


Abstract
An angle-resolved scattered light sensor is a non-contact surface inspection technique that is robust and has a high resolution for roughness measurement at approximately 1 nm. Typically, during the early stage of cyclic loading in metals, persistent slip bands (PSBs) emerge on the surface as persistent slip markings (PSMs) which consist of extrusions and intrusions. It is commonly reported that the initiated crack is generated at the tip of one of those intrusions. Thus, the PSM formation is an important key for explaining the crack initiation behaviors in the early stage through surface development that was encouraged by the local plastic strain deformation. In this study, the optical-based measurement methods using the confocal microscope and the angle-resolved scattered light sensor were used to inspect and describe the crack formation during cyclic loading due to extrusion and intrusion formations. The specimens were fine-polished by diamond suspension (until 1 µm) and tested on a servo-hydraulic push–pull testing machine with the selected stress amplitude of 492 MPa (70% of the ultimate tensile strength), frequency (f) = 10 Hz, and load ratio (R) = −1. The extrusions and intrusions on the specimen were reliably observed and detected by our surface measurement techniques. The FIB–SEM results reported the emergence of PSMs and crack formations on the modified surface during fatigue loading. Moreover, the scattered light sensor has presented a remarkable result, which could be a potential technique for a new approach to study fatigue life estimation through the formation of extrusion and intrusion.
1. Introduction
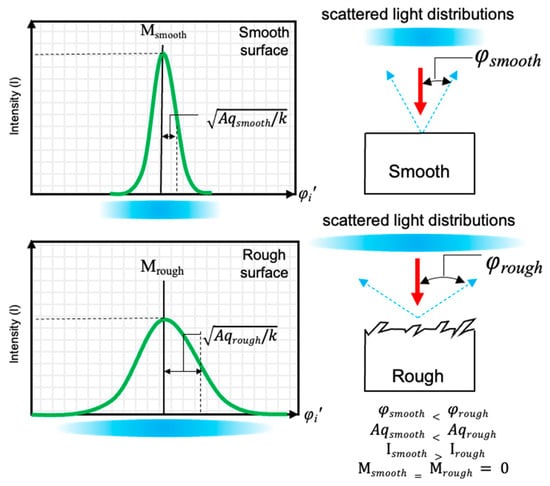
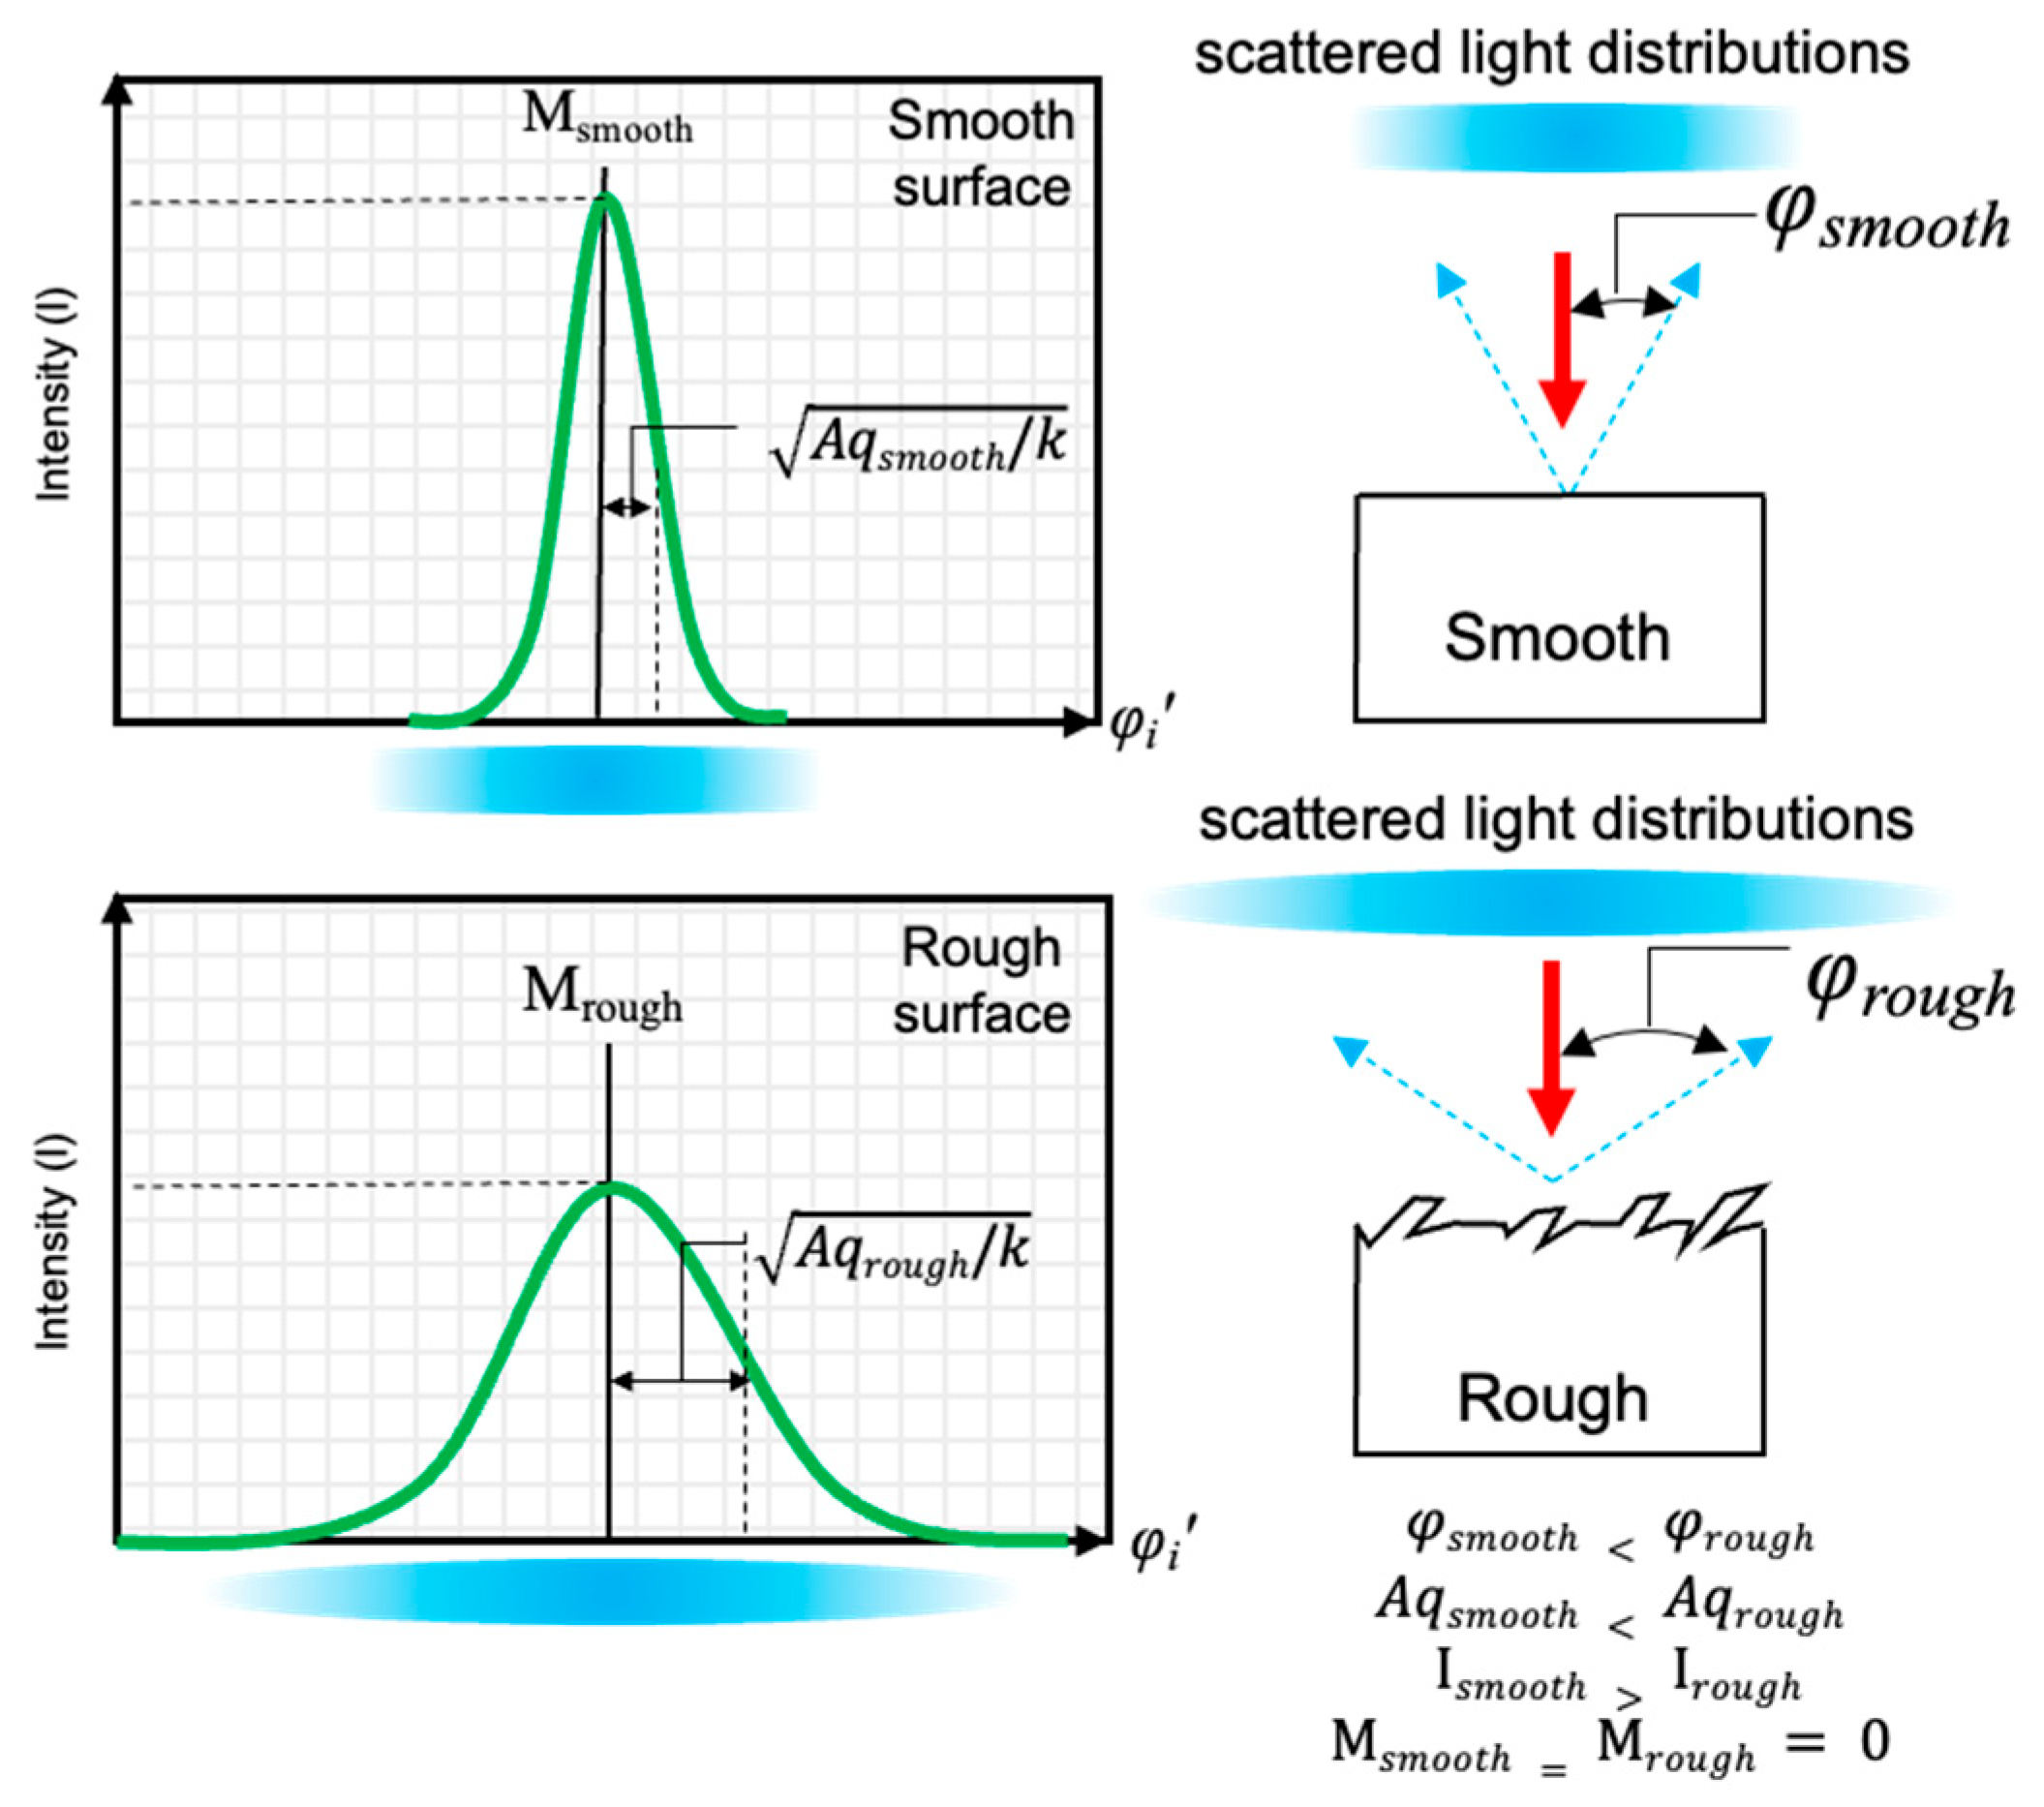
Persistent slip bands (PSBs) in single crystals and polycrystals are identified as intensive cyclic slip bands due to the deformation of local cyclic plastic strain [1,2,3,4], and ladder-like dislocation structures are formed [5]. During cyclic loading, the PSB behavior plays the main role in the very early stages of fatigue damage [6]. PSBs can emerge as persistent slip markings (PSMs) on the free surfaces [4,5,7,8]. Wei-Di Cao and Hans Conrad mentioned that high plastic strain concentration can be created in PSBs at the grains, twin boundaries, and the boundaries of the intermetallic or second-phase particles [3]. Moreover, those sites seem to be sites of initiating fatigue cracks [3]. Typically, the PSM contains extrusions and intrusions [9]. The most common reason for fatigue crack initiation is the growth of intrusions by slip and un-slip mechanisms [1,10,11]. Thus, the crack origin of fatigue damage can be generated at the end tip of intrusions, at which high plastic strain concentration is found [7,10,12,13]. Most researchers studied the behavior of slip bands and characterized the appearance of PSMs by using several techniques, for example, atomic force microscopy (AFM), scanning electron microscopy (SEM), focused ion beam (FIB), transmission electron microscopy (TEM) [2,5,7,14,15,16], and optical-based methods [17]. Moreover, they also suggested using their investigations and techniques to detect the process of crack initiation [18]. Another important interaction of PSB formation is the arrangement of dislocations in the slip bands, which was investigated by Lukáš et al. [6] and Linlin Li et al. [19]. The dislocation walls were generated in the PSB, and it consists of edge dipoles and multipoles for generating and arranging the dislocation loops due to the external shear stress as described by Jaroslav Polák and Jiří Man [2], although the extensive material for studying the PSB is copper in single and polycrystalline [3,6,7,14,16,19]. However, their knowledge could also be employed for investigation in steel. Nevertheless, the PSB and PSM mechanisms in steels still need more discussion and investigation. Therefore, an angle-resolved scattered light sensor and a confocal microscope were used to inspect the initial surface and developed surfaces after distinct fatigue cycles because of the extrusion and intrusion formations. The measurement of the surface using a scattered light sensor can be referred to [20]. The principle of an angle-resolved scattered light sensor is described in [21], and the results demonstrating different surface gradients (smooth and rough) are shown in Figure 1. A valuable benefit of the measurement using angle-resolved scattered light is the strong dynamics of photo-sensitive diodes and statistical investigation. Moreover, it can be utilized to measure the surface changes even with slight alterations [12,21]. The OS 500 is a sensor for angle-resolved scattered light measurement, which was fabricated by OptoSurf GmbH, Ettlingen, Germany. Therefore, the OS 500 sensor was utilized to provide a new sight of surface development, and it might be used for attempts in the prospect of real-time inspection of the altered surfaces leading to fatigue failure.
Figure 1.
The scattered light distribution behavior of reflected light on the different surface textures and gradients, the arrows represent the direction of incident light (red) and the reflected light (blue).
2. Materials and Methods
2.1. Material Specifications
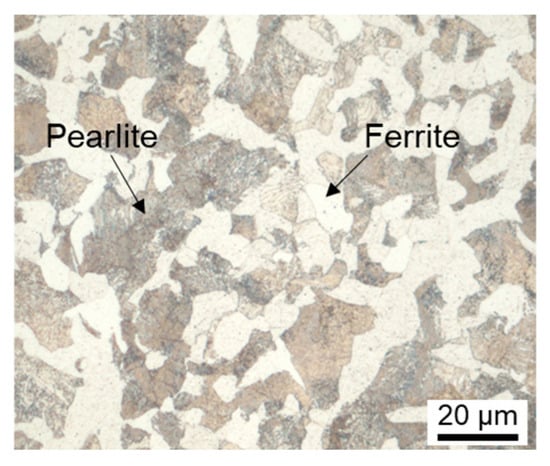
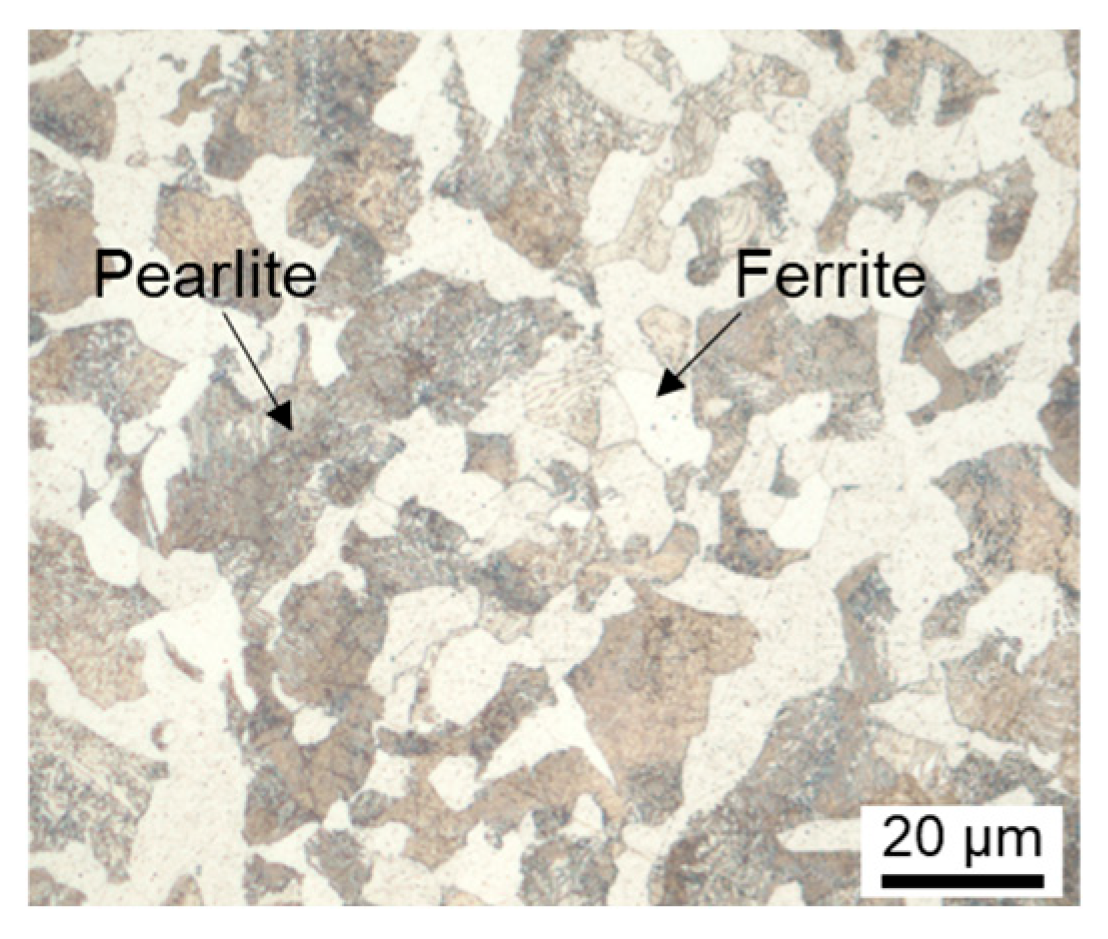
The specimen was prepared from C45E steel in the normalized condition. The microstructure demonstrates ferrite and pearlite after etching with an etchant of Nital 3% (HNO3: ~3 mL and ethanol: 100 mL) as shown in Figure 2. The chemical compositions and mechanical properties of the steel are shown in Table 1. The hardness of the specimens was measured by a universal hardness testing machine on a Vickers scale with an applied test load of 30 kgf at five points. Afterward, the hardness values were converted to the ultimate tensile strength (UTS) by using the conversion table referred to DIN 50150 [22].
Figure 2.
The etched microstructure of C45E illustrates perlite and ferrite structures.
Table 1.
Chemical compositions and mechanical properties of the investigated steel.
2.2. Specimen Dimensions and Preparations
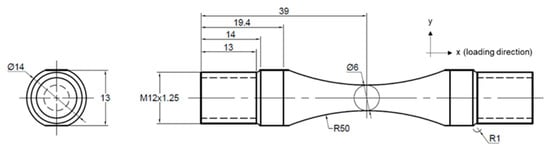
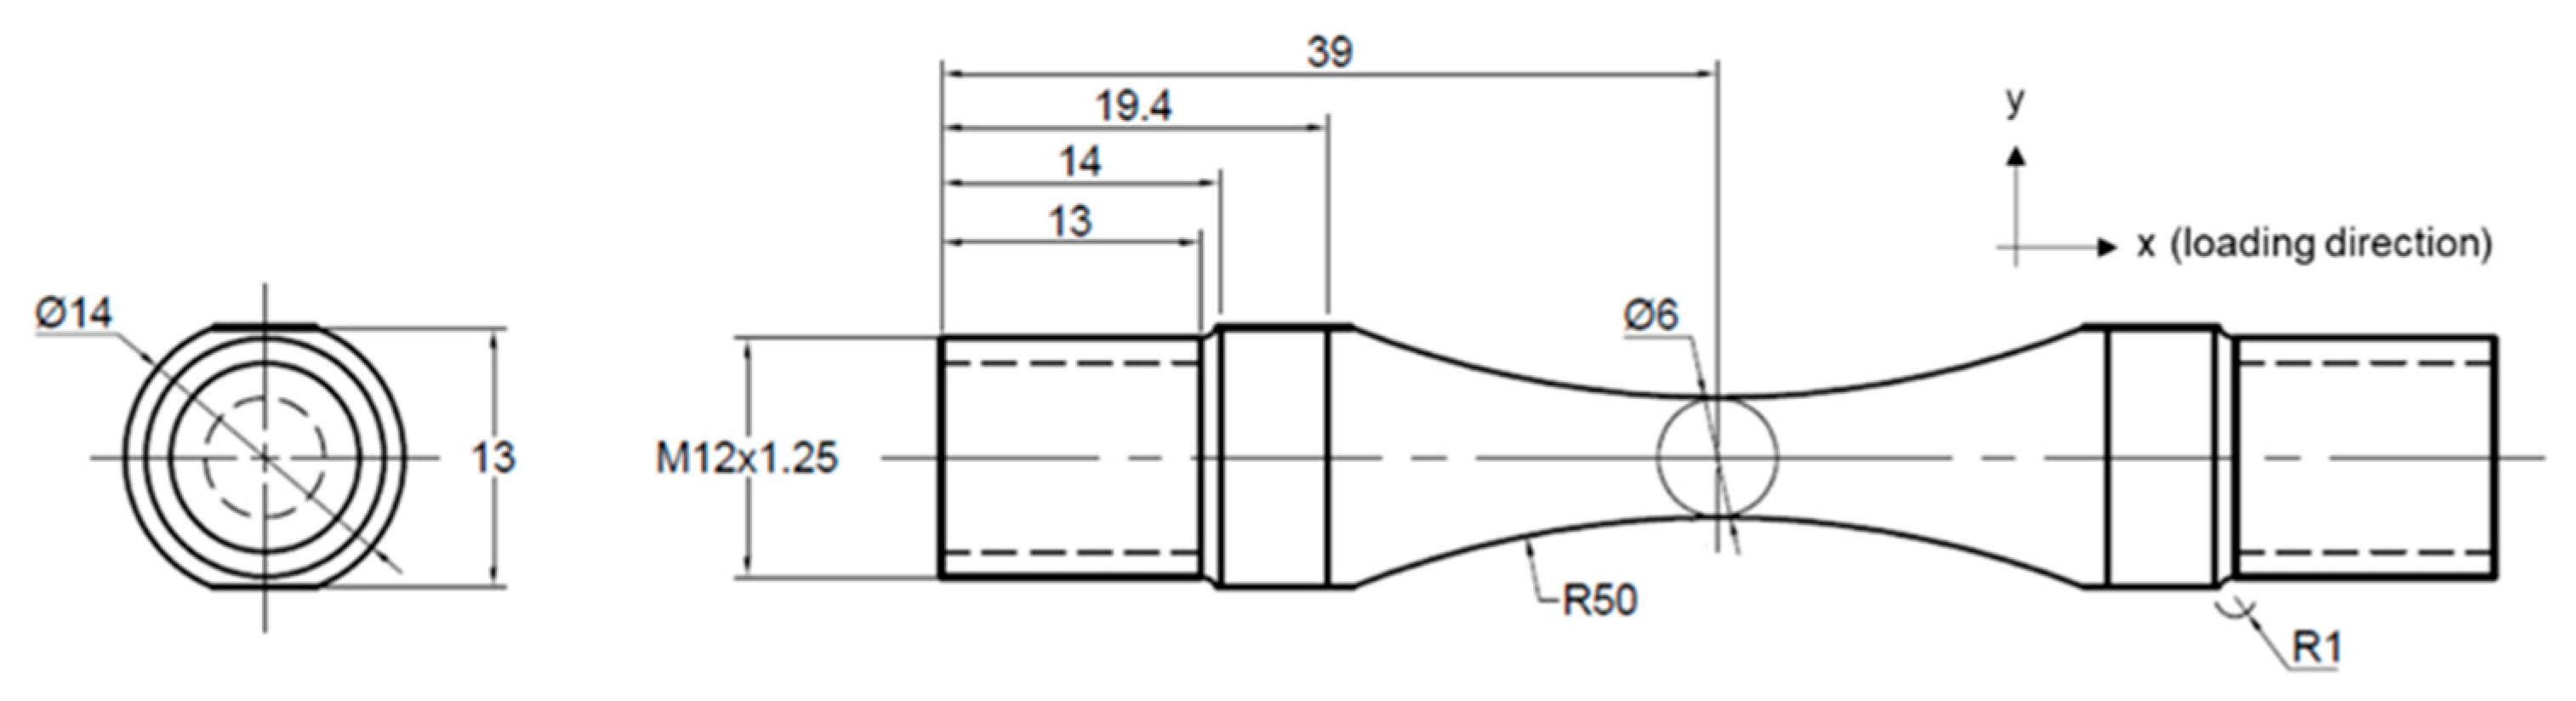
The specimen dimensions were designed following ASTM E466 [23] with the calculated notch factor of 1.004, referred to in Chapter 5.5 [24]. The specimen dimensions are shown in Figure 3, and the stress direction is marked as an x-axis. The specimens were machined and typically polished by the University’s workshop. The surface quality of the specimens after being fabricated by the University’s workshop is called “as-machined”. Regarding the previous study from [8], the as-machined surface quality was still unsuitable for investigating the appearances of extrusions and intrusions since the roughness significantly affects PSM observation and fatigue life [25]. Therefore, specimens with smoother surface quality than as-machined were required for this study. Hence, we adapted the milling machine tool for manual polishing of the specimens with 3 and 1 micron of diamond suspensions, respectively, for 5 min each. According to most studies of surface alteration due to PSM during cyclic loading, one specimen was employed on each tested condition to characterize and diagnose the extrusions and intrusions [8,9,26]. Thus, we utilized one specimen to inspect the surface development using both surface measurement techniques and another specimen to analyze the PSMs using a focused ion beam–scanning electron microscope (FIB–SEM) of FEI Helinos Nanolab 650 (FEI Company, Hillsboro, OR, USA). Both specimens were manufactured and fatigue-tested in corresponding ways.
Figure 3.
The fatigue specimen dimensions in mm.
2.3. Fatigue Test Setups
The fatigue tests were carried out on a servo-hydraulic push–pull testing machine (SCHENK-PSA) with a maximum capacity of 100 kN, manufactured by Carl Schenck AG, Darmstadt, Germany. The fatigue tests were performed with selected stress amplitudes of 70% of the ultimate tensile strength, which is 492 MPa, a frequency (f) of 10 Hz, and a load ratio R = −1. The tests were interrupted every 100 cycles to measure the developed roughness, and then the tests were continued for the next 100 cycles or until the specimen fractured.
2.4. Observation Techniques and Surface Measurements
Initially, the surfaces of specimens after manual polishing using diamond suspensions were observed by an optical microscope before testing to ensure that the surface quality was sufficient to observe and characterize the evolution on the surface. The confocal microscope of the µsurf model was fabricated by NanoFocus AG, Oberhausen, Nordrhein-Westfalen, Germany, which is called Nanofocus in this study. Only one area on the specimen was specified to measure the surface roughness to observe the changes. The Nanofocus with a lens of 20× and 0.6 of NA was applied to acquire roughness information. The raw data of the roughness was interpreted to obtain the roughness values by the software MountainMap Expert 8.0. Areal roughness parameters of arithmetical mean height (Sa) and root mean square gradient (Sdq) were determined, and these could be calculated by Equations (1) and (2) as described in ISO 25178 [27]. Furthermore, the modified parameter of Sdq for a small gradient surface can also be calculated by Equation (4), which is approximately proportional to the determined Aq from a scattered light sensor as described by [12]. The linear profile measurements of arithmetic mean deviation (Ra), maximum profile peak height (Rp), maximum valley depth (Rv), and root mean square slope (Rdq) were investigated in the loading direction. Since the profile measurement can provide the PSM appearance, it might have a better description of the appearance of PSM than areal measurement parameters. These profile measurement parameters can be calculated by Equations (4) to (7). The profile measurements can be referred to ISO 4287 [28].
Sa is the arithmetical mean height; Sdq is the root mean square gradient, and Z(x,y) are ordinate values.
Ra is the arithmetic mean deviation. Z(x) are the ordinate values. Rp is the maximum profile peak height. Rv is the maximum profile valley depth, and Rdq is the root mean square slope.
The angle-resolved scattered light sensor (OS 500, OptoSurf GmbH, Ettlingen, Germany) contains 32 photodiodes, which are organized in the linear detector, and the measured spot size (D) is 0.9 mm. The sensor of OS 500 was used for studying surface developments and there are five measuring points which were marked as 0 (at the measured area using Nanofocus), +1, +2, −1, and −2 (at the vicinity areas that are the measuring points away 1 and 2 mm from the position in the anticlockwise and clockwise directions, respectively). The surface roughness results in the variance of reflected scattered light distribution on the detector that is called Aq, referred to [29]. The values of Aq and M can also be calculated by Equations (8) and (9).
Aq is the mathematical variance. kAq is the correction factor. N is the number of diodes. φ is the measured reflection angle. M is the mean value, and H(φn) is a factor of the discreet scattered light angle φn.
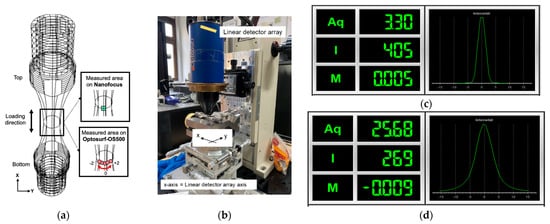
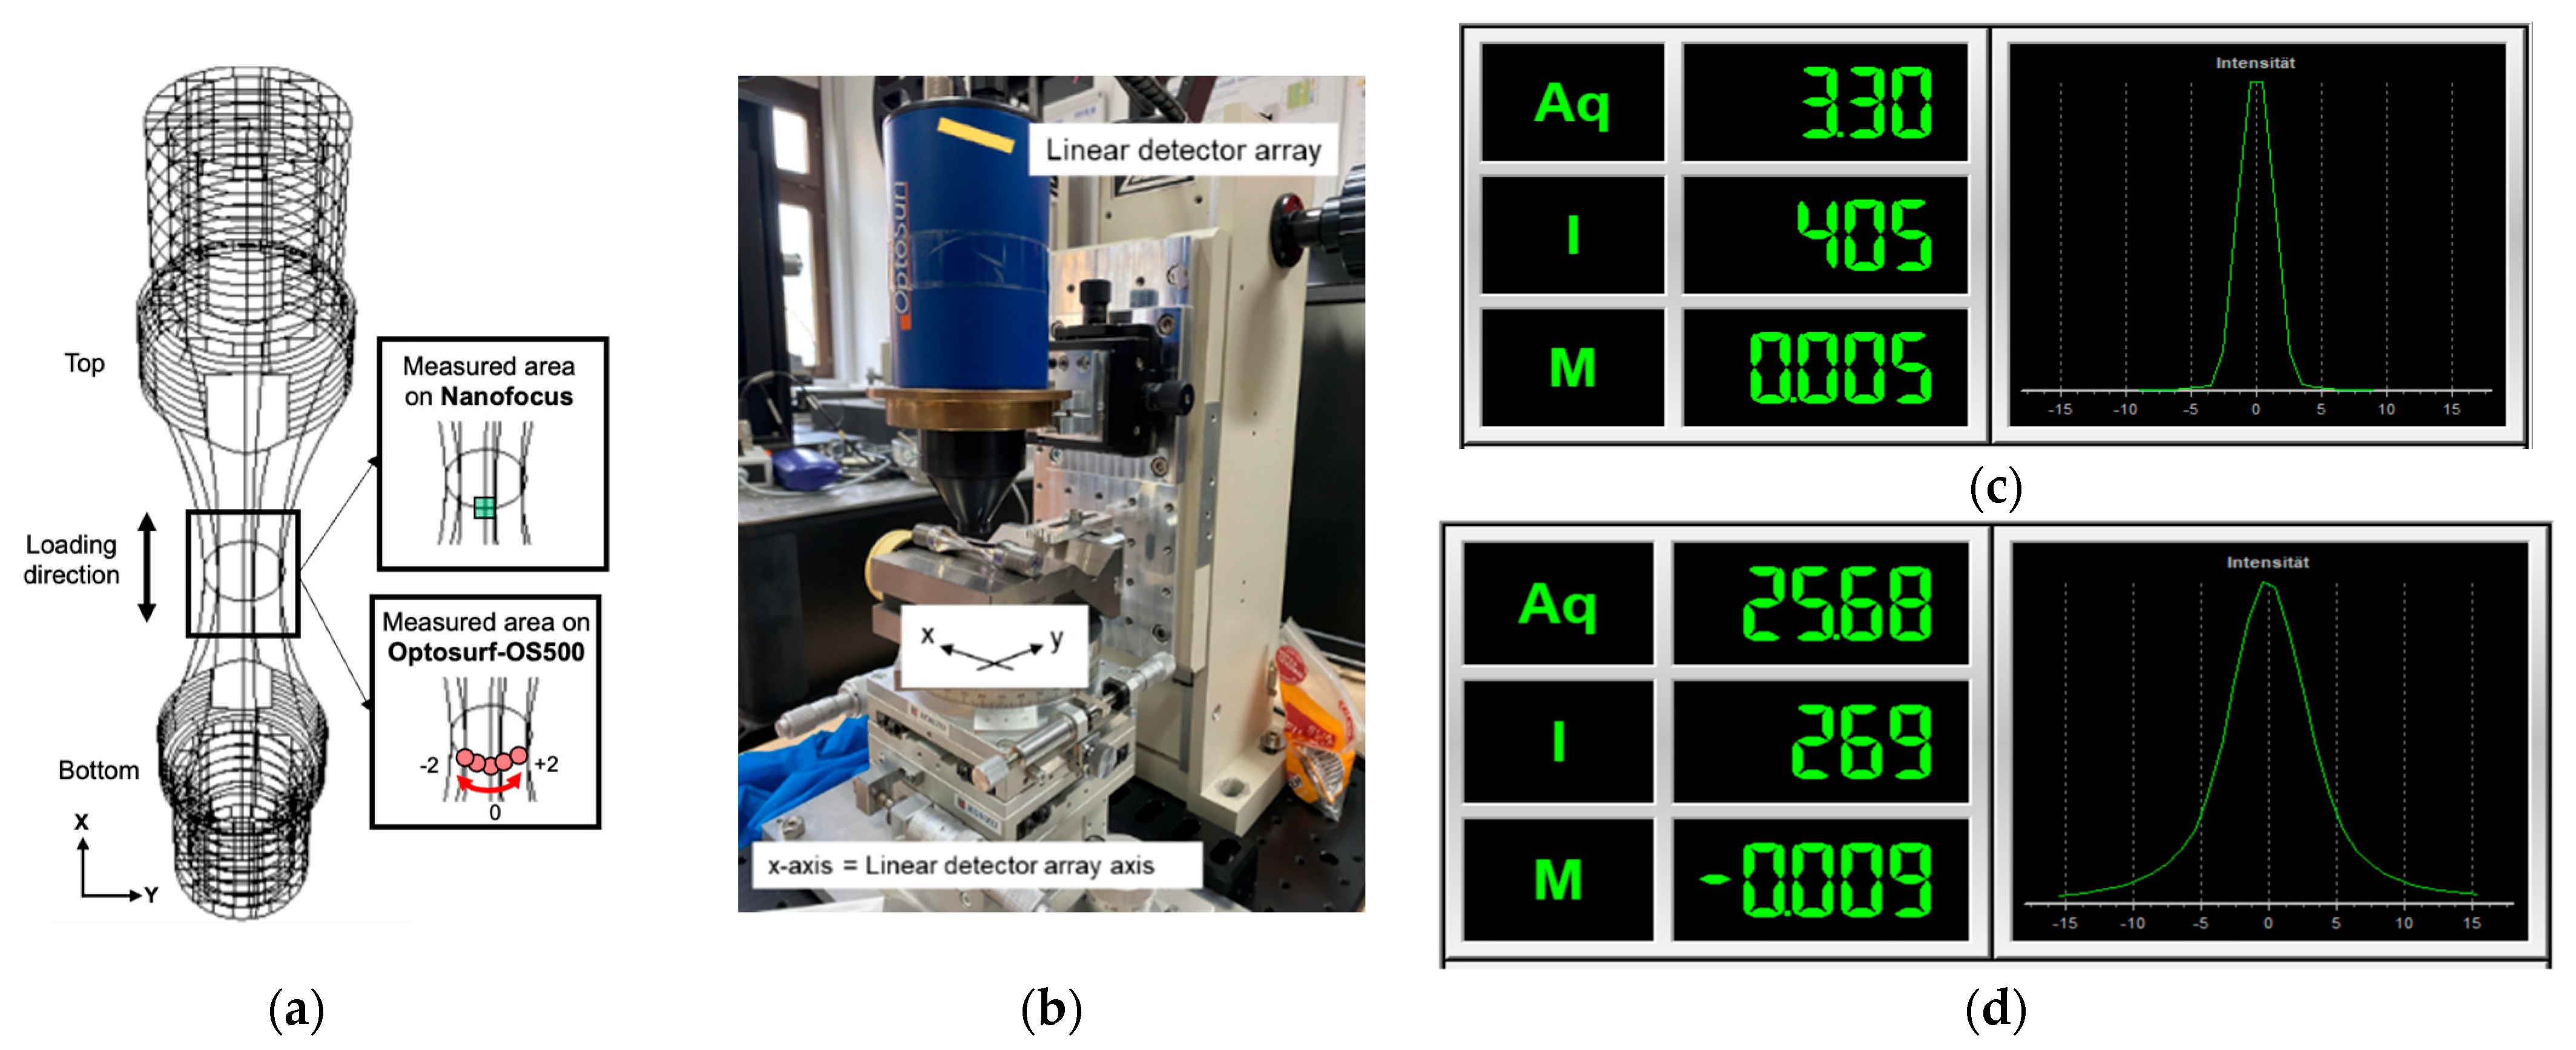
The surface identification on the specimen for surface roughness measurement using a confocal microscope (Nanofocus) and a scattered light sensor (OS 500, OptoSurf GmbH, Ettlingen, Germany) is demonstrated in Figure 4a. Figure 4b shows the measuring setups of OS 500 and the specimen. The specimen was placed in a parallel direction within the linear detector array. Figure 4c,d present the results of Aq (variance), I (intensity), M (position), and the statistical curves of distributed scattered light from smooth and rough surfaces, respectively. Aqi and Aqm are the Aq roughness from the OS 500 on each measuring point and calculated mean value using all values of Aqi on considered measurements, which were reported in this study. A random specimen was used as the reference specimen that was measured by OS 500 to monitor the influence of ambient light during the measurement. Another aspect is to characterize the PSMs during fatigue deformation. Thus a specimen with the same surface quality was used in the fatigue tests until the number of cycles reached 900. Afterward, the specimen was subjected to a focused ion beam–scanning electron microscope (FIB–SEM) at NSC (Nano Structuring Center of RPTU) to characterize the PSMs. The broken specimen was observed on the fracture surface using a stereomicroscope Carl Zeiss Stereo Discovery V20 with Axio Vision 4.8 software, manufactured by Carl Zeiss AG, Oberkochen, Germany, to investigate and identify crack initiation sites and crack growth characteristics.
Figure 4.
The surface roughness measurement for (a) the surface identification on the tested specimen, (b) measuring setups of the OS 500 sensor, and the revealed scattered light distribution in the statistical information on (c) the polished surface and (d) the rougher surface.
3. Results and Discussion
3.1. The Development of Surfaces on a Confocal Microscope
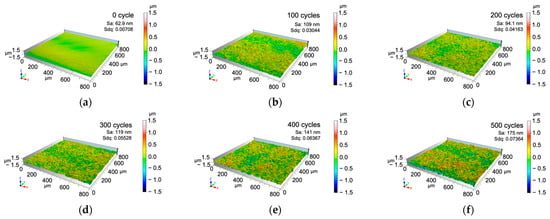
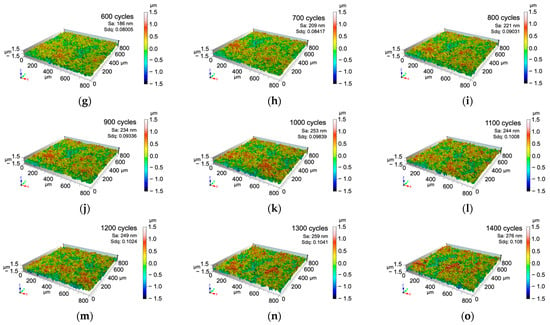
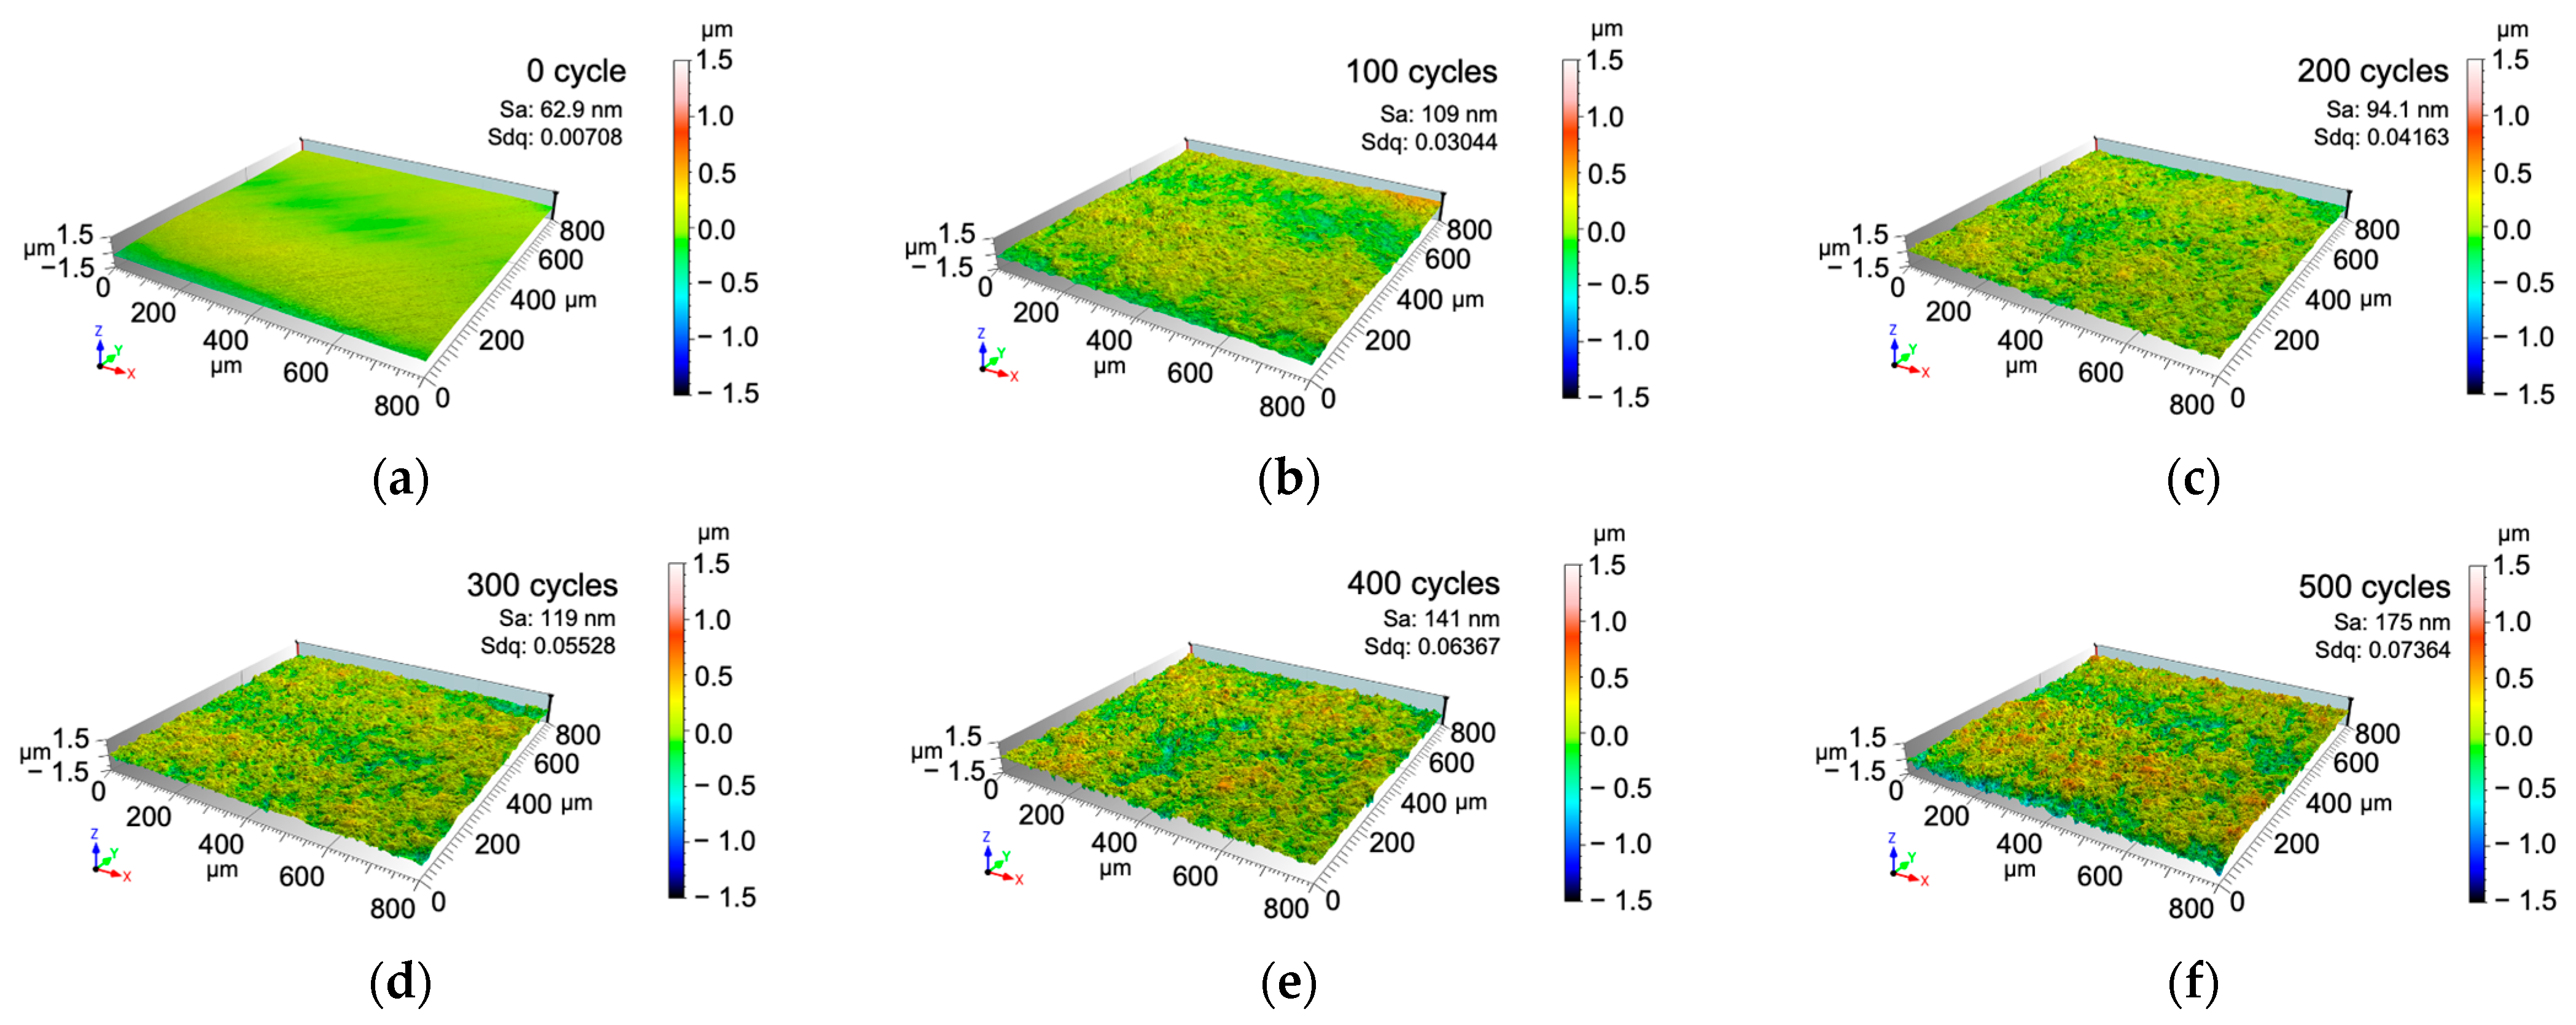
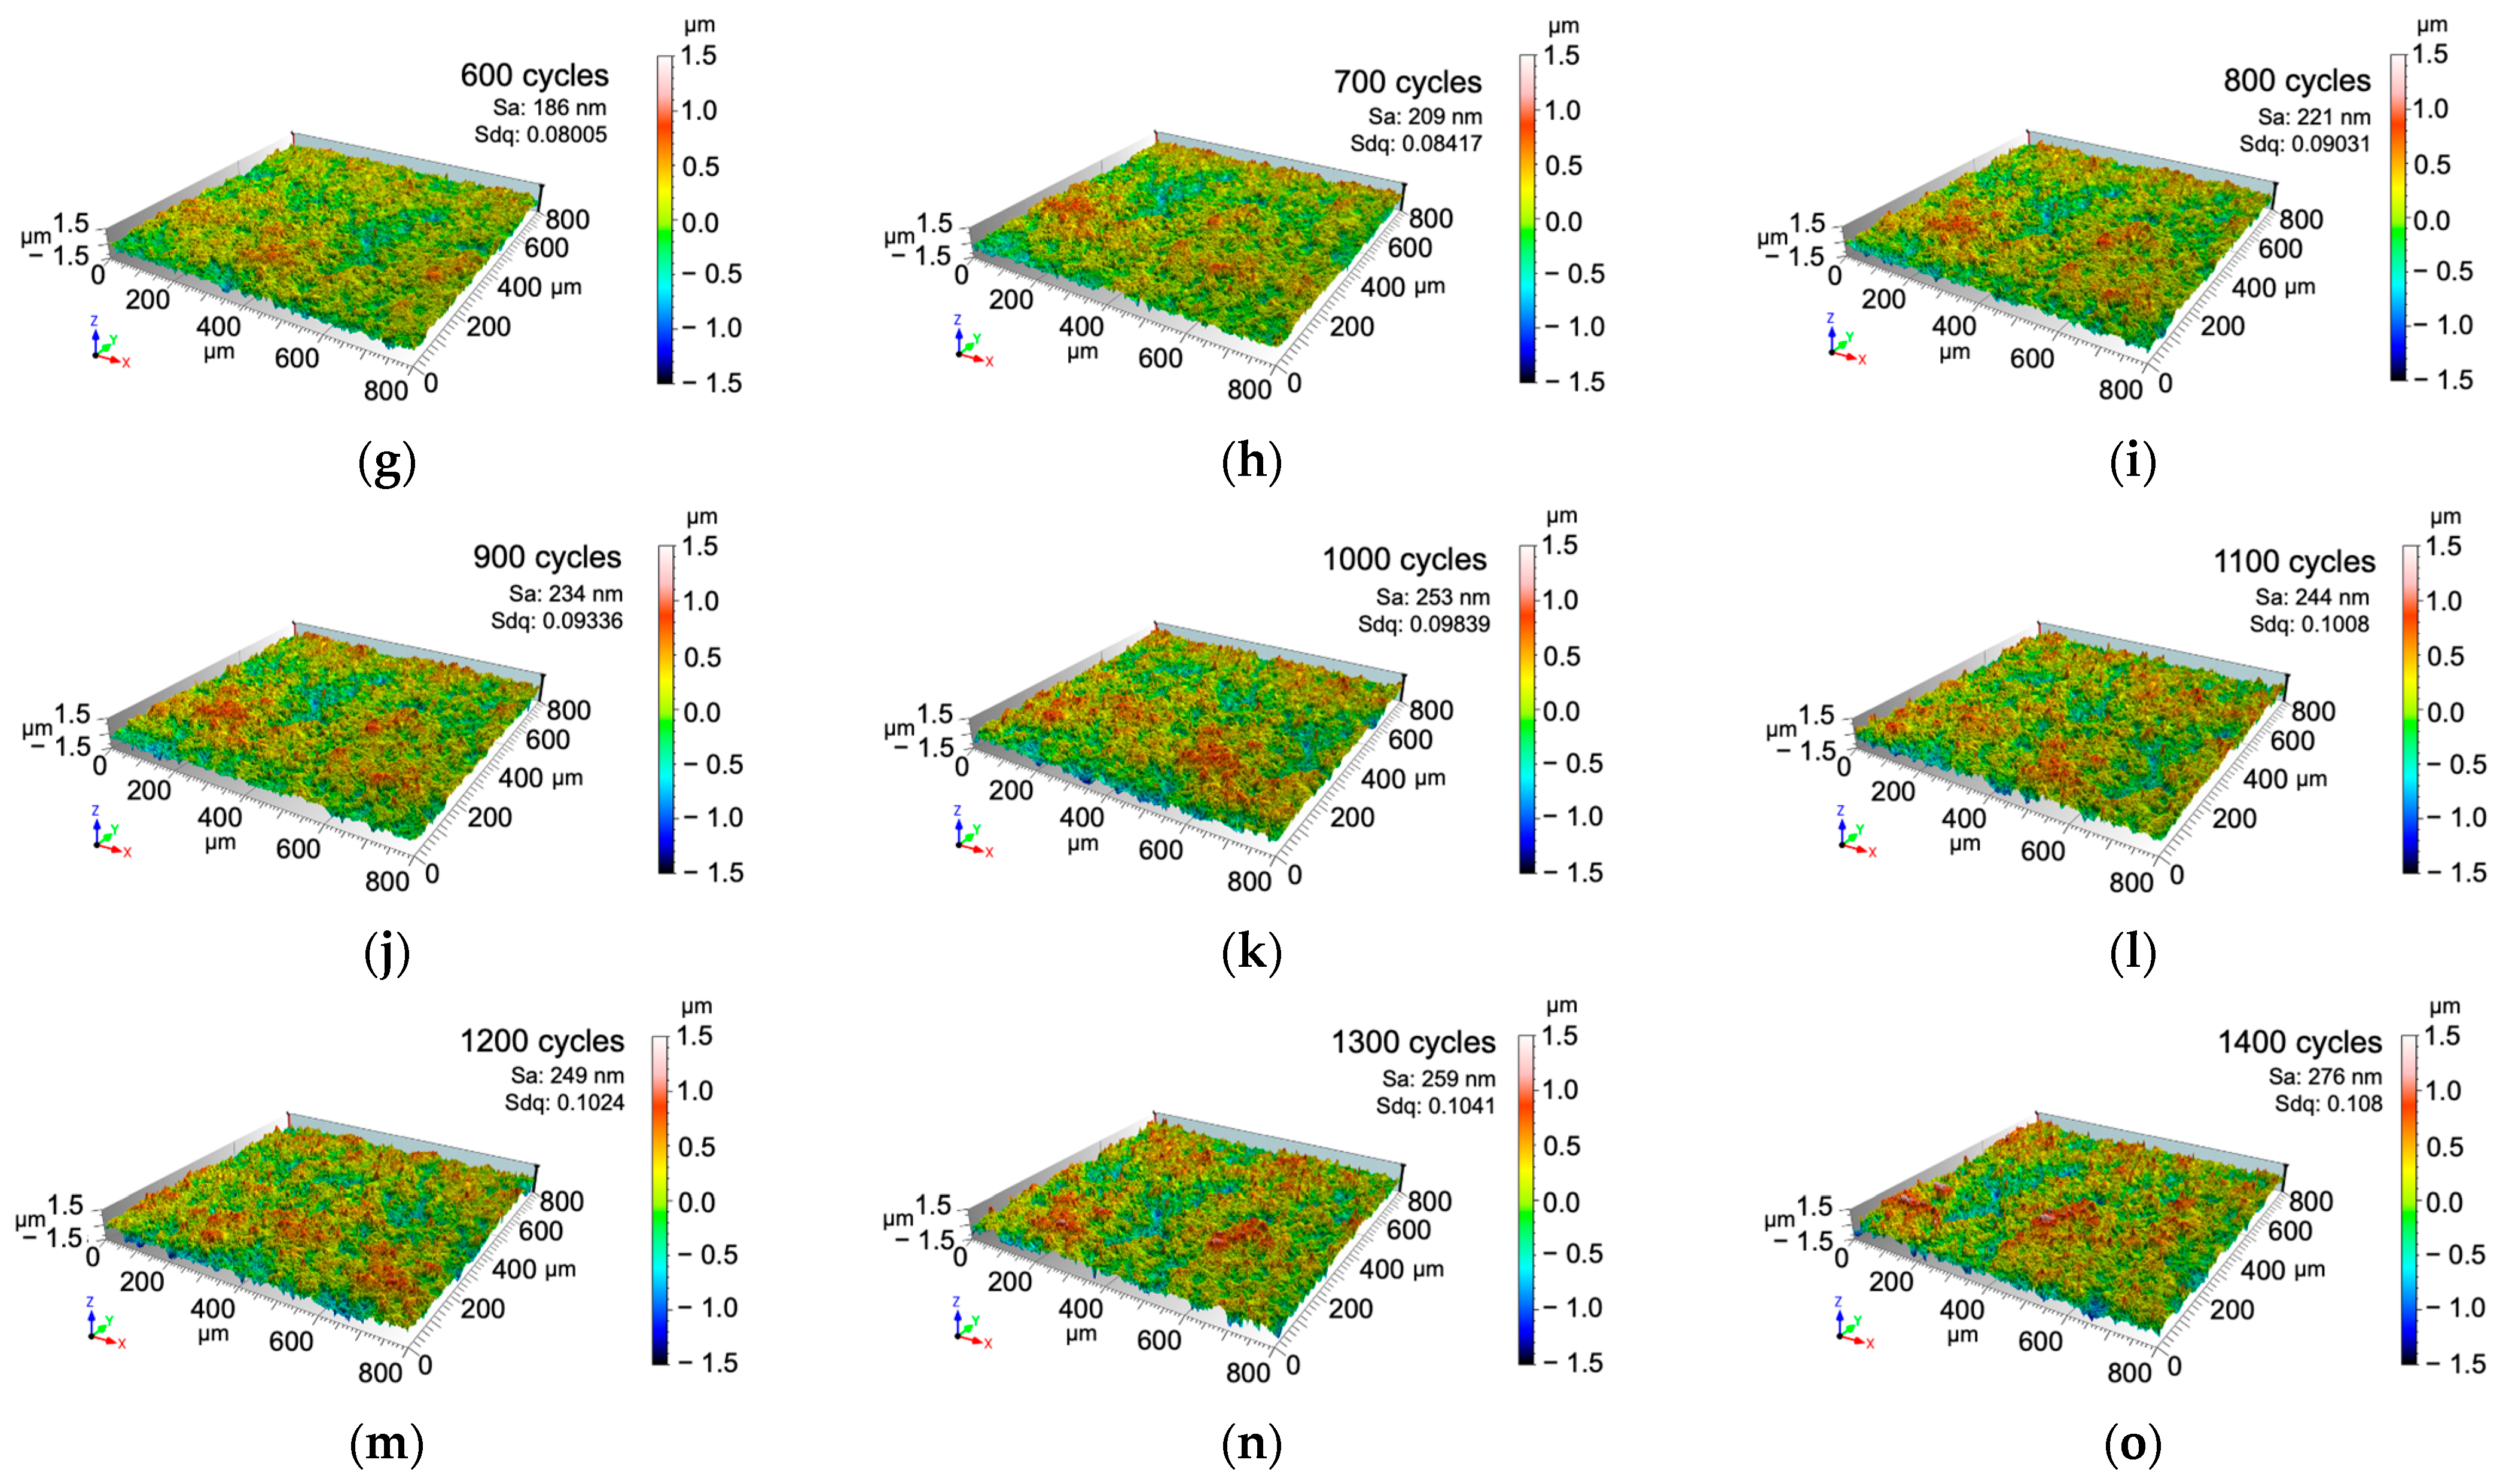
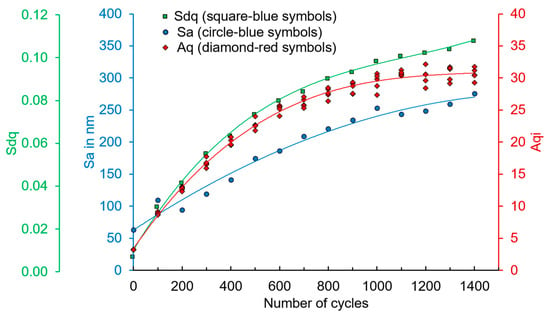
Figure 5a–o illustrate the topography of the surface of the initial and fatigue-loaded states of the specimens after periodic measurement using a confocal microscope and using MountainMap Expert 8.0 to determine the roughness values. The initial surface exists with 62.85 nm of Sa and 0.00708 of Sdq as shown in Figure 5a. With the increased number of cycles, the Sa and Sdq increase as well. The red appearances on the topography micrographs represent the alteration in height, and the blue appearances represent the development in depth. Shortly before the specimen failed, the Sdq reached 0.108 and Sa reached 275.6 nm at 1400 cycles, as illustrated in Figure 5o. Then, the fatigue-tested specimen failed at 1474 cycles. Figure 5 illustrates the areal roughness results in Sa and Sdq for the same specimen and cycles compared with the Aq results from the scattered light sensor. The measured values clearly indicate that there is a modification of the surface topography, which was probably caused by the cyclic local plastic strain deformation. The local plastic deformation process produces the PSM, which consists of extrusion and intrusion [8,9,26]. Hence, the extrusions’ and intrusions’ identifications and characterizations will be described in further section.
Figure 5.
The topography micrographs observed at (a) 0 cycles, (b) 100 cycles, (c) 200 cycles, (d) 300 cycles, (e) 400 cycles, (f) 500 cycles, (g) 600 cycles, (h) 700 cycles, (i) 800 cycles, (j) 900 cycles, (k) 1000 cycles, (l) 1100 cycles, (m) 1200 cycles, (n) 1300 cycles, and (o) 1400 cycles.
3.2. The Development of Surfaces on the Angle-Resolved Scattered Light Sensor (OS 500)
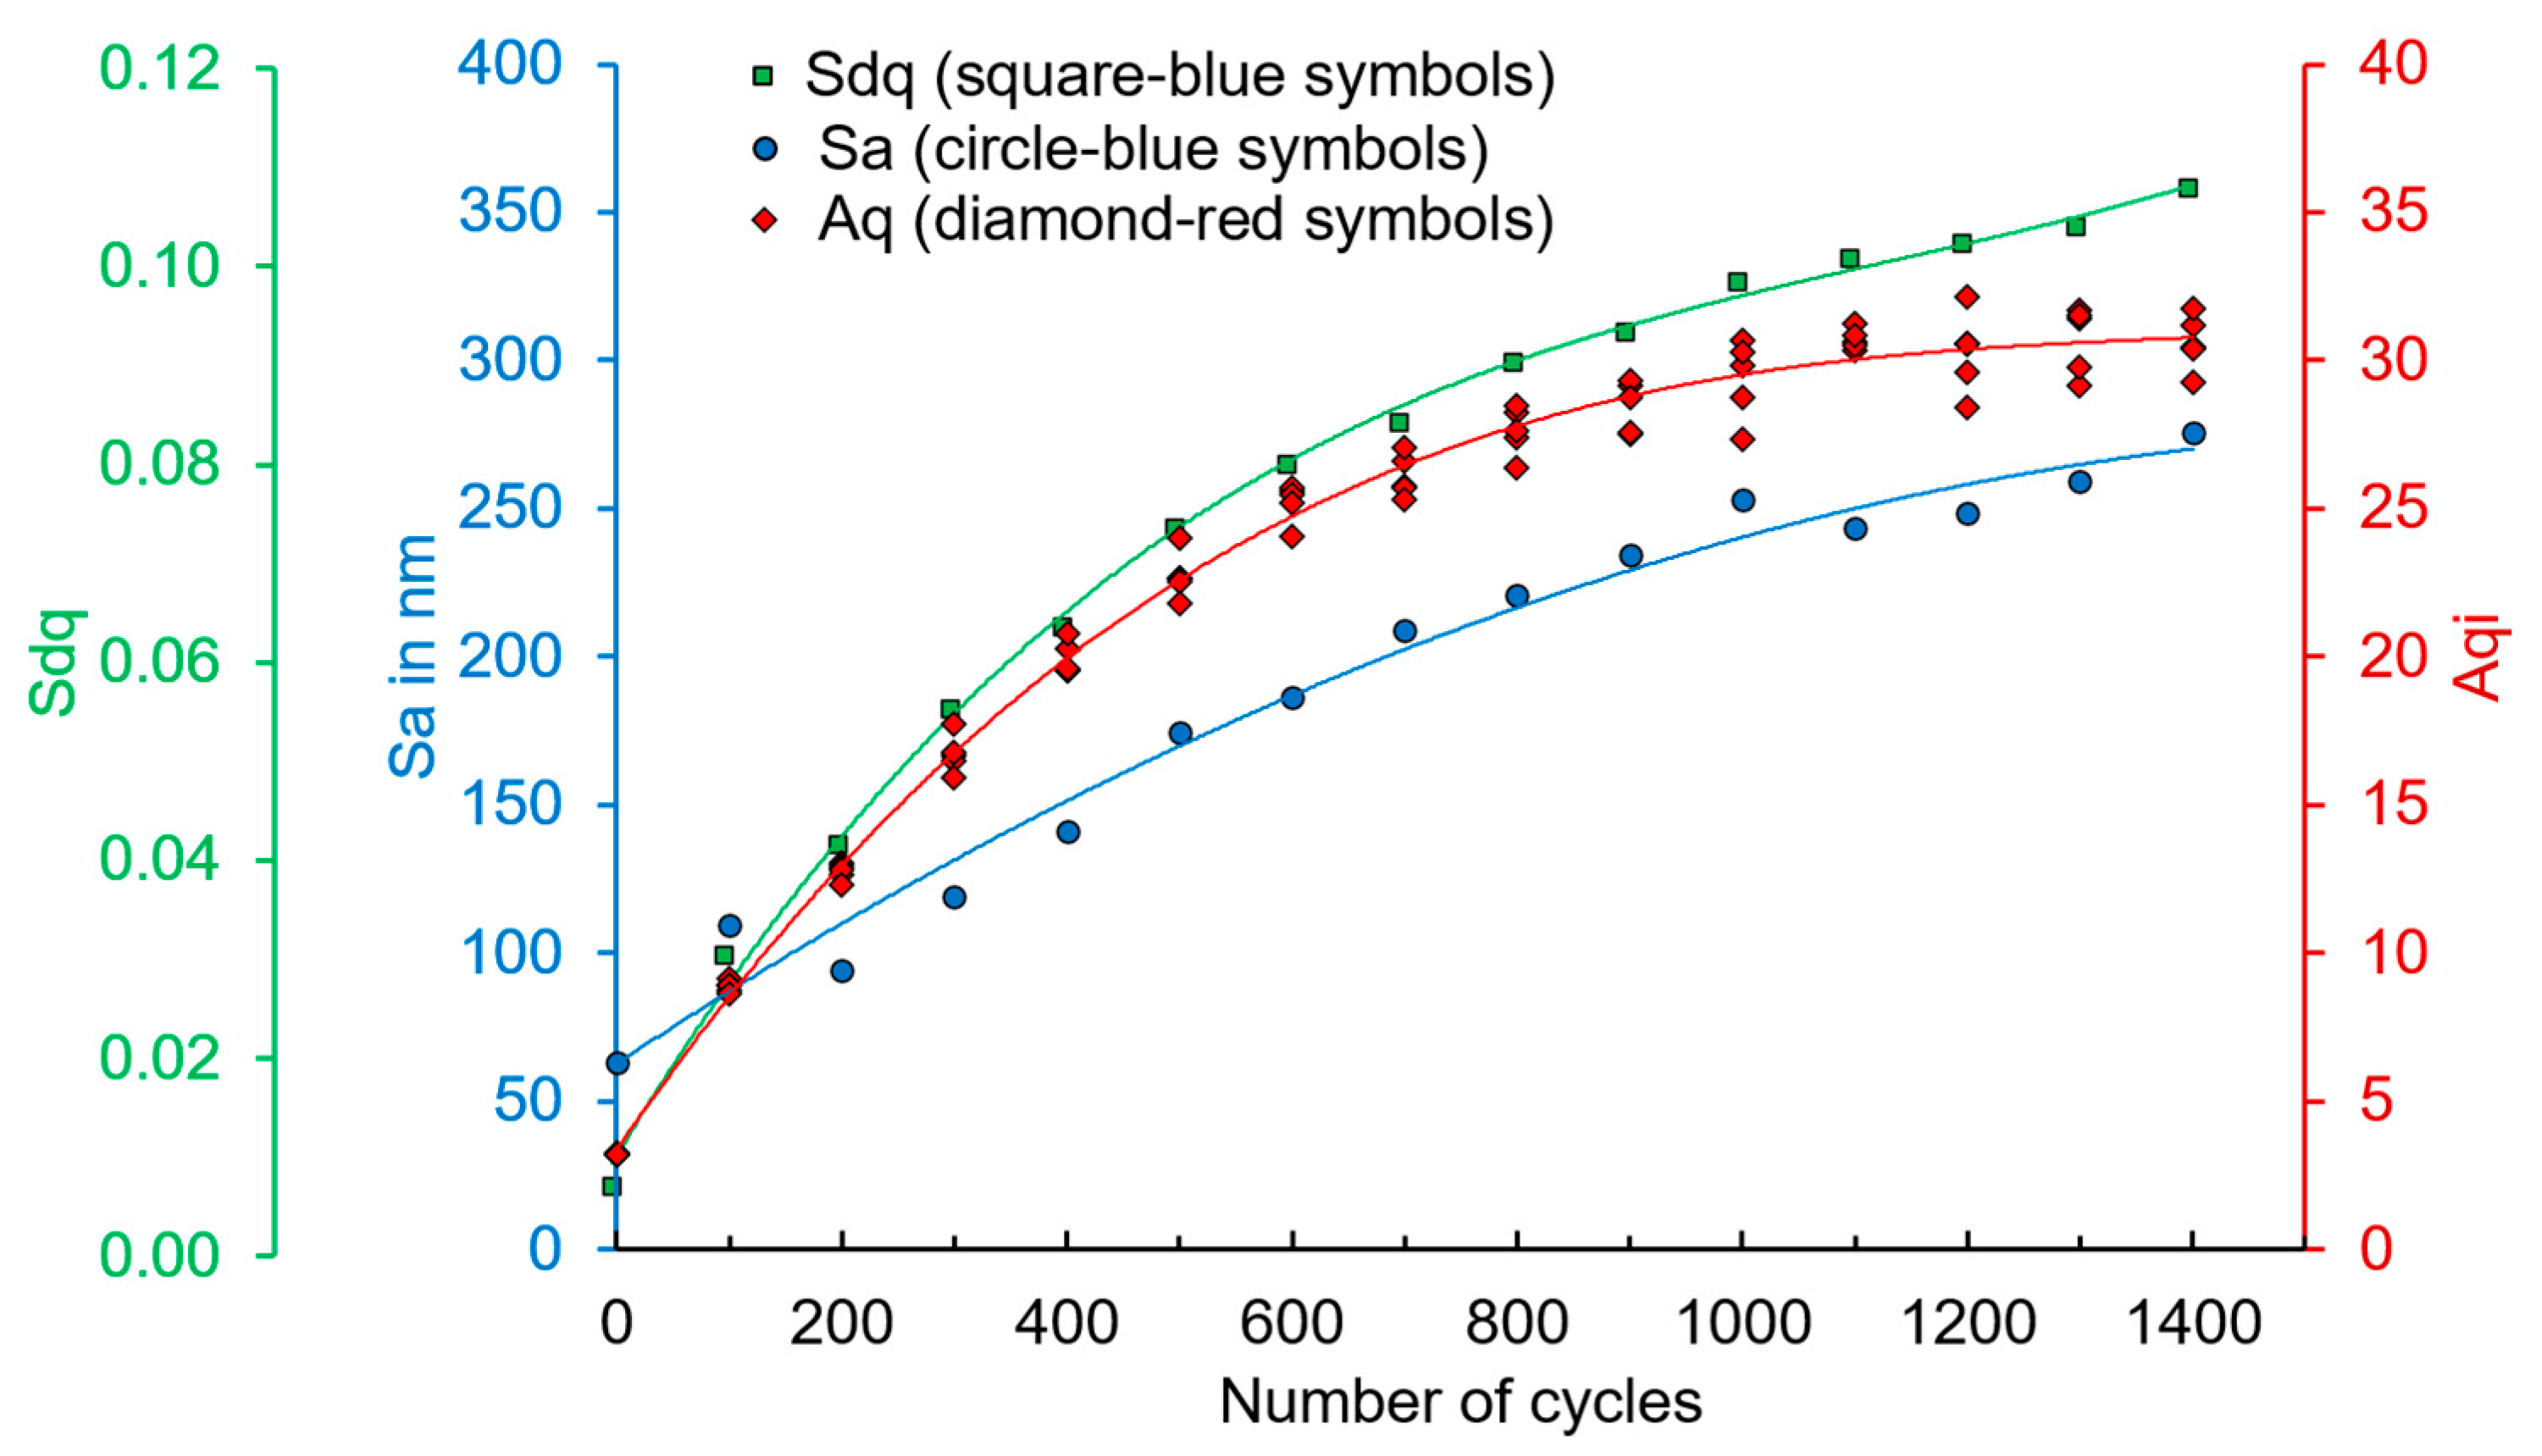
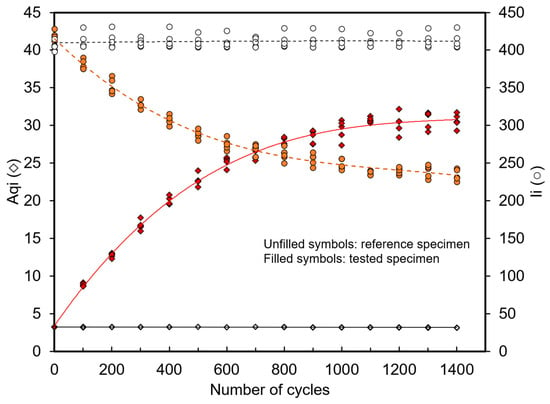
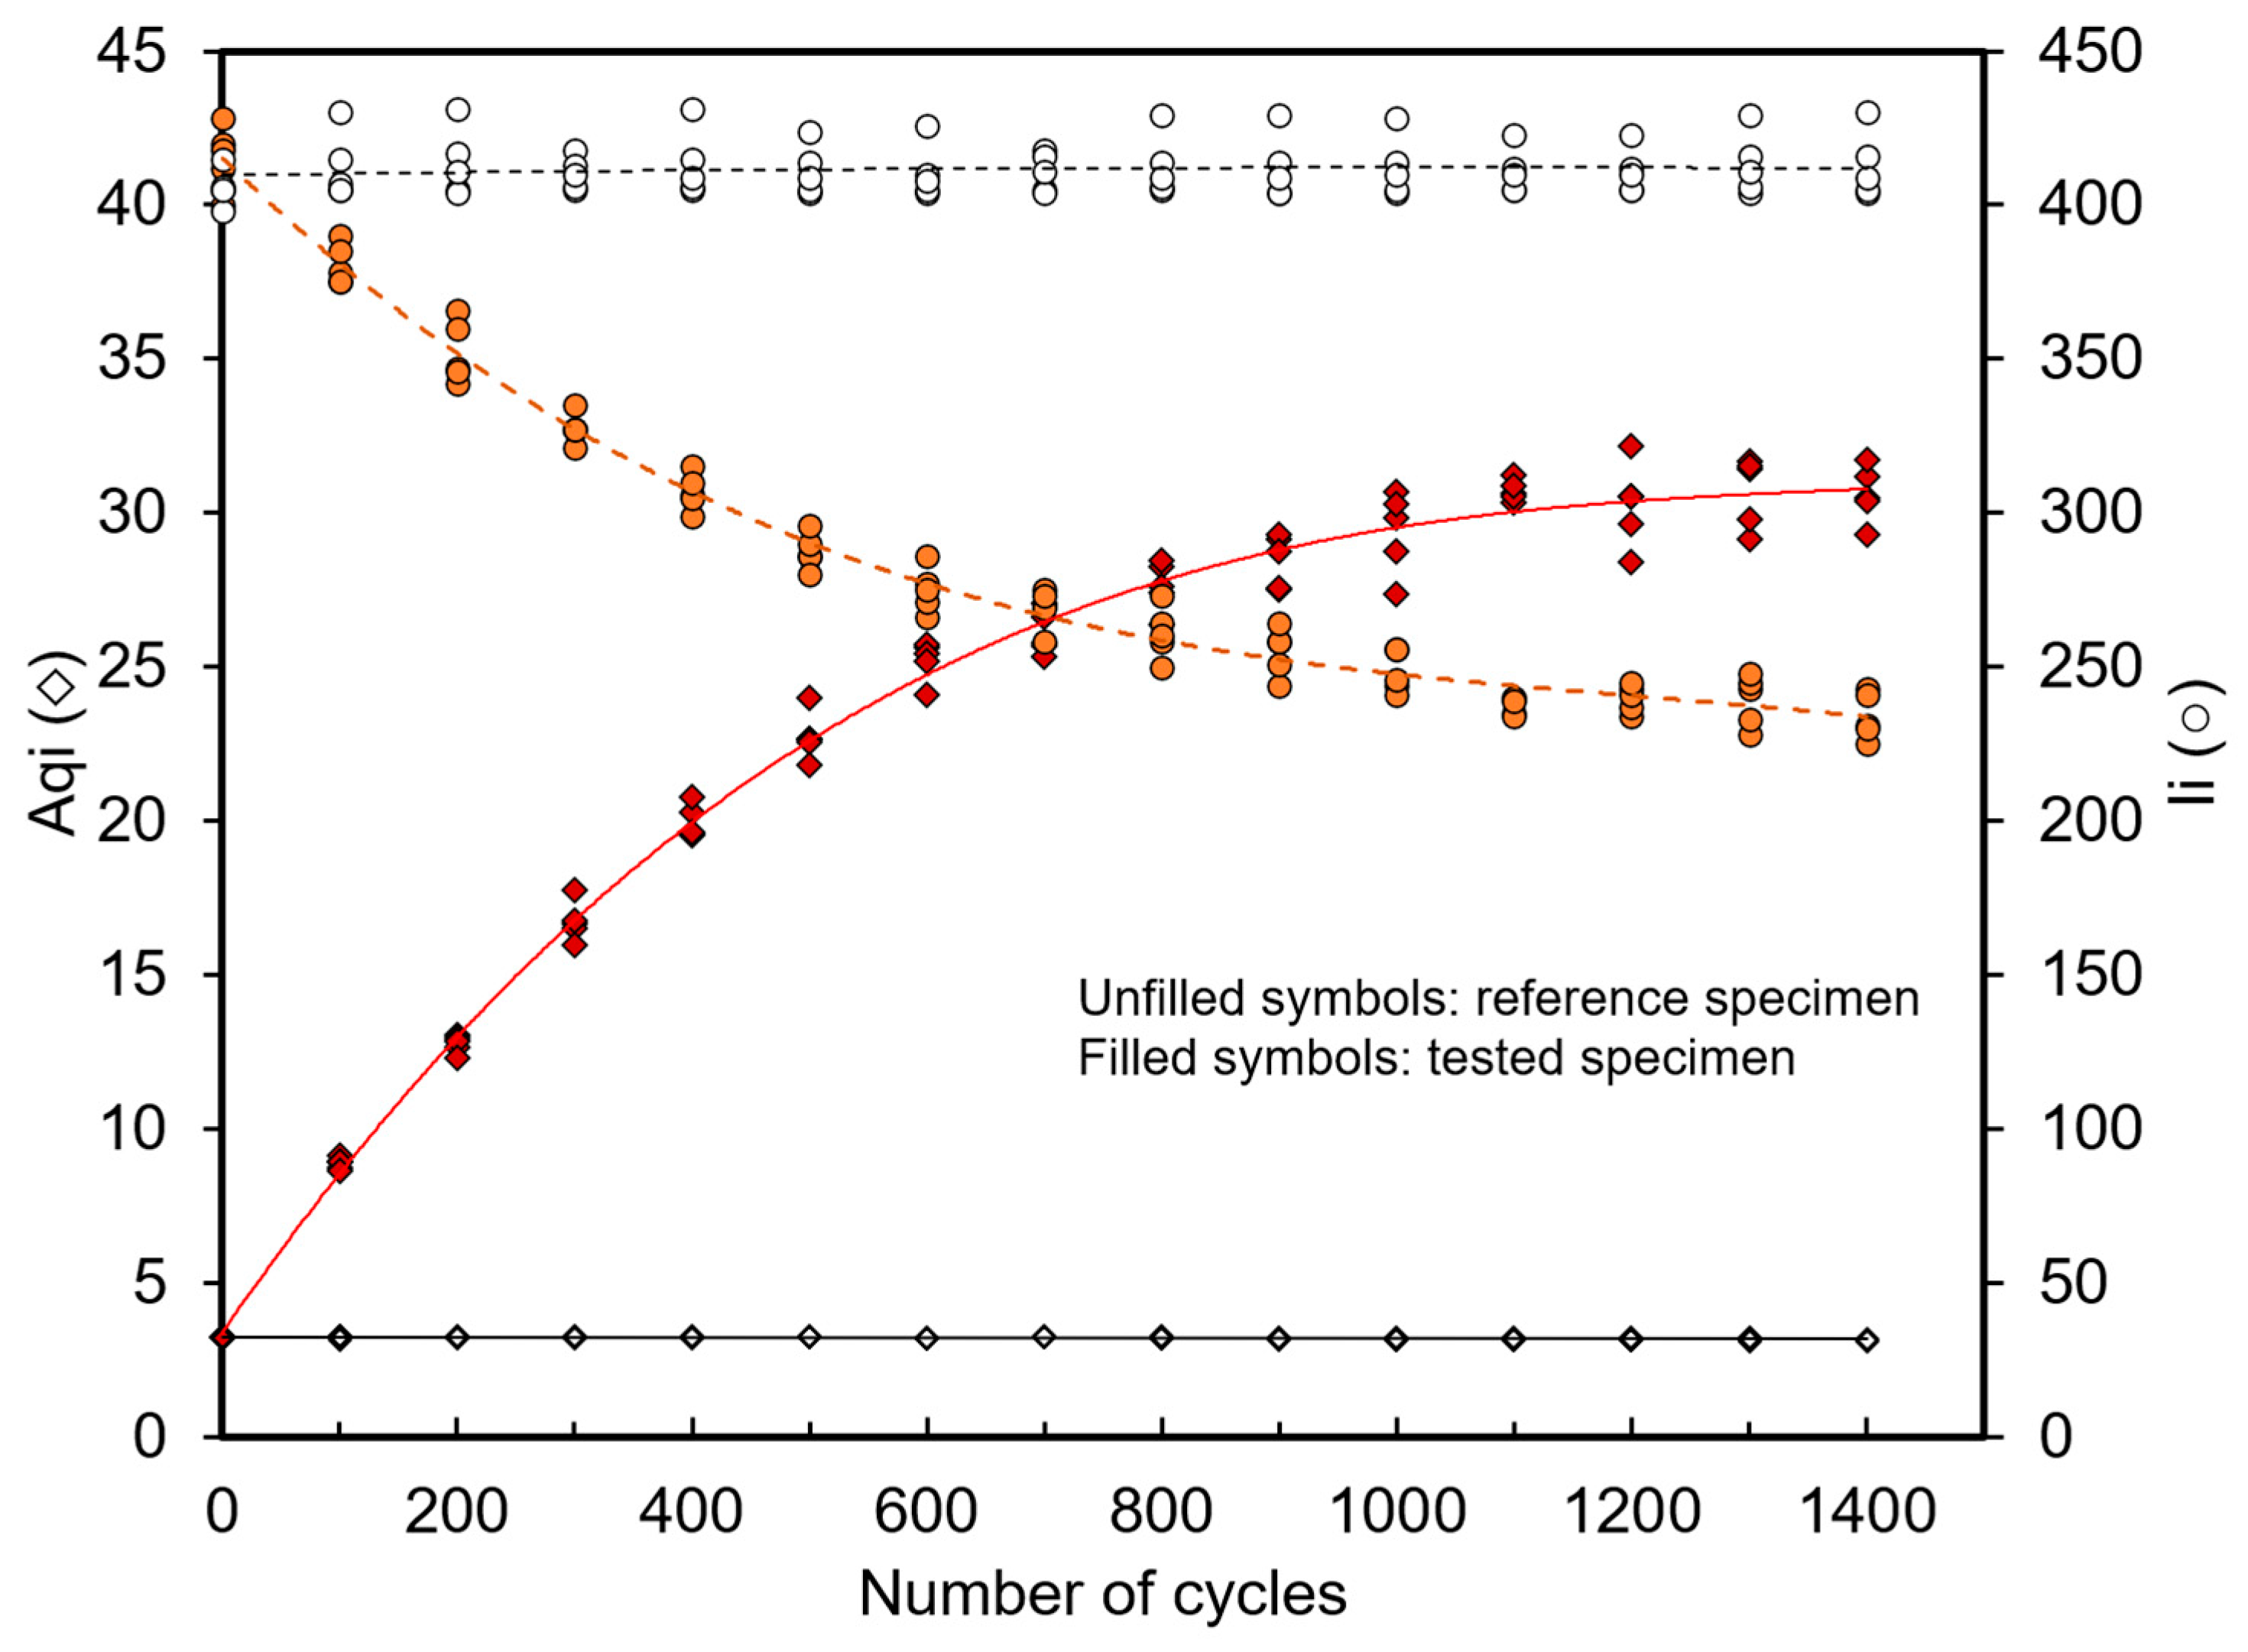
Figure 6 demonstrates the development of Aqi (red symbols) and the developing trend (red trendline) of the investigated specimen during testing, and it can reveal that the Aq and areal parameters (Sa and Sdq) are corresponding to each other since the development trends are similar. Figure 7 shows the Aqi and intensity (Ii) results of the reference specimen (without tests) and the developed Aqi and Ii during the tests at the interrupted cycles until failure. The reference specimen was used to determine the influences of ambient light during the measurement. The reference specimen was measured before the test specimen. Ambient light has a small effect in the range of 0.215 on the Aq results, which can be acceptable for the measurement on the actual measured surface, whereas the intensity results are not significantly influenced by the fluctuation of ambient light. The Aq values increase continuously in an upward trend until the tested cycles reach 1100 cycles. Afterward, the Aq seems unchanged until failure. In contrast, the intensity values show an opposite trend. The numerical results of Aqi on varied measuring points are shown in Table 2. The change in Aq values due to the roughness development has influenced the intensity of the scattered light distribution curves as described in [30,31].
Figure 6.
The surface roughness measurement results in Sa and Sdq compared to Aqi development.
Figure 7.
The surface measured results using the OS 500 sensor; (unfilled symbols) Aqi and Ii results of a reference specimen (without testing) at the interrupted cycles of the tested specimen and (filled symbols) Aqi and Ii development of the tested specimen until failure.
Table 2.
The Aqi developmental interrupted cycles.
3.3. Extrusion and Intrusion Identification and Characterization
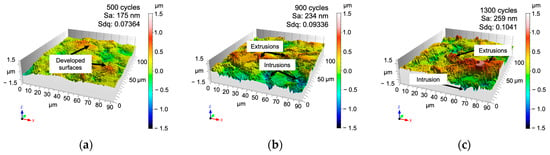
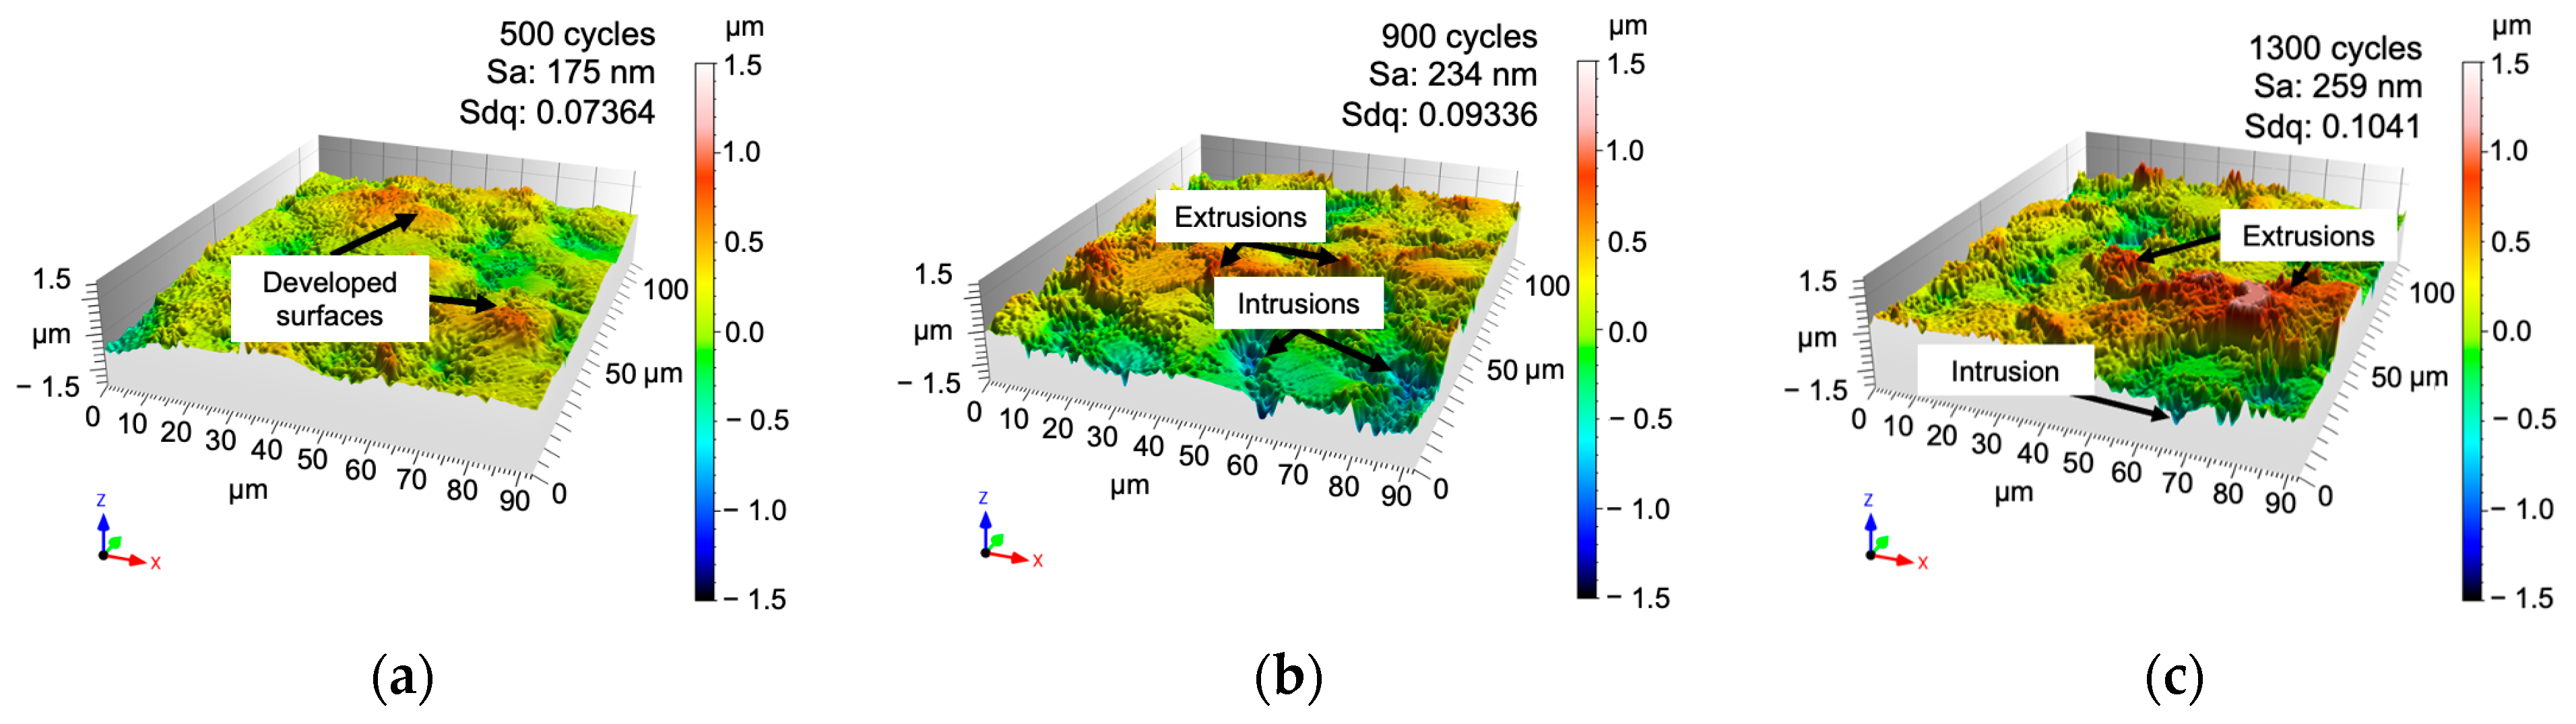
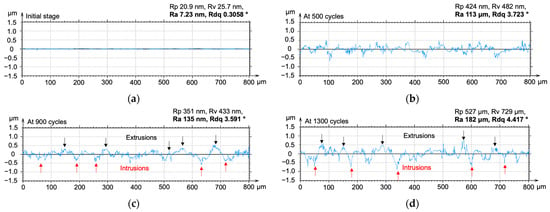
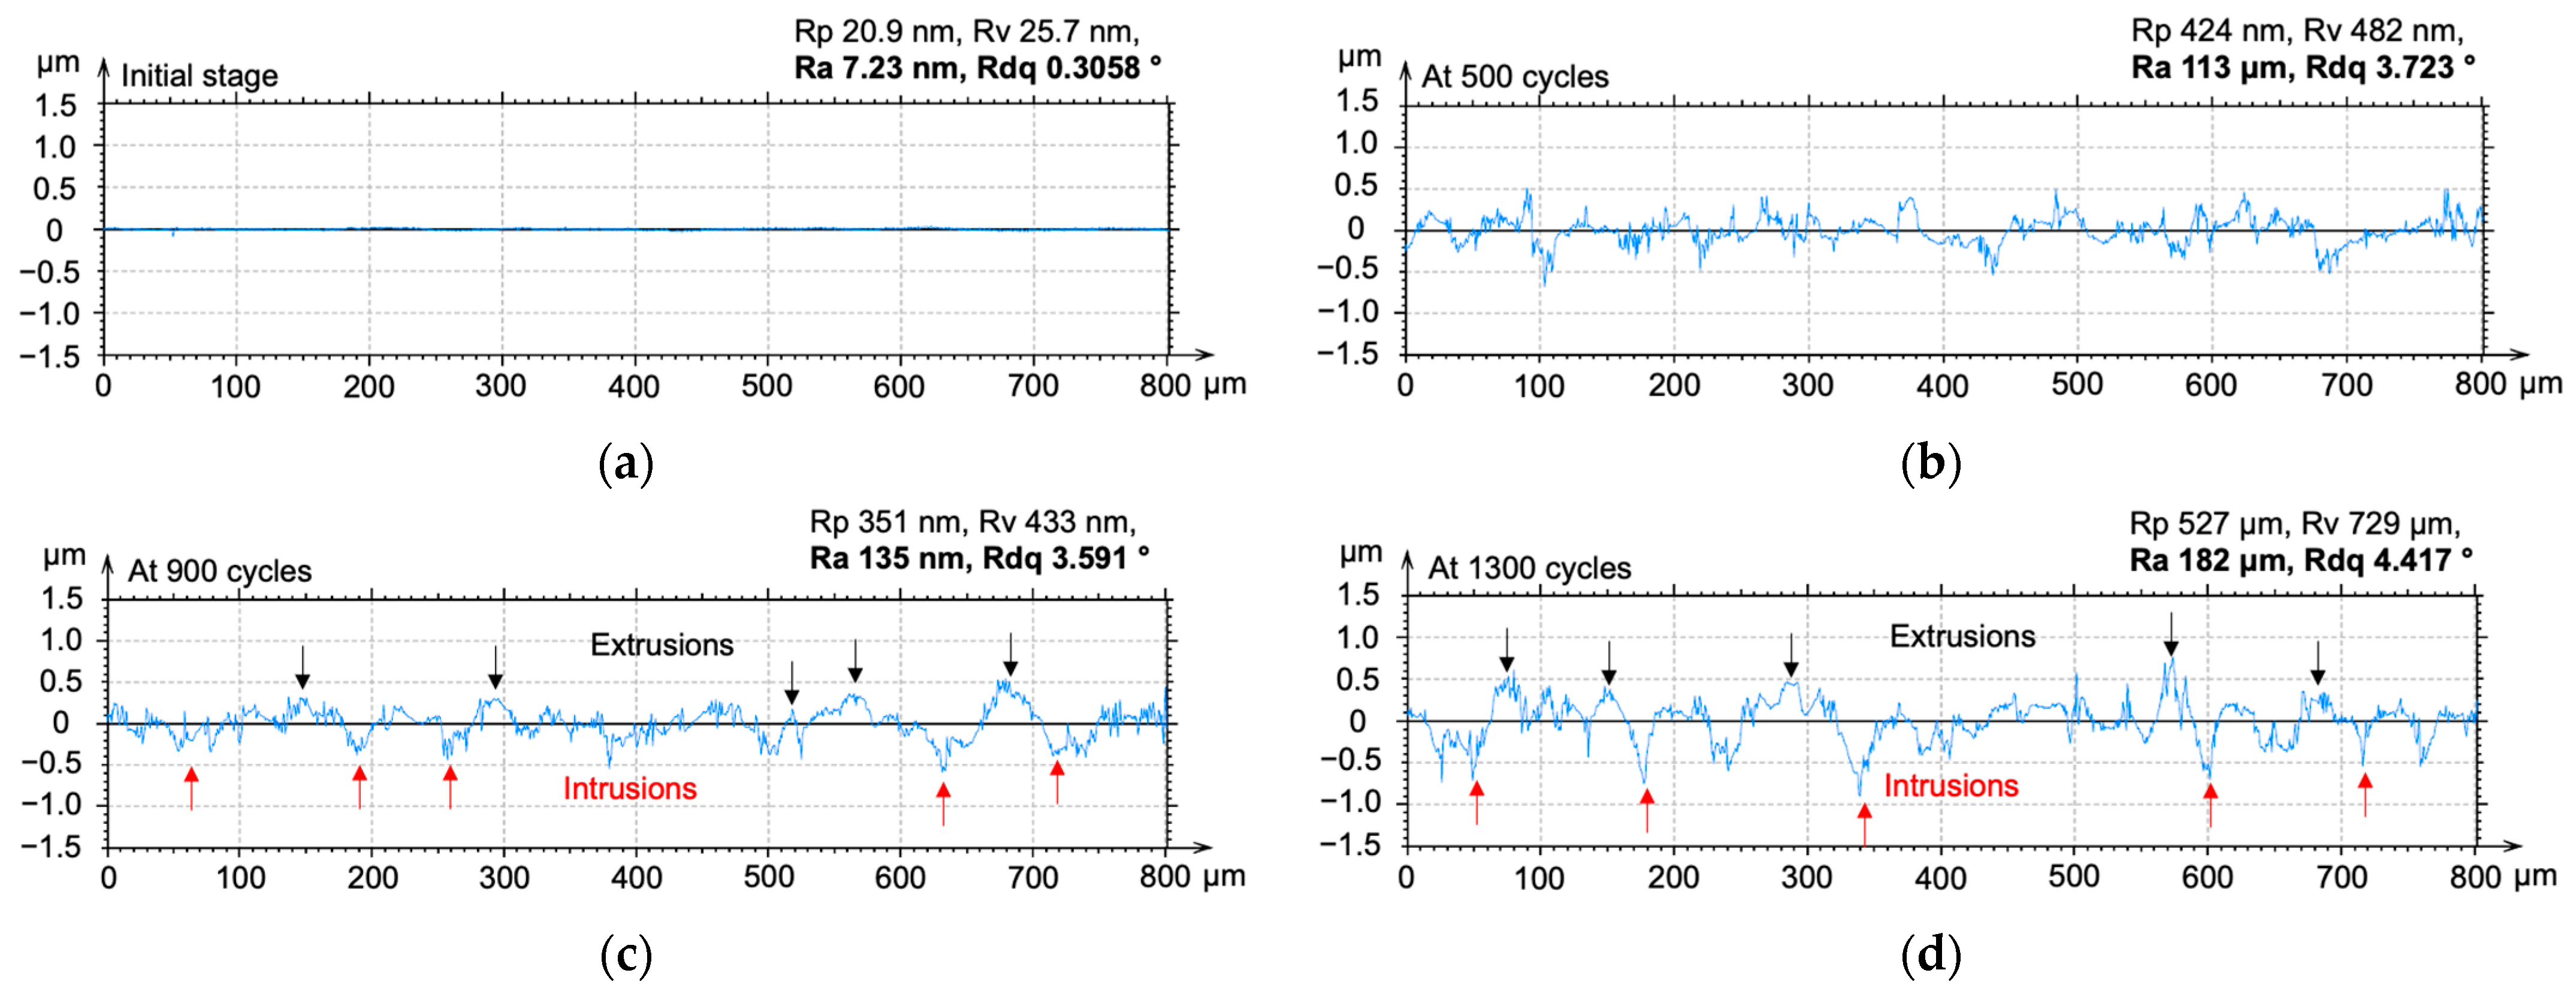
Regarding the previous study, the PSBs can promote the PSMs on the surface as the appearance of extrusions and intrusions on the free surface during cyclic loading [7,17]. In this work, we confirm that the surfaces were modified by extrusions and intrusions during cyclic loading because the measured roughness parameters of Sa and Sdq were developed. The 3D topography micrographs from the Nanofocus can display the characteristics of extrusions and intrusions as shown in Figure 8. Figure 8a–c show the developed surfaces in 3D micrographs of the tested specimen at 500, 900, and 1300 cycles, respectively. The extrusions seem to be first created at the start of the test and followed by the intrusions as reported in [9]. Figure 9 shows representative profile measurements of initial and developed surfaces, which show that the roughness was modified because of the pile-up and sink-in of the material. Figure 9a is the roughness profile of the initial surface (as-polished). At 500 cycles, as shown in Figure 8a, the developed surfaces were observed and can be identified as mountains; furthermore, Figure 9b confirms that the roughness profile was changed by the formation of the markings on the surface. At 900 and 1300 cycles, the extrusions and intrusions present as flat top and sharp edge, respectively, as can be seen in Figure 8b,c. Figure 9c confirms that the intrusions became deeper while the test cycles increased. Within a short period before breaking at 1300 cycles, the specimen presents significantly high extrusions and deep intrusions, as shown in Figure 8c and Figure 9d. In particular, the intrusions after 1300 cycles are significantly deeper than after 500 cycles, as illustrated in Figure 9d and marked by the arrows. The Rp and Rv developments, as demonstrated in Figure 9 from the discrete profile measurements, represent the progress of the extrusion and intrusion formations during the fatigue tests. Moreover, the steepness of the peaks of roughness was modified as well, which can be seen through the development of the Rdq values. As mentioned before, the profile measurement can better represent the characteristics of the extrusions and intrusions than the parameters from areal measurements; thus, Figure 9 can confirm this assumption. The profile measurement can provide several heights of extrusions and the depths of intrusions as well [8,17].
Figure 8.
The identification of extrusions and intrusions on topography images during cyclic loading at (a) 500 cycles, (b) 900 cycles, and (c) 1300 cycles.
Figure 9.
The representative profile measurements on the same measured surface area at (a) the initial stage, (b) 500 cycles, (c) 900 cycles, and (d) 1300 cycles.
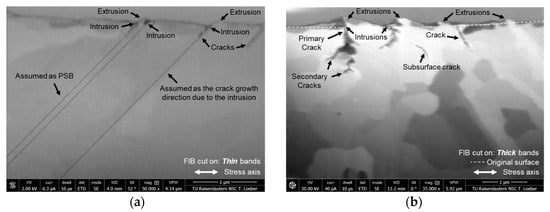
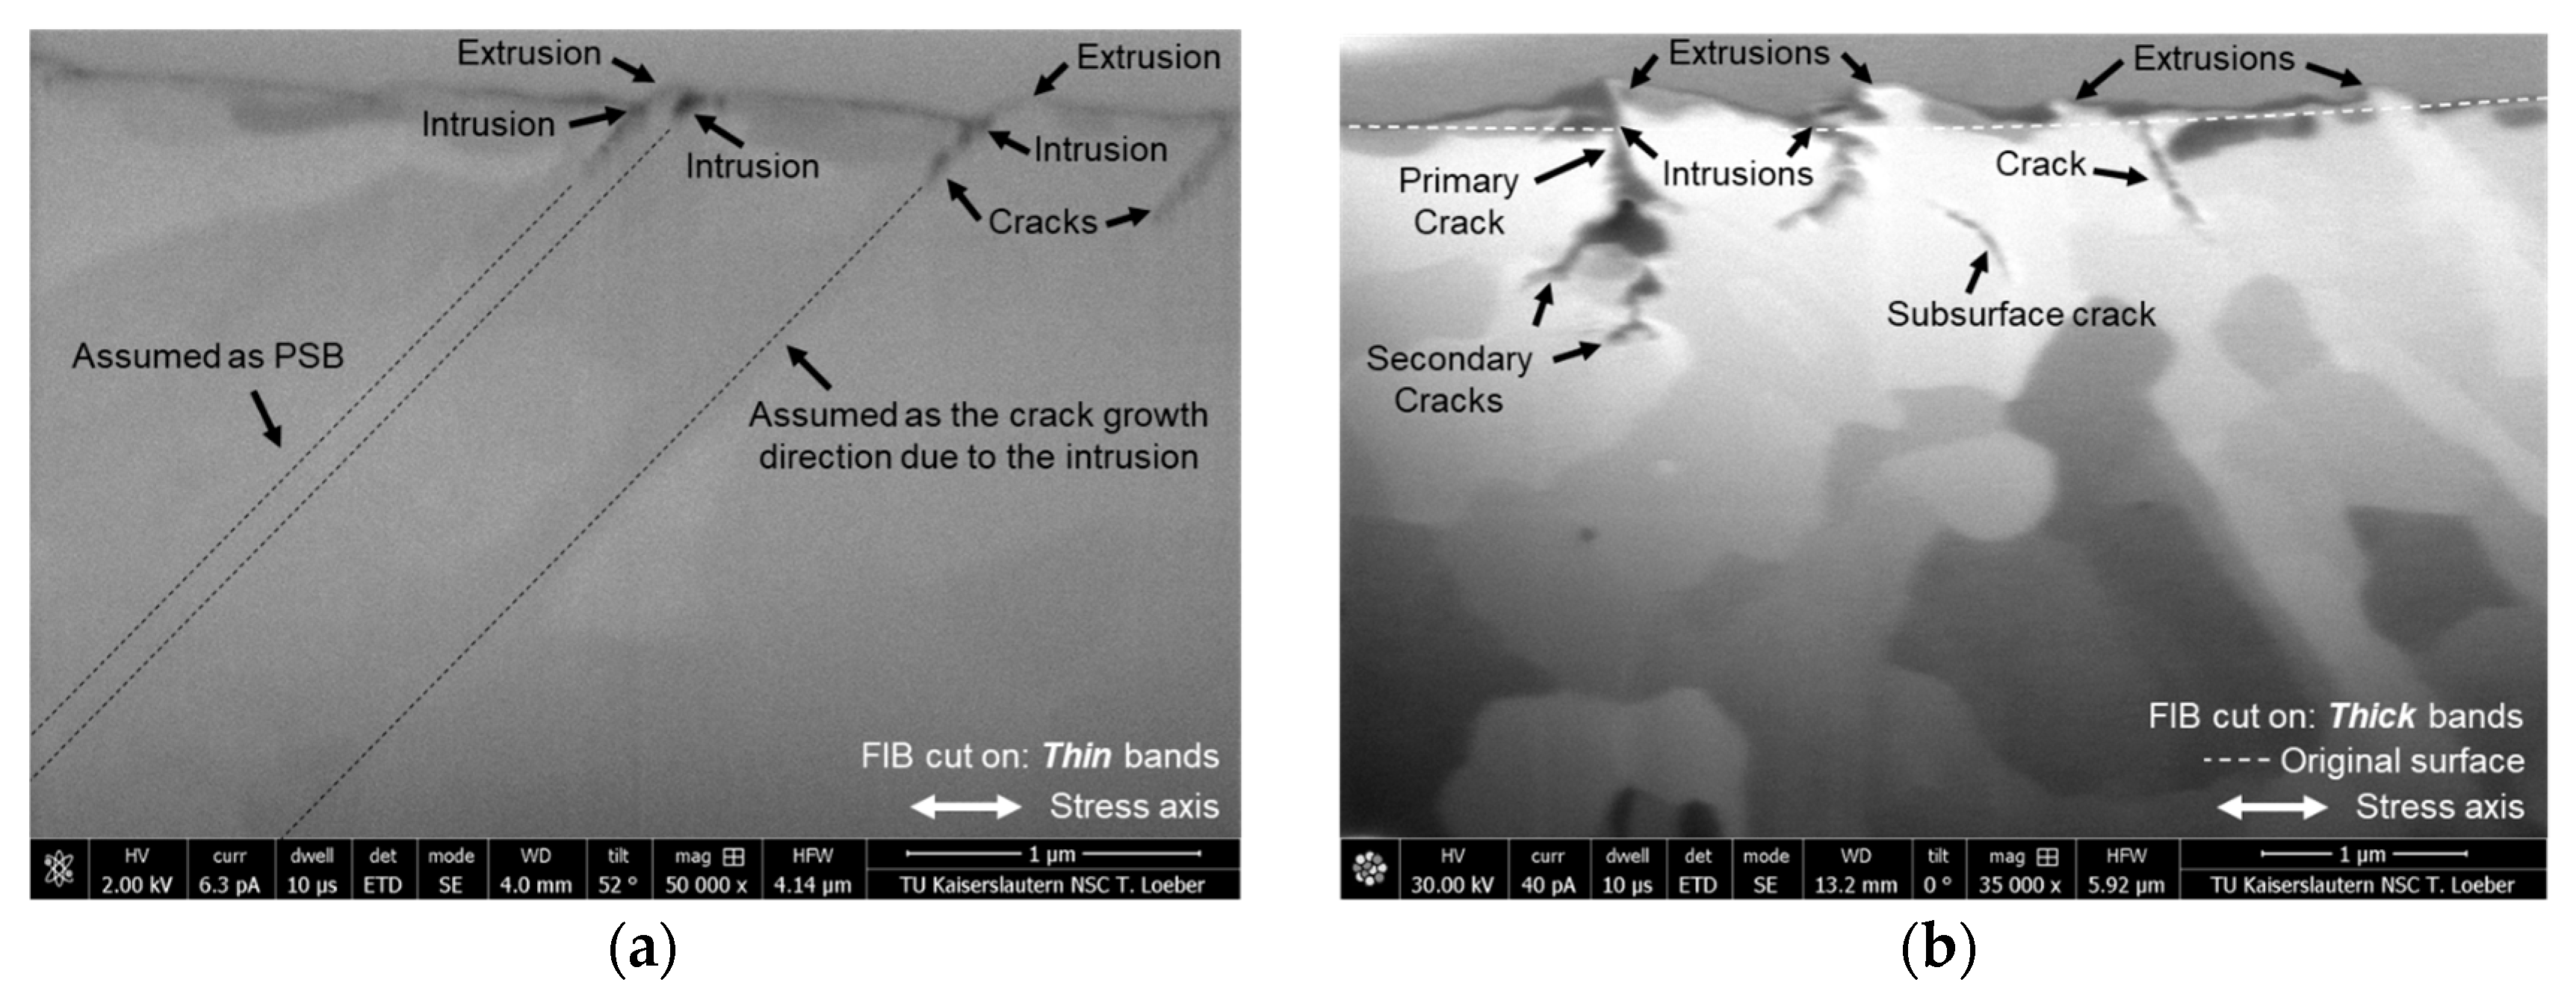
Previously, many techniques were performed to determine the shape of extrusions and intrusions because the numerical characteristics of PSM are necessary information for the models of fatigue crack initiation [1,5,9]. The most popular technique in the papers reporting the PSM characteristics is the AFM [15,16]. However, another typical method to observe the characteristics of extrusions and intrusions is FIB–SEM, which was also employed to describe the shape, width, and angle of the emerged PSM [26]. In this work, the FIB–SEM was utilized to observe and confirm the PSM formation on the surface and crack branching. Figure 10 shows the FIB cuts on the slip bands of the tested specimen’s surface at 900 cycles. Regarding the observation using an optical microscope, two types of bands were classified by the observed thickness and width appearances, which provided thin and thick slip bands. Both slip bands were cut and observed. According to FIB–SEM micrographs, not only the extrusions and intrusions were observed and confirmed, but also the cracks initiated at the tip of the intrusions. The intrusions were formed and possibly encouraged the crack initiation at the intrusions. Figure 10a presents the extrusions and intrusions from the thin observed slip bands on the tested surface. Cracks due to intrusions are observed as well. Regarding the characteristics of PSMs on the FIB–SEM micrograph in Figure 10a, the PSB channel can be assumed through the area underneath the emerged PSM with the same inclined angle. The intrusions were formed at 45° (approx.). Moreover, the primary cracks were observed at the tips of intrusions at the same inclined angle of formed intrusions. In addition, the induced microstructure modification during fatigue loading, encouraged by the plastic deformation process due to cyclic hardening and softening mechanisms of the steel, especially for C45E, can be explained through the hysteresis loops of the experimental data, as reported by the researcher [30,31]. The FIB cut on the thicker bands is shown in Figure 10b. The extrusions and intrusions were also observed, but the extrusions were thicker and higher than the extrusions observed on thin slip bands. Furthermore, the intrusions from the thicker slip bands are deeper than those from the thin slip bands. The primary cracks were observed following the growth of secondary cracks that started at the approximate depth of 0.3 microns from the original surface. According to the investigation using observation techniques and surface roughness measurement, the appearances of PSMs are measurable and observable. Moreover, the PSMs can be identified as evidence of the PSB formation created inside the material during cyclic loading. Thus, the emergence of PSMs influenced the surface roughness, which can also be measured through roughness measurements. We ensured that the intrusions were crack initiation sites because the valley depth of the intrusions had a sharp edge, and primary cracks were also observed. On the other hand, the top of the observed extrusions is mostly flat, and the cracks promoted by the extrusion are not observed. The promoted PSMs on the free surface can be investigated and confirmed that the shape and some dimensions of extrusions and intrusions can be provided by measurements using confocal microscopy and FIB–SEM. In contrast, an angle-resolved scattered light sensor cannot provide the characteristics of PSMs, whereas it can provide the alterations of the surface gradient due to the formation of extrusion and intrusion, although the surface has been altered slightly [32,33].
Figure 10.
FIB–SEM of the slip bands on the surface at 900 cycles (a) on the thin slip bands and (b) on the thick slip bands.
3.4. Fracture Surface
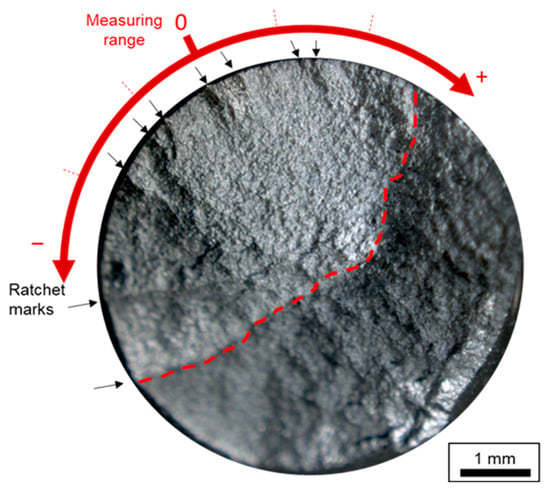
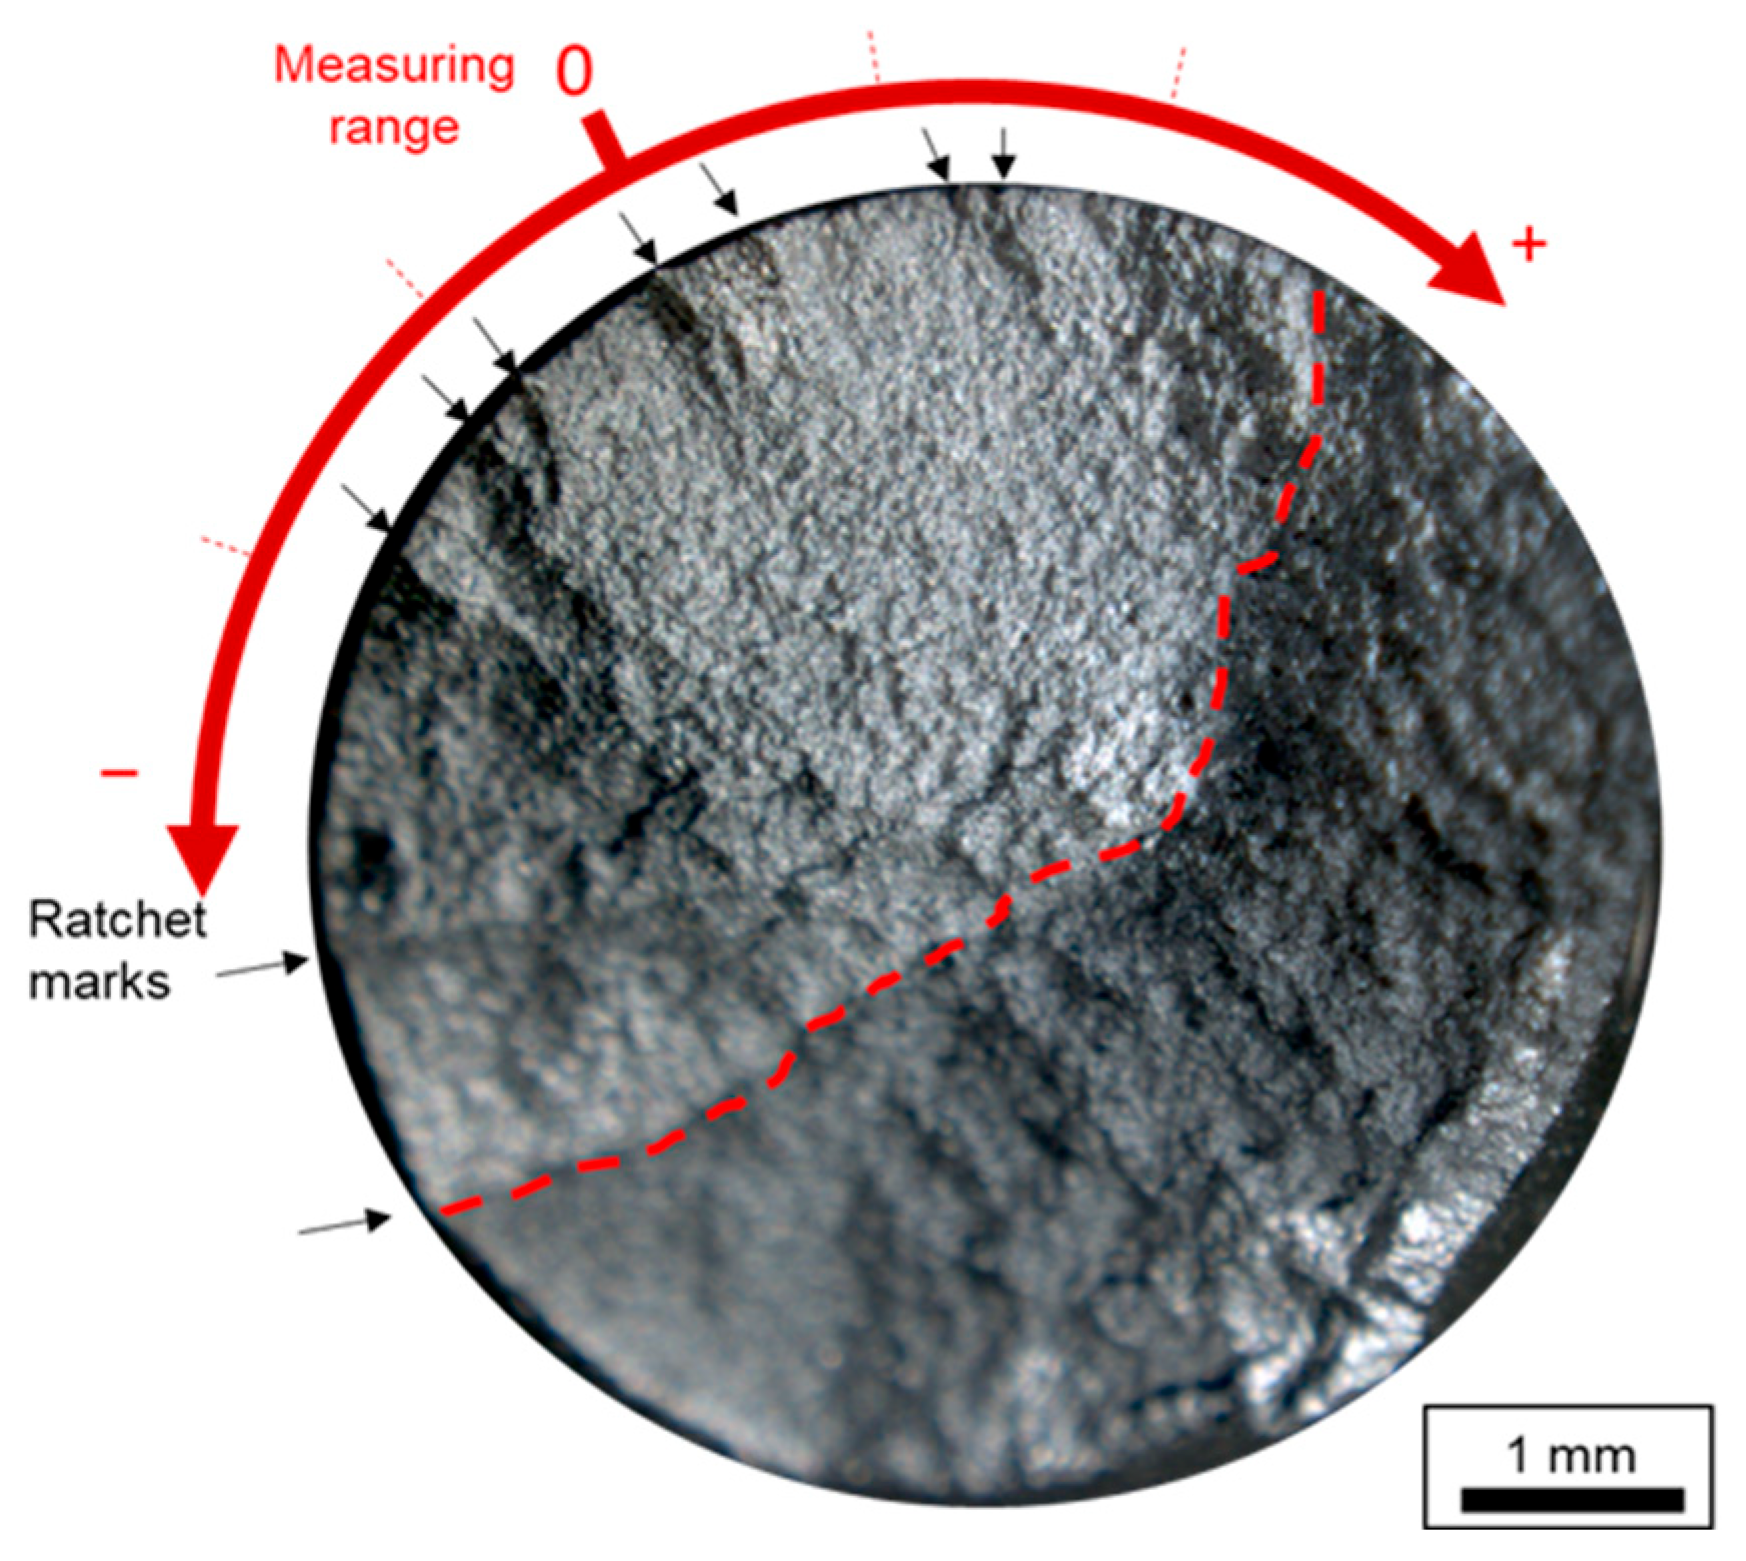
The fatigue test specimen broke after 1474 cycles. Afterward, the fracture surface was investigated by a stereomicroscope. In Figure 11, the ratchet marks are observed and indicated by black arrows. We can identify the marks as the crack origins. Several fatigue cracks started at the surface, grew together, and ran through half of its diameter (approx. 50% of the area) at the gauge length. The end of the fatigue crack area is marked by a dotted red line in Figure 11. Regarding the fracture surface, the areas of crack initiation sites were covered by the scattered light sensor measurement. So, the Aq results and the site of crack initiation accordingly, and roughness results can present the surface development mechanism that led to crack initiation. Ratchets’ marks are evidence of the PSM formation on the fracture surface, and they were specified as the fatigue crack origins.
Figure 11.
The fracture surface (broken at 1474 cycles) and the red dashed line separates the fatigue and final rupture zones.
4. Conclusions
The fine-polished surface prepared using diamond suspension reveals a suitable surface quality to observe and measure the surface alterations during cyclic loading due to PSM formations by the techniques. Ambient light has no significant effect in this study on measurements using the scattered light sensor because the alteration on the surface from cyclic loading is significantly larger than the fluctuations from ambient light. The surface development can be confirmed through the roughness results in Sa, Sdq, and Aq parameters. The values of these parameters increased until failure, which means that the PSB and PSM were formed during the tests and generated extrusions and intrusions that influenced the roughness. The Aq and the areal roughness parameters are comparable parameters because they demonstrate a similar upward trend in the developed roughness results. PSMs consist of extrusions and intrusions, which can be identified by areal and profile measurements and FIB micrographs. This work can also confirm that extrusions were built prior to the intrusions, even though the intrusions play the main role in crack initiation. Primary and secondary cracks were observed. Moreover, the observed cracks from SEM–FIB micrographs were found at the end tip of intrusions. PSB channel can be assumed by the emerging PSMs. The cracks were initiated at the surface and grew through the specimen, as shown by several ratchet marks on the fracture surface that were identified as multiple crack origins.
Both surface measurement techniques provide interesting and potential results for future work. Especially, a scattered light sensor can possibly be applied for measuring the modified surface during cyclic loading as in situ measurement.
Author Contributions
Conceptualization, P.S. and E.K.; methodology, P.S., G.S. and E.K.; formal analysis, P.S., G.S., J.S. and E.K.; investigation, P.S. and E.K.; writing—original draft preparation, P.S.; writing—review and editing, G.S., J.S. and E.K.; supervision, E.K. All authors have read and agreed to the published version of the manuscript.
Funding
This research received no external funding.
Data Availability Statement
The original contributions presented in this study are included in the article. Further inquiries can be directed to the corresponding authors.
Acknowledgments
The authors would like to thank the Royal Thai Government’s scholarships for funding to support one of the authors (Phanuphak Seensattayawong), and we are grateful to Thomas Löber from the Nano Structuring Center (NSC) of RPTU University Kaiserslautern-Landau for valuable characterization using FIB–SEM operations.
Conflicts of Interest
The authors declare no conflicts of interest.
References
- Polák, J. Role of Persistent Slip Bands and Persistent Slip Markings in Fatigue Crack Initiation in Polycrystals. Crystals 2023, 13, 220. [Google Scholar] [CrossRef] [Scilit]
- Polák, J.; Man, J. Experimental evidence and physical models of fatigue crack initiation. Int. J. Fatigue 2016, 91, 294–303. [Google Scholar] [CrossRef] [Scilit]
- Cao, W.; Conra, H. On the effect of persistent slip band (PSB) parameters on fatigue life. Fatigue Fract. Eng. Mat. Struct. 1992, 15, 573–583. [Google Scholar] [CrossRef] [Scilit]
- Essmann, U.; Gösele, U.; Mughrabi, H. A model of extrusions and intrusions in fatigued metals I. Point-defect production and the growth of extrusions. Philos. Mag. A 1981, 44, 405–426. [Google Scholar] [CrossRef] [Scilit]
- Polák, J.; Mazánová, V.; Heczko, M.; Kuběna, I.; Man, J. Profiles of persistent slip markings and internal structure of underlying persistent slip bands. Fatigue Fract. Eng. Mat. Struct. 2017, 40, 1101–1116. [Google Scholar] [CrossRef] [Scilit]
- Lukáš, P.; Klesnil, M.; Krejčí, J.; Ryš, P. Substructure of Persistent Slip Bands in Cyclically Deformed Copper. Phys. Status Solidi 1966, 15, 71–82. [Google Scholar] [CrossRef] [Scilit]
- Polák, J.; Mazánová, V.; Heczko, M.; Petráš, R.; Kuběna, I.; Casalena, L.; Man, J. The role of extrusions and intrusions in fatigue crack initiation. Eng. Fract. Mech. 2017, 185, 46–60. [Google Scholar] [CrossRef] [Scilit]
- Seensattayawong, P.; Kerscher, E. The Evolution of Surfaces on Medium-Carbon Steel for Fatigue Life Estimations. Coatings 2024, 14, 1077. [Google Scholar] [CrossRef] [Scilit]
- Polák, J.; Jadlovský, D.; Kruml, T. Extrusions and intrusions in the cyclic plastic zone of the growing fatigue crack in polycrystalline copper. Int. J. Fatigue 2024, 179, 108063. [Google Scholar] [CrossRef] [Scilit]
- Déprés, C.; Robertson, C.F.; Fivel, M.C. Crack initiation in fatigue: Experiments and three-dimensional dislocation simulations. Mater. Sci. Eng. A 2004, 387–389, 288–291. [Google Scholar] [CrossRef] [Scilit]
- Polák, J.; Man, J.; Kruml, T. The sources of cyclic slip irreversibility. Acta Mater. 2024, 267, 119709. [Google Scholar] [CrossRef] [Scilit]
- Torner, F.M.; Das, J.; Stelzer, G.; Linke, B.; Seewig, J. Fundamental Analysis of the Usability of an Angle-Resolved Scattered Light Sensor for Monitoring Vibratory Finishing Processes Based on Ray Tracing Simulations. AMM 2017, 869, 115–127. [Google Scholar] [CrossRef] [Scilit]
- Gonchar, A.V.; Kurashkin, K.V.; Andreeva, O.V.; Anosov, M.S.; Klyushnikov, V.A. Fatigue life prediction of structural steel using acoustic birefringence and characteristics of persistent slip bands. Fatigue Fract. Eng. Mat. Struct. 2022, 45, 101–112. [Google Scholar] [CrossRef] [Scilit]
- Phung, N.L.; Favier, V.; Ranc, N.; Valès, F.; Mughrabi, H. Very high cycle fatigue of copper: Evolution, morphology and locations of surface slip markings. Int. J. Fatigue 2014, 63, 68–77. [Google Scholar] [CrossRef] [Scilit]
- Villechaise, P.; Sabatier, L.; Girard, J.C. On slip band features and crack initiation in fatigued 316L austenitic stainless steel: Part 1: Analysis by electron back-scattered diffraction and atomic force microscopy. Mater. Sci. Eng. A 2002, 323, 377–385. [Google Scholar] [CrossRef] [Scilit]
- Cretegny, L.; Saxena, A. AFM Characterization of the Evolution of Surface Deformation During Fatigue in Polycrystalline Copper. Acta Mater. 2001, 49, 3755–3765. [Google Scholar] [CrossRef] [Scilit]
- de Lacerda, J.C.; Martins, G.D.; Signoretti, V.T.; Teixeira, R. Evolution of the surface roughness of a low carbon steel subjected to fatigue. Int. J. Fatigue 2017, 102, 143–148. [Google Scholar] [CrossRef] [Scilit]
- Polák, J.; Man, J. Initiation of Stage I Fatigue Cracks—Experiments and Models. Procedia Eng. 2015, 101, 386–394. [Google Scholar] [CrossRef] [Scilit]
- Li, L.; Zhang, Z.; Zhang, P.; Li, C.; Zhang, Z. Dislocation arrangements within slip bands during fatigue cracking. Mater. Charact. 2018, 145, 96–100. [Google Scholar] [CrossRef] [Scilit]
- Schneider, P.; Stratmann, I.; Rakowitsch, M.; Schindler, C. Untersuchung der Interaktion zwischen Reibleistung im Rad-Schiene-Kontakt und der durch Streulichtmessungen charakterisierten Radoberflächentopographie. In IRSA 2021: Tagungsband, Proceedings: 3rd International Railway Symposium Aachen, Aachen, Germany, 21–23 November 2021; RWTH Aachen University: Aachen, Germany, 2022. [Google Scholar] [CrossRef]
- Brodmann, R.; Thurn, G. Roughness measurement of ground, turned and shot-peened surfaces by the light scattering method. Wear 1986, 109, 1–13. [Google Scholar] [CrossRef] [Scilit]
- DIN 50150; Testing of Metallic Materials: Conversion of Hardness Values. Beuth Verlag GmbH: Berlin, Germany, 2000.
- ASTM E466-15; Practice for Conducting Force Controlled Constant Amplitude Axial Fatigue Tests of Metallic Materials. ASTM International: West Conshohocken, PA, USA, 2015.
- Haibach, E. Betriebsfestigkeit: Verfahren und Daten zur Bauteilberechnung, 3., Korrigierte und Ergänzte Auflage; Springer: Berlin/Heidelberg, Germany, 2006; ISBN 9783540293644. [Google Scholar]
- Li, C.; Dai, W.; Duan, F.; Zhang, Y.; He, D. Fatigue Life Estimation of Medium-Carbon Steel with Different Surface Roughness. Appl. Sci. 2017, 7, 338. [Google Scholar] [CrossRef] [Scilit]
- Polák, J.; Babinský, T.; Vražina, T.; Kruml, T. The Role of Extrusions and Intrusions in the Initiation and Intergranular Growth of Fatigue Cracks. Adv. Eng. Mater. 2024, 26, 2400313. [Google Scholar] [CrossRef] [Scilit]
- DIN 25178-2; Geometrical Product Specifications (GPS)–Surface Texture: Areal–Part 2: Terms, Definitions and Surface Texture Parameters. Beuth Verlag GmbH: Berlin, Germany, 2012.
- DIN EN ISO 4287; Internationales Wörterbuch der Metrologie: Grundlegende und allgemeine Begriffe und zugeordnete Benennungen (VIM); Deutsch-Englische Fassung ISO/IEC-Leitfaden 99:2007 = Vocabulaire International de Métrologie; Deutsches Institut für Normung, 3. Aufl. Beuth: Berlin, Germany, 2010.
- VDA-Empfehlung 2009; Oberflächenbeschaffenheit: Geometrische Produktspezifikation Winkelaufgelöste Streulichtmesstechnik; Definition, Kenngrößen und Anwendung. VDA Verband der Automobilindustrie: Berlin, Germany, 2010.
- Deldar, S.; Smaga, M.; Beck, T. On the influence of cyclic loadings on the magnetic permeability of ferritic-pearlitic AISI 1045 steel. Int. J. Fatigue 2022, 159, 106650. [Google Scholar] [CrossRef] [Scilit]
- Moćko, W. The influence of stress-controlled tensile fatigue loading on the stress–strain characteristics of AISI 1045 steel. Mater. Des. 2014, 58, 145–153. [Google Scholar] [CrossRef] [Scilit]
- Seensattayawong, P.; Brodmann, R.; Stelzer, G.; Seewig, J.; Kerscher, E. The study of surface in early stages of fatigue failure on carbon steels using a confocal microscope and a scattered light sensor. Eng. Fail. Anal. 2025, 178, 109720. [Google Scholar] [CrossRef] [Scilit]
- Seensattayawong, P.; Stelzer, G.; Seewig, J.; Kerscher, E. Surface inspection to detect early fatigue crack initiation in the low cycle fatigue regime of high carbon steel using a scattered light sensor. Mater. Test. 2025, 67, 1641–1650. [Google Scholar] [CrossRef] [Scilit]

Disclaimer/Publisher’s Note: The statements, opinions and data contained in all publications are solely those of the individual author(s) and contributor(s) and not of MDPI and/or the editor(s). MDPI and/or the editor(s) disclaim responsibility for any injury to people or property resulting from any ideas, methods, instructions or products referred to in the content. |
© 2026 by the authors. Licensee MDPI, Basel, Switzerland. This article is an open access article distributed under the terms and conditions of the Creative Commons Attribution (CC BY) license.