


Abstract
In this study, ZnO–GO nanocomposites were synthesized from waste Zn–C batteries and used for the photocatalytic degradation of malachite green (MG) under UV light. ZnO–GO nanocomposites with different GO contents (1, 2.5, and 5 wt%) were prepared at room temperature and characterized by XRD, SEM, EDS, and UV–Vis spectroscopy. The GO content significantly affects the morphology, optical properties, and photocatalytic activity of the nanocomposites. In the presence of ZnO NPs, a malachite green degradation efficiency of 96.25% was achieved in 90 min, while ZnO–1%GO, ZnO–2.5%GO, and ZnO–5%GO achieved 95.35%, 97.27%, and 99.6% MG degradation, respectively, in just 30 min. The photocatalytic degradation process of MG was optimized using Response Surface Methodology (RSM). The effects of GO content, catalyst dosage, initial MG concentration, and irradiation time on the efficiency of photocatalytic degradation were investigated, and optimal conditions were determined. Under optimal conditions, a photocatalytic degradation efficiency of 98.51% was achieved. These results indicate that ZnO–GO nanocomposites synthesized from waste Zn–C batteries are efficient and environmentally friendly photocatalysts for the treatment of dye-contaminated wastewater.
1. Introduction
Water pollution from industrial wastewater containing synthetic dyes is a serious environmental issue because organic dyes are chemically stable pollutants that threaten aquatic ecosystems and human health [1,2,3,4]. Malachite green (MG) (N-methylated diaminotriphenylmethane) is a synthetic cationic dye [2,3] widely used in medicine [5], textile [2,3,6], and the food industry [5,7]. However, even at low concentrations (<1 mg/L), malachite green has cytotoxic, mutagenic, and carcinogenic effects [3]. Therefore, removing malachite green is important for protecting the environment and human health.
Various methods, such as adsorption [8,9,10], sonochemical degradation [11,12], membrane filtration [13], and biological treatment [14,15,16], have been investigated for treating water contaminated with MG. However, these methods are limited by low efficiency, high costs, and the generation of secondary pollution [1,2,3,17]. As a result, advanced oxidation processes (AOPs) have attracted significant attention from researchers, with photocatalytic decomposition standing out as the most frequently used and effective method for wastewater treatment [1,18,19]. Photocatalytic degradation relies on the in situ generation of reactive oxidative species that can degrade and mineralize a wide range of toxic organic compounds to CO2 and H2O [20].
Zinc oxide (ZnO), due to its wide energy gap (3.37 eV), high photosensitivity, availability, non-toxicity, and chemical and thermal stability, is one of the most commonly used semiconductors [21,22]. However, its practical application is limited by the rapid recombination of photoinduced electrons (e–) and holes (h+), particle agglomeration, and significantly reduced activity under visible light [21,23,24]. To overcome these shortcomings, various modification strategies for ZnO have been developed, among which the use of graphene oxide (GO) as a modifying agent has proven effective [22,25,26].
Graphene oxide can reduce the energy band gap of ZnO and the recombination of photogenerated electron–hole pairs, improving the photocatalytic performance of ZnO, especially under visible light [22,24,27]. In addition, graphene oxide has a layered structure and a large specific surface area (200–500 m2/g), providing abundant active sites for pollutant adsorption and degradation, while also enhancing the mechanical stability and long-term performance of ZnO–GO nanocomposites [25,26]. For these reasons, ZnO–GO nanocomposites have attracted considerable attention from researchers in recent years.
A literature review indicates that the synthesis of ZnO–GO nanocomposites typically relies on methods that require high temperatures, commercial and often expensive precursors, and specialized equipment, while the use of secondary raw materials such as waste batteries remains unexplored. In this study, a sustainable room-temperature method for synthesizing ZnO–GO nanocomposites from Zn–C batteries is proposed. Both components of the nanocomposite are synthesized from Zn–C batteries, making this approach unique and aligned with circular economy principles and the United Nations Sustainable Development Goals. Furthermore, the influence of graphene oxide content (1 wt%, 2.5 wt%, and 5 wt%) on the structural, chemical, optical, and morphological properties of ZnO–GO nanocomposites was investigated. The synthesized materials were used for the photocatalytic degradation of malachite green, and the degradation process was optimized using response surface methodology (RSM).
2. Materials and Methods
2.1. Materials
Hydrochloric acid (Zorka, Šabac, Serbia), 30% hydrogen peroxide (Sanihem, Belgrade, Serbia), potassium permanganate (Merck, Darmstadt, Germany), sodium hydroxide (NRK Inženjering, Belgrade, Serbia), sodium nitrate (Merck, Darmstadt, Germany), sulphuric acid (Merck, Darmstadt, Germany) and malachite green (Centrohem, Stara Pazova, Serbia) were used in the experiments. All reagents were of analytical grade and used as supplied, without further purification.
2.2. Disassembly of the Waste Zn–C Batteries
Waste Zn–C batteries (RO3P type, size AAA, 1.5 V) without visible external damage were collected from small household appliances and used for experimental tests. Before opening, all Zn–C batteries were checked to ensure they were fully discharged. Batteries that were not completely discharged were subsequently discharged before opening. The batteries were manually opened under controlled laboratory conditions, using appropriate protective equipment, including protective gloves and a protective mask. The plastic casing was first removed from the waste Zn–C batteries, followed by the removal of the metal terminals. The batteries were then carefully opened to minimize material loss. Each battery was systematically disassembled into its individual parts, including the zinc anode, plastic and paper separators, electrolyte, and graphite electrode (Figure 1). For the laboratory synthesis of ZnO–GO nanocomposites, seven zinc anodes (15 g) and four graphite electrodes (2 g) were used, while the remaining components were stored for future recycling.
Figure 1.
Individual components obtained from disassembled Zn–C battery.
The zinc anode was polished, washed with distilled water, and treated in an ultrasonic bath for 15 min before use in the synthesis of ZnO nanoparticles (ZnO NPs). The graphite electrodes were polished with 1500 and 2000 grit sandpaper, and treated with 5% HCl to remove any electrolyte residue. The electrodes were rinsed several times with distilled water to remove all traces of the acid solution and then dried in an oven. After drying, the electrodes were ground to a fine powder.
2.3. Synthesis of Graphene Oxide
Graphene oxide was synthesized using a modified Hummer’s method [28,29], in which the ratio of graphite to oxidizing agents was adjusted compared to the traditional Hummer–Offeman procedure [30]. The synthesis of graphene oxide was conducted in a digester to ensure proper containment of reactive chemicals and safe handling.
Graphite powder obtained from Zn–C batteries and concentrated H2SO4 were mixed in a laboratory beaker. The beaker was placed in an ice bath with a magnetic stirrer, and the suspension was stirred for 1 h. Subsequently, 2.5 g of NaNO3 was gradually added, with constant temperature control (t < 10 °C) and stirring for 1 h. The temperature of the system was controlled to prevent the release of nitrogen dioxide and nitrogen tetroxide gases [31]. KMnO4 was slowly introduced into the suspension, and the reaction was allowed to proceed for 1 h to facilitate the oxidation of graphite and the formation of graphite intercalation compounds. The temperature was then adjusted to 25 °C, and stirring continued for another hour. Next, 100 mL of distilled H2O was slowly added, and the mixture was stirred for 1 h, with the temperature controlled (t < 80 °C). After that, 100 mL of distilled water was added, and mixing continued for 1 h. Concentrated H2O2 was added to the suspension to reduce non reacted permanganate. The H2O2 was added slowly because the reaction is vigorous. The resulting suspension was filtered, and the separated precipitate was washed with 5% HCl and distilled water until the pH of the filtrate was neutral. Finally, the precipitate was ultrasonically treated in a small volume of deionized water and then dried at 80 °C in an oven.
The filtrate, which contains residual acids, manganese ions, and nitrates from the oxidation process, is collected and must undergo appropriate waste treatment procedures to minimize environmental impact before disposal. Nitrate ions can be removed from aqueous solutions by biological denitrification or adsorption methods using various adsorbents such as carbon-based materials, agricultural waste, or natural materials [32]. Mn2+ ions can be precipitated by adding KOH and adjusting the pH to about 10. The resulting sediment may contain Mn3O4, and a small amount of Mn(OH)2. Adding Na2S2O8 can improve the removal efficiency of Mn2+ ions. K2SO4 can be separated from the solution by successive neutralization and evaporation of water [33].
2.4. Synthesis of ZnO Nanoparticles
Zinc obtained from waste Zn–C batteries was dissolved in HCl under continuous stirring. The reaction is violent and produces zinc chloride and releases H2 gas (Equation (1)). To precipitate zinc hydroxide, 1 M NaOH was gradually added to the ZnCl2 solution until a milky white Zn(OH)2 colloid formed (Equation (2)) [34]. The colloidal solution was filtered, and the separated precipitate was dried in an oven. The obtained precipitate was then calcined at various temperatures (400 °C, 500 °C, 600 °C, and 700 °C) for 3 h to form ZnO nanoparticles. The formation of ZnO is presented in Equation (3).
2.5. Synthesis of ZnO–GO Nanocomposites
ZnO–GO nanocomposites with different GO contents (1, 2.5, and 5 wt%) were prepared at room temperature [35]. The ZnO solution was prepared by adding 0.5 g of ZnO calcined at 700 °C to 20 mL of ethanol, while the 1 wt% GO solution was prepared by adding 0.1 g of GO to 10 mL of ethanol. Both ZnO and GO solutions were treated in an ultrasonic bath for 30 min. The ZnO solution was stirred with a magnetic stirrer for 2 h. The GO solution was added dropwise to the ZnO solution to achieve a ZnO:GO weight ratio of 98:2. The resulting mixture was stirred for 6 h and then filtered. The precipitate was dried in an oven at 80 °C until completely dry. The resulting powder was ground in an agate mortar and labeled as ZnO–1%GO nanocomposite. The same procedure was used to produce ZnO–2.5%GO and ZnO–5%GO nanocomposites. A flow diagram of the synthesis of ZnO–GO nanocomposites from spent Zn–C batteries is presented in Figure 2.
Figure 2.
A flow diagram of the synthesis of ZnO–GO nanocomposites from spent Zn–C batteries.
2.6. Characterization Methods
The structure and crystallinity of the ZnO NPs, GO, and ZnO–GO nanocomposites were determined by X-ray diffraction (XRD) using a Rigaku MiniFlex 600 instrument with a D/teXUltra 250 high–speed detector and an X-ray tube with a copper anode (Rigaku Corporation, Tokyo, Japan). Measurements were conducted in the 2θ range of 3–90° at a scanning speed of 10°/min under operating conditions of 40 kV and 15 mA. Phase identification was performed using PDXL 2 software version 2.4.2.0, and the obtained diffraction patterns were compared with data from the JCPDS database. Surface morphology and elemental composition were examined by scanning electron microscopy coupled with energy-dispersive X-ray spectroscopy (SEM–EDS) using a Tescan Vega 3 LMU instrument (Tescan, Brno, Czech Republic). FTIR spectra of ZnO samples were obtained on a PerkinElmer Spectrum 3 instrument (PerkinElmer Inc., Waltham, MA, USA) operating in ATR mode, in the range of 400–4000 cm−1. The pH of the solution was determined using a pH 700 meter (Eutech Instruments, Singapore). A UV-Vis spectrometer (Beckman DU-65, Beckman Coulter, IN, USA) was used to measure the residual concentrations of malachite green and to examine the optical properties of ZnO and ZnO–GO nanocomposites. For optical property determination, ZnO NPs and ZnO–GO nanocomposites were dispersed in ethanol (1 mg/mL), subjected to ultrasonic treatment, and analyzed on a UV-Vis spectrometer at wavelengths from 300 to 800 nm.
2.7. Photocatalytic Study
The photocatalytic activity of ZnO NPs and ZnO–GO nanocomposites was evaluated using malachite green as a model organic pollutant. Photocatalytic experiments were carried out in a custom-designed batch photoreactor comprising a laboratory beaker, magnetic stirrer, and UVA light source (λ = 395 nm, 100 W). All measurements were carried out at room temperature. For each experiment, 0.1 g of photocatalyst was added to 30 mL of MG solution with a concentration of 10 ppm (pH = 4.7). The resulting suspension was magnetically stirred at 300 rpm for 60 min in the dark to achieve adsorption–desorption equilibrium [36,37]. The mixture was then exposed to UVA irradiation for 5–90 min under continuous stirring. At the end of the photocatalytic reaction, the suspension was centrifuged at 4000 rpm for 15 min to separate the catalyst particles from the solution. The solution was subsequently analyzed using a UV–Vis spectrophotometer at a wavelength of 617 nm to determine the residual MG concentration. The photocatalytic degradation efficiency (%) was calculated using Equation (4) [38]:
where A0 is the initial absorbance of dye solution, and A is the absorbance of the dye solution after the photocatalytic reaction.
3. Results and Discussion
3.1. XRD
The diffractograms of graphite powder from Zn–C batteries and synthesized GO are shown in Figure 3. The characteristic graphite peaks at 26.4°, 42.4°, 44.4°, 50.1°, 54.5°, 77.4°, and 83.5° are identical to those in the JCPDS database (00–041–1487) and correspond to the (002), (100), (101), (102), (004), (110), and (112) basal planes of graphite, respectively. These results are consistent with those of Radovanović et al. [39], Loudiki et al. [28], Silva et al. [29], and Sperandio et al. [40]. A sharp diffraction peak at 26.4° indicates the highly crystalline hexagonal structure of the graphite powder [28,40]. A small peak at 21.4° may indicate the presence of impurities [28]. In the XRD pattern of GO, a peak at 10.8° was observed, corresponding to the (001) diffraction plane of graphene oxide. No peaks indicating impurities or residual graphite were identified. This confirms the successful oxidation of graphite to graphene oxide, resulting in an increase in d-spacing from 0.33 nm to 0.82 nm due to the intercalation of epoxy, hydroxyl, carboxylic, and carbonyl groups between the graphene layers [29,31,41,42,43,44].
Figure 3.
XRD patterns of graphite powder recovered from waste Zn–C batteries and synthesized GO.
The effect of ZnO calcination temperature on phase purity, crystallinity, and structural parameters was investigated to ensure the selection of pure precursors suitable for further nanocomposite synthesis. Diffractograms of ZnO samples calcined at 400 °C, 500 °C, 600 °C, and 700 °C are shown in Figure S1. In samples calcined at 400 °C and 500 °C, in addition to ZnO, simonkolleite was detected. The presence of simonkolleite in these samples was also confirmed by FTIR analysis (Figure S2). In contrast, the XRD patterns of samples calcined at 600 °C and 700 °C revealed zincite as the only crystalline phase. Since samples calcined at 400 °C and 500 °C contained secondary phases, a detailed analysis of the crystal structure parameters (Table S1) and photocatalytic activity was performed only for the samples calcined at 600 °C and 700 °C. ZnO calcined at 700 °C exhibited enhanced crystallinity and a higher number of oxygen vacancies, which promoted charge separation and improved photocatalytic activity (Figures S3 and S4). Thus, ZnO calcined at 700 °C was chosen for subsequent GO modification.
The diffractograms of ZnO, ZnO–1%GO, ZnO–2.5%GO, and ZnO–5%GO nanocomposites are presented in Figure 4. In the ZnO sample, diffraction peaks were observed at 2θ angles at 31.7°, 34.4°, 36.2°, 47.5°, 56.5°, 62.8°, 66.3°, 67.9°, 69.0°, 72.5°, 76.5°, 81.3°, and 89.6°, corresponding to the (100), (002), (101), (102), (110), (103), (200), (112), (201), (004), (202), (104), and (203) planes of ZnO, respectively [45,46]. The obtained diffractograms are identical to those in the JCPDS database card No. 036–1451. The high intensity and narrow width of the diffraction peaks confirm the hexagonal wurtzite structure of ZnO with the P63mc space group [22,38,47]. The sharp and well-defined peaks in the XRD patterns indicate a high degree of crystallinity in ZnO [22,48].
Figure 4.
Diffractograms of ZnO and ZnO–GO nanocomposites with different GO contents.
In the XRD patterns of ZnO–GO nanocomposites (Figure 4), peaks at 2θ angles of 31.8°, 34.4°, 36.3°, 47.6°, 56.6°, 62.9°, 66.4°, 67.9°, 69.1°, 72.6°, 76.9°, 81.4°, and 89.6° were detected, corresponding to ZnO with a hexagonal wurtzite structure. A slight shift in the diffraction peaks compared to pure ZnO toward higher 2θ angles indicates a reduction in the crystal lattice parameters of the nanocomposites (Table 1) due to the successful interaction between ZnO and GO [49,50]. The characteristic peak of GO was not detected in the nanocomposite, which may be attributed to the high crystallinity of ZnO nanoparticles, the limited stacking of GO sheets in the presence of ZnO, and the low concentration of GO [51,52]. During the synthesis of the nanocomposite, ultrasonic treatment of the GO solution resulted in complete exfoliation of the GO [51,52], allowing the ZnO nanoparticles to fully cover the GO surface and prevent re-stacking of the layers [37,53]. In addition, the intense diffraction peaks of ZnO can mask the diffraction peaks of GO, as only a small amount of GO was used for the synthesis of the nanocomposites [36,42,54,55]. In the diffractograms of ZnO–GO nanocomposites, no peaks indicating the presence of impurities were detected, demonstrating the high purity and crystallinity of the synthesized composites [35]. Structural parameters of ZnO and ZnO–GO nanocomposites are presented in Table 1.
Table 1.
Structural parameters of ZnO nanoparticles and ZnO–GO nanocomposites.
The average crystallite size of ZnO NPs and ZnO–GO nanocomposites was determined using the Debye–Scherrer formula [49]:
where D—crystallite size (nm), k—constant (0.89), λ—wavelength of X-ray radiation (0.154 nm), β—full width at half maximum of the most intense diffraction peak (rad), and θ—Bragg’s angle (°). The average crystallite size of the nanocomposite is smaller than that of pure ZnO (Table 1). As the GO content in the nanocomposite increases, the average crystallite size and the intensity of the (101) peaks slightly decrease. This indicates that GO influences the crystallization process of ZnO [56]. GO can promote the formation of C–O–Zn bonds [49,55] or cause the Zener pinning effect, which may inhibit crystal growth [25].
The crystal lattice parameters (a and c) of the hexagonal wurtzite structure, as well as the unit cell volume (V), were determined using Equations (6)–(8) [38,49]:
The lattice parameters of ZnO–GO nanocomposites are smaller than those of pure ZnO (Table 1). The introduction of GO creates structural defects and increases microstrain, leading to a decrease in the lattice parameters and, consequently, a reduction in the unit cell volume [57].
The dislocation density (δ) and microstrain (ε) were calculated using Equations (9) and (10), respectively [58,59].
The obtained values are shown in Table 1 and indicate that as GO content increases, dislocation density and microstrain also increase. GO inhibits crystal growth, leading to more structural defects, the formation of additional grain boundaries, and consequently higher dislocation density and microstrain (Table 1). This suggests that the presence of GO causes local lattice disorder and strain [57,60].
The length of the Zn–O bond is defined by Equation (11) [58]:
where U represents the positional parameter in the wurtzite structure and can be determined using Equation (12) [58]:
The positional parameter is a measure of the displacement of each atom in the wurtzite structure with respect to the next along the c–axis. Compared to pure ZnO, the bond length in the nanocomposites is greater due to structural changes caused by the introduction of GO (Table 1) [61]. Specifically, distortion in ZnO may cause a shift in Zn atoms toward GO, resulting in increased bond length [62].
The interplanar spacing dhkl was calculated according to Equation (13) [63]:
where h, k, and l represent the Miller indices. The obtained values are shown in Table 1 and indicate that as the content of GO increases, the interplanar spacing decreases. A decrease in d-spacing indicates lattice contraction due to the presence of a large number of defects and oxygen vacancies in the crystal lattice [64].
Atomic packing fraction (APF) was calculated according to Equation (14) and presented in Table 1 [65]:
The atomic packing fraction of the ZnO–GO nanocomposite are lower than those of pure ZnO because GO inhibits the nucleation and growth of crystals through intercalation [37]. Additionally, APF reduction indicates the growth of defects in the crystal structure, the occurrence of dislocations, and oxygen vacancies. Defects introduced by GO reduce the atomic packing density and disrupt the ordering of the crystal structure, resulting in a decrease in the atomic packing fraction in the nanocomposite.
The specific surface area (S) of ZnO NPs and ZnO–GO nanocomposites was determined using Equation (15) [66]:
where ρx is the sample density. The specific surface area of the synthesized samples increased significantly with the incorporation of GO. The surface area of pure ZnO was 40.19 m2/g, while those of ZnO–1%GO, ZnO–2.5%GO, and ZnO–5%GO were 58.62, 60.06, and 62.50 m2/g, respectively. This demonstrates that incorporating graphene oxide markedly increases the specific surface area of the composite material. As the GO content increases, the specific surface area also increases [50,67]. This is attributed to oxygen–containing functional groups on the GO surface, which serve as active adsorption sites. The availability of these sites is expected to promote more efficient interaction with pollutant molecules, thereby facilitating their effective removal [25].
3.2. UV–Vis Spectroscopy
The UV–Vis absorption spectra of ZnO NPs, ZnO–1% GO, ZnO–2.5% GO, and ZnO–5% GO nanocomposites are shown in Figure 5. The maximum absorption of the ZnO spectrum was recorded at 375 nm, indicating that the optical response of ZnO is governed by the transition of electrons from the valence to the conduction band [45,59,68,69]. In the absorption spectra of ZnO–GO nanocomposites, two absorption peaks were observed between 300 and 400 nm. The first peak at 324 nm is attributed to exciton absorption, while the second peak at 377 nm corresponds to the band gap energy of ZnO [47]. Compared to pure ZnO, a moderate red shift in the absorption peaks of the ZnO–GO nanocomposite was observed. This shift is due to the presence of carbon atoms in the composite and the formation of strong chemical bonds between ZnO and GO [54,55].
Figure 5.
UV–Vis absorption spectra of ZnO NPs and ZnO–GO nanocomposites in ethanol.
The Tauc plot is commonly used to estimate the optical band gap of ZnO NPs and ZnO–GO nanocomposites [26]. Tauc plots were constructed from the absorption data according to the following relation and are presented in Figure 6 [68]:
where α—absorption coefficient, hv—photon energy, A—constant, and Eg—optical band gap [68]. The band gap for the synthesized ZnO was 3.00 eV, consistent with literature data [18,70,71]. However, for ZnO–GO nanocomposites, a gradual decrease in the band gap with increasing GO content was observed. The band gaps of ZnO–1%GO, ZnO–2.5%GO, and ZnO–5%GO were 2.88 eV, 2.81 eV, and 2.75 eV, respectively. A similar trend of band gap reduction with increasing GO content has been reported by other authors [54,55,59]. Due to its high electron affinity and delocalized π–electron system, GO in the nanocomposites acts as an electron acceptor, while ZnO serves as an electron donor. Excited electrons migrate from the conduction band of ZnO to the GO layer via the π electrons present in the carbon atoms. This process leads to a shift in the Fermi level towards the valence band and an effective narrowing of the energy gap [26,54,72]. Reducing the energy gap of ZnO–GO nanocomposites compared to pure ZnO increases their ability to absorb visible light [26]. Furthermore, the presence of graphene oxide can reduce the recombination of the h+/e− pair in ZnO–GO nanocomposites, leading to improved light absorption in the UV and visible regions of the spectrum, as confirmed by the results shown in Figure 5. This effect renders ZnO–GO nanocomposites significantly more efficient photocatalysts with a wide range of applications [18,26,55].
Figure 6.
Tauc plots of (a) ZnO NPs, (b) ZnO–1%GO, (c) ZnO–2.5%GO and (d) ZnO–5%GO nanocomposites.
3.3. SEM–EDS
The morphology of ZnO NPs and ZnO–GO nanocomposites was examined using a scanning electron microscope, and the results are presented in Figure 7. The SEM image of pure ZnO (Figure 7a) shows the formation of spherical and irregularly shaped particles. Agglomerates ranging from 100 nm to 10 μm were also observed. The formation of these agglomerates results from the calcination of the sample at high temperatures [73].
Figure 7.
SEM images of (a) ZnO, (b) ZnO–1%GO, (c) ZnO–2.5%GO, and (d) ZnO–5%GO.
In the SEM photographs of the composite (Figure 7b–d), pure GO sheets are not visible, both because of the small amount of GO used in the synthesis of the nanocomposite and because the ZnO nanoparticles completely cover the GO surface. This indicates good interaction between the ZnO and GO in all prepared composites [36,49,50]. According to the results presented in Figure 7, increasing the content of GO does not affect the morphology of ZnO nanoparticles [49,50], but it can effectively prevent their agglomeration due to the interaction of ZnO nanoparticles with residual functional groups on the basal planes of GO. This interaction increases the available surface area for adsorption and photocatalytic reactions [50].
The results of the EDS analysis are shown in Figure 8. In the spectrum of pure ZnO (Figure 8a), peaks for zinc and oxygen are observed, with no signals from other elements, confirming that the synthesized ZnO is of high purity. Characteristic peaks for zinc, oxygen, and carbon are observed in all spectra of the nanocomposites, confirming the successful synthesis of ZnO–GO nanocomposites with different GO contents (Figure 8b–d). The absence of additional peaks indicates that no impurities are present.
Figure 8.
EDS spectra of (a) ZnO, (b) ZnO–1%GO, (c) ZnO–2.5%GO, and (d) ZnO–5%GO.
3.4. Photocatalytic Activity
The photocatalytic activity of ZnO NPs and ZnO–GO nanocomposites was evaluated based on the efficiency of the photocatalytic decomposition of malachite green under UVA radiation. The efficiency of photocatalytic degradation of malachite green in the presence of ZnO NPs, ZnO–1%GO, ZnO–2.5%GO, and ZnO–5%GO nanocomposites was monitored for 90 min and is shown in Figure 9a. The results indicate that the tested photocatalysts exhibit photocatalytic activity for malachite green degradation and the efficiency of MG degradation increases with longer UVA exposure. The decomposition of MG in the presence of ZnO NPs reaches 96.25% after 90 min, while in the presence of the ZnO–1%GO nanocomposite, a nearly identical photocatalytic degradation efficiency of 95.35% is achieved in only 30 min. As the GO content in the nanocomposite increases, the efficiency of MG photocatalytic degradation rises to 97.27% and 99.6% for ZnO–2.5%GO and ZnO–5%GO, respectively.
Figure 9.
(a) The effect of GO content on the efficiency of photocatalytic degradation of malachite green; (b) kinetic analysis of photocatalytic degradation of malachite green using ZnO NPs and ZnO–GO nanocomposites.
The higher photocatalytic activity of the ZnO–GO nanocomposite compared to pure ZnO can be attributed to reduced recombination of electron–hole pairs, which leads to the generation of more hydroxyl radicals and increases the efficiency of photocatalytic degradation [25,26,54,74]. Additionally, the higher photocatalytic activity of the nanocomposite compared to ZnO can be attributed to better adsorption of the dye on the catalyst surface, resulting from the larger specific surface area of the nanocomposite, the presence of oxygen functional groups (–OH, –COOH, and –C=O), and the ability of GO to form π–π interactions with the dye [22,25,26].
The content of GO in the nanocomposite has a significant effect on the photocatalytic activity of the composite. Increasing the GO content up to 5 wt% increases the efficiency of photocatalytic degradation of MG (Figure 9a). As the content of GO in the composite increases, the specific surface area increases, leading to a greater number of active centers on the catalyst surface and improved photocatalytic activity [50]. Also, as the GO content in the nanocomposites increased, the crystallite size decreased (Table 1), resulting in higher efficiency of the photocatalytic decomposition of malachite green [23].
Considering that the ZnO–GO nanocomposites achieve almost complete MG degradation within 40 min (Figure 9a), the photocatalytic degradation kinetics in their presence were monitored for 40 min, whereas the degradation kinetics in the presence of ZnO NPs were followed for 90 min. Using the pseudo-first-order kinetic model based on the Langmuir–Hinshelwood mechanism, the kinetics of the photocatalytic decomposition of malachite green was examined according to Equation (17) [23,75,76]:
where C is the concentration of MG at time t, C0 is the initial concentration of MG, and k1 is the pseudo-first order-kinetic constant [23]. The kinetic profiles of malachite green photocatalytic degradation in the presence of ZnO and ZnO–GO nanocomposites are shown in Figure 9b. The obtained linear relationships and high correlation coefficients (Table 2) confirm that malachite green decomposition follows a pseudo-first-order kinetics model. The reaction rate constant is determined from the slope according to Equation (17) [75], while the half-life time (t1/2) can be determined according to Equation (18) [77]:
Table 2.
Kinetic parameters for the photocatalytic degradation of malachite green using ZnO NPs and ZnO–GO nanocomposites.
The obtained values for the half-life time and the reaction rate constant are presented in Table 2. As the content of GO in the nanocomposite increases, the reaction rate constant rises, while half-life time decreases. Increasing the content of GO up to 5 wt% can enhance the decomposition rate of malachite green by up to five times. These results clearly demonstrate that the presence of GO in nanocomposites can significantly accelerate the photocatalytic degradation of malachite green.
The mechanism of the photocatalytic decomposition of malachite green is presented by reactions (19–24) [1,77,78]. Upon exposure to UV light, ZnO absorbs photons, exciting electrons from the valence band to the conduction band and leaving behind positively charged holes in the valence band [26,77]. As the energy levels of ZnO and the π* orbitals of GO are aligned, electrons from the conduction band of ZnO are transferred to the surface of GO through π–π* interactions, preventing the recombination of h+/e− pairs [26,77]. Efficient separation of photogenerated pairs results in more electrons participating in the degradation reaction [1,25]. Electrons reduce oxygen molecules to form superoxide species, which then react with water molecules to generate hydroxyl radicals [26,77]. Positively charged holes can oxidize water molecules, producing hydroxyl radicals [26]. Formed reactive oxygen species can decompose MG into CO2 and H2O. Mostafa and Amdeha [1] point out that •OH and •O2− significantly contribute to the photocatalytic degradation of malachite green, while h+ has a limited role in the photodegradation of MG.
Table 3 presents a comparative analysis of the photocatalytic activity of ZnO–5%GO synthesized from Zn–C batteries and ZnO–GO nanocomposites synthesized from chemical precursors. Additionally, Table 4 compares the photocatalytic activity of the ZnO–5%GO nanocomposite with various photocatalysts used for malachite green degradation.
Table 3.
Comparative analysis of the photocatalytic efficiency of ZnO–GO nanocomposites synthesized from different precursors.
Table 4.
Comparative analysis of the photocatalytic performance of various photocatalysts for the degradation of malachite green.
The comparative analyses of photocatalytic activity presented in Table 3 and Table 4 indicate that ZnO–5%GO exhibits photocatalytic activity, supporting the reuse of zinc and graphite from waste Zn–C batteries as precursors for synthesizing ZnO–GO nanocomposites and their application in wastewater treatment. The presented study aligns with the principles of sustainable development and the circular economy, as this approach contributes to waste reduction, environmental preservation, and the conservation of Zn and C resources.
3.5. Statistical Analysis and Process Optimization
Response Surface Methodology (RSM) is a statistical approach that connects experimental data with mathematical models to estimate the influence of multiple factors on the desired response. Unlike traditional experimental techniques, which examine only one factor while keeping other process parameters constant, RSM enables the simultaneous analysis of several parameters. This reduces the number of experiments required, saves time, and decreases the amount of chemicals used in experimental research [75]. Among the available experimental designs, the Box–Behnken design has been frequently applied in recent years to optimize photocatalytic processes, as it has shown good agreement with experimental values and high predictive reliability [86,87].
RSM based on the Box–Behnken Design (BBD) was employed to evaluate the effects of graphene oxide content (%GO), initial concentration of MG (C0), irradiation time (t), and catalyst dosage (m) on the photocatalytic degradation efficiency of malachite green (E). Four independent variables were studied at three levels, low (−1), medium (0), and high (+1), as presented in Table 5. Using trial version of the Design–Expert software 13 (StatEase Inc., MN, USA), a Box–Behnken matrix was created (Table 6). A total of 29 experimental runs were generated in randomized order to minimize systematic error. The center points were replicated multiple times to provide a reliable estimation of the pure error, and to assess the reproducibility of the measured responses. Experimentally achieved efficiencies ranged from 82.68% to 99.40% (Table 6).
Table 5.
Experimental factors and range levels in the experimental design.
Table 6.
Box–Behnken matrix with experimental photocatalytic degradation efficiencies of malachite green.
3.5.1. Model Selection
The experimentally obtained data were analyzed using Response Surface Methodology to select the model that best represents the relationship between the analyzed parameters and the efficiency of photocatalytic degradation of malachite green. Linear, two-factor interaction (2FI), quadratic, and cubic models were tested. The results of the analysis of variance (ANOVA), presented in Table 7, show that the linear model has the highest statistical significance, and good predictive ability. The inclusion of interaction and quadratic terms did not significantly improve model performance. Consequently, the linear model was selected as the most appropriate to describe the effects of the investigated parameters on the efficiency of photocatalytic degradation.
Table 7.
Statistical evaluation of the adequacy of various RSM models.
Based on the applied linear model, the dependence of the efficiency of the photocatalytic decomposition of malachite green on the examined factors is represented by the following regression equation:
Positive signs for independent factors such as GO content, catalyst dosage, and UV irradiation time indicate a positive effect on the response, while the initial MG concentration has an antagonistic impact on the efficiency of MG photocatalytic degradation [88,89].
A graphical comparison of experimentally obtained and model-predicted photocatalytic degradation efficiencies of MG is shown in Figure 10a. All points lie along the regression line, indicating minimal differences between experimental and model-predicted values [75]. The normal probability plot (Figure 10b) shows that the residual values are close to the reference line, indicating the model’s accuracy in explaining the relationship between the independent variables and the response [55]. The residuals versus run number plot (Figure 10c) shows a random scatter of residuals near zero (±3.54581) with no apparent trend or periodicity [88]. These results indicate the absence of systematic errors, confirming that the developed mathematical model is statistically valid and reliable for describing the process.
Figure 10.
(a) Comparison of experimental and predicted degradation efficiencies of MG; (b) normal probability plot of the residuals; (c) residuals versus run number.
3.5.2. Analysis of Variance (ANOVA) and Model Validation
Statistical analysis of variance (ANOVA) was used to assess the significance of the developed model and individual factors. The results of the analysis of variance are presented in Table 8. The statistical significance of the model and the examined factors was evaluated using the F-value and p-value. The higher the F-value is above 1, the more accurately the estimated effects of the examined factors explain the data variations compared to the mean value. p-values less than 0.05 indicate a high level of statistical significance for the regression model at the 95% confidence level, with a lower p-value indicating greater model significance [90]. As the p-value is less than 0.0001 and the F-value is 30.8, the model is highly significant. Furthermore, the analysis of variance showed that all investigated parameters have a statistically significant effect on the efficiency of the photocatalytic decomposition of malachite green (p < 0.05). Based on the F-value, it can be concluded that the catalyst dosage (45.77) and content of GO (42.83) have the greatest influence on the decomposition of malachite green, while the influence of the initial concentration of malachite green (19.56) and the irradiation time (15.04) is slightly smaller but still significant.
Table 8.
Analysis of variance (ANOVA) for the selected linear model.
Model validation is a key step in assessing a model’s ability to predict new data based on the training dataset. Several relevant parameters were considered for model validation, including the coefficient of determination (R2), adjusted R2, predictive R2, adequate precision, and coefficient of variation (C.V.) (Table 9) [75]. The coefficient of determination should be greater than 0.8 and as close to 1 as possible. The obtained coefficient of determination value of 0.837 indicates good predictability and suitability of the model [89,91]. The robustness of the model was further confirmed by comparing the predictive R2 and adjusted R2 (Table 9). Their difference was less than the recommended 0.2, indicating the significance of the model and satisfactory predictive ability [4,89]. Adequate precision of the model is 18.51, which significantly exceeds the threshold value of 4, indicating its applicability and suitability [55,75]. Based on the coefficient of variation, the reproducibility of the results and the implications of the model can be evaluated. The desirable range for the coefficient of variation is 0.5% to 13.5% [92]. The obtained coefficient of variation of 2.2% is optimal and confirms the high precision and repeatability of the experimental data.
Table 9.
Statistical parameters for the proposed linear model based on ANOVA.
3.5.3. Influence of Individual Factors on the Efficiency of Photocatalytic Degradation of MG
Understanding the influence of individual factors is essential for optimizing the photocatalytic degradation of malachite green. Figure 11 shows the effects of GO content, initial malachite green concentration, catalyst dosage, and irradiation time on the efficiency of the photocatalytic decomposition of malachite green. Increasing the GO content, catalyst dosage, and irradiation time significantly improved the efficiency of the photocatalytic decomposition of malachite green. However, increasing the initial concentration of malachite green negatively affected the efficiency of photocatalytic degradation.
Figure 11.
Influence of individual factors on efficiency of photocatalytic degradation of MG.
Optimizing the combination of GO content, catalyst dosage, irradiation time, and initial MG concentration can significantly increase photocatalytic efficiency. Using Design–Expert software and numerical optimization identified the following optimal parameters: GO content of 5 wt%, initial malachite green concentration (C0) of 10 ppm, irradiation time (t) of 20 min, and catalyst dosage (m) of 0.1 g.
3.6. Stability and Reusability Test
The stability and reusability of the ZnO–5%GO nanocomposite are important criteria for its practical application and the economic viability of the synthesis process. To assess the stability and reusability of the synthesized nanocomposite, a series of experiments on the photocatalytic decomposition of malachite green were conducted under optimal conditions over five consecutive cycles. After each cycle, the nanocomposite was washed with ethanol, then dried and reused in the next cycle under the same experimental conditions. The results, shown in Figure 12, indicate that after five cycles, there is a slight decrease in the efficiency of photocatalytic malachite green decomposition of 6.32%. This trend may indicate the accumulation of intermediates after the photocatalytic degradation of malachite green, which block the active sites on the photocatalyst [1,24,48], or the reduction in photocatalyst mass that occurs during separation and washing between cycles [74,93]. However, after five consecutive cycles, the photocatalyst retained a significant percentage of activity (92.19%), confirming its stability and potential for practical application in wastewater treatment. These results can be attributed to the chemical stability of the ZnO–5%GO nanocomposite and its excellent photoelectric performance [37]. The stability of the ZnO–5%GO nanocomposite can be ascribed to the synergistic effect of ZnO with GO, which not only enhances the photocatalytic activity of ZnO but also improves the mechanical stability and the long-term durability of catalyst [25,94]. In addition, GO prevents the agglomeration of ZnO NPs, thereby avoiding activity reduction and loss of efficacy during repeated use [94].
Figure 12.
Reusability of ZnO–5%GO nanocomposites for photocatalytic degradation of MG.
3.7. Energy Consumption Analysis
The energy consumption analysis was conducted to evaluate the energy efficiency and sustainability of the ZnO–GO nanocomposite synthesis process. Electricity consumption (E) represents the electricity required by the device during the usage period and can be determined according to Equation (26) [95]:
where P is active power of the device, and t is the usage period.
Table 10 summarizes the energy consumption of each device and the total energy consumption during the synthesis of ZnO, GO, and ZnO–GO nanocomposites. ZnO synthesis is the most energy-intensive, as it requires both a laboratory furnace and a drying oven. Thermal treatment is the most energy-intensive step in the synthesis. However, the total energy consumption for the conventional synthesis method using chemical precursors would be higher, because dissolving the precursor typically requires additional heating of the reaction mixture, whereas dissolving Zn anodes does not require additional thermal treatment. The synthesis of GO and ZnO–GO nanocomposites are less energy-intensive process.
Table 10.
Energy consumption analysis of ZnO–GO nanocomposite synthesis.
The highest energy consumption per mass of product was recorded for GO, because only a small amount of product was synthesized to reduce chemical use and waste generation. ZnO–GO had the lowest energy consumption per product mass, at only 0.36 kWh.
4. Conclusions
This study presents a detailed characterization and comprehensive analysis of the photocatalytic performance of ZnO–GO nanocomposites for the degradation of malachite green. A sustainable synthesis method for ZnO–GO nanocomposites from waste Zn–C batteries at room temperature was proposed. The results confirm the successful synthesis of the ZnO–GO nanocomposite, demonstrating the significant potential of using secondary raw materials, particularly waste Zn–C batteries, as precursors for photocatalyst synthesis.
The effect of GO content on the optical, structural, morphological, and photocatalytic properties of nanocomposites was investigated. The results show that increasing the GO content in the nanocomposites up to 5 wt% improves optical properties, reduces particle size and agglomeration tendency, increases specific surface area, and enhances photocatalytic activity.
Response Surface Methodology was used to investigate the effects of GO content, catalyst dosage, initial MG concentration, and irradiation time on the efficiency of photocatalytic degradation of malachite green. Analysis of variance indicates that all tested parameters significantly affected the efficiency of MG degradation, with GO content and catalyst dosage having the greatest effects. Numerical optimization determined the following optimal conditions: GO content of 5 wt%, catalyst dosage of 0.1 g, initial MG concentration of 10 ppm, and irradiation time of 20 min. Under optimal conditions, the photocatalytic degradation efficiency of MG was 98.51%. After five reuse cycles, it remained at 92.19%, demonstrating the excellent stability and reusability of the ZnO–GO nanocomposite. In this study, the synthesis and photocatalytic measurements were conducted on a laboratory scale, and the scalability of the process was not assessed.
In line with the zero-waste concept, future research will focus on fully valorizing all battery components, including the electrolyte, to synthesize composites with improved performance and broader application potential in wastewater treatment and environmental protection.
Supplementary Materials
The following supporting information can be downloaded at: https://www.mdpi.com/article/10.3390/met16010071/s1, Figure S1: XRD diffractograms of ZnO samples calcined at different temperatures; Figure S2: FTIR spectra of ZnO samples calcined at different temperatures; Figure S3: Effect of ZnO calcination temperature on the efficiency of photocatalytic decomposition of malachite green. Figure S4: Kinetic analysis of the photocatalytic degradation of MG using ZnO calcined at 600 °C and 700 °C. Table S1: Structural parameters of ZnO calcined at 600 °C and 700 °C. References [38,39,45,48,63,64,73,96,97,98,99,100,101,102,103,104,105,106,107,108,109,110,111,112,113,114] are cited in the Supplementary Materials.
Author Contributions
Conceptualization, S.S., M.R. and S.M.; methodology, S.S.; Validation, M.R., S.Đ., S.M. and B.M.; formal analysis, S.S.; Investigation S.S., S.Đ. and B.M.; writing—original draft preparation, S.S.; writing—review and editing, S.S., M.R., V.N., B.M., S.M., S.Đ. and M.A.; visualization, S.S., M.R. and V.N.; supervision, M.A. and M.R. All authors have read and agreed to the published version of the manuscript.
Funding
The research presented in this paper was conducted with the financial support of the Ministry of Science, Technological Development, and Innovations of the Republic of Serbia, within the funding of the scientific research work at the University of Belgrade, Technical Faculty in Bor (contract number 451-03-137/2025-03/200131).
Data Availability Statement
The original contributions presented in this study are included in the article/Supplementary Materials. Further inquiries can be directed to the corresponding author.
Conflicts of Interest
The authors declare no conflicts of interest.
Abbreviations
The following abbreviations are used in this manuscript:
| GO | Graphene oxide |
| NPs | Nanoparticles |
| MG | Malachite green |
| XRD | X-ray diffraction |
| SEM | Scanning Electron Microscopy |
| EDS | Energy-Dispersive X-ray Spectroscopy |
| FTIR | Fourier Transform Infrared Spectroscopy |
| RSM | Response Surface Methodology |
| BBD | Box–Behnken Design |
| JCPDS | Joint Committee on Powder Diffraction Standards |
| APF | Atomic packing fraction |
| ANOVA | Analysis of variance |
| MMnS(60) | Mesoporous manganese silicate |
| CDC | Ca-doped ceria |
| TiO2/COF | Titanium dioxide/covalent organic framework |
| FVZ3 | Iron vanadium oxide-zinc oxide |
| BC@Co-MOF | Bacterial cellulose-supported cobalt-based metal−organic frameworks |
| Fe@(Alg-CMC) | Fe(III) ion cross-linked alginate-carboxymethyl cellulose composite beads |
| RGO/TiO2/PANCMA NFs | Reduced graphene oxide/TiO2/poly(acrylonitrile–co–maleic acid) composite nanofibers |
| CZnO–dots | ZnO/carbon dots |
| ZnO–EG | ZnO/exfoliated graphite |
References
- Mostafa, E.M.; Amdeha, E. Enhanced photocatalytic degradation of malachite green dye by highly stable visible-light-responsive Fe-based tri-composite photocatalysts. Environ. Sci. Pollut. Res. Int. 2022, 29, 69861–69874. [Google Scholar] [CrossRef] [Scilit] [PubMed]
- Karadeniz, D.; Kahya, N.; Erim, F.B. Effective photocatalytic degradation of malachitegreen dye by Fe(III)-Cross-linked Alginate-Carboxymethyl cellulose composites. J. Photochem. Photobiol. A Chem. 2022, 428, 113867. [Google Scholar] [CrossRef] [Scilit]
- Abubakar, H.L.; Tijani, J.O.; Abdulkareem, A.S.; Egbosiuba, T.C.; Abdullahi, M.; Mustapha, S.; Ajiboye, E.A. Effective removal of malachite green from local dyeing wastewater using zinc-tungstate based materials. Heliyon 2023, 9, e19167. [Google Scholar] [CrossRef] [Scilit] [PubMed]
- Shukla, B.K.; Rawat, S.; Gautam, M.K.; Bhandari, H.; Garg, S.; Singh, J. Photocatalytic Degradation of Orange G Dye by Using Bismuth Molybdate: Photocatalysis Optimization and Modeling via Definitive Screening Designs. Molecules 2022, 27, 2309. [Google Scholar] [CrossRef] [Scilit]
- Wang, S.; Chen, Z.; Zhao, Y.; Sun, C.; Li, J. High photocatalytic activity over starfish-like La-dopedZnO/SiO photocatalyst for malachite green degradationunder visible light. J. Rare Earths 2021, 39, 772–780. [Google Scholar] [CrossRef] [Scilit]
- Daoudi, C.; Hamidi, F.; Saidi-Bendahou, K.; Chelihi, A.; Karon, K.; Cherif, C.Z. Application of mesoporous materials doped with magnesium for the photocatalytic degradation of malachite green under UV and solar irradiation. J. Indian Chem. Soc. 2025, 102, 102012. [Google Scholar] [CrossRef] [Scilit]
- Balram, D.; Lian, K.-Y.; Sebastian, N.; Aiswarya, N.H.; Alharthi, S.S.; Al-Saidi, H.M. Tracing genotoxic malachite green contamination in aquatic environment using α-Co2V2O7/PAH-CNTs-based electrochemical sensor. J. Environ. Chem. Eng. 2025, 13, 119300. [Google Scholar] [CrossRef] [Scilit]
- Reyes-Màrquez, V.; Chiñas Rojas, L.E.; Colorado-Peralta, R.; Peña-Rodríguez, R.; Rivera-Villanueva, J.M.; Morales-Morales, D. Adsorption potential of polymeric porous crystalline materials (MOFs) for the removal of Indigo carmine, Congo red, and Malachite green from water. Inorg. Chim. Acta 2023, 558, 121743. [Google Scholar] [CrossRef] [Scilit]
- Chowdhury, R.; Borgohain, X.; Iraqui, S.; Rashid, M.H. Carboxymethyl cellulose assisted morphology controlled synthesis of Mn3O4 nanostructures for adsorptive removal of malachite green from water. Int. J. Biol. Macromol. 2024, 282, 136838. [Google Scholar] [CrossRef] [Scilit]
- Harzali, H.; Azizi, M. Investigating the adsorption of Malachite green and Methyl green onto synthesized Ni0.5Zn0.5Fe2O4 spinel ferrites. J. Environ. Chem. Eng. 2024, 12, 113413. [Google Scholar] [CrossRef] [Scilit]
- Moumeni, O.; Hamdaoui, O. Intensification of sonochemical degradation of malachite green by bromide ions. Ultrason. Sonochem. 2012, 19, 404–409. [Google Scholar] [CrossRef] [Scilit]
- Moumeni, O.; Hamdaoui, O.; Pétrier, C. Sonochemical degradation of malachite green in water. Chem. Eng. Process. 2012, 62, 47–53. [Google Scholar] [CrossRef] [Scilit]
- Iqbal, A.; Cevik, E.; Bozkurt, A.; Asiri, S.M.M.; Alagha, O.; Qahtan, T.F.; Jalees, M.I.; Farooq, M.U. Ultrahigh adsorption by regenerable iron-cobalt core-shell nanospheres and their synergetic effect on nanohybrid membranes for removal of malachite green dye. J. Environ. Chem. Eng. 2022, 10, 107968. [Google Scholar] [CrossRef] [Scilit]
- Himanshu; Bereha, B.; Kumari, N.; Maruthi, M.; Singh, R.K.; Saini, J.K. Appraisal of malachite green biodegradation and detoxification potential of laccase from Trametes cubensis. Bioresour. Technol. 2025, 417, 131869. [Google Scholar] [CrossRef] [Scilit] [PubMed]
- Du, L.N.; Zhao, M.; Li, G.; Xu, F.C.; Chen, W.H.; Zhao, Y.H. Biodegradation of malachite green by Micrococcus sp. strain BD15: Biodegradation pathway and enzyme analysis. Int. Biodeterior. Biodegrad. 2013, 78, 108–116. [Google Scholar] [CrossRef] [Scilit]
- Lv, G.-Y.; Cheng, J.-H.; Chen, X.-Y.; Zhang, Z.-F.; Fan, L.-F. Biological decolorization of malachite green by Deinococcus radiodurans R1. Bioresour. Technol. 2013, 144, 275–280. [Google Scholar] [CrossRef] [Scilit]
- Al-Tohamy, R.; Ali, S.S.; Li, F.; Okasha, K.M.; Mahmoud, Y.A.-G.; Elsamahy, T.; Jiao, H.; Fu, Y.; Sun, J. A critical review on the treatment of dye-containing wastewater: Ecotoxicological and health concerns of textile dyes and possible remediation approaches for environmental safety. Ecotoxicol. Environ. Saf. 2022, 231, 113160. [Google Scholar] [CrossRef] [Scilit]
- Sumantrao, S.K.; Kariyajjanavar, P.; Vidayasagar, C.C.; Shridhar, A.H.; Ghagane, S.C.; Chigari, S.S.; Bonageri, G.; Ansari, M.Z.; Alsubaie, A.S. Sunlight-driven GO/ZnO nanocomposite for photocatalytic degradation of Chlorpyrifos insecticide and its biological activities. J. Environ. Chem. Eng. 2025, 13, 115437. [Google Scholar] [CrossRef] [Scilit]
- Bragta, D.; Garg, P.; Chaudhary, S.; Madhok, G.; Negi, S.; Panwar, S.; Singh, A.; Kumar, R. Eco-friendly biosynthesis of ZnO nanoparticles using fungus Schizophyllum commune and their hybrid with chitosan for enhanced UV-A photocatalytic degradation of tetracycline. Chemosphere 2025, 387, 144666. [Google Scholar] [CrossRef] [Scilit]
- Ahmed, S.; Rasul, M.G.; Martens, W.N.; Brown, R.; Hashib, M.A. Heterogeneous photocatalytic degradation of phenols in wastewater: A review on current status and developments. Desalination 2010, 261, 3–18. [Google Scholar] [CrossRef] [Scilit]
- Shaba, E.Y.; Jacob, J.O.; Tijani, J.O.; Suleiman, M.A.T. A critical review of synthesis parameters affecting the properties of zinc oxide nanoparticle and its application in wastewater treatment. Appl. Water Sci. 2021, 11, 48. [Google Scholar] [CrossRef] [Scilit]
- Al-Rawashed, N.A.F.; Allabadi, O.; Aljarrah, M.T. Photocatalytic Activity of Graphene Oxide/Zinc Oxide Nanocomposites with Embedded Metal Nanoparticles for the Degradation of Organic Dyes. ACS Omega 2020, 5, 28046–82055. [Google Scholar] [CrossRef] [Scilit] [PubMed]
- Alcaraz, L.; García-Díaz, I.; González, L.; Rabanal, M.E.; Urbieta, A.; Fernández, P.; López, F.A. New photocatalytic materials obtained from the recycling of alkaline and Zn/C spent batteries. J. Mater. Res. Technol. 2019, 8, 2809–2818. [Google Scholar] [CrossRef] [Scilit]
- Al-Zahrani, S.A.; Umar, K.; Tweib, S.A.; Rashd, J.A.M.; Afridi, S.K.; Bhawani, S.A.; Otaibi, A.A.; Masood, N.; Mansour, D.; Khan, A.; et al. Biomass Mediated Synthesis of ZnO and ZnO/GO for the Decolorization of Methylene Blue Under Visible Light Source. Catalysts 2023, 13, 409. [Google Scholar] [CrossRef] [Scilit]
- Afridi, S.K.; Umar, K. A novel bio-facilitated synthesis of GO/ZnO/Ag nanocomposite via Citrulline Lanatus and OPEFB for enhanced photocatalytic degradation of imidacloprid: Kinetics, mechanism and byproduct analysis. JWPE 2025, 72, 107603. [Google Scholar] [CrossRef] [Scilit]
- Rathod, P.P.; Bhosle, V.K.; Ubale, A.U.; Khan, Z.S. Ultrasonically synthesized ZnO-GO nanocomposite for photocatalytic and antibacterial applications. Compos. Commun. 2025, 57, 102457. [Google Scholar] [CrossRef] [Scilit]
- Ding, Y.; Qin, W.; Zhu, H.; Dai, Y.; Hong, X.; Han, S.; Xie, Y. Construction of ZnO/r-GO Composite Photocatalyst for Improved Photodegradation of Organic Pollutants. Molecules 2025, 30, 1008. [Google Scholar] [CrossRef] [Scilit]
- Loudiki, A.; Matrouf, M.; Azriouil, M.; Laghrib, F.; Farahi, A.; Bakasse, M.; Lahrich, S.; El Mhammedi, M.A. Graphene oxide synthesized from zinc-carbon battery waste using a new oxidation process assisted sonication: Electrochemical properties. Mater. Chem. Phys. 2022, 275, 125308. [Google Scholar] [CrossRef] [Scilit]
- Silva, R.M.; Sperandio, G.H.; da Silva, A.D.; Okumura, L.L.; da Silva, R.C.; Moreira, R.P.L.; Silva, T.A. Electrochemically reduced graphene oxide films from Zn-C battery waste for the electrochemical determination of paracetamol and hydroquinone. Mikrochim. Acta 2023, 190, 273. [Google Scholar] [CrossRef] [Scilit]
- Hummer, W.S.; Offerman, R.E. Preparation of Graphitic Oxide. J. Am. Chem. Soc. 1958, 80, 1339. [Google Scholar] [CrossRef] [Scilit]
- Ribeiro, A.C.; Piske, B.E.; Wiggers, V.R.; Neica, E.G.C. Exploring Hummers Approach for Graphene Oxide Synthesis and Industrial Viability. IJCEA 2024, 15, 1–5. [Google Scholar] [CrossRef] [Scilit]
- Mohsenipour, M.; Shahid, S.; Ebrahimi, K. Removal Techniques of Nitrate from Water: A Review. Asian J. Chem. 2014, 26, 7881–7886. [Google Scholar] [CrossRef] [Scilit]
- Chen, J.; Yao, B.; Li, C.; Shi, G. An improved Hummers method for eco-friendly synthesis of graphene oxide. Carbon 2013, 64, 225–229. [Google Scholar] [CrossRef] [Scilit]
- Nath, M.R.; Ahmed, A.N.; Gafur, M.A.; Miah, M.Y.; Bhattacharjee, S. ZnO nanoparticles preparation from spent zinc-carbon dry cell batteries: Studies on structural, morphological and optical properties. J. Asian Ceram. Soc. 2018, 6, 262–270. [Google Scholar] [CrossRef] [Scilit]
- Bharadwaj, P.; Kiran, G.R.; Acharyya, S.G. Remarkable performance of GO/ZnO nanocomposites under optimized parameters for remediation of Cd (II) from water. Appl. Surf. Sci. 2023, 626, 157238. [Google Scholar] [CrossRef] [Scilit]
- Mirikaram, N.; Pérez-Molina, Á.; Morales-Torres, S.; Salemi, A.; Maldonado-Hódar, F.J.; Pastrana-Martínez, L.M. Photocatalytic Perfomance of ZnO-Graphene Oxide Composites towards the Degradation of Vanillic Acid Under Solar Radiation and visible-LED. Nanomaterials 2021, 11, 1576. [Google Scholar] [CrossRef] [Scilit] [PubMed]
- Lin, Y.; Hong, R.; Chen, H.; Zhang, D.; Xu, J. Green Synthesis of ZnO-GO Composites for the Photocatalytic Degradation of Methylene Blue. J. Nanomater. 2020, 2020, 4147357. [Google Scholar] [CrossRef] [Scilit]
- Nguyen, N.T.; Nguyen, V.A. Synthesis, Characterization, and Photocatalytic Activity of ZnO Nanomaterials Prepared by a Green, Nonchemical Rout. J. Nanomater. 2020, 2020, 1768371. [Google Scholar] [CrossRef] [Scilit]
- Radovanović, M.B.; Simonović, A.T.; Petrović Mihajlović, M.B.; Tasić, Ž.Z.; Antonijević, M.M. Application of Graphite Electrodes Prepared from Waste Zinc−Carbon Batteries for Electrochemical Detection of Xanthine. Chemosensors 2025, 13, 282. [Google Scholar] [CrossRef] [Scilit]
- Sperandio, G.; Junior, I.M.; Bernardo, E.; Moreira, R. Graphene Oxide from Graphite of Spent Batteries as Support of Nanocatalysts for Fuel Hydrogen Production. Processes 2023, 11, 3250. [Google Scholar] [CrossRef] [Scilit]
- Jagiełło, J.; Chlanda, A.; Baran, M.; Gwiazda, M.; Lipińska, L. Synthesis and Characterization of Graphene Oxide and Reduced Graphene Oxide Composites with Inorganic Nanoparticles for Biomedical Applications. Nanomaterials 2020, 10, 1846. [Google Scholar] [CrossRef] [Scilit] [PubMed]
- Ebrahimi Naghani, M.; Negabi, M.; Zadsar, M.; Ahangar, H.A. Synthesis and characterization of linear/nonlinear optical properties of graphene oxide and reduced graphene oxide-based zinc oxide nanocomposite. Sci. Rep. 2023, 13, 1496. [Google Scholar] [CrossRef] [Scilit] [PubMed]
- Chauhan, H.A.; Rafatullah, M.; Ali, K.A.; Umar, M.F.; Khan, M.A.; Jeon, B.-H. Photocatalytic activity of graphene oxide/zinc oxide nanocomposite derived from rice husk for the degradation of phenanthrene under ultraviolet-visible light. JWPE 2022, 47, 102714. [Google Scholar] [CrossRef] [Scilit]
- Silva, W.C.H.; Zafar, M.A.; Allende, S.; Jacob, M.V.; Tuladhar, R. Sustainable Synthesis of Graphene Oxide from Waste Sources: A Comprehensive Review of Methods and Applications. Mater. Circ. Econ. 2024, 6, 23. [Google Scholar] [CrossRef] [Scilit]
- Rawat, S.; Singh, J. Synthesis of nZnO from waste batteries by hydrometallurgical method for photocatalytic degradation of organic pollutants under visible light irradiation. J. Environ. Manag. 2022, 318, 115518. [Google Scholar] [CrossRef] [Scilit]
- Oyewo, O.A.; Ramaila, S.; Mavuru, L.; Onwudiwe, D.C. Enhanced photocatalytic degradation of methyl orange using Sn-ZnO/ GO nanocomposite. J. Photochem. Photobiol. 2022, 11, 100131. [Google Scholar] [CrossRef] [Scilit]
- Azmayesh, R.; Naghshara, H.; Aref, S.M.; Ghafouri, M.; Siahsahlan, M. The effect of GO content on the improvement of efficient water splitting applications in ZnO/GO nanocomposites. Int. J. Hydrogen Energy 2024, 84, 511–520. [Google Scholar] [CrossRef] [Scilit]
- Riwayati, I.; Winardi, S.; Madhania, S.; Shimada, M.; Kusdianto. Green synthesis of ZnO nanoparticles using Cosmos caudatus: Effects of calcination temperature and precursor type on photocatalytic and antimicrobial activities. Results Eng. 2024, 24, 103594. [Google Scholar] [CrossRef] [Scilit]
- Horlu, M.; Macit, C.K.; Aksakal, B.; Tanyeri, B.; Biryan, F. Investigation of the effect of graphene oxide nanoparticles on the structural and dielectric parameters in zinc oxide semiconductors. JSST 2024, 110, 169–182. [Google Scholar] [CrossRef] [Scilit]
- Alves, Z.; Nunes, C.; Ferreira, P. Unravelling the Role of Synthesis Conditions on the Structure of Zinc Oxide-Reduced Graphene Oxide Nanofillers. Nanomaterials 2021, 11, 2149. [Google Scholar] [CrossRef] [Scilit]
- Kumar, S.V.; Huang, N.M.; Yusoff, N.; Lim, H.M. High performance magnetically separable graphene/zinc oxide nanocomposite. Mater. Lett. 2013, 93, 411–414. [Google Scholar] [CrossRef] [Scilit]
- Omar, F.S.; Ming, H.N.; Hafiz, S.M.; Ngee, L.H. Microwave Synthesis of Zinc Oxide/Reduced Graphene Oxide Hybrid for Adsorption-Photocatalysis Application. Int. J. Photoenergy 2014, 2014, 176835. [Google Scholar] [CrossRef] [Scilit]
- Ahmed, G.; Hanif, M.; Mahmood, K.; Yao, R.; Ning, H.; Jiao, D.; Wu, M.; Khan, J.; Liu, Z. Lattice defects of ZnO and hybrids with GO: Characterization, EPR and optoelectronic properties. AIP Adv. 2018, 8, 025218. [Google Scholar] [CrossRef] [Scilit]
- Faaizatunnisa, N.; Ediati, R.; Yusof, E.N.M.D.; Fadlan, A.; Karelius, K.; Kulsum, U.; Ariesta, M.N. Optimized photocatalytic degradation of 2-naphthol using ZnO/rGO nanocomposites synthesized from palm kernel shell waste. JWPE 2025, 70, 106977. [Google Scholar] [CrossRef] [Scilit]
- Mahdavi, R.; Talesh, S.S.A. Enhanced selective photocatalytic and sonocatalytic degradation in mixed dye aqueous solution by ZnO/GO nanocomposites: Response surface methodology. Mater. Chem. Phys. 2021, 267, 124581. [Google Scholar] [CrossRef] [Scilit]
- El-Shahat, S.; Emam, A.N.; El-Dessouky, M.I.; Mohamed, G.G. Reduced Graphene Oxide/Zinc Oxide/Silver Nanocomposites Trigger Visible Light Activity for Efficient Photocatalytic Degradation of Xylenol Orange as a Persistent Pollutant Model. Egypt. J. Chem. 2025, 68, 103–131. [Google Scholar] [CrossRef] [Scilit]
- Hosseini, S.M.; Asadpour, S.; Ghasemi, M.; Shirani, M. Efficient photocatalytic activity of ZnO/GO/CuO nanocomposite with solar light for reduction of hexavalent chromium. Sci. Rep. 2025, 15, 20780. [Google Scholar] [CrossRef] [Scilit]
- Bindu, P.; Thomas, S. Estimation of lattice strain in ZnO nanoparticles: X-ray peak profile analysis. J. Theor. Appl. Phys. 2014, 8, 123–134. [Google Scholar] [CrossRef] [Scilit]
- Kachere, A.R.; Kakade, P.M.; Kanwade, A.R.; Dani, P.; Mandlik, N.T.; Rondiya, S.R.; Dzade, N.Y.; Jadkar, S.R.; Bhoslae, S.V. Zinc Oxide/Graphene Oxide Nanocomposites: Synthesis, Characterization and Their Optical Properties. ES Mater. Manuf. 2022, 16, 19–29. [Google Scholar] [CrossRef] [Scilit]
- Talib, Z.M.; Hassan, A.I.; Saimon, J.A. Structural and Optoelectronic Characterization of Graphene ZnO/Si Nano Hybrid Photodetector. J. Nanostructures 2023, 13, 1091–1103. [Google Scholar] [CrossRef]
- Dadlani, A.; Trejo, O.; Acharya, S.; Torgersen, J.; Petrousis, I.; Nordalund, D.; Sarangi, R.; Schindler, P.; Pronz, F.B. Exploring Local Electronic Structure and Geometric Arrangement of ALD Zn(O,S) Buffer Layers using X-Ray Absorption Spectroscopy. J. Mater. Chem. C 2015, 3, 12192–12198. [Google Scholar] [CrossRef] [Scilit]
- Geng, W.; Zhao, X.; Zan, W.; Liu, H.; Yao, X. Effects of the electric field on the properties of ZnO-graphene composites: A density functional theory study. Phys. Chem. Chem. Phys. 2014, 16, 3542. [Google Scholar] [CrossRef] [Scilit] [PubMed]
- Singh, R.P.P.; Hudiara, I.S.; Rana, S.B. Effect of calcination temperature on the structural, optical and magnetic properties of pure and Fe-doped ZnO nanoparticles. Mater. Sci. Pol. 2016, 34, 451–459. [Google Scholar] [CrossRef] [Scilit]
- Zhao, M.-J.; Sun, Z.-T.; Zhang, Z.-X.; Geng, X.-P.; Wu, W.-Y.; Lien, S.-Y.; Zhu, W.-Z. Suppression of Oxygen Vacancy Defects in sALD-ZnO Films Annealed in Different Conditions. Materials 2020, 13, 3910. [Google Scholar] [CrossRef] [Scilit]
- Khawal, H.A.; Gawai, U.P.; Asokan, K.; Dole, B.N. Modified structural, surface morphological and optical studies of Li3+ swift heavy ion irradiation on zinc oxide nanoparticles. RCS Adv. 2016, 6, 49068. [Google Scholar] [CrossRef] [Scilit]
- Dasuki, D.; Habanjar, K.; Awad, R. Effect of Growth and Calcination Temperatures on the Optical Properties of Ruthenium-Doped ZnO Nanoparticles. Condens. Matter 2023, 8, 102. [Google Scholar] [CrossRef] [Scilit]
- Garg, R.; Gupta, R.; Singh, N.; Bansal, A. Characterization and performance evaluation of synthesized ZnO nanoflowers, nanorods, and their hybrid nanocomposites with graphene oxide for degradation of Orange G. ESPR 2021, 28, 57009–57029. [Google Scholar] [CrossRef] [Scilit]
- Boukhoubza, I.; Khenfouch, M.; Achehboune, M.; Leontie, L.; Galca, A.C.; Enculescu, M.; Carlescu, A. Graphene Oxide Concentration Effect on the Optoelectronic Properties of ZnO/GO Nanocomposites. Nanomaterials 2020, 10, 1532. [Google Scholar] [CrossRef] [Scilit]
- Pascariu, P.; Tudose, I.V.; Suchea, M.; Koudomas, E.; Fifere, N.; Airinei, A. Preparation and characterization of Ni, Co doped ZnO nanoparticles for photocatalytic applications. Appl. Surf. Sci. 2018, 448, 481–488. [Google Scholar] [CrossRef] [Scilit]
- Rani, M.; Keshu; Shanker, U. Highly efficient sunlight-driven photo-adsorptive degradation of organic pollutants by green synthesized Z-scheme heterojunction CeO2@ZnO nanocomposite. Environ. Sci. Nano 2024, 11, 200–215. [Google Scholar] [CrossRef] [Scilit]
- Ansari, S.A.; Khan, M.M.; Kalathil, S.; Nisar, A.; Lee, J.; Cho, M.H. Oxygen vacancy induced band gap narrowing of ZnO nanostructures by an electrochemically active biofilm. Nanoscale 2013, 5, 9238–9246. [Google Scholar] [CrossRef] [Scilit] [PubMed]
- Parthenidis, P.; Maroulas, K.N.; Evgenidou, E.; Kyzas, G.Z.; Lambropoulou, D.A. Synthesis, characterization and application of GO-ZnO photocatalyst for the enhanced degradation of azole fungicides: Performance, activation of oxidants, transformation products and toxicity. J. Water Process Eng. 2025, 74, 107824. [Google Scholar] [CrossRef] [Scilit]
- Kaewsaenee, J.; Singhaset, M.T.; Roongraung, K.; Kemacheevakul, P.; Chuangchote, S. Polymer-Assisted Coprecipitation Synthesized Zinc Oxide Nanoparticles and Their Uses for Green Chemical Synthesis via Photocatalytic Glucose Conversions. ACS Omega 2023, 8, 43664−43673. [Google Scholar] [CrossRef] [Scilit] [PubMed]
- Jahan, S.; Sayem, A.; Uddin, K.; Ferdous, F.; Jahan, R.A.; Syed, I.M. Remarkable photocatalytic performance and recyclable pathway of cleansing wastewater using ZnO–rGO nanocomposite. AIP Adv. 2025, 15, 075343. [Google Scholar] [CrossRef] [Scilit]
- Khosravi-Far, M.; Mohebat, R.; Ghaedi, M.; Tabatabaee, M. Efficient photocatalytic degradation of malachite green dye from wastewater using facilely synthesized ternary ZIF-8/Ag/Ag2S nanocomposite: Optimization by RSM (CCD). Process Saf. Environ. Prot. 2024, 190, 46–62. [Google Scholar] [CrossRef] [Scilit]
- Chanu, L.A.; Singl, K.J.; Devi, K.N. UV light illuminated photodegradation of Malachite green dye using ZnO/CuO nanocomposites. Mater. Today Proc. 2022, 65, 2865–2870. [Google Scholar] [CrossRef] [Scilit]
- Aydogan, S.; Canpolat, N.; Kocyigit, A.; Yilmaz, M. Synergistic enhancement of simazine degradation using ZnO nanosheets and ZnO/GO nanocomposites: A sol-gel synthesis approach. Ceram. Int. 2024, 50, 25080–25094. [Google Scholar] [CrossRef] [Scilit]
- Rout, D.R.; Chaurasia, S.; Jena, H.M. Enhanced photocatalytic degradation of malachite green using manganese oxide doped graphene oxide/zinc oxide (GO-ZnO/Mn2O3) ternary composite under sunlight irradiation. J. Environ. Manag. 2022, 318, 115449. [Google Scholar] [CrossRef] [Scilit]
- Asadullah; Aleena; Khan, A.; Rahman, U.U.; Humayun, M.; Akbar, A.; Alanazi, A.F.; Bouodina, M. Green Synthesis of Zinc Oxide-Graphene Oxide Composite via Ex Situ and In Situ Methods for the Photoassisted Removal of Congo Red Dye: A Comparative Study. ACS Omega 2025, 10, 27112−27126. [Google Scholar] [CrossRef] [Scilit]
- Amar, I.A.; Harara, H.M.; Baqual, Q.A.; Abdul Qadir, M.A.; Altohami, F.A.; Ahwidi, M.M.; Abdalsamed, I.A.; Saleh, F.A. Photocatalytic degradation of malachite green dye under UV light irradiation using calcium-doped ceria nanoparticles. Asian J. Nanosci. Mater. 2020, 3, 1–14. [Google Scholar] [CrossRef]
- Yao, D.; Xie, X.; Liang, X.; Lu, S.; Lai, H. Photocatalytic Degradation of Malachite Green by Titanium Dioxide/Covalent Organic Framework Composite: Characterization, Performance and Mechanism. ChemistryOpen 2024, 13, e202300209. [Google Scholar] [CrossRef] [Scilit]
- Mhalshekar, K.; Selvam, S.; Sahoo, A.; Illa, M.P.; Gaydhane, M.; Sontakke, S. Efficient Photocatalytic Degradation of Malachite Green and Cr(VI) Using Co-MOF and Bacterial Cellulose@Co-MOF Biocomposite: A Green Approach. ACS Omega 2025, 10, 45965–45981. [Google Scholar] [CrossRef] [Scilit] [PubMed]
- Du, F.; Sun, L.; Huang, Z.; Chen, Z.; Xu, Z.; Ruan, G.; Zhao, C. Electrospun reduced graphene oxide/TiO2/poly(acrylonitrile-comaleic acid) composite nanofibers for efficient adsorption and photocatalytic removal of malachite green and leucomalachite green. Chemosphere 2020, 239, 124764. [Google Scholar] [CrossRef] [Scilit] [PubMed]
- Sekar, A.; Yadav, R. Green fabrication of zinc oxide supported carbon dotsfor visible light-responsive photocatalyticdecolourization of Malachite Green dye: Optimizationand kinetic studies. Optic 2021, 242, 167311. [Google Scholar] [CrossRef] [Scilit]
- Amdeha, E.; Selam, M.S. Facile Green Synthesis of ZnO Supported on Exfoliated Graphite for Photocatalytic Degradation of Dye Under UV and Visible-Light Irradiation. Egypt. J. Chem. 2022, 65, 557–569. [Google Scholar] [CrossRef] [Scilit]
- Moussa, S.B. Box-Behnken design for the optimization of the photocatalytic degradation of methyl orange using gold-platinum bimetallic nanoparticles doped-1D titania. J. Photochem. Photobiol. A. Chem. 2024, 447, 115284. [Google Scholar] [CrossRef] [Scilit]
- Madjene, F.; Assassi, M.; Chokri, I.; Enteghar, T.; Lebik, H. Optimization of photocatalytic degradation of rhodamine B using Box-Behnken experimental design: Mineralization and mechanism. Water Environ. Res. 2021, 93, 112–122. [Google Scholar] [CrossRef] [Scilit]
- Hasanpour, M.; Motahari, S.; Jing, D.; Hatami, M. Statistical analysis and optimization of photodegradation efficiency of methyl orange from aqueous solution using cellulose/zinc oxide hybrid aerogel by response surface methodology (RSM). Arab. J. Chem. 2021, 14, 103401. [Google Scholar] [CrossRef] [Scilit]
- Tetteh, E.K.; Ezugbe, E.O.; Asante-Sackey, D.; Armah, E.K.; Rathilal, S. Response Surface Methodology: Photocatalytic Degradation Kinetics of Basic Blue 41 Dye Using Activated Carbon with TiO2. Molecules 2021, 26, 1068. [Google Scholar] [CrossRef] [Scilit]
- Marković, M.; Gorgievski, M.; Štrbac, N.; Grekulović, V.; Božinović, K.; Zdravković, M.; Vuković, M. Raw Eggshell as an Adsorbent for Copper Ions Biosorption—Equilibrium, Kinetic, Thermodynamic and Process Optimization Studies. Metals 2023, 13, 206. [Google Scholar] [CrossRef] [Scilit]
- Al, C.; Zhou, D.; Wang, Q.; Shao, X.; Lei, Y. Optimization of operating parameters for photocatalytic degradation of tetracycline using In2S3 under natural solar radiation. Sol. Energy 2015, 13, 34–42. [Google Scholar] [CrossRef] [Scilit]
- Gadore, V.; Singh, A.K.; Mishra, S.R.; Ahmaruzzaman, M. RSM approach for process optimization of the photodegradation of congo red by a novel NiCo2S4/chitosan photocatalyst. Sci. Rep. 2024, 14, 1118. [Google Scholar] [CrossRef] [Scilit] [PubMed]
- Suresh, M.; Pravina, R.; Shanmugavel, M.; Sivasamy, A. Construction of RGO@N-ZnO nanocomposite photocatalyst for disinfection of microbes and dye degradation under visible light irradiation. J. Taiwan Inst. Chem. Eng. 2024, 161, 105510. [Google Scholar] [CrossRef] [Scilit]
- Thuy, P.T.; Hue, B.T.C.; Sang, N.X.; Thuy, L.T.T.; Lieu, P.L. Synthesis of zinc oxide-doped reduced graphene oxide (rGO) nanocomposites on visible light-driven photocatalytic and antibacterial activity applications. Nano Express 2024, 5, 045018. [Google Scholar] [CrossRef] [Scilit]
- Skėrė, S.; Bastida-Molina, P.; Hurtado-Pérez, E.; Juzėnas, K. Energy Consumption Analysis and Efficiency Enhancement in Manufacturing Companies Using Decision Support Method for Dynamic Production Planning (DSM DPP) for Solar PV Integration. Machines 2023, 11, 939. [Google Scholar] [CrossRef] [Scilit]
- Parra, M.R.; Haque, F.Z. Aqueous chemical route synthesis and the effect of calcination temperature on the structural and optical properties of ZnO nanoparticles. J. Mater. Res. Technol. 2014, 3, 363–369. [Google Scholar] [CrossRef] [Scilit]
- Golsheikh, A.M.; Kamali, K.Z.; Huang, N.M.; Zak, A.K. Effect of calcination temperature on performance of ZnO nanoparticles for dye-sensitized solar cells. Powder Technol. 2018, 329, 282–287. [Google Scholar] [CrossRef] [Scilit]
- Belay, A.; Bekele, B.; Reddy, C.A.R. Effects of Temperature and Polyvinyl Alcohol Concentrations in the Synthesis of Zinc Oxide Nanoparticles. Dig. J. Nanomater. Biostructures 2019, 14, 51–60. Available online: https://www.chalcogen.ro/51_BelayA.pdf (accessed on 3 January 2026).
- Li, S.; Chen, X.; Wang, X.; Xiong, Y.; Yan, Y.; Tan, Z.; Yang, X.; Li, Y. Simonkolleite Coating on Poly(Amino Acids) to Improve Osteogenesis and Suppress Osteoclast Formation in Vitro. Polymers 2019, 11, 1505. [Google Scholar] [CrossRef] [Scilit]
- Moezzi, A.; Cortie, M.; McDonagh, A. Transformation of zinc hydroxide chloride monohydrate to crystalline zinc oxide. Dalton Trans. 2016, 45, 7385–7390. [Google Scholar] [CrossRef] [Scilit]
- Sharma, V.; Sharma, J.K.; Kansay, V.; Sharma, V.D.; Sharma, A.; Kmar, S.; Sharma, A.K.; Bera, M.K. The effect of calcination temperatures on the structural and optical properties of zinc oxide nanoparticles and their influence on the photocatalytic degradation of leather dye. Chem. Phys. Impact 2023, 6, 100196. [Google Scholar] [CrossRef] [Scilit]
- Baharudin, K.B.; Abdullah, N.; Derawi, D. Effect of calcination temperature on the physicochemical properties of zinc oxide nanoparticles synthesized by coprecipitation. Mater. Res. Express 2018, 5, 125018. [Google Scholar] [CrossRef] [Scilit]
- Özgür, Ü.; Alivov, Y.I.; Liu, C.; Teke, A.; Reshchikov, M.A.; Doğan, S.; Avrutin, V.; Cho, S.–J.; Morkoҫ, H. A comprehensive review of ZnO materials and devices. J. Appl. Phys. 2005, 98, 041301. [Google Scholar] [CrossRef] [Scilit]
- Ni, Z.; Chen, X.; Su, L.; Shen, H.; Yin, C. Effect of Calcination Temperature in Large-Aperture Medium-Entropy Oxide (FeCoCuZnNa)O on CO2 Hydrogenation for Light Olefins. Catalysts 2024, 14, 818. [Google Scholar] [CrossRef] [Scilit]
- Nedelkovski, V.; Radovanović, M.; Medić, D.; Stanković, S.; Hulka, I.; Tanikić, D.; Antonijević, M. Enhancing Wastewater Treatment Through Python ANN-Guided Optimization of Photocatalysis with Boron-Doped ZnO Synthesized via Mechanochemical Route. Processes 2025, 13, 2240. [Google Scholar] [CrossRef] [Scilit]
- Lin, K.–H.; Sun, S.–J.; Ju, S.–P.; Tsai, J.–Y.; Chen, H.–T.; Hsieh, J.–Y. Observation of the amorphous zinc oxide recrystalline process by molecular dynamics simulation. J. Appl. Phys. 2013, 113, 073512. [Google Scholar] [CrossRef] [Scilit]
- Mostafa, S.; Yeasmin, S.; Pranto, M.H.; Reza, S.M.; Rashid, T.U.; Das, H.; Rahman, M.; Habib, A. Annealing-induced optimization of greensynthesized ZnO nanoparticles for improved nanopriming in sustainable agriculture. Nanoscale Adv. 2025, 7, 5589. [Google Scholar] [CrossRef] [Scilit]
- Saidani, A.; Boudraa, R.; Fendi, K.; Benouadah, L.; Benabbas, A.; Djermoune, A.; Salvestrini, S.; Bollinger, J.–C.; Alayyaf, A.A.; Mouni, L. Effect of Calcination Temperature on the Photocatalytic Activity of Precipitated ZnO Nanoparticles for the Degradation of Rhodamine B Under Different Light Sources. Water 2025, 17, 32. [Google Scholar] [CrossRef] [Scilit]
- Sudha, D.; Dhanapandian, S.; Manoharan, C.; Arunachalam, A. Structural, morphological and electrical properties of pulsed electrodeposited CdIn2Se4 thin films. Results Phys. 2016, 6, 599–605. [Google Scholar] [CrossRef] [Scilit]
- Pholnak, C.; Sirisathitkul, C.; Suwanboon, S.; Harding, D.J. Effects of Precursor Concentration and Reaction Time on Sonochemically Synthesized ZnO Nanoparticles. Mater. Res. 2014, 17, 405–411. [Google Scholar] [CrossRef] [Scilit]
- Abdullah, J.A.A.; Guerrero, A.; Romero, A. Efficient and Sustainable Synthesis of Zinc Salt-Dependent Polycrystal Zinc Oxide Nanoparticles: Comprehensive Assessment of Physicochemical and Functional Properties. Appl. Sci. 2024, 14, 1815. [Google Scholar] [CrossRef] [Scilit]
- Nandiyanto, A.B.D.; Ragadhita, R.; Fiandini, M. Interpretation of Fourier Transform Infrared Spectra (FTIR): A Practical Approach in the Polymer/Plastic Thermal Decomposition. Indones. J. Sci. Technol. 2023, 8, 113–126. [Google Scholar] [CrossRef] [Scilit]
- de Peres, M.L.; de Avila Delucis, R.; Amico, S.C.; Gatto, D.A. Zinc oxide nanoparticles from microwave-assisted solvothermal process: Photocatalytic performance and use for wood protection against xylophagous fungus. Nanomater. Nanotechnol. 2019, 9, 1847980419876201. [Google Scholar] [CrossRef] [Scilit]
- Zhu, F.; Persson, D.; Thierry, D.; Taxen, C. Formation of Corrosion Products on Open and Confined Zinc Surfaces Exposed to Periodic Wet/Dry Conditions. Corrosion 2000, 56, 1256–1265. [Google Scholar] [CrossRef] [Scilit]
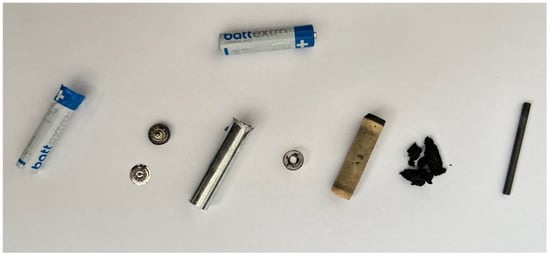
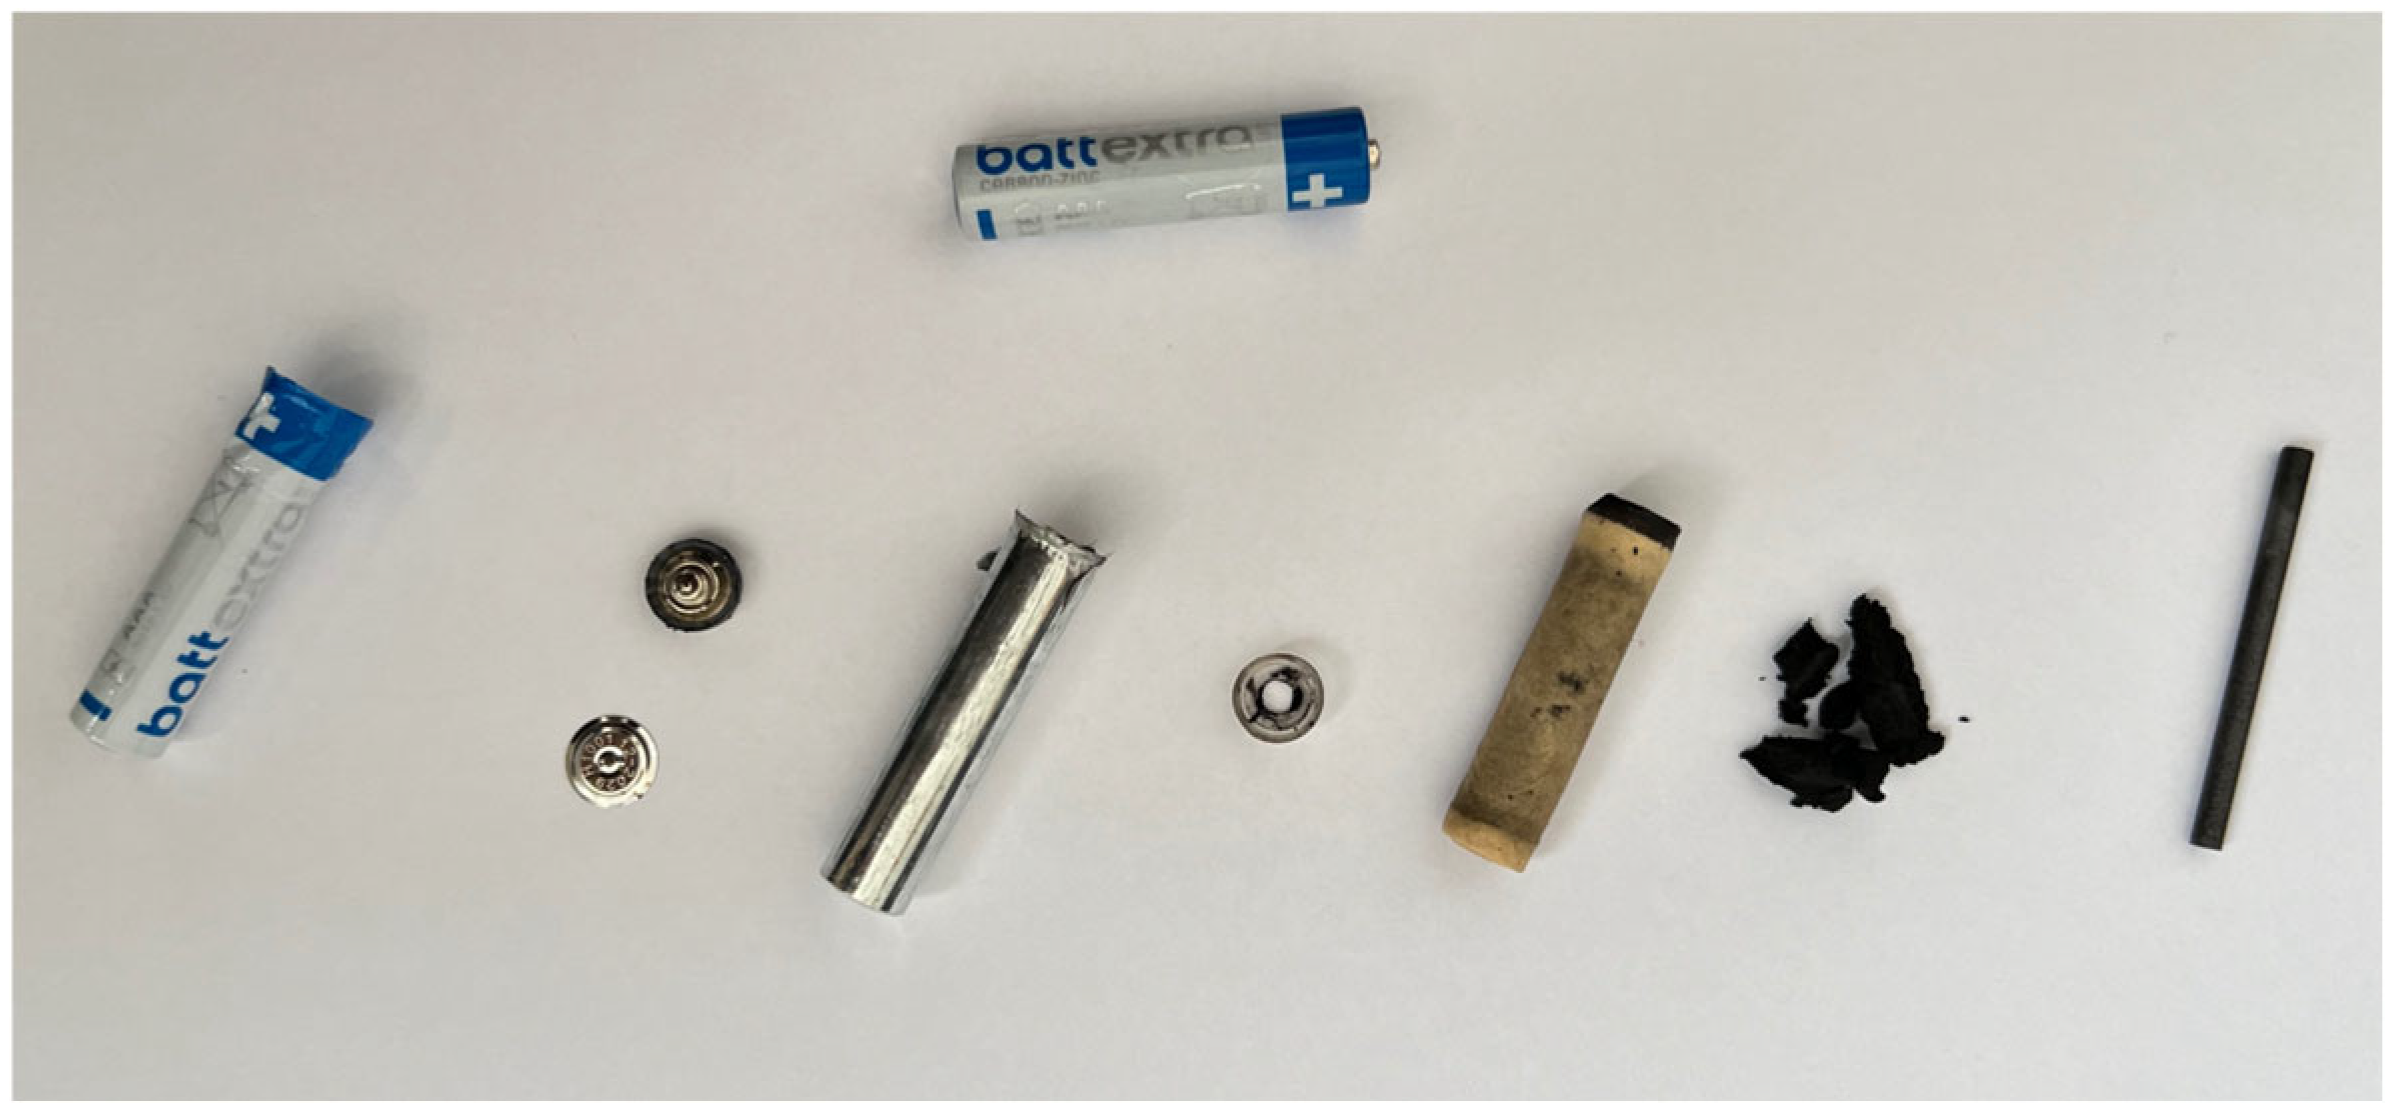
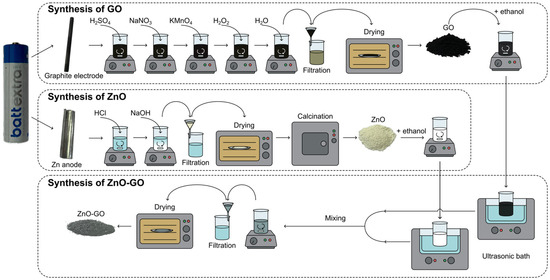
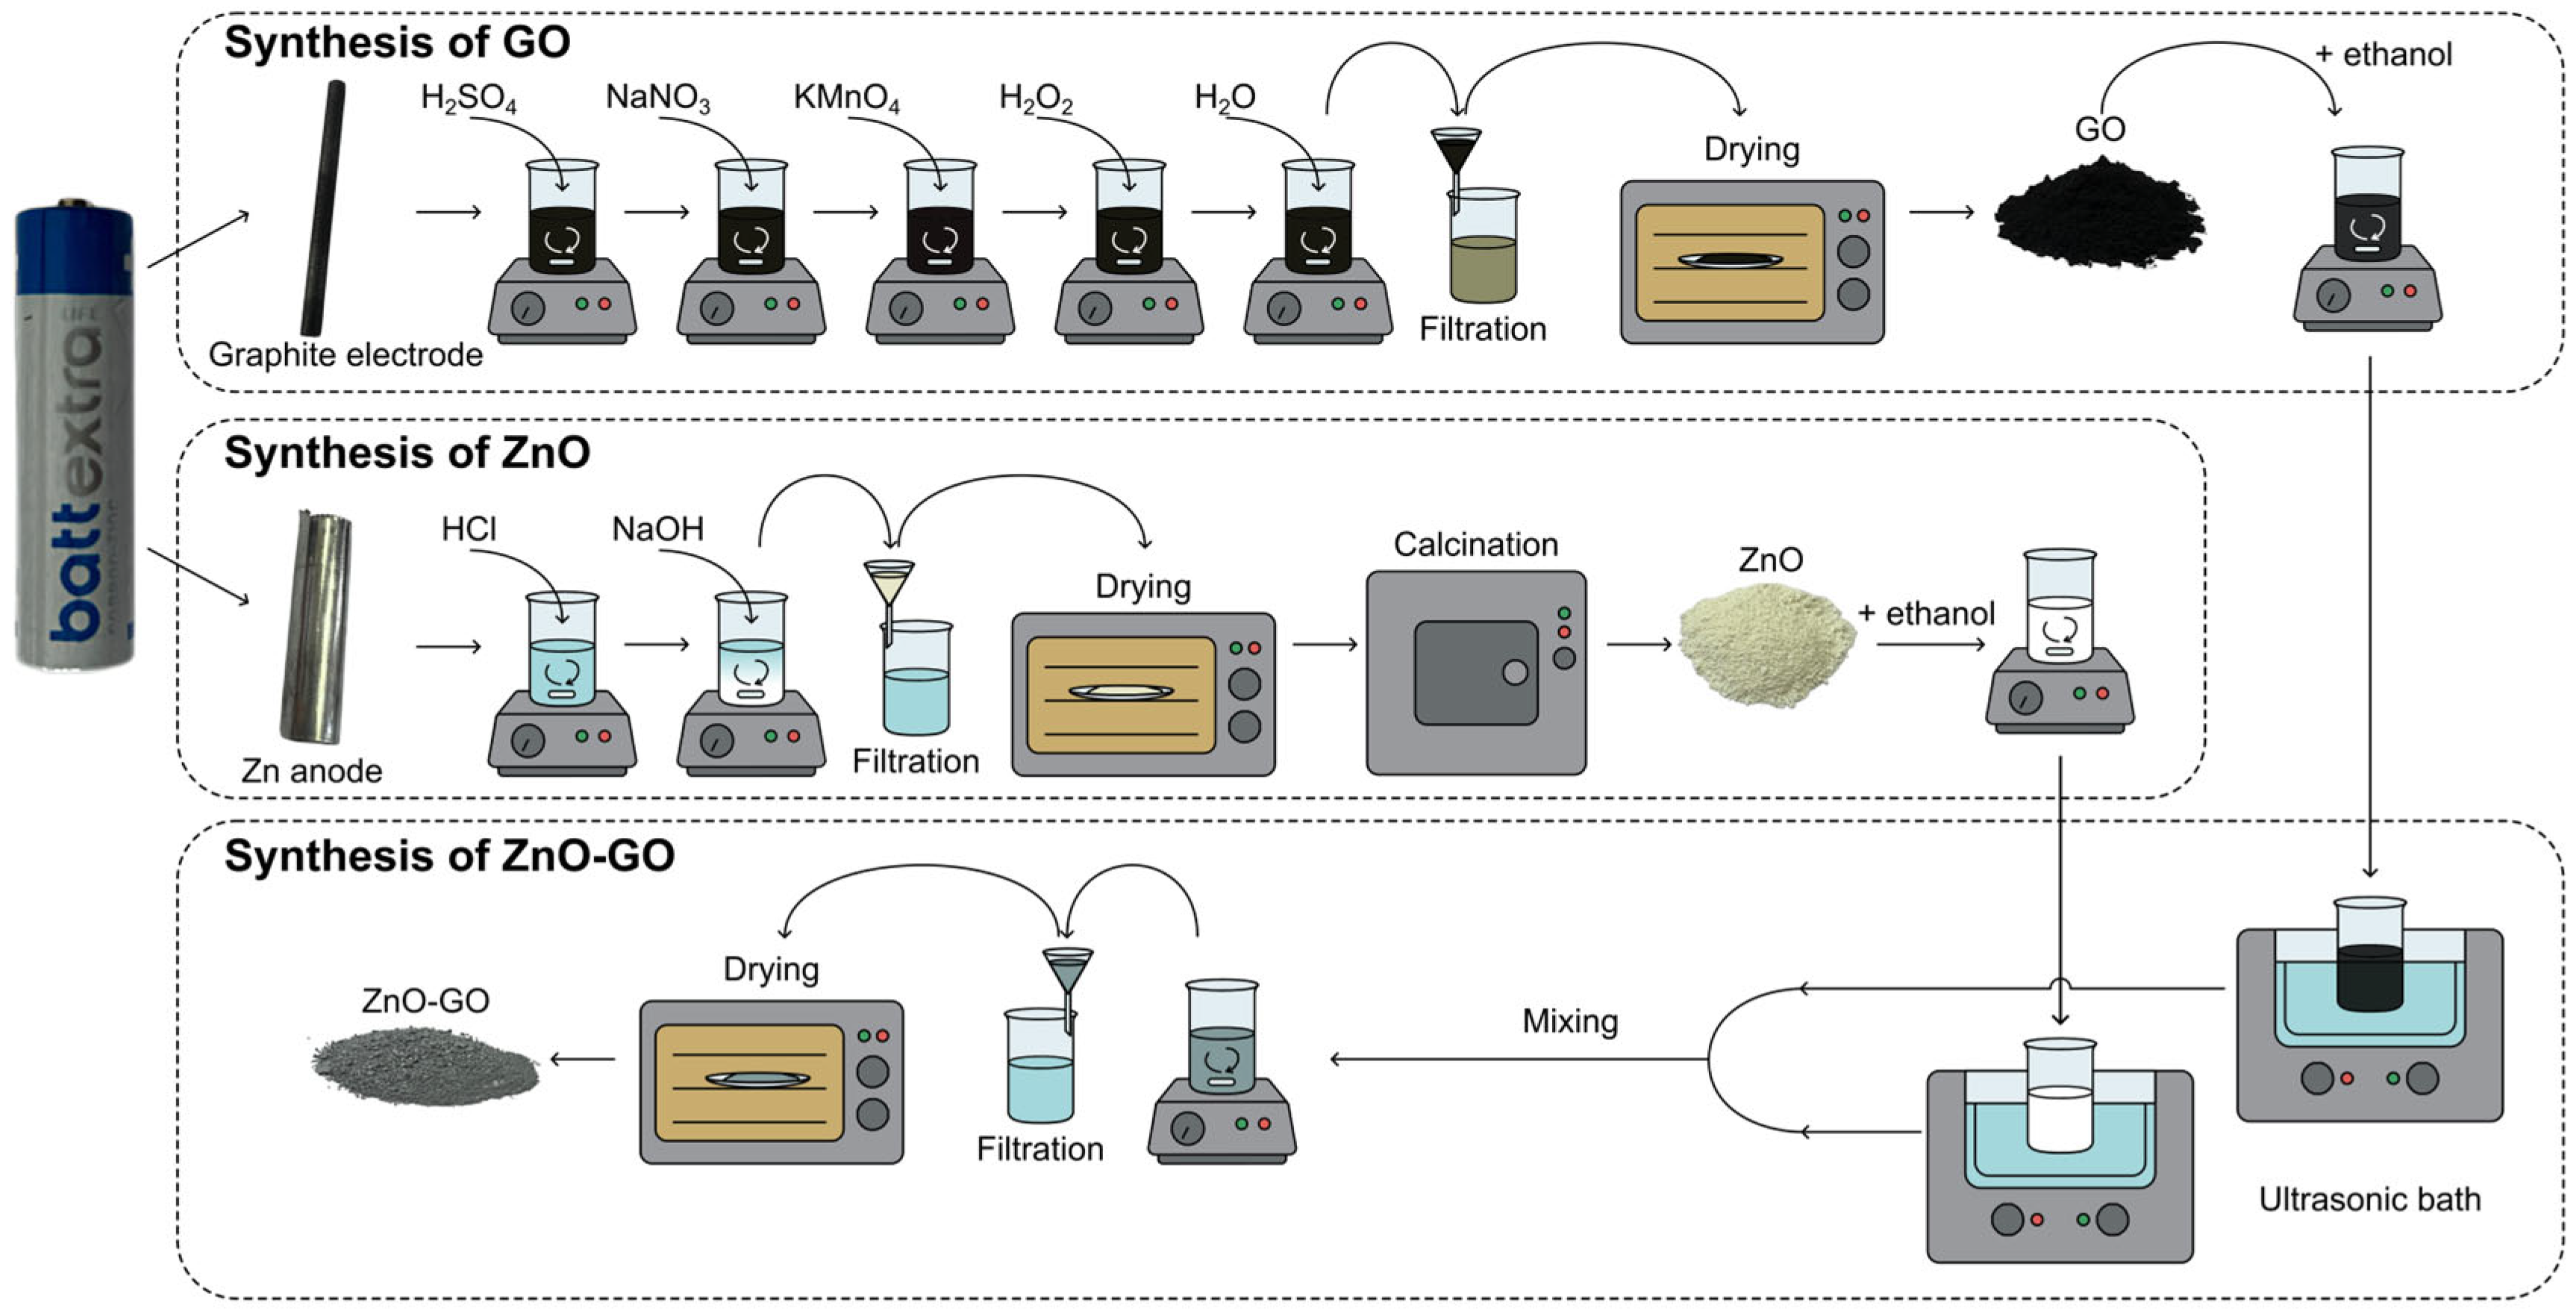
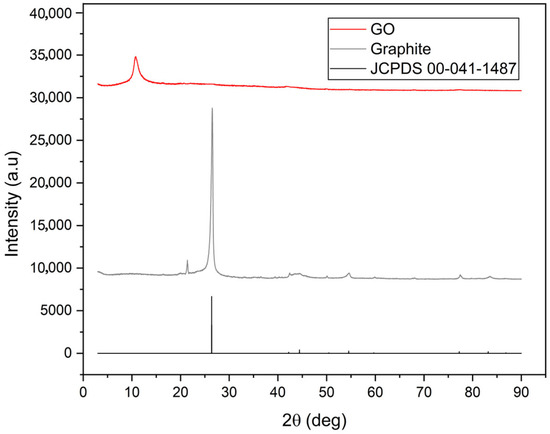
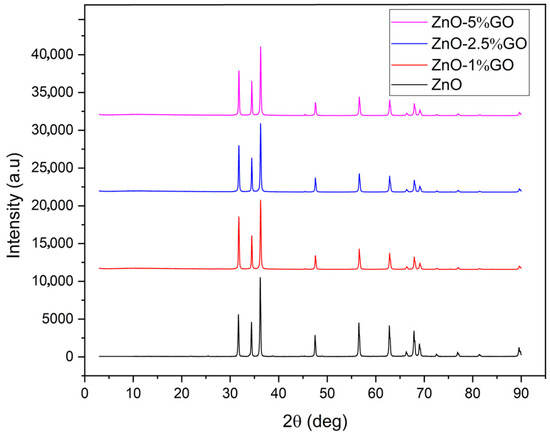
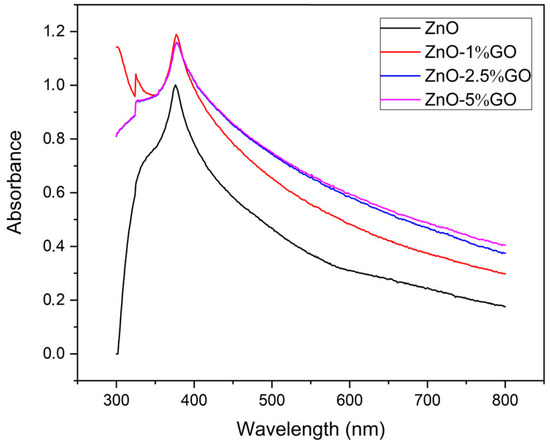
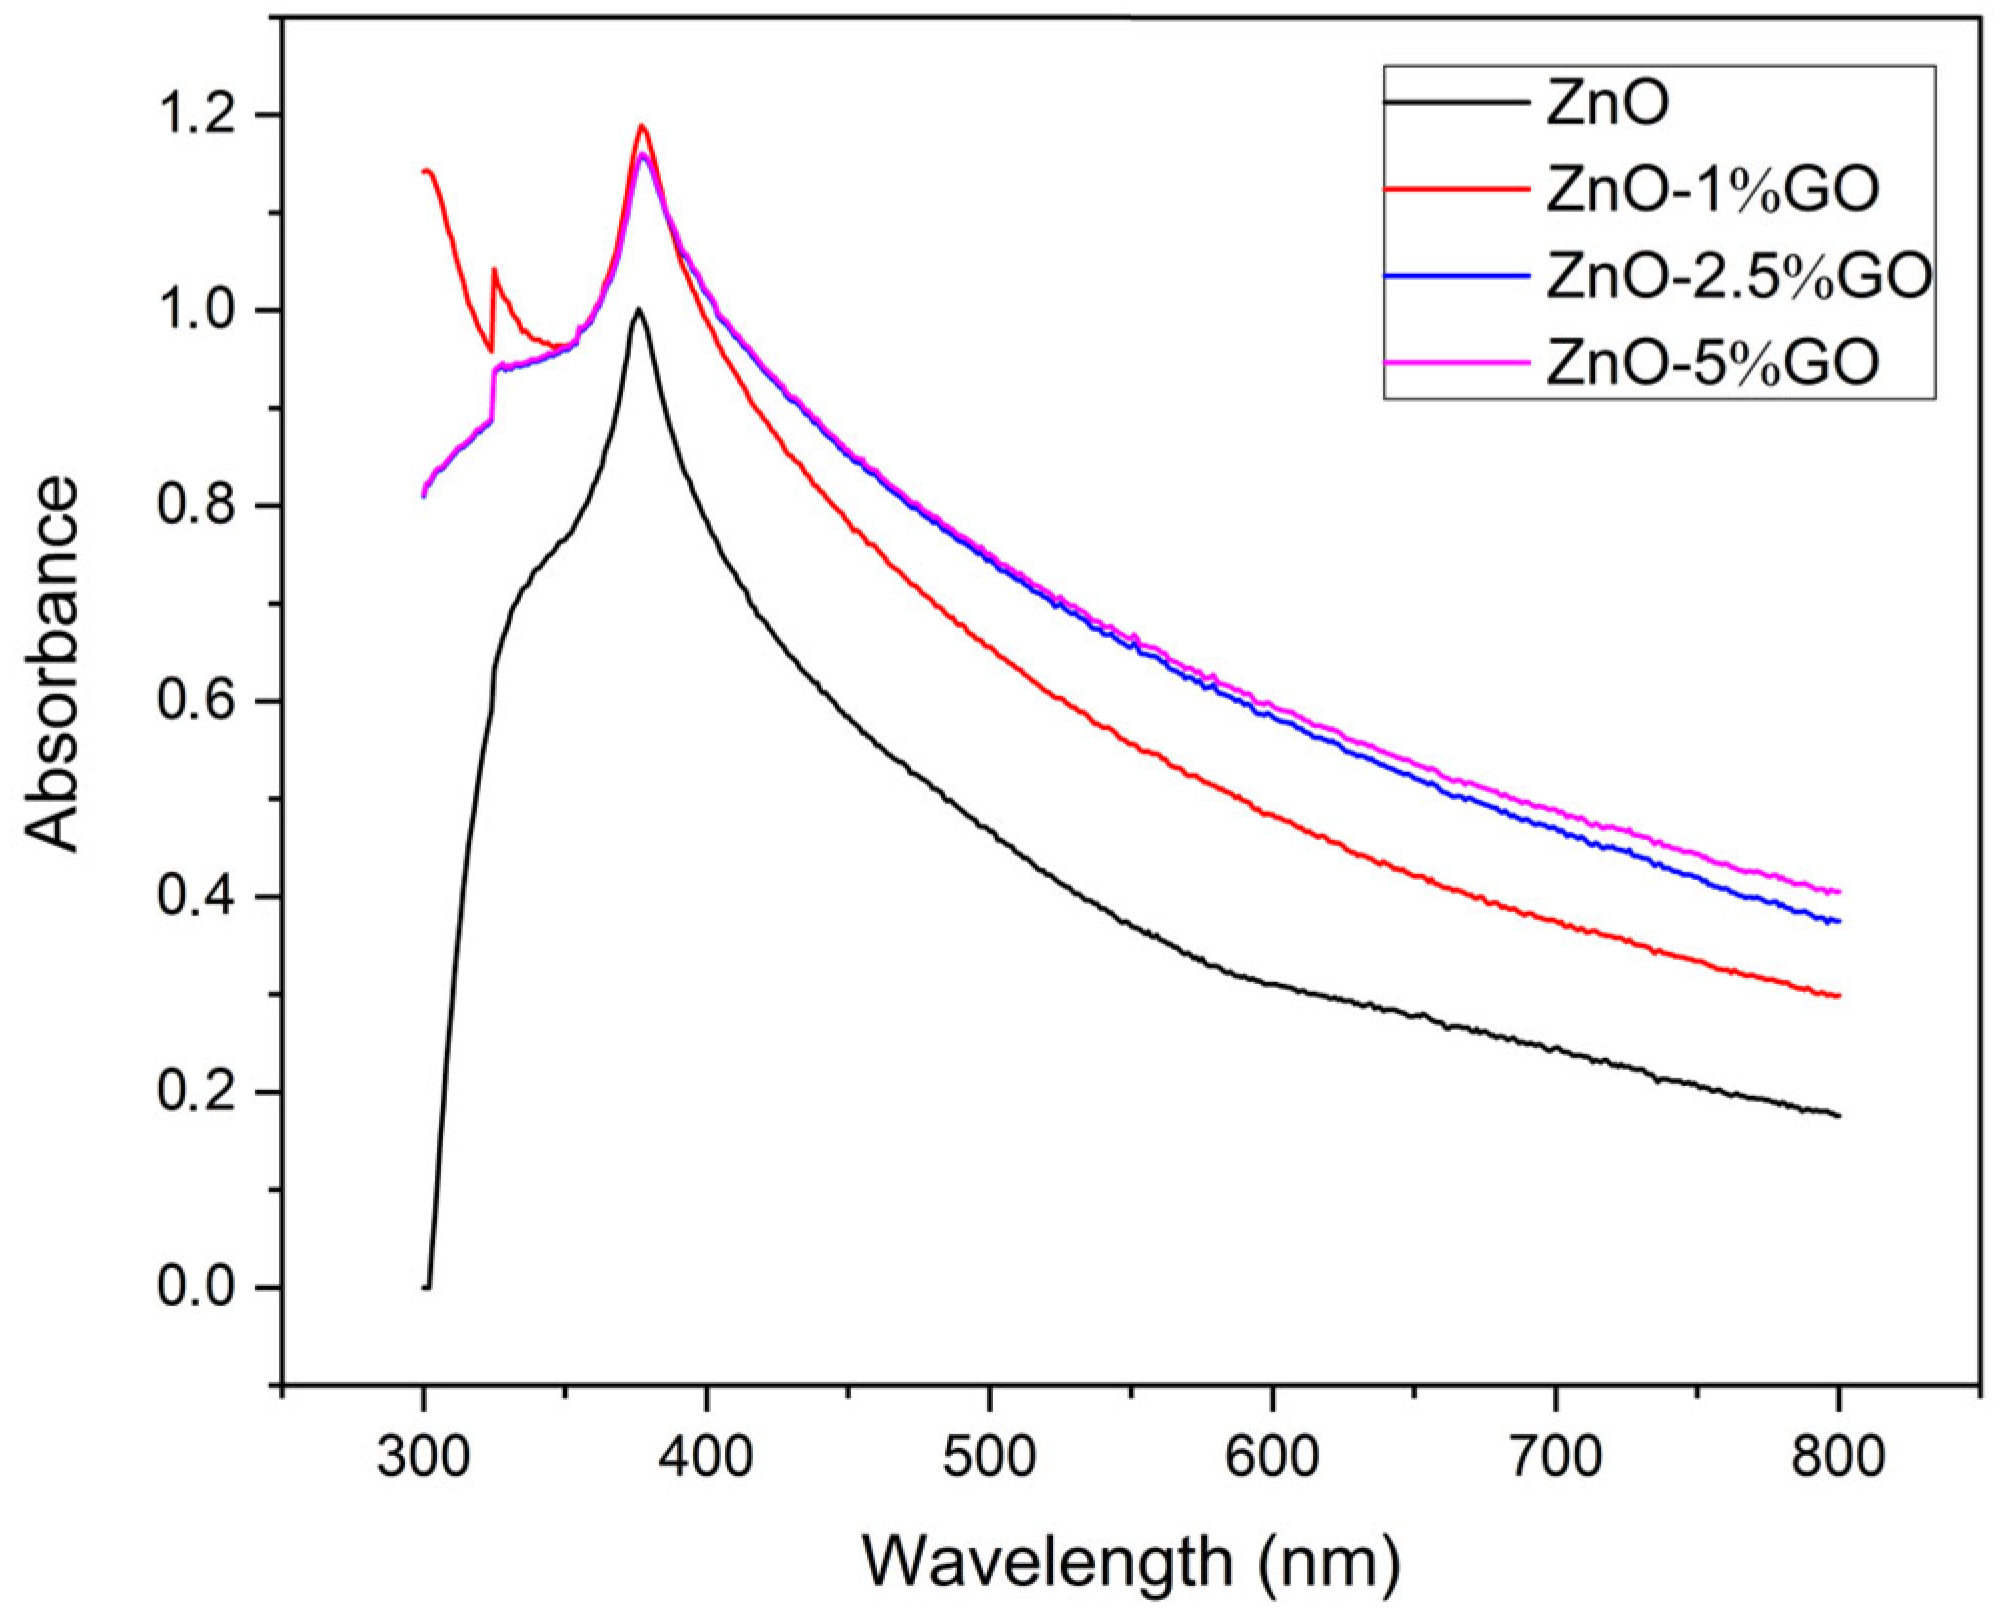
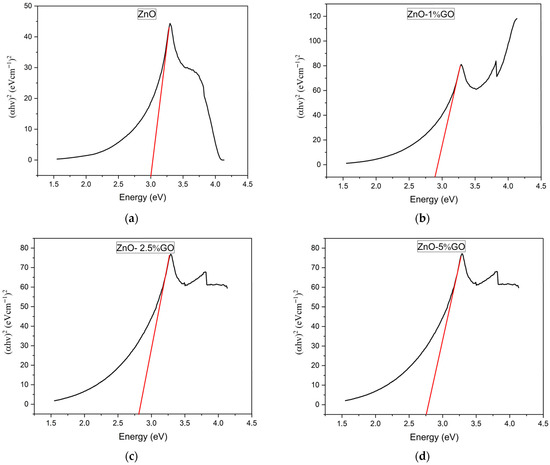
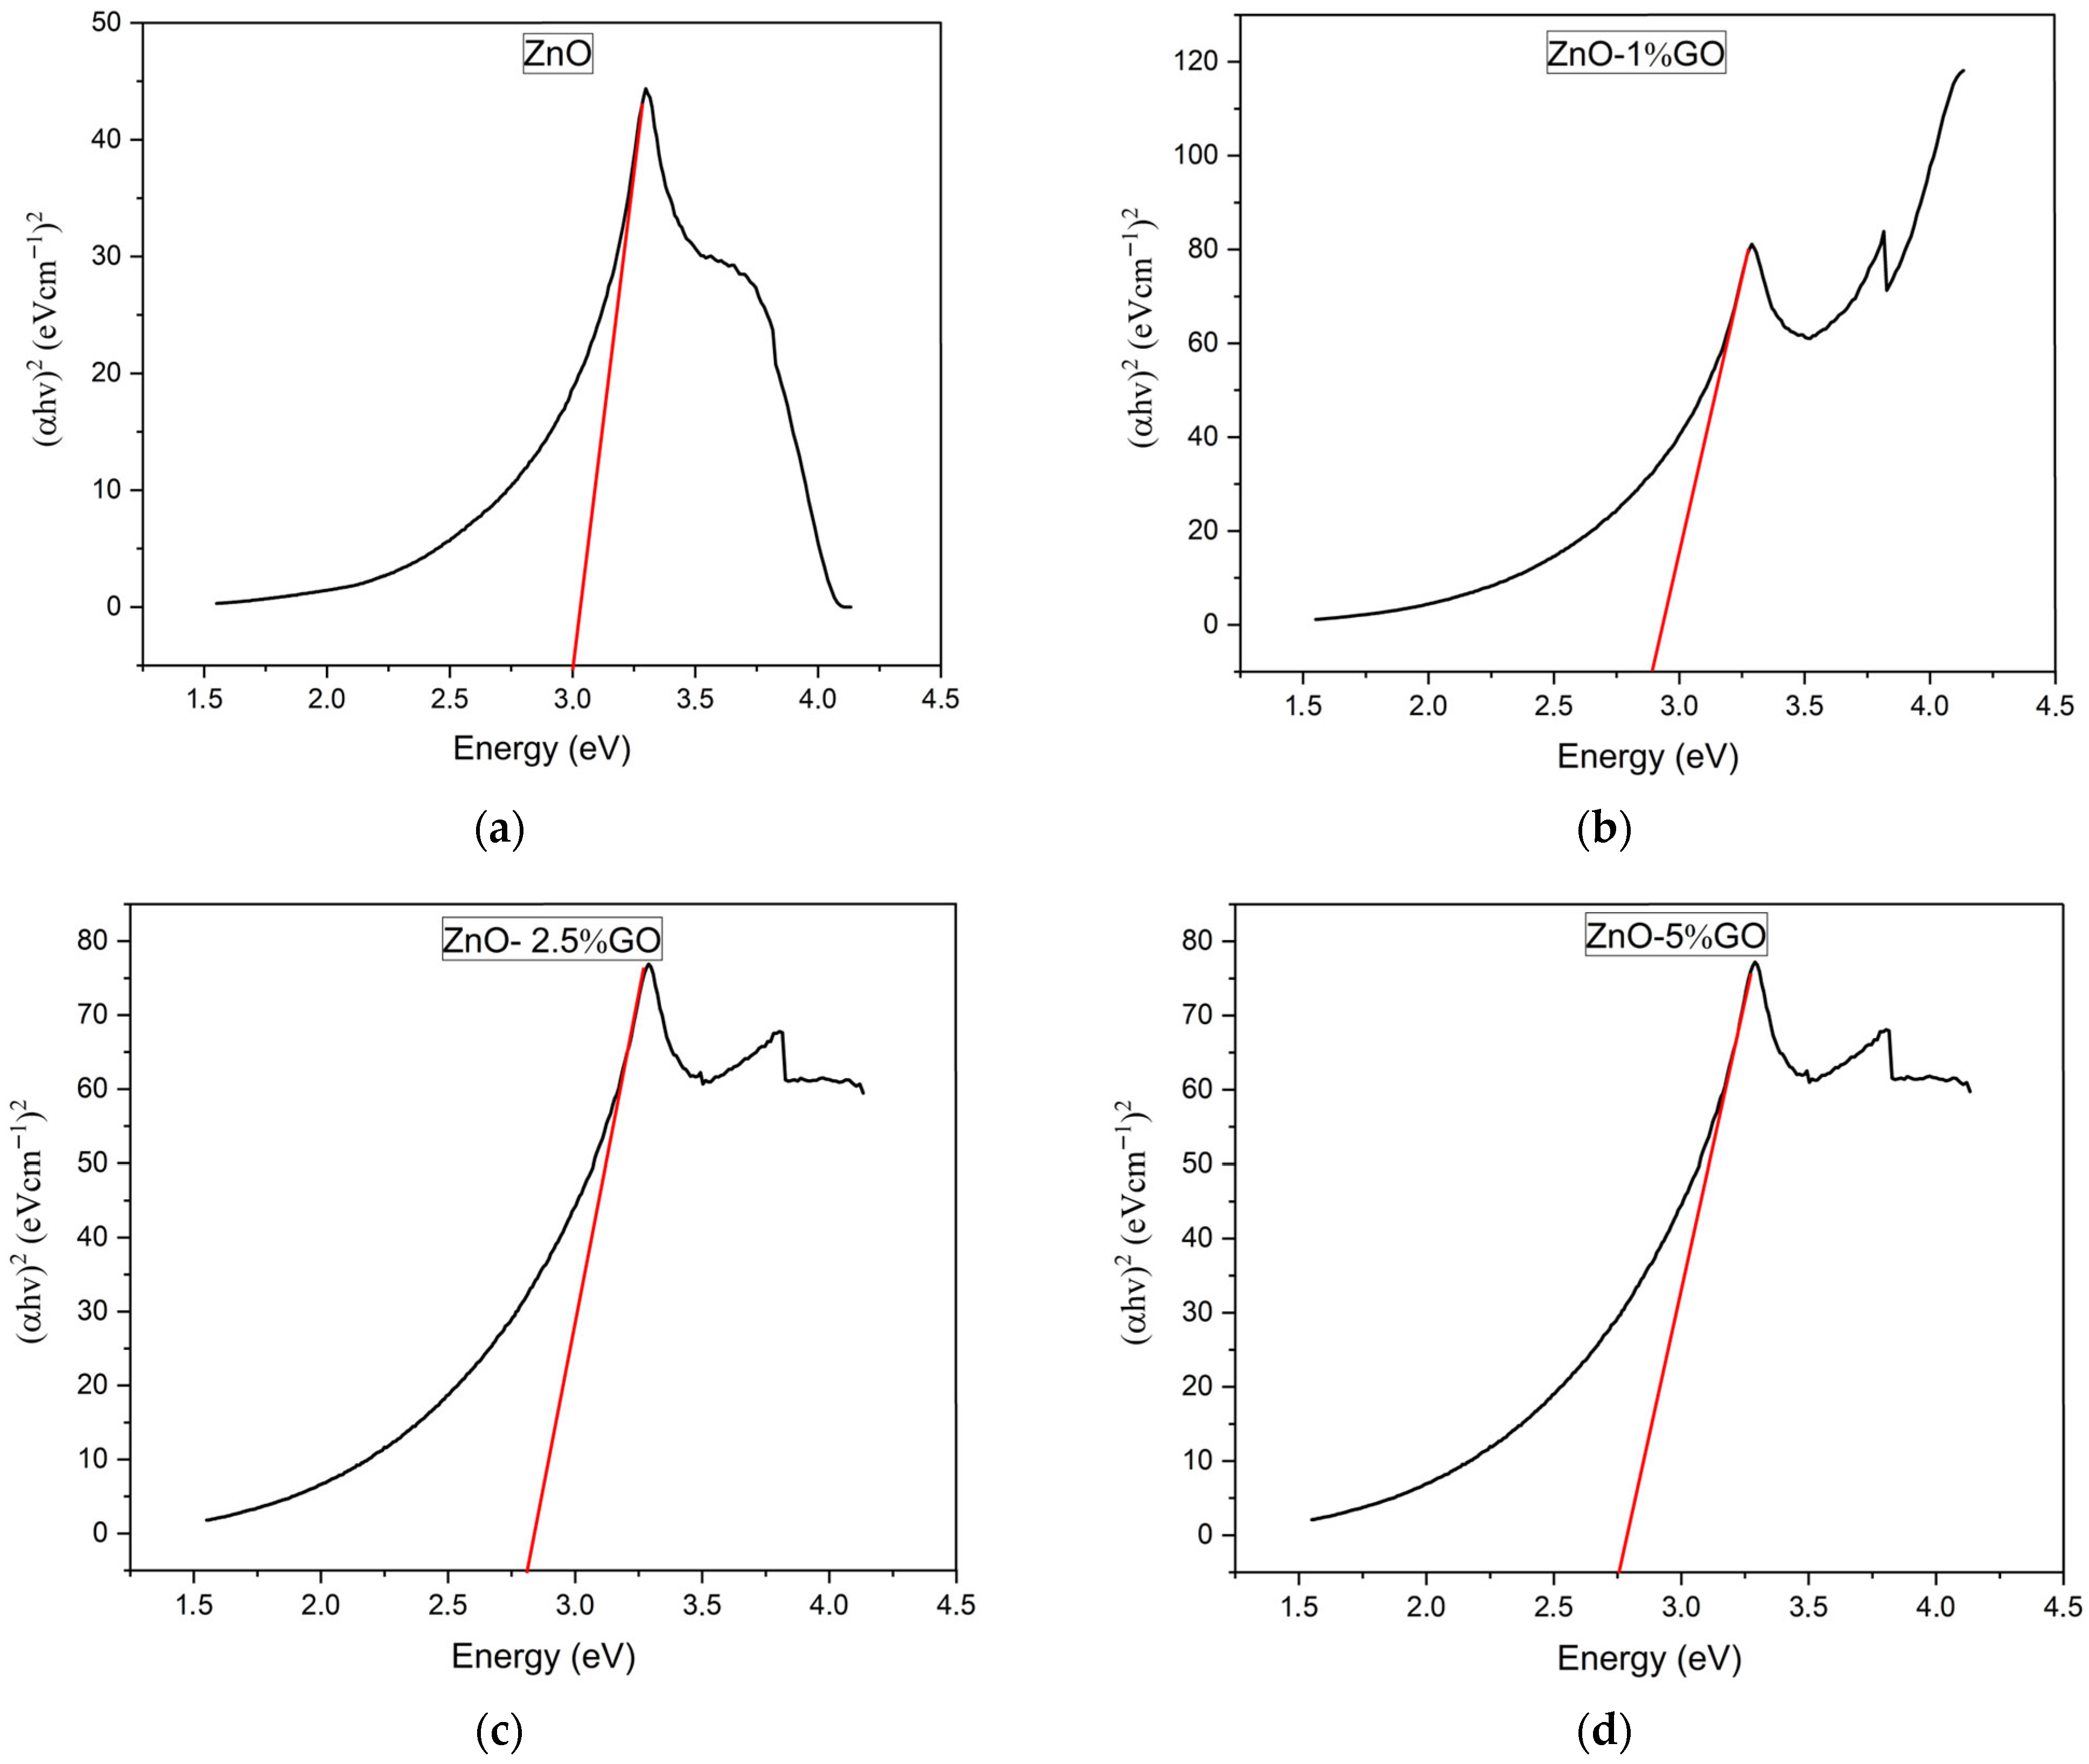
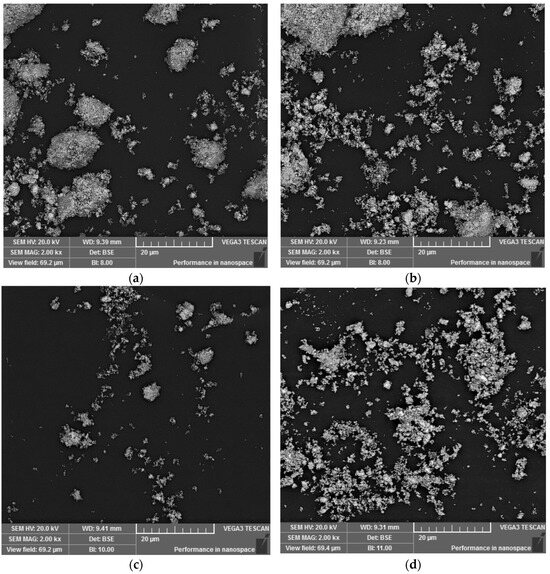
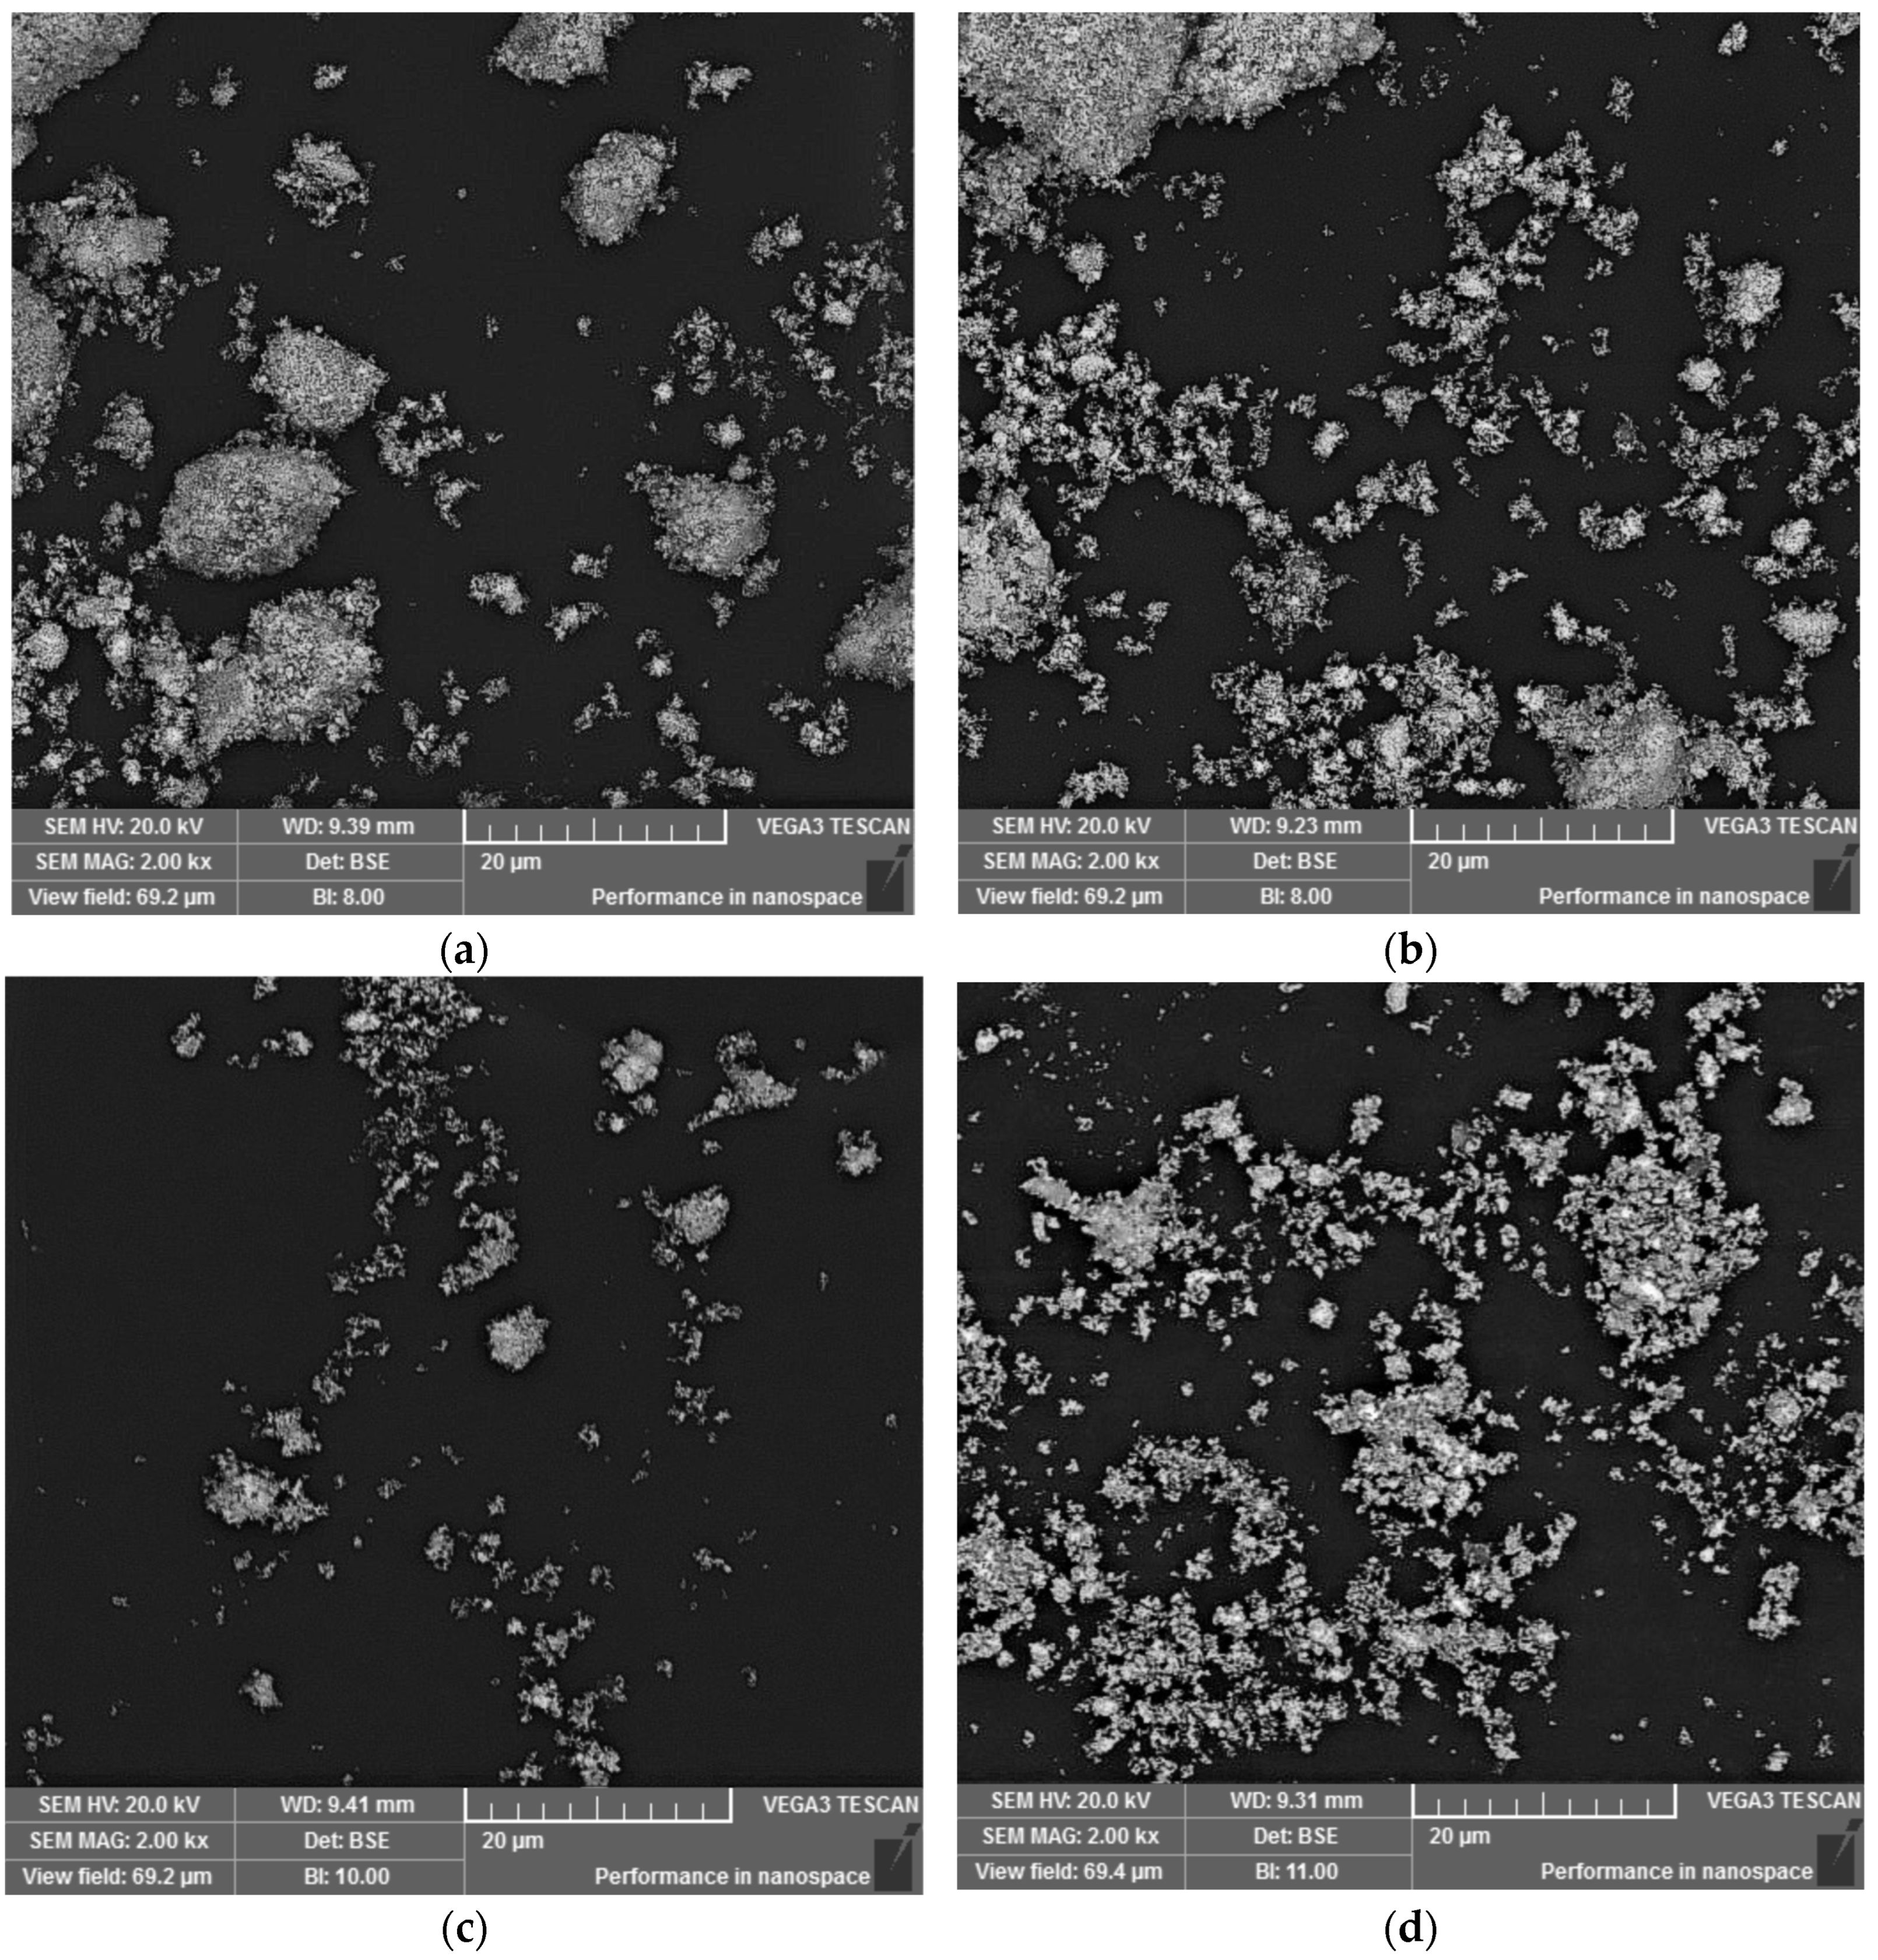
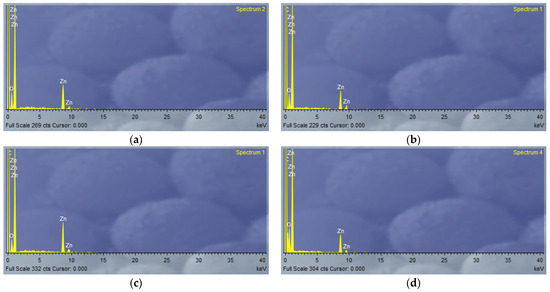
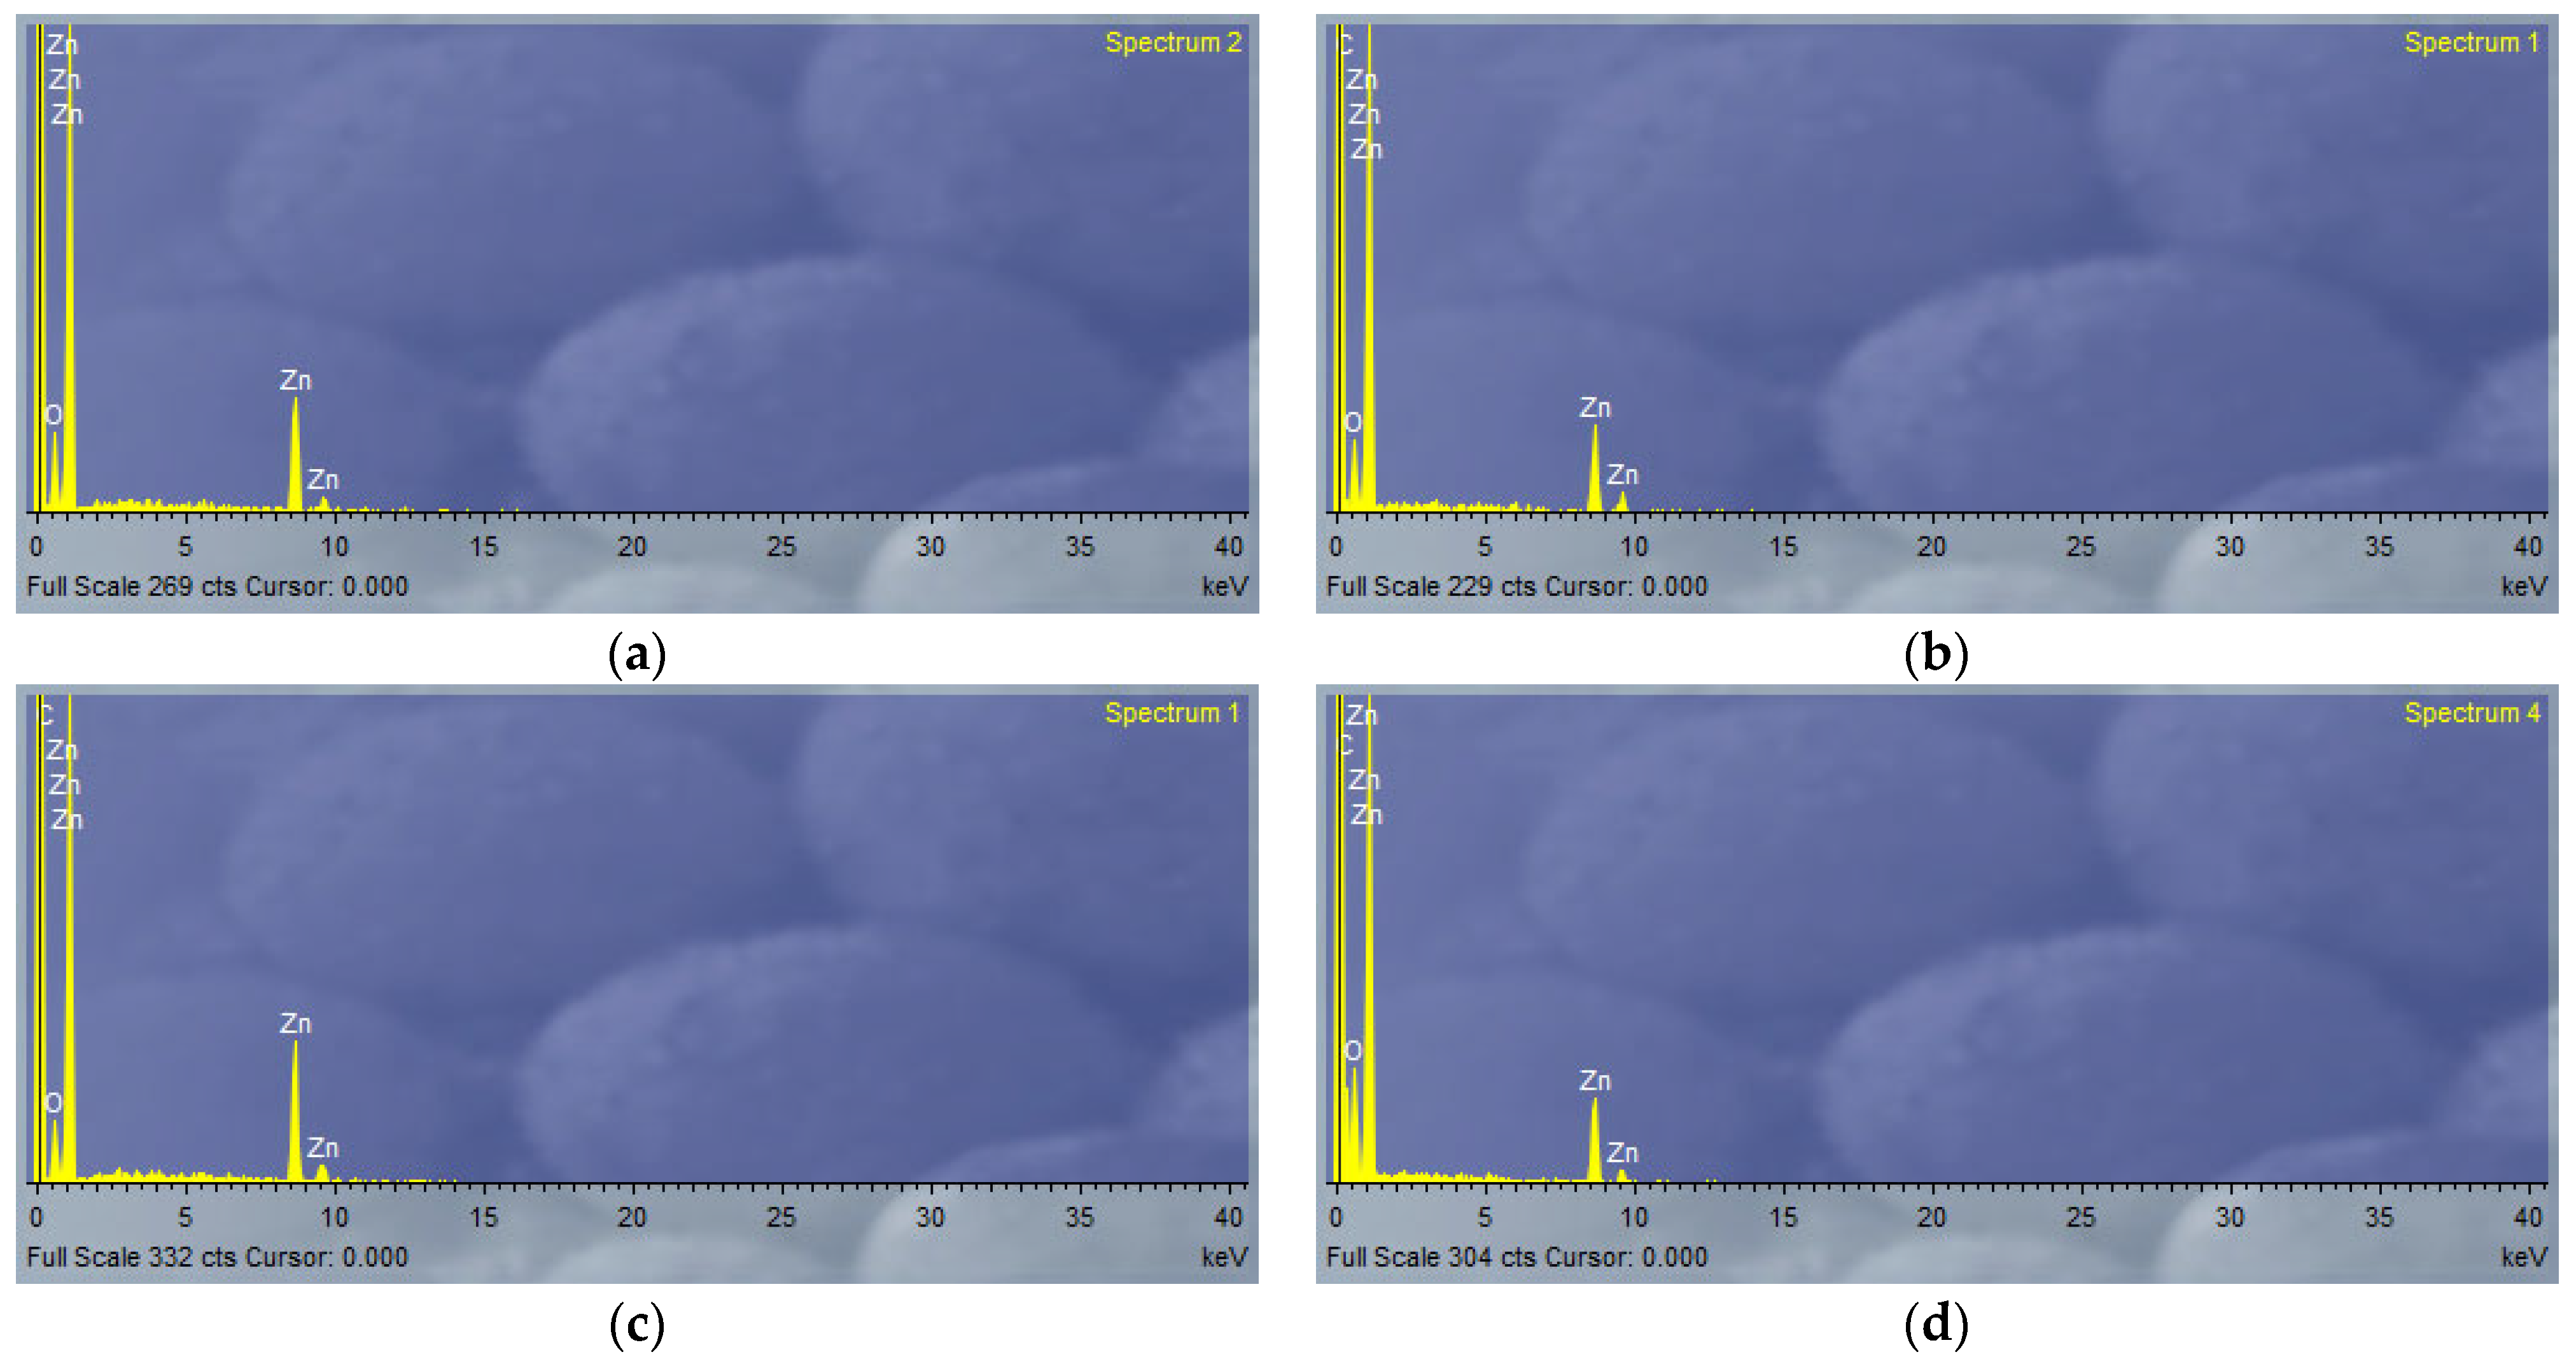
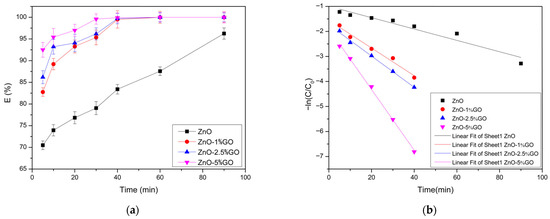
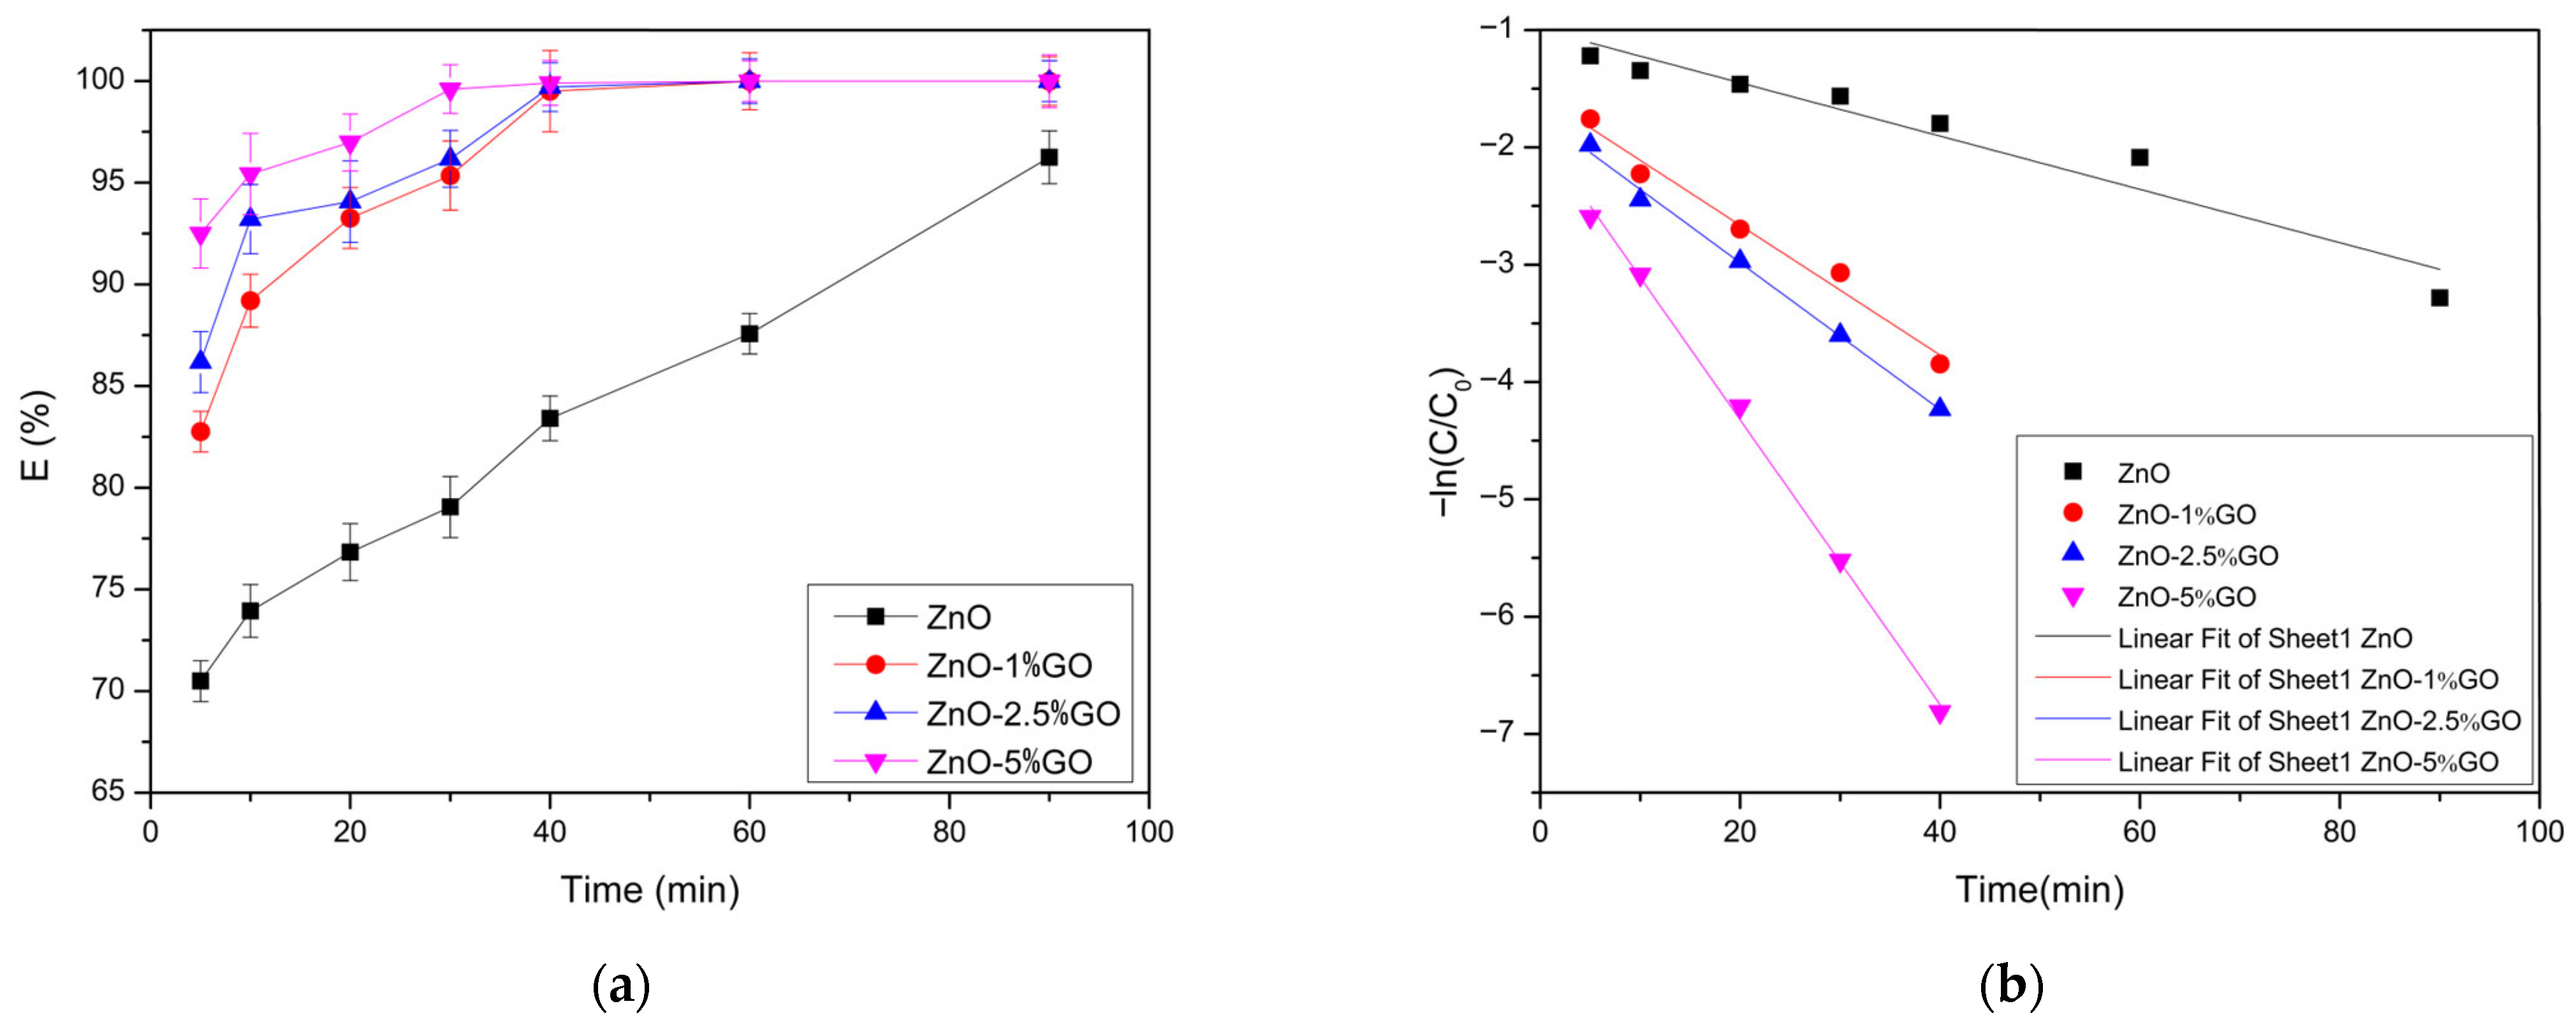
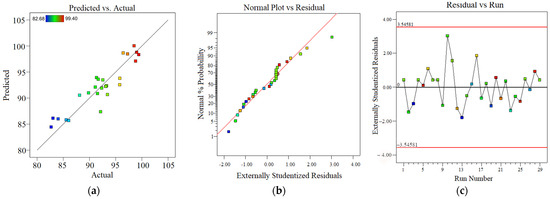
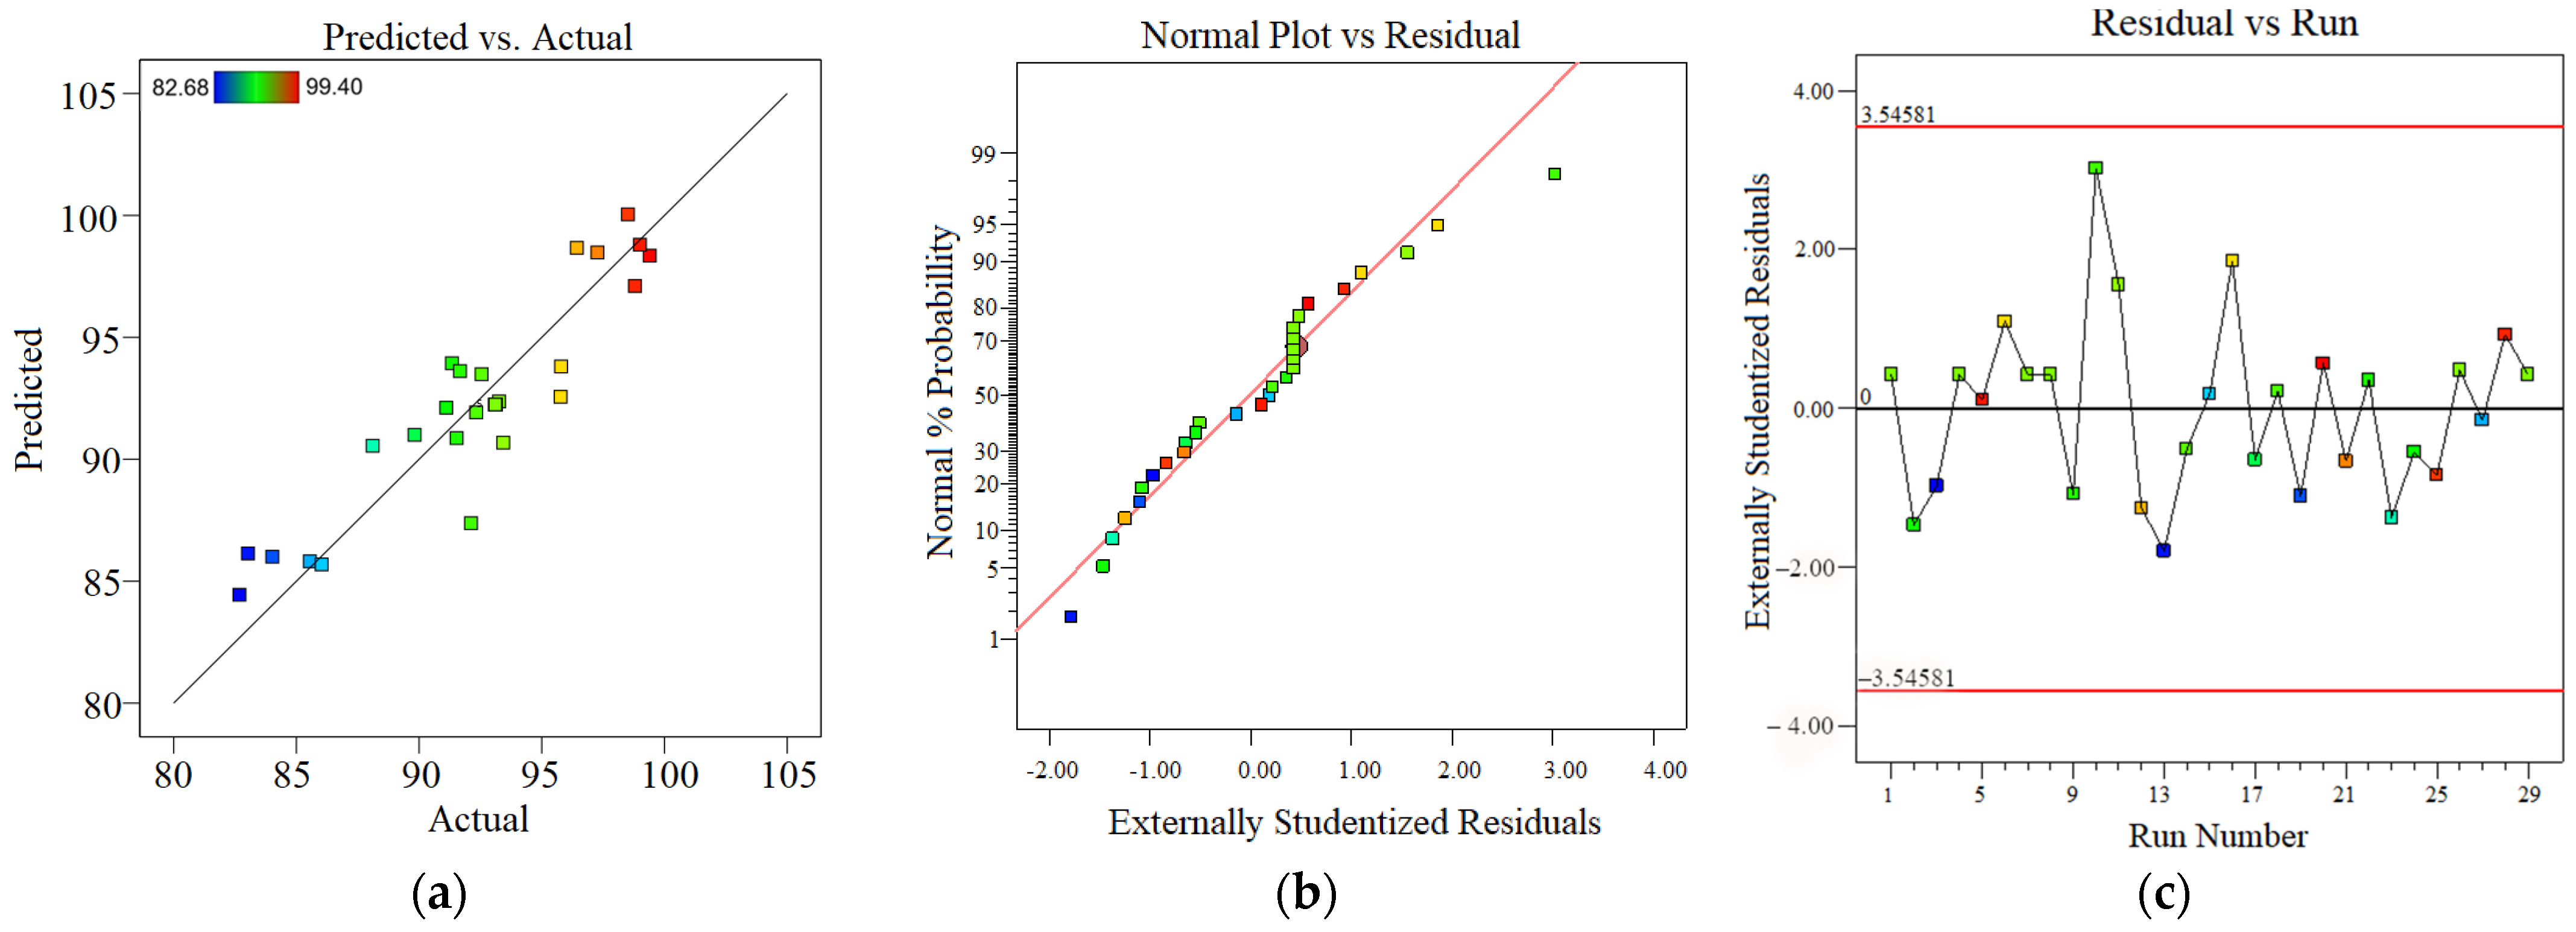
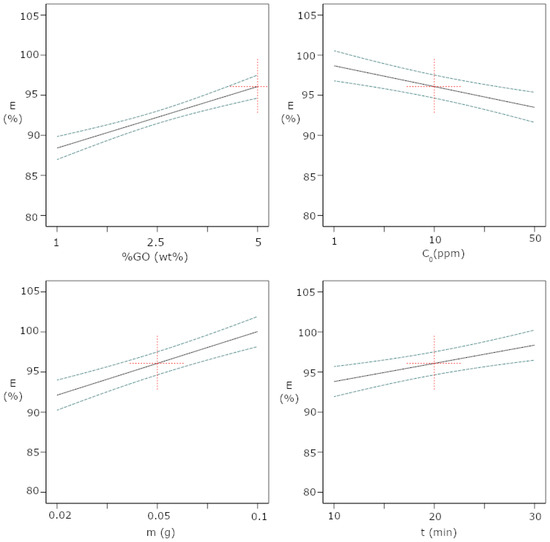
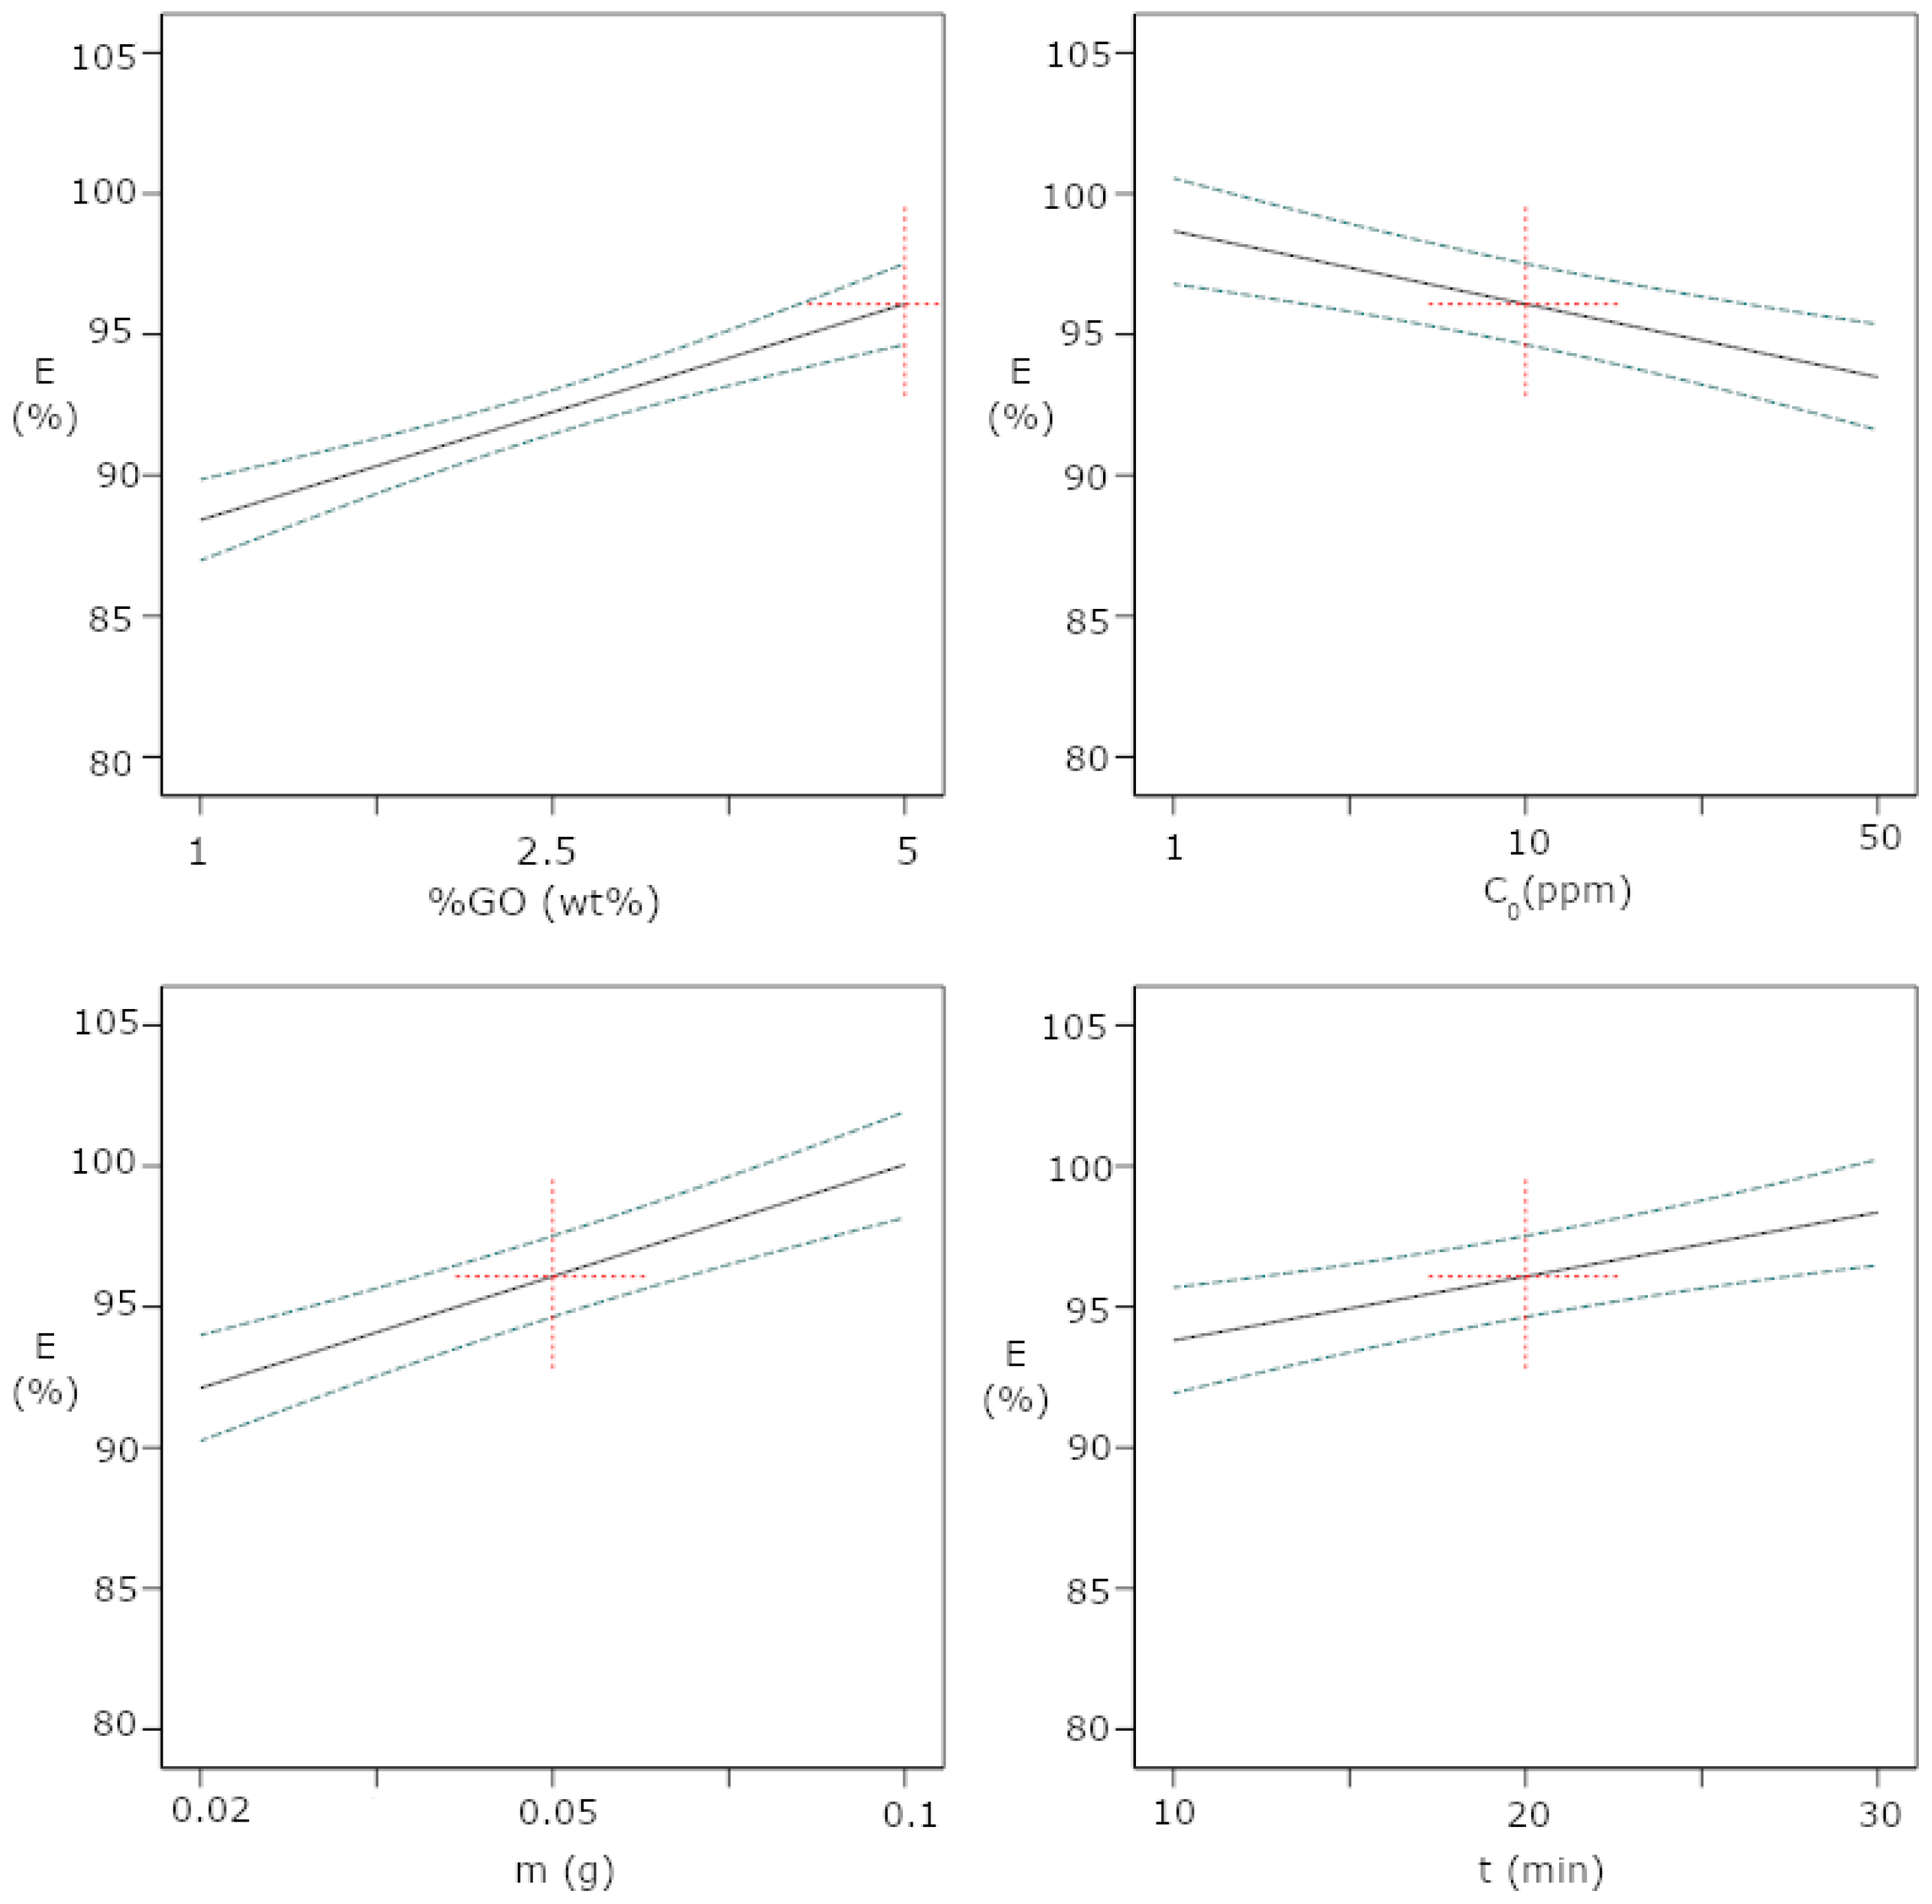
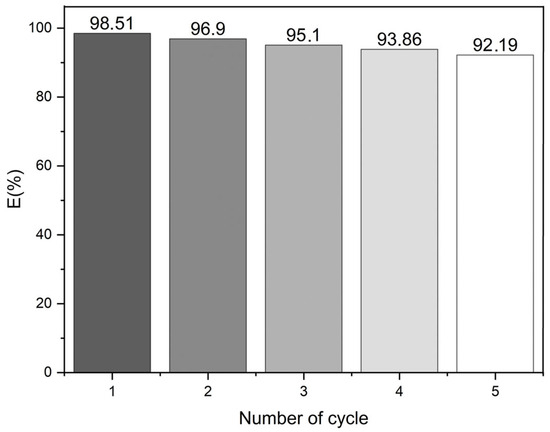
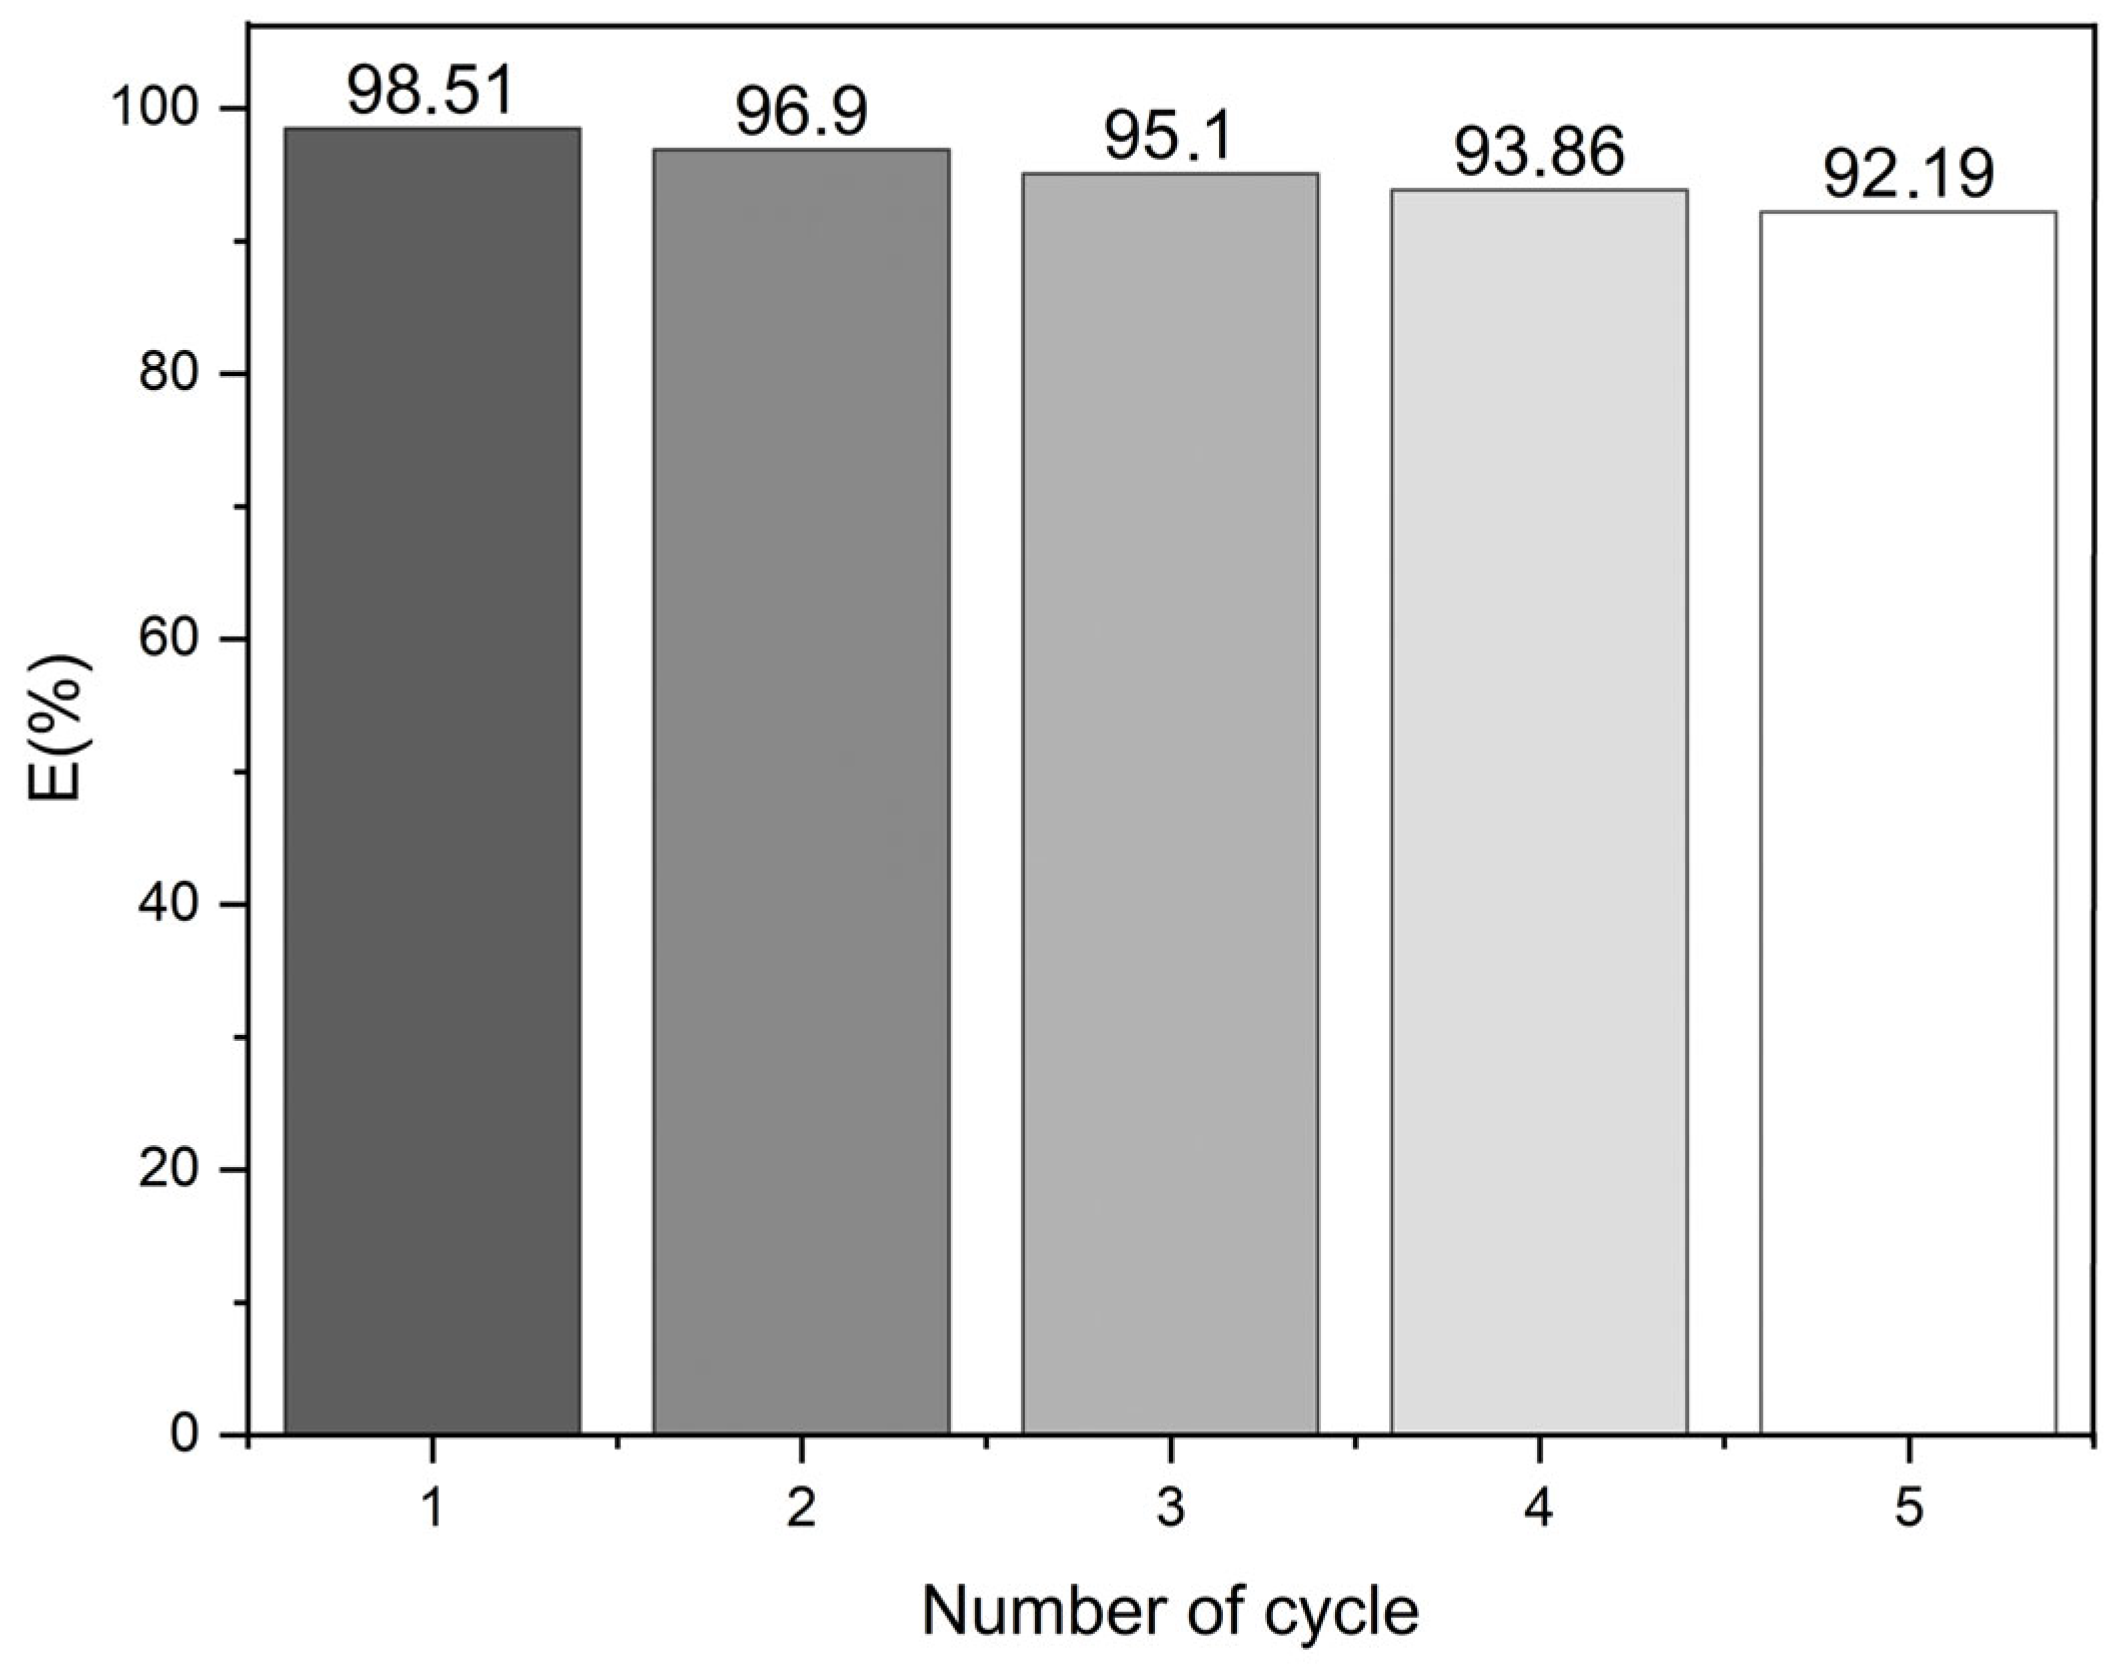

Disclaimer/Publisher’s Note: The statements, opinions and data contained in all publications are solely those of the individual author(s) and contributor(s) and not of MDPI and/or the editor(s). MDPI and/or the editor(s) disclaim responsibility for any injury to people or property resulting from any ideas, methods, instructions or products referred to in the content. |
© 2026 by the authors. Licensee MDPI, Basel, Switzerland. This article is an open access article distributed under the terms and conditions of the Creative Commons Attribution (CC BY) license.