


Abstract
Magnesium–lithium alloys are the lightest structural metals and offer high specific strength, good damping capacity, and excellent thermal conductivity; however, their limited room-temperature strength restricts wider engineering applications. In this study, friction stir processing (FSP) was applied to LA103Z magnesium–lithium alloy to modify its surface microstructure and mechanical properties. The effects of tool rotational speed and travelling speed on dynamic recrystallization behavior, grain refinement, and phase evolution in the stirred zone (SZ) and thermomechanically affected zone (TMAZ) were systematically investigated. FSP induced significant grain refinement accompanied by the precipitation of a reticular α-Mg phase along β-Li grain boundaries, as well as Li3Mg7 and Li2MgAl phases within the stirred zone, leading to pronounced strengthening. Under optimized processing conditions, substantial improvements in hardness and tensile properties were achieved compared with the base material. The optimal condition was obtained at 600 rpm and 100 mm/min, yielding an average hardness of 79.17 HV0.2, a tensile strength of 243.6 MPa, and an elongation of 17.9%, corresponding to increases of 47.5% in hardness and 53.3% in tensile strength. Quantitative relationships between heat input, grain size, and mechanical properties further demonstrate that heat input governs microstructural evolution and strengthening behavior during FSP of LA103Z alloy.
1. Introduction
Weight reduction is a key strategy for achieving energy savings and efficiency gains in aerospace, automotive, electronics, and medical equipment fields. Mg-Li alloys, as the lightest metallic structural materials, are regarded as highly promising future materials due to their exceptional specific strength, specific stiffness, damping properties, and electromagnetic shielding capabilities [1,2]. However, their relatively low absolute strength severely limits their application in critical components [3,4]. Therefore, developing efficient and reliable strengthening techniques for Mg-Li alloys has become an urgent necessity to broaden their engineering applications.
Although adding reinforcing phases through bulk alloying often reduces a material’s ductility and machinability, research focus has shifted toward post-processing techniques designed to enhance surface properties without affecting the bulk [5]. Common methods for manufacturing surface layers, such as surfacing, spraying, or re-melting with a laser beam, may introduce issues like thermal cracking, deformation, composition segregation, and reduced wear resistance. This has prompted researchers to explore alternative surface composite techniques [6,7,8].
Mishra et al. [9] proposed the friction stir processing (FSP) technique in 1999 based on the principles of friction stir welding. FSP is primarily used for microstructural modification of the near-surface layer of metal components, capable of altering and enhancing the mechanical properties of the base metal to a certain extent [10,11]. Liu et al. [12] enhanced the strength of Mg-9Li-1Zn alloy to 252 MPa and increased its elongation to 31.9% through FSP, while also improving its corrosion resistance. Che et al. [13] observed that after FSP of a duplex Mg-Li alloy, the β-Li phase grains were refined to approximately 7.5 μm. Minor Li3Mg7, Li2MgAl, and AlLi precipitates were present in the stirred zone (SZ), and the average hardness of SZ increased from 61.5 HV to 67.8 HV.
Friction stir processing has evolved into a versatile manufacturing tool for microstructural modification, composite fabrication, and defect remediation in metallic materials [14]. Bobbin-tool FSP has been successfully used to produce bulk aluminum-based composites with refined crystallite size and enhanced mechanical properties, such as AA1050 reinforced with nano-silica fume [15]. Statistical approaches, including response surface methodology, have enabled systematic optimization of FSP parameters and tool geometries, revealing strong correlations between process parameters, heat input, microstructure, and mechanical performance [16]. Recent studies also show that FSP effectively refines primary silicon particles and dendritic structures in as-cast Al-Si alloys, significantly improving their mechanical properties, thereby providing a strong basis for extending these principles to Mg-Li alloys [17,18].
In FSP, the tool exerts immense shear forces on the surface layer metal, inducing severe plastic deformation. The high temperature gradient generated by friction between the matrix metal and the tool shoulder synergistically promotes recrystallization mechanisms [19]. Jiang et al. [20] investigated the texture of LZ91 alloy processed by underwater FSP and found that FSP promoted the initiation of prismatic slip or tensile twinning in the α-Mg phase, while typical recrystallization texture appeared in the β-Li phase. The recrystallization mechanism refined grains while increasing grain boundary area in the alloy, thereby promoting grain boundary sliding [21]. Cao et al. [22] prepared the Mg-Li alloy LAZ822 with a maximum elongation to failure of 489.5% via FSP. Zhou et al. [23] obtained a Mg-Li alloy with average grain sizes of ~0.61 μm (α phase) and ~0.96 μm (β phase) through FSP, and an excellent superplasticity from 369% to 1104% was obtained at 473 K. Liu et al. [24] employed underwater FSP at a 400 rpm rotational speed and a 50 mm/min travelling speed to refine the α-Mg and β-Li phases in Mg-9.93Li-3.06Al-1.49Zn alloy to approximately 1.6 μm and 6.8 μm, respectively. The processed alloy exhibited outstanding low-temperature superplasticity.
Process parameters play a critical role in shaping the microstructure and resulting properties of Mg-Li alloys during processing. Identifying and optimizing these parameters allows the alloy to develop improved structural characteristics and mechanical performance, expanding the potential use of Mg-Li alloys in a wide range of engineering applications [25,26]. In practice, the processing quality and strengthening effect are primarily related to the rotational speed and travelling speed of the tool. Jiang et al. [20] investigated the effect of rotational speed on a duplex Mg-Li alloy, finding that higher rotational speeds cause significant recrystallization and grain growth, with pronounced recrystallization texture appearing in the β-Li phase. Research by Chen et al. [27] showed that while FSP enhances the strength of Mg-9Li-2Al-1Zn, it simultaneously reduces its plasticity and room-temperature impact resistance.
Recent studies on FSP of Mg-Li alloys have demonstrated its potential to refine grains, increase strength, and promote superplastic behavior [28,29]. However, most existing work [30,31] focuses on the outcomes obtained under a limited set of processing conditions, such as fixed rotational or travel speeds. As a result, there is still no comprehensive understanding of how processing parameters influence microstructure and mechanical properties in a systematic manner. This gap is particularly evident for rotational speed and travel speed, the two most influential dynamic parameters in FSP. Their combined effects on phase evolution, texture development, and overall performance of dual-phase Mg-Li alloys remain insufficiently explained. Without clear insight into these mechanisms, process optimization lacks a robust theoretical basis, which limits both standardization and broader adoption of FSP for Mg-Li alloys.
Accordingly, this paper investigated the dual-phase LA103Z Mg-Li alloy using a systematic series of FSP experiments. The effects of rotational speed and travelling speed on microstructural evolution and mechanical performance in the processed zone were examined in detail. By correlating microstructure with property changes, the study clarified the mechanisms through which FSP strengthened Mg-Li alloys and provided the experimental evidence and theoretical basis needed for process optimization and practical implementation of FSP in LA103Z.
2. Materials and Methods
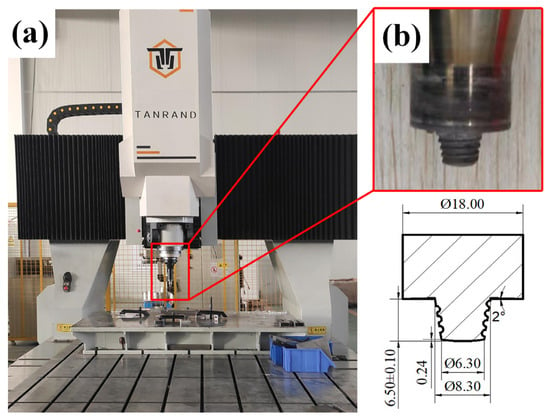
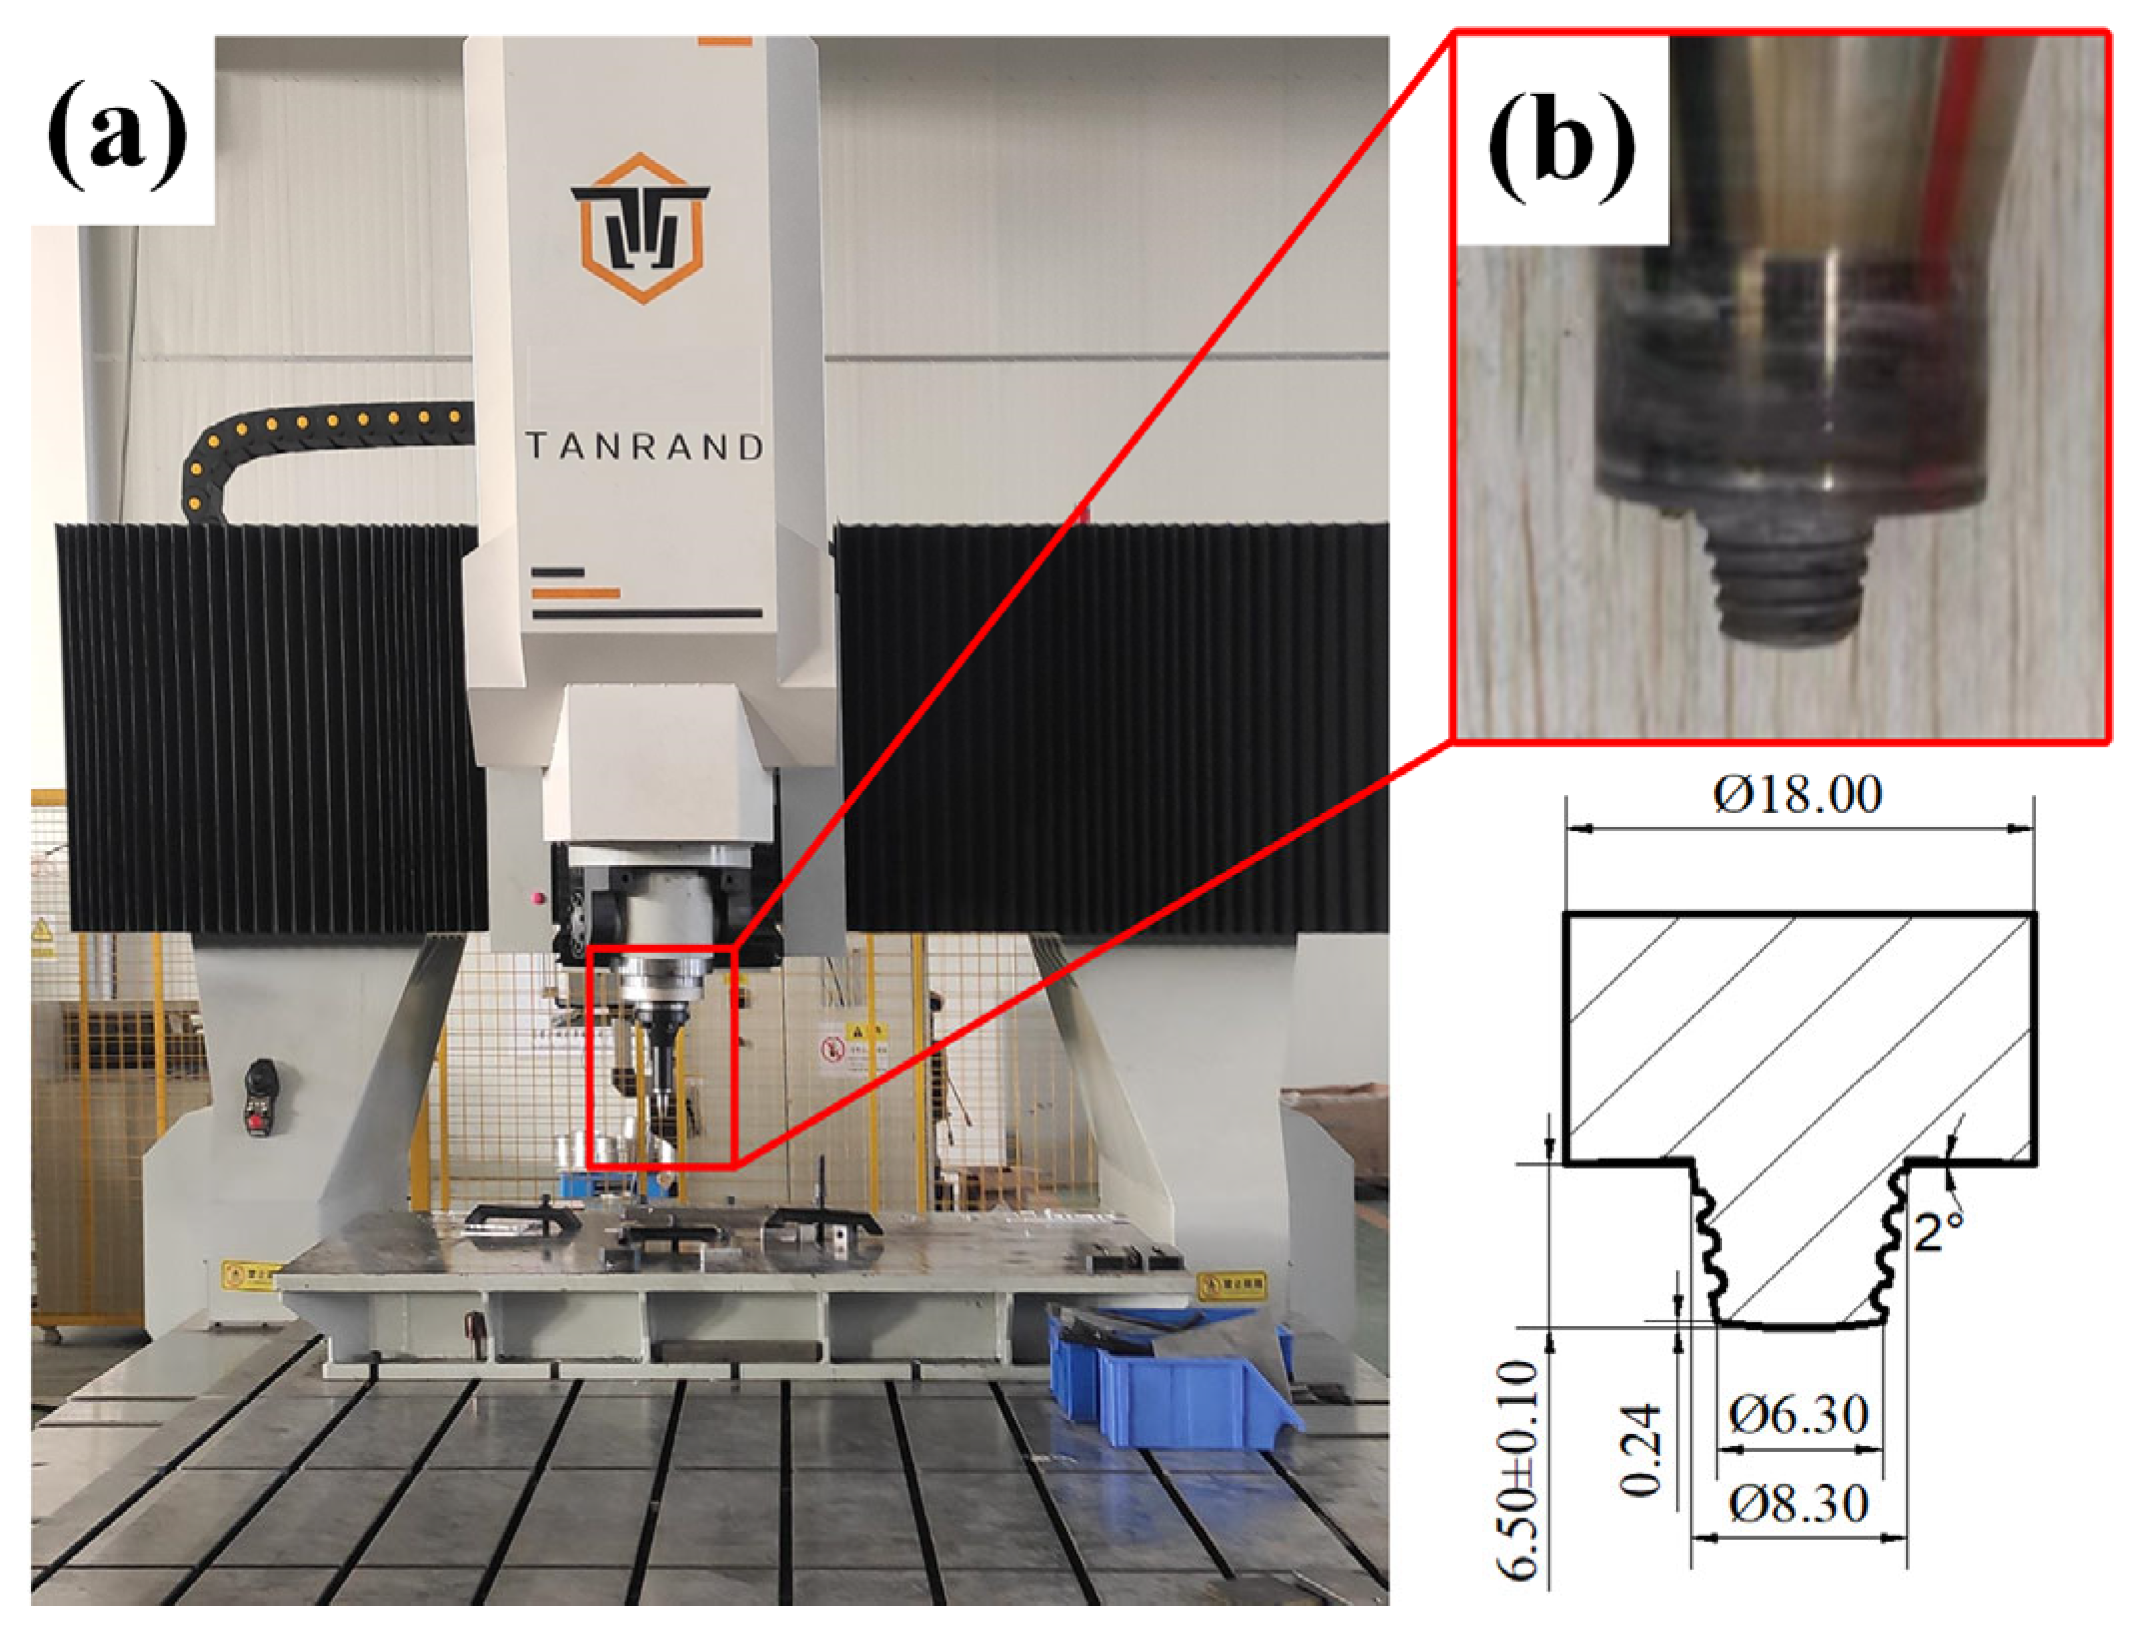
The material used in this paper was LA103Z magnesium–lithium alloy rolled plate, with dimensions of 200 × 200 × 7 mm3. FSP experiments were conducted on the TR-FSW-M200 mobile gantry-type friction stir welding machine produced by Beijing Tanrand New Materials Technology Co. in Beijing, China, as shown in Figure 1a. The processing equipment was controlled by a CNC program, enabling precise regulation of both the tool’s rotational speed and travelling speed.
Figure 1.
(a) Gantry-type friction stir welding machine. (b) The tool and its size (unit: mm).
The tool used in FSP was conical with threads, as shown in Figure 1b. The shoulder diameter of the tool shaft was 18 mm. The pin length was 6.5 mm, with a large end diameter of 8.3 mm and a small end diameter of 6.3 mm. During machining, the tool inclination angle was set to 2.5° to prevent tunnel-type defects. The plunge depth of the tool during machining was set to 0.2 mm.
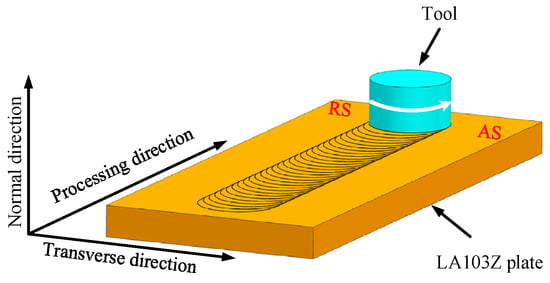
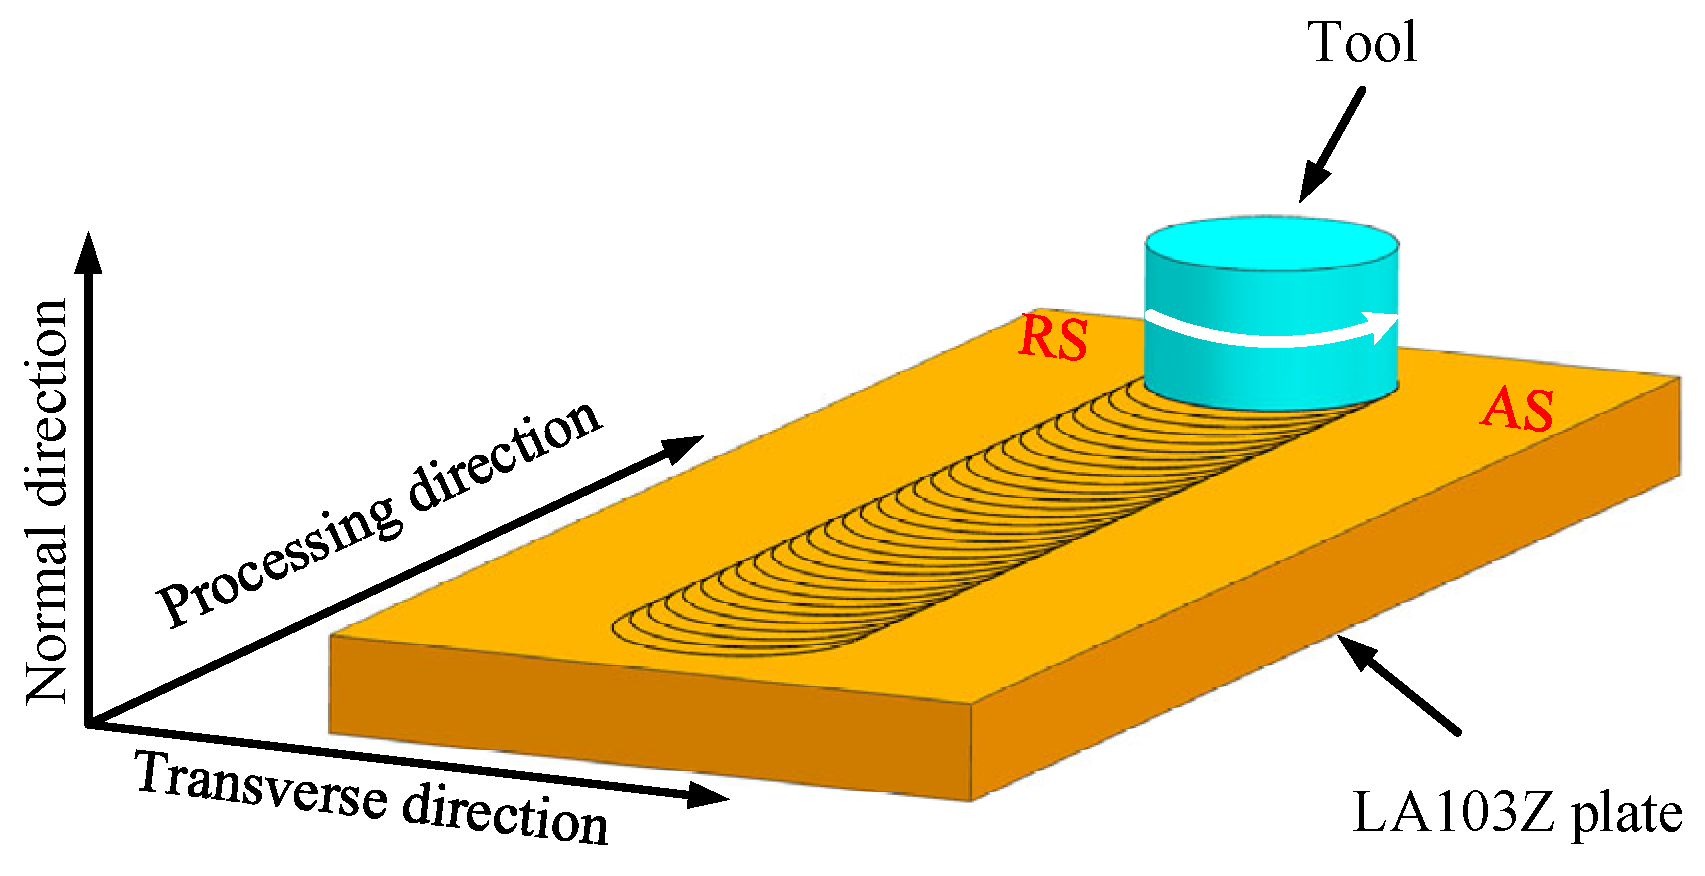
Figure 2 illustrated a single-pass stir friction processing operation. The tool rotated counterclockwise, with the side aligned with the rotation direction and travel direction designated as the advancing side (AS), and the opposite side as the retreating side (RS). The direction perpendicular to the processing direction was denoted as the transverse direction, and the thickness direction as the normal direction.
Figure 2.
Schematic diagram of single-pass FSP.
During processing, the heat input of the tool was primarily governed by the tool rotational speed and travelling speed [32,33]. Higher rotational speeds and lower travelling speeds lead to increased frictional heating and higher processing temperatures. The selection of the process parameter window in this paper was based on a combination of reported parameter ranges for Mg-Li alloys, preliminary trials, and practical processing constraints. Preliminary experiments indicated that rotational speeds below 300 rpm produced insufficient heat input, resulting in unstable material flow and incomplete stirring, whereas rotational speeds above 600 rpm caused excessive heat generation, surface scorching, and incipient defects in the Mg-Li alloy sheet. Therefore, a rotational speed range of 300–600 rpm was identified as a stable and suitable processing window for the present material and tool configuration. Within this window, representative rotational speeds of 300, 400, and 600 rpm were selected to characterize low-, intermediate-, and high-heat input conditions, respectively. The tool was traversed along the rolling direction of the plate, and travelling speeds of 50, 100, and 200 mm/min were chosen using the same rationale. Table 1 summarizes the experimental design.
Table 1.
Processing parameters of FSP.
After FSP, metallographic specimens were prepared along the transverse direction according to ASTM E3 standard [34]. Following mechanical polishing, specimens were etched using a metallographic etchant (14 mL anhydrous ethanol + 2 mL glacial acetic acid + 1 g picric acid). The surface morphology and microstructure of the specimen cross-sections were observed using an optical microscope.
After ion polishing on a IB-19530CP polisher produced by JEOL Ltd., Tokyo, Japan, EBSD characterization was performed using a JSM-7800F field emission scanning electron microscope produced by JEOL Ltd., Tokyo, Japan. The scanning area was 400 × 400 μm2 with a scan step of 0.8 μm. Approximately 80% of the collected patterns were successfully indexed.
Sheet materials were cut into 15 × 15 × 2 mm3 specimens. Test surfaces were ground with sandpaper to achieve parallel and smooth upper and lower planes before testing. XRD phase analysis of pre- and post-processed sheets was performed using a DMAX-2500PC X-ray diffractometer developed by Rigaku Corporation, Tokyo, Japan. The testing angle range was 20–90°, with a scanning speed of 5°/min. XRD phase composition was analyzed using Jade Standard software of Materials Data, Inc., Livermore, CA, USA.
Microhardness testing employed an HVS-1000A micro Vickers hardness tester in accordance with ASTM E384 [35] using a load of 0.2 kgf and a dwell time of 15 s, produced by Jinan Fangyuan Laboratory Instruments Co., Ltd. in Jinan, China. Measurements were taken at five points in different locations, with the average value serving as the final hardness result. Test points were selected within the tool influence zone of the sheet after FSP, spaced at 0.5 mm intervals along both the transversal and normal directions, for a total of 37 × 13 test points. Following testing, a microhardness distribution cloud diagram and hardness distribution curve were plotted.
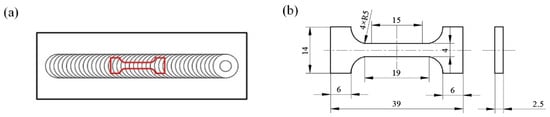
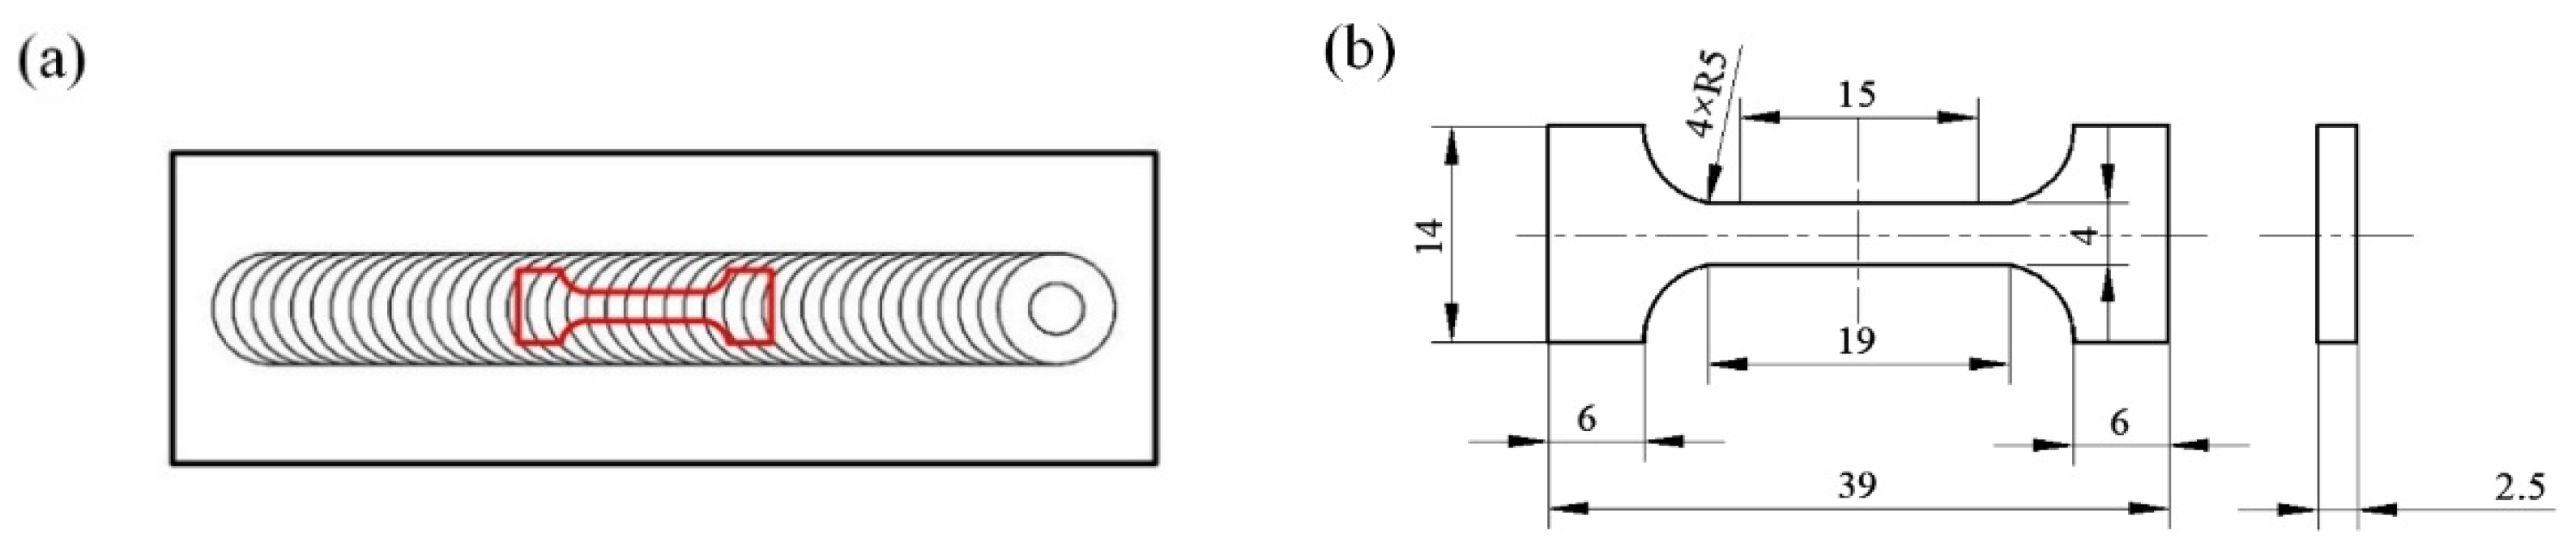
For tensile testing, specimens were prepared along the processing direction at the thickness center, as shown in Figure 3. Room-temperature tensile tests were conducted at room temperature in accordance with ASTM E8/E8M [36], using a universal tensile testing machine at a strain rate of 1 × 10⁻³ s−1. Each test series was repeated three times, and the average value was taken. After tensile testing, the fracture surfaces of the specimens were examined using a Model SU-70 field emission scanning electron microscope, produced by Hitachi in Tokyo, Japan.
Figure 3.
(a) Schematic diagram of sampling for tensile testing; (b) size of tensile sample (unit: mm).
3. Results and Discussion
3.1. Surface Morphology
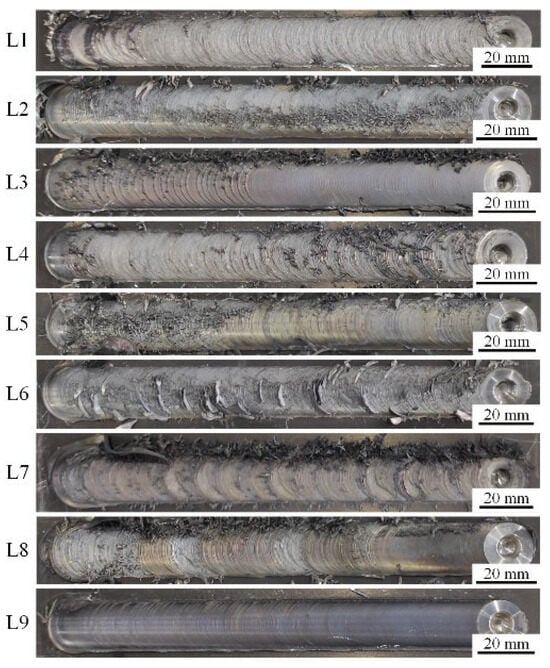
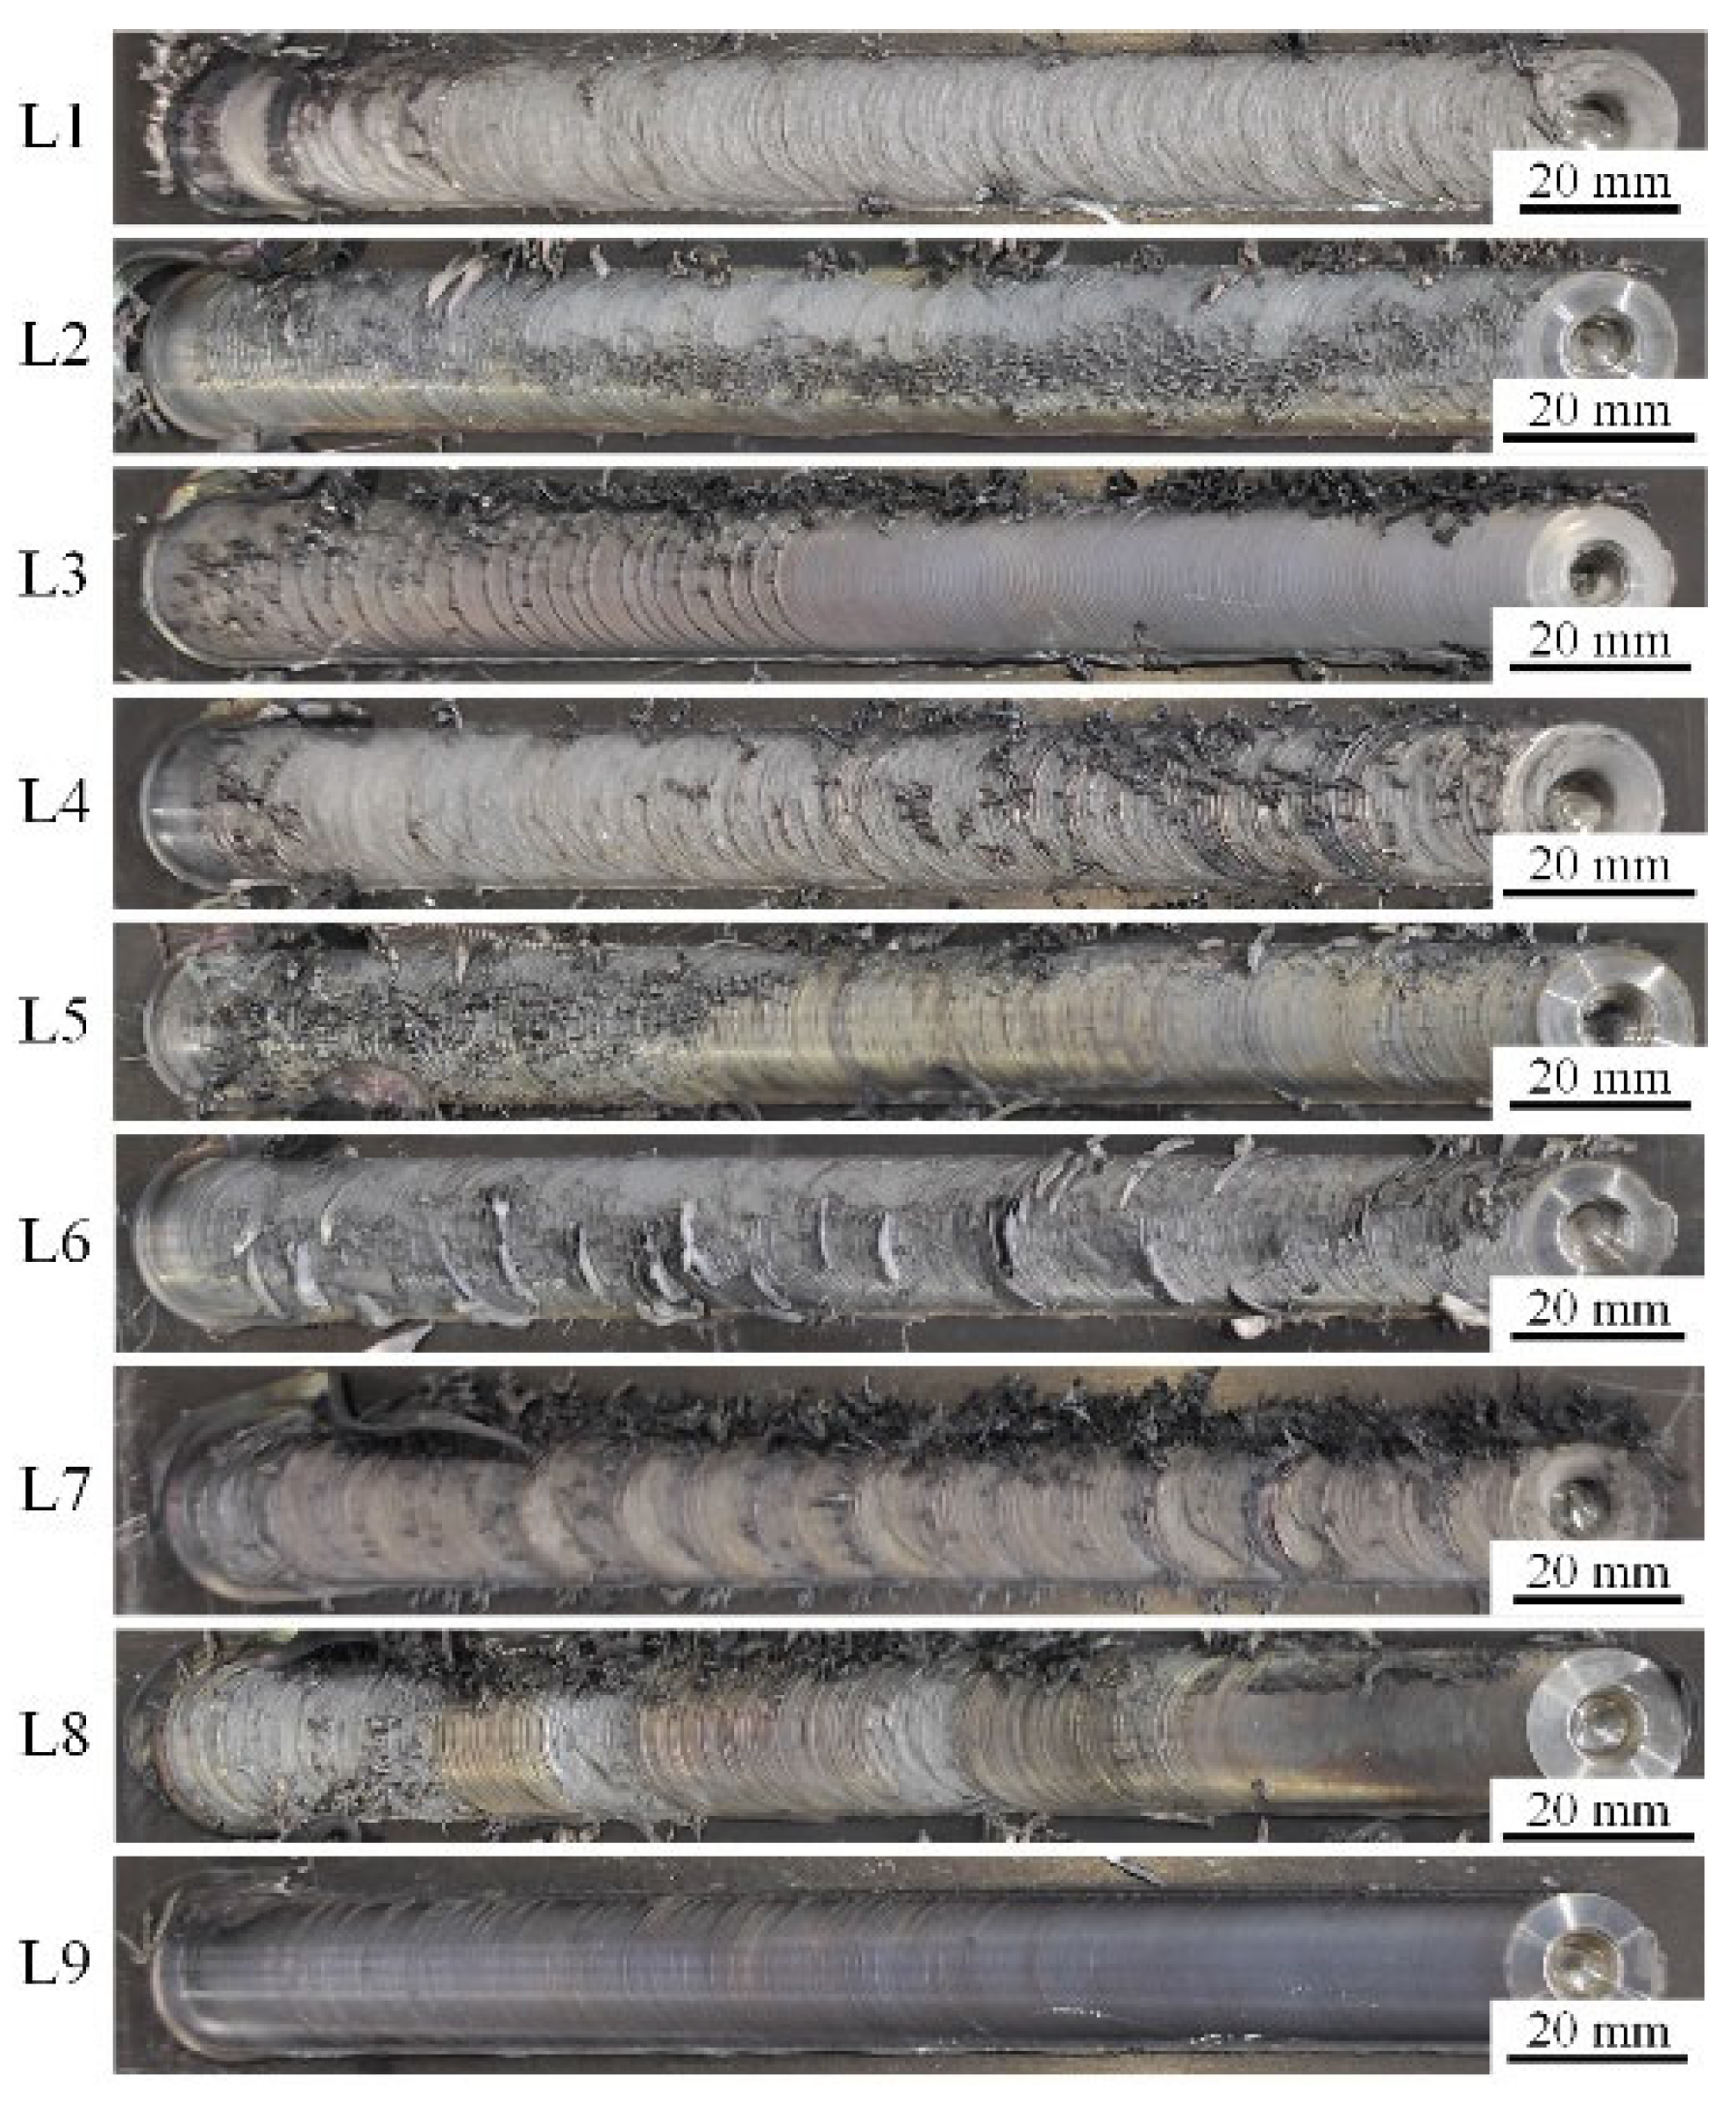
Figure 4 showed the upper surface morphology of the LA103Z plate after FSP. All process parameters resulted in plate surfaces with no obvious defects and good surface morphology. While maintaining constant tool inclination angle and downward pressure, different process parameters exerted varying effects on the sheet surface morphology. At low heat input, poor material flowability prevented adequate flow under stirring action, resulting in a rough surface (as shown in L3). At high heat input, accumulated heat in the surface layer led to overheating and rapid oxidation of the surface material. Simultaneously, the surface layer material was squeezed off by the shoulder during processing, causing peeling on the finished surface (as shown in L7). When process parameters were appropriate, a relatively flat surface with good surface quality was achieved after processing (as shown in L9).
Figure 4.
Surface of the plate after FSP.
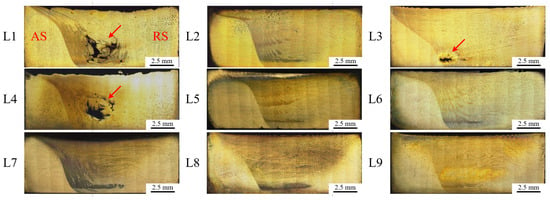
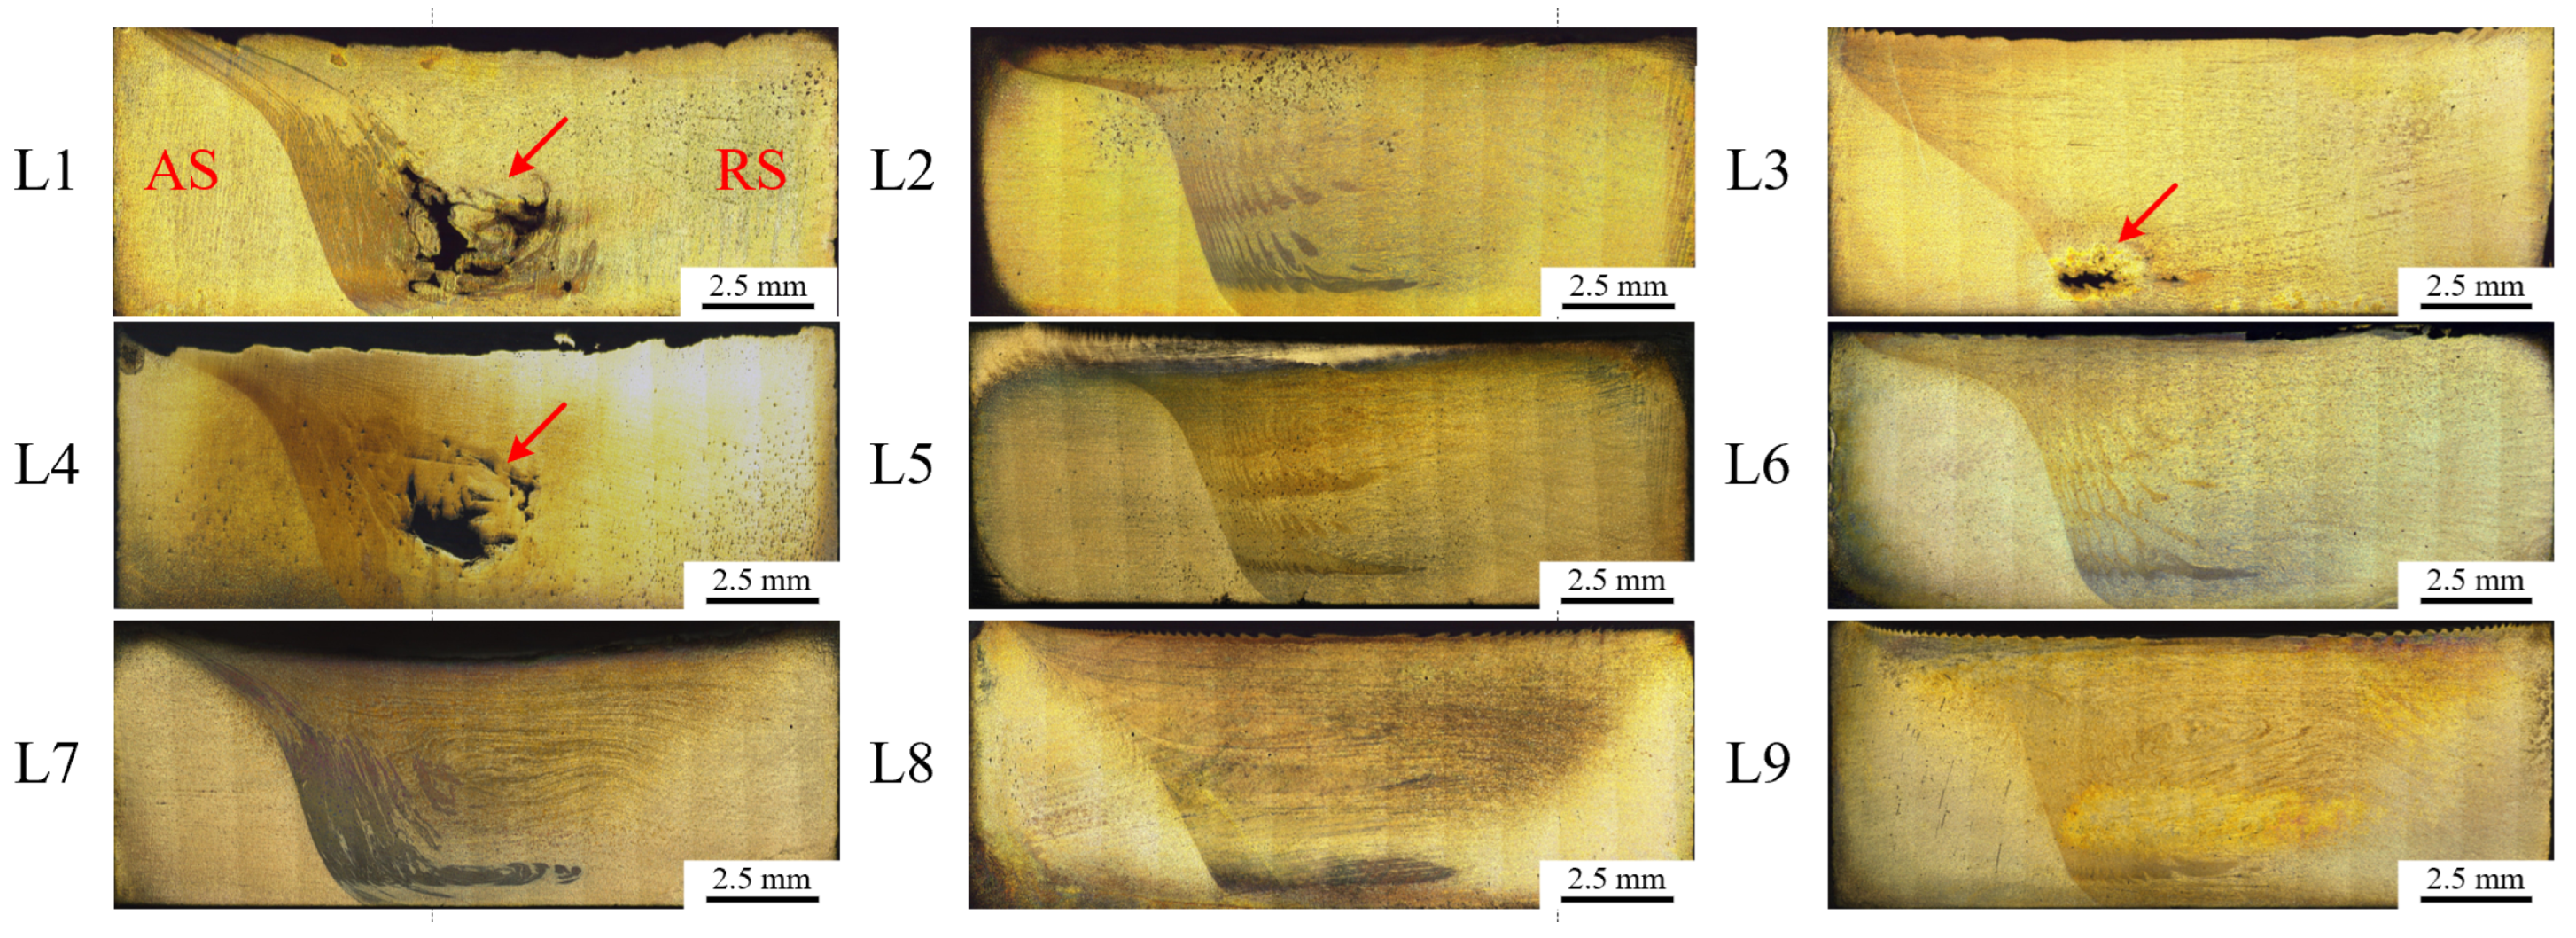
Figure 5 shows the cross-sectional morphology of the sheet. It was evident that the area of SZ varied with different processing parameters. When the tool’s rotational speed increased or its travel speed decreased, the SZ area correspondingly expanded. This occurred because the increased heat input led to a larger softened area within the material, enabling the tool to agitate more material and thereby creating a relatively larger SZ.
Figure 5.
Macroscopic morphology of the plate cross-section after FSP.
L1 and L4 were the processing results at rotational speeds of 300 and 400 rpm, respectively, with a travelling speed of 50 mm/min. Noticeable defects were present in the mixing zone. This occurred because the material could not flow in time to fill the cavity left by the tool, resulting in macroscopic defects in the processed plate. In L3 (300-200), material struggled to flow under the tool’s action with its lower heat input, particularly in the middle and lower sections of the mixing zone. Due to the reduced heat input at the shaft shoulder, the material temperature in the lower part of the plate remained relatively low. Consequently, the material on the RS failed to promptly fill the cavity, forming tunnel-type defects.
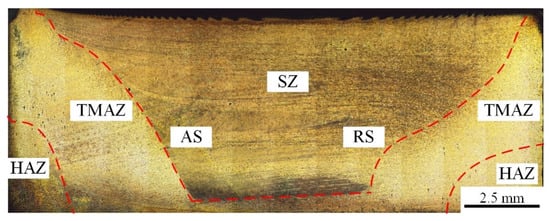
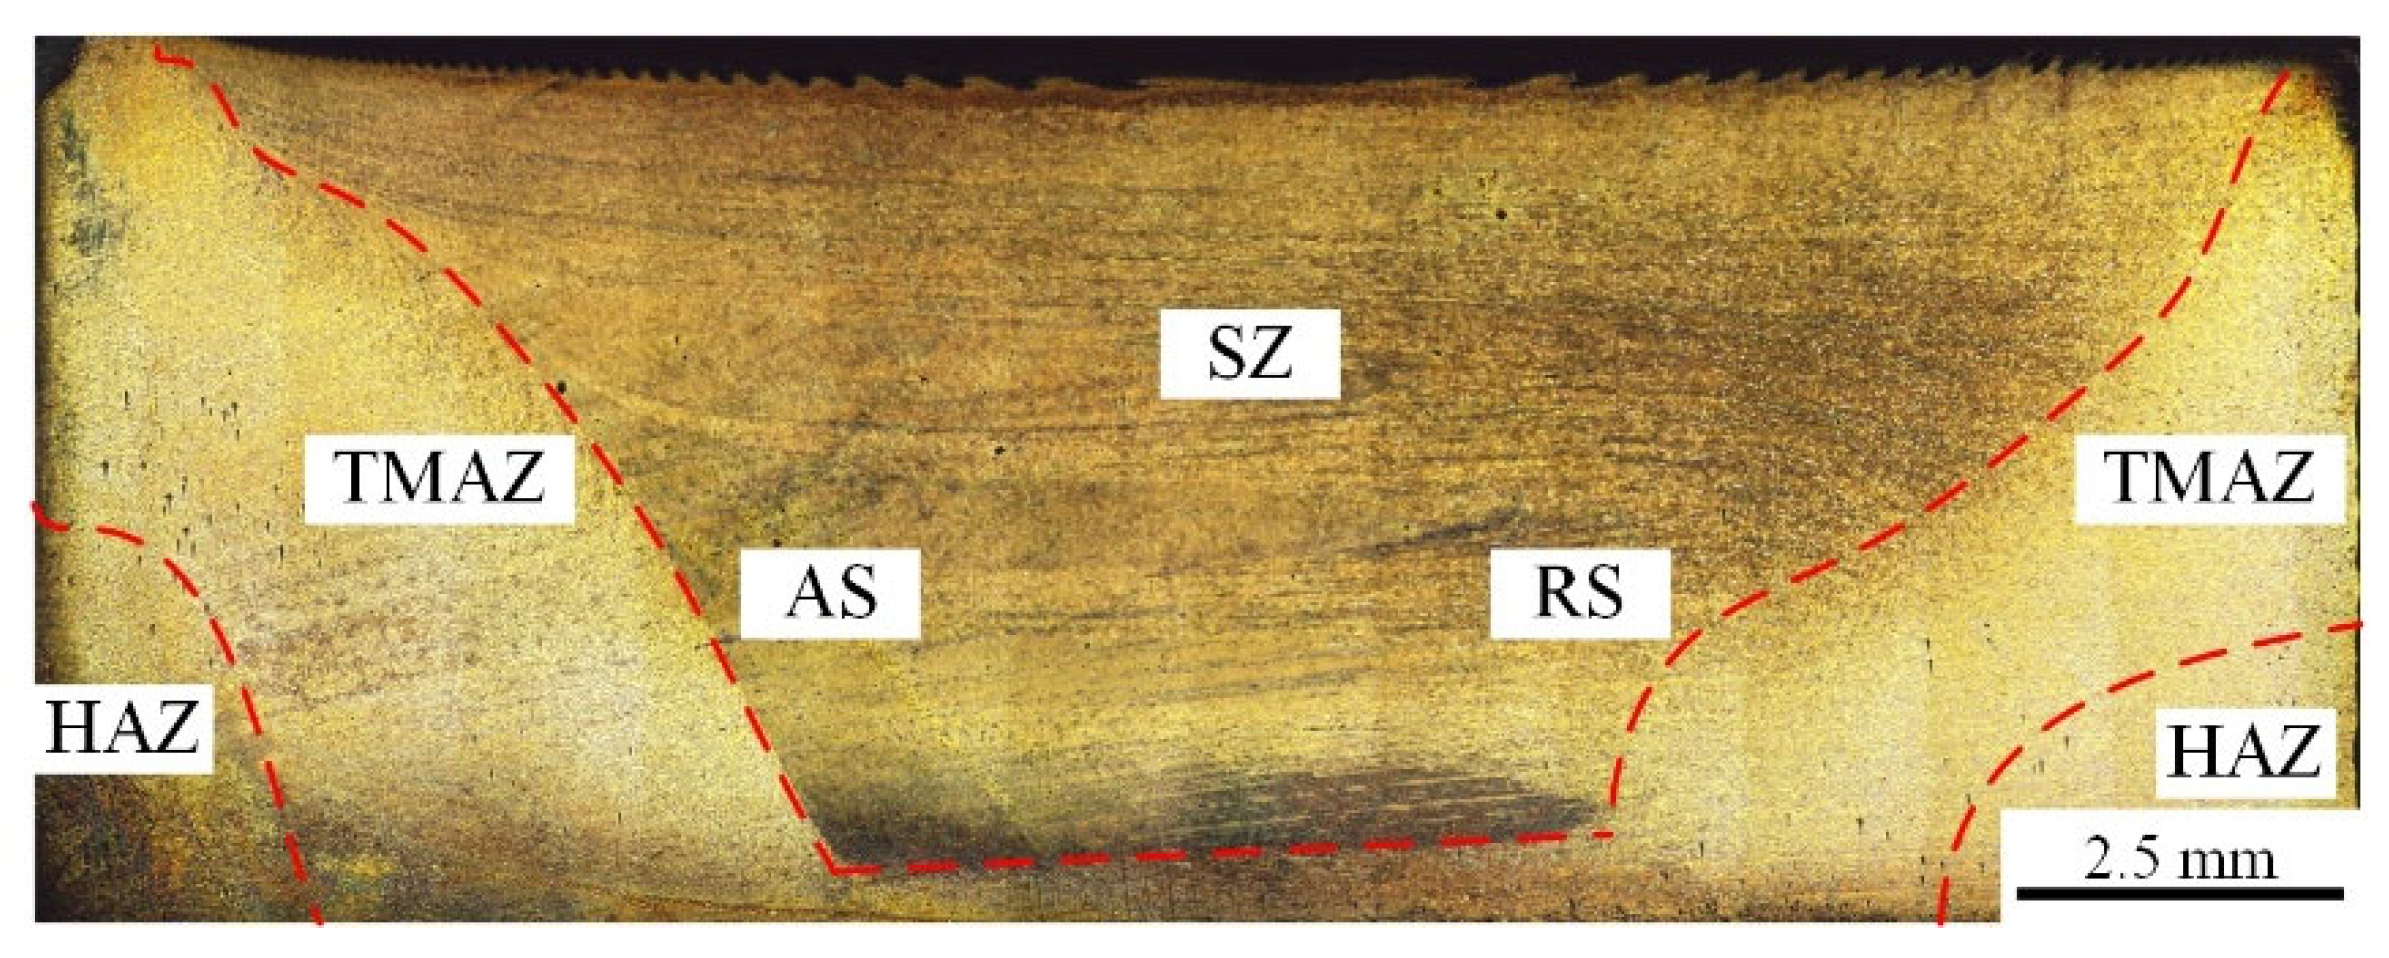
Taking L8 (600-100) as an example, as shown in Figure 6, three distinct zones were observed within the FSP region: the stirred zone (SZ), the thermomechanically affected zone (TMAZ), and the heat-affected zone (HAZ). The shape of SZ differed from that of the tool, exhibiting a bowl-like configuration. This occurred because the upper portion of SZ was subjected to combined contact friction and heat generation from both the shoulder and the tool, driving material deformation. Conversely, the lower portion of SZ was only driven by the smaller end of the tool, causing the material to move. Consequently, the SZ assumed a bowl-shaped configuration rather than the conical shape matching the tool.
Figure 6.
Processing partition of the plate cross-section in L8 (600-100).
A distinct interface existed between the AS and the TMAZ, whereas the boundary between the two became less defined on the RS. This primarily resulted from differential metal flow on either side of the tool during processing, leading to variations in microstructural characteristics [22]. On the AS, material within the HAZ was propelled forward by the tool, moving in the same direction as its advance. As the tool moved forward, a cavity formed behind it. Material from the SZ was squeezed into this cavity by the tool, flowing in the opposite direction to the tool’s motion. This resulted in opposing flow directions between the SZ and the HAZ, creating significant differences in flow direction and velocity between the two regions. This generated intense shear forces between the materials, forming a distinct interface between them.
On the RS, the tool drove materials in the TMAZ backward, opposite to its forward direction. Simultaneously, materials in the SZ were squeezed and propelled by the tool to fill the cavity behind it, also flowing against the tool’s movement. Consequently, the material flow directions in the SZ and TMAZ were identical, differing only in velocity. Shear forces between materials were significantly reduced, resulting in a less distinct interface between these two zones.
3.2. Microstructure
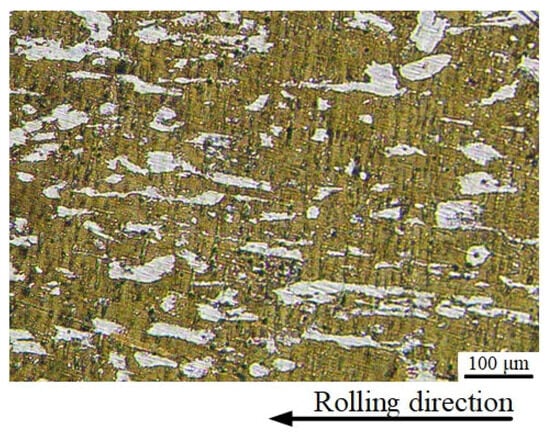
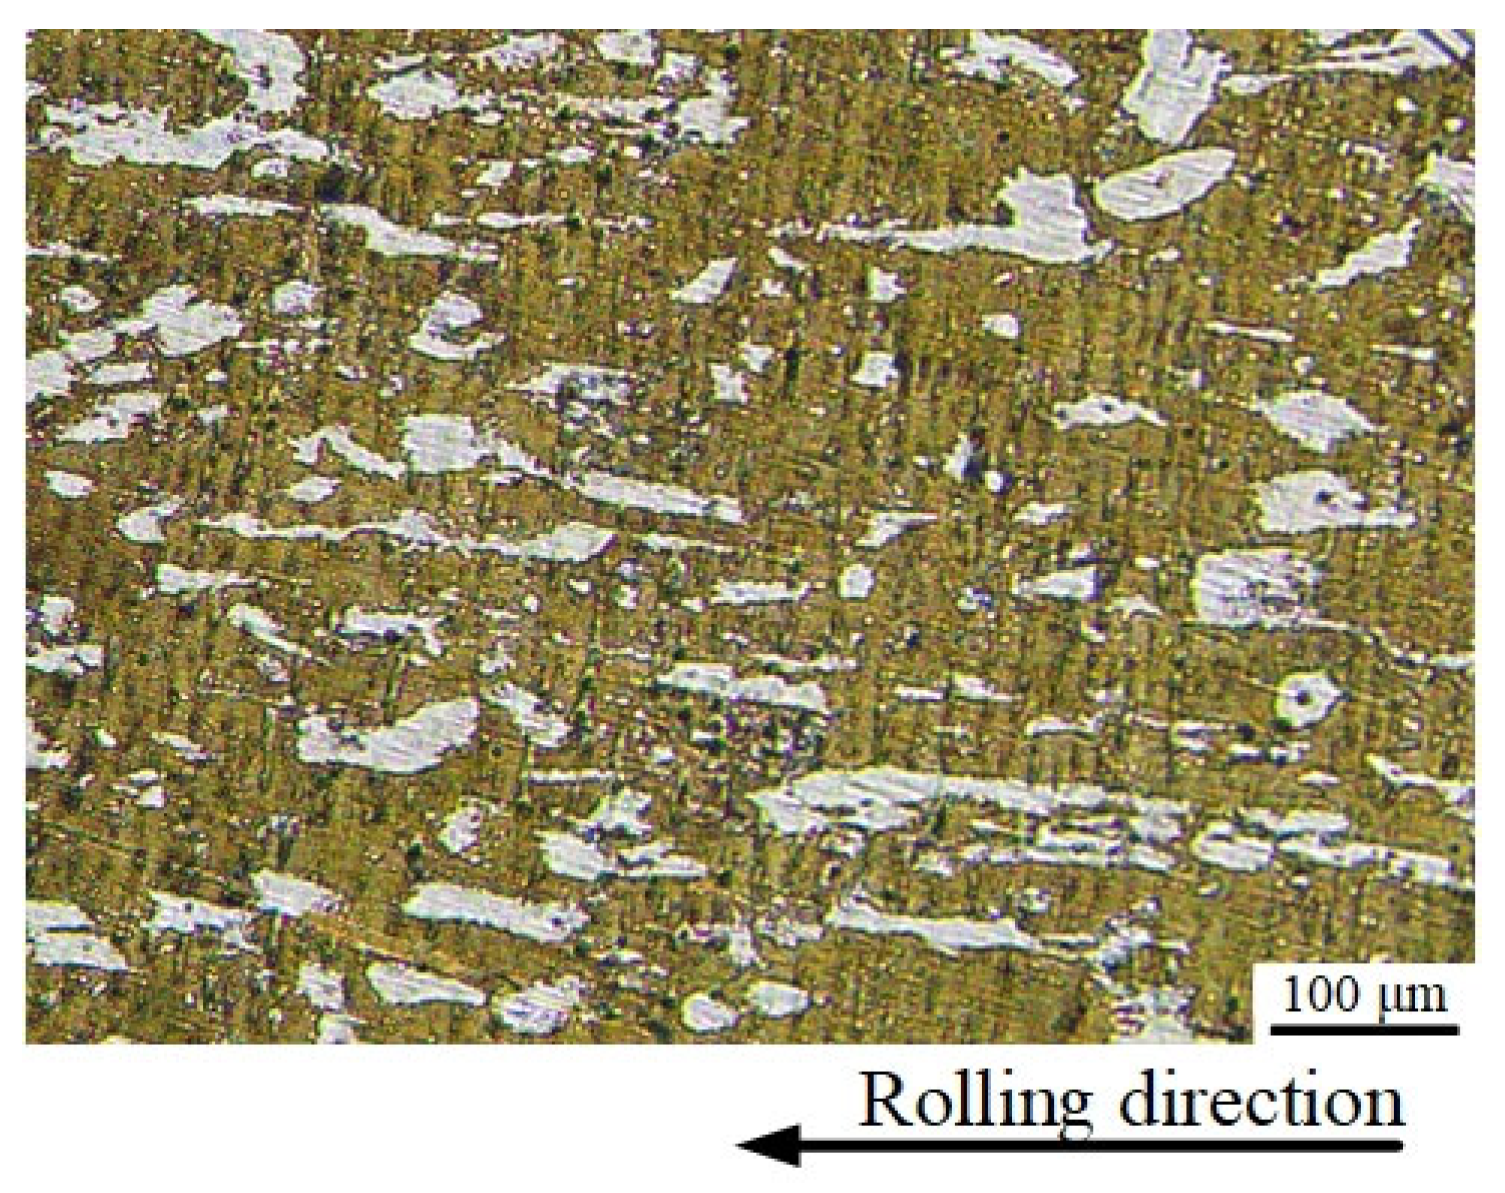
Figure 7 showed the metallographic microstructure of the base material (BM) of LA103Z. This alloy consisted of a two-phase structure comprising white α-Mg phase and yellow β-Li phase. Both α-Mg and β-Li phases elongated along the rolling direction. The α-Mg phase exhibited a streamlined distribution within the β-Li phase, with the longest α-Mg streamline exceeding 150 μm in length and an average size of 86.56 μm. The average size of the β-Li phase was 52.02 μm.
Figure 7.
Metallographic microstructure of LA103Z before FSP.
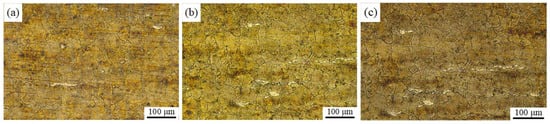
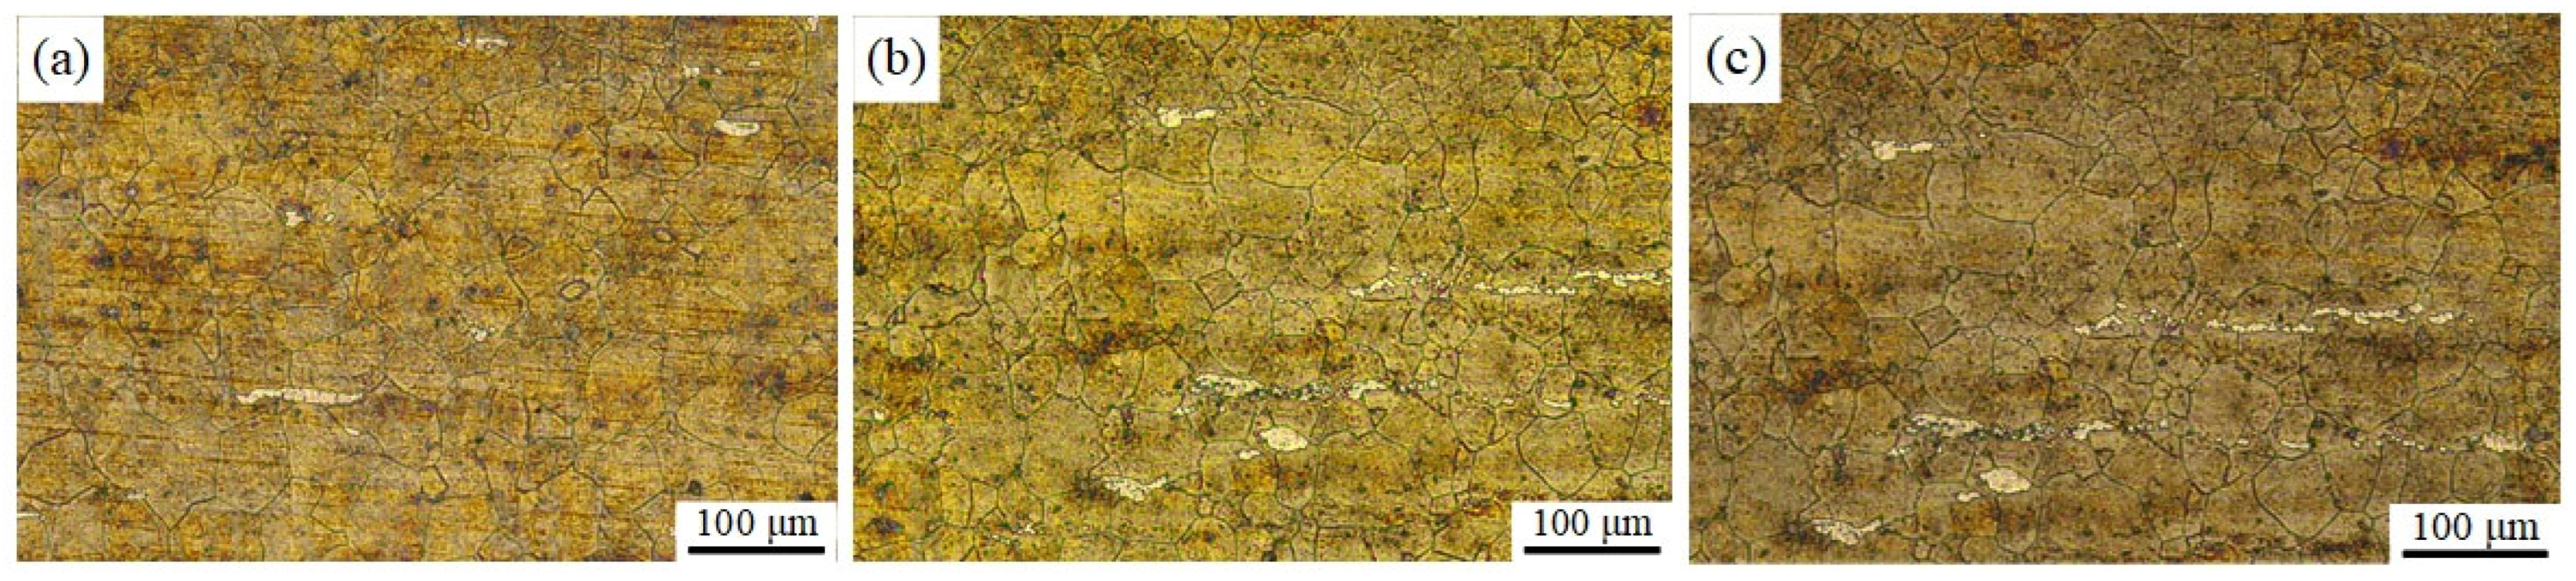
Figure 8 shows the microstructure of the SZ in the plate L8 after FSP. Under the combined effects of friction heat generated between the shoulder and the sheet and the rotation of the tool, the material in this zone underwent severe plastic deformation, resulting in microstructural refinement and the formation of numerous equiaxed grains. The volume fraction of the white α-Mg phase gradually increased from the top to the bottom part. In the top portion of the SZ, the Mg-Li alloy underwent severe deformation due to the stirring action of the tool and heat input from the shoulder. The α-Mg phase was fragmented into small particles distributed throughout the matrix. During the processing, dynamic dissolution of the α-Mg phase occurred, reducing its volume fraction. In the bottom portion of the SZ, the distribution of the α-Mg phase remained largely consistent with that of the BM, indicating that the influence of the tool on this region was minor.
Figure 8.
Metallographic microstructure of the (a) top, (b) middle, and (c) bottom regions of the SZ.
On the other hand, grain size also gradually decreased from top to bottom, with an average grain size of 34.99 μm in the top region, 30.53 μm in the middle region, and 25.48 μm in the bottom region. The grain size variation in the normal direction was large, with a standard deviation of 3.90 μm. This was attributed to the significant thermal input from the shaft shoulder affecting the top region of the SZ, resulting in larger grain sizes, while the thermal influence gradually weakened in the middle and bottom regions, leading to relatively smaller grain sizes.
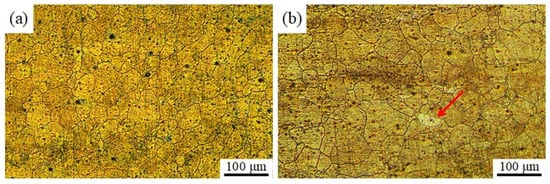
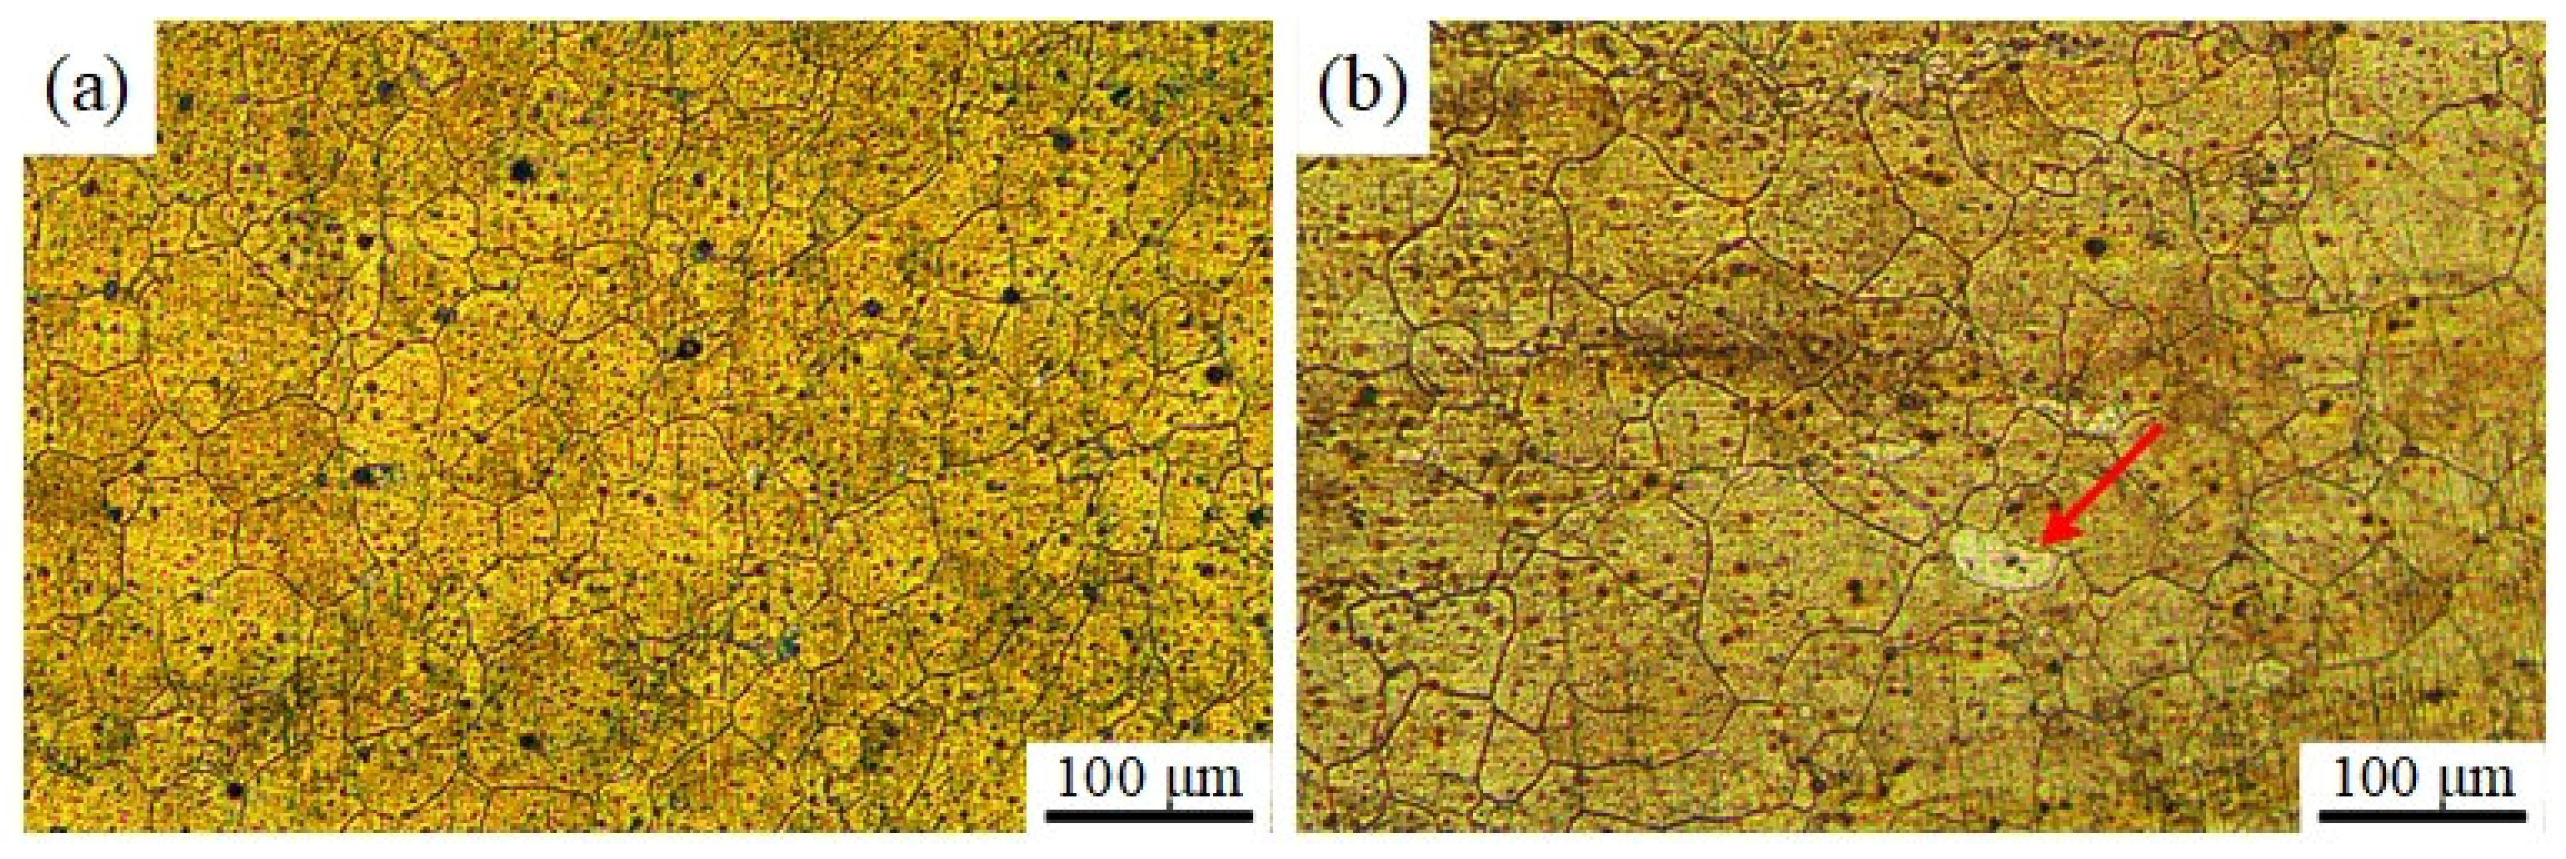
Figure 9 shows the microstructures of the AS and RS of the plate L8 after FSP. The average grain sizes on the AS and RS were 30.45 μm and 32.92 μm, respectively. The grains on the RS were larger than those on the AS, and large white α-Mg phases (red arrows) were distributed within the β-Li phase on the RS. Under rotational forces, high-temperature material moved toward the RS. Compared to the AS, the RS experienced higher temperatures and longer exposure to high heat, leading to a certain degree of grain growth. Simultaneously, the material on the RS was subjected to relatively less mechanical agitation from the tool, resulting in a small amount of white α-Mg phase remaining undissolved in the matrix.
Figure 9.
Metallographic microstructure of the (a) AS and (b) RS of the SZ.
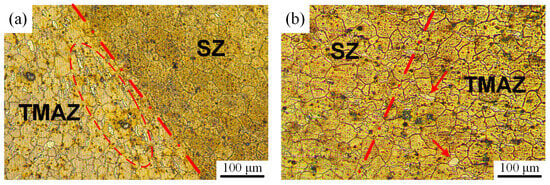
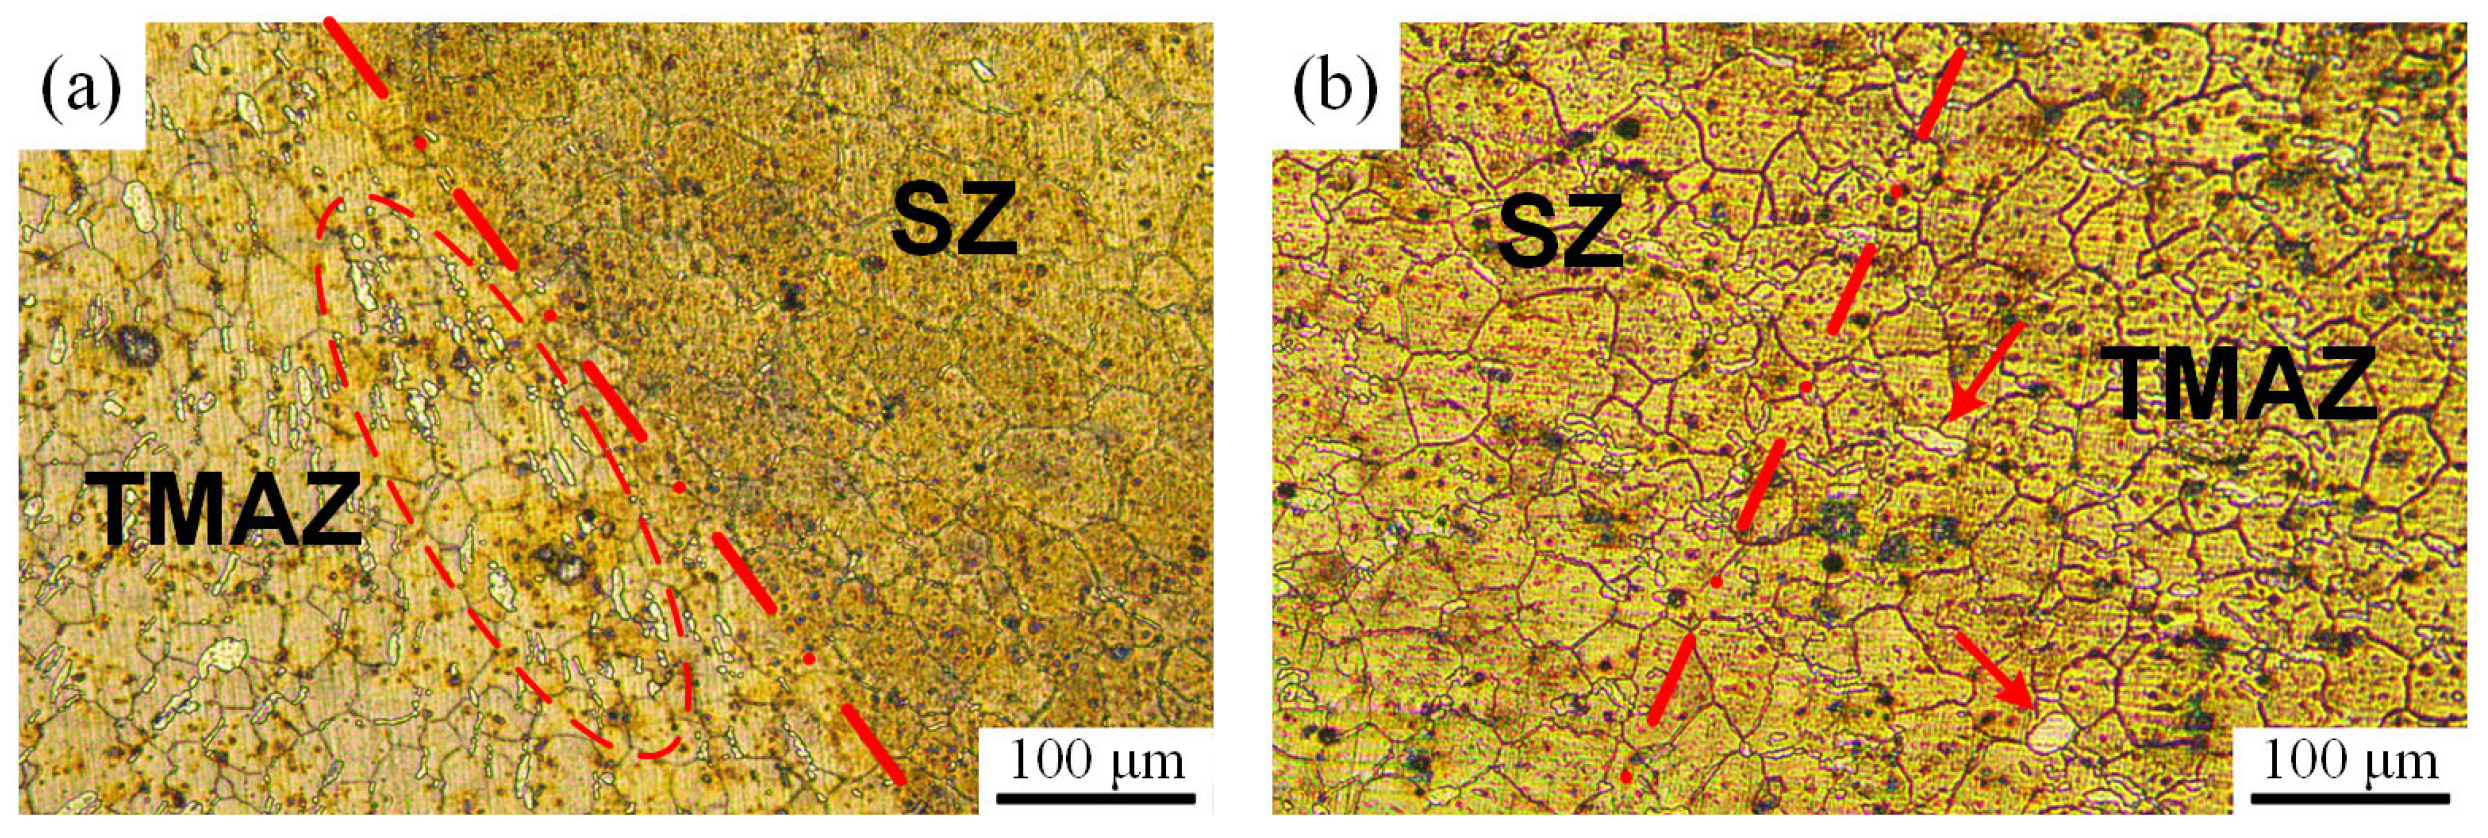
Figure 10 shows the microstructures of the AS and RS of the TMAZ of the plate L8 after FSP. As seen in Figure 10a, the α-Mg phase on the AS elongated along the tool edge and exhibited a flattened distribution. Long-grained α-Mg phases were dispersed within the Li phase matrix, while the average grain size of the β-Li phase was 38.52 μm, slightly larger than that in the SZ. Under thermomechanical coupling, the material in TMAZ softened, intensifying grain rotation and elongation, resulting in the flattened distribution of α-Mg along the tool contour [37]. During processing, the TMAZ experienced weaker mechanical agitation than the SZ, with temperature gradually decreasing from the SZ to the TMAZ. Materials closer to the SZ, due to higher temperatures, were more readily deformed under the influence of the tool and gained recrystallization driving force, resulting in smaller grain sizes relative to those farther from the SZ.
Figure 10.
Metallographic microstructure of the (a) AS and (b) RS of the TMAZ.
Comparing Figure 10a,b, it was found that the volume fraction of the α-Mg phase on the AS was significantly higher than that on the RS, while the grain size of the β-Li phase was smaller than that on the RS. During processing, the material temperature on the RS was higher, with a longer duration of elevated temperatures. Consequently, the temperature in the TMAZ was also higher, resulting in a higher internal energy within the α-Mg phase [13]. This higher energy made the α-Mg phase more prone to dissolution back into the β-Li phase, leading to a lower volume fraction of the α-Mg phase compared to the AS. Simultaneously, grain growth occurred in the β-Li phase at these higher temperatures, resulting in larger β-Li phase grain sizes than those on the AS.
3.2.1. Metallographic Structure
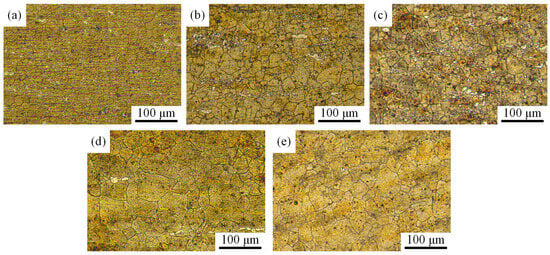
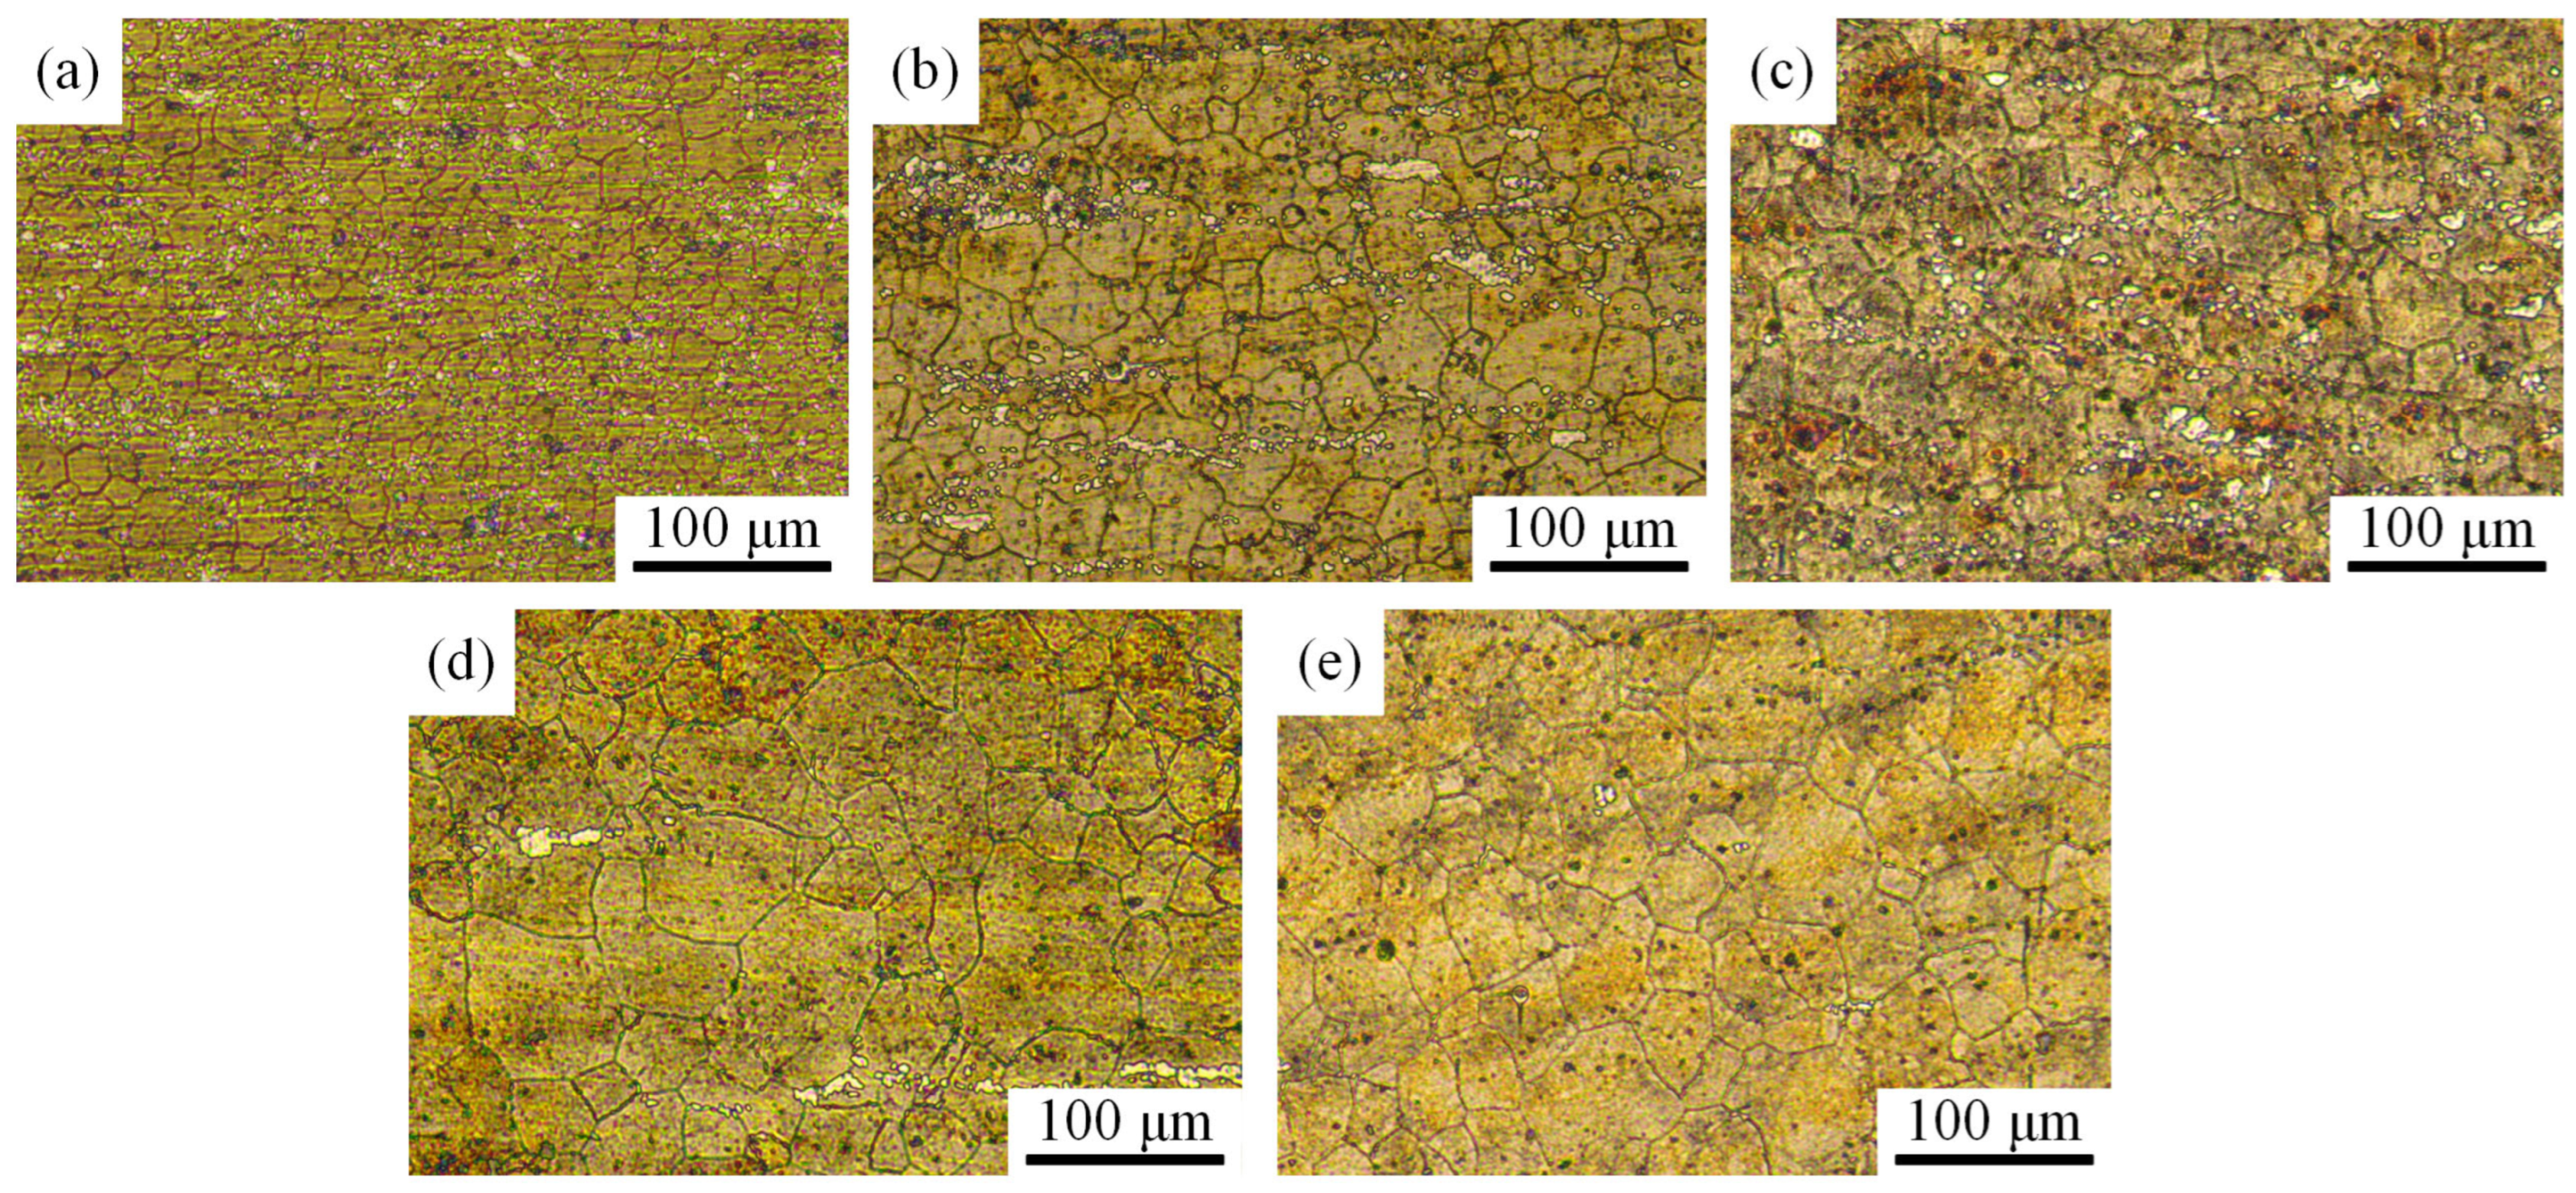
Figure 11 shows the metallographic microstructure of SZ under different process parameters. Figure 11a,b,d depict the microstructure of SZ after FSP at different rotational speeds with a travelling speed of 100 mm/min. It was evident that the microstructure of SZ exhibited significant differences at different rotational speeds. As the rotational speed of the tool increased, the white α-Mg phase gradually decreased. In the L2 (300-100) sample, the α-Mg phase was distributed in a network pattern at the grain boundaries of the β-Li phase. The average grain sizes in the central regions of SZ for the L2 (300-100), L5 (400-100), and L8 (600-100) samples were 19.92 μm, 24.37 μm, and 30.53 μm, respectively. Evidently, the grain size progressively increased with rising rotational speed.
Figure 11.
Microstructure of SZ under different process parameters: (a) L2 (300-100); (b) L5 (400-100); (c) L7 (600-50); (d) L8 (600-100); (e) L9 (600-200).
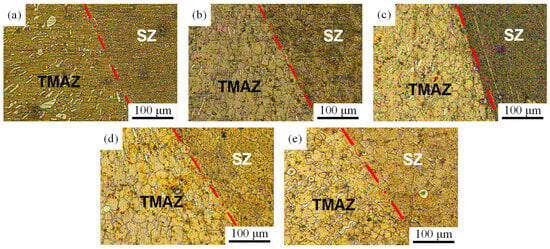
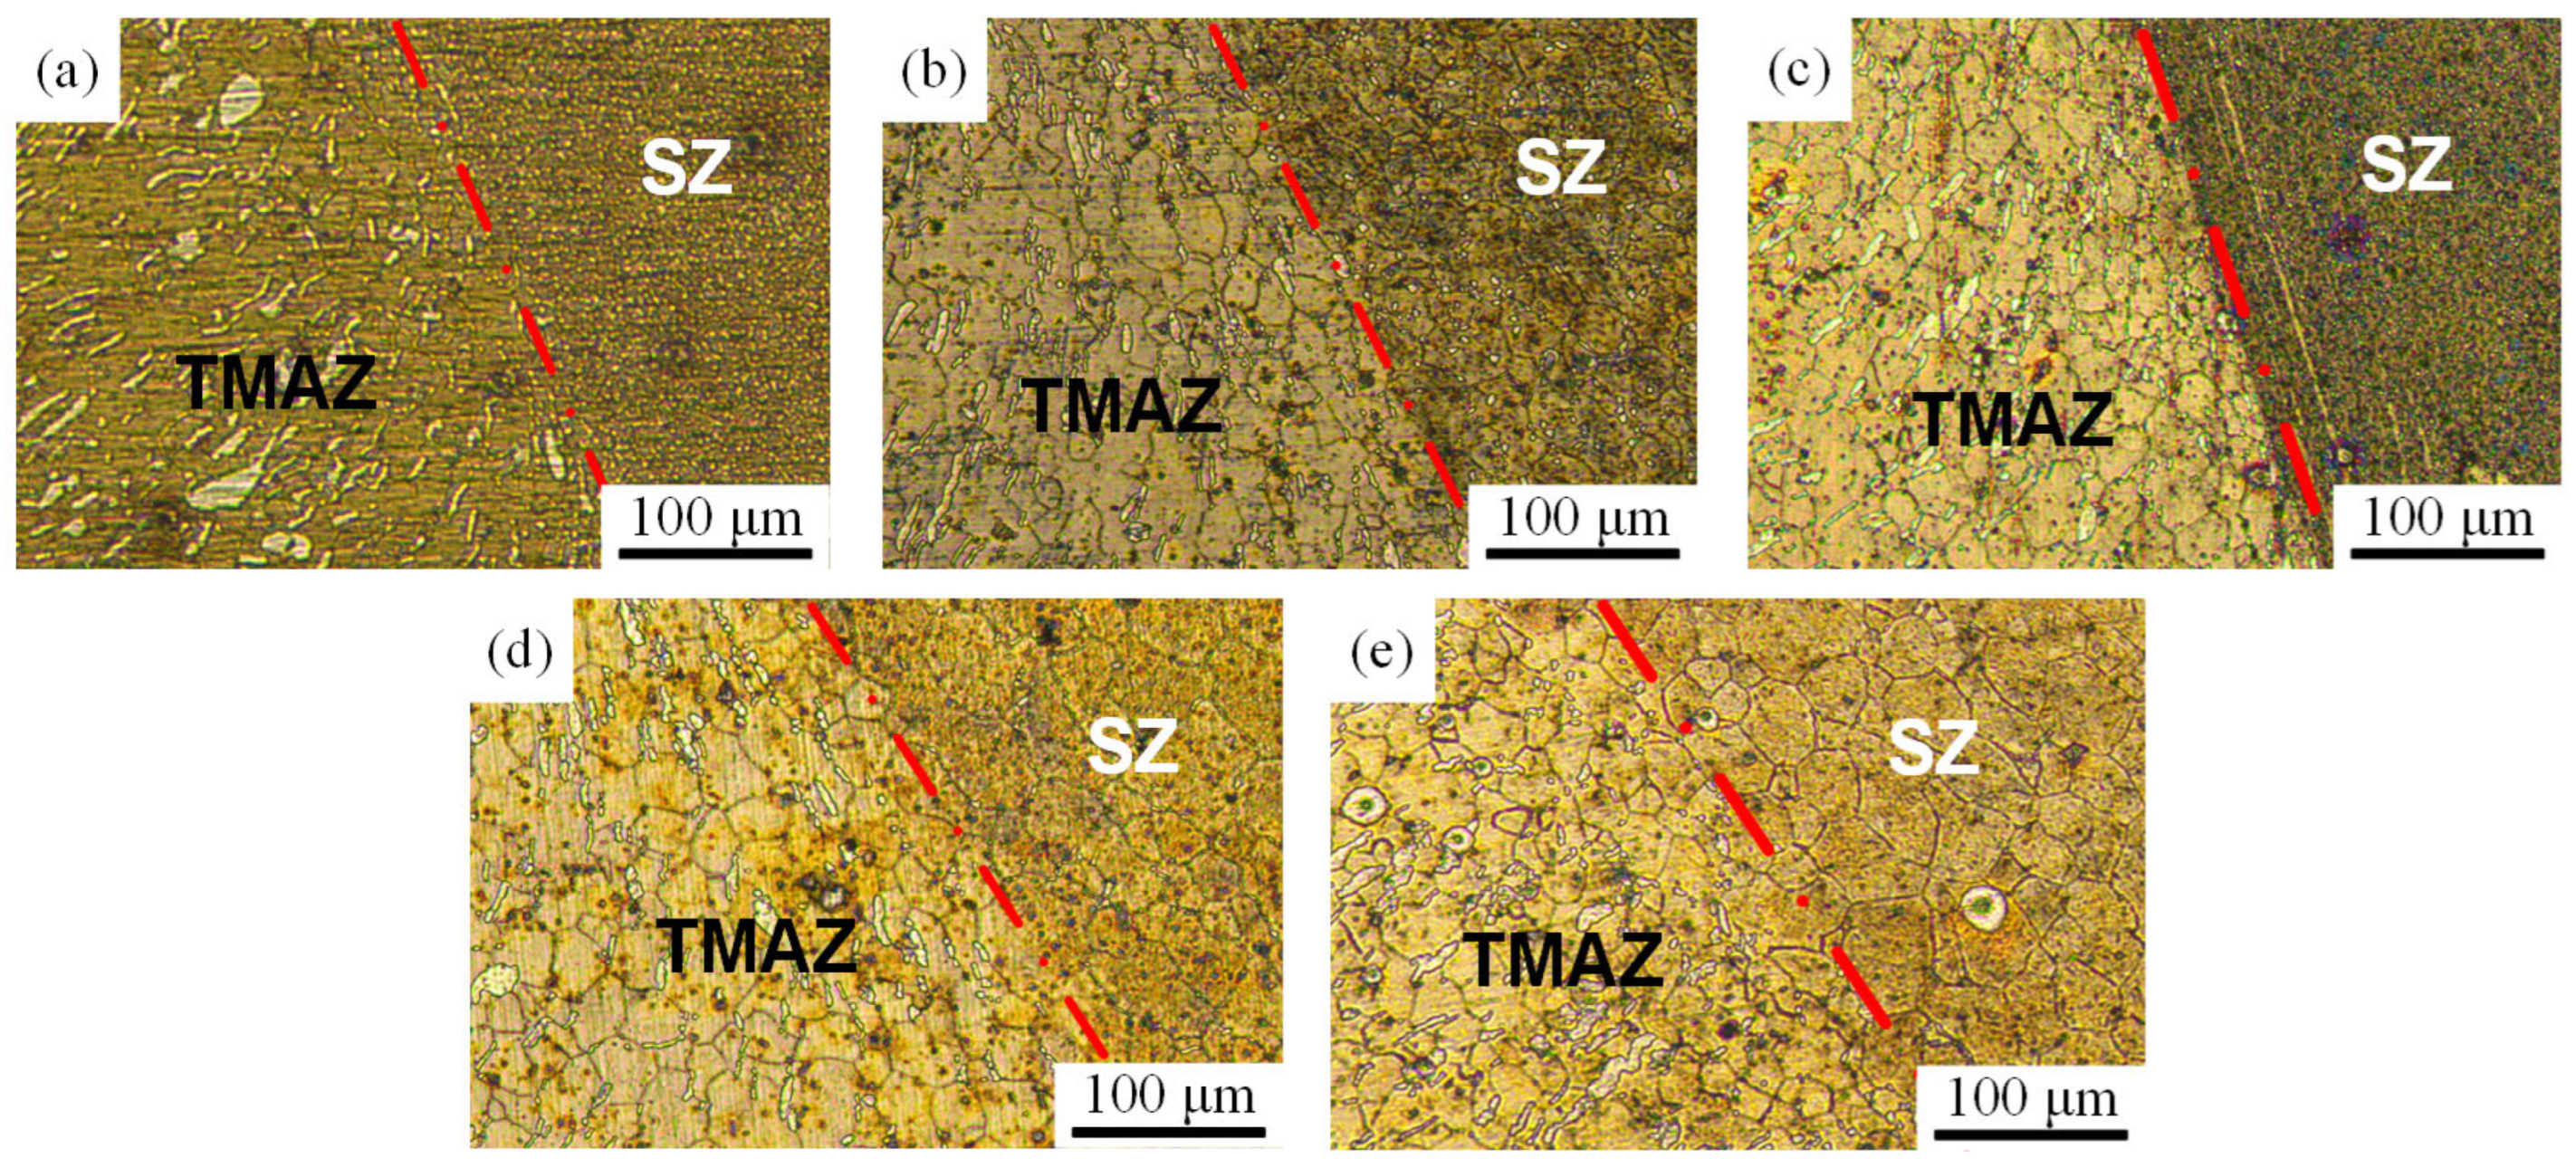
Figure 12c–e show the microstructures of TMAZ after FSP at different travelling speeds with a rotational speed of 600 rpm. As the travelling speed increased, the volume fraction of the α-Mg phase gradually decreased. At a travelling speed of 200 mm/min, the α-Mg phase became difficult to distinguish, indicating that higher processing speeds cause Mg to be reabsorbed, reducing the volume of the α-Mg phase. The average grain sizes in the central regions of SZ for 600-50, 600-100, and 600-200 were 34.45, 30.53, and 28.67 μm, respectively. This indicated that variations in rotational speed significantly influenced grain size in SZ, whereas changes in travelling speed had a relatively minor effect on grain size.
Figure 12.
Microstructure of the TMAZ under different process parameters: (a) L2 (300-100); (b) L5 (400-100); (c) L7 (600-50); (d) L8 (600-100); (e) L9 (600-200).
3.2.2. EBSD Results
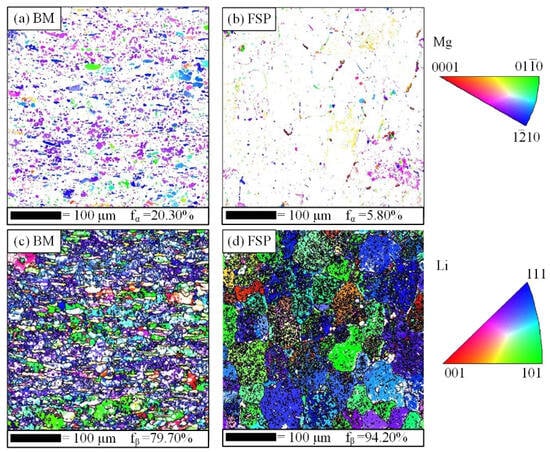
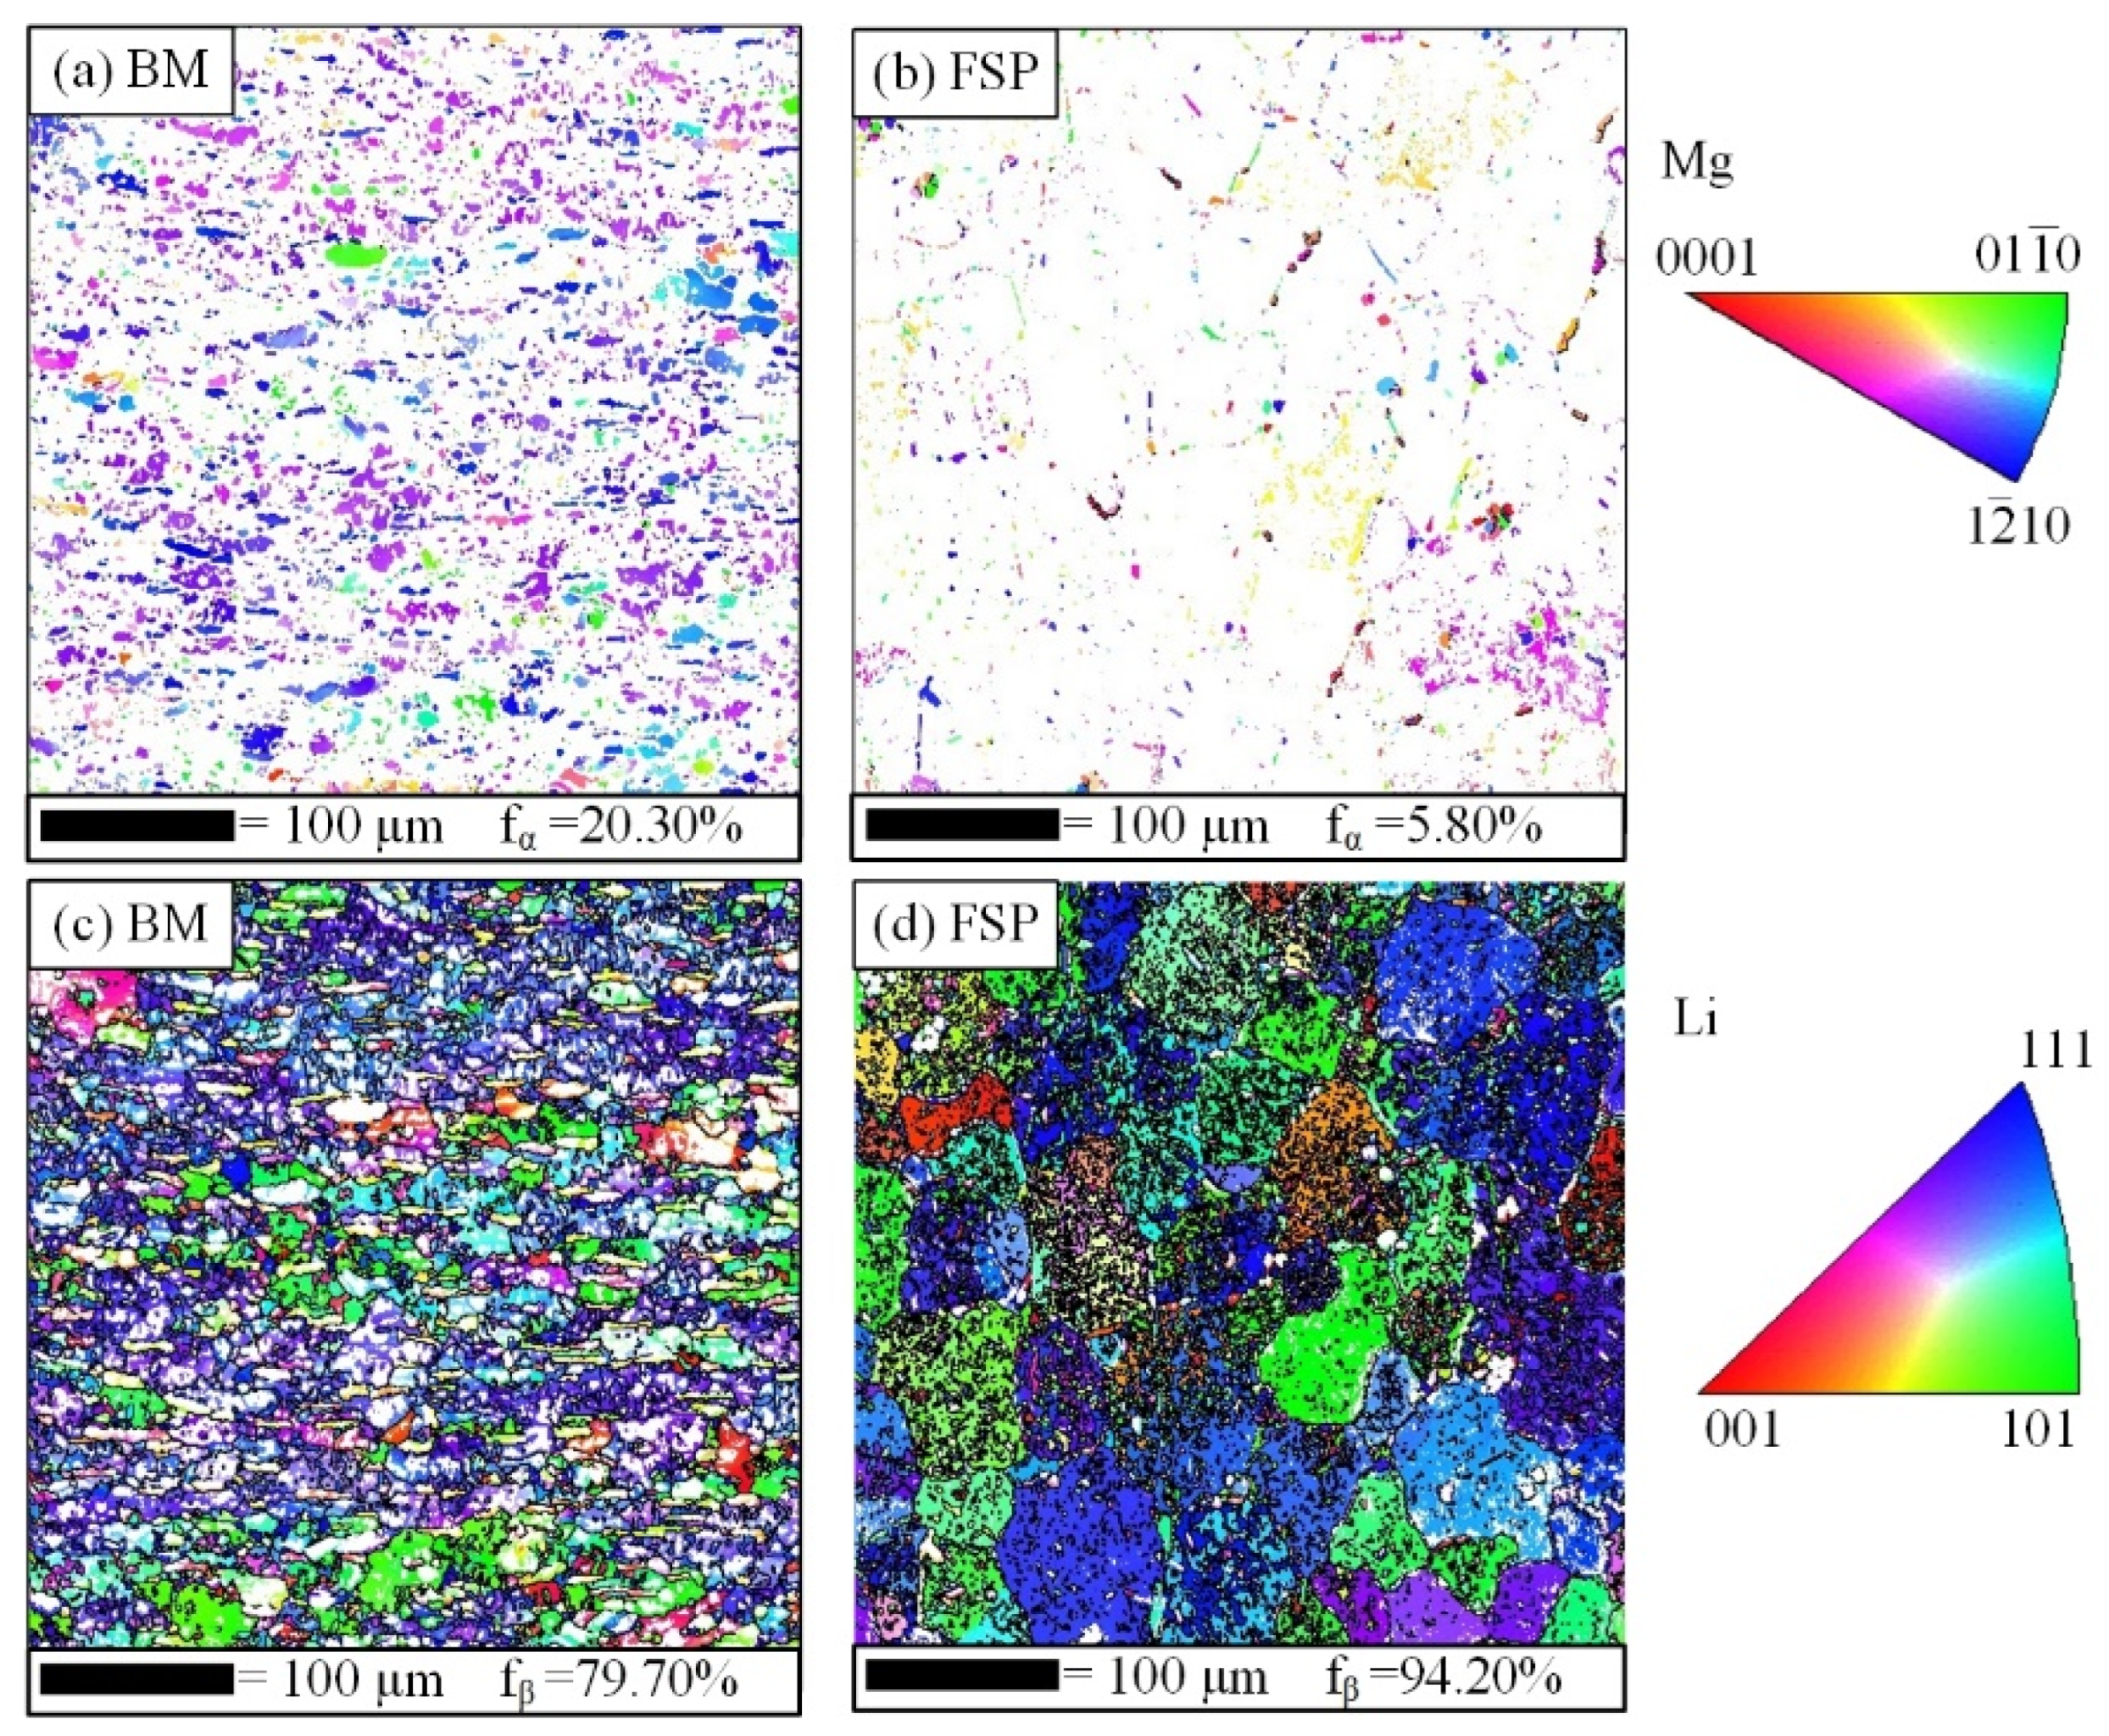
Figure 13 shows the reverse polarity diagram of the SZ before and after FSP (taking L8 as an example). In the BM, α-Mg and β-Li phases exhibited distinct grain orientation, with both elongated and equiaxed grains present in varying sizes. α-Mg was uniformly distributed within the β-Li phase, with a volume fraction of 20.30%. α-Mg grains exhibited either equiaxed morphology or elongated grains with a maximum aspect ratio of 8.72, averaging 1.94. However, their orientation was largely consistent, demonstrating pronounced rolling characteristics. After FSP, the volume fraction of α-Mg decreased sharply to only 5.80% due to the intense thermal–mechanical coupling action of the tool with grain orientation becoming random. Concurrently, a reticular α-Mg phase precipitated at β-Li grain boundaries, indicating that the α-Mg phase in the BM dissolved during processing and redistributed as reticular equiaxed grains along β-Li grain boundaries. The β-Li phase underwent dynamic recrystallization under the tool’s action. Elongated grains disappeared in the sheet, replaced by numerous randomly oriented fine equiaxed grains. Grain size became more uniform, and grain preferential orientation weakened, indicating that the texture of the Mg-Li alloy sheet was significantly weakened after FSP.
Figure 13.
IPFs of (a,b) α-Mg phase and (c,d) β-Li phase in SZ before and after FSP.
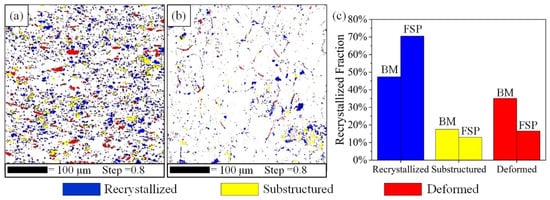
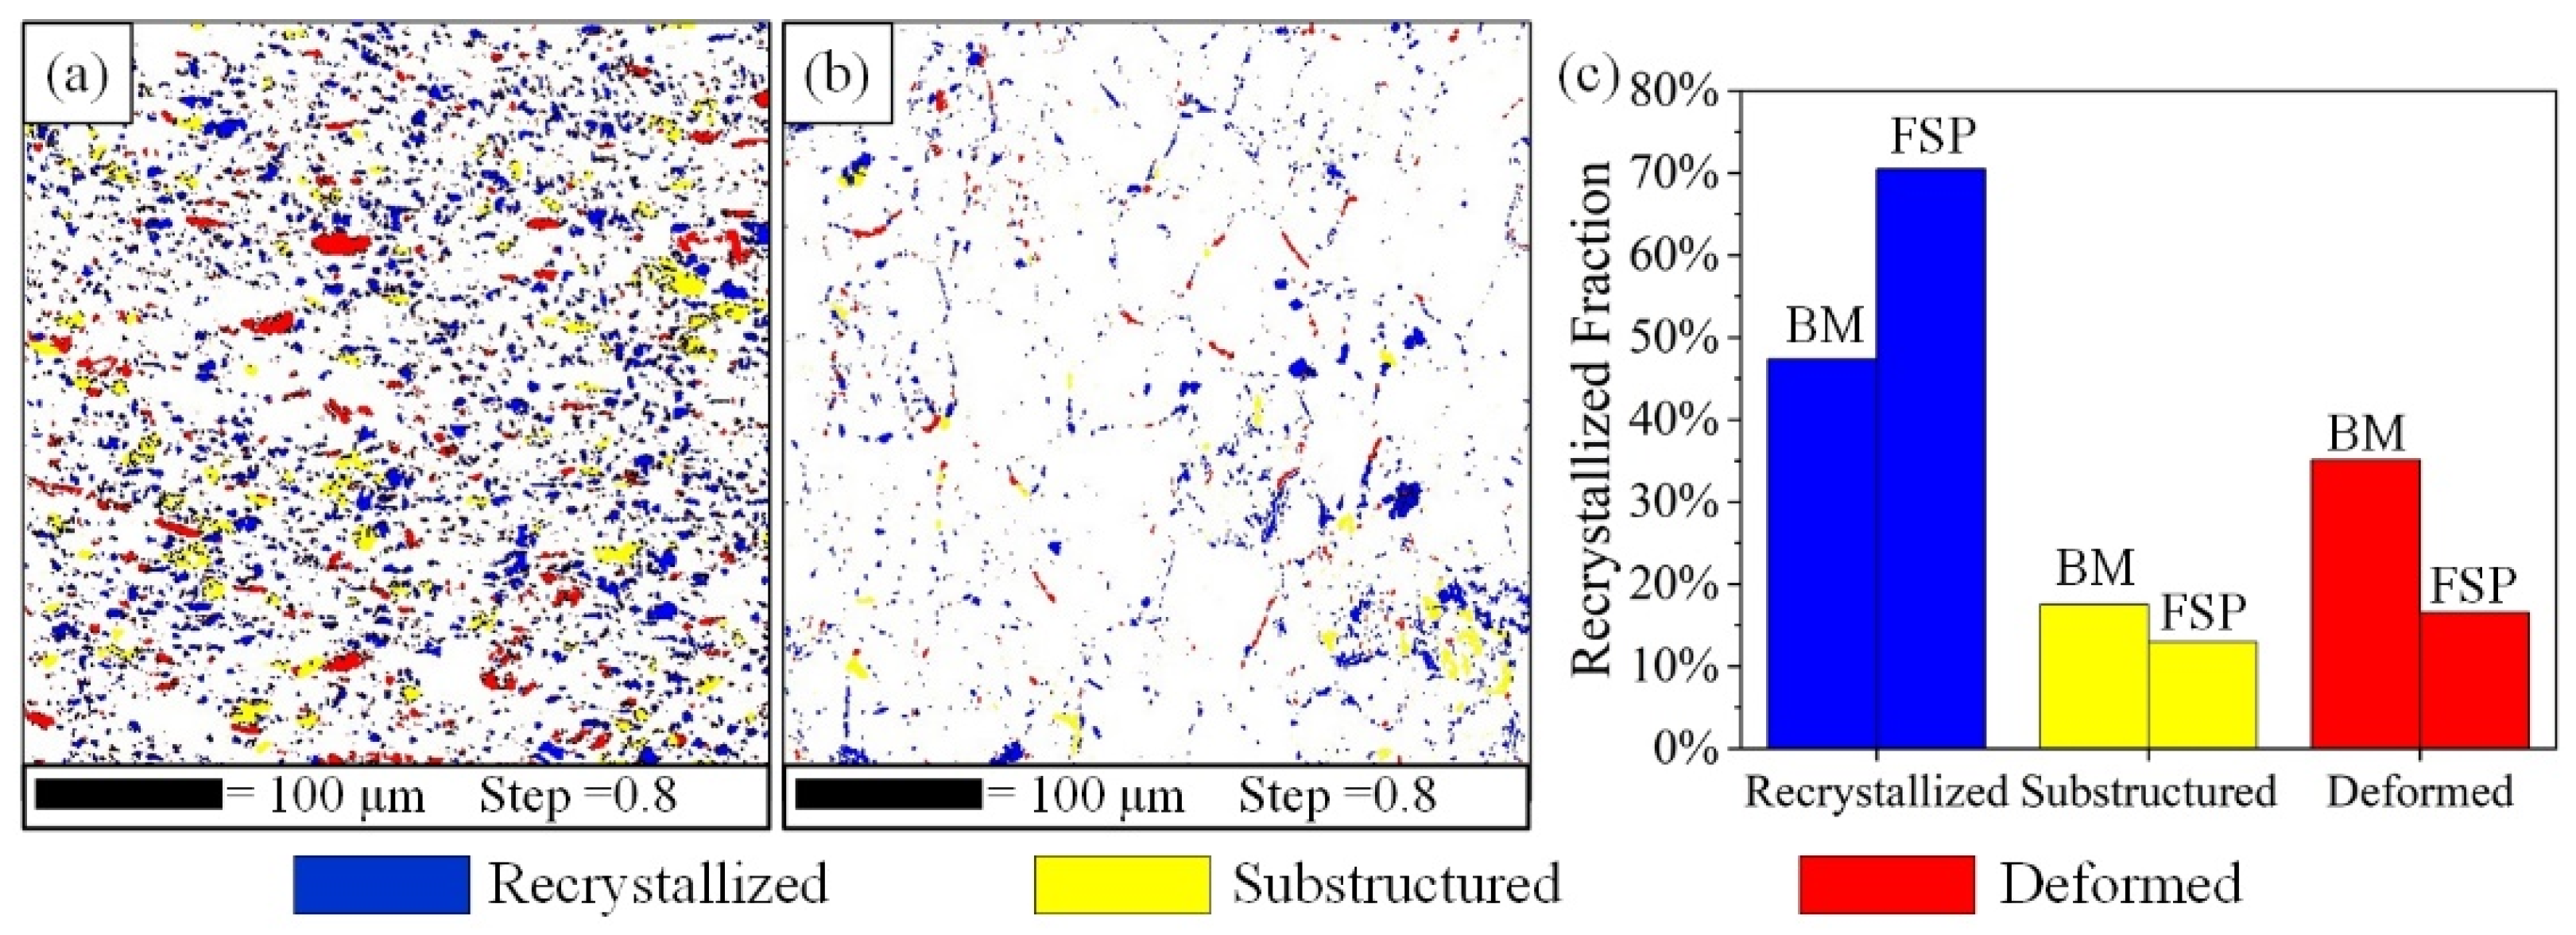
Figure 14 shows the recrystallized microstructure of the α-Mg phase before and after FSP (taking L8 as an example). Red indicates deformed grains, yellow indicates subgrains, and blue indicates recrystallized grains. After FSP, the material underwent dynamic recovery recrystallization. The large red deformed grain structure in the matrix was broken and dissolved, and the proportion of recrystallized grains in the α-Mg phase increased from 47.4% to 70.5%. Concurrently, the proportion of deformed grains decreased significantly from 35.1% to 16.6%. Under the combined effects of heat input and mechanical agitation, the α-Mg phase transformed into recrystallized grains.
Figure 14.
Recrystallization of α-Mg phase in (a) BM and (b) FSP; (c) percentage of recrystallization.
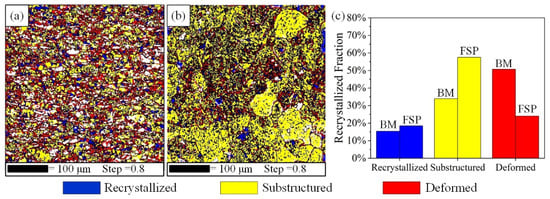
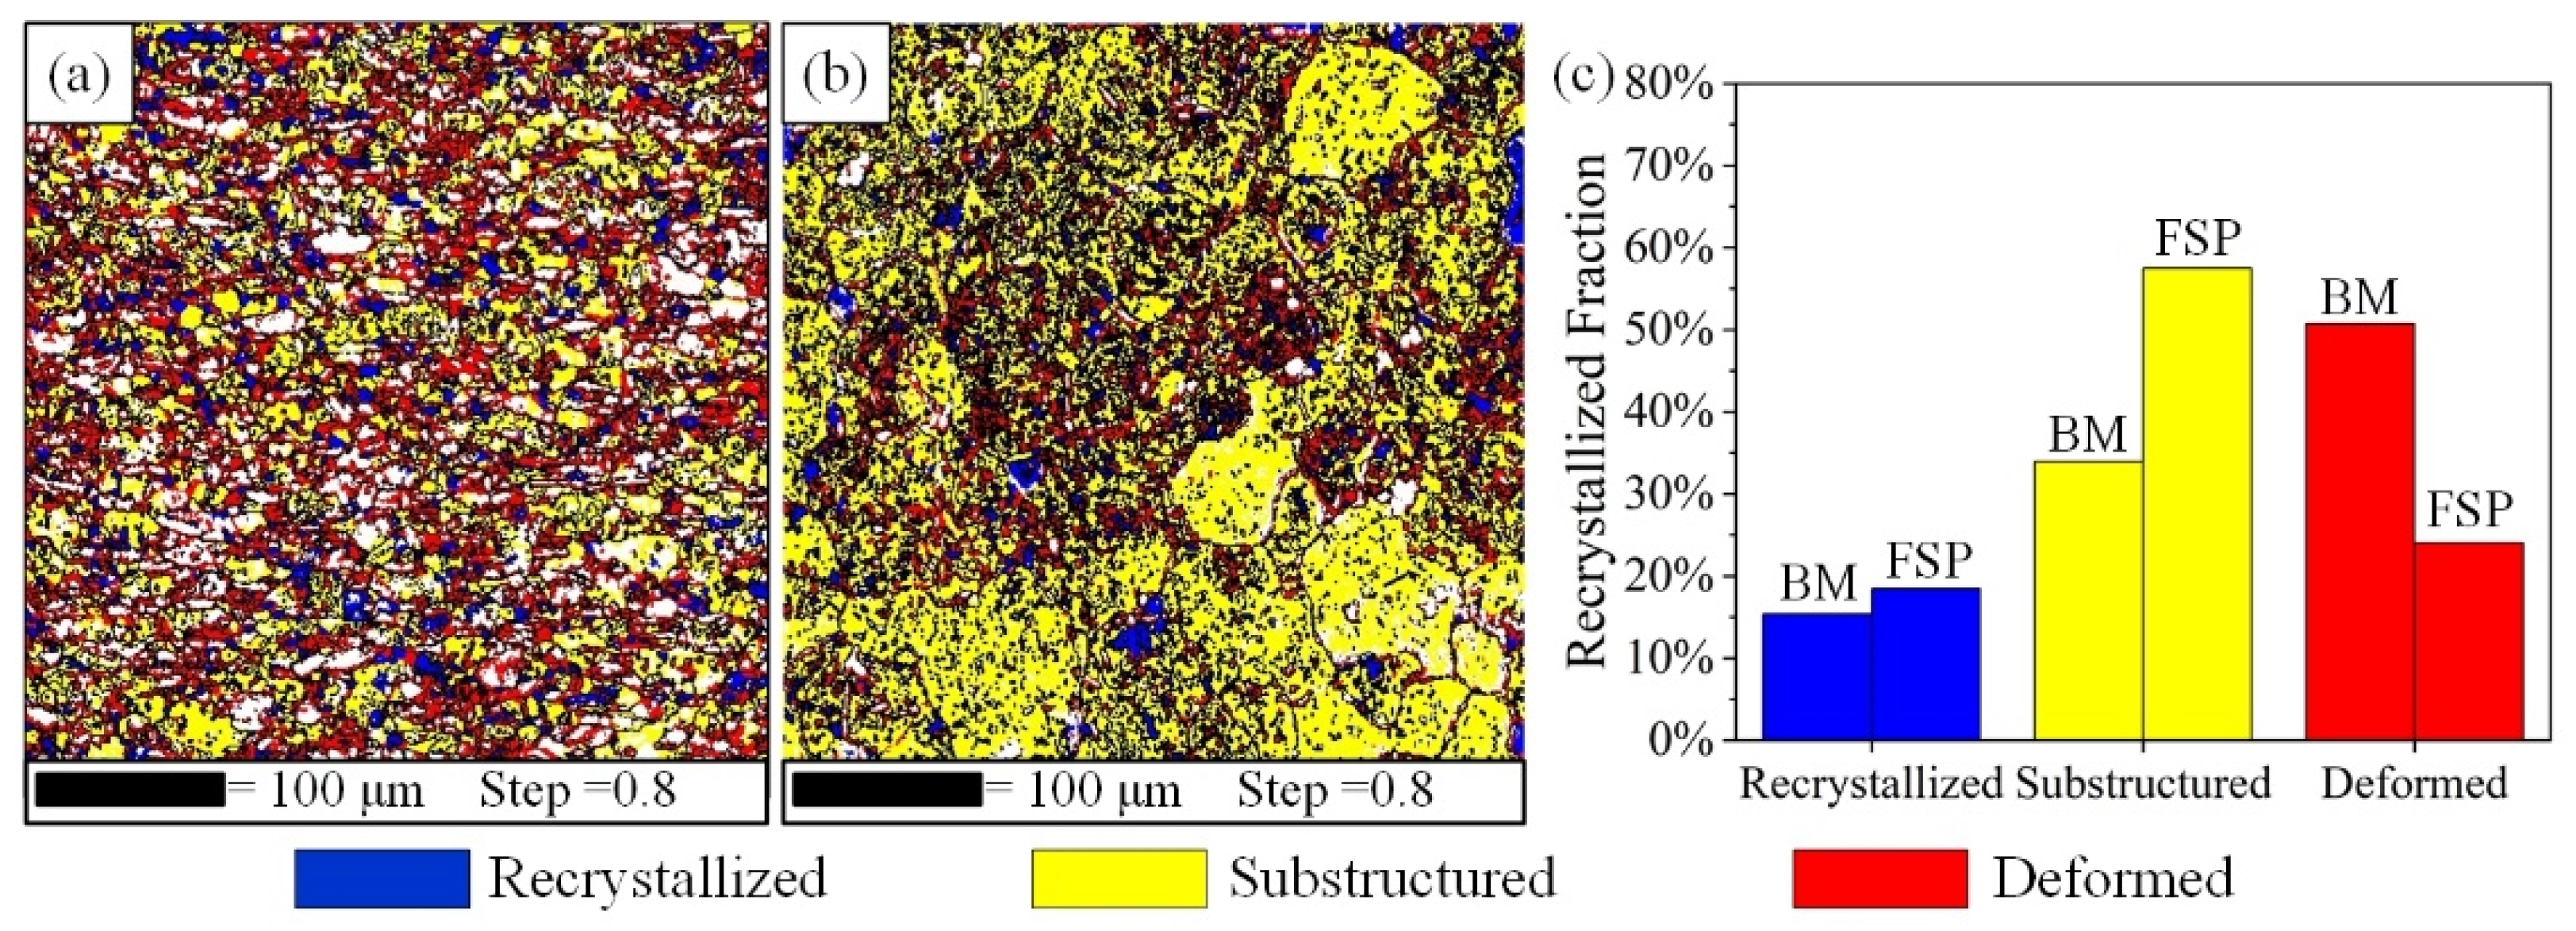
Figure 15 shows the recrystallized microstructure of the β-Li phase before and after FSP (taking L8 as an example). For the BM, most grains in the β-Li phase were rolled deformed grains, accounting for 50.7% of the total grain volume, with significant grain orientation differences. During FSP, dynamic recovery recrystallization occurred under the action of the tool. Most grains within the material transformed into yellow sub-structural grains, accounting for 57.5%, while the red deformed grain structure decreased significantly to only 24.0%. This indicated that FSP could induce dynamic recrystallization in the Mg-Li alloy, reduce internal rolling stresses, and improve the grain structure.
Figure 15.
Recrystallization of β-Li phase in (a) BM and (b) FSP; (c) percentage of recrystallization.
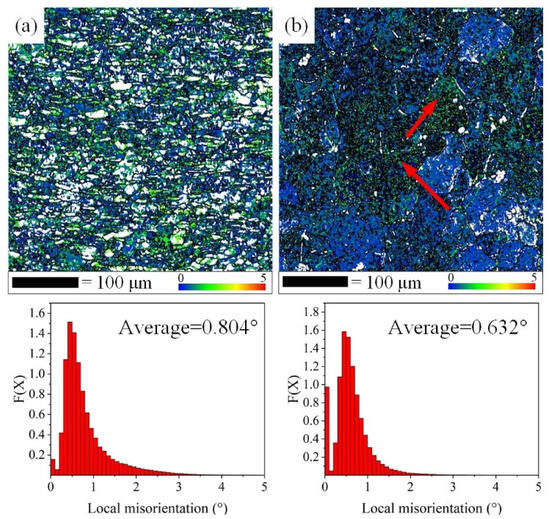
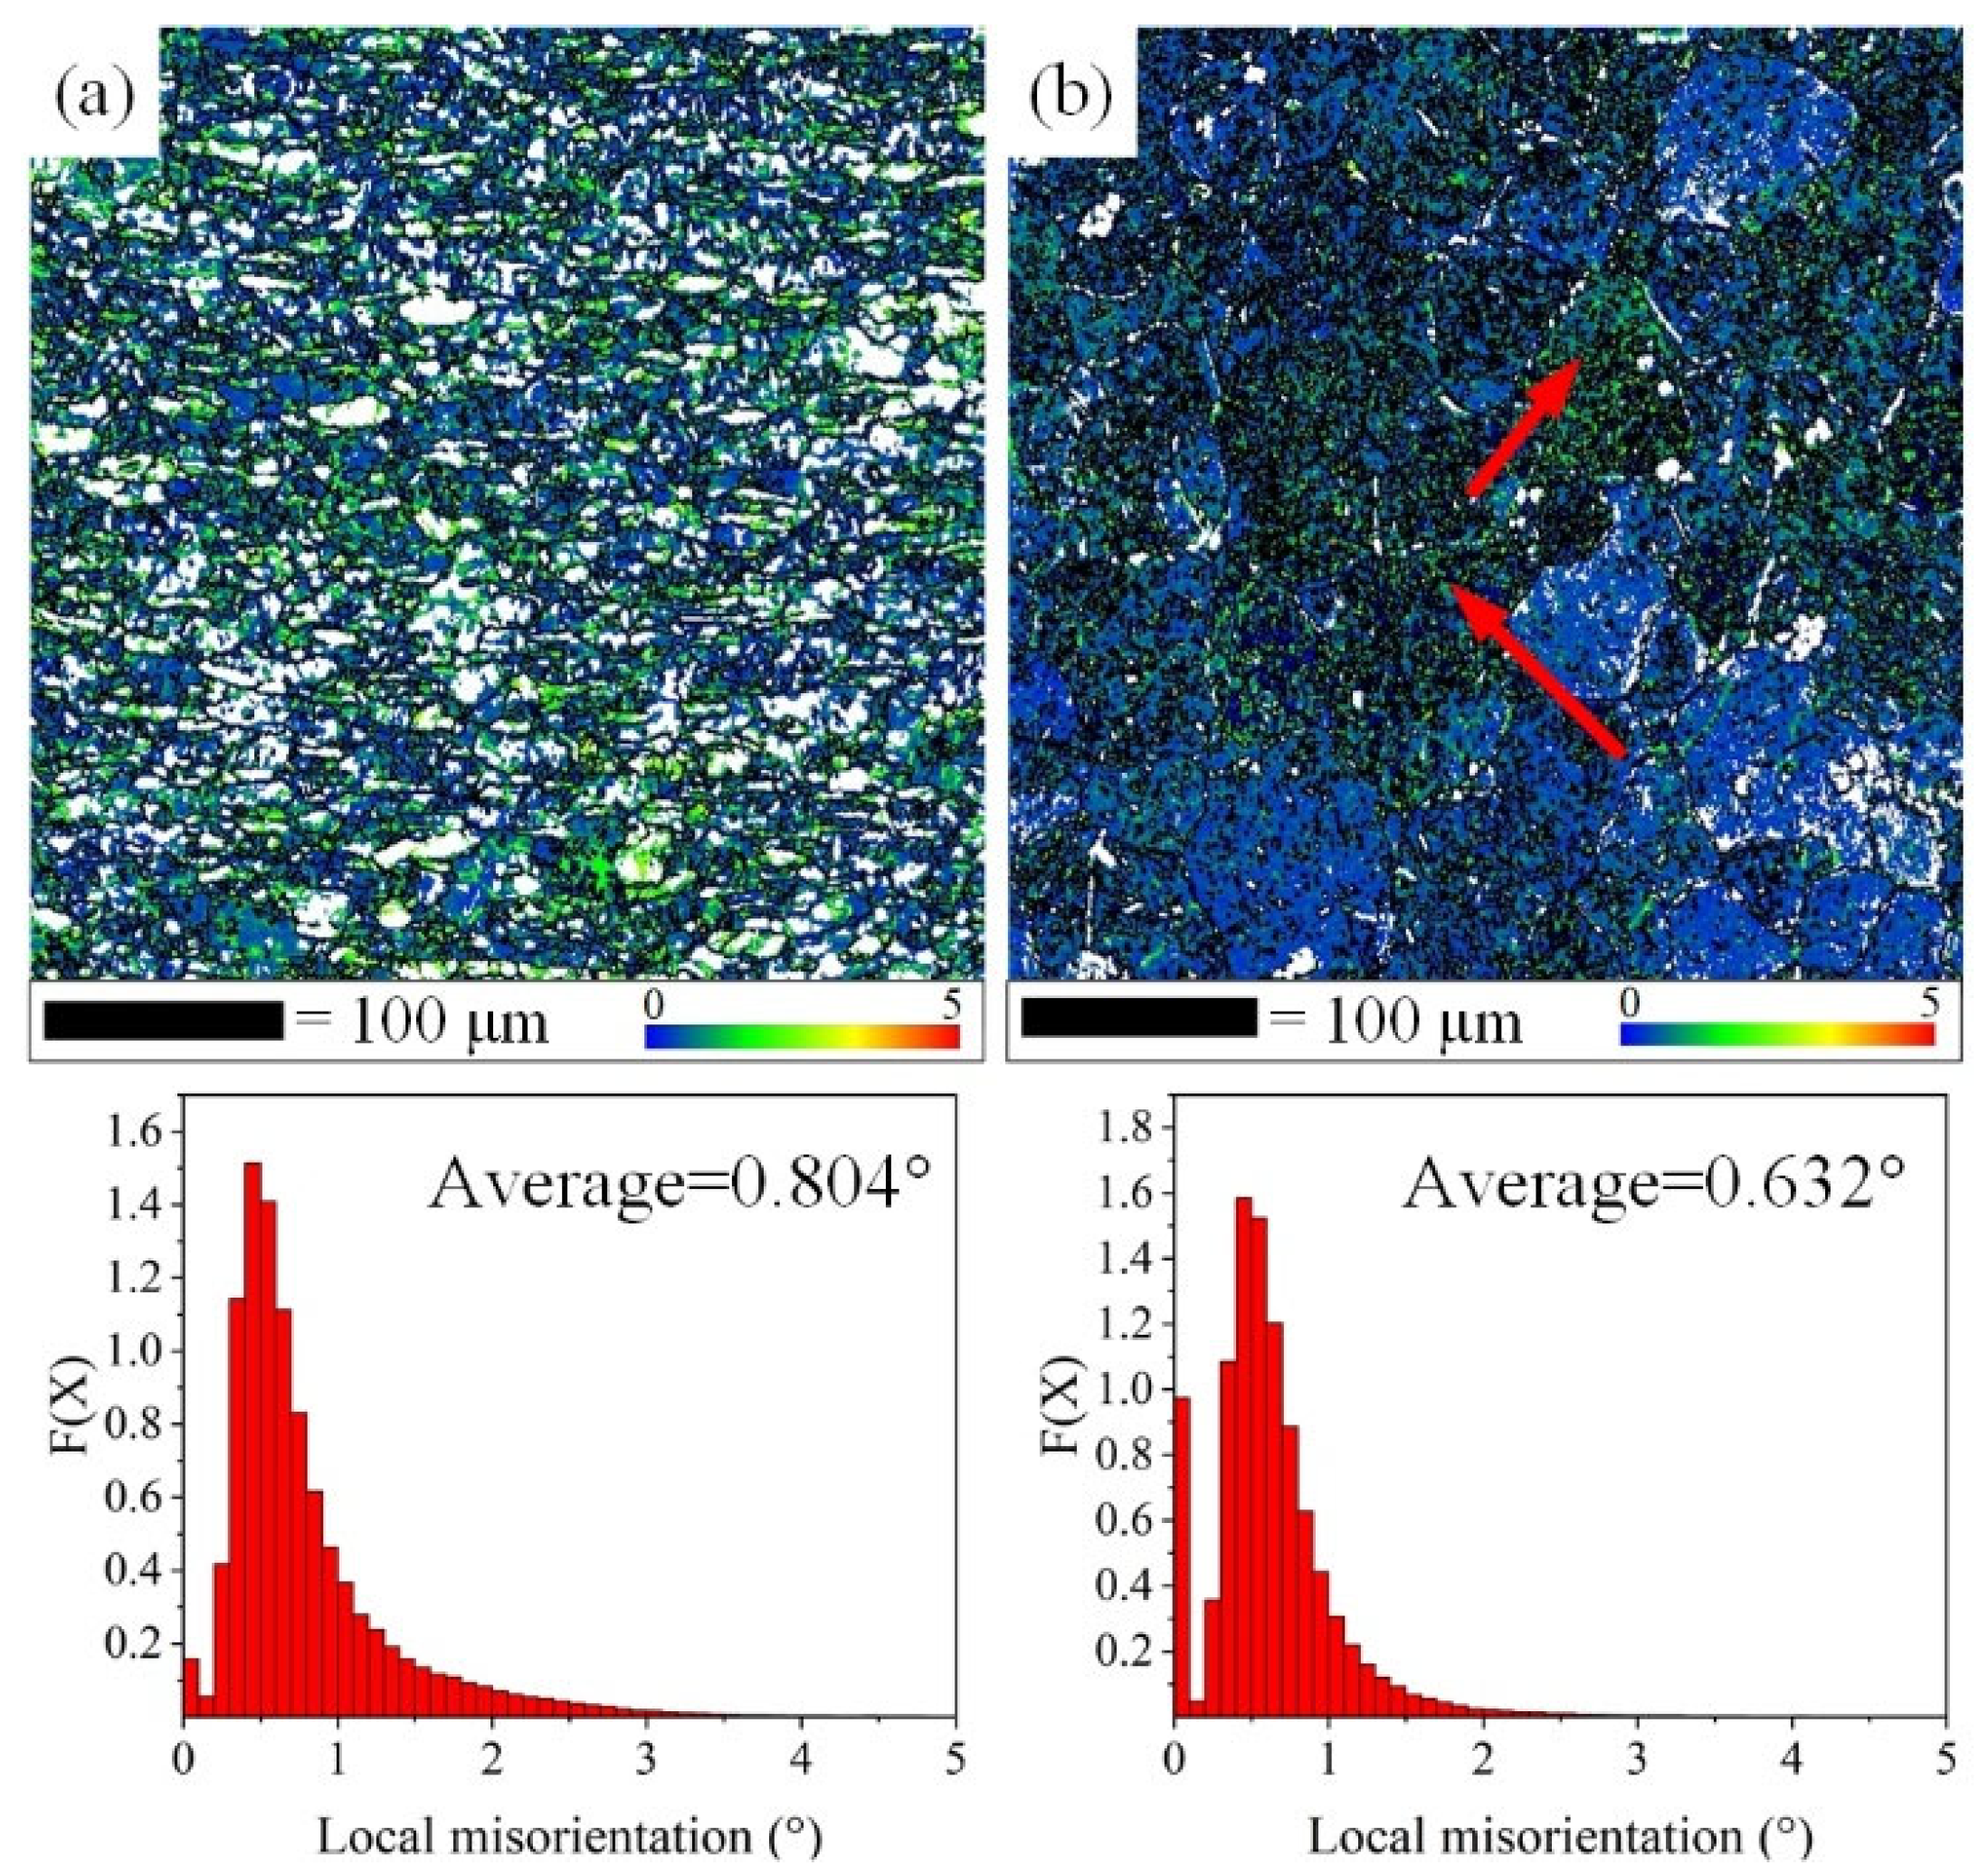
Figure 16 shows the distribution of local orientation differences in the β-Li phase before and after FSP (taking L8 as an example). The values of the β-Li phase before and after processing were 1.98 × 10¹⁴ m−2 and 9.48 × 10¹³ m−2, respectively. This indicated that under the effects of severe plastic deformation and high heat input during FSP, the Mg-Li alloy underwent dynamic recrystallization, resulting in a significant reduction in dislocation density and an improvement in microstructure.
Figure 16.
Distribution maps of β-Li phase local misorientation in (a) BM and (b) FSP.
Compared to Figure 16b, Figure 14a contains a large number of green areas, indicating a significant orientation difference in the BM with an average misorientation of 0.804°. The material exhibited high dislocation density with dislocation clustering. In contrast, Figure 16b is predominantly blue, showing a reduced average orientation difference of 0.632°, indicating dynamic recrystallization occurred during FSP. As indicated by the red arrows, green networks persisted within the recrystallized grains, revealing the presence of dislocations and substructure grains, with fine recrystallized grains in the process of formation.
Figure 16b also reveals that the local misorientation at the α-Mg/β-Li phase interface in the SZ after FSP was low. The α-Mg and β-Li phases exhibited an approximately Burgers-type half-lattice relationship, allowing dislocations to traverse or slip between the two phases [38] without dislocation pile-up. Therefore, during FSP, the network-like distribution of α-Mg did not significantly affect the recrystallization and growth of β-Li grains.
3.2.3. XRD Pattern
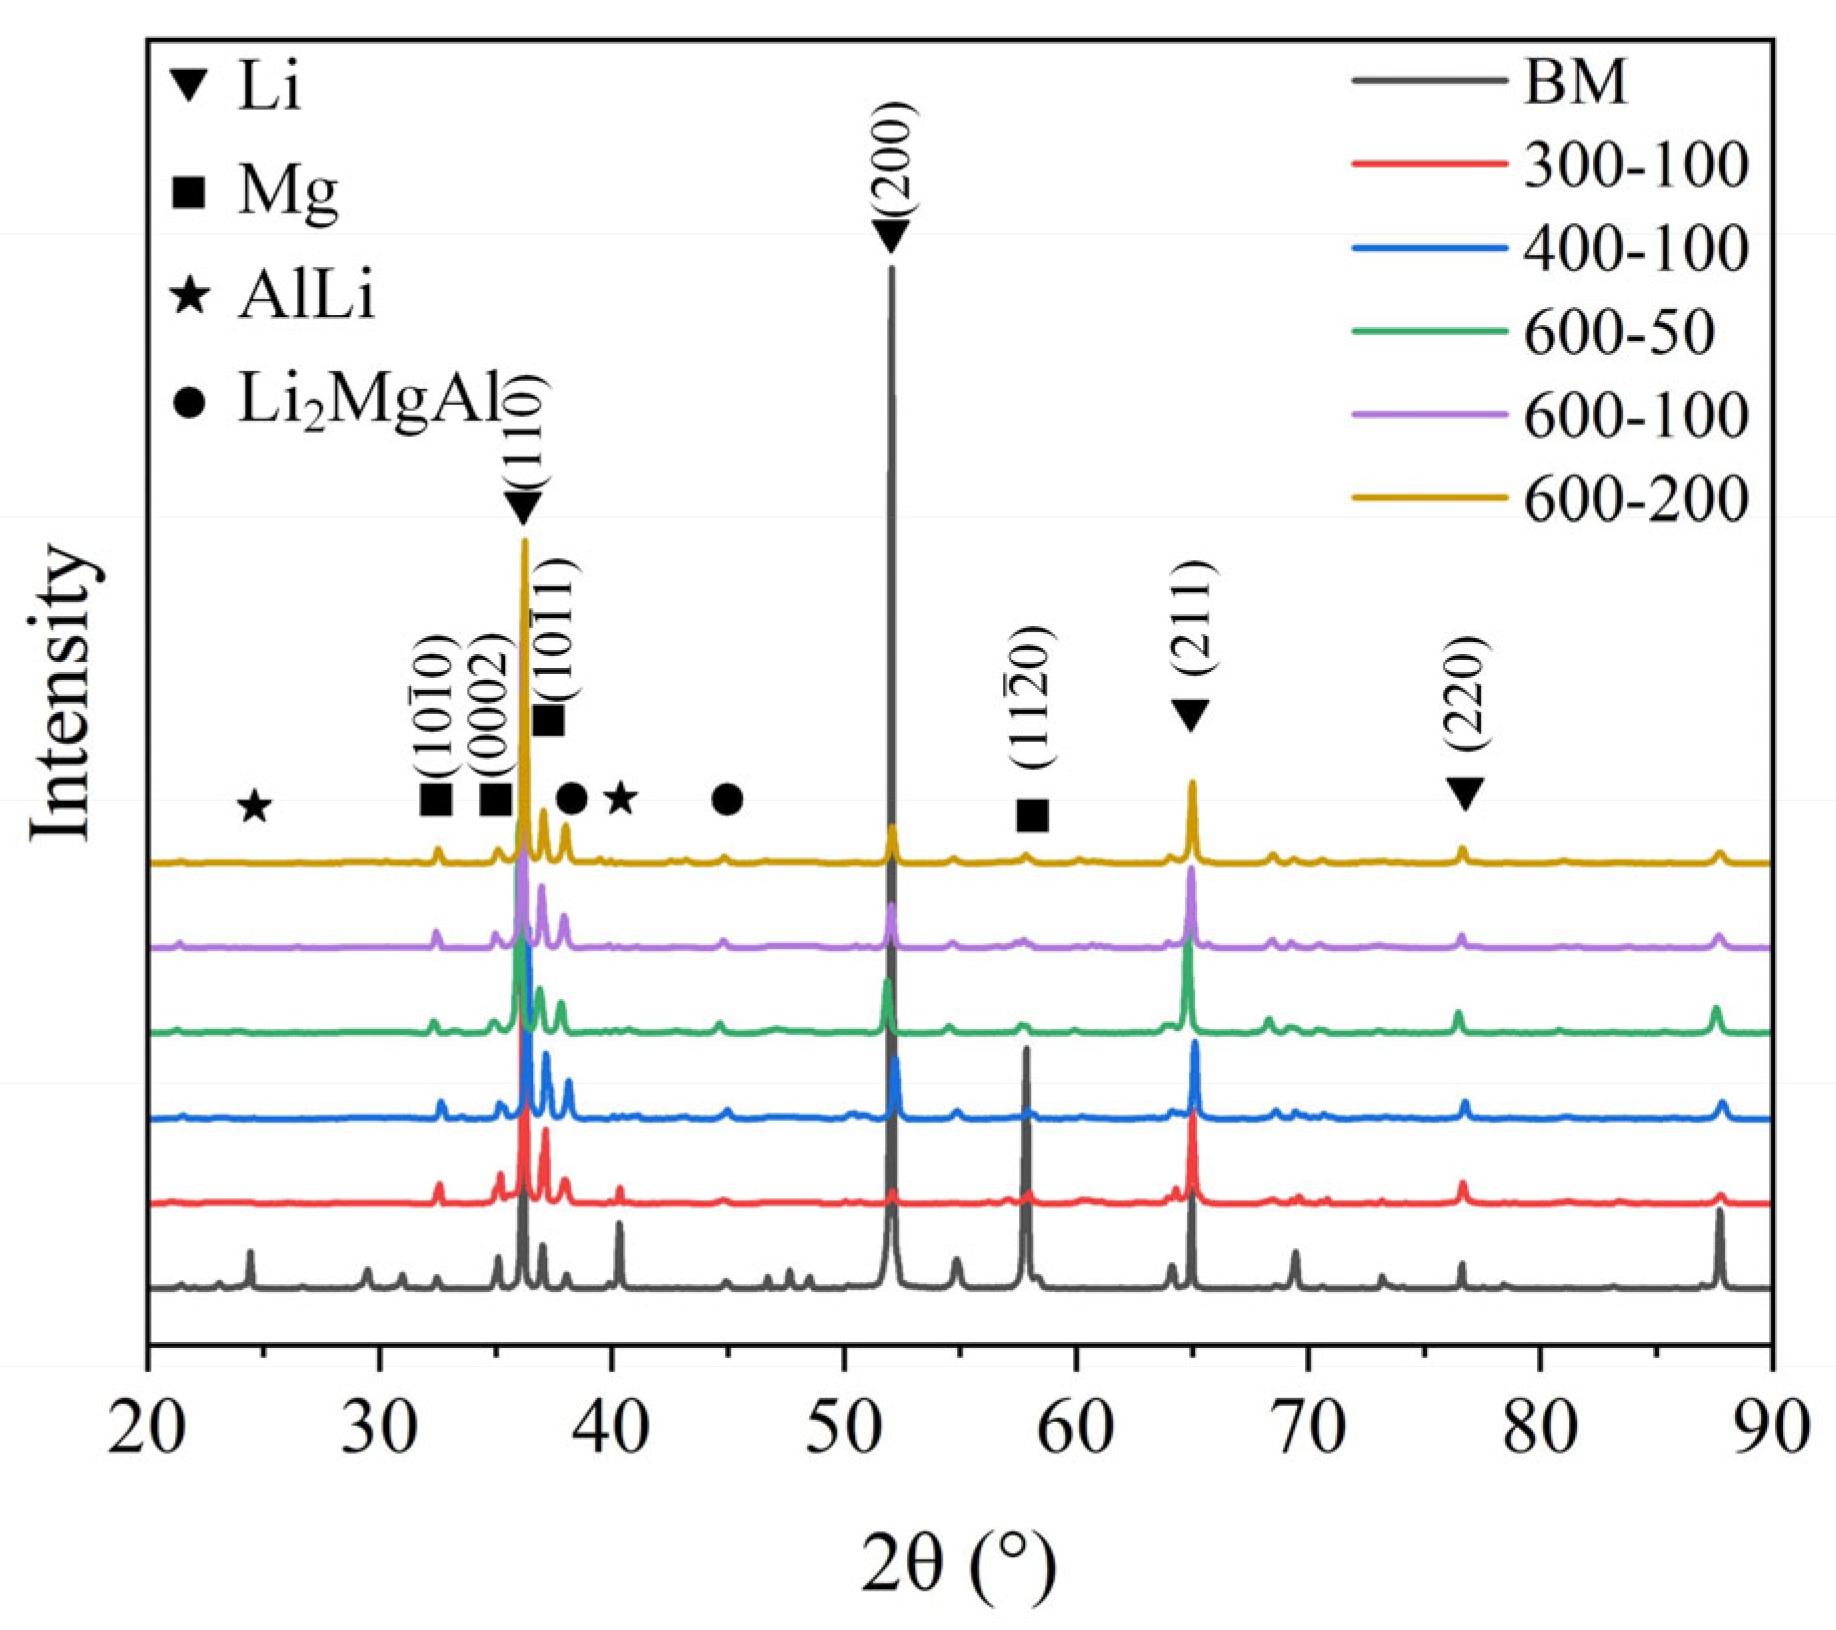
Figure 17 shows the XRD patterns of the Mg-Li alloy after FSP under different process parameters. It was observed that the Li phase (200) crystal plane and Mg phase (11) crystal plane exhibited the highest diffraction peak intensities in the BM, characteristic of rolled sheet metal. After single-pass processing, the diffraction peak intensities of these two crystal planes significantly decreased. Meanwhile, the intensities of other planes, such as the Li phase (110) plane, increased. This further proved that the recrystallization that occurred during FSP resulted in random grain orientation and reduced texture.
Figure 17.
XRD pattern of samples under different parameters.
The primary precipitation phase in the matrix was mainly the stable AlLi phase. After single-pass processing, Li3Mg7 and Li2MgAl phases precipitated. This indicated that during FSP, as the tool rotated rapidly and advanced, Mg atoms re-dissolved into the Li matrix, forming stable Li3Mg7 phase and combining with Al atoms to form metastable Li2MgAl phase [39,40]. The precipitation particles produced strengthening of MgLi alloys [41,42].
Comparing the XRD curves of Mg-Li alloys after FSP under different process parameters, it could be observed that varying process parameters did not significantly affect the types of precipitated phases or the intensities of the crystal plane diffraction peaks.
3.3. Microhardness
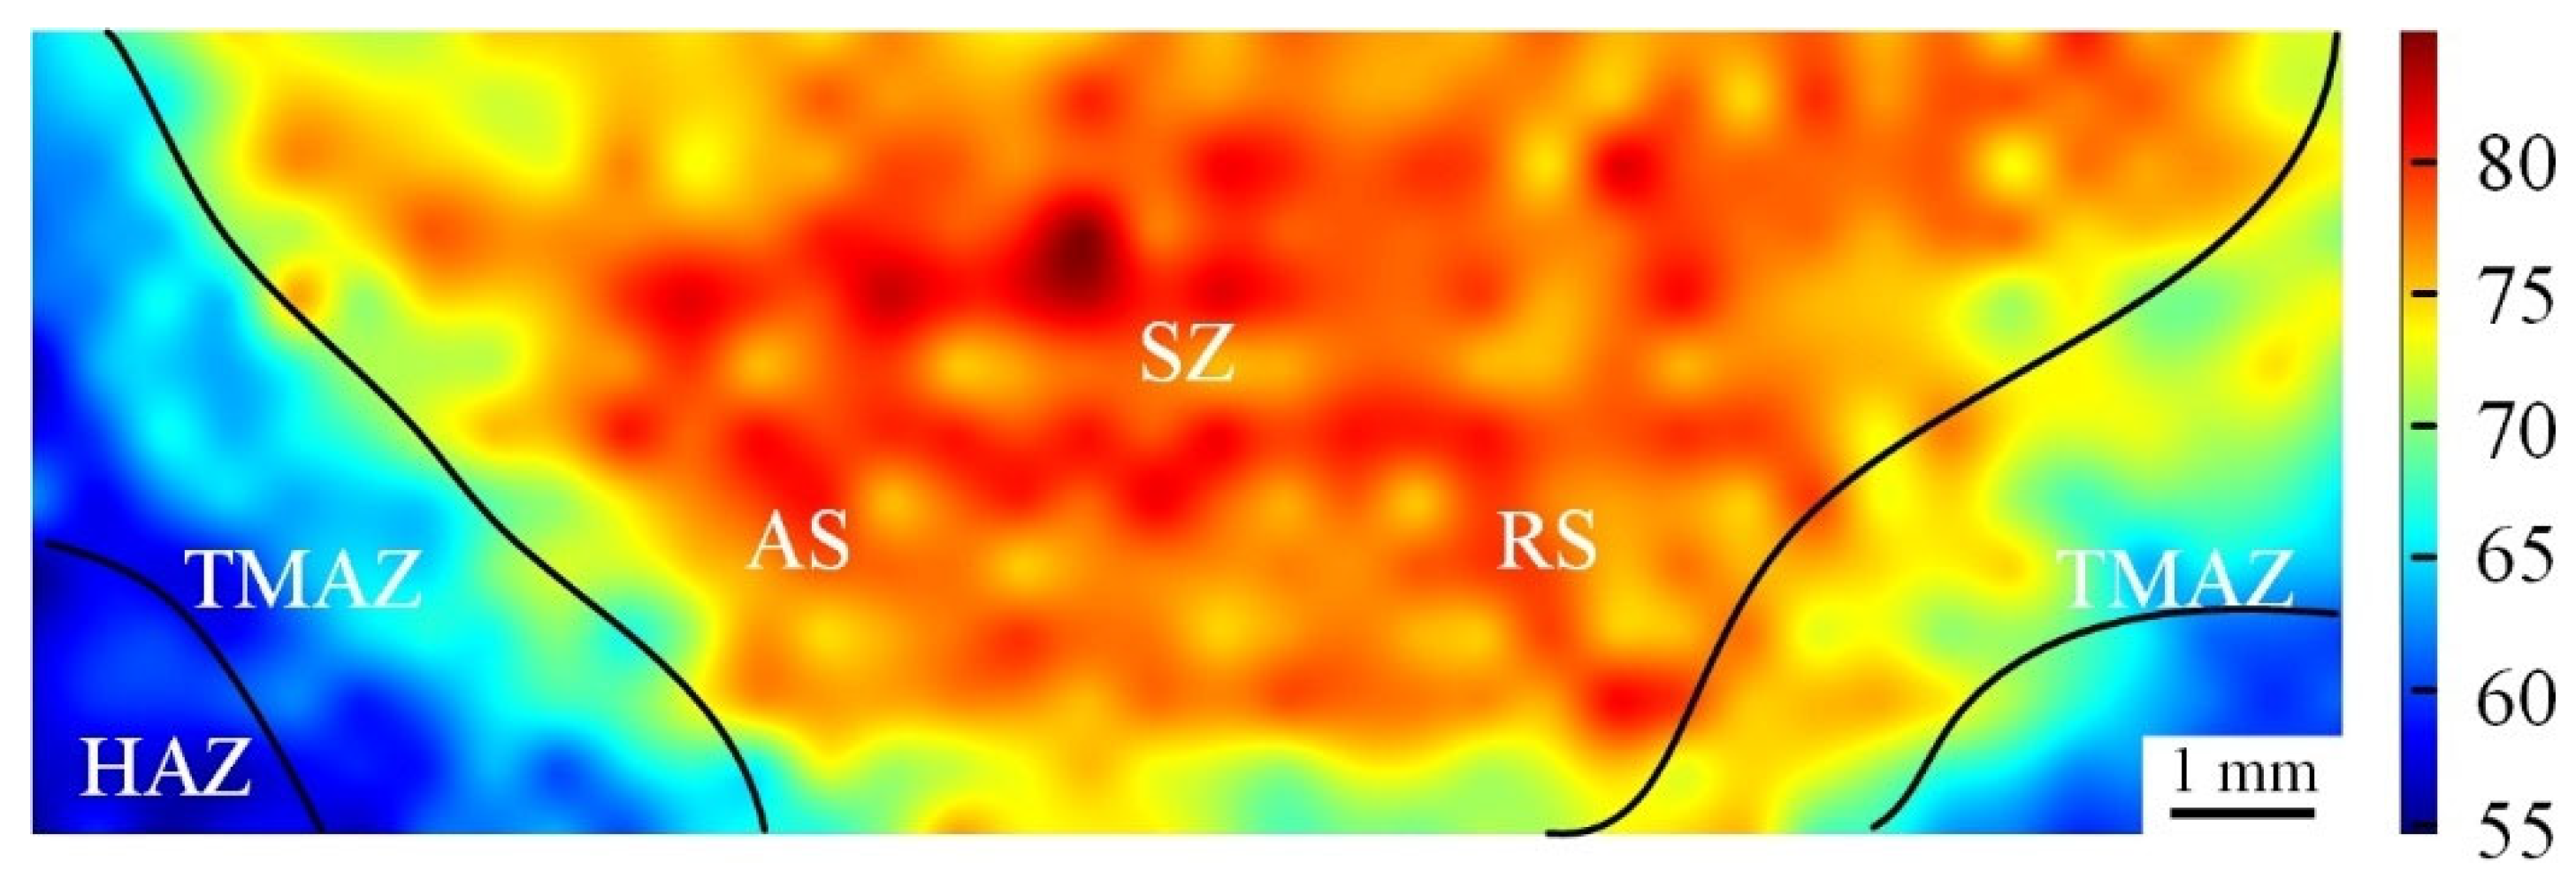
Test results indicated the BM hardness was 53.68 HV0.2. Figure 18 shows the hardness contour map of the cross-section of the plate L8 (600-100) after processing. The hardness distribution was consistent with the division of the SZ. After FSP, the hardness increased throughout the plate, with a significant rise in the SZ. The highest hardness was observed at the center of the SZ, with an average hardness of 79.17 HV0.2. Grain refinement strengthening and work hardening were the primary reasons for the increased hardness in the SZ [43].
Figure 18.
The hardness contour map in the cross-section of the plate after FSP (unit: HV0.2).
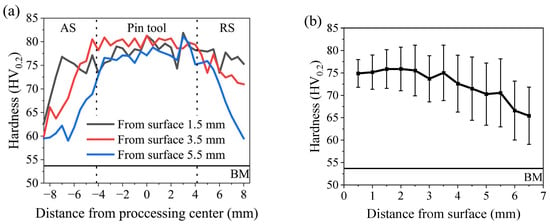
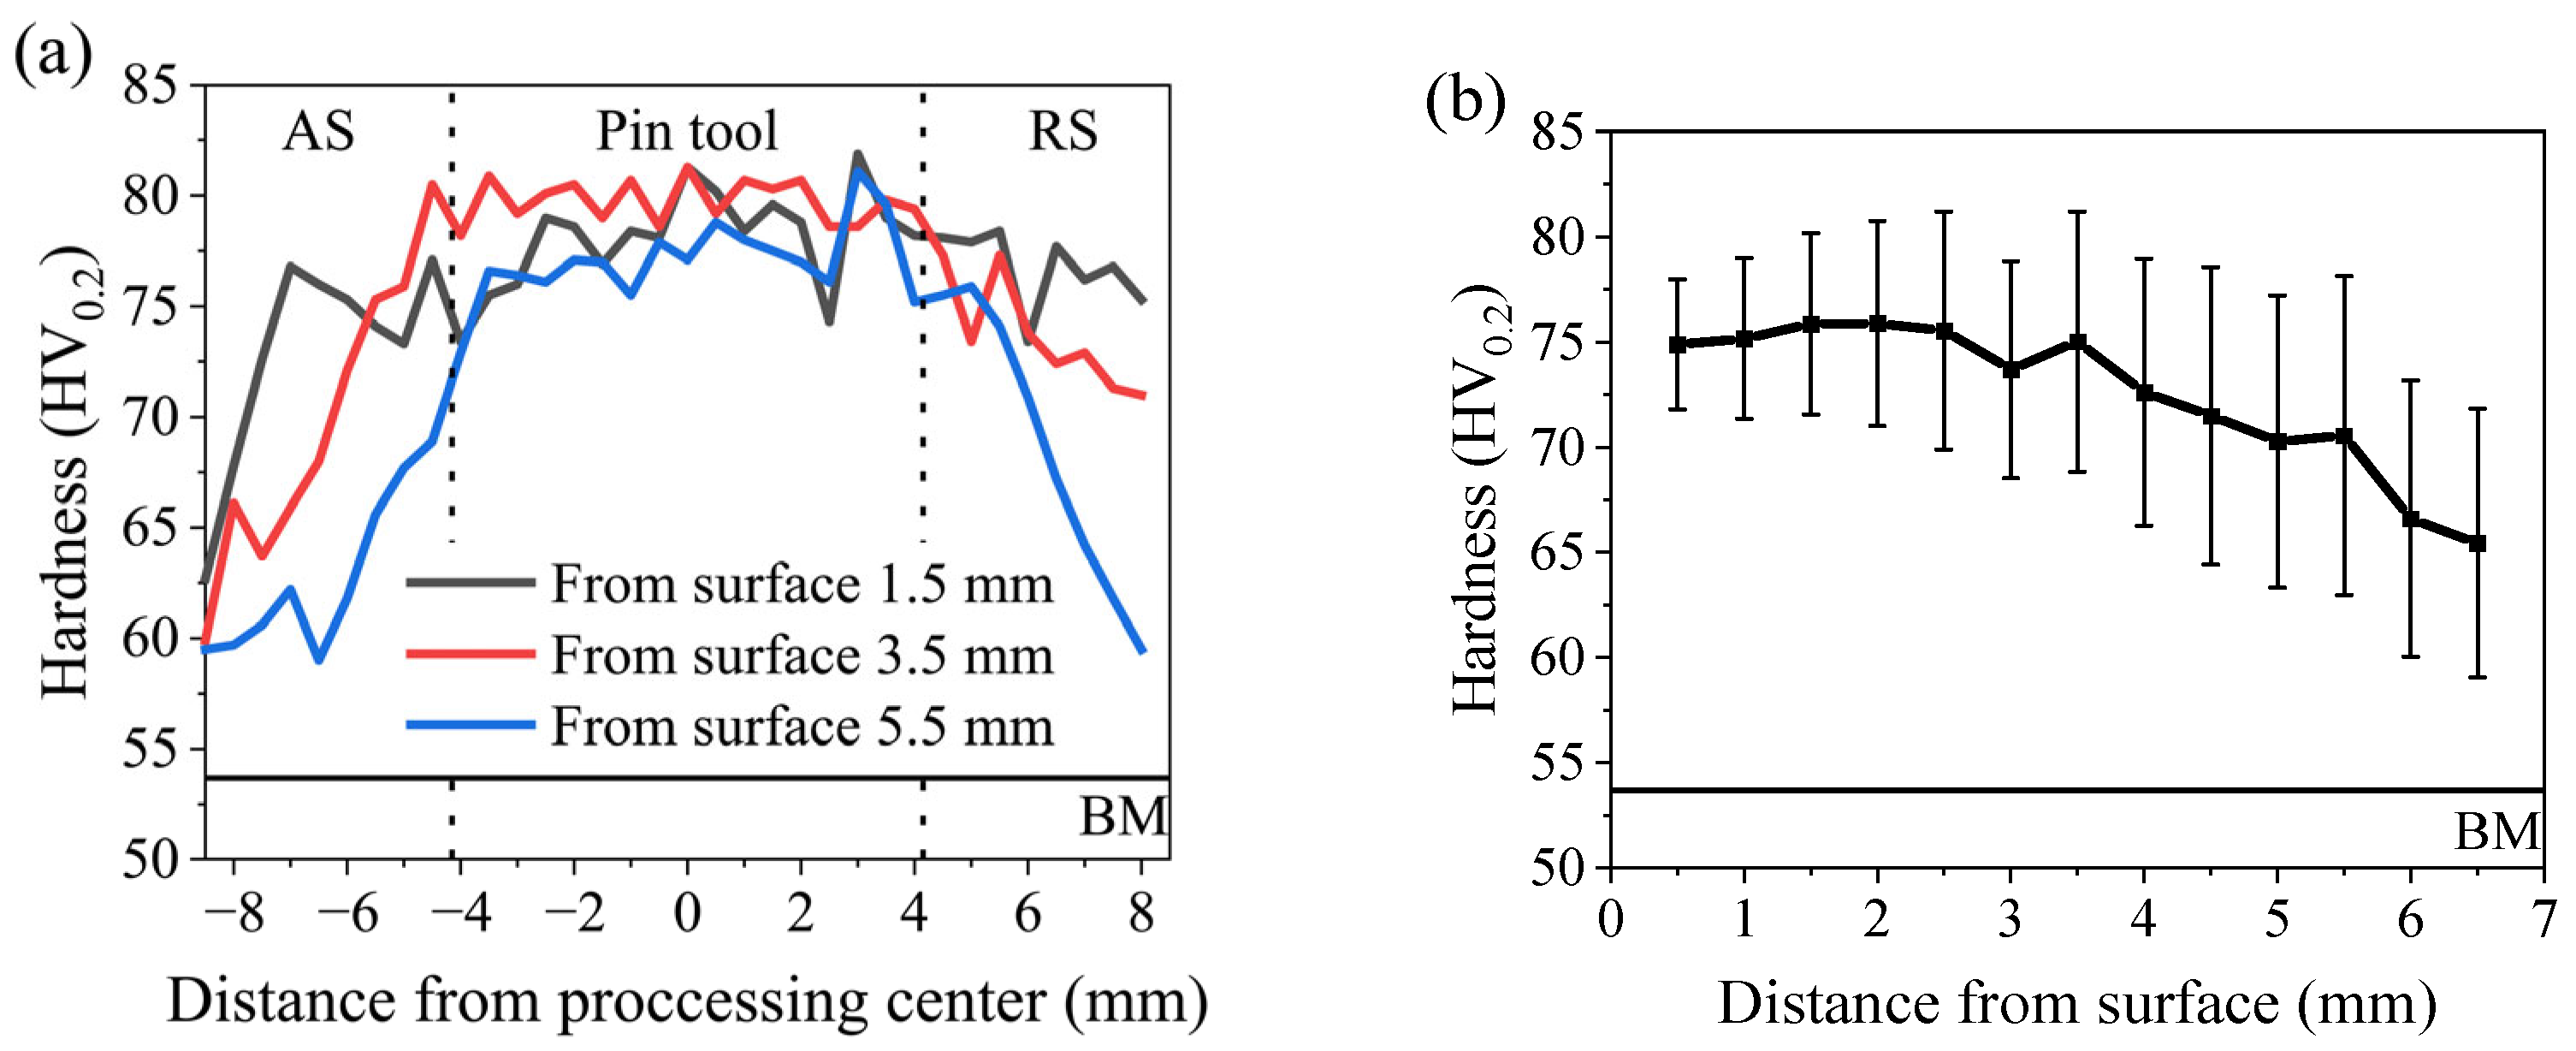
Figure 19 shows the hardness distribution of the plate cross-section after processing with the parameter L8 (600-100). The overall hardness in the SZ was significantly higher than that of the BM, with an average hardness of 77.32 HV0.2. As shown in Figure 19a, the hardness distribution was relatively uniform in the central region of the SZ, where the mechanical stirring effect of the tool was stronger, leading to enhanced hardness [26]. The hardness decreased markedly on both sides of the SZ, indicating poorer strengthening effects. Figure 19b reveals that the average hardness at different distances from the upper surface first increased slowly with thickness and then gradually decreased. Closer to the top surface, the thermal influence of the tool shoulder on the material was greater. Grains grew under the effect of higher heat input, resulting in a slight decrease in hardness. In the lower region of the SZ, the influence of the tool weakened. The strain generated decreased with increasing distance from the top surface, and the material-hardening effect gradually diminished.
Figure 19.
Distribution curves of plate cross-sectional hardness at (a) different depth positions and (b) center of the SZ along the normal direction.
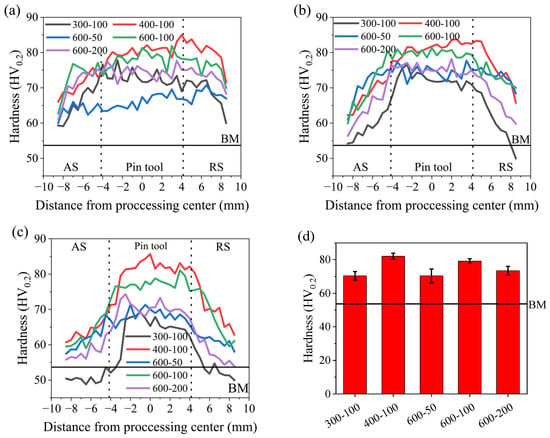
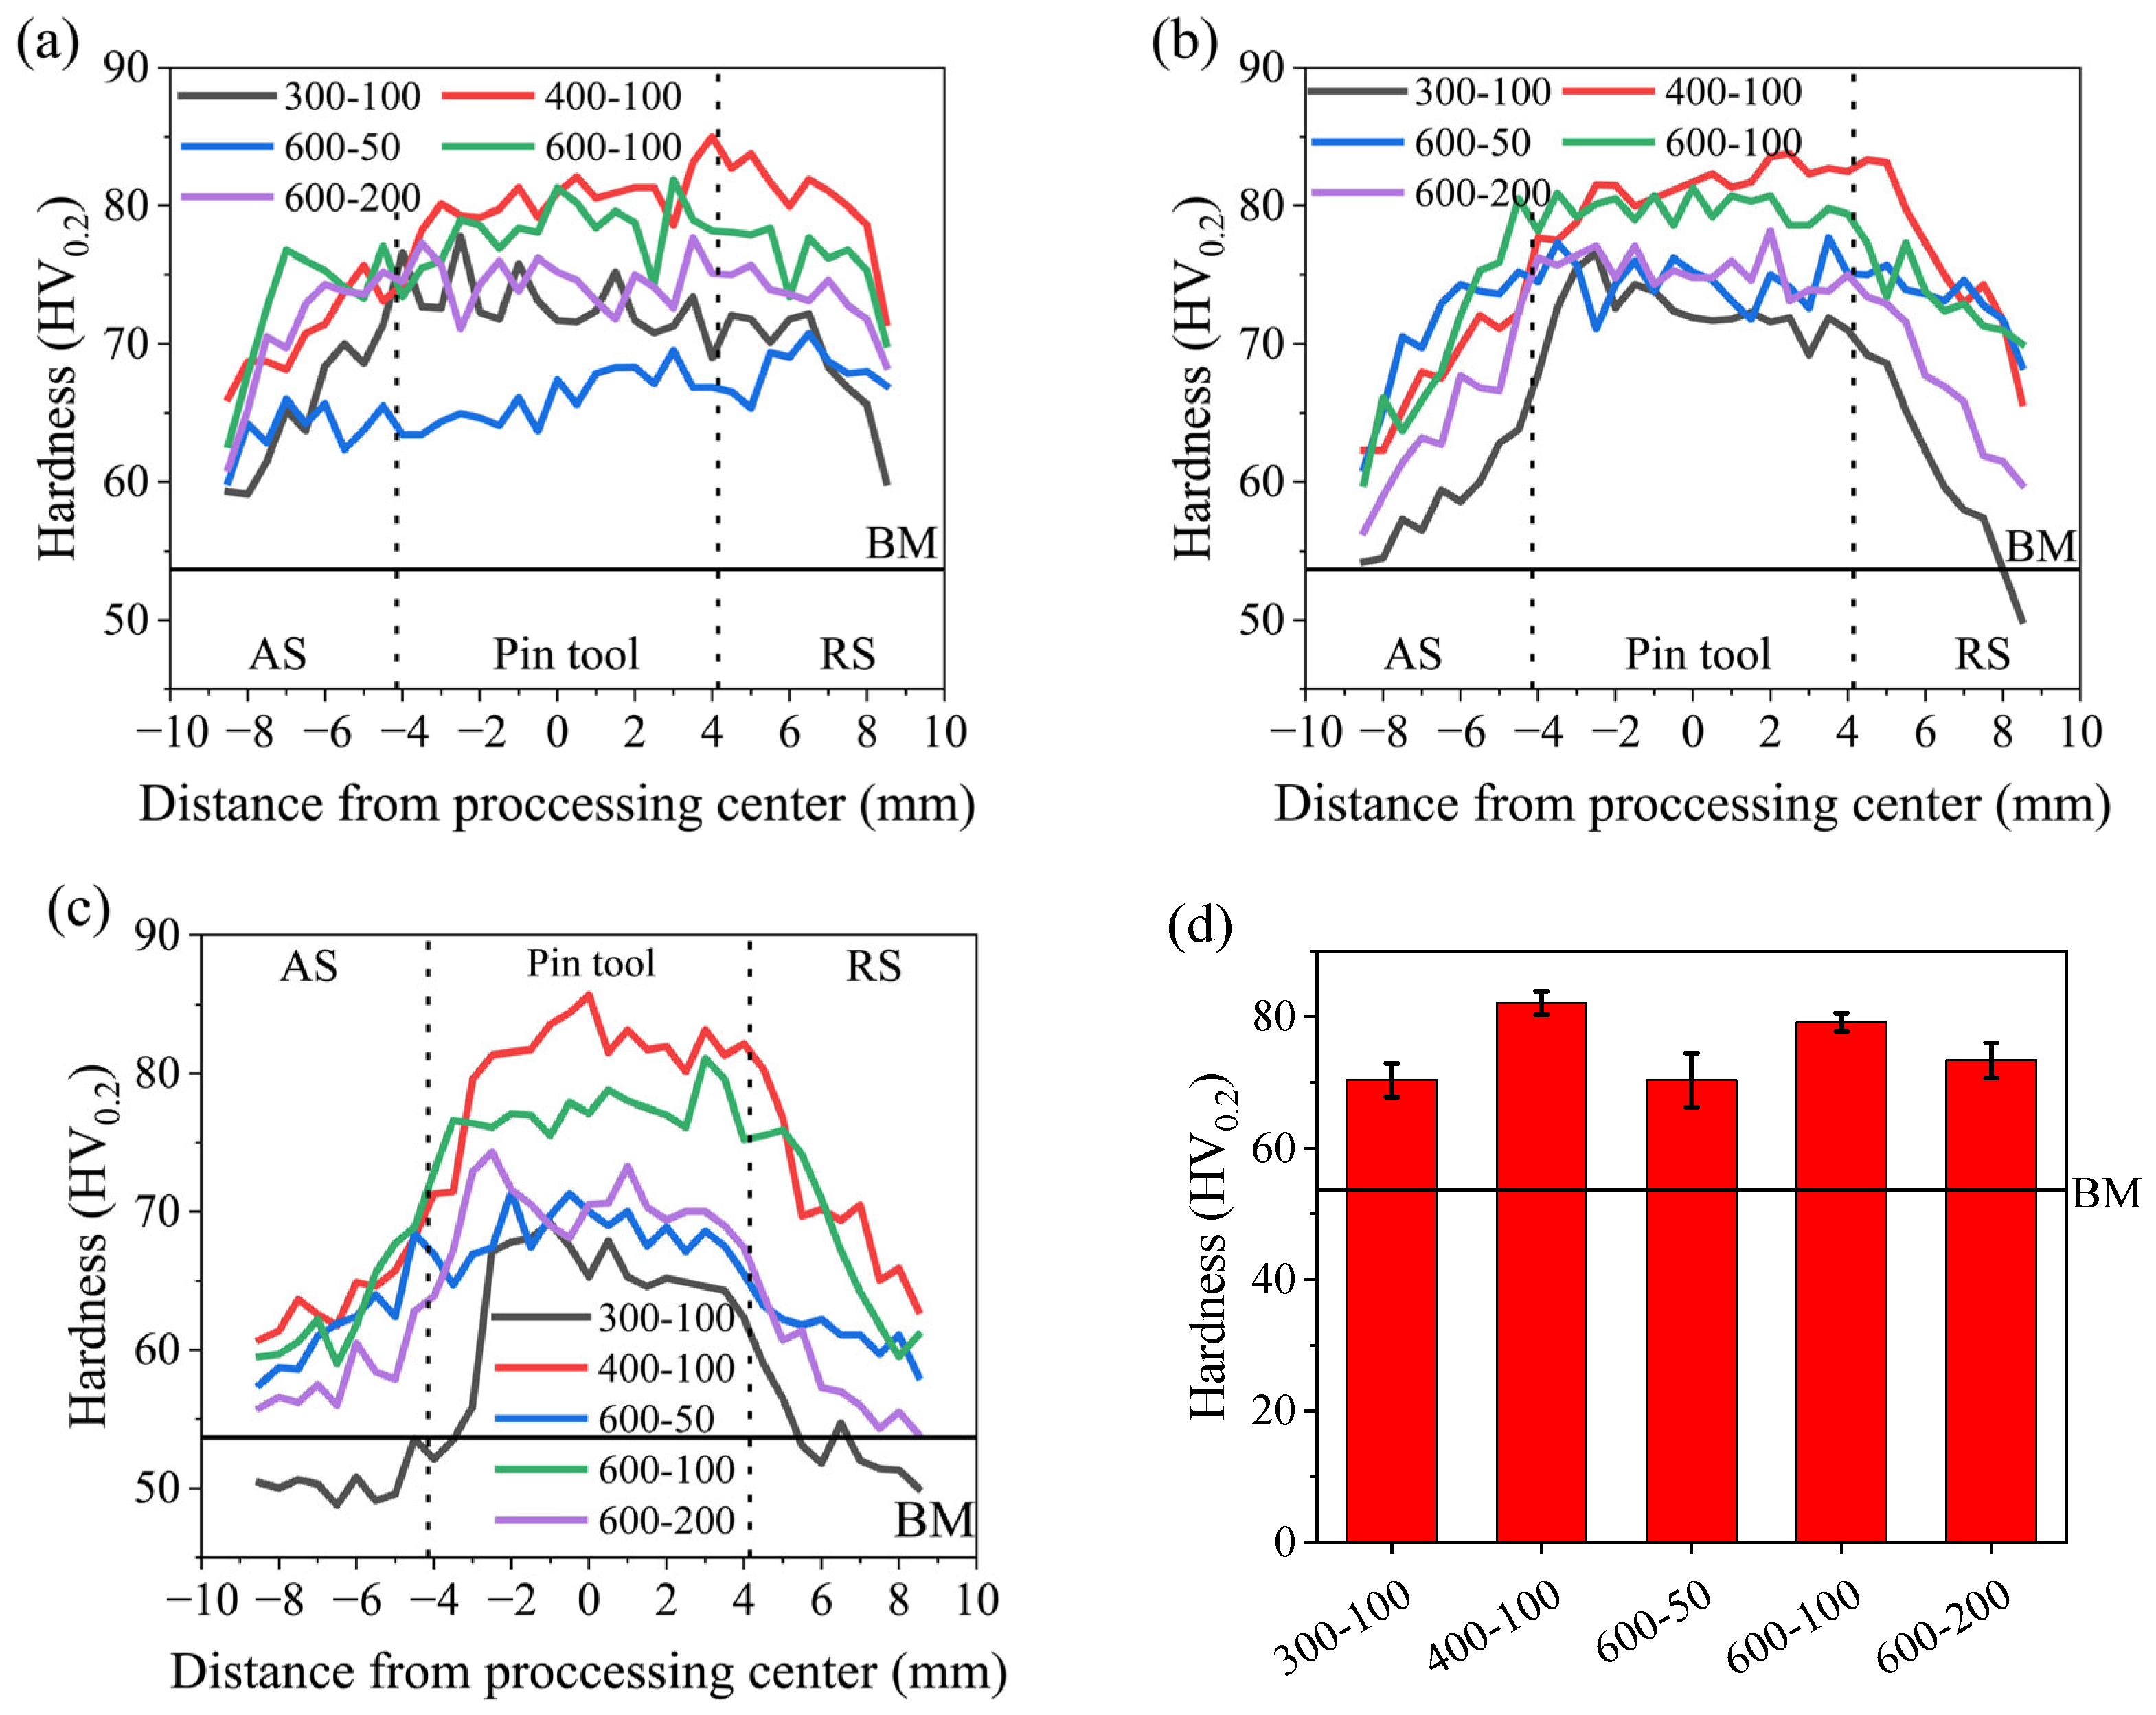
Figure 20 shows the influence of different process parameters on the hardness distribution of the Mg-Li alloy at various depths. For the upper region of the plate (1.5 mm from the top surface), Figure 20a indicates that the hardness on the RS was slightly higher than that on the AS. Large hard α-Mg phases existed in the RS of the SZ, enhancing its hardness. The upper region was subject to greater mechanical stress from the shoulder and thermal effects, resulting in higher recrystallization and relatively elevated hardness levels. At constant travelling speed, hardness initially increased then decreased with rising rotational speed, with the best strengthening effect observed at L5 (400-100). At a constant rotation speed, hardness in this region first increased and then decreased with increasing travelling speed. At a low tool travelling speed, such as L7 (600-50), the thermal input from the tool—particularly the shaft shoulder—to the plate was substantial. This caused material overheating, leading to excessive grain growth, lower material hardness, and poor strengthening effect.
Figure 20.
Hardness distribution under different process parameters at depths of (a) 1.5 mm, (b) 3.5 mm and (c) 5.5 mm; (d) average hardness at the stirring center.
Figure 20b shows the hardness distribution in the central region of the plate (3.5 mm from the surface). Significant differences in material-strengthening effects were observed at different rotational speeds, with the lowest hardness occurring at L2 (300-100). At 300 rpm, the material on the RS experienced minimal mechanical agitation from the tool, resulting in insufficient deformation. Residual matrix texture persisted in this region, causing its hardness to be even lower than that of the BM. The grain size at L5 (400-100) was smaller, resulting in higher hardness than at L8 (600-100). At L7 (600-50), the temperature in this zone was lower than in the upper region, allowing hardness to recover somewhat and reach levels comparable to L9 (600-200). Additionally, it was observed that the travelling speed had a relatively minor influence on material hardness.
For the lower region of the plate (5.5 mm from the surface), Figure 20c shows that the hardness of most areas at L2 (300-100) was lower than that of the BM. Instead of enhancing material properties, the FSP weakened them. At low rotational speeds, the tool generated low thermal power. With minimal heat input, the material exhibited poor flowability, and the mechanical agitation effect of the tool on the material was ineffective, thereby degrading material properties. At L5 (400-100) and L8 (600-100), this region still achieved good strengthening effects. The high-speed tool induced sufficient dynamic recrystallization in the material, resulting in favorable strengthening. Compared to other travelling speeds, the material at L8 (600-100) still attained a relatively high hardness level in this region. This indicated that under the experimental conditions of this paper, the strengthening effect was optimal at a travelling speed of 100 mm/min.
Figure 20d shows the average hardness of the stirring center under different process parameters. It was evident that the highest hardness was achieved at L5 (400-100), with an average hardness of 82.10 HV0.2 and a hardness standard deviation of 1.80 in the ND, indicating a relatively uniform hardness distribution. At L8 (600-100), the average hardness of the center was 79.17 HV0.2, with a standard deviation of 1.40 in the ND, indicating the most uniform hardness distribution. The lowest average hardness values were observed at L2 (300-100) (70.34 HV0.2) and L7 (600-50) (70.33 HV0.2). This indicated that process parameters significantly influenced the hardness of the processed material. Overall, the L5 (400-100) process parameters yielded the best strengthening effect, while L8 (600-100) provided the most uniform strengthening distribution.
3.4. Tensile Properties
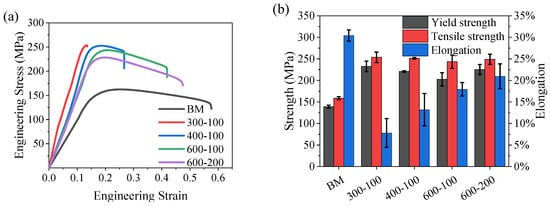
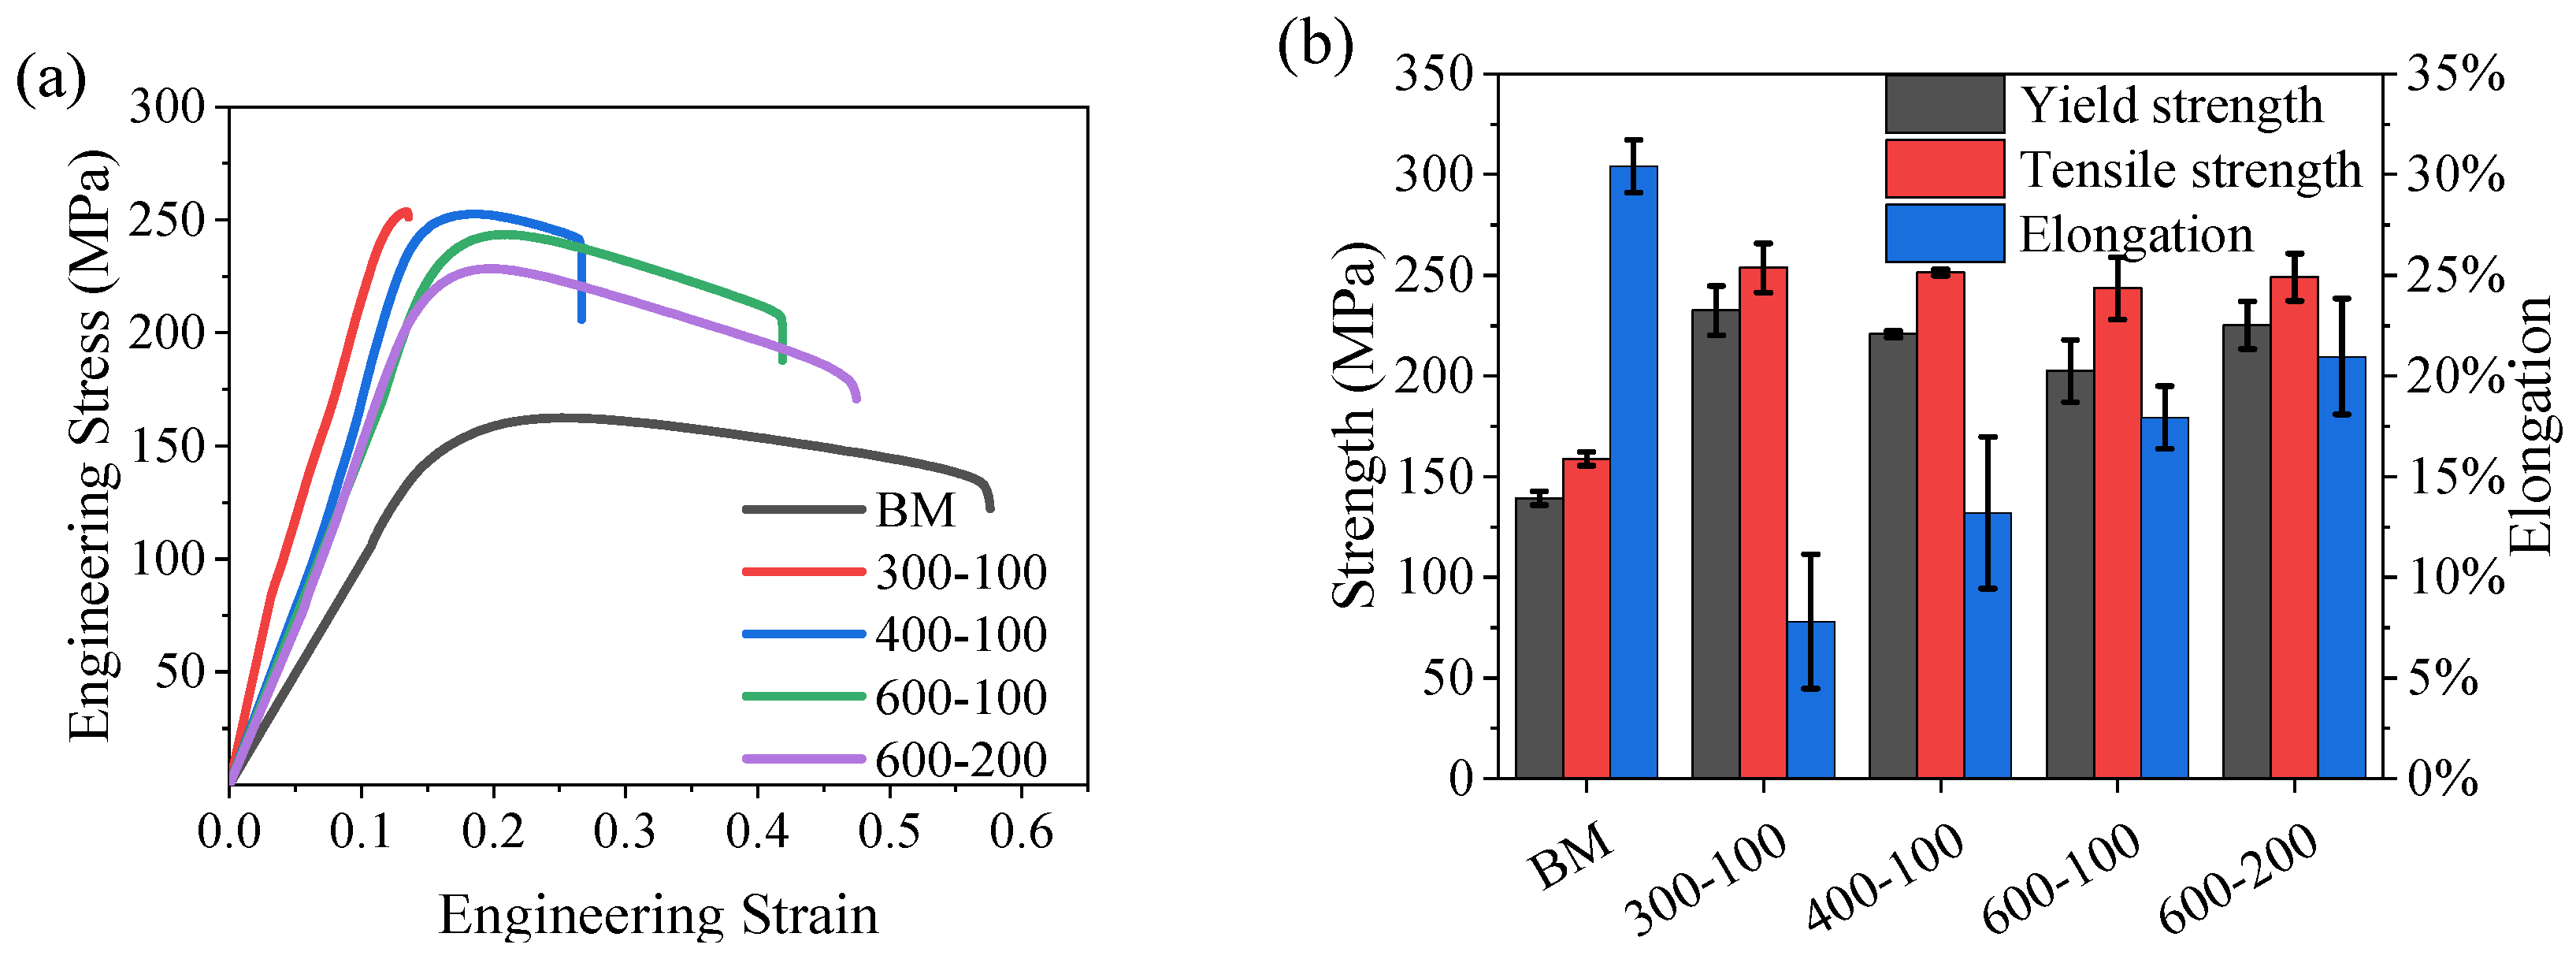
Figure 21 shows the effect of process parameters on the tensile properties of processed Mg-Li alloy materials. The specimen processed at L7 (600-50), although free from obvious macroscopic defects, exhibited premature fracture at a relatively low load during tensile testing, indicating the presence of latent internal defects. Therefore, L7 was excluded from the comparative tensile property analysis to ensure that the reported results reflect the intrinsic mechanical behavior of defect-free FSPed material. The tensile strength of BM was 158.9 MPa, with an elongation after fracture of 30.4%. Compared to the BM, the tensile strength of specimens processed at L2 (300-100), L5 (400-100), L8 (600-100), and L9 (600-200) increased, while the elongation after fracture slightly decreased. As discussed in Section 3.2, the effect of FSP on microstructure indicated that the formation of a network layer of α-Mg phase at the β-Li phase grain boundaries, which restricted deformation, was the primary cause of the decrease in plasticity of the material after FSP.
Figure 21.
(a) Engineering stress–strain curves and (b) tensile properties under different parameters.
Figure 21a reveals that as rotational speed increased, the tensile strength of the material gradually decreased while the elongation after fracture progressively increased. The tensile strengths for the L2 (300-100), L5(400-100), and L8 (600-100) conditions were 253.6, 251.4, and 243.6 MPa, respectively, while the elongation after fracture was 7.8%, 13.2%, and 17.9%, respectively. Compared to the BM, the tensile strength of the materials processed under the three sets of parameters increased by 59.6%, 58.2%, and 53.3%, respectively, while the elongation at break decreased by 74.4%, 56.6%, and 41.1%, respectively.
The microstructure shown in Figure 11 reveals that at lower rotational speeds, significant grain refinement occurred with a higher number of equiaxed grains. This was the primary reason for the marked increase in tensile strength. Additionally, the processed Mg-Li alloy contained a relatively high proportion of α-Mg phase, which exhibited high tensile strength [44] but reduced the grain’s capacity to accommodate dislocations [45], leading to a sharp decrease in elongation after fracture. As the rotational speed increased, the thermal input rose, causing grain growth in the recrystallized structure. This resulted in a decrease in the tensile strength while the elongation after fracture showed improvement.
When the rotational speed was constant, the tensile strength of the processed material decreased with increasing travelling speed. After processing at L9 (600-200), the tensile strength reached 249.0 MPa, representing a 56.7% increase over the parent material. However, the elongation after fracture dropped to 21.0%, a 30.9% decrease compared to the BM. When the travelling speed increased from 100 mm/min to 200 mm/min, the heat input and stirring intensity applied to the material per unit time decreased, leading to reduced dynamic recrystallization and consequently lower tensile strength.
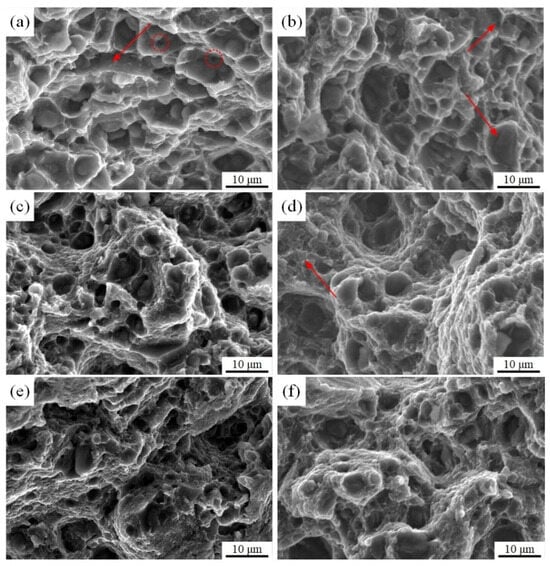
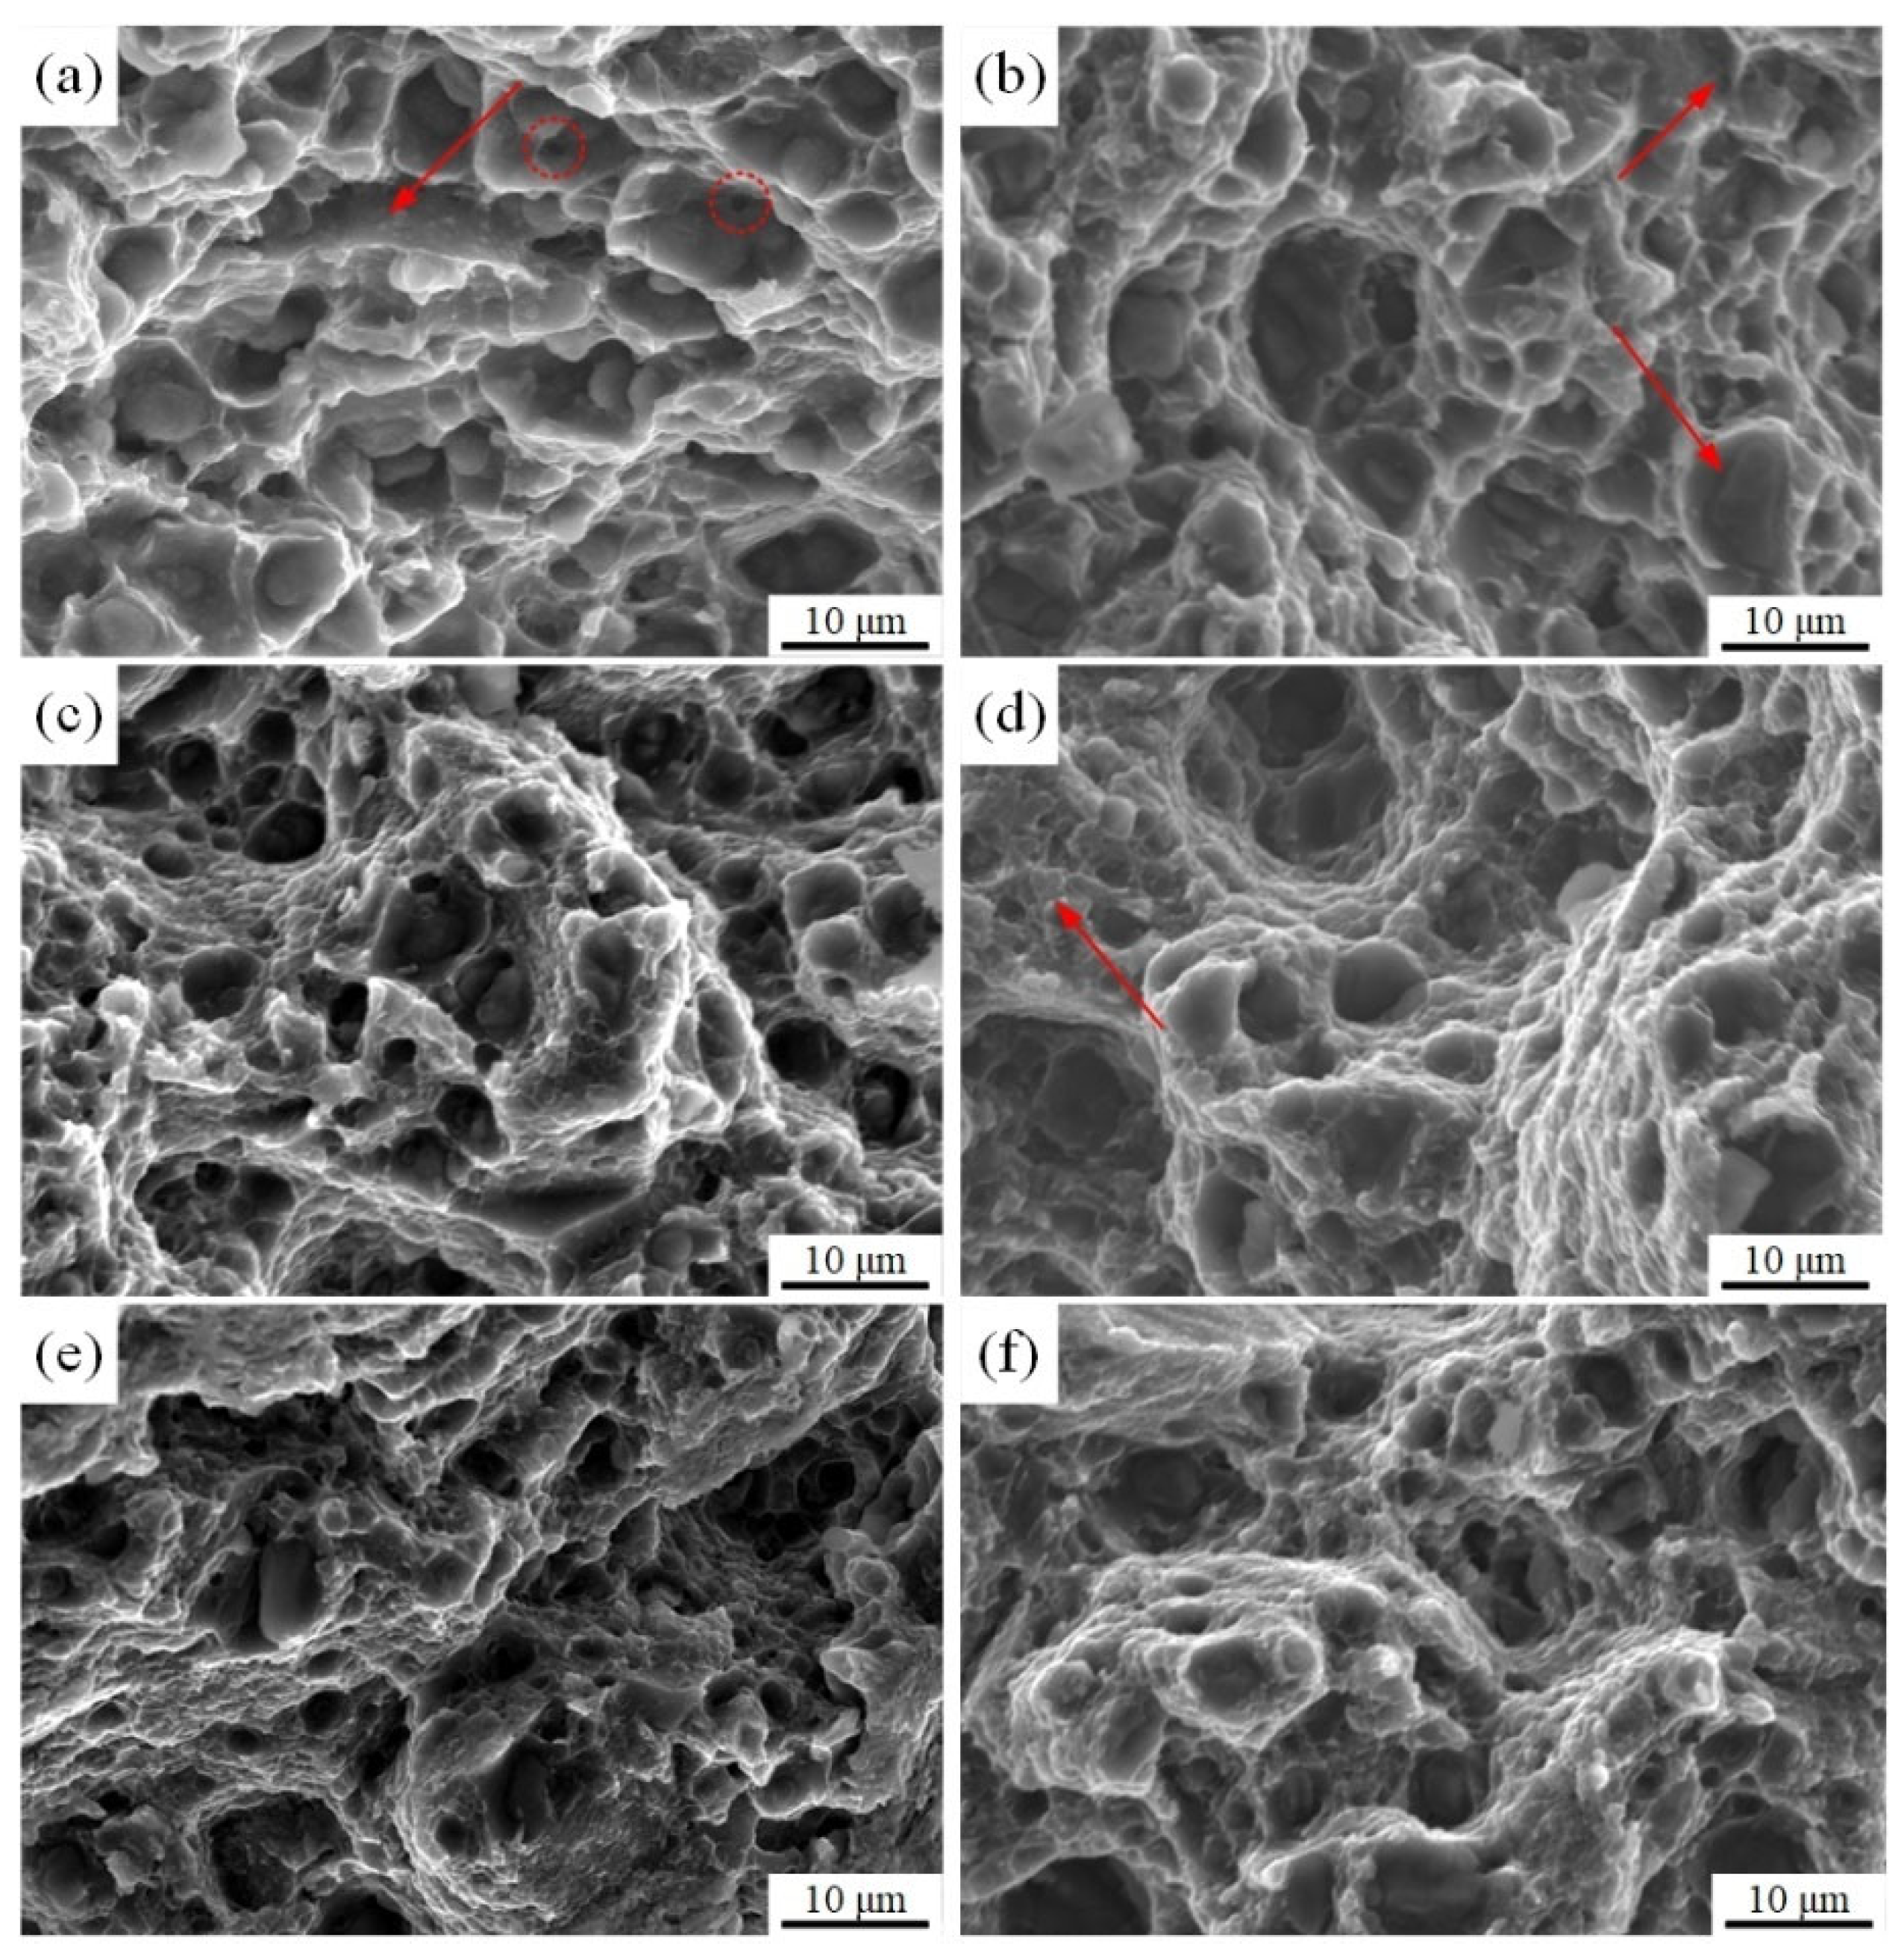
Figure 22 shows the fracture surface morphology of samples with significant differences in fracture characteristics observed across varying process parameters. Figure 22a shows the tensile fracture surface of the BM, exhibiting cleavage planes (indicated by red arrows) and deep ductile dimples, with a mixed ductile–brittle fracture mode. The circled areas indicated internal microstructural defects. After FSP, Figure 22b–f reveals closed pore defects, indicating that FSP would reduce microstructural defects.
Figure 22.
Tensile fracture under different parameters: (a) BM, (b) L2 (300-100), (c) L5 (400-100), (d) L7 (600-50), (e) L8 (600-100), (f) L9 (600-200).
At lower rotational speeds (Figure 22b), the fracture surface was flatter (indicated by red arrows), with fewer and shallower ductile dimples. This was consistent with the poor plasticity exhibited in tensile test. As discussed in Section 3.2, at lower rotational speeds, the volume fraction of α-Mg phase in the material was higher. The differing crystal structures between α-Mg phase and β-Li phase resulted in poor deformation coordination, leading to relatively poor plasticity [46]. As the rotational speed increased (Figure 22c,e), the number and depth of ductile dimples on the fracture surface increased, with numerous deep dimples appearing. Overall, the fracture morphology exhibited a predominantly ductile fracture behavior.
When the process parameter was at L7(600-50) (Figure 22d), fewer ductile dimples were observed, and quasi-cleavage morphology appeared at the location indicated by the arrow, exhibiting a degree of brittle fracture consistent with the behavior seen in tensile tests. As shown in Figure 22e,f, the increase in travelling speed led to a greater number of dimples on the fracture surface, with numerous equiaxed dimples appearing. This indicated good plasticity, and the post-fracture elongation at L9 (600-200) reached 21.0%.
3.5. Relationship Between Process Parameters and Microstructure Properties
FSP could refine grains and enhance material properties due to dynamic recrystallization occurring during intense plastic deformation induced by the tool in Mg-Li alloys. Deformation temperature and strain rate were the main factors influencing the degree of dynamic recrystallization, with higher deformation temperatures and strain rates leading to greater recrystallization [47,48]. However, excessively high deformation temperatures would cause excessive grain growth and deteriorate properties, thereby failing to achieve strengthening effects.
In FSP, heat input primarily came from the friction-induced heat generated between the tool and the plate material. The heat generation power Q was related to the rotational speed and travelling speed of the tool, satisfying the following relationship [49,50,51]:
where ω was the angular velocity of the tool and v was its linear velocity. Substituting into the above equation and treating the product of other coefficients as k yields the following:
where n was the rotation speed of the tool; the unit of coefficient k is J∙mm/(min∙rpm2). The relationship between process parameters and heat input Q for defect-free plates after FSP is shown in Table 2. As indicated in the table, the heat input of L3 (300-200) yielded the lowest value. However, due to the relatively low temperature, the plates failed to fuse promptly during processing, resulting in tunnel-type defects. For other processing parameters, the heat input of the plates was higher, and the temperature in the SZ was elevated; as such, no significant macroscopic defects were observed.
Table 2.
The relationship between FSP parameters and Q.
The experiment results indicated that process parameters significantly influenced the grain size and strength of the Mg-Li alloy. Table 3 presents the average grain size, tensile strength, and yield strength at the center of the SZ in the defect-free plates after FSP.
Table 3.
Average grain size and tensile properties of SZ.
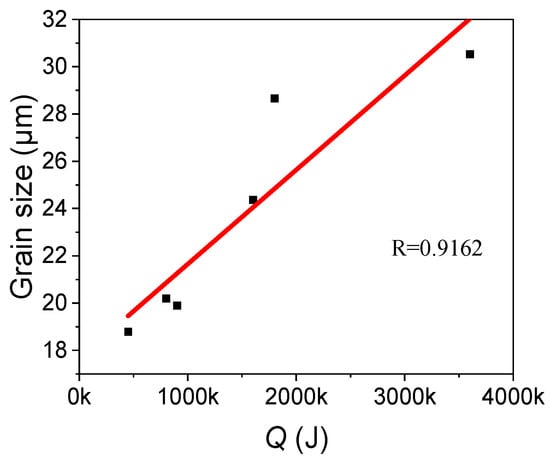
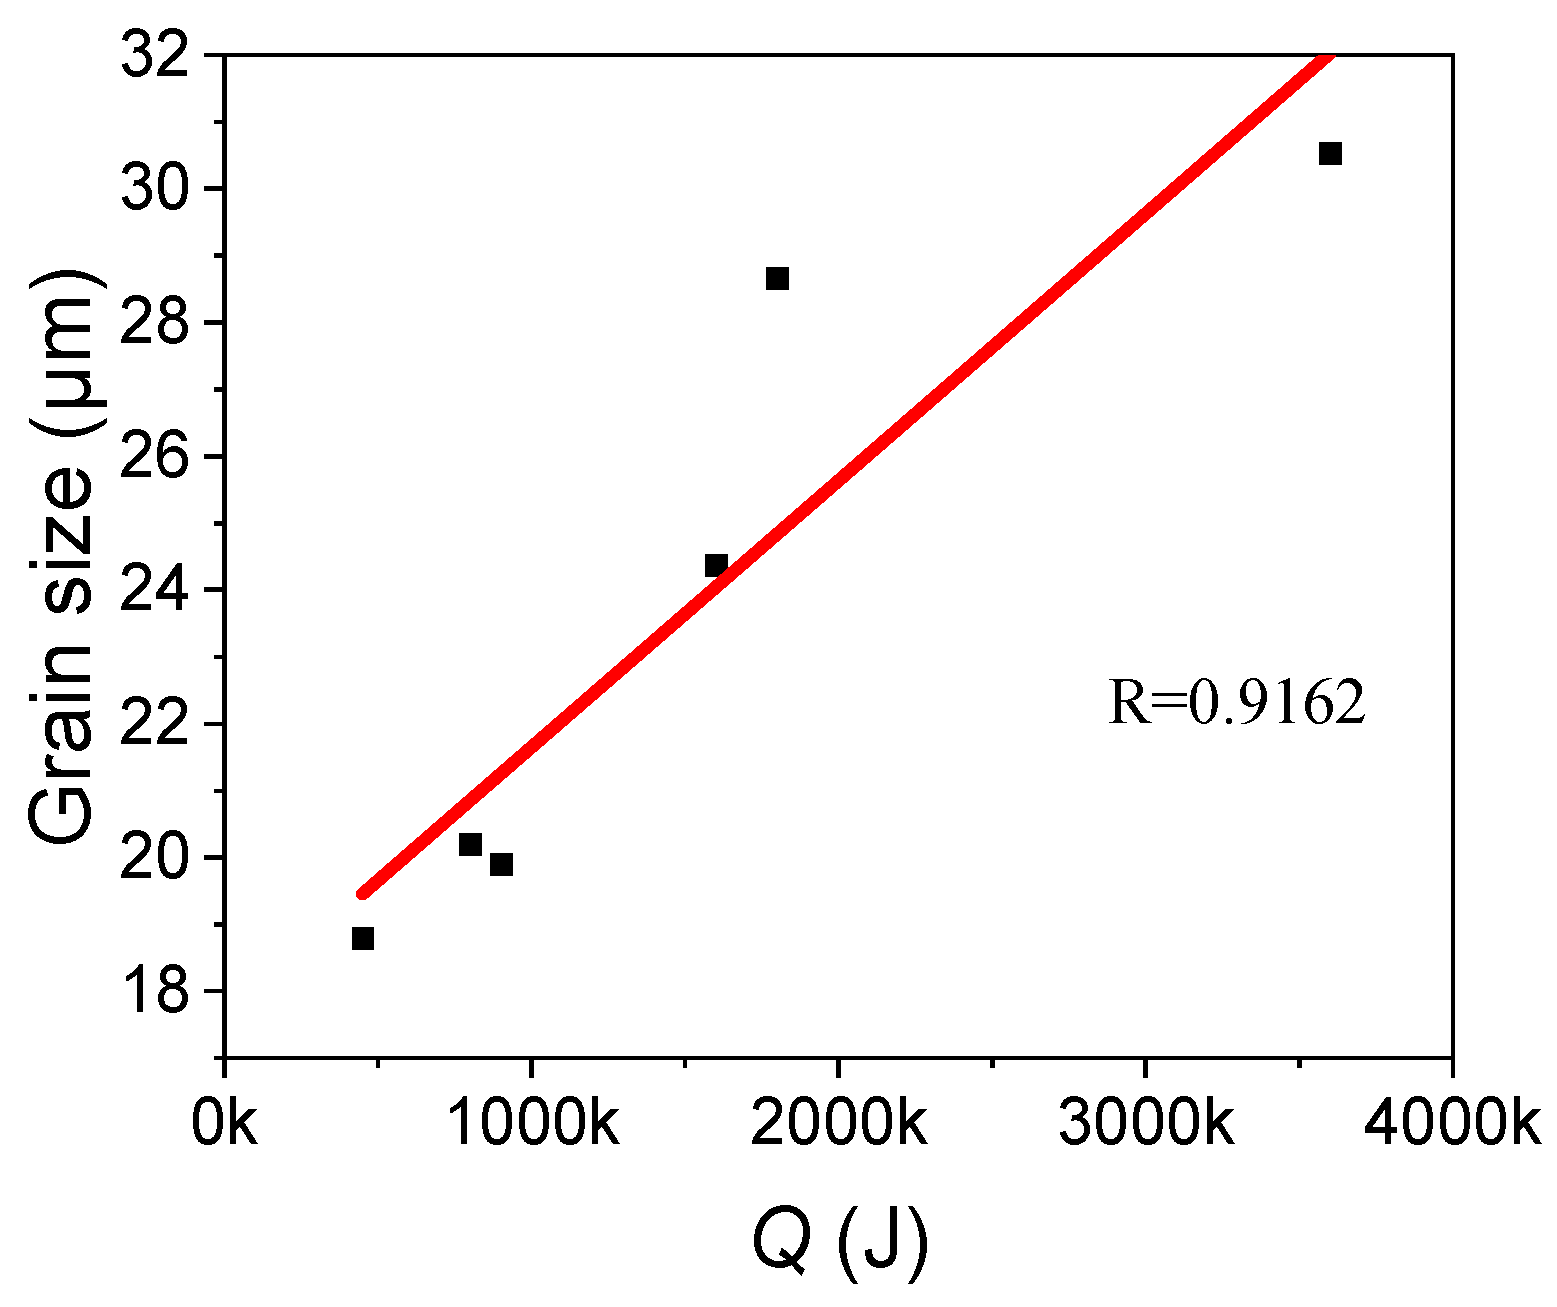
As shown in Section 3.2, increasing the tool rotation speed or decreasing the travelling speed both led to an increase in grain size within the SZ. Figure 23 shows the fitted curve of the grain size at the center of the SZ versus heat input Q under different process parameters, with the fitted relationship expressed as follows:
Figure 23.
Relationship between average grain size and Q under different parameters.
It was observed that as the tool rotation speed increased and the travelling speed decreased—namely, with rising heat input—the grain size in SZ gradually grew larger. The grain size exhibited a largely linear relationship with the heat input from the tool. As the heat input increased, the plate temperature rose, enhancing atomic diffusion within the SZ. This led to the dissolution of the α-Mg phase, accelerated grain growth rates, and larger grain sizes.
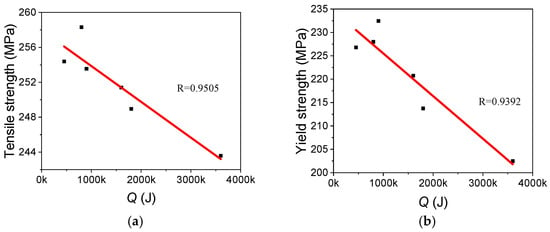
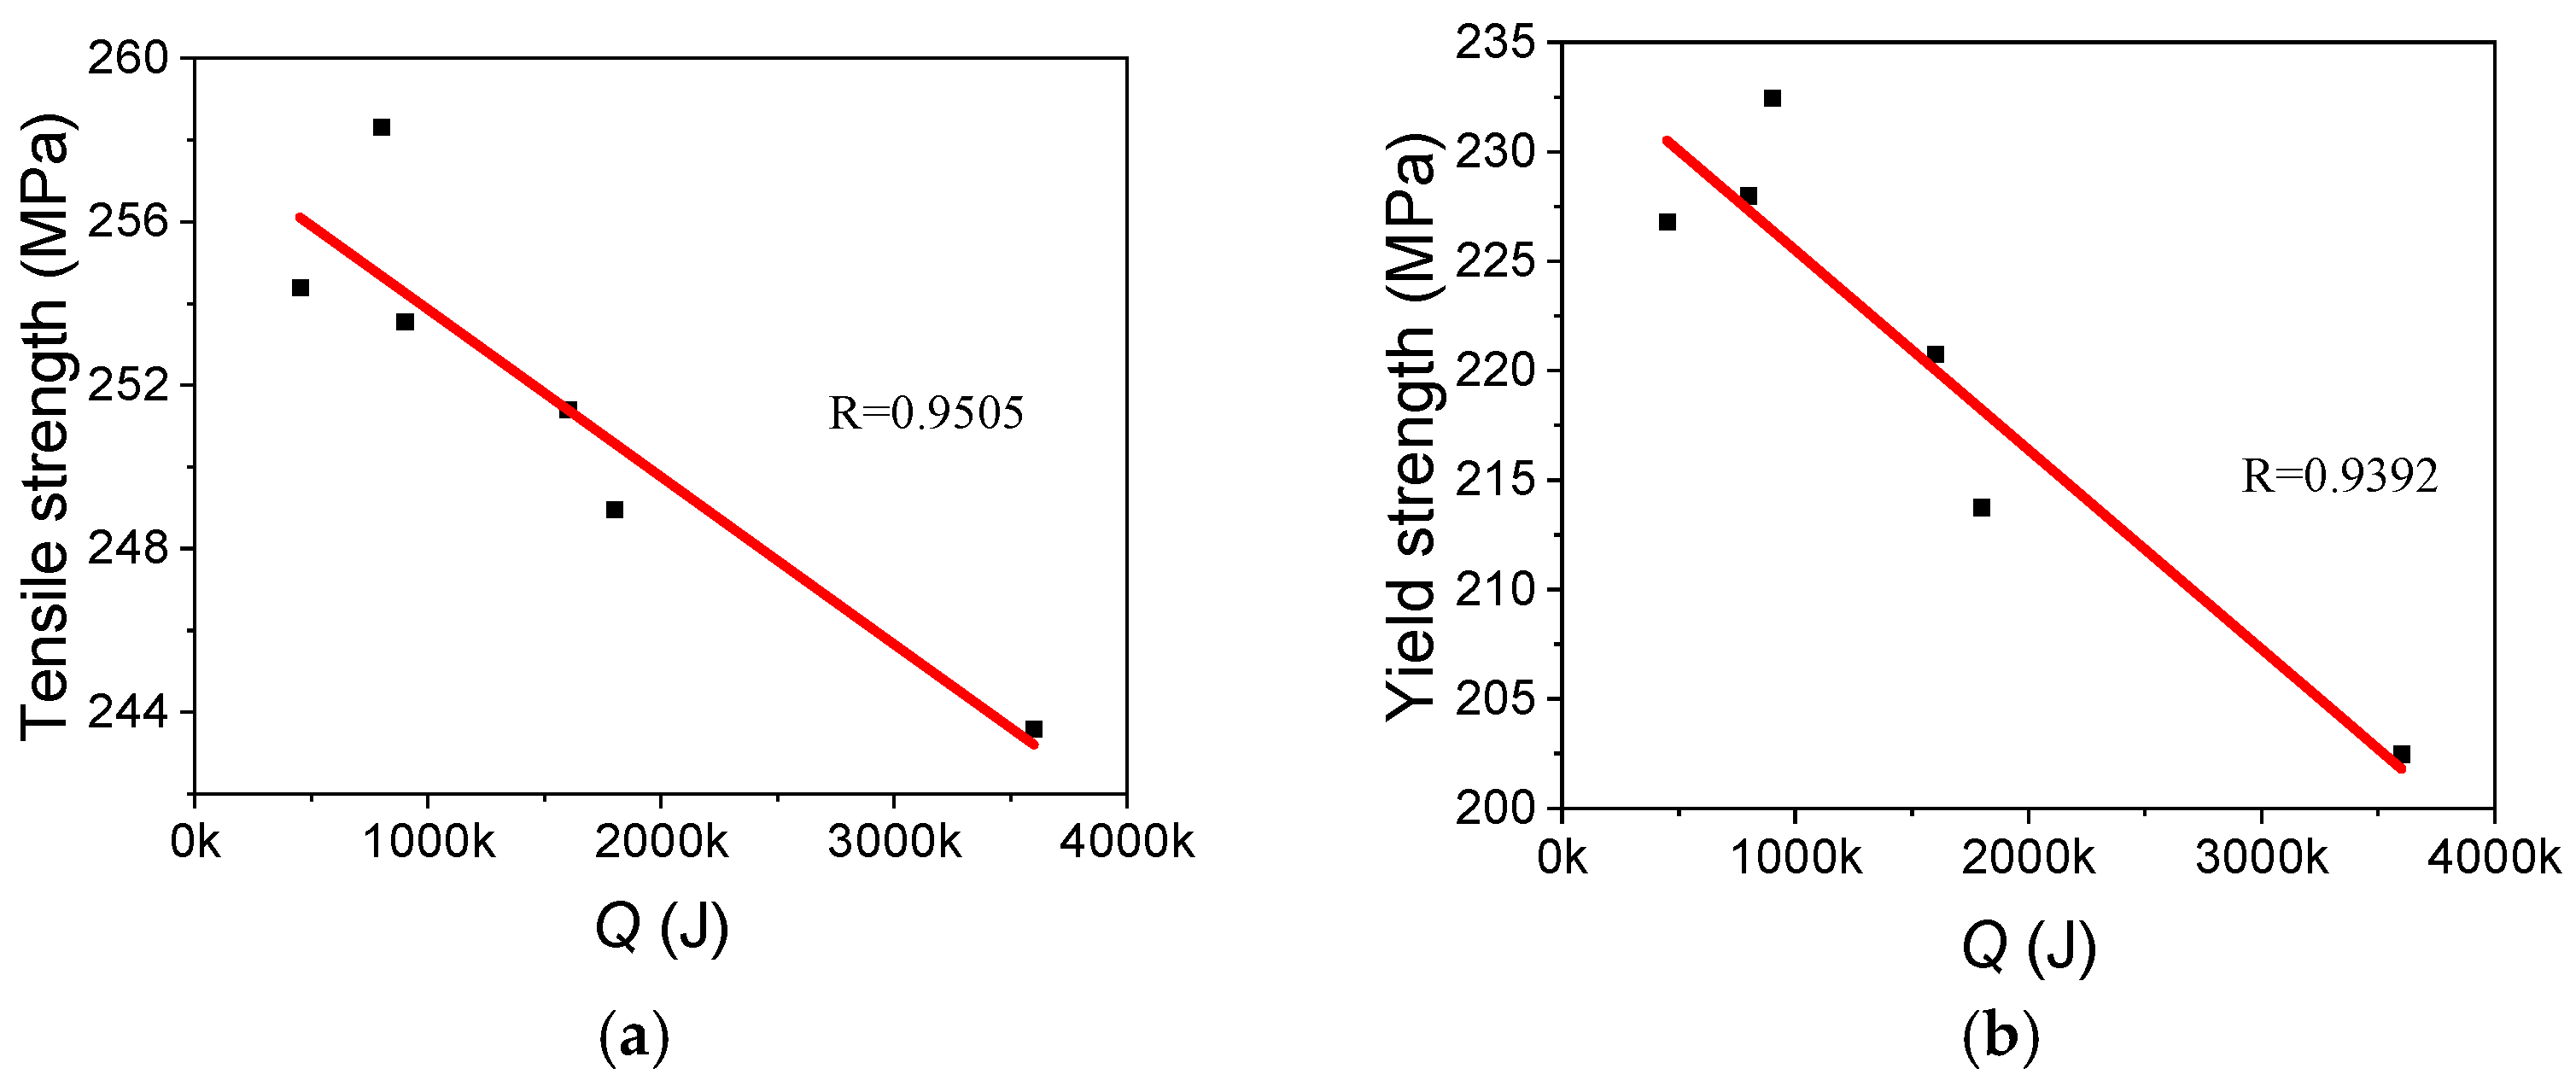
From Section 3.4, it was observed that tensile strength was closely related to process parameters. Figure 24 shows the fitted curves of tensile strength, yield strength, and heat input Q for materials processed under different parameters. The corresponding fitting equations were as follows:
Figure 24.
Relationships between (a) tensile strength, (b) yield strength and Q.
Clearly, both tensile strength and yield strength exhibited a linear decrease trend as heat input Q increased.
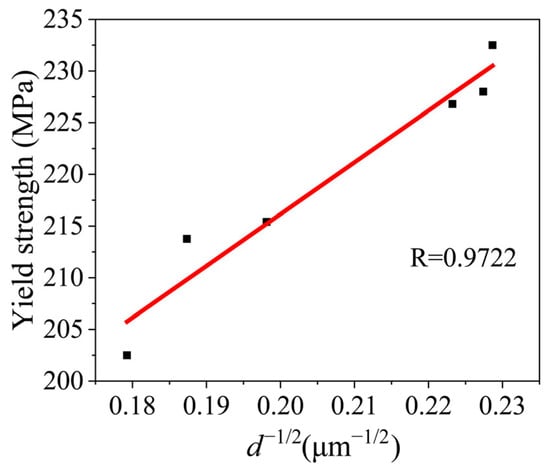
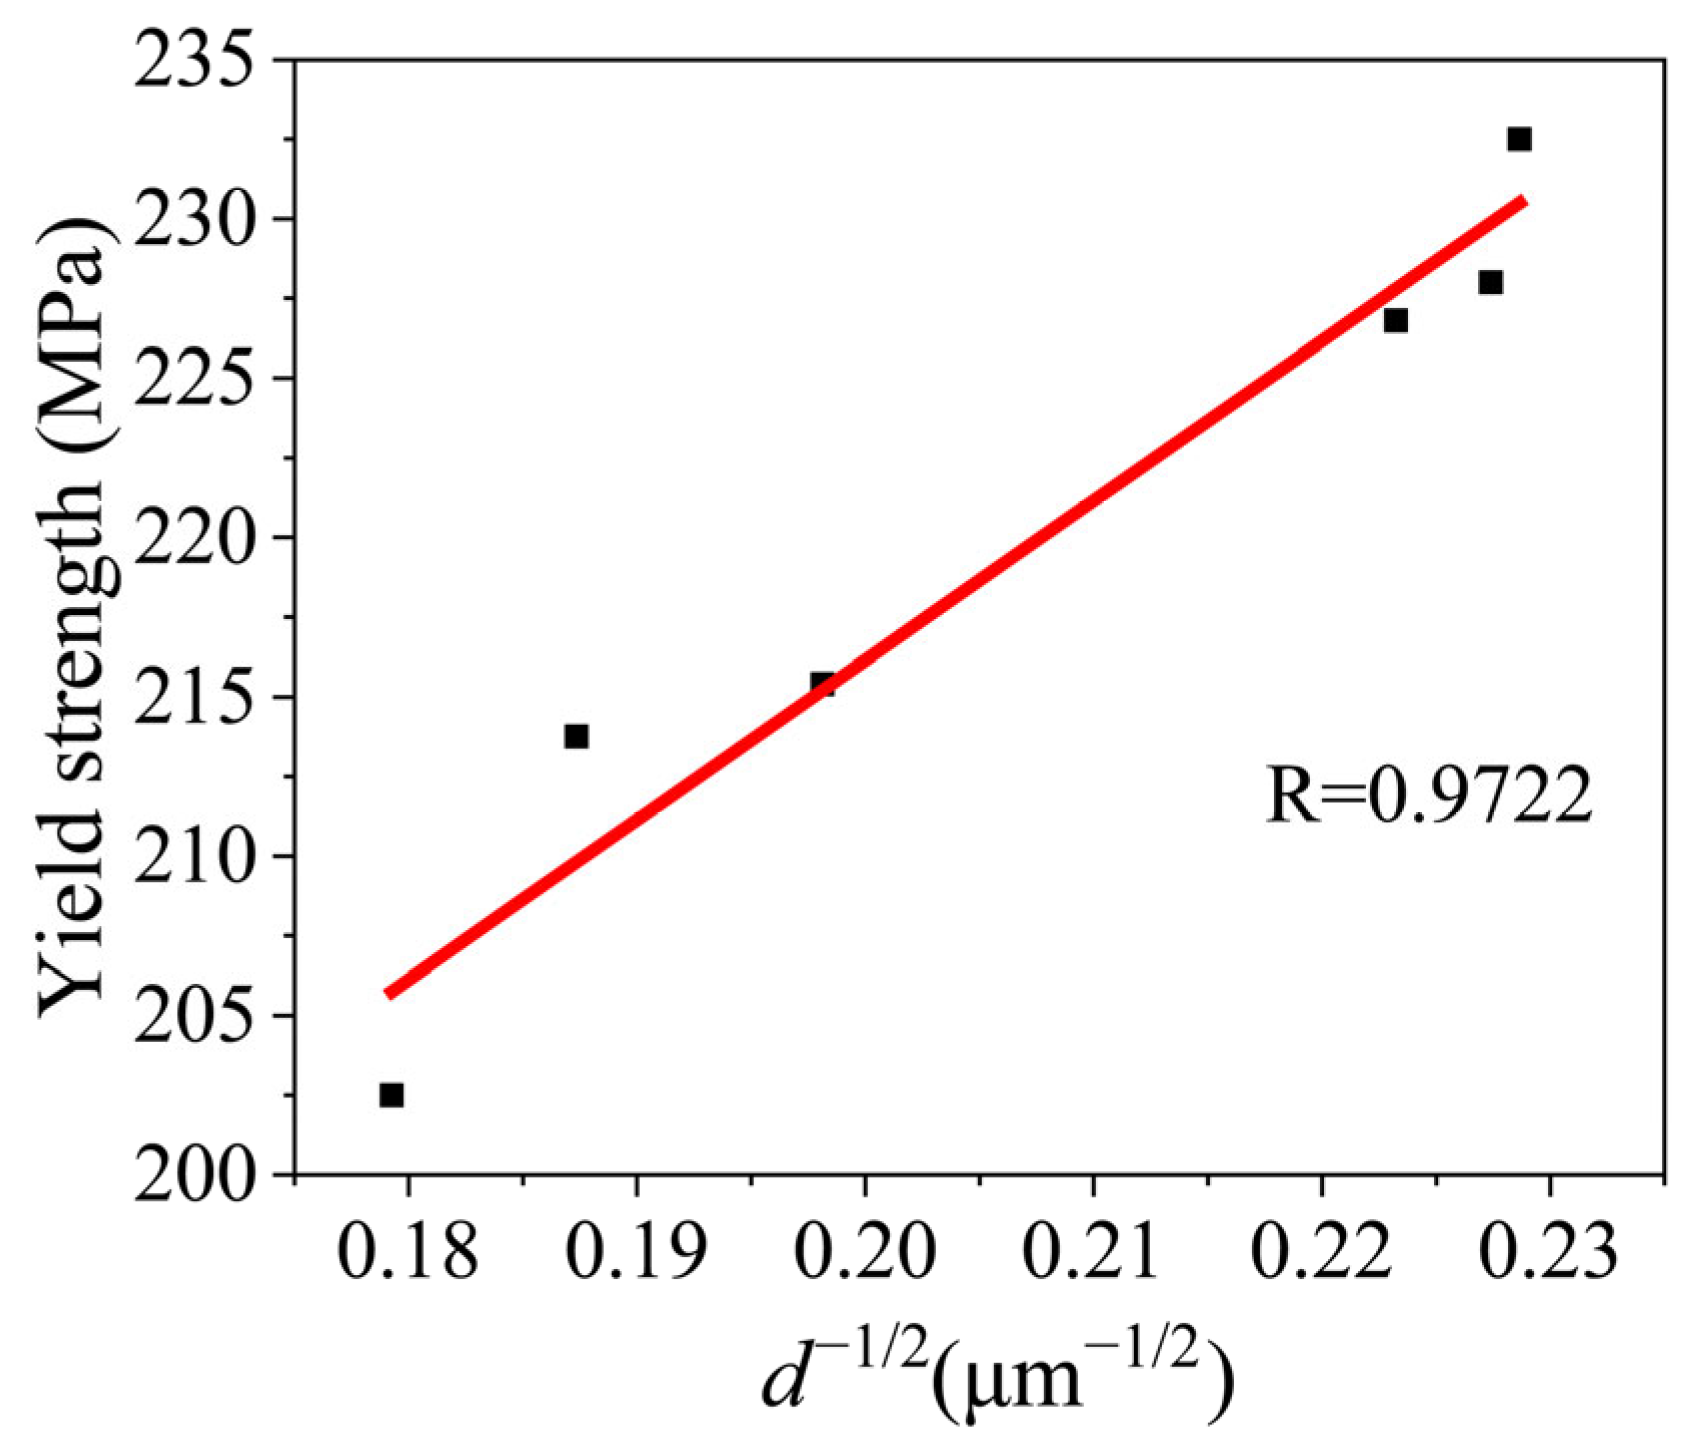
Combining Figure 23 and Figure 24, it was observed that both yield strength and grain size variations were closely correlated with changes in the thermal input Q of the tool. Yield strength exhibited a near-linear decrease with increasing thermal input, while grain size showed a near-linear increase with increasing thermal input. Linear fitting of the square roots of yield strength and grain size, as shown in Figure 25, yielded the following fitting equation:
Figure 25.
Relationship between yield strength and average grain size.
The correlation coefficient R was 0.9722, indicating that the yield strength and grain size generally conformed to the Hall–Petch relationship.
Different parameters in FSP resulted in significant variations in the temperature distribution and material flow within the plate. This led to differences in the degree of recrystallization and grain size within the SZ, thereby causing varying degrees of strengthening in the mechanical properties of the processed material.
4. Conclusions
Single-pass friction stir processing was successfully applied to LA103Z Mg-Li alloy plates. The effects of rotation speed and travelling speed on microstructure evolution and mechanical properties were systematically investigated, and relationships between FSP parameters, grain size and tensile behavior were established. The following conclusions can be drawn:
(1) LA103Z Mg-Li alloy exhibited no significant macroscopic defects during FSP at rotational speeds ranging from 300 to 600 rpm and a travelling speed of 100 mm/min, with favorable surface finish. Under these process parameters, the material underwent dynamic recrystallization, resulting in grain refinement. A reticular α-Mg phase precipitated at β-Li phase grain boundaries, while Li3Mg7 and Li2MgAl phases precipitated in SZ. Post-processing, the material exhibited significantly enhanced hardness and tensile properties compared to the BM, though elongation after fracture decreased.
(2) At a constant travelling speed, increasing rotation speed increased heat input, promoted grain coarsening, and reduced the volume fraction of the α-Mg phase, leading to decreased strength but improved ductility. In contrast, when the rotational speed was fixed, variations in travelling speed had a relatively minor influence on the microstructure and mechanical properties of the SZ.
(3) Among the investigated parameters, different optimal conditions were identified depending on the performance criterion. The highest strength and hardness were achieved at 400 rpm and 100 mm/min (L5), with an average hardness of 82.10 HV0.2 and a tensile strength of 251.4 MPa. In contrast, the best comprehensive mechanical performance, considering both strength and ductility, was obtained at 600 rpm and 100 mm/min (L8), yielding a hardness of 79.17 HV0.2, a tensile strength of 243.6 MPa, and an elongation of 17.9%.
(4) Higher heat input increased the peak temperature in the stirred zone, resulting in grain coarsening and reduced tensile strength. Heat input exhibited an approximately linear relationship with grain size and tensile properties, while yield strength followed a Hall–Petch-type relationship with grain size.
Author Contributions
Conceptualization, J.Z. and K.H.; methodology, J.Z.; software, K.H.; validation, K.H., Z.K. and X.F.; formal analysis, K.H.; investigation, Z.K.; resources, X.F.; data curation, X.F.; writing—original draft preparation, K.H.; writing—review and editing, J.Z.; visualization, Z.K.; supervision, X.F.; project administration, J.Z.; funding acquisition, J.Z. All authors have read and agreed to the published version of the manuscript.
Funding
This research was funded by Shandong Key Laboratory of Advanced Aluminum Materials and Technology, Binzhou Institute of Technology, grant number: BINTECH-PY-20231124-18.
Data Availability Statement
The original contributions presented in the study are included in the article, further inquiries can be directed to the corresponding author.
Conflicts of Interest
Authors Zihan Kong and Xinzhen Fang were employed by the State Grid Shandong Electric Power Company. Author Kai Hu was employed by the Rizhao Science and Technology Innovation Service Center. The remaining authors declare that the research was conducted in the absence of any commercial or financial relationships that could be construed as a potential conflict of interest.
Abbreviations
The following abbreviations are used in this manuscript:
| FSP | Friction stir processing |
| AS | Advancing side |
| RS | Retreating side |
| SZ | Stirred zone |
| TMAZ | Thermomechanically affected zone |
| HAZ | Heat-affected zone |
| BM | Base material |
References
- Cui, S.; Cao, W.; Zhang, Q.; Wang, L.; Sun, Y.; Guan, S. Material Flow and Microstructural Evolution in Friction Stir Welding of LAZ931 Duplex Mg-Li Alloys. Metals 2024, 14, 1305. [Google Scholar] [CrossRef] [Scilit]
- Ma, L.; Yu, M.; Gao, S.; Cui, F.; Liu, X.; Zhao, H.; Zhou, L.; Feng, X. Microstructure Modification and Corrosion Inhibition of Duplex MgLi Alloy via Friction Stir Processing. J. Manuf. Process. 2025, 135, 288–300. [Google Scholar] [CrossRef] [Scilit]
- Mineta, T.; Saijo, H.; Sato, H. High Temperature Creep Deformation Behavior of Heat-Treated (α + β)-Mg-9Li-4Al-1Zn Alloy. J. Alloys Compd. 2022, 910, 164938. [Google Scholar] [CrossRef] [Scilit]
- Li, X.; Ren, L.; Le, Q.; Jin, P.; Cheng, C.; Wang, T.; Wang, P.; Zhou, X.; Chen, X.; Li, D. The Hot Deformation Behavior, Microstructure Evolution and Texture Types of as-Cast Mg–Li Alloy. J. Alloys Compd. 2020, 831, 154868. [Google Scholar] [CrossRef] [Scilit]
- Thankachan, T.; Prakash, K.S. Microstructural, Mechanical and Tribological Behavior of Aluminum Nitride Reinforced Copper Surface Composites Fabricated through Friction Stir Processing Route. Mater. Sci. Eng. A 2017, 688, 301–308. [Google Scholar] [CrossRef] [Scilit]
- Vigneshkumar, M.; Padmanaban, G.; Balasubramanian, V. Influence of Tool Tilt Angle on the Formation of Friction Stir Processing Zone in Cast Magnesium Alloy ZK60/SiCp Surface Composites. Metallogr. Microstruct. Anal. 2019, 8, 58–66. [Google Scholar] [CrossRef] [Scilit]
- Vaira Vignesh, R.; Padmanaban, R.; Govindaraju, M.; Suganya Priyadharshini, G. Investigations on the Corrosion Behaviour and Biocompatibility of Magnesium Alloy Surface Composites AZ91D-ZrO2 Fabricated by Friction Stir Processing. Trans. IMF 2019, 97, 261–270. [Google Scholar] [CrossRef] [Scilit]
- Eacherath, S.; Murugesan, S. Synthesis and Characterization of Magnesium-Based Hybrid Composites—A Review. Int. J. Mater. Res. 2018, 109, 661–672. [Google Scholar] [CrossRef] [Scilit]
- Mishra, R.S.; Mahoney, M.W.; McFadden, S.X.; Mara, N.A.; Mukherjee, A.K. High Strain Rate Superplasticity in a Friction Stir Processed 7075 Al Alloy. Scr. Mater. 1999, 42, 163–168. [Google Scholar] [CrossRef] [Scilit]
- Wang, W.; Han, P.; Peng, P.; Guo, H.; Huang, L.; Qiao, K.; Hai, M.; Yang, Q.; Wang, H.; Wang, K.; et al. Superplastic Deformation Behavior of Fine-Grained AZ80 Magnesium Alloy Prepared by Friction Stir Processing. J. Mater. Res. Technol. 2020, 9, 5252–5263. [Google Scholar] [CrossRef] [Scilit]
- Govindaraju, M.; Vignesh, R.V.; Padmanaban, R. Effect of Heat Treatment on the Microstructure and Mechanical Properties of the Friction Stir Processed AZ91D Magnesium Alloy. Met. Sci. Heat Treat. 2019, 61, 311–317. [Google Scholar] [CrossRef] [Scilit]
- Liu, G.; Ma, Z.; Wei, G.; Xu, T.; Zhang, X.; Yang, Y.; Xie, W.; Peng, X. Microstructure, Tensile Properties and Corrosion Behavior of Friction Stir Processed Mg-9Li-1Zn Alloy. J. Mater. Process. Technol. 2019, 267, 393–402. [Google Scholar] [CrossRef] [Scilit]
- Che, Q.-Y.; Wang, K.-S.; Wang, W.; Huang, L.-Y.; Li, T.-Q.; Xi, X.-P.; Peng, P.; Qiao, K. Microstructure and Mechanical Properties of Magnesium–Lithium Alloy Prepared by Friction Stir Processing. Rare Met. 2021, 40, 2552–2559. [Google Scholar] [CrossRef] [Scilit]
- Dash, S.S.; Chen, D. A Review on Processing–Microstructure–Property Relationships of Al-Si Alloys: Recent Advances in Deformation Behavior. Metals 2023, 13, 609. [Google Scholar] [CrossRef] [Scilit]
- Ahmed, M.M.Z.; El-Sayed Seleman, M.M.; Eid, R.G.; Zawrah, M.F. Production of AA1050/Silica Fume Composite by Bobbin Tool-Friction Stir Processing: Microstructure, Composition and Mechanical Properties. CIRP J. Manuf. Sci. Technol. 2022, 38, 801–812. [Google Scholar] [CrossRef] [Scilit]
- Albaijan, I.; Ahmed, M.M.Z.; El-Sayed Seleman, M.M.; Touileb, K.; Habba, M.I.A.; Fouad, R.A. Optimization of Bobbin Tool Friction Stir Processing Parameters of AA1050 Using Response Surface Methodology. Materials 2022, 15, 6886. [Google Scholar] [CrossRef] [Scilit]
- El-Eraki, B.; Shalaby, M.F.Y.; El-Sissy, A.; Eisa, A.; Ataya, S.; El-Sayed Seleman, M.M. The Role of Friction Stir Processing Travel Speed on the Microstructure Evolution and Mechanical Performance of As-Cast Hypoeutectic Al-5Si Alloy. Crystals 2025, 15, 546. [Google Scholar] [CrossRef] [Scilit]
- El-Eraki, B.; El-Sayed Seleman, M.M.; El-Sissy, A.; Eisa, A. Structural and Mechanical Modifications of Hyper-Eutectic Al–16Si Alloy Using Friction Stir Processing. Discov. Appl. Sci. 2025, 7, 875. [Google Scholar] [CrossRef] [Scilit]
- Sejani, D.; Li, W.; Patel, V. Stationary Shoulder Friction Stir Welding–Low Heat Input Joining Technique: A Review in Comparison with Conventional FSW and Bobbin Tool FSW. Crit. Rev. Solid State Mater. Sci. 2022, 47, 865–914. [Google Scholar] [CrossRef] [Scilit]
- Jiang, L.; Jiang, W.; Guo, F.; Huang, W.; Dong, H.; Hu, H.; Dai, Q. Micro-Nano Structure Characteristics and Texture Evolution of the Friction Stir Processed Dual-Phase MgLi Alloy. Mater. Charact. 2021, 173, 110979. [Google Scholar] [CrossRef] [Scilit]
- Peng, Y.; Xie, Z.; Su, C.; Zhong, Y.; Tao, Z.; Zhuang, D.; Zeng, J.; Tang, H.; Xu, Z. Inhomogeneous Microstructure Evolution of 6061 Aluminum Alloyat High Rotating Speed Submerged Friction Stir Processing. Materials 2023, 16, 579. [Google Scholar] [CrossRef] [Scilit] [PubMed]
- Cao, F.R.; Xue, G.Q.; Zhou, B.J.; Wang, S.C. High-Temperature Deformation Behavior of Duplex Mg–8.41Li–1.80Al–1.77Zn Alloy Processed by Friction Stir Processing. Met. Mater. Int. 2019, 25, 570–583. [Google Scholar] [CrossRef] [Scilit]
- Zhou, M.; Morisada, Y.; Fujii, H.; Wang, J.-Y. Pronounced Low-Temperature Superplasticity of Friction Stir Processed Mg–9Li–1Zn Alloy. Mater. Sci. Eng. A 2020, 780, 139071. [Google Scholar] [CrossRef] [Scilit]
- Liu, F.C.; Tan, M.J.; Liao, J.; Ma, Z.Y.; Meng, Q.; Nakata, K. Microstructural Evolution and Superplastic Behavior in Friction Stir Processed Mg–Li–Al–Zn Alloy. J. Mater. Sci. 2013, 48, 8539–8546. [Google Scholar] [CrossRef] [Scilit]
- Jana, S.; Mishra, R.S.; Baumann, J.A.; Grant, G.J. Effect of Friction Stir Processing on Microstructure and Tensile Properties of an Investment Cast Al-7Si-0.6Mg Alloy. Met. Mater. Trans. A 2010, 41, 2507–2521. [Google Scholar] [CrossRef] [Scilit]
- Fang, Z.; Xu, S.; Wang, Z.; Sun, Y. Effect of Solution and Aging Treatment on the Microstructure and Properties of LAZ931 Mg-Li Alloy by Friction Stir Processing. Metals 2025, 15, 314. [Google Scholar] [CrossRef] [Scilit]
- Chen, H.-C.; Hung, F.-Y.; Lui, T.-S.; Chen, L.-H.; Huang, J.-W. Effects of Friction Stir Process and Stabilizing Heat Treatment on the Tensile and Punch-Shear Properties of Mg–9Li–2Al–1Zn Magnesium Alloy. Mater. Trans. 2013, 54, 505–511. [Google Scholar] [CrossRef] [Scilit]
- Zhu, Y.; Zhou, M.; Geng, Y.; Zhang, S.; Xin, T.; Chen, G.; Zhou, Y.; Zhou, X.; Wu, R.; Shi, Q. Microstructural Evolution and Its Influence on Mechanical and Corrosion Behaviors in a High-Al/Zn Containing Duplex Mg-Li Alloy after Friction Stir Processing. J. Mater. Sci. Technol. 2024, 184, 245–255. [Google Scholar] [CrossRef] [Scilit]
- Gao, S.; Zhou, L.; Zhao, Y.; Liu, X.; Ma, L.; Li, Y.; Song, X.; Zhao, H. In-Situ Quenching Friction Stir Processing of Magnesium-Lithium Alloy: Microstructure, Mechanical Properties and Corrosion Resistance. J. Alloys Compd. 2026, 1050, 185942. [Google Scholar] [CrossRef] [Scilit]
- Jiang, L.; Bai, Y.; Jiang, W.; Guo, F.; Huang, W.; Wang, F.; Chai, L.; Chen, X.; Xu, A. Obtaining Ultra-Fine and Uniform Two-Phase Structures: Evolution of Morphology and Phase Redistribution in a Dual-Phase Mg–Li Alloy during Submerged Friction Stir Processing. Mater. Sci. Eng. A 2024, 895, 146238. [Google Scholar] [CrossRef] [Scilit]
- Liu, Z.; Nie, J.; Zhao, Y. Effect of Deformation Processing on Microstructure Evolution and Mechanical Properties of Mg–Li Alloys: A Review. Trans. Nonferrous Met. Soc. China 2024, 34, 1–25. [Google Scholar] [CrossRef] [Scilit]
- Commin, L.; Dumont, M.; Masse, J.-E.; Barrallier, L. Friction Stir Welding of AZ31 Magnesium Alloy Rolled Sheets: Influence of Processing Parameters. Acta Mater. 2009, 57, 326–334. [Google Scholar] [CrossRef] [Scilit]
- Li, Y.; Guan, Y.; Liu, Y.; Zhai, J.; Hu, K.; Lin, J. Effect of Processing Parameters on the Microstructure and Tensile Properties of a Dual-Phase Mg–Li Alloy during Friction Stir Processing. J. Mater. Res. Technol. 2022, 17, 2714–2724. [Google Scholar] [CrossRef] [Scilit]
- ASTM E3-11; Standard Guide for Preparation of Metallographic Specimens. ASTM International: West Conshohocken, PA, USA, 2025.
- ASTM E384-22; Standard Test Method for Microindentation Hardness of Materials. ASTM International: West Conshohocken, PA, USA, 2022.
- ASTM E8/E8M-22; Standard Test Methods for Tension Testing of Metallic Materials. ASTM International: West Conshohocken, PA, USA, 2022.
- Song, W.; Wu, Z.; He, S.; Liu, J.; Yang, G.; Liu, Y.; Jin, H.; He, Y.; Heng, Z. Effects of Friction Stir Processing on the Microstructure and Mechanical Properties of an Ultralight Mg-Li Alloy. Crystals 2024, 14, 64. [Google Scholar] [CrossRef] [Scilit]
- Kral, M.V.; Muddle, B.C.; Nie, J.F. Crystallography of the Bcc/Hcp Transformation in a Mg–8Li Alloy. Mater. Sci. Eng. A 2007, 460–461, 227–232. [Google Scholar] [CrossRef] [Scilit]
- Ji, F.; Xin, T.; Zhao, Y.; Yang, W.; Bai, G.; Tang, S.; Guo, E.; Zhou, M.; Shi, Q.; Cui, L.; et al. Enhancing Plasticity in BCC Mg-Li-Al Alloys through Controlled Precipitation at Grain Boundaries. Int. J. Plast. 2024, 181, 104105. [Google Scholar] [CrossRef] [Scilit]
- Zhang, C.; Han, P.; Zhang, Z.; Dong, M.; Zhang, L.; Gu, X.; Yang, Y.; Xu, B. Transformation of the θ-Phase in Mg-Li-Al Alloys: A Density Functional Theory Study. J. Mol. Model. 2012, 18, 1123–1127. [Google Scholar] [CrossRef] [Scilit]
- Wu, H.; Gao, Z.; Lin, J.; Chiu, C. Effects of Minor Scandium Addition on the Properties of Mg–Li–Al–Zn Alloy. J. Alloys Compd. 2009, 474, 158–163. [Google Scholar] [CrossRef] [Scilit]
- Yang, C.-W. Effect of Friction Stir Processing on the Microstructural Evolution and Tensile Behaviors of an α/β Dual-Phase Mg–Li–Al–Zn Alloy. Mater. Trans. 2014, 55, 371–377. [Google Scholar] [CrossRef] [Scilit]
- Liu, F.; Ji, Y.; Bai, Y. Influence of Multipass High Rotating Speed Friction Stir Processing on Microstructure Evolution, Corrosion Behavior and Mechanical Properties of Stirred Zone on AZ31 Alloy. Trans. Nonferrous Met. Soc. China 2020, 30, 3263–3273. [Google Scholar] [CrossRef] [Scilit]
- Hanwu, D.; Limin, W.; Ke, L.; Lidong, W.; Bin, J.; Fusheng, P. Microstructure and Deformation Behaviors of Two Mg–Li Dual-Phase Alloys with an Increasing Tensile Speed. Mater. Des. 2016, 90, 157–164. [Google Scholar] [CrossRef] [Scilit]
- Wang, Y.N.; Huang, J.C. Texture Analysis in Hexagonal Materials. Mater. Chem. Phys. 2003, 81, 11–26. [Google Scholar] [CrossRef] [Scilit]
- Li, J.; Jin, L.; Wang, F.; Dong, S.; Dong, J. Effect of Phase Morphology on Microscopic Deformation Behavior of Mg–Li–Gd Dual-Phase Alloys. Mater. Sci. Eng. A 2021, 809, 140871. [Google Scholar] [CrossRef] [Scilit]
- Arbegast, W.; Baker, K.; Hartley, P. Fracture Toughness Evaluations of 2195 Al-Cu-Li Autogenous and Hybrid Friction Stir Welds. In Proceedings of the 5th International Conference on Trends in Welding Research, Pine Mountain, GA, USA, 1–5 June 1998; pp. 1–5. [Google Scholar]
- Pew, J.W.; Nelson, T.W.; Sorensen, C.D. Torque Based Weld Power Model for Friction Stir Welding. Sci. Technol. Weld. Join. 2007, 12, 341–347. [Google Scholar] [CrossRef] [Scilit]
- Arbegast, W.J.; Hartley, P.J. Friction Stir Weld Technology Development at Lockheed Martin Michoud Space System—An Overview. In Proceedings of the the fifth international conference on trends in welding research, Pine Mountain, GA, USA, 1 June 1998; pp. 541–546. [Google Scholar]
- Yi, D.; Onuma, T.; Mironov, S.; Sato, Y.S.; Kokawa, H. Evaluation of Heat Input during Friction Stir Welding of Aluminium Alloys. Sci. Technol. Weld. Join. 2017, 22, 41–46. [Google Scholar] [CrossRef] [Scilit]
- Hovanski, Y.; Carsley, J.E.; Clarke, K.D.; Krajewski, P.E. Friction-Stir Welding and Processing. JOM 2015, 67, 996–997. [Google Scholar] [CrossRef] [Scilit]

Disclaimer/Publisher’s Note: The statements, opinions and data contained in all publications are solely those of the individual author(s) and contributor(s) and not of MDPI and/or the editor(s). MDPI and/or the editor(s) disclaim responsibility for any injury to people or property resulting from any ideas, methods, instructions or products referred to in the content. |
© 2026 by the authors. Licensee MDPI, Basel, Switzerland. This article is an open access article distributed under the terms and conditions of the Creative Commons Attribution (CC BY) license.