


Abstract
Qatar offers small and medium-sized enterprises (SMEs) an unusually uniform environment for digitalization, with advanced infrastructure, generous public programs, and strong market pressure, yet digital adoption varies widely between firms. This study asks whether that environment still explains the variation. Using the technology-organization-environment (TOE) framework, we surveyed owners and managers of service-sector SMEs through 165 invitations in April 2026 and analyzed 158 screened responses with partial least squares structural equation modeling (PLS-SEM). The model tested the effects of technological readiness, organizational readiness, environmental support, competitive pressure, and customer expectations on digital adoption, each measured on five-point scales. Organizational readiness was the strongest predictor ( = 0.671), technological readiness had a smaller significant effect ( = 0.297), and the model explained 74.5% of the variance. No environmental construct was significant, although four of the five environmental conditions were rated near the top of the scale. We interpret this as environmental saturation, a reading the diagnostics favor over a measurement ceiling: conditions shared by nearly all firms no longer distinguish adopters, leaving a divide in internal capability. Policymakers should fund diagnosed capability gaps, training, and implementation advice rather than further general provision, and managers should prioritize leadership commitment and staff skills.
1. Introduction
Qatar is an unusual setting for research on digital transformation. Few countries have built a more supportive environment for technology adoption: connectivity is advanced, government-led transformation programs are well-funded, and small and medium-sized enterprise (SME) support schemes are plentiful. Yet adoption among service-sector SMEs is uneven. Some firms have embedded digital technologies in their core operations and strategic decision-making. Others, facing the same infrastructure, the same policies, and the same customers, have barely begun. Because every external condition favors adoption, the question worth asking is why firms facing such similar and favorable conditions differ so much.
The question matters beyond any single adoption framework. Qatar is a high-income but still hydrocarbon-dependent economy that, like its Gulf neighbors, has placed entrepreneurship and a dynamic SME sector at the center of its post-carbon diversification agenda. Service-sector SMEs are expected to lead that agenda, and their capacity to digitalize has become a practical indicator of whether diversification is taking hold. Understanding why their digital adoption differs matters for how an emerging economy should invest in entrepreneurial development, beyond how well any adoption model performs. Similar questions confront other emerging economies pursuing state-led digital transformation agendas [1]. The question is also a societal one. Digital technologies increasingly organize how people work, transact, and participate in economic life [2], so whether the small firms that account for most everyday economic activity can use these technologies affects who shares in the opportunities of a digitalizing society. Research on digital inequalities has so far examined this mostly at the level of individuals, and less at the level of the organizations they work in and buy from [3]. The firm-level literature has begun to close that gap, measuring digital divides between organizations and not between citizens [4,5] and showing that such divides widen under stress and in resource-poor settings [6,7]. It has not yet examined what happens to these divides once the external environment no longer differs from one firm to the next.
The problem is most acute for the technology-organization-environment (TOE) framework developed by Tornatzky and Fleischer [8], still one of the most widely used models of organizational technology adoption. In the framework’s logic, adoption decisions reflect technological characteristics, organizational readiness, and environmental influences, and the environmental dimension explains adoption to the extent that environmental conditions differ between firms: those facing stronger competitive pressure, more demanding customers, or more generous public support should adopt more. Qatar fits this logic poorly. When environmental pressures and supports reach almost every firm, it is unclear what the environment can still explain. This study therefore asks whether, and why, environmental factors stop predicting digital adoption when nearly all firms rate those conditions highly.
Existing research offers only a partial answer. Studies applying the TOE framework consistently identify organizational readiness and technological capability as the stronger drivers of digital adoption, while environmental influences return weaker and less stable effects, and recent work has shifted attention toward internal capabilities such as leadership commitment, employee skills, and organizational resources [9]. Omrani et al. [10], in a large-scale study spanning European and non-European contexts, found organizational factors to exert substantially stronger effects on digital transformation than environmental conditions. These studies show that environmental effects are often weak, but they do not explain why the effects sometimes disappear altogether. Weak environmental results have been reported as empirical outcomes and not treated as a theoretical problem, so the conditions under which the environmental dimension of the TOE framework stops differentiating adopters from non-adopters remain unspecified. This has two consequences. TOE research keeps accumulating null results on the environmental dimension without refining the theory, and SME digitalization policy in digitally mature economies keeps funding environmental stimulus whose remaining effect on adoption has not been tested.
Qatar is a critical case for this question. The country combines extensive digital infrastructure, strong public support for innovation, and ambitious transformation policies with persistent variation in SME adoption outcomes. In most settings a weak environmental effect is hard to interpret because a non-significant coefficient could reflect either an unimportant factor or an undersupplied one. In Qatar, external conditions are favorable, broadly available, and largely shared across firms, which makes the second explanation unlikely. If the environmental dimension fails to differentiate adopters here, the failure reflects a limit of the framework more than a feature of the setting.
We argue that it does fail, and for an identifiable reason. An adoption factor can explain differences between firms only if it varies across them, and in Qatar environmental conditions vary too little to explain which firms adopt. We call this condition environmental saturation and develop it as a scope condition for the environmental dimension of the TOE framework.
The argument is not specific to Qatar. Studies routinely apply the TOE framework’s environmental dimension in new settings on the assumption that it works the same way everywhere. If its explanatory power depends on cross-firm variation in external conditions, that assumption will fail wherever a digital ecosystem matures toward uniformity. The conditions under which the environment stops explaining adoption are therefore a matter of the framework’s scope more than of one country’s particular features.
We tested the argument with a cross-sectional survey of 158 decision-makers in service-sector SMEs in Qatar, conducted in April 2026, and estimated the model with partial least squares structural equation modeling (PLS-SEM). Organizational and technological readiness account for almost all of the explained variance in adoption. The environmental indicators show only a weak association with adoption, which the linear model does not detect.
The study makes three contributions. First, it adds a scope condition to the TOE framework. Most TOE studies ask whether environmental factors influence adoption; we ask under what conditions they stop doing so and whether those conditions hold in Qatar. Environmental saturation states where the environmental dimension should and should not be expected to explain adoption: it predicts differences between firms only while external conditions still vary across them. Second, the concept offers a theoretical reading of a recurring null result. Weak or non-significant environmental effects, which TOE studies have so far reported without explanation, become a testable proposition about the level and dispersion of external conditions, and the proposition can be refuted in settings where those conditions still differ. Third, the study links TOE research to work on digital inequality between organizations. Where the external conditions of digitalization are broadly equal, the remaining differences between firms lie in their internal capability, and policy in digitally mature economies has to address that divide.
The remainder of the paper is organized as follows. Section 2 reviews the TOE framework alongside the diffusion and capability literature, develops the hypotheses, and then sets out the environmental saturation argument and the research gap. Section 3 describes the research context and sample, the measures and the refinement of the environmental constructs, the assessment of common method bias, and the analytical procedure. Section 4 reports the measurement model, the descriptive statistics and correlations, and the structural model; weighs environmental saturation against a measurement-ceiling explanation of the environmental results; and checks whether the results hold once duplicated responses are removed from the data. Section 5 interprets the findings and sets out their implications for theory, for SME managers, and for policymakers in Qatar. Section 6 states the strengths and limitations of the study, Section 7 proposes directions for future research, and Section 8 concludes.
2. Literature Review and Hypotheses
2.1. The TOE Framework and Digital Adoption
The TOE framework developed by Tornatzky and Fleischer [8] remains one of the most influential models of organizational technology adoption. It proposes that adoption decisions are shaped by three interrelated dimensions: technological characteristics, organizational conditions, and environmental influences. Unlike models centered on individual user behavior or on technology attributes alone, TOE treats adoption as embedded in organizational and institutional context so that outcomes depend not only on what a technology is but on the readiness of the organization adopting it and the environment in which that organization operates.
Each dimension covers a different set of influences. The technological dimension covers the perceived attributes of the technology itself, including compatibility with existing processes, ease of use, complexity, and the opportunity to experiment before committing, attributes taken from the diffusion tradition [11]. The organizational dimension covers the internal capabilities and resources that allow a firm to evaluate, implement, and sustain new technology, from leadership commitment and employee skills to financial capacity and infrastructure [12,13]. The environmental dimension covers the external pressures and supports a firm faces, including competitive intensity, customer expectations, industry developments, government initiatives, and relationships with technology vendors [14,15]. The framework holds that the three operate jointly, and its appeal is that it does not reduce adoption to any one of them.
The framework has been applied widely in studies of digital transformation, innovation adoption, and information systems implementation in developed and emerging economies alike. Zhu et al. [16] extended it by showing how the three dimensions jointly shape technology diffusion within firms, and subsequent reviews confirm technological readiness, organizational capability, and environmental conditions as recurring determinants of adoption [9]. In the small-business literature specifically, digital readiness and dynamic capabilities have been associated with greater digitalization of business processes and better firm performance so that adoption depends on the firm as much as on its surrounding support ecosystem [17]. TOE offers a natural foundation for examining digital adoption among service-sector SMEs in Qatar, and in particular for asking whether its environmental dimension still explains adoption when institutional support is high for nearly all firms.
Work published since 2020 has both broadened and complicated that foundation. Systematic reviews of TOE applications find organizational factors to be the most consistently influential of the three dimensions in cloud-based technology adoption [12] and in knowledge-intensive SME digital transformation [18] alike. Applications to newer technologies reproduce the pattern. Studies of artificial intelligence adoption for sustainable performance [15], of digital transformation adoption in SMEs generally [14], and of customer relationship management adoption in developing-country SMEs [19] all report significant technological and organizational effects alongside environmental ones that are weaker, unstable, or contingent on leadership. Within the literature, the environmental dimension explains less and less, although studies continue to include it.
The difficulties with the environmental dimension are already visible in the diffusion tradition that preceded the framework. Rogers [11] treats adoption as a process in which the perceived attributes of an innovation, the communication channels available, and the surrounding social system jointly determine how quickly it spreads. The organizational strand of that tradition has long distinguished the conditions that put an innovation on a firm’s agenda from those that determine whether it is actually implemented. Frambach and Schillewaert [20] separate adopter-side determinants from supplier-side and environmental influences because they operate at different points in the process, and Damanpour and Schneider [21] show empirically that the importance of environmental, organizational, and managerial factors differs between the initiation and implementation phases. Greenhalgh et al. [22], reviewing diffusion in service organizations specifically, reach a compatible conclusion: external influences establish the occasion for adoption, while assimilation depends on absorptive capacity and organizational readiness inside the firm. For the present study, this implies that environmental conditions may matter mainly early on, when they put digitalization on a firm’s agenda, and explain little once digitalization is on every firm’s agenda.
2.2. Technological Readiness and Digital Adoption
Technological readiness captures the extent to which digital technologies are perceived as suitable, beneficial, and feasible to implement. Within the TOE framework, technological characteristics shape adoption through managerial perceptions of benefit, implementation difficulty, and fit with existing operations [8]. Firms adopt when expected advantages outweigh perceived risks and costs.
Three characteristics recur in the evidence, each of them an innovation attribute identified in the diffusion literature and adopted in the TOE framework’s technological dimension [11,20]. Compatibility, the degree to which a technology aligns with existing processes, routines, and operational requirements, lowers the disruption cost of adoption; technologies that integrate without major restructuring are accepted more readily, while those demanding substantial workflow change meet resistance even when their long-term benefits are recognized. Complexity works in the opposite direction, raising implementation uncertainty and discouraging adoption, particularly in SMEs whose thin technical expertise makes difficult technologies costly to evaluate, let alone deploy. Trialability, the opportunity to experiment before committing, reduces perceived risk by letting firms observe benefits under real operating conditions, a consideration that weighs heavily on firms for which one failed implementation can represent serious organizational damage. The pattern is well-documented in service organizations specifically, where perceived attributes of an innovation shape whether it is taken up at all, while its assimilation depends on capacities internal to the adopting organization [22].
These perceptions matter more in small firms. Resource constraints make SMEs acutely sensitive to implementation risk, so technology selection depends heavily on feasibility and expected value to a degree that larger organizations, with their slack resources and dedicated information technology (IT) functions, rarely experience. Hanelt et al. [9] identify technological capability and readiness as recurring determinants of digital transformation success, and Zhu et al. [16] show that favorable technological conditions support diffusion and implementation within firms. Firms are therefore more likely to adopt technologies they perceive as compatible, manageable, and testable.
We therefore expect:
Hypothesis H1.
Technological readiness positively influences digital adoption among service-sector SMEs in Qatar.
2.3. Organizational Readiness and Digital Adoption
Organizational readiness is the most consistently influential determinant of digital transformation in the SME evidence. Technological opportunity and external encouragement create the occasion for adoption, but firms must still recognize, evaluate, implement, and sustain digital initiatives, and that work is done with internal resources. Small firms in emerging economies depend on the deliberate development of internal capability to succeed under dynamic and demanding market conditions [23]. That dependence is sharpest at the smaller end of the size distribution, where research on the least competitive micro-firms in a less-developed regional economy found their owners treating the interlinked demands of crisis, innovation, and change management as a blind spot, perceiving external pressures they lacked the internal capability to act on [24]. A supportive environment cannot substitute for weak capability inside the firm, and digital tools alone are not enough either: even in large, well-resourced organizations, digitalization can remain functional rather than strategic where organizational learning capacities and participatory practices lag behind the technology [25].
Readiness has identifiable components: leadership commitment, employee digital skills, training, financial resources, technological infrastructure, and openness to innovation. Top management support is especially important because transformation requires strategic direction, resource allocation, and organizational change, and in SMEs, where decision authority concentrates in owners and senior managers, leadership attitudes largely decide whether digital initiatives gain momentum or stall. Leadership commitment alone is not enough, however. Firms also need the skills, training, and financial capacity to translate strategic intent into working systems, and where employees perform multiple roles, as they typically do in small firms, gaps in digital literacy or technical support slow even well-sponsored initiatives.
Large-sample evidence confirms the hierarchy: Omrani et al. [10] found organizational factors to be substantially stronger predictors of digital transformation than environmental conditions across 15,346 European and non-European SMEs.
The resource-based tradition explains why. Barney [26] attributes sustained advantage to resources that are valuable, rare, and costly to imitate, and these are the capabilities that cannot be bought in or supplied by policy. Cohen and Levinthal [27] add the most relevant mechanism: a firm’s ability to recognize the value of new external information, assimilate it, and apply it is itself a function of prior internal investment, so two firms facing an identical external opportunity will convert it at very different rates. Teece et al. [28] extend the argument to the capacity to reconfigure competences as environments shift. The evidence on SME digitalization is consistent with this view. Eller et al. [13] identify internal capability and managerial commitment as the antecedents that decide SME digitalization. Yao et al. [29] show, for aspirant emerging-market SMEs, that the binding barriers are internal and resource-adaptive, with firms moving through transformation phases at rates set by the capabilities they can assemble rather than by the opportunities they encounter. Where external conditions are held roughly constant across firms, as they are in the present setting, the literature predicts the pattern we tested for: differences in adoption that follow differences in internal capability.
This reasoning yields our second hypothesis:
Hypothesis H2.
Organizational readiness positively influences digital adoption among service-sector SMEs in Qatar.
2.4. Environmental Influences and Digital Adoption
The environmental dimension of the TOE framework captures the external conditions bearing on adoption. Firms do not decide in isolation; they respond to pressures, opportunities, and constraints arising from their operating environment [8]. In digital transformation research the dimension typically spans competitive pressure, customer expectations, government support, industry developments, and relationships with external technology providers, all expected to encourage adoption by raising the incentives and lowering the barriers.
The expected mechanisms are familiar. Competitors who digitalize force laggards to modernize or lose relevance, and the pressure intensifies in service industries where customer-facing technology is immediately visible. Customers who want service that is faster and digitally mediated lead firms to invest in capabilities they would otherwise defer. Governments subsidize infrastructure, reform regulation, and fund training programs that lower both the cost and the complexity of adoption, a contribution that matters most to resource-constrained firms. Vendors supply the expertise and implementation support that SMEs lack internally. Empirical work broadly supports these channels: Zhu et al. [16] found environmental influences contributing to diffusion through market and institutional pressure, and more recent SME studies identified customer demand, competitive intensity, and institutional support as adoption drivers [9,30].
The magnitude of these effects, however, is unstable across studies. Some report significant positive relationships. Others find environmental effects dwarfed by technological and organizational factors, most prominently Omrani et al. [10] across their large international sample. The instability itself raises the question of when, and under what institutional conditions, environmental influences still differentiate adopters from non-adopters, and whether they can do so at all once favorable external conditions become broadly shared.
Following the conventional TOE expectation, we tested:
Hypothesis H3a.
Environmental support positively influences digital adoption among service-sector SMEs in Qatar.
Hypothesis H3b.
Competitive pressure positively influences digital adoption among service-sector SMEs in Qatar.
Hypothesis H3c.
Customer expectations positively influences digital adoption among service-sector SMEs in Qatar.
2.5. Environmental Saturation and the Qatar Context
We define environmental saturation as the condition in which the external conditions relevant to adoption are both favorable and similar across the firms in a setting and therefore no longer differentiate firms that adopt from firms that do not. The definition has three elements: level, dispersion, and consequence. Conditions must be favorable since a uniformly poor environment would suppress adoption instead of leaving it to internal factors; they must vary little across firms, which distinguishes saturation from a merely supportive environment; and when both hold, the environmental dimension of the TOE framework loses its capacity to explain differences in adoption, even though it may remain necessary for adoption to occur at all.
The TOE framework assumes that favorable environmental conditions support adoption. That assumption depends on a statistical premise: a factor explains adoption only insofar as it varies across firms. Where environmental pressures, institutional support, and digital infrastructure differ substantially between firms, the environment can explain who adopts. Once those conditions become broadly shared, its capacity to differentiate adopters from non-adopters shrinks toward zero, however supportive the conditions remain.
The distinction at stake is between necessary and sufficient conditions. Saturated environmental conditions may well be necessary for adoption in the sense that without infrastructure, institutional support, and customer demand there would be little to adopt and little reason to do so. They are no longer a sufficient explanation of adoption differences. Governments that invest heavily in digital infrastructure and innovation programs reduce cross-firm variation in external conditions by making resources and support widely available, and when customer expectations and competitive pressure likewise become pervasive in an industry, firms experience much the same environment whatever they decide. Variation in outcomes must then have other sources.
Saturation is thus an instance of a known phenomenon. Pierce and Aguinis [31] document across many management domains what they call the too-much-of-a-good-thing effect: relationships that are ordinarily monotonic and positive turn flat, or reverse, beyond a threshold so that the customary linear specification misdescribes them exactly where the antecedent is most abundant. The closest empirical parallel comes from public support for private investment. Government subsidy raises firm innovation effort up to a point and then ceases to do so. Guo et al. [32] find the effect of subsidized programs conditional and non-linear, Görg and Strobl [33] show that small subsidies raise private research spending while large ones crowd it out, and Marino et al. [34] find no additionality, and in places outright substitution, at higher intensities of public funding. The mechanism across these studies is the one proposed here. A supportive external condition differentiates firms while it is scarce and unevenly distributed and stops differentiating them once it is abundant and evenly distributed, without ever ceasing to be supportive. Environmental saturation names that transition for the environmental dimension of the TOE framework.
Treating saturation as a scope condition follows established practice in theory building. The boundary conditions of a theory state the who, where, and when of its propositions [35], and specifying them makes a theory more precise because it shows where its predictions should and should not hold [36]. The environmental dimension of the TOE framework has usually been treated as general. Environmental saturation restricts it to settings in which external conditions still vary across firms. The concept concerns the scope of the existing model: it specifies when its environmental predictors can be expected to explain adoption. Three propositions follow. Where external conditions vary across firms, environmental factors should predict adoption, as the TOE framework expects. Where conditions are favorable and similar across firms, environmental factors should lose predictive power although they remain favorable. In that case, the variation in adoption should be accounted for mainly by organizational and technological readiness. The present study tests the second and third propositions; the first corresponds to the conventional TOE expectation, which is supported in settings where conditions still vary [37,38].
Qatar comes close to the saturated case. A decade of investment in digital infrastructure, e-government services, innovation ecosystems, and SME support programs under Qatar National Vision 2030 and the national digital agenda [39] has produced advanced connectivity, widespread digital awareness, and institutional support available to nearly every firm. Adoption among service-sector SMEs nevertheless varies substantially. The combination of high and similar environmental conditions with varied adoption is the configuration in which the explanatory power of the environmental dimension can be tested.
This uniformity is the result of policy. Nationwide connectivity, e-government platforms that move routine compliance online, publicly funded incubators and accelerators, and SME support and financing schemes are provided as public goods available to almost any firm that seeks them. In a compact and highly connected market, competitive and customer pressure to digitalize affects firms in much the same way, whatever their internal state. The external setting is therefore favorable for most firms and, on most of the indicators firms report, similar across them, so the differences that remain between firms are largely internal.
A comparison with other settings shows what is distinctive about this configuration. Cross-country work on SME digitalization in Europe still finds adoption tracking national differences in digital infrastructure and skills, which is what one expects where environmental conditions do vary between settings [37]. Cirera et al. [38], surveying technology adoption by firms across developing countries, likewise locate much of the gap in uneven access to the enabling environment, and older cross-national analyses of the global digital divide reach the same conclusion at the level of countries instead of firms [40]. Qatar is at the far end of that distribution. Kaba and Said [41], comparing the Gulf Cooperation Council with the Association of Southeast Asian Nations and other Arab states, document how far and how quickly the Gulf states closed their infrastructure gap, and Balawi [42], comparing the entrepreneurial ecosystems of the United Arab Emirates, Qatar, and Saudi Arabia, describes support structures that are strong and broadly similar across all three. The prediction that follows is specific and testable: environmental saturation should appear wherever public provision has compressed cross-firm variation in external conditions and should not appear where that variation remains wide. The claim concerns a configuration, of which Qatar is one instance.
Saturation does not make environmental factors unimportant: their explanatory power declines as conditions become high and similar across firms, and the remaining variation in adoption then reflects differences in organizational readiness and technological capability. This extends TOE research from estimating the direct effects of environmental influences to specifying the conditions under which those effects weaken or disappear. It also reframes a familiar worry in emerging-economy research. Adoption frameworks are routinely imported into fast-maturing digital economies on the assumption that an environmental dimension calibrated elsewhere will behave the same way in the new setting, yet saturation implies that the dimension’s explanatory power changes as ecosystems develop: it is high where ecosystems remain uneven and falls as public investment equalizes them. It therefore depends on how much external conditions still vary across firms, and rapid, state-led digital development tends to reduce that variation.
2.6. Research Gap
Three strands of research meet in this study, and none of them answers the question it asks. TOE research has advanced the understanding of the technological and organizational correlates of SME digital transformation, from digital leadership and knowledge management to organizational resources and technological readiness [9,18], but it continues to treat environmental conditions as variables whose effects should be observable wherever they are measured. Research on public support has shown that support stops differentiating firms beyond a threshold [32,34], but this finding has not been applied to the environmental dimension of adoption models. Research on digital inequality between organizations has documented divides between firms [4,6], but it has not asked what form those divides take when the external environment is broadly equal.
The gap is specific. No study has examined whether the environmental dimension of the TOE framework stops explaining adoption when infrastructure, institutional support, competitive pressure, and customer expectations are favorable and similar across firms, or whether the variation that remains is then accounted for by internal readiness. This study addresses the gap in three steps. It develops environmental saturation as a scope condition (Section 2.5), tests the implied pattern with survey data from a setting close to the saturated case (Section 3 and Section 4), and weighs the saturation reading against the competing possibility of a measurement ceiling (Section 4.6). Saturation is treated throughout as a theoretically grounded interpretation to be tested, not as an established fact.
Figure 1 presents the conceptual model linking technological readiness, organizational readiness, and the environmental factors to digital adoption, with environmental saturation positioned as the scope condition that weakens environmental explanatory power when external conditions become uniformly favorable.
Figure 1.
Conceptual model of digital adoption among service-sector small and medium-sized enterprises (SMEs) in Qatar. The figure states the hypothesized relationships (H1, H2, and H3a–H3c) and positions environmental saturation as the proposed scope condition; estimated coefficients are reported in Section 4.4. IT = information technology.
3. Materials and Methods
3.1. Research Context and Sample
Data were collected through a cross-sectional survey administered to SME owners, managers, and senior decision-makers responsible for technology-related decisions within their organizations. A purposive, network-based sampling approach targeted respondents with direct knowledge of their firm’s digital transformation activities and organizational capabilities since these individuals evaluate, approve, and implement digital initiatives. The researcher issued individual invitations to 165 professional contacts through LinkedIn and WhatsApp, drawing on an established network of owners, managers, and senior executives, including chief executive and chief financial officers who hold organizational or digital decision-making responsibility. Every invitation was sent individually; no intermediaries were used, and the questionnaire was not posted to open groups or distribution lists. Of the 165 invitations, 161 questionnaires were returned, a response rate of 97.6% that reflects the direct and personal nature of the approach rather than an open call. Screening questions confirmed that each respondent represented an SME operating in Qatar, defined as a firm with fewer than 250 employees, and held ownership, managerial, or decision-making responsibility for digital matters. Participation was voluntary, informed consent was obtained digitally, and responses were collected anonymously. The survey was fielded between 7 and 10 April 2026, and all responses analyzed here were received within that window.
Of the 161 questionnaires returned, three did not pass the screening questions, and in each case the instrument terminated before the substantive items were reached. One respondent reported that the firm was no longer operating in Qatar, one that the firm did not meet the criterion of having fewer than 250 employees, and one that they were not involved in digital or strategic decision-making. The final analytical sample therefore comprised 158 valid responses from service-sector SMEs across a range of industries.
During final checks carried out before resubmission, the response file was examined for duplicate submissions. Of the 158 analyzed responses, 63 reproduce an earlier response exactly across all 22 substantive items, so the file contains 95 distinct response patterns. Independent respondents cannot plausibly coincide on 22 five-point items. To establish this we simulated datasets of the same size that preserve both the observed distribution of each item and the full inter-item correlation structure, calibrated on the 28 earliest analyzed responses, those among the first 31 questionnaires received that passed screening, none of which duplicates another. Across 2000 such simulations, the median number of repeated response patterns was zero and the maximum was two, against the 63 observed. The duplicates are also not randomly distributed with respect to submission order. None occurs among the analyzed responses from the first 31 questionnaires received. Dividing the analyzed responses into quarters by order of receipt, the number that repeats an earlier response runs 1 of 39, then 4 of 40, then 29 of 39, then 29 of 40, so duplication is close to absent in the first half of the fielding window and close to three-quarters in the second. A fresh export obtained from the survey platform is identical, cell for cell, to the working file, so the pattern is present in the responses as they were collected and was not introduced during data preparation. The questionnaire was administered through a link that did not restrict submission to the invited recipients, so onward forwarding could be neither prevented nor detected, and we were unable to determine the mechanism.
We report the analysis below on the full sample of 158, which is the sample on which the measurement and structural models were estimated, and we note here what follows from the duplication. Non-independence mainly affects precision. The estimates themselves differ somewhat between the two samples, while the substantive pattern of results is unchanged, as Section 4.7 reports. The standard errors, t-statistics, p-values and bootstrap confidence intervals throughout the paper are computed as though 158 independent observations were available, and the effective sample size is smaller than that.
Because recruitment relied on a purposive professional network rather than probability sampling, the sample should not be read as statistically representative of all service-sector SMEs in Qatar. It is best understood as a well-informed sample of firms whose decision-makers could speak directly to their organization’s digital activity, and the findings are generalized to the theoretical argument and not to the population. Published national statistics do not break down Qatar’s SMEs by the size classes and service sectors used in Table 1, so the sample could not be benchmarked against the population on these characteristics. The sample captures firms at different stages of digital transformation, providing the variation in adoption outcomes the analysis requires. Table 1 profiles the sample by sector, firm size, firm age, respondent role, and digital tools in use.
Table 1.
Sample profile.
Two conventions were used to establish that this sample supports the intended analysis. The ten-times rule, which sets the minimum at ten times the largest number of structural paths directed at any construct [43], gives a floor of 50 for the five-predictor model estimated here. The more demanding inverse square root method [44] sets the minimum sample as a function of the smallest path coefficient one intends to detect; inverted, it indicates that 158 observations provide 80% power at the 5% significance level to detect standardized path coefficients of approximately 0.198 or larger.
This threshold affects how the results should be read. The two supported paths exceed it by a wide margin, while the environmental coefficients fall well short of it. The study therefore had adequate power to detect environmental effects large enough to make the environment a primary explanatory factor in the TOE framework and found none. It cannot rule out environmental effects smaller than about 0.20. Both figures treat the 158 responses as independent, which the duplication reported above shows they are not; applied to the 95 distinct response patterns, the inverse square root method raises the smallest detectable coefficient to 0.255, the value used in the sensitivity analysis of Section 4.7.
3.2. Measures and Instrument Development
Data were collected using a structured questionnaire based on the TOE framework. The instrument was adapted from established measures in technology adoption and SME digital transformation research, drawing primarily on Oliveira and Martins [45], with additional items adapted from Gangwar et al. [46] and Rahayu and Day [47].
All constructs were measured on five-point Likert scales ranging from 1 (strongly disagree) to 5 (strongly agree). Responses were coded from 1 to 5 accordingly. The complexity indicator was reverse-scored as 6 minus the recorded value so that higher scores denote lower perceived complexity throughout. Construct scores reported in the descriptive statistics are unit-weighted means of a construct’s constituent items; the structural model was estimated on the weighted composites described in Section 3.5. The technological dimension initially comprised six indicators capturing compatibility, ease of use, complexity, trialability, perceived efficiency improvement, and customer service enhancement. The organizational dimension comprised six indicators covering top management support, digital skills, employee training, financial resources, IT infrastructure, and openness to innovation. The environmental dimension comprised five indicators measuring competitive pressure, customer expectations, government initiatives, external vendor support, and industry trends. Digital adoption was measured through five indicators reflecting the integration of digital technologies into operations, cross-functional systems, investment activity, overall transformation level, and strategic use.
Two of the six technological indicators, those capturing perceived efficiency improvement and customer service enhancement, were removed during measurement refinement because their loadings fell below the retention threshold. Technological readiness is therefore reported throughout as a refined four-item composite covering compatibility, ease of use, complexity, and trialability, and every table that reports it refers to this four-item version. The two removed items are identified individually in the Supplementary Materials File S1, which allows the original six-item specification to be reconstructed.
Table 2 summarizes the measurement model as estimated: the six constructs, their retained indicators, and the sources from which the items were adapted.
Table 2.
Constructs, indicators, and item sources.
The questionnaire was administered in English, the working language of the professional network from which respondents were drawn and of business practice in the sectors sampled, so no translation or back-translation was undertaken. Before piloting, the instrument was reviewed for contextual suitability by an academic reviewer and by three practitioners familiar with the local business environment: the owner of a company who is also a mechanical engineer, the chief operating officer of a large firm, and a restaurant owner. That review examined the clarity, comprehensibility, and local appropriateness of the wording for respondents operating in Qatar and concluded that no changes were necessary.
The instrument was then piloted with 31 owners, managers, and senior executives drawn from the same target population of service-sector SMEs in Qatar, using think-aloud and verbal-probing techniques. Participants confirmed that the items were clear and readily understood and that the questionnaire could be completed within the estimated five to seven minutes. Because the pilot produced no substantive change to the constructs, the items, or the administration of the instrument, the 31 pilot responses were retained in the final dataset, of which 28 passed the eligibility screening and enter the analyzed sample.
The retained measurement items, their wording, and their conceptual sources, together with the full sample profile, are provided in the Supplementary Materials File S1. The questionnaire as administered is provided in the Supplementary Materials File S2.
3.3. Environmental Construct Refinement
Initial reliability analysis indicated that the environmental dimension did not hold together as a single construct. The five environmental indicators produced a Cronbach’s alpha of 0.523, below the generally accepted threshold for internal consistency, which pointed to multidimensionality and raised concerns about modeling environmental influences as a unified TOE construct.
An exploratory factor analysis was therefore conducted on the five environmental indicators, and its diagnostics are reported in full. Bartlett’s test of sphericity confirmed that the matrix departs significantly from an identity matrix, , . The Kaiser–Meyer–Olkin (KMO) measure of sampling adequacy was 0.524, above Kaiser’s floor of 0.50, but in the lowest band he treats as usable and below the 0.60 ordinarily required before a factor solution is interpreted, with item-level measures of 0.431 for competitive pressure and 0.325 for customer expectations. We report these values without treating them as validation because a low KMO is consistent with the finding itself: the measure indexes how far a set of variables shares common variance and can be reduced to fewer dimensions, the two items with the lowest values are the two the analysis separates out, and a five-item block that resolves into three dimensions, two of them measured by a single indicator each, cannot return a high KMO. The items did not load onto a single factor. Three dimensions emerged instead: government initiatives and external vendor support loaded together as a common environmental support factor, while competitive pressure and customer expectations stood apart as conceptually distinct influences. Industry trends was assigned to the environmental support construct, although its own loading points to a different factor. In the rotated three-factor solution industry trends loads 0.432 on the support factor and 0.718 on the factor on which competitive pressure loads, and its strongest bivariate association is with competitive pressure, not with government initiatives or external vendor support. It was retained with environmental support on conceptual grounds because the item asks about an ambient condition of the sector shared by the firms operating in it, not about rivalry directed at the individual firm. Two results suggest that the choice matters little: removing the item raises the construct’s Cronbach’s alpha only from 0.633 to 0.644, leaving it below 0.70 either way, and in the ordinary least squares robustness specification, reassigning industry trends to competitive pressure or entering it as a construct of its own leaves every environmental coefficient non-significant and moves the explained variance in digital adoption only between 0.732 and 0.737.
Environmental influences thus operate through several distinct mechanisms. The final model therefore represents the environmental dimension through three separate constructs, environmental support, competitive pressure, and customer expectations, consistent with the recommendation that multidimensional constructs be modeled according to their empirical and conceptual structure instead of being forced into a single composite [43,48].
How far the differentiated environmental results can be relied on is limited in two ways. First, the three-construct environmental structure was derived from these data and was not specified in advance. The study was designed around the conventional TOE treatment of the environment as a single dimension, and the split emerged only after the initial reliability analysis failed. Hypotheses H3a–H3c are presented above in the three-construct form for expositional clarity, but they were not formulated as three separate predictions before the data were examined. Second, the reallocation of industry trends to the environmental support factor was a conceptual judgment taken during measurement refinement rather than one the data compelled.
The differentiated pattern of environmental non-effects reported below is therefore exploratory, and readers should treat the contrast between environmental support, competitive pressure, and customer expectations as descriptive of this sample rather than as a confirmed structure. The aggregate result does not depend on the split. As the robustness analysis reported in Section 4.4 shows, the environmental dimension adds 0.9 percentage points of explained variance entered as three refined constructs and 1.2 entered as the original five indicators, neither of them significant, so the central finding is not an artifact of the post hoc restructuring.
3.4. Common Method Bias Assessment
Because the study relies on self-reported data from a single respondent per organization, common method bias was assessed through both procedural and statistical means. Method bias can inflate observed relationships when predictors and outcomes share a measurement instrument [49], and statistical detection procedures are recommended alongside design remedies in PLS-SEM research [50].
Procedurally, participation was voluntary, responses were anonymous, respondents were informed that the study served academic purposes only, and items were worded neutrally to limit evaluation apprehension and socially desirable responding [51].
Statistically, Harman’s single-factor test served as the initial diagnostic [52]. With all measurement items entered into an unrotated exploratory factor analysis, the largest factor explained 36.11% of total variance, below the commonly cited 50% threshold. Full-collinearity variance inflation factors (VIFs) were then computed as Kock [50] specifies, by regressing each latent variable in turn on all of the others with the criterion included: 2.030 for technological readiness, 3.448 for organizational readiness, 1.458 for environmental support, 1.092 for competitive pressure, 1.021 for customer expectations, and 3.917 for digital adoption. Four of the six fall well below Kock’s threshold of 3.3. Two exceed it, and both follow from the model’s explanatory strength rather than from method variance. The value for digital adoption is fixed by the model itself since the full-collinearity VIF of the criterion is identically , so an of 0.745 places it at approximately 3.92 whatever produced the explained variance. For organizational readiness, the value follows from its correlation with digital adoption reported in Section 4.3, which by itself imposes a floor of 3.285. The pattern across the six constructs is the more informative diagnostic: method variance is shared by every item on a common instrument and would inflate all six together, whereas four of the six lie between 1.02 and 2.03, and the two that do not are the two joined by the strongest structural path in the model. Method variance is therefore unlikely to pose a serious threat to the findings, although, as in all cross-sectional self-report designs, some residual method variance cannot be entirely excluded.
3.5. Analytical Procedure
The hypotheses were tested using PLS-SEM, estimated in SmartPLS 4 [53], on the model shown in Figure 1. PLS-SEM suits exploratory research, theory extension, and models combining established with refined constructs, and it accommodates modest samples without strict distributional assumptions [43,54].
The model comprises an outer (measurement) model and an inner (structural) model, and all constructs were specified reflectively. For construct j with indicators, each observed indicator relates to its latent construct as
where denotes the outer loading of indicator i on construct j and the associated measurement error. Construct scores are obtained as weighted composites of the standardized indicators,
with the weights estimated iteratively so that the resulting scores maximize the explained variance of the dependent construct.
The inner model specifies digital adoption () as a linear function of the five exogenous constructs:
where , , , and denote technological readiness, organizational readiness, environmental support, competitive pressure and customer expectations respectively; to are the standardized path coefficients corresponding to hypotheses H1, H2, and H3a–H3c; and is the structural disturbance term. Hypotheses H3a to H3c predict , and to be positive and significant; the environmental saturation argument implies instead that they are indistinguishable from zero once and are accounted for.
Estimation proceeded in the two stages standard to PLS-SEM [43]. The measurement model was evaluated first and the structural model estimated only after it had been validated. The criteria at the first stage were outer loadings of at least 0.60, a level considered acceptable when other indicators in the same block are stronger [54]; Cronbach’s alpha and composite reliability (CR) of at least 0.70; average variance extracted (AVE) of at least 0.50; heterotrait–monotrait ratios (HTMTs) below 0.85, or 0.90 for conceptually similar constructs [55]; and indicator variance inflation factors below 5 [43]. At the second stage, the structural model was estimated with the path weighting scheme and a maximum of 3000 iterations, and collinearity among the predictors was checked with inner variance inflation factors against a threshold of 3 [43]. Significance was assessed by bootstrapping with 5000 subsamples, using two-tailed tests at the 0.05 level and bias-corrected and accelerated 95% confidence intervals (CIs) [56,57]. A hypothesis was counted as supported when its path coefficient had the predicted sign, a p-value below 0.05, and a confidence interval that excluded zero. Explanatory power was evaluated through the coefficient of determination () and adjusted , and the contribution of each predictor through the effect size [43,58]. Model fit was assessed with the standardized root mean square residual (SRMR) and the normed fit index (NFI), against the conventional guidelines of an SRMR below 0.08 [59] and an NFI above 0.90. Global fit measures are of limited use in PLS-SEM, which is oriented toward explanation and prediction [60]. An ordinary least squares hierarchical regression estimated in IBM SPSS Statistics (version 32; IBM Corp., Armonk, NY, USA) served as a robustness check on the structural results, and a set of supplementary diagnostics reported in Section 4.6 addresses the alternative reading that the environmental results reflect restricted measurement range rather than a substantive condition. These diagnostics were computed in Python (version 3.14; Python Software Foundation, Wilmington, DE, USA), including a re-implementation of the PLS-SEM algorithm that reproduces the SmartPLS loadings, path coefficients, and SRMR exactly.
4. Results
4.1. Measurement Model Assessment
The measurement model was evaluated before any structural estimate was interpreted, following the two-stage procedure set out in Section 3.5.
Table 3 reports the assessment. All retained indicators loaded positively on their intended constructs above the 0.60 minimum, and all AVE values exceeded the 0.50 threshold, supporting convergent validity. Internal consistency held across the multi-item constructs. The environmental support construct returned a lower Cronbach’s (0.633) but maintained acceptable composite reliability (0.795), defensible for an exploratory construct with few indicators [43,61]. Indicator variance inflation factors ranged from 1.17 to 3.28, below the threshold of 5, so collinearity within the blocks is not a concern.
Table 3.
Outer loadings, internal consistency reliability, and convergent validity.
Table 4.
Discriminant validity assessment using the heterotrait–monotrait ratio (HTMT).
Fourteen of the fifteen HTMT values fall below 0.85, the stricter of the two thresholds in common use. The exception, 0.899 between organizational readiness and digital adoption, lies between them: below the 0.90 applied to conceptually similar constructs and above the 0.85 ordinarily applied to a pair as distinct as an internal capability and an outcome. Bootstrapped inference for that pair returns a 95% bias-corrected confidence interval from 0.787 to 0.969, which excludes 1.00 and so rules out redundancy but does not place the ratio below 0.85 [55]. The Fornell–Larcker criterion is likewise not met for this pair since the square root of the organizational readiness average variance extracted, 0.775, is below the 0.834 correlation between the two composites reported in Table 5. The two constructs are theoretically distinct and share no items, but they are not clearly separated in these data, and the strongest path in the structural model runs between them.
Table 5.
Descriptive statistics and correlations with digital adoption.
With these qualifications, the measurement model provides an adequate basis for the structural analysis.
4.2. Descriptive Statistics
Descriptive statistics for the study variables, means (M) and standard deviations (SD), are presented in Table 5.
Four of the five environmental indicators cluster near the top of the scale. Customer expectations recorded the highest mean (M = 4.84, SD = 0.37), followed by competitive pressure and industry trends (both M = 4.59) and government initiatives (M = 4.15, SD = 0.72). External vendor support was the lowest environmental indicator (M = 3.31, SD = 0.65), still above the scale midpoint. The standard deviations show the same pattern for most of them: customer expectations is the extreme case, with the highest mean and the smallest dispersion in the table. Government initiatives is the exception, with the largest standard deviation of any variable in the study at 0.72. Respondents thus report strong pressure to digitalize that varies little from firm to firm, while government programs and vendor support are reported less evenly.
The internal dimensions score lower. Technological readiness averaged 3.33 (SD = 0.60) and organizational readiness 3.52 (SD = 0.46), indicating moderate and varied internal capability across the sampled firms. Digital adoption itself recorded a mean of 3.66 (SD = 0.57), below four of the five environmental indicators, and its dispersion shows that firms differ materially in how far digital technologies have penetrated operations and strategy. Favorable external conditions thus coexist with widely varying capability and adoption, the pattern the saturation argument requires.
4.3. Correlation Analysis
The correlations give a first indication of how these factors relate to adoption. Technological readiness associates positively and significantly with digital adoption (r = 0.461, p < 0.001) and organizational readiness more strongly still (r = 0.834, p < 0.001). The environmental variables are only weakly associated with adoption. Competitive pressure (r = 0.175, p = 0.028) and external vendor support (r = 0.181, p = 0.023) reach significance at small magnitudes, while customer expectations shows no association at all (r = 0.000, p = 0.996), with government initiatives (r = 0.082, p = 0.303) and industry trends (r = 0.136, p = 0.089) likewise non-significant.
The environmental results change when ranks are used. Spearman correlations with digital adoption are for the environmental support composite, for industry trends, for government initiatives, for competitive pressure and for external vendor support, all significant at , while customer expectations runs the other way at (p = 0.069). The environmental indicators are therefore ordered with adoption even though they are not linearly associated with it. Section 4.6 identifies the source of the divergence and reports the incremental test on both metrics. The structural model estimated below is linear, and its environmental coefficients should be read as statements about that specification.
Bivariate associations of this kind are suggestive rather than conclusive since correlations cannot apportion explanatory contributions among predictors or account for their interrelations. The hypotheses were therefore tested in the PLS-SEM structural model, which estimates each factor’s effect with the others held constant and provides the effect-size decomposition the saturation argument requires.
4.4. Structural Model Results
The structural model was evaluated using the SmartPLS bootstrapping procedure. It explained 74.5% of the variance in digital adoption ( = 0.745; adjusted = 0.736), despite the absence of significant environmental effects. Estimating Equation (3) yields
in which the two internal coefficients are significant and the three environmental coefficients are not. The contrast between the first two terms and the last three is the empirical core of the paper. Figure 2 presents the estimated model in full, with the reflective measurement structure and outer loadings alongside the structural paths.
Figure 2.
Structural model of digital adoption among service-sector small and medium-sized enterprises (SMEs) in Qatar, estimated with partial least squares structural equation modeling (PLS-SEM). Rectangles denote measured indicators and ellipses latent constructs; because all constructs are specified reflectively, measurement arrows run from each construct to its indicators, with outer loadings shown beside the indicator labels. Structural paths show standardized coefficients, with *** indicating p < 0.001 and n.s. indicating a non-significant path. Competitive pressure and customer expectations are single-indicator constructs, fixed at a loading of 1.000. Abbreviated indicator labels: rev. = reverse-scored; innov. = innovation; mgmt = management; Ext. = external; Gov. = government.
Organizational readiness had the largest effect, with a path coefficient of = 0.671 (t = 11.08, p < 0.001, 95% CI 0.547 to 0.787). Firms reporting stronger digital skills, more resources, more supportive leadership, and greater openness to change also report more adoption. In this sample, the difference between extensive and minimal adopters is associated mainly with conditions inside the organization.
Technological readiness had a smaller but significant effect ( = 0.297, t = 4.01, p < 0.001, 95% CI 0.141 to 0.433). Firms that perceive digital technologies as compatible, easy to use, uncomplicated, and testable report more adoption, so perceptions of the technology itself still matter. Its effect size, however, is about one fifth of that of organizational readiness ( = 0.205 against 1.045).
None of the environmental dimensions reached significance in the estimated model. Environmental support had a small positive coefficient short of significance ( = 0.075, t = 1.16, p = 0.247), customer expectations a small negative one ( = −0.047, t = 1.54, p = 0.124), and competitive pressure a coefficient this model cannot distinguish from zero ( = −0.012, t = 0.28, p = 0.783). All three confidence intervals include zero (Table 6).
Table 6.
Structural model results and hypothesis testing.
As a robustness check, an ordinary least squares hierarchical regression reproduced the pattern for both environmental specifications. Added to a baseline containing Technological and organizational readiness, the three refined environmental constructs increased explained variance by less than one percentage point ( = 0.009, F(3, 152) = 1.67, p = 0.177). Entering the environmental dimension instead as the original five indicators from which those constructs were derived increased it by 1.2 percentage points ( = 0.012, F(5, 150) = 1.31, p = 0.263). The baseline in both models specified technological readiness as the original six-item composite instead of the refined four-item construct; substituting the refined construct leaves the two increments at 0.009 (p = 0.164) and 0.013 (p = 0.194). The absence of a detectable environmental contribution is therefore not specific to the estimator, to the technological specification, or to the post hoc environmental split. It is specific to the metric, as Section 4.6 shows.
Collinearity among the predictors is low, with inner variance inflation factors between 1.01 and 1.69. Global fit is weaker. SmartPLS reports an SRMR of 0.136 and an NFI of 0.601, outside the conventional guidelines of 0.08 and 0.90, and the bootstrap test of exact fit rejects the model since the observed SRMR exceeds the 99% quantile of its bootstrap distribution (0.108). We report these values with two qualifications. Global fit measures remain contested in PLS-SEM, whose evaluation rests mainly on explanatory and predictive power [60]. More important for the argument, the misfit does not come mainly from the environmental block. Indicator pairs involving an environmental construct account for about one third of the squared residuals, and a model estimated without the environmental constructs fits worse (SRMR 0.146). The largest single source is the reverse-scored complexity item. It accounts for 32% of the squared residuals and correlates negatively with seven of the other nineteen indicators, including with government initiatives, a pattern common with negatively worded items [49]. Re-estimating the model without that item lowers the SRMR to 0.118 and leaves the structural results unchanged: organizational readiness 0.655, technological readiness 0.306, environmental paths between and 0.066, and = 0.747. The largest share of the remaining misfit, about a fifth, comes from overlap between technological and organizational indicators, for example, between IT infrastructure and compatibility (r = 0.697). The measurement model is therefore less clean than its reliability and validity statistics suggest, but its weaknesses do not affect the contrast between internal and environmental factors on which the argument rests.
4.5. Hypothesis Testing
Table 6 summarizes the hypothesis tests. H1 and H2 meet the three criteria set out in Section 3.5: the predicted sign, a p-value below 0.05, and a confidence interval excluding zero. H3a has the predicted sign but is not significant, and H3b and H3c are negative and not significant, so none of the three environmental hypotheses is supported.
The effect sizes show the same contrast. Organizational readiness has a very large effect on digital adoption ( = 1.045) and technological readiness a medium one ( = 0.205), while environmental support ( = 0.015), customer expectations ( = 0.009), and competitive pressure ( = 0.000) all fall below the 0.02 threshold conventionally read as a small effect. The explanatory power of the model comes almost entirely from the two internal dimensions.
4.6. Distinguishing Saturation from a Measurement Ceiling
The environmental indicators are clustered near the top of the scale, which suggests an alternative reading of the null paths. On that reading the environmental measures are simply too compressed to covary with anything, so the results reflect a property of the instrument rather than a property of Qatar. The distinction matters because environmental saturation is a claim about a shared external condition while a ceiling effect is a claim about restricted measurement range. Both readings predict the same three things, namely, high means, small standard deviations and paths that do not reach significance, so no summary of dispersion can separate them, however it is rescaled. They can be separated by an asymmetry in what each implies. A measurement ceiling is a property of the instrument and is therefore indiscriminate: an item that has lost the capacity to register differences between firms has lost it for every criterion at once. Environmental saturation is a property of the setting and is selective: the item still registers whatever differences remain among firms and simply finds none that align with adoption. The diagnostics in Table 7 are built on that asymmetry.
Table 7.
Diagnostics separating environmental saturation from a measurement ceiling. (A) What the observed response distribution permits; (B) ordered probit on the raw ordinal item; (C) what the five environmental indicators explain, as a block.
Table 7A asks what the observed response distributions actually permit. For a variable with a given distribution of responses there is an exact upper limit on how strongly it can correlate with adoption, attained when the two are perfectly rank-aligned, and that limit falls to zero as a ceiling becomes complete. Customer expectations is the appropriate test case because it has the highest mean in the study and because 26 respondents chose four and the remaining 132 chose five, with no other value used. A variable with exactly that distribution can correlate 0.699 with adoption. The observed value is 0.000. Across the five environmental indicators the attainable limits run from 0.608 to 0.790 and the observed correlations from 0.000 to 0.181.
The lower block of Table 7A holds the instrument constant and varies only the content. Government initiatives has a mean of 4.152 and correlates 0.082 with adoption. The item asking whether top management supports digital transformation has a mean of 4.146, a smaller standard deviation of 0.477 against 0.715, and a slightly lower attainable limit of 0.782 against 0.790, and it correlates 0.447. It is the more compressed of the two and has less room in which to covary, and it covaries five times as strongly. Two technological items with means of 4.462 and 4.576, comparable to competitive pressure at 4.595 and industry trends at 4.589, correlate 0.374 and 0.217. The same respondents, answering on the same five-point scale in the same questionnaire, produced associations with adoption that differ by up to a factor of five at effectively identical means. One qualification applies: no non-environmental item reaches customer expectations’ mean of 4.835, so that indicator has no matched counterpart, and its case depends on the distributional calculation alone.
Table 7B repeats the question in a model built for bounded ordinal data. Each environmental item is treated as an ordered categorical response with freely estimated thresholds, so top coding is represented explicitly rather than assumed away, and each is regressed on adoption together with firm size and firm age. Firm size and firm age serve as positive controls since they are recorded outside the Likert instrument and are therefore not subject to whatever compression the scale imposes. Competitive pressure returns a coefficient of 0.067 on adoption, which is not distinguishable from zero, and 0.699 on firm size, which is significant beyond the 0.001 level. Customer expectations returns 0.157 on adoption and on firm size. Government initiatives returns 0.317 on firm age. The two organizational control items return 0.558 and 0.587 on adoption in the same specification. A threshold structure capable of registering a firm-size difference of that magnitude has not lost the capacity to register differences, which is what a ceiling sufficient to null the adoption paths would require. The one exception is consistent with this reading: external vendor support returns 0.210 on adoption, and it is the only environmental indicator near the middle of the scale, with a mean of 3.310, where no ceiling applies.
Table 7C states the same result at the level of the block. The five environmental indicators explain 31.3% of the variance in firm size and 14.5% in firm age, both significant beyond the 0.001 level, and 6.2% in adoption, which is not significant. A measurement ceiling is a property of the instrument and could not be selective in this way.
We do not report a correction for restriction of range. Thorndike’s Case II formula, the standard adjustment for the situation in which selection has operated directly on the variable whose correlation is being corrected, rescales the observed correlation by the ratio of the unrestricted to the restricted standard deviation of that variable. It therefore requires a reference population in which the same measures are unrestricted, no benchmark of that kind exists for these items in a comparable economy, and any correction factor we might apply would be chosen rather than estimated. The calculations in Table 7A serve the same purpose without requiring an external parameter because they condition on the response distributions actually observed.
The most direct evidence on this point comes from repeating the incremental test of Section 4.4 on ranks. Over that baseline, with technological readiness entered as the refined four-item construct, the five environmental indicators raise explained variance by 1.3 percentage points on the raw metric (F(5, 150) = 1.50, p = 0.194) and by 4.0 percentage points on rank-transformed variables (F(5, 150) = 3.70, p = 0.004, with a bootstrap 95% confidence interval from 0.020 to 0.096 over 2000 resamples). A measurement ceiling attenuates rank associations at least as severely as linear ones, so a block that reaches p = 0.004 on ranks has not been flattened by its instrument. That inference is secure, but its weight should not be overstated. The paragraph that follows identifies the ten observations that drive the difference between the two metrics, and a result driven by ten firms out of 158, in a file containing 63 duplicated responses, establishes that the environmental items still register differences, but it does not settle the ceiling question on its own. The strongest evidence in this section remains Table 7A, which conditions on the response distributions actually observed and requires no external parameter.
The rank result also narrows our own claim: the environmental dimension is not statistically inert. The source of the divergence between the two metrics is identifiable: all ten of the firms with the lowest adoption scores, between 1.4 and 2.6, rate four of the five environmental indicators, all but external vendor support, at or near the top of the scale. In raw units these observations are extreme and reduce the Pearson coefficient; on ranks they simply occupy the lowest positions. This configuration illustrates the saturation argument since firms that have adopted almost nothing report the same high external support as firms that have adopted a great deal. The paper’s claim thus stands in a narrower form: the environmental dimension is weakly associated with adoption, the association depends on the metric, and the linear specification through which the framework is usually tested does not detect it. None of this means that the environment explains nothing.
A third reading of the environmental nulls, that the environmental measures are simply less reliable than the internal ones, can be answered only in part. Correcting the environmental support composite’s association with adoption for attenuation raises it from 0.170 to between 0.197 and 0.223, depending on whether composite reliability or Cronbach’s alpha is used, against 0.908 to 0.935 for organizational readiness with the same correction. For unreliability alone to lift the composite to the level of the weaker of the two internal predictors, its reliability would have to be near 0.15. For competitive pressure and customer expectations, each measured by one indicator and therefore fixed at a loading of 1.000, no internal-consistency estimate exists in these data, and we do not substitute an assumed one. Two features of the evidence nonetheless bear against that reading. The correction is multiplicative, so it cannot lift customer expectations off a correlation of zero any more than the range correction above could. And unreliability attenuates every association a measure has, so the rank result reported above tells against this reading as much as against the ceiling.
The evidence is weaker in one case. Customer expectations is the single construct for which the ceiling reading cannot be excluded. It has the highest mean in the study and it is the only environmental indicator whose raw standard deviation falls below that of organizational readiness. For that construct, and for that construct alone, a cross-sectional design cannot separate an absent effect from an effect that the instrument was unable to register. The saturation interpretation advanced here relies on the environmental dimension considered as a whole, where the diagnostics converge, rather than on any single indicator.
4.7. Sensitivity to Duplicated Responses
The duplication reported in Section 3.1 leaves 95 distinct response patterns. The analysis below is a like-for-like sensitivity comparison; it does not re-estimate the PLS-SEM model on the reduced data: ordinary least squares regression on standardized construct means was run on the full sample and on the reduced one so that both are estimated the same way and the difference between them is attributable to the records removed rather than to a change of method.
The substantive pattern is unchanged. On the 95 distinct response patterns the model explains 75.3% of the variance in digital adoption (adjusted = 0.739) against 73.4% on the full sample. Organizational readiness remains the dominant predictor ( = 0.752, t = 11.48, p < 0.001), and technological readiness retains a significant secondary effect ( = 0.235, t = 3.61, p < 0.001). None of the three environmental dimensions reaches significance: environmental support ( = 0.066, p = 0.274), competitive pressure ( = , p = 0.067) and customer expectations ( = , p = 0.898). Internal consistency is marginally higher on the reduced sample for every multi-item construct; the two single-indicator environmental constructs have no internal-consistency estimate to compare. The minimum path coefficient detectable at 80% power rises from 0.198 to 0.255 [44], so the reduced sample is less able to exclude small environmental effects than the full one.
The reduced sample has one further feature. The 95 distinct response patterns are not homogeneous over the fielding window. Twenty-eight of them come from the first 31 questionnaires received, the other three of those 31 having been removed by the screening questions before the analytical sample was formed, and none of the 28 is duplicated; the remaining 67 were received later. Comparing the two groups, eight of the 22 items differ at conventional significance where one would be expected by chance, technological readiness and environmental support differ at the construct level, and the distribution of firm sizes differs. These differences establish heterogeneity and a shift in the composition of the sample over the four days of fielding; they do not by themselves establish statistical dependence among the surviving records. The narrower conclusion is the one that matters here: removing the duplicated responses does not produce a temporally homogeneous or demonstrably representative sample, so the reduced analysis is offered as a sensitivity analysis and not as a corrected estimate. It does show that the reported relationships do not depend on the duplicated records.
5. Discussion
The results are consistent across the TOE dimensions. Organizational readiness is the strongest predictor of digital adoption, technological readiness has a significant secondary effect, and the environmental constructs add no effect the model can detect. The first two results agree with existing TOE research, which has long identified internal capability as the main driver of SME digital transformation. The third result is the theoretically interesting one. The framework expects favorable environmental conditions to encourage adoption, so the absence of any detectable differentiating effect in an unusually supportive digital environment needs an explanation.
5.1. Environmental Saturation as an Explanation
Our interpretation starts from the descriptive statistics in Table 5. Four of the five environmental indicators are near the top of the scale, and three of them, customer expectations, competitive pressure, and industry trends, are rated almost identically by most firms. Conditions shared this widely can do little to differentiate the firms exposed to them. On this reading, the environment loses explanatory power as it stops varying.
A second reading is available and needs a direct answer. Environmental indicators clustered near the top of a five-point scale are, in statistical terms, range-restricted, and restricted range mechanically depresses any correlation. Environmental saturation and a simple instrument ceiling therefore predict the same null paths, and the concept has theoretical value only if the two can be separated. Section 4.6 addresses this, and the evidence favors the substantive reading. A ceiling is a property of the instrument and cannot be selective about which criterion it blocks, yet the same environmental indicators that explain 6.2% of the variance in adoption explain 31.3% of the variance in firm size and 14.5% in firm age. The ordered probit in Table 7B shows the same pattern for four of the five individual items. The environmental variance is therefore real and systematic, but it is not linearly related to adoption, which is the form the framework’s usual test assumes. On one metric, the ranks, a weak relationship does appear. This defense holds for the environmental dimension as a whole, not for every indicator in it, and the same section sets out the exception.
This reading departs from the usual practice in TOE research of treating weak environmental effects as measurement noise or contextual accident. In a digitally mature ecosystem, environmental factors appear to have changed their role while continuing to matter. Their intensity no longer separates adopters from non-adopters; they become baseline conditions that make adoption possible for all firms but do little to explain which firms adopt. The item means are consistent with this: customer demand affects the sampled firms in much the same way, and government programs and industry trends are broadly shared. Under these conditions, the differences that explain adoption are found inside the firm, in organizational capability, managerial commitment, resource availability, and technological readiness because these are the respects in which the firms in this sample still differ most.
This is the condition defined in Section 2.5 as environmental saturation: external support mechanisms, institutional pressures, and digital infrastructure become widespread enough that they largely cease to differentiate between adopters and non-adopters. Saturated conditions are mostly a shared characteristic rather than a source of variation, and organizational and technological factors then account for most of the explained variance. The concept is simple, but it turns a recurring null result into a testable proposition about where and when the environmental dimension should predict adoption.
5.2. Theoretical Implications
Saturation also helps explain findings that the literature has so far reported without explaining. Omrani et al. [10], across 15,346 European and non-European SMEs, found organizational factors substantially stronger than environmental conditions but left the reason open. Our results suggest a mechanism and an extreme case. In Qatar, extensive infrastructure, strong institutional support, ambitious policy, and broad digital awareness [39] have raised environmental conditions to a level at which their effects are weaker than organizational ones and, in the linear model, statistically indistinguishable from zero. The two studies complement each other. Theirs shows that environmental effects are weaker than organizational ones across many countries; ours suggests where that difference leads when external conditions become favorable and similar across firms and states the corresponding boundary condition: the environmental dimension of the TOE framework explains adoption only where those conditions still vary across firms.
The findings also bear on research on the Gulf region, much of which still concentrates on barriers such as infrastructure limitations, regulatory obstacles, and insufficient institutional support [41,42]. These concerns described the region’s economies a decade ago and still describe many emerging markets. In Qatar’s service sector, however, respondents rate the external conditions highly, and the variation in adoption is associated with internal readiness. A research agenda organized around external barriers is therefore likely to explain only a small part of the remaining variation in such settings.
The same argument applies to entrepreneurial development in emerging economies more broadly. Policy has long focused on building the environment around firms, but the evidence increasingly shows that the constraints lie inside them. Studies of SME performance in developing economies find that firm-level resources outweigh government support and inter-firm collaboration in explaining which firms succeed [62], and the saturation argument offers a mechanism: as public support becomes broad and even, its capacity to differentiate firms declines, and the remaining differences between them reflect their own capabilities. For service SMEs, where the product is often the digitally mediated interaction itself, those capabilities are managerial as much as technical.
At the level of society, the findings indicate a capability-based digital divide among organizations. Research on digital inequality has traced how divides of access give way to divides of skill and outcome among individuals [3]; our results suggest that a similar shift occurs among organizations. When infrastructure and institutional support become public goods, the gap between organizations persists in another form, separating firms that can convert a supportive environment into transformation from firms that cannot. Evidence from the public sector points the same way: administrative simplification improves societal outcomes such as transparency and equitable access to services only where an organization’s internal document-management practice can support that simplification [63]. For a diversifying economy whose services, employment, and everyday conveniences increasingly depend on digitally capable SMEs, narrowing this organizational divide is a societal task as much as a managerial one.
5.3. Recommendations for SME Managers
The results point to four actions for owners and managers of service SMEs in Qatar, each tied to a specific finding. Because the evidence is cross-sectional, they are indications and not tested interventions. First, digital transformation needs visible commitment from senior management. Top management support is among the individual items most strongly associated with adoption (r = 0.447, against 0.082 for government initiatives at a similar mean; Table 7A), and it returns a coefficient of 0.558 on adoption in the ordered probit. Making one senior person responsible for digital change is a simple way to provide that commitment. Second, skills and training should come before further technology purchases. Employee training and digital skills have the highest loadings on organizational readiness (0.874 and 0.859), the construct with by far the largest effect on adoption ( = 0.671, = 1.045). Third, technologies should be chosen for their fit with existing operations and tried before full commitment. Compatibility has the highest loading on technological readiness (0.888), which has a significant effect of its own ( = 0.297). Fourth, managers should not expect wider public programs or stronger market pressure to raise their firms’ adoption since these conditions are already rated highly by nearly all firms and are not associated with adoption in the model. The exception is external vendor support, the one environmental condition rated only moderately (M = 3.31) and weakly associated with adoption (r = 0.181), which suggests that implementation help from vendors is worth seeking.
5.4. Recommendations for Policymakers in Qatar
For policymakers, the results suggest that further general investment in infrastructure and broad transformation initiatives will add little to adoption where internal capability is the constraint. Such investment remains necessary, but in this sample the conditions it creates are already rated highly and do not distinguish adopters from non-adopters. Work on public business-support systems reaches a similar conclusion: institutional support leads to firm-level transformation only where knowledge-transfer bottlenecks and absorption capability are addressed [64]. For SME support programs, the more promising target is organizational readiness, meaning leadership development, digital skills, training, and organizational learning, which are the respects in which the sampled firms still differ. This matters most for the smallest firms, for which change-management capability is a documented weakness that external support alone does not offset [24].
In Qatar, the next policy task is therefore to build firms’ capacity to use the support already available since access to infrastructure and general awareness are largely in place. That points toward segmentation by readiness rather than uniform provision because when most firms already face similar external conditions, awareness campaigns and across-the-board incentives mainly subsidize what the environment already provides. Digital-maturity assessment can be used to sort firms by where their constraint actually lies, directing firms with low readiness toward hands-on help in setting a digital strategy, securing managerial commitment, training staff, redesigning operating processes, and selecting technologies suited to their business model, while firms that are already more mature receive advanced financing and implementation support in place of introductory awareness activity. The institutions needed for this already exist: the Qatar Development Bank’s Go Digital program already pairs a maturity assessment with differentiated support pathways [65], and the national SMEs Go Digital program run by the Ministry of Communications and Information Technology connects firms with specific digital solutions and training [66].
Support might also be tied to implementation milestones rather than to participation. Grants or subsidized financing could require a participating firm to designate a responsible senior leader, complete a workforce-skills assessment, adopt a time-bound transformation roadmap, and report measurable outcomes such as process integration, employee usage, productivity improvement, or digitally generated revenue. Business associations, including the Qatar Chamber and sector bodies, could complement public programs with sector-specific peer-learning groups, shared digital specialists, and workshops led by firms that have completed a transformation successfully. In each case, the aim is to turn widely available environmental support into managerial, workforce, and organizational capability because these internal differences are the ones most strongly associated with adoption in this study.
One environmental lever may still have room to work. External vendor support is the only environmental condition rated near the middle of the scale (M = 3.31), and the only one associated with adoption both in the correlations (r = 0.181) and in the ordered probit (0.210). Programs that develop the local market for implementation services, for example, by accrediting vendors or co-funding implementation support within Go Digital, would address the one external condition that still varies across firms. Because this recommendation is based on a weak association, it should be evaluated before it is scaled up.
The United Arab Emirates, Saudi Arabia, Bahrain, and Oman are also investing heavily in digital infrastructure, innovation ecosystems, and government-led transformation programs, each with its own national vision. If their environments become saturated in the same way, the argument predicts that adoption differences will persist while environmental measures lose their influence, and that capability building will become the more effective policy instrument. This is a prediction for comparative research to test, not a finding of the present study.
6. Strengths and Limitations
6.1. Strengths
Four features of the study strengthen its findings. Its setting, Qatar, offers an unusually supportive digital environment, in which environmental saturation should be observable if it exists. All respondents held decision-making roles (Table 1), so they could report firsthand on their firms’ digital activity. The absence of detectable environmental effects was tested against its most direct alternative explanation, a measurement ceiling, by examining whether the environmental items still register differences between firms on criteria other than adoption, something a ceiling would rule out (Section 4.6). The main results were also checked against three threats to their validity: common method bias was assessed by procedural and statistical means (Section 3.4), the structural results were re-examined without the reverse-scored complexity item (Section 4.4), and a sensitivity analysis was run with the duplicated responses removed (Section 4.7). These checks narrow the alternative explanations the findings must answer; they do not remove the limitations that follow.
6.2. Limitations
The most serious limitation of this study is the duplication set out in Section 3.1. The analyzed responses cannot be treated as fully independent observations, and the inferential statistics reported throughout are consequently less secure than their nominal values suggest. The pattern of results survives the sensitivity analysis on the 95 distinct response patterns, as Section 4.7 shows, though the estimates themselves are not identical and the reduced sample is itself not homogeneous. The findings should therefore be treated as provisional and as standing in need of replication on an independently collected sample before the scope condition proposed here is regarded as established.
Five further limitations apply. The sampling was purposive and non-probabilistic, targeting owners, managers, and senior decision-makers through online channels. The approach secured informed respondents at the cost of statistical generalizability, and digitally mediated recruitment may have over-represented firms that are already digitally engaged, so the results speak for the sampled service-sector SMEs rather than for all SMEs in Qatar or the Gulf.
The design is cross-sectional, capturing perceptions and adoption at a single point in time. Digital transformation is a process rather than an event, and a snapshot cannot establish causal direction or reveal how organizational capabilities, technological perceptions, and environmental conditions interact as firms move through it. The estimated relationships are associations. Reliance on self-reported data from one respondent per firm adds the familiar risks of social desirability and subjective interpretation, partially mitigated by the procedural and statistical checks reported above but not eliminated.
The setting is a single country, chosen for its theoretical relevance. Qatar’s institutional environment differs from less digitally developed economies in the respects that motivate the study, which means the saturation effect documented here may be specific to contexts where digital infrastructure and institutional support are already pervasive. Whether the same pattern appears in maturing rather than mature ecosystems is an open empirical question.
The environmental indicators were also close to the scale ceiling. Section 4.6 sets out the diagnostics that weigh substantive saturation against a simple instrument ceiling, and they favor the former, but they cannot close the question from a single cross-sectional sample and they leave the case of customer expectations open. Instruments designed to discriminate at the upper end of environmental support could resolve what the present measures can only weigh.
Finally, the global fit of the model is weak (SRMR 0.136). Section 4.4 traces the largest single source of the misfit to the reverse-scored complexity item and the largest part of the remainder to overlap between technological and organizational indicators and shows that the structural results do not change when the complexity item is removed. A replication should nevertheless use a refined instrument, with fewer overlapping items and either no reverse-worded items or a balanced set of them.
7. Future Research
The limitations set out in Section 6 also point to further research. The most direct test of the environmental saturation argument is comparative: studies spanning multiple Gulf and non-Gulf economies at different stages of digital maturity could establish whether environmental explanatory power declines systematically as ecosystems mature, and whether Qatar is an outlier or an early instance of a general pattern. Comparative evidence of that kind would also separate the substantive saturation reading from the instrument-ceiling reading since the same measures should regain predictive power in settings where environmental conditions do vary.
Longitudinal designs could track the saturation process itself. If the argument is right, environmental influences should matter most in the early phases of a country’s digitalization, when infrastructure, policy support, and customer demand still differ across firms and regions and should fade as conditions equalize. Following firms through several stages of transformation would reveal whether the explanatory weight shifts from the environment to the organization in the sequence the theory implies.
Mixed-methods work could identify the mechanism. Interviews and case studies of how SME managers actually perceive uniform environmental pressure, and why pervasive pressure fails to translate into differentiated adoption, would complement the statistical evidence. Extensions of the model itself are also worth pursuing: variables such as digital strategy, absorptive capacity, innovation capability, and organizational maturity may capture additional variation in readiness that the present construct set leaves unexplained, and including them would help specify the boundary conditions of the TOE framework more precisely.
8. Conclusions
8.1. Summary of Findings
This study asked why adoption among Qatar’s service SMEs is uneven when their digital environment is among the most supportive an SME could face. Survey data from 158 SME decision-makers, analyzed with PLS-SEM, show that organizational readiness is the strongest predictor of digital adoption ( = 0.671) and that technological readiness has a smaller significant effect ( = 0.297), with the model explaining 74.5% of the variance in adoption. Environmental support, competitive pressure, and customer expectations accounted for little of the difference between firms, and none of their paths could be distinguished from zero, although respondents rated most environmental conditions as strong. Favorable conditions that nearly every firm shares explain little about why those firms differ, and we call this condition environmental saturation. A single cross-sectional study in one country, whose data contain duplicated responses, can support this reading but cannot settle it; Section 6 and Section 7 set out these limitations and the research that would test the argument.
8.2. Contribution to Theory
The contribution to TOE research is a scope condition. The Qatar case suggests that the environmental dimension of the TOE framework predicts adoption weakly, and not at all in its usual linear form, because favorable conditions have become common to nearly all firms and not because the environment is unimportant. Environmental influences explain adoption differences where environmental conditions vary meaningfully across firms; where conditions become broadly shared, the explanatory weight shifts to organizational and technological readiness. The framework remains valid. Researchers applying TOE in digitally mature settings should expect weak environmental effects, treat them as informative rather than anomalous, and design studies that can capture the variation that remains.
8.3. Contribution to Practice
For practice, the findings concern managers and policymakers separately (Section 5.3 and Section 5.4). Managers of service SMEs should look to their own leadership commitment, staff skills, and training, which are the factors most strongly associated with adoption in this study, instead of waiting for further external support. Policymakers in Qatar should aim support at diagnosed capability gaps instead of further general provision, and judge programs by the skills and systems they leave behind. Where the digital environment has become a public good, digital inclusion becomes largely a question of organizational capability.
Supplementary Materials
The following supporting information can be downloaded at https://www.mdpi.com/article/10.3390/soc16090294/s1, File S1, containing Table S1: Retained measurement items and sources, and Table S2: Sample profile (N = 158); File S2: Survey questionnaire as administered.
Author Contributions
Conceptualization, D.C. and D.K.A.; methodology, D.C. and D.K.A.; formal analysis, D.C. and D.K.A.; investigation, D.K.A.; data curation, D.K.A.; writing—original draft preparation, D.C. and D.K.A.; writing—review and editing, D.C. and D.K.A.; visualization, D.C.; supervision, D.C.; project administration, D.C. All authors have read and agreed to the published version of the manuscript.
Funding
This research received no external funding.
Institutional Review Board Statement
Ethical review and approval were waived for this study. The distinction between the jurisdiction of the researchers and that of the respondents is worth making explicit. The authors are affiliated with an institution in Cyprus, so the institutional and legal framework governing the conduct of the research is the Cypriot one, whereas the respondents were decision-makers in small and medium-sized enterprises operating in Qatar, who took part voluntarily and anonymously in their professional capacity. Three grounds support the waiver. First, the Cypriot statutory ethics-review mandate, established by the Bioethics Law 150(I)/2001 as amended, extends to biomedical research on human beings and their biological substances, to clinical trials on medicinal products for human use, and to research on medical devices; a non-interventional, fully anonymous organizational survey of adult professionals falls outside that mandate, and no other Cypriot legislation imposes an ethics-approval requirement for this category of research. Second, the instrument collected no names, contact details, network identifiers, or firm identifiers at any point, so the study did not constitute processing of personal data under Regulation (EU) 2016/679, Recital 26, or the supplementing Law 125(I)/2018. Third, the authors’ institution confirmed that it does not operate an ethics-review or approval mechanism for non-interventional, fully anonymous social-science research of this kind, and that no formal determination of that nature can be issued for it. The study was nonetheless conducted in accordance with the ethical principles applicable to research involving human participants: participation was entirely voluntary, digital informed consent was obtained from every participant before participation, respondents could withdraw at any point, anonymity was guaranteed by design, and results are reported only in aggregate form.
Informed Consent Statement
Informed consent was obtained from all subjects involved in the study.
Data Availability Statement
The data presented in this study are available on request from the corresponding author due to confidentiality assurances given to survey respondents.
Conflicts of Interest
Dimos Chatzinikolaou serves on the Editorial Board of Societies; he had no involvement in the editorial handling or peer review of this manuscript. The authors declare no other conflicts of interest.
Abbreviations
The following abbreviations are used in this manuscript:
| AI | Artificial intelligence |
| AVE | Average variance extracted |
| CI | Confidence interval |
| CR | Composite reliability |
| HTMT | Heterotrait–monotrait ratio |
| ICT | Information and communication technology |
| IT | Information technology |
| KMO | Kaiser–Meyer–Olkin |
| NFI | Normed fit index |
| PLS-SEM | Partial least squares structural equation modeling |
| SD | Standard deviation |
| SME | Small and medium-sized enterprise |
| SRMR | Standardized root mean square residual |
| TOE | Technology-organization-environment |
References
- Rohayati, Y.; Abdillah, A. Digital transformation for era Society 5.0 and resilience: Urgent issues from Indonesia. Societies 2024, 14, 266. [Google Scholar] [CrossRef] [Scilit]
- Ayeni, O.B.; Musinguzi-Karamukyo, I.; Onibalusi, O.T.; Omigbodun, O.M. Digital identities and the social realm: How AI-driven platforms reshape participation, recognition, and group dynamics. Societies 2026, 16, 96. [Google Scholar] [CrossRef] [Scilit]
- Martini, E.; Sgambato, M.C. Digital inequalities and access to technology: Analyzing how digital tools exacerbate or mitigate social inequalities. Societies 2025, 15, 318. [Google Scholar] [CrossRef] [Scilit]
- Mazzoni, L.; Pinelli, F.; Riccaboni, M. Measuring corporate digital divide through websites: Insights from Italian firms. EPJ Data Sci. 2024, 13, 51. [Google Scholar] [CrossRef] [Scilit]
- Thonipara, A.; Sternberg, R.; Proeger, T.; Haefner, L. Digital divide, craft firms’ websites and urban-rural disparities: Empirical evidence from a web-scraping approach. Rev. Reg. Res. 2023, 43, 69–99. [Google Scholar] [CrossRef] [Scilit]
- Muhammad, S.S.; Dey, B.L.; Kamal, M.M.; Samuel, L.; Alzeiby, E.A. Digital transformation or digital divide? SMEs’ use of AI during global crisis. Technol. Forecast. Soc. Change 2025, 217, 124184. [Google Scholar] [CrossRef] [Scilit]
- Quansah, E.M. Digital divide: Accessing digital technologies for firms in BOP countries. Online Inf. Rev. 2024, 48, 476–490. [Google Scholar] [CrossRef] [Scilit]
- Tornatzky, L.G.; Fleischer, M. The Processes of Technological Innovation; Lexington Books: Lexington, MA, USA, 1990. [Google Scholar]
- Hanelt, A.; Bohnsack, R.; Marz, D.; Antunes Marante, C. A systematic review of the literature on digital transformation: Insights and implications for strategy and organizational change. J. Manag. Stud. 2021, 58, 1159–1197, Correction in J. Manag. Stud. 2022, 59, 583. [Google Scholar] [CrossRef] [Scilit]
- Omrani, N.; Rejeb, N.; Maalaoui, A.; Dabić, M.; Kraus, S. Drivers of digital transformation in SMEs. IEEE Trans. Eng. Manag. 2024, 71, 5030–5043. [Google Scholar] [CrossRef] [Scilit]
- Rogers, E.M. Diffusion of Innovations, 5th ed.; Free Press: New York, NY, USA, 2003. [Google Scholar]
- Al Hadwer, A.; Tavana, M.; Gillis, D.; Rezania, D. A systematic review of organizational factors impacting cloud-based technology adoption using the technology-organization-environment framework. Internet Things 2021, 15, 100407. [Google Scholar] [CrossRef] [Scilit]
- Eller, R.; Alford, P.; Kallmünzer, A.; Peters, M. Antecedents, consequences, and challenges of small and medium-sized enterprise digitalization. J. Bus. Res. 2020, 112, 119–127. [Google Scholar] [CrossRef] [Scilit]
- Hoang, H. Navigating the digital landscape: An exploration of the relationship between technology-organization-environment factors and digital transformation adoption in SMEs. Sage Open 2024, 14, 21582440241276198. [Google Scholar] [CrossRef] [Scilit]
- Badghish, S.; Soomro, Y.A. Artificial intelligence adoption by SMEs to achieve sustainable business performance: Application of technology-organization-environment framework. Sustainability 2024, 16, 1864. [Google Scholar] [CrossRef] [Scilit]
- Zhu, K.; Kraemer, K.L.; Xu, S. The process of innovation assimilation by firms in different countries: A technology diffusion perspective on e-business. Manag. Sci. 2006, 52, 1557–1576. [Google Scholar] [CrossRef] [Scilit]
- Alqam, H.S.; Razzak, M.R.; Bachkirov, A.A. Driving SME success through digital readiness and dynamic capabilities in propelling business process digitalization and performance. J. Entrep. Emerg. Econ. 2025, 17, 1699–1722. [Google Scholar] [CrossRef] [Scilit]
- Hafeez, S.; Shahzad, K.; Helo, P.; Mubarak, M.F. Knowledge management and SMEs’ digital transformation: A systematic literature review and future research agenda. J. Innov. Knowl. 2025, 10, 100728. [Google Scholar] [CrossRef] [Scilit]
- Religia, Y.; Ramawati, Y.; Firdausi, A.S.M.; Nainggolan, D.S. Exploring digital leadership: TOE framework in CRM adoption by SMEs in developing countries. RAUSP Manag. J. 2025, 60, 58–74. [Google Scholar] [CrossRef] [Scilit]
- Frambach, R.T.; Schillewaert, N. Organizational innovation adoption: A multi-level framework of determinants and opportunities for future research. J. Bus. Res. 2002, 55, 163–176. [Google Scholar] [CrossRef] [Scilit]
- Damanpour, F.; Schneider, M. Phases of the adoption of innovation in organizations: Effects of environment, organization and top managers. Br. J. Manag. 2006, 17, 215–236. [Google Scholar] [CrossRef] [Scilit]
- Greenhalgh, T.; Robert, G.; Macfarlane, F.; Bate, P.; Kyriakidou, O. Diffusion of innovations in service organizations: Systematic review and recommendations. Milbank Q. 2004, 82, 581–629. [Google Scholar] [CrossRef] [Scilit]
- Anning-Dorson, T. Unlocking SME success: Optimizing capability development amidst dynamic market conditions in emerging economies. J. Entrep. Emerg. Econ. 2025, 17, 1–24. [Google Scholar] [CrossRef] [Scilit]
- Chatzinikolaou, D.; Vlados, C. Crisis, innovation and change management: A blind spot for micro-firms? J. Entrep. Emerg. Econ. 2024, 16, 698–719. [Google Scholar] [CrossRef] [Scilit]
- Chatzinikolaou, D.; Magaliou, N.M.; Vlados, C.M. Strategic human resource management, innovation, and social dialogue in the Fourth Industrial Revolution: The case of Greek pharmaceutical multinationals. Societies 2025, 15, 228. [Google Scholar] [CrossRef] [Scilit]
- Barney, J. Firm resources and sustained competitive advantage. J. Manag. 1991, 17, 99–120. [Google Scholar] [CrossRef] [Scilit]
- Cohen, W.M.; Levinthal, D.A. Absorptive capacity: A new perspective on learning and innovation. Adm. Sci. Q. 1990, 35, 128–152. [Google Scholar] [CrossRef] [Scilit]
- Teece, D.J.; Pisano, G.; Shuen, A. Dynamic capabilities and strategic management. Strateg. Manag. J. 1997, 18, 509–533. [Google Scholar]
- Yao, M.X.; Wang, D.; Freeman, S. Digital barriers and capabilities in aspirant emerging-market SMEs: A resource-adaptive dynamic capabilities model of transformation phases. Technovation 2026, 152, 103506. [Google Scholar] [CrossRef] [Scilit]
- Tripathi, A.; Singh, A. SMEs awareness and preparation for digital transformation: Exploring business opportunities for entrepreneurs in Saudi Arabia’s Ha’il region. Sustainability 2024, 16, 3831. [Google Scholar] [CrossRef] [Scilit]
- Pierce, J.R.; Aguinis, H. The too-much-of-a-good-thing effect in management. J. Manag. 2013, 39, 313–338. [Google Scholar] [CrossRef] [Scilit]
- Guo, D.; Guo, Y.; Jiang, K. Government-subsidized R&D and firm innovation: Evidence from China. Res. Policy 2016, 45, 1129–1144. [Google Scholar] [CrossRef] [Scilit]
- Görg, H.; Strobl, E. The effect of R&D subsidies on private R&D. Economica 2007, 74, 215–234. [Google Scholar] [CrossRef] [Scilit]
- Marino, M.; Lhuillery, S.; Parrotta, P.; Sala, D. Additionality or crowding-out? An overall evaluation of public R&D subsidy on private R&D expenditure. Res. Policy 2016, 45, 1715–1730. [Google Scholar] [CrossRef] [Scilit]
- Whetten, D.A. What constitutes a theoretical contribution? Acad. Manag. Rev. 1989, 14, 490–495. [Google Scholar] [CrossRef] [Scilit]
- Busse, C.; Kach, A.P.; Wagner, S.M. Boundary conditions: What they are, how to explore them, why we need them, and when to consider them. Organ. Res. Methods 2017, 20, 574–609. [Google Scholar] [CrossRef] [Scilit]
- Škare, M.; de Obesso, M.d.l.M.; Ribeiro-Navarrete, S. Digital transformation and European small and medium enterprises (SMEs): A comparative study using digital economy and society index data. Int. J. Inf. Manag. 2023, 68, 102594. [Google Scholar] [CrossRef] [Scilit]
- Cirera, X.; Comin, D.; Cruz, M. Bridging the Technological Divide: Technology Adoption by Firms in Developing Countries; World Bank: Washington, DC, USA, 2022. [Google Scholar]
- Ministry of Communications and Information Technology. Digital Agenda 2030. 2024. Available online: https://www.mcit.gov.qa/en/about-us/digital-agenda-2030 (accessed on 1 July 2026).
- Billon, M.; Lera-Lopez, F.; Marco, R. Differences in digitalization levels: A multivariate analysis studying the global digital divide. Rev. World Econ. 2010, 146, 39–73. [Google Scholar] [CrossRef] [Scilit]
- Kaba, A.; Said, R. Bridging the digital divide through ICT: A comparative study of countries of the Gulf Cooperation Council, ASEAN and other Arab countries. Inf. Dev. 2014, 30, 358–365, Correction in Inf. Dev. 2015, 31, 93. [Google Scholar] [CrossRef] [Scilit]
- Balawi, A. Entrepreneurship ecosystem in the United Arab Emirates: An empirical comparison with Qatar and Saudi Arabia. Int. Entrep. Rev. 2021, 7, 55–66. [Google Scholar] [CrossRef] [Scilit]
- Hair, J.F.; Hult, G.T.M.; Ringle, C.M.; Sarstedt, M.; Danks, N.P.; Ray, S. Partial Least Squares Structural Equation Modeling (PLS-SEM) Using R: A Workbook; Springer: Cham, Switzerland, 2021. [Google Scholar] [CrossRef] [Scilit]
- Kock, N.; Hadaya, P. Minimum sample size estimation in PLS-SEM: The inverse square root and gamma-exponential methods. Inf. Syst. J. 2018, 28, 227–261. [Google Scholar] [CrossRef] [Scilit]
- Oliveira, T.; Martins, M.F. Understanding e-business adoption across industries in European countries. Ind. Manag. Data Syst. 2010, 110, 1337–1354. [Google Scholar] [CrossRef] [Scilit]
- Gangwar, H.; Date, H.; Ramaswamy, R. Understanding determinants of cloud computing adoption using an integrated TAM-TOE model. J. Enterp. Inf. Manag. 2015, 28, 107–130. [Google Scholar] [CrossRef] [Scilit]
- Rahayu, R.; Day, J. Determinant factors of e-commerce adoption by SMEs in developing country: Evidence from Indonesia. Procedia-Soc. Behav. Sci. 2015, 195, 142–150. [Google Scholar] [CrossRef] [Scilit]
- Jarvis, C.B.; MacKenzie, S.B.; Podsakoff, P.M. A critical review of construct indicators and measurement model misspecification in marketing and consumer research. J. Consum. Res. 2003, 30, 199–218. [Google Scholar] [CrossRef] [Scilit]
- Podsakoff, P.M.; MacKenzie, S.B.; Lee, J.Y.; Podsakoff, N.P. Common method biases in behavioral research: A critical review of the literature and recommended remedies. J. Appl. Psychol. 2003, 88, 879–903. [Google Scholar] [CrossRef] [Scilit]
- Kock, N. Common method bias in PLS-SEM: A full collinearity assessment approach. Int. J. e-Collab. 2015, 11, 1–10. [Google Scholar] [CrossRef] [Scilit]
- Podsakoff, P.M.; MacKenzie, S.B.; Podsakoff, N.P. Sources of method bias in social science research and recommendations on how to control it. Annu. Rev. Psychol. 2012, 63, 539–569. [Google Scholar] [CrossRef] [Scilit]
- Harman, H.H. Modern Factor Analysis, 3rd ed.; University of Chicago Press: Chicago, IL, USA, 1976. [Google Scholar]
- Ringle, C.M.; Wende, S.; Becker, J.M. SmartPLS 4; SmartPLS: Bönningstedt, Germany, 2024; Available online: https://www.smartpls.com (accessed on 11 September 2026).
- Chin, W.W. The partial least squares approach to structural equation modeling. In Modern Methods for Business Research; Marcoulides, G.A., Ed.; Lawrence Erlbaum Associates: Mahwah, NJ, USA, 1998; pp. 295–336. [Google Scholar]
- Henseler, J.; Ringle, C.M.; Sarstedt, M. A new criterion for assessing discriminant validity in variance-based structural equation modeling. J. Acad. Mark. Sci. 2015, 43, 115–135. [Google Scholar] [CrossRef] [Scilit]
- Ringle, C.M.; Sarstedt, M.; Mitchell, R.; Gudergan, S.P. Partial least squares structural equation modeling in HRM research. Int. J. Hum. Resour. Manag. 2020, 31, 1617–1643. [Google Scholar] [CrossRef] [Scilit]
- Sarstedt, M.; Ringle, C.M.; Hair, J.F. Partial least squares structural equation modeling. In Handbook of Market Research; Homburg, C., Klarmann, M., Vomberg, A., Eds.; Springer: Cham, Switzerland, 2021; pp. 587–632. [Google Scholar] [CrossRef] [Scilit]
- Cohen, J. Statistical Power Analysis for the Behavioral Sciences, 2nd ed.; Lawrence Erlbaum Associates: Hillsdale, NJ, USA, 1988. [Google Scholar]
- Henseler, J.; Hubona, G.; Ray, P.A. Using PLS path modeling in new technology research: Updated guidelines. Ind. Manag. Data Syst. 2016, 116, 2–20. [Google Scholar] [CrossRef] [Scilit]
- Hair, J.F.; Risher, J.J.; Sarstedt, M.; Ringle, C.M. When to use and how to report the results of PLS-SEM. Eur. Bus. Rev. 2019, 31, 2–24. [Google Scholar] [CrossRef] [Scilit]
- Nunnally, J.C.; Bernstein, I.H. Psychometric Theory, 3rd ed.; McGraw-Hill: New York, NY, USA, 1994. [Google Scholar]
- Zulu-Chisanga, S.; Chabala, M.; Mandawa-Bray, B. The differential effects of government support, inter-firm collaboration and firm resources on SME performance in a developing economy. J. Entrep. Emerg. Econ. 2021, 13, 175–195. [Google Scholar] [CrossRef] [Scilit]
- Aguado-Riveros, U.I.; Espinoza-Quispe, L.E.; Santillán-Enciso, C.L.; Silva-Infantes, M.; Barrionuevo-Inca-Roca, Y.A.; Astuñaupa-Flores, S.N.; Poma-Lagos, L.A.; Navarro-Véliz, J.A.; González-Prida, V. Reducing administrative burden through simplification and document management in local governments: Evidence from a district-level public organization. Societies 2026, 16, 91. [Google Scholar] [CrossRef] [Scilit]
- Chatzinikolaou, D.; Vlados, C. Public support for business, intermediary organizations, and knowledge transfer: Critical development and innovation policy bottlenecks. J. Knowl. Econ. 2024, 16, 4605–4625. [Google Scholar] [CrossRef] [Scilit]
- Qatar Development Bank. Go Digital Program, 2026. Available online: https://www.qdb.qa/develop-your-business/advisory-services/go-digital-program (accessed on 28 August 2026).
- Ministry of Communications and Information Technology. SMEs Go Digital Program. 2026. Available online: https://www.mcit.gov.qa/en/news/mcit-showcases-milestones-of-the-smes-go-digital-program-in-accelerating-sme-digital-transformation/ (accessed on 28 August 2026).
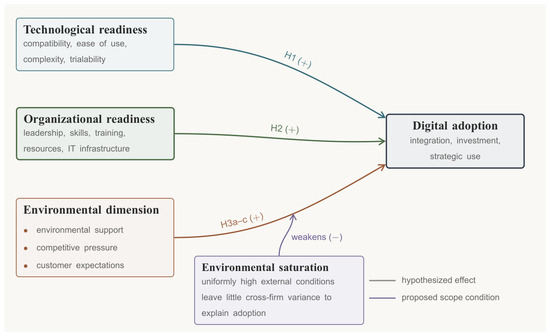
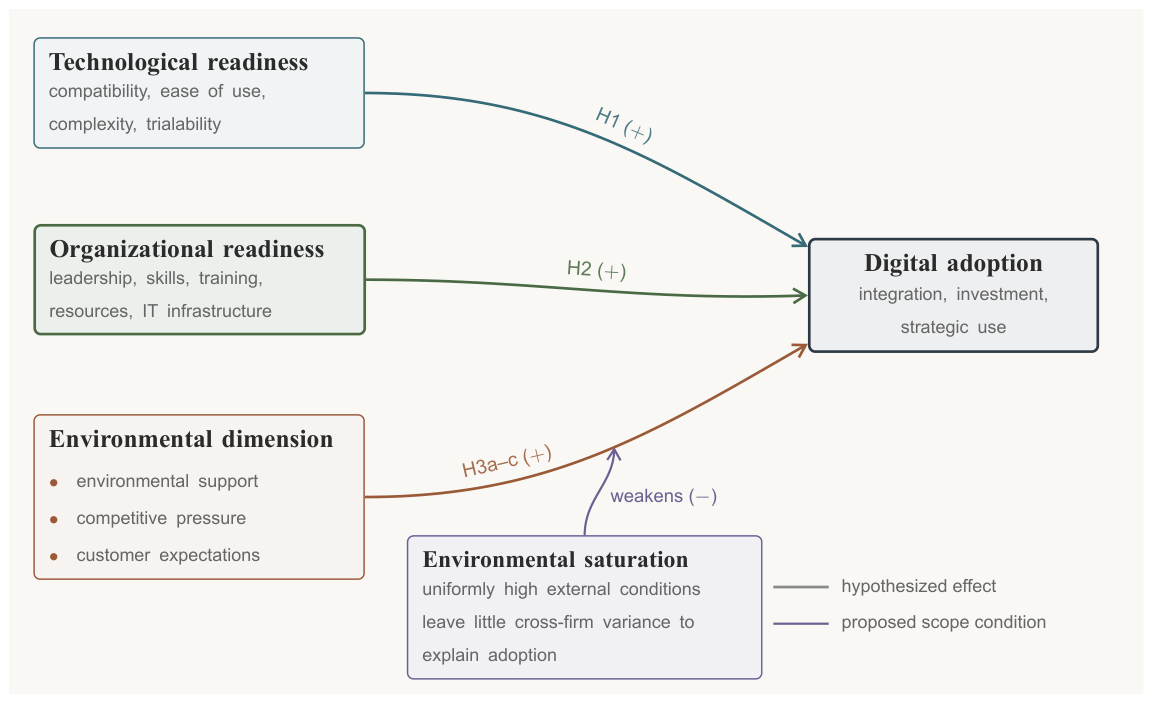
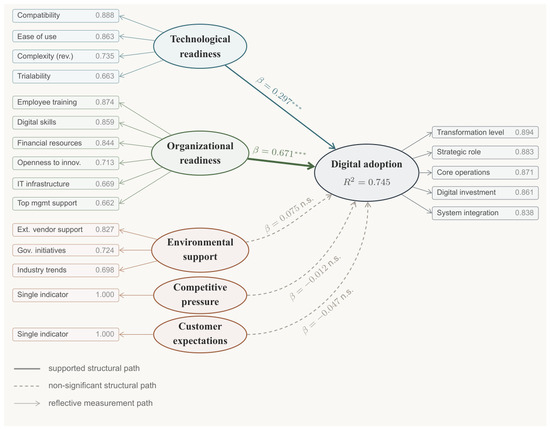
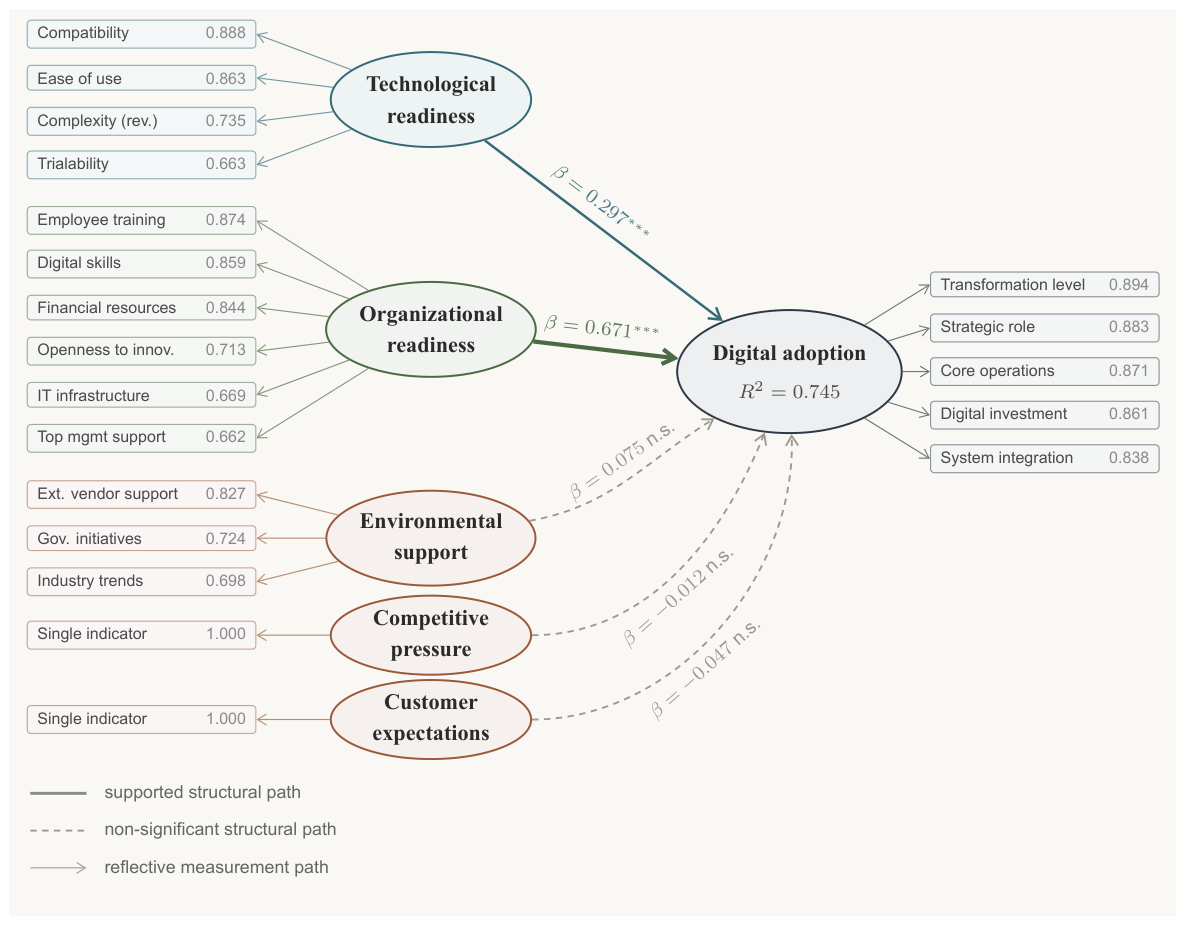

Disclaimer/Publisher’s Note: The statements, opinions and data contained in all publications are solely those of the individual author(s) and contributor(s) and not of MDPI and/or the editor(s). MDPI and/or the editor(s) disclaim responsibility for any injury to people or property resulting from any ideas, methods, instructions or products referred to in the content. |
© 2026 by the authors. Licensee MDPI, Basel, Switzerland. This article is an open access article distributed under the terms and conditions of the Creative Commons Attribution (CC BY) license.