1. Introduction
Climate change has become one of the most significant global challenges of the twenty-first century. It has wide-ranging effects on ecosystems, economies, and human health and well-being [
1]. Anthropogenic emissions have disrupted temperature regimes, precipitation patterns, cryospheric dynamics, and the frequency and severity of extreme weather events across the globe [
2]. Such changes are not spatially homogeneous and intersect with existing socio-economic disparities and environmental vulnerabilities, and are associated with disproportionate effects across regions and population groups. According to global and regional evaluations, developing regions with climate-sensitive livelihoods continue to experience disproportionate risks because limited assets, weak institutions, and restricted access to services may constrain their capacity to anticipate, absorb, and adapt to climate shocks [
3]. Mountain regions are among the world’s most climate-sensitive socio-ecological systems [
4]. Accelerated mountain warming, which often exceeds the global averages, is associated with glacial melt and retreat, reduced snow cover, changed seasonal runoff cycles, and heightened the frequency of climatic-related hazards, including landslides, flash floods, avalanches, droughts, and glacial lake outburst floods [
5]. The biophysical changes have far-reaching effects not only on mountain communities but also on downstream populations who rely on mountain ecosystems for water, food, and energy, as well as other ecosystem services [
6]. The mountain systems in Asia, such as the Himalayas and the Central Asian highlands, are global hotspots of climate risk with decisive consequences for sustainable development and regional stability [
7]. In South and Central Asia, mountain communities are predominantly rural and depend on subsistence and smallholder farming, pastoralism, forestry, and common property resources [
8,
9]. These are the livelihoods affected by steep terrain, low-fertility soil, limited cultivable land, short growing seasons, and high climatic variability. Existing studies show that climate change and extreme climatic conditions are associated with lower farm productivity. amplify agricultural production risk, raise income volatility, and endanger food security, particularly in fragile ecosystems [
10]. These effects may be intensified in mountain settings by remoteness, poor infrastructure, and limited access to markets, extension services, and formal safety nets [
11].
Climate-induced vulnerability has therefore become central in climate change research and policy. The most widely recognized analytical framework, as developed by the Intergovernmental Panel on Climate Change (IPCC), views vulnerability as a function of exposure to climatic risks, the sensitivity of socio-ecological systems, and the capacity to adapt. This framework highlights that vulnerability is not defined solely by physical exposure but also by social, economic, institutional and behavioral factors associated with how households and communities adjust to climatic stresses. Composite indices have been widely used, including the Livelihood Vulnerability Index (LVI) and the LVI-IPCC, which combine indicators of climate variability and natural resources, health, food, water, socio-demographic factors, and institutional capacity [
12]. Substantial heterogeneity in climate vulnerability outcomes has been demonstrated in many index-based empirical studies across regions, communities, and households subjected to homogeneous climatic conditions [
13,
14]. These studies conclude that variations in sensitivity and adaptive capacity are often important factors in overall vulnerability, beyond exposure. Education, income diversification, access to assets, health, social capital, and institutional support are some of the factors closely associated with vulnerability and resilience [
15]. These results are of particular importance to mountainous areas, where exposure to climatic risks is frequently inevitable, but adaptive potential differs significantly among households and social groups.
Adaptation has therefore become a central pillar of climate policy and research. Adaptation can be described as change in practices, processes, and structures that may buffer damage or capitalizes on the opportunities arising from climate change. At the local community level, adaptation is often autonomous, as households and communities respond to observed climate variability, while planned adaptation is supported through public policy and institutional action. The empirical literature documents numerous adaptation measures used by rural households, such as changes in crop types and planting periods, water and soil conservation, agroforestry, livelihood diversification, migration, and adjustments to livestock management [
16]. This is particularly true for indigenous and local traditional knowledge systems, which help moderate fragile mountain environments [
17]. Small and marginal farming households, including herders, apply their accumulated experience of weather patterns, environmental indicators, and land dynamics. Some studies demonstrate the significance of traditional and indigenous knowledge practices such as mixed farming, rotational grazing, seed saving, and collective natural resource management in potentially improving resilience by supporting livelihood diversification and reducing dependence on external inputs [
18]. The integration of local traditional knowledge with scientific climate information is increasingly recognized as essential for context-specific and socially acceptable adaptation practices.
Climate-smart agriculture (CSA) has recently gained attention as an integrated approach to raising productivity, strengthening resilience, and reducing greenhouse gas emissions [
19]. Experiences in Asia and other developing countries show that CSA practices (drought-tolerant crops, agroforestry, water-saving irrigation, soil fertility management, and integrated crop-livestock systems) can significantly alleviate livelihood vulnerability and enhance adaptive capacity [
20]. Nevertheless, adoption of CSA practices has not spread evenly, especially in regions with smallholders in marginal and mountainous areas, where financial, labour, risk, and information-access constraints appear relevant. There is a large body of literature that studies the factors influencing adaptation and the adoption of technologies, such as education, farm income, land and livestock ownership, access to reliable agricultural extension and climatic information, cooperatives, and credit services [
21]. Behavioral and perception-related studies also found that farmers’ prior experience with climate shocks, their risk perception, and attitude towards uncertainty significantly impact the adaptation decisions. Timely and relevant information, facilitated by extension systems, media, ICTs, and social networks, is important for determining awareness levels and the adoption of adaptive practices.
Climate-induced vulnerability and adaptive capacity are significantly linked to the gender dimension because of women’s inequitable access to climatic information, land rights, credit, and decision-making, which is associated with gender-differentiated effects of climate change [
22]. Existing empirical research and gender vulnerability assessments consistently show that female-headed households are more vulnerable. despite their major role in agricultural production and natural resource management [
23]. Male out-migration in hills and mountainous regions is associated with women’s burden and weaker adaptive capacity in mountain communities, which requires gender-sensitive adaptation policies [
24]. Beyond household-level factors, vulnerability and adaptation are also influenced by institutional, governance, and policy contexts. Climate vulnerability may be intensified by weak institutions, low levels of participation, and poor service delivery, and may be reduced by inclusive, community-based, and participatory approaches that strengthen social capital and community action [
25]. The economics of adaptation literature emphasizes that adaptation should be mainstreamed in development planning, adaptive capacity building, and distributional impacts to ensure that adaptation benefits reach the most vulnerable groups [
26].
Recent methodological advances have strengthened the empirical assessment of adaptation interventions. Empirical assessments using difference-in-differences, propensity score matching, and spatial econometric techniques have revealed that various interventions, including improved access to climatic information, agricultural credit, cooperative services, and climate-resilient technologies, are associated with reduced climate vulnerability and improved livelihoods, yet the impacts vary by context [
27]. Although the literature on climate vulnerability and adaptation is growing rapidly, there is limited comparative evidence across mountain systems. The Himalayas and the Central Asian highlands have several common features, such as ecological vulnerability, sensitivity to climatic conditions, and reliance on natural resource-based livelihoods. Yet, they vary significantly in terms of historical trends, systems of governance, institutional designs, and developmental trajectories. The mountain communities in Central Asia are influenced by the post-socialist transformation and changing property regimes, and thus, the adaptation challenges are not identical to those of Himalayan communities embedded in different national policy context. A systematic comparative analysis of these regions is therefore important in determining the general patterns as well as region-specific drivers of vulnerability and adaptability.
Most existing climate change studies have focused on specific areas, sectors, or countries, ignoring heterogeneity and micro-level social differentiation. In developing countries, climate impact reviews increasingly advocate local livelihood-based analyses that integrate exposure, sensitivity, and adaptive capacity within a consistent analytical framework [
28]. Mountain regions remain underrepresented in comparative empirical studies, despite their significant role in regional sustainability and the livelihoods of downstream populations. This paper fills these gaps by offering a comparative evaluation of climate-induced vulnerability and adaptive capacity among mountain communities in South and Central Asia with particular reference to the Himalayas and the Central Asian highlands. Leh in India and Sindhupalchok in Nepal are Himalayan Mountain contexts where subsistence farming and migration, along with scarcity of water and exposure to disasters, are key factors associated with household vulnerability. Batken in the Kyrgyz Republic and Urgut in Uzbekistan represent mountain systems with post-Soviet institutional histories and semi-commercial agriculture and reliance on irrigation. It is, therefore, possible to compare the social, agricultural and institutional conditions where climatic vulnerability is generated with the selected districts.
This paper situates local livelihood experiences within existing vulnerability and livelihood index-based approaches and connects them to broader theoretical and policy debates. The comparative method allows the study to identify both common vulnerabilities and context-specific determinants of resilience, which can be used to provide evidence for developing inclusive, place-based adaptation strategies. Understanding the interaction between exposure, sensitivity, and adaptive capacity under varied mountain conditions is relevant to the protection of livelihoods in the highlands as well as sustainable development, water security, and social stability in South and Central Asia. The present paper contributes to this agenda, as it aims at developing a comparative, empirically based understanding of climate-induced vulnerability and adaptive capacity in two of the most climate-sensitive mountain systems in Asia.
Research Questions and Objectives
The study is guided by four linked research questions: (i) how does livelihood vulnerability vary across selected mountain communities in South and Central Asia; (ii) how do exposure, sensitivity, and adaptive capacity interact to produce different vulnerability outcomes; (iii) how do livelihood assets and structural endowments explain regional differences in adaptive capacity; and (iv) how do qualitative accounts from communities help interpret the index-based results? The corresponding objectives are to construct comparable LVI, LVI-IPCC, and LEI measures; to identify the component-level correlates of vulnerability in each region; to connect quantitative results with local narratives; and to draw context-specific policy lessons for reducing vulnerability and strengthening adaptive capacity.
2. Review of Literature
Climate change is a socio-economic and institutional issue, as well as an environmental phenomenon. International assessment studies show that climate effects are not evenly distributed across regions and populations, as they vary in terms of exposure, sensitivity, and adaptive capacity. Poorer regions are overrepresented because their livelihoods are directly associated with climate-sensitive development sectors such as agriculture, livestock, forestry, and fisheries, and adaptive responses are constrained by institutions and financial capacity [
29]. Economic studies also highlight that climate change may hinder growth, worsen poverty, and increase inequality when adaptation is inadequate or ineffective [
28]. Vulnerability has become a dominant analytical concept within this wider discussion. Vulnerability is a dynamic condition influenced by both external shocks and internal coping capacity. This understanding was formalized by the IPCC, which defined vulnerability as dependent on exposure, sensitivity, and adaptive capacity, a definition widely applied in most empirical climate change research [
30].
A growing body of literature identifies mountain areas as hotspots of climate change because of elevation-related warming, cryosphere sensitivity, and complex topography [
4]. Studies have shown that temperature increases in mountainous areas are often faster than the global average, associated with accelerated glacier melt and changes in hydrological systems [
31]. These changes are linked with increase in frequency and severity of hazards like landslides, floods, droughts, and glacial lake outburst floods, and their effects are also observed in livelihoods and downstream populations [
32]. The fragility of environmental stability and the social and economic significance of mountainous regions of the Himalayas and Central Asia have attracted more research interest [
4,
33]. The Hindu Kush Himalaya Assessment notes that the area functions as the water tower of Asia, where environmental change is rapid and human vulnerability is high. The Central Asian highlands confront increasing climatic impacts, including severe water stress and economic distress [
8,
34]. Despite these similarities, the existing studies are mainly region-specific and lack a comparative empirical assessment of climate change impacts on mountain communities.
The sustainable livelihoods framework is widely used to examine the effect of climate change on rural and mountain communities [
35]. This framework focuses on the relationship between livelihood assets (human, natural, financial, physical, and social capital), vulnerability contexts, and institutional structures [
36]. In developing countries, climate change and climate-induced events are particularly harmful to rain-fed agriculture and natural resources-based livelihoods [
37]. Structural issues such as inadequate access to fertile land and irrigation facilities, and fragile ecosystems, are associated with higher mountain livelihood sensitivity [
4]. The Himalayan studies record diminishing agricultural yields, rising crop failures, and water stress linked to alterations in snow patterns and rainfall [
38]. Similarly, the Central Asian highlands have experienced increasing degradation of pastures, reduction in livestock, and inadequate irrigation owing to recurring droughts and temperature fluctuations [
8]. Therefore, beyond biophysical exposure, the vulnerability to climate change is directly linked to livelihood improvement and improved ecosystem governance.
The development of composite indices to quantify multi-dimensional vulnerability is one of the major methodological contributions in the climate vulnerability literature [
39]. The LVI was developed by Hahn et al. [
40], which has been extensively used in a variety of situations to measure vulnerability at the household and community level. LVI indicators include climate vulnerability, natural disasters, food security, access to water, health, socio-demographic factors, livelihood strategies, and social networks [
13,
41]. The LVI-IPCC reformulation aligns the index directly with the IPCC vulnerability framework by reorganizing the indicators into exposure, sensitivity, and adaptive capacity. Many studies use the LVI and LVI-IPCC methods in rural or agrarian contexts, demonstrating their utility for comparative analysis and policy-related examination [
40]. Studies have shown that adaptive capacity and sensitivity are the key determinants of overall vulnerability, rather than exposure [
14,
42]. The most recent study using LVI-based approaches in ecologically sensitive settings has found substantial intra-community heterogeneity. Even farming households exposed to similar climatic conditions may have considerably diverse vulnerability outcomes associated with variations in education, income diversification, access to credit, and social networks [
13]. These results support disaggregated analysis that does not examine only aggregate climatic indicators.
Adaptive capacity is central to theoretical and empirical studies of climate change. It is the capacity of people, households, and institutions to anticipate, adapt to, and recover from the effects of climatic shocks [
43]. Adaptive capacity is positively influenced by human capital (education, skills, and health) as it permits farm households to access climatic information, use new techniques, and diversify livelihoods [
44]. Access to financial capital, such as income, savings and credit access, may improve households’ adaptation and ability to absorb climatic shocks. Land quality, irrigation infrastructure, and housing, which are natural and physical capital, are also important in buffering climate change impacts [
44]. Institutions and social networks are also vital for sharing knowledge and lowering risk. By contrast, weak institutions, inadequate extension services, and poor governance limit adaptive adaptation capacity, especially in remote mountain areas [
45]. Therefore, adaptive capacity is linked with power relations and access to resources.
Various studies record the diverse climate adaptation strategies used by farming households. Such strategies include changes in cropping patterns, the adoption of stress-tolerant varieties, changes in planting calendars, soil and water conservation, diversification of livelihoods, and migration [
46,
47]. Adaptation can be path-dependent and incremental and shaped by existing livelihood systems and resource limitations [
26]. Empirical research in Africa has suggested that these households can become less vulnerable and more resistant through CSA practices such as agroforestry, integrated crop-livestock systems, and water-saving irrigation [
19]. Nevertheless, CSA adoption rates remain uneven, especially among the smallholders in marginal environments, due to financial, informational, and institutional barriers [
48].
Indigenous and local knowledge systems occupy an important place in the climate adaptation literature, particularly in marginal and mountain settings [
17]. Researchers have stressed that farmers and pastoralists have extensive knowledge of weather patterns, ecological indicators, and landscape dynamics. Adaptation strategies include crop diversification, rotational grazing, and community-based resource management, which are informed by this knowledge. Recent studies emphasize the need to apply indigenous knowledge alongside scientific climate data more systematically to improve adaptation effectiveness [
49,
50]. Therefore, integrating indigenous knowledge with scientific information may enhance the relevance and effectiveness of adaptation intervention, specifically in the context of low trust in institutional interventions [
51].
Gender has emerged as a crucial aspect of climate vulnerability and adaptation. Women’s vulnerability is often associated with gendered divisions of labour, unequal access to land and credit, and limited participation in decision-making [
52]. Systematically greater vulnerability scores for female-headed households in agrarian settings have been reported by using gender-sensitive vulnerability indices [
37]. Out-migration of men in mountainous areas has increased women’s responsibilities for agriculture and the administration of natural resources, increasing their exposure and adaptation burden [
8]. Meanwhile, research findings highlight the primary role of women in adaptation and innovation, and the need to implement gender-responsive policy, increasing the accessibility of resources and information to women.
Both vulnerability and adaptation outcomes are influenced by institutional and governance contexts. Studies on climate governance highlight that institutional weaknesses, the marginalization of vulnerable groups in development practices, and poor service delivery are associated with higher vulnerability, especially among disadvantaged communities [
53]. Participatory and community-based methods, on the other hand, strengthen resilience by building social capital and local institutions [
54]. Mainstreaming adaptation into planning while recognizing distributional impacts may help support more equitable benefits for vulnerable groups through adaptation interventions [
26]. However, poorly designed adaptation interventions may increase inequalities if social differentiation is ignored.
Recent advances in empirical methods have strengthened the assessment of adaptation interventions [
27]. Quasi-experimental designs (i.e., difference-in-differences and propensity score matching) show that targeted interventions are associated with decrease in vulnerability and increase livelihood resilience [
54]. Nevertheless, heterogeneity and context-specificity of impacts make it important to adopt localized analysis and robust evaluation frameworks [
28]. Evidence from resilience interventions further shows that locally designed programmes may reduce vulnerability and strengthen livelihood resilience when they address context-specific risks and delivery constraints [
55].
2.1. Research Gap in the Existing Literature
Although the literature reviewed above is extensive, several gaps remain. First, comparative analyses across mountain systems remain limited, as most studies focus on single regions or countries. Second, the integration of vulnerability measurement and adaptation and resilience outcomes need to be strengthened. Third, the relationship between indigenous knowledge and formal institutions and the development of new technologies has received limited attention in relation to adaptive capacity.
2.2. Present Study’s Contribution
This study directly addresses these gaps by offering a comparative evaluation of climate-induced vulnerability and adaptive capacity in the Himalayas and Central Asian highlands. The study contributes to a more detailed understanding of mountain vulnerability and resilience in South and Central Asia by using established frameworks of vulnerability, LVI/LVI-IPCC methodologies, and insights from the adaptation, gender, and institutional studies.
3. Methodology
This study adopts a mixed-method analytical approach to evaluate climate-induced livelihood vulnerability in selected mountain communities of South and Central Asia. Household survey data provide comparable quantitative measures, while focus group discussions, key informant interviews, and case studies provide contextual evidence on local institutions, livelihoods, and adaptation practices. The analytical framework combines the Livelihood Vulnerability Index (LVI), its IPCC-compatible extension (LVI-IPCC), and a capital-based Livelihood Equity/Endowment Index (LEI). Together, these measures allow vulnerability to be examined not only as exposure to climate risks, but also as a condition associated with sensitivity, adaptive capacity, and unequal access to livelihood assets. The LVI components and number of indicators used in the index construction are summarised in
Table A1.
3.1. Data Sources and Survey Design
The empirical analysis is based on primary data collected from 600 sampled households, with 150 households selected from each of the following study areas: Leh district in Ladakh, India; Sindhupalchok in Nepal; Batken in Kyrgyzstan; and Urgut in Uzbekistan. The equal regional sample was used to maintain a balanced comparative design across the four study contexts. It was not intended to generate statistically representative estimates for each entire district or urban centre. To improve comparability and reduce sampling bias, a multi-stage stratified random sampling design was followed. Study districts were selected using explicit criteria: mountain ecology and altitude, documented exposure to climate-related risks, dependence on agriculture and land-based livelihoods, and the presence of rural or peri-rural settlements suitable for comparative analysis. In the second stage, each district was stratified into high- and medium-vulnerability locations using secondary data and field validation by local officials, researchers, and knowledgeable residents. The stratification considered altitude or terrain position, climate hazards such as droughts, floods, landslides and water stress, dependence on agriculture, and settlement remoteness (
Table A2). In the third stage, six villages or rural/peri-rural settlements were selected in each study area (
Table A3).
In the fourth stage, a household listing exercise was conducted in the selected villages or settlements to create the household sampling frame. The listing recorded household size, social composition, livelihood source, landholding, irrigation access, drinking-water access, housing conditions, and climate-exposure characteristics (
Table A4). The 150 households in each study area were allocated across selected villages using probability proportional to size, so that larger villages received a larger share of the sample. Within each village, households were selected through circular systematic random sampling from the complete household list. The final sample was checked against the listing characteristics to ensure that major household categories present in each settlement were adequately represented. The results, therefore, refer to the surveyed households and sampled settlements, not to the entire administrative district or city population.
The qualitative component was designed to explain and validate the patterns found in the indices. Twelve focus group discussions, eight key informant interviews, and six case studies were conducted across the four study areas. Participants were purposively selected from the same broad survey locations, including farmers, women, elderly residents, local resource users, community representatives, and local officials or knowledgeable persons. Discussions focused on climate perceptions, water and land-use change, livelihood risks, institutional support, migration, gendered burdens, and local adaptation practices. Notes from the qualitative work were coded thematically and used to interpret the component-level LVI, LVI-IPCC, and LEI results. This integration helped avoid treating the indices as stand-alone numbers and enabled the statistical patterns to be read alongside lived experience and institutional context.
Ethical safeguards were incorporated throughout the study. Participation was voluntary, informed consent was obtained before data collection, and all survey records were anonymized before analysis. No direct or linked identifiers were retained in the analytical dataset. The study therefore falls within the less-than-minimal-risk/no-linked-identifier category described in the ICMR National Ethical Guidelines for Biomedical and Health Research Involving Human Participants, 2017, Table 2.1 and Section 4.8.2/Table 4.2 [
56].
3.2. Construction of the Livelihood Vulnerability Index (LVI)
The LVI is developed through a balanced weighting approach in which indicators are first standardized and then averaged. This method follows established approaches to vulnerability assessment [
40,
57] and is useful where vulnerability is multidimensional, and no single indicator can be assumed a priori to dominate the others. Equal weighting was used to avoid imposing subjective weights across social, environmental, institutional, and livelihood indicators in the absence of a defensible region-specific weighting scheme. However, the equal-weighting assumption is interpreted cautiously: component-level results are reported alongside the aggregate index, and conclusions are based on repeated patterns across the LVI, LVI-IPCC, LEI, and qualitative evidence rather than on a single ranking alone. The equal-weighting approach assumes that there is no compelling empirical or theoretical evidence to justify weighting one indicator over another across the different mountain contexts included in this study. To assess whether this choice could influence interpretation, the results were read alongside component scores, the LVI, LVI-IPCC, LEI, and qualitative evidence. These convergent patterns suggest that the main interpretation is unlikely to depend solely on the equal-weighting assumption. Therefore, the index rankings should be read as comparative signals.
To ensure comparability, all indicators were transformed so that higher values consistently reflect higher vulnerability. Binary variables were converted to a 0–1 format, while continuous variables were standardized using min–max normalisation:
This transformation scales all variables between 0 and 1. Component scores were calculated as the arithmetic mean of their respective indicators, implying equal weighting within each component. The overall LVI is then computed as:
, where
denotes component score, and
represents the number of indicators in the component i. This specification is intended to ensure that each indicator contributes equally to the final index, rather than each component (
Table A5).
3.3. LVI-IPCC Framework
To align the analysis with the IPCC vulnerability framework, the LVI components were regrouped into three dimensions: exposure, sensitivity, and adaptive capacity. (i) Exposure: Natural disasters, climate variability; (ii) Sensitivity: Health, food, water, housing, forest-energy; and (iii) Adaptive Capacity: Socio-demographic, livelihood, social networks, knowledge, financial, infrastructure. The LVI-IPCC index was calculated as: LVI-IPCC = (Exposure − Adaptive Capacity) × Sensitivity.
This formulation is designed to reflect the interaction between households’ adaptive capacity and climate risks.
In this formulation, higher exposure tends to increase vulnerability, while adaptive capacity can offset part of this risk, and sensitivity indicates how strongly households may be affected. Higher values indicate relatively higher vulnerability, values close to zero indicate moderate vulnerability, and negative values suggest relatively stronger resilience (
Table A5).
3.4. Livelihood Equity/Endowment Index (LEI)
To provide a more complete understanding of structural inequalities, a Livelihood Equity/Endowment Index (LEI) was created, using a capital-based approach. This index includes five key areas: (i) Human capital, including education and health; (ii) Natural capital, covering land and water; (iii) Social capital, focusing on networks and institutions; (iv) Physical capital, such as infrastructure and housing; and (v) Financial capital, including income and credit. The LEI is computed as
Unlike the LVI, which captures current vulnerability, the LEI reflects longer-term structural endowments associated with households’ capacity to adapt and sustain livelihoods. Capital dimensions were constructed using standardized indicators scored in the same 0–1 direction as the LVI, where higher values indicate weaker livelihood endowment or greater structural vulnerability. The LEI was calculated as the average of five capital dimensions. Equal weighting was retained because the purpose of the index is to assess balanced livelihood endowments across human, natural, social, physical, and financial capital, not to privilege one form of capital over another. The interpretation, therefore, considers both the composite LEI value and the individual capital scores.
3.5. Scope and Limitations
The combined use of LVI, LVI-IPCC, and LEI provides a comprehensive framework for analyzing vulnerability by integrating exposure, sensitivity, adaptive capacity, and structural inequalities. The approach also has limitations. First, min-max normalization is sensitive to the range of observed values, so unusually high or low values can affect standardized scores. Second, equal weighting may understate the possibility that some indicators matter more than others in specific contexts. For this reason, the analysis reports component-level patterns and treats the aggregate rankings as comparative signals rather than definitive measures. Third, the study is based on cross-sectional data, which limits the ability to capture changes in vulnerability and adaptation over time. Fourth, the sample represents selected rural and peri-rural settlements within each study area, not the full district population. Fifth, the indices are descriptive and comparative; they identify associations and possible contributing factors, but do not claim causal effects. Finally, the qualitative evidence strengthens interpretation, but it does not substitute for longitudinal or experimental validation. These limitations are acknowledged while retaining the value of the framework for policy-relevant comparison across diverse mountain contexts.
3.6. Study Area
The study areas comprise selected mountain districts and settlements in Leh, India; Sindhupalchok, Nepal; Batken, Kyrgyzstan; and Urgut, Uzbekistan. These sites are located within two broad highland systems, the Himalayas and the Central Asian mountains. They were selected because they combine ecological fragility, climate-sensitive livelihood systems, and contrasting institutional histories. This makes them suitable for comparing how similar climate pressures are associated with different vulnerability outcomes when filtered through land systems, settlement patterns, market access, governance, and livelihood assets.
Leh represents a high-altitude cold desert setting in the Trans-Himalaya. Agriculture and pastoral activities are partly constrained by limited cultivable land, a short growing season, extreme temperatures, and dependence on glacier- and snowmelt-fed irrigation. Traditional water management institutions and local knowledge remain important, but they are under pressure from changing hydrology, out-migration, and limited financial and infrastructural access. Sindhupalchok represents a mid-hill Himalayan setting with steep terrain, rain-fed and partially irrigated agriculture, recurrent landslides, floods, seismic risk, and monsoon variability. Livelihoods depend on smallholder farming, livestock, wage work, and remittances, while local institutions and social networks provide important but uneven support.
Batken and Urgut differ from the Himalayan cases because their land, irrigation, and service-delivery systems have been shaped by Soviet and post-Soviet institutional histories. Batken is a semi-arid mountain and agro-pastoral region where livelihoods combine crop production, orchards, livestock, small trade, wage work, and migration. Water scarcity, land degradation, and border-related resource pressures are associated with adaptive capacity. Urgut is a mountain-valley transition area near Samarkand, with stronger links to markets and irrigated, semi-commercial agriculture. These market and irrigation links support adaptation in some ways, but structural inequalities in land, finance, and institutional access remain associated with vulnerability.
The comparative value of the four cases lies in these contrasts. The Himalayan sites are more strongly connected with remoteness, smallholder subsistence systems, migration, and hazard exposure, while the Central Asian sites are more strongly linked with irrigated agriculture, market linkages, and post-socialist land and water institutions. The analysis, therefore, treats climate vulnerability as a socio-ecological outcome, not simply as a result of physical exposure.
These site differences are carried into the interpretation of the household results, with the analysis consistently distinguishing surveyed households and sampled settlements from the wider district populations.
3.7. Sample Profile
The sample profile indicates that most selected households were rural or peri-rural and that their livelihoods were closely connected to agriculture, livestock, water, land, and other natural resources. However, production systems differed markedly across the four study areas. In Leh, sampled households were drawn from high-altitude villages where subsistence agriculture, livestock, and glacier-fed irrigation remain central. Cultivable land is limited, growing seasons are short, and livelihood diversification is constrained. In Sindhupalchok, sampled households came mainly from villages where livelihoods combine smallholder farming, livestock, wage labour, and remittance support. Agricultural land is often fragmented and rain-fed or only partly irrigated.
In Batken, sampled households were drawn from agricultural villages where crop production, orchards, livestock, irrigated plots, wage work, and migration income are combined. Compared with the Himalayan sites, the agricultural system is more specialized and partly commercial. In Urgut, the sample included urban, peri-urban, and rural agricultural settlements with closer links to markets and irrigation systems. These differences in production systems are central to interpreting the vulnerability results because low dependence on family farming in Batken and Urgut does not automatically mean low vulnerability; it reflects different forms of market dependence, irrigation reliance, and institutional exposure.
3.7.1. Gender and Age
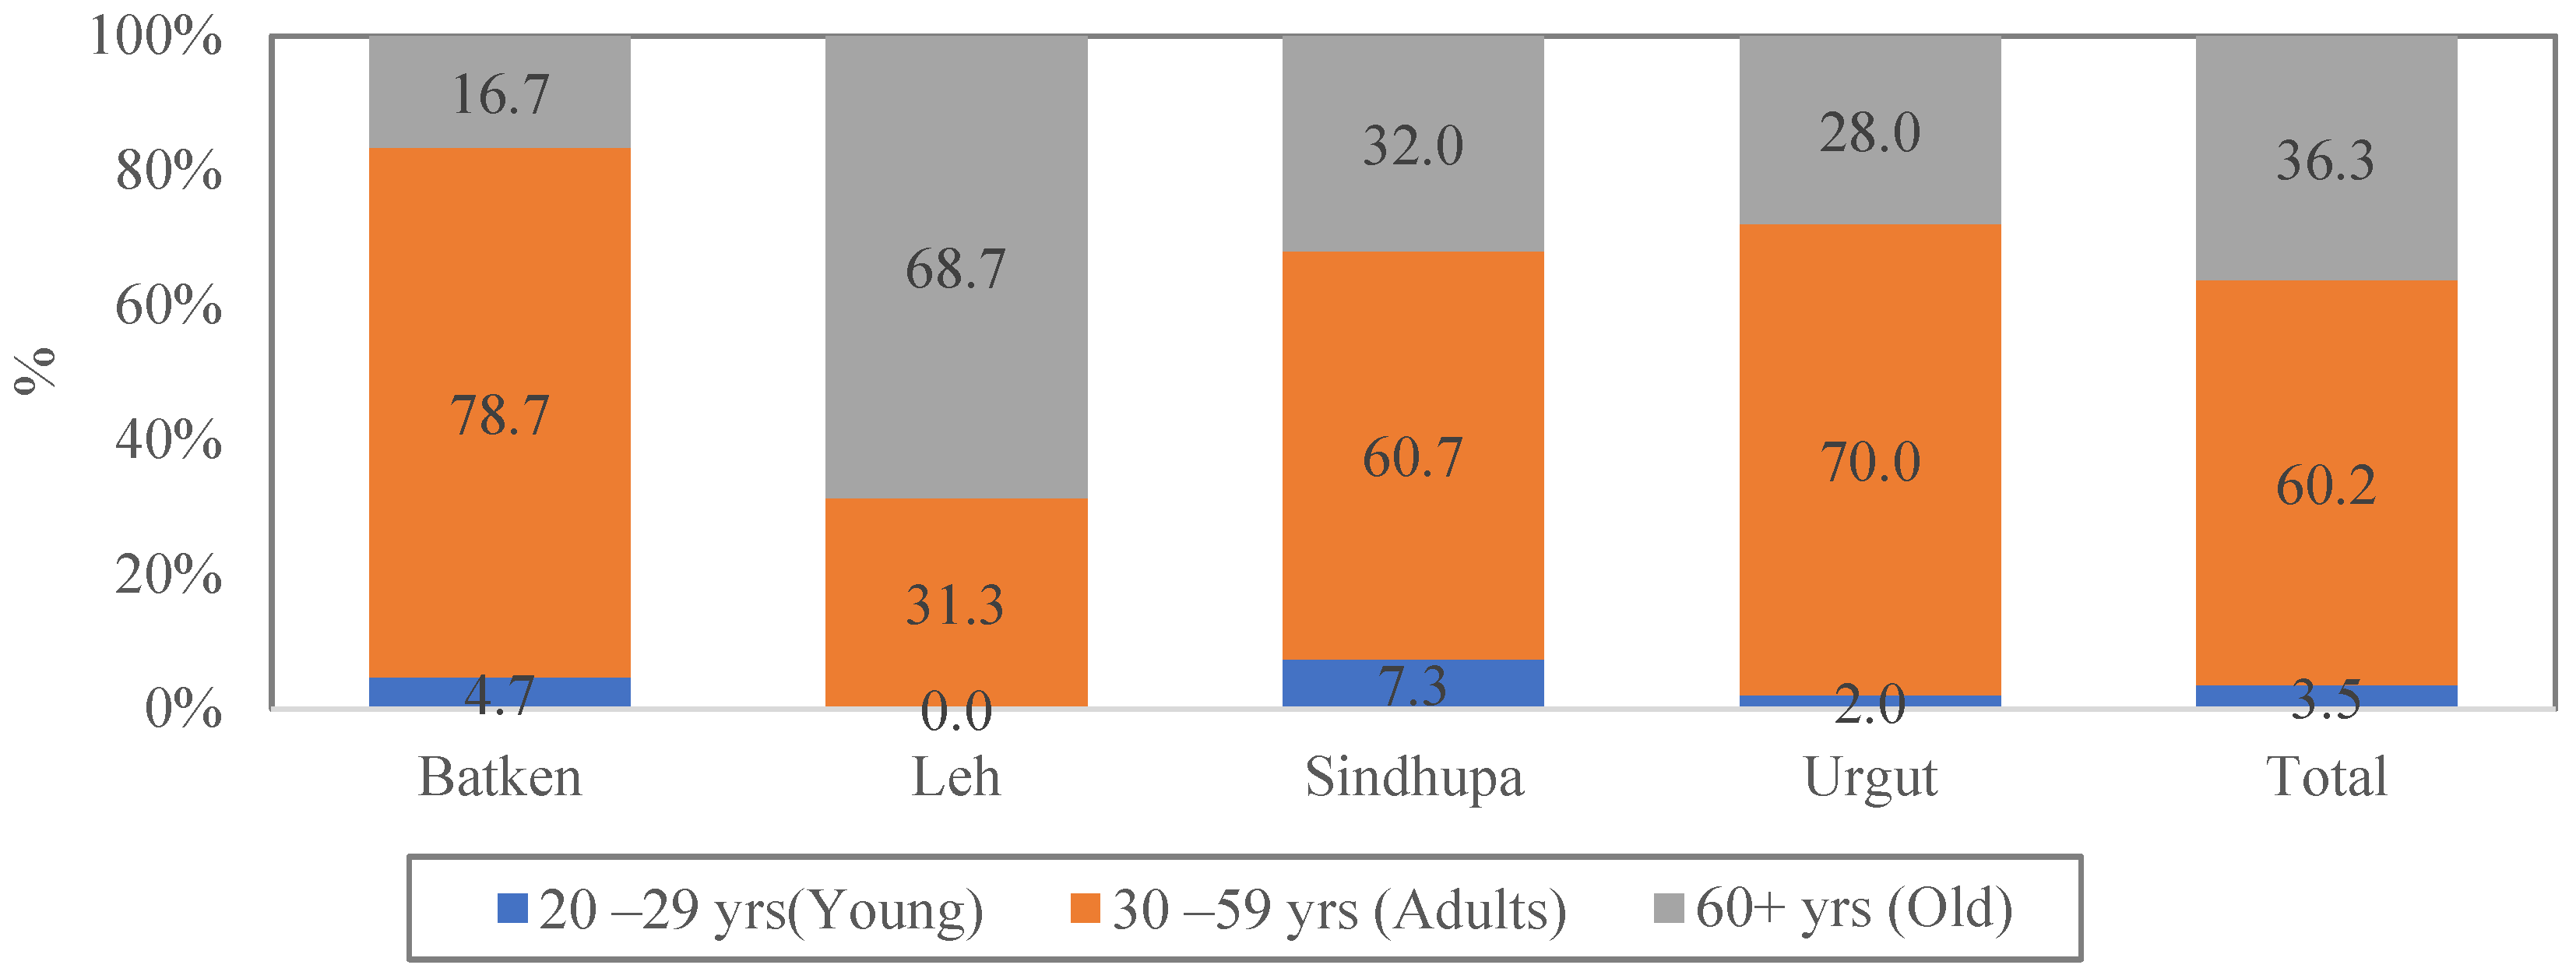
Women account for 34.5% of surveyed respondents, with somewhat higher representation in Sindhupalchok and Leh and lower representation in Batken and Urgut. This pattern likely reflects regional differences in gender norms, migration, and household decision-making. The age distribution shown in
Figure 1 is mainly composed of working-age respondents (60.2%), while 36.3% are elderly and 3.5% are young people. The regional pattern is especially important. Batken and Urgut have a relatively high proportion of working-age respondents, suggesting greater household labour availability. Sindhupalchok has a more mixed age profile, while Leh has a distinctly older respondent profile, with 68.7% of respondents in the elderly age group. This may increase labour constraints and dependency pressures. At the same time, elderly residents may hold valuable traditional ecological knowledge on water management, cropping practices, weather indicators, and collective resource use. Ageing is therefore associated with increased vulnerability in some respects but may also contribute to adaptive capacity when local knowledge is recognized and linked with institutional support.
3.7.2. Income Levels
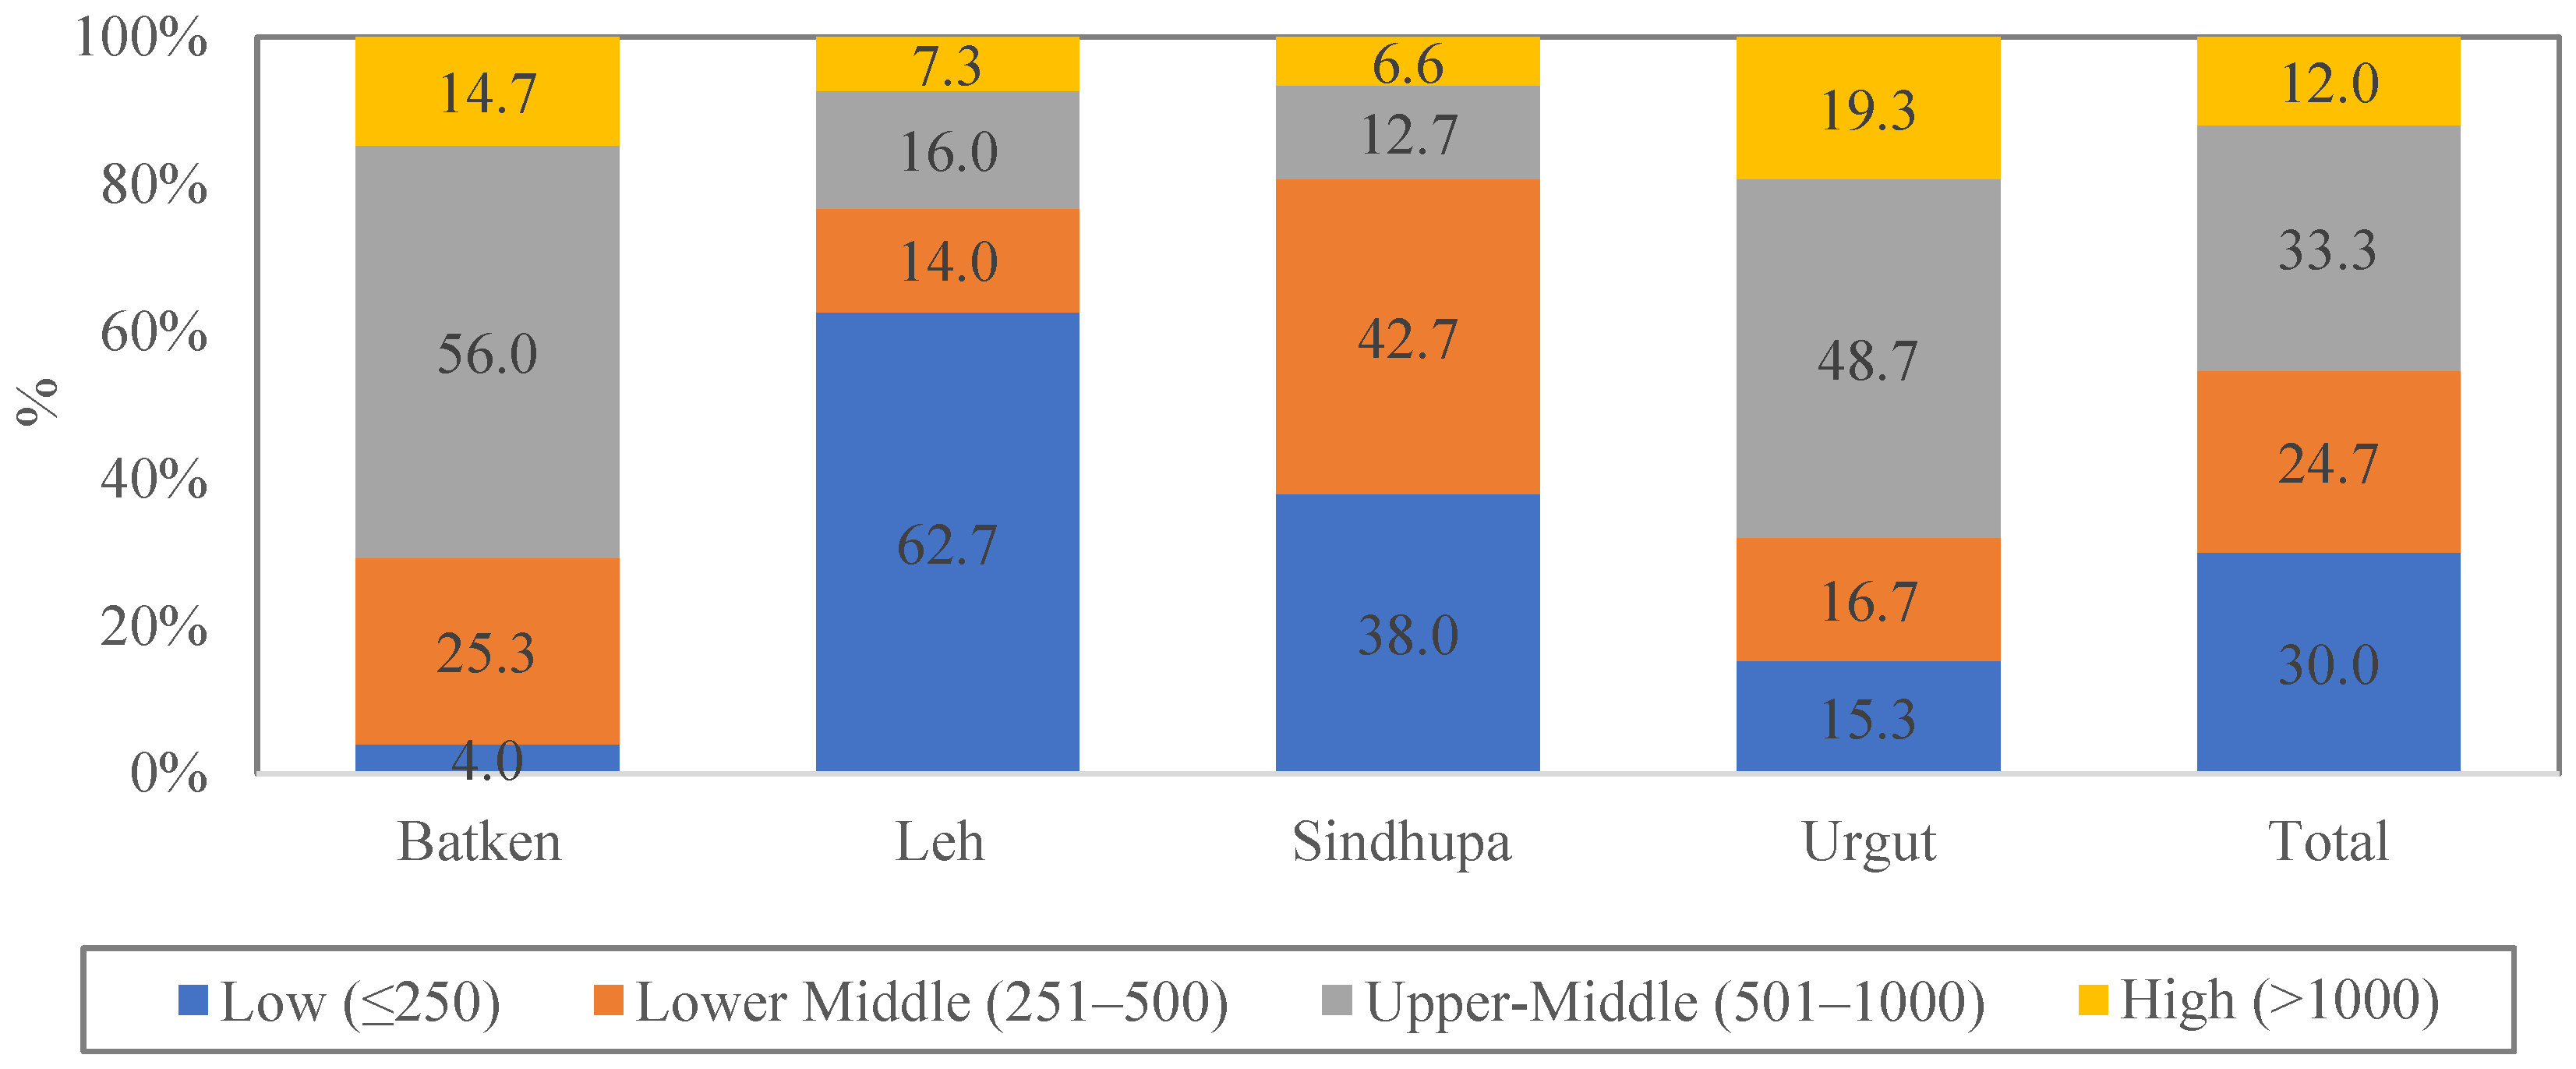
Figure 2 shows substantial variation in income distribution across the surveyed households. At the aggregate level, about 30% of households fall into the low-income category, nearly one-fourth into the lower-middle category, about one-third into the upper-middle category, and only 12% into the highest income group. The regional pattern suggests that economic vulnerability is concentrated most strongly among surveyed households in Leh and Sindhupalchok.
Figure 2.
Distribution by Income (in US dollars) Group (%).
Figure 2.
Distribution by Income (in US dollars) Group (%).
Among the surveyed households, Leh has the weakest income profile, with 62.7% of households in the lowest income bracket. Sindhupalchok shows a similar pattern, with more than 80% of households falling into the low and lower-middle income groups. These distributions suggest limited financial security and weaker capacity to absorb shocks or invest in adaptation. Batken and Urgut show relatively stronger income profiles, with 56.0% and 48.7% of households in the upper-middle income group, respectively. Even so, a substantial share of households in both districts remains below the higher income threshold, indicating that economic precarity cuts across the sample. These patterns support the wider argument that financial capital is a key correlate of adaptive capacity, as households with more stable incomes are generally better placed to absorb shocks and invest in risk-reducing strategies [
58].
3.7.3. Family Structure
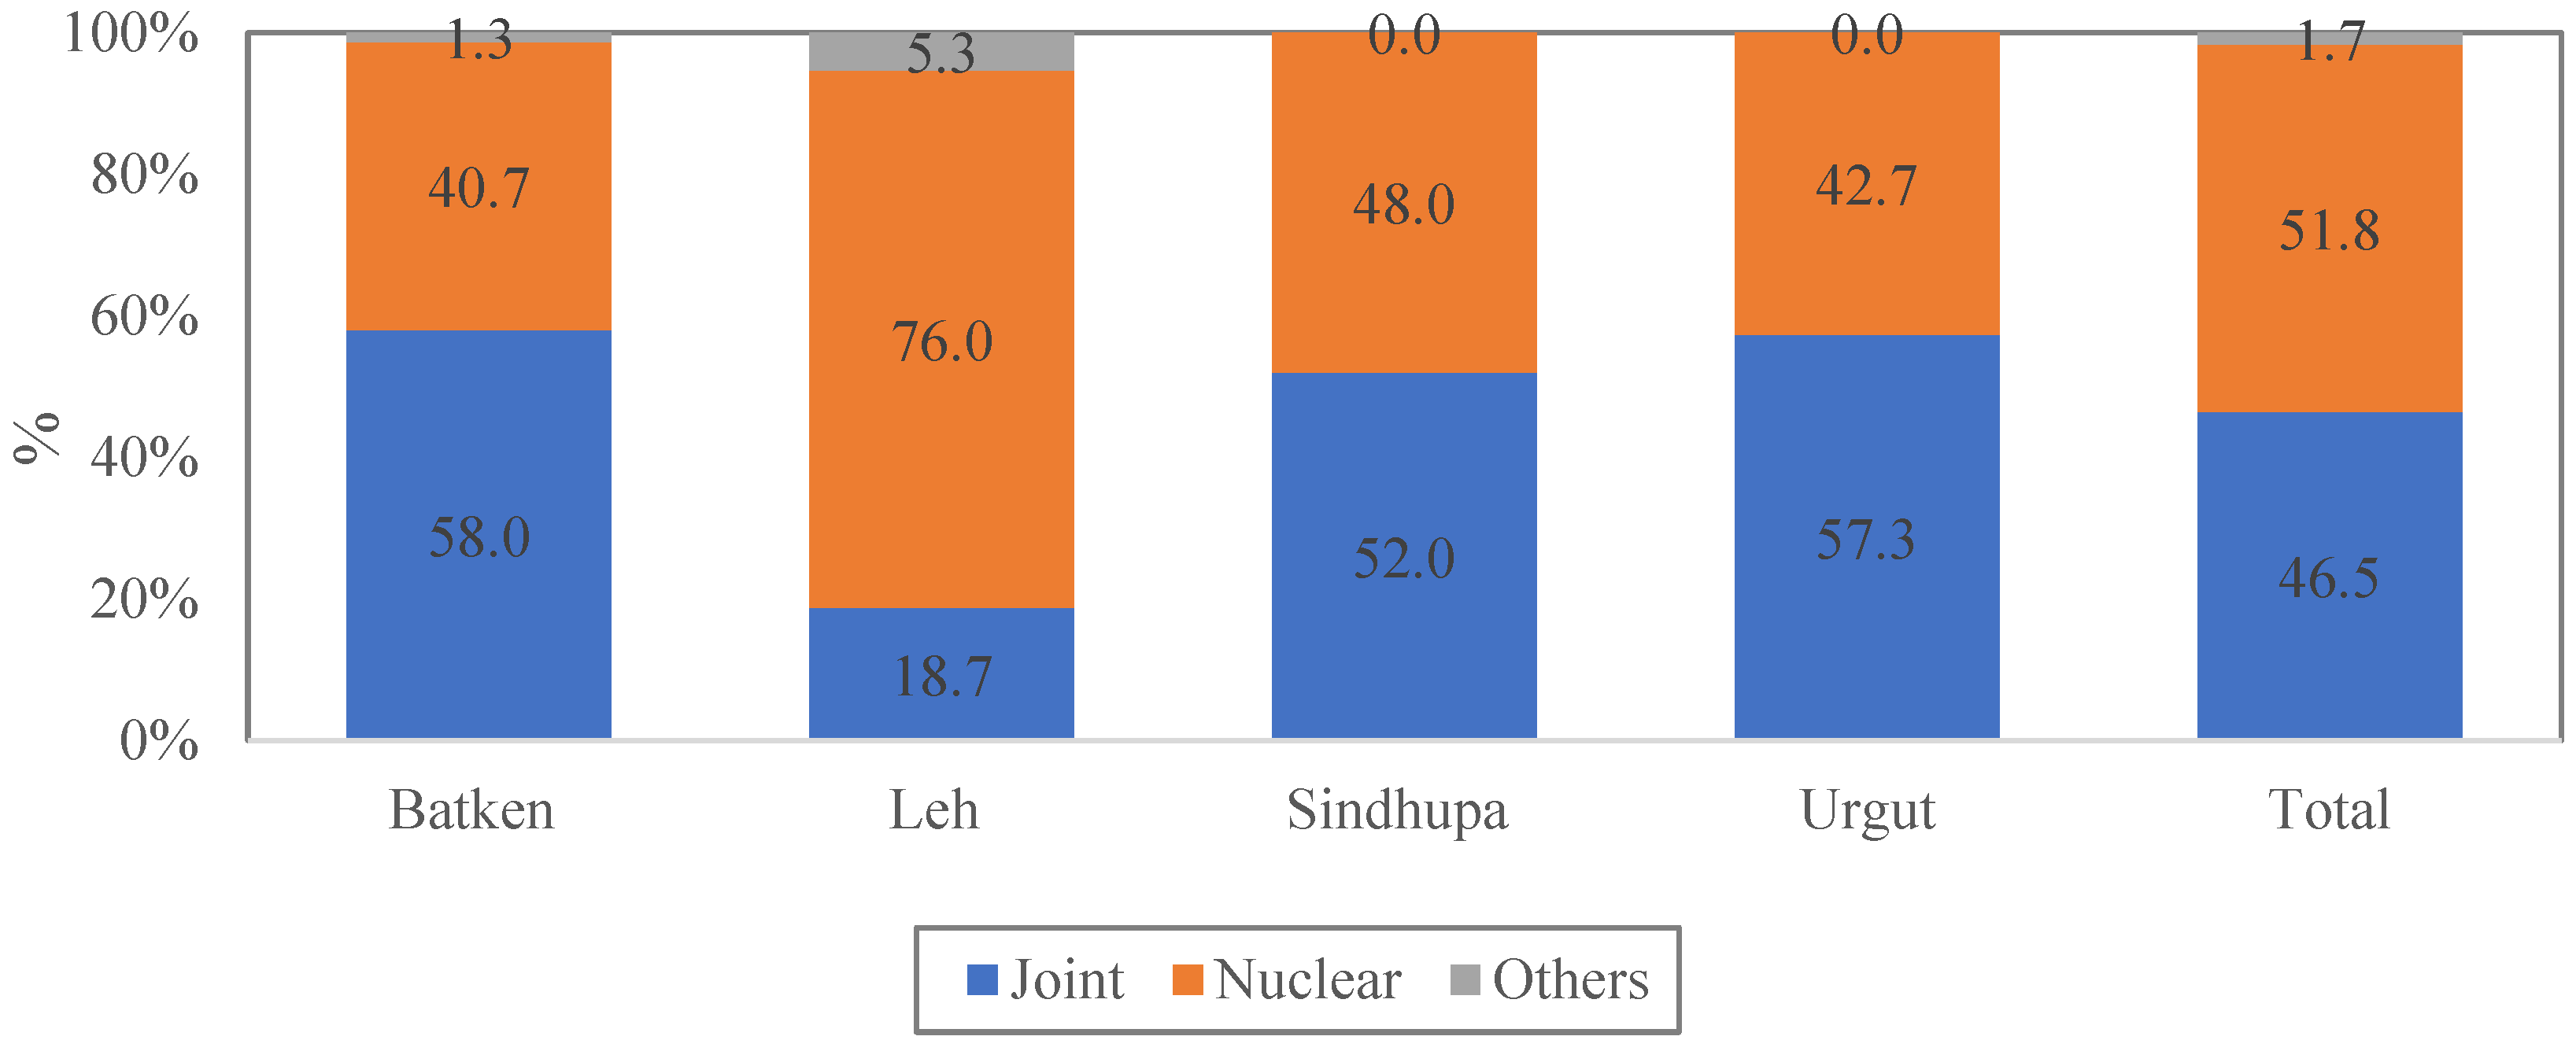
Family structure provides insight into household organization and the availability of support within family systems. As shown in
Figure 3, the sample is almost evenly split between nuclear families (51.8%) and joint families (46.5%), suggesting that mountain households are situated within a transitional social context rather than a single dominant family form. Nuclear families are most common among surveyed households in Leh (76.0%), which may reflect migration, family restructuring, and changes in traditional living arrangements. Batken, Sindhupalchok, and Urgut have higher shares of joint families, ranging from approximately 52% to 58%. Such intergenerational arrangements can support resilience by sharing care, labour, and income responsibilities. At the same time, they may increase dependency burdens where elderly or non-working members are numerous. The coexistence of nuclear and joint family systems, therefore, has direct implications for vulnerability because household structure is associated with both social support and resource pressure [
45].
Figure 3.
Family Structure (%).
Figure 3.
Family Structure (%).
3.7.4. Religious Composition
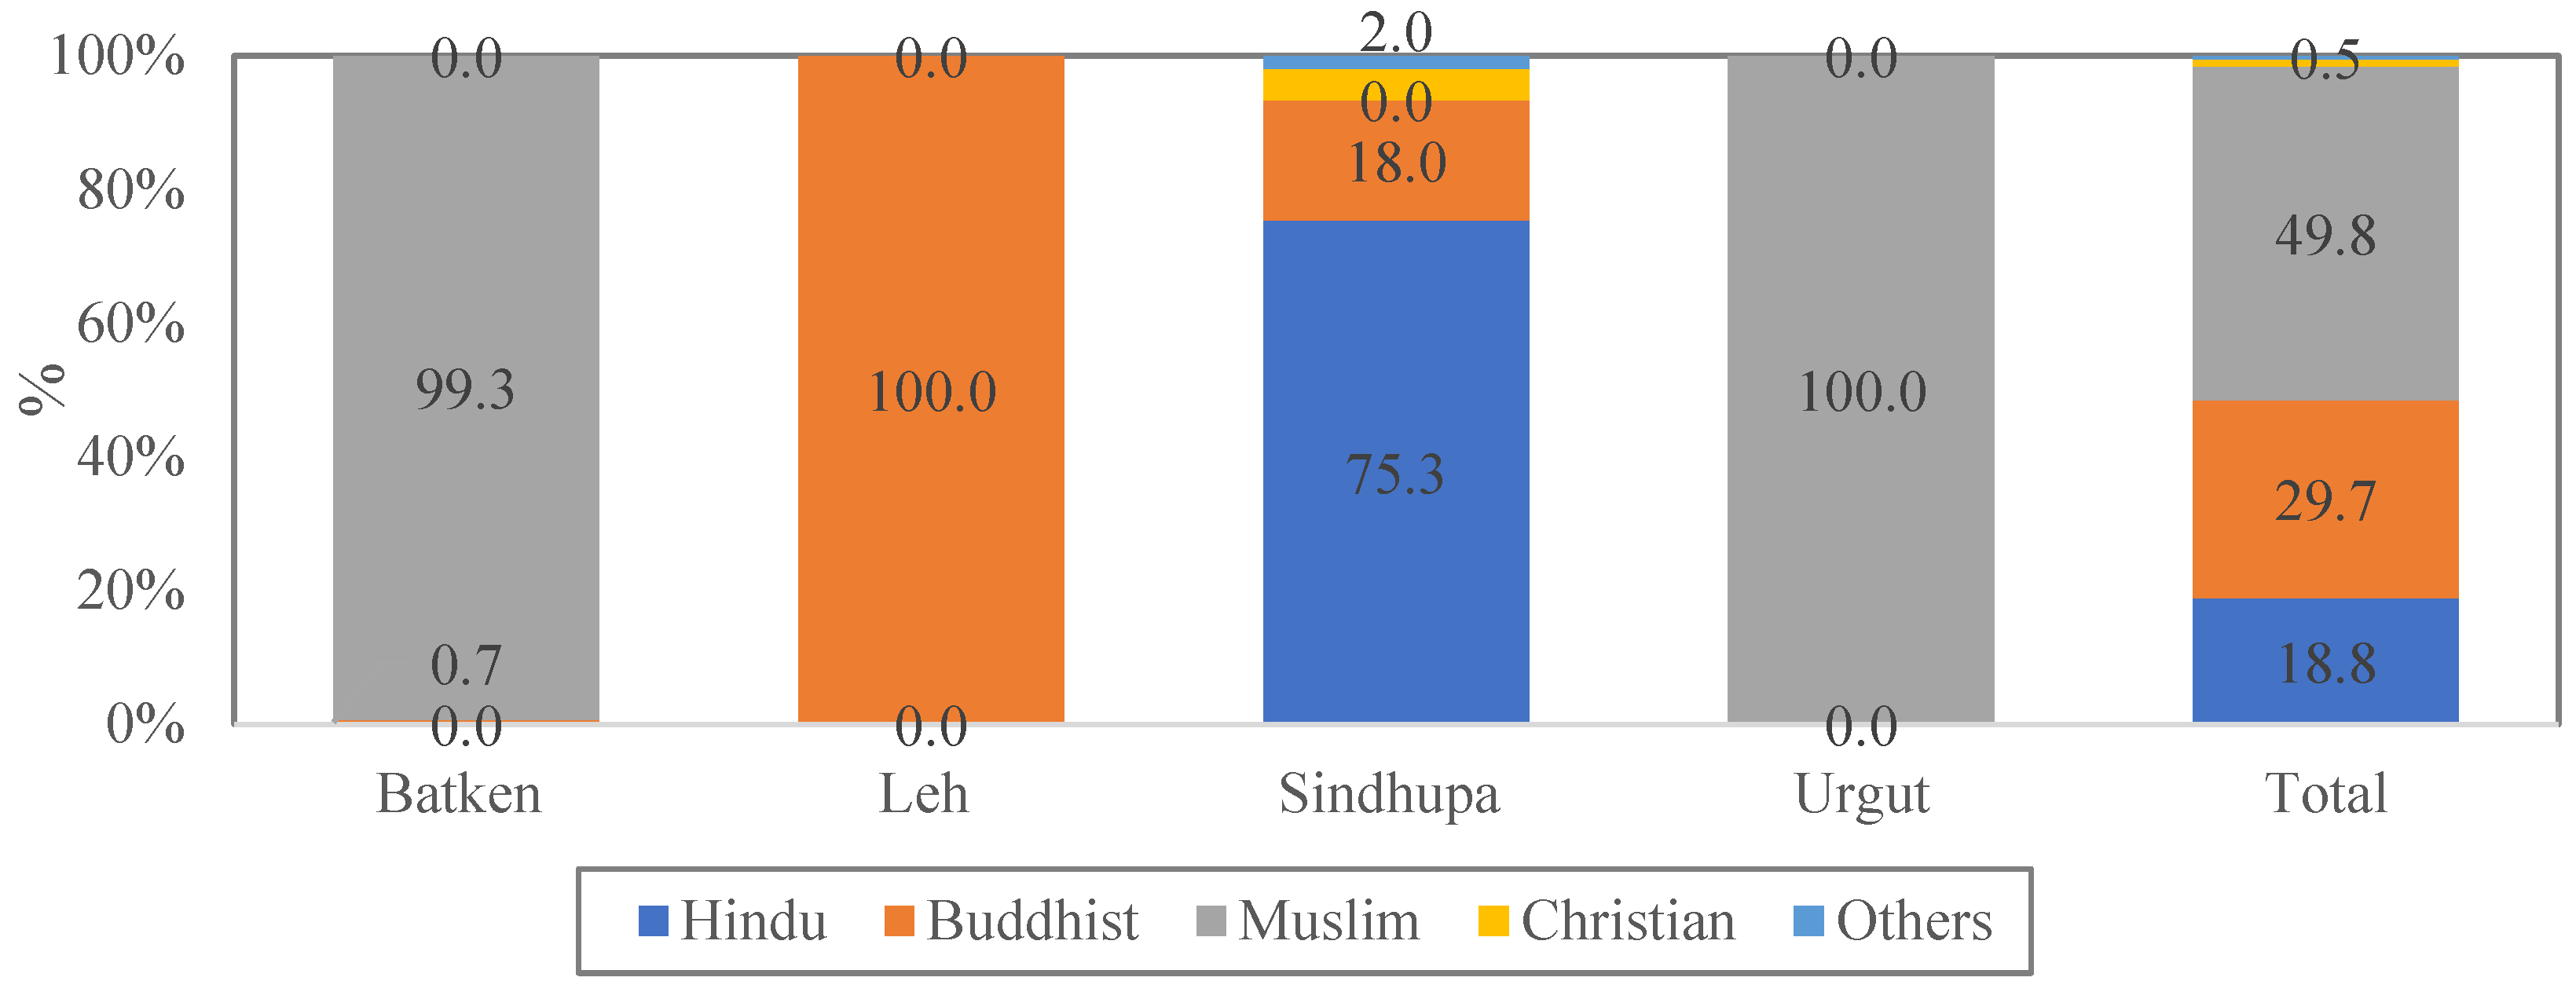
The religious composition of the sample, shown in
Figure 4, reflects strong regional clustering and considerable cultural differentiation across the study areas. At the aggregate level, the sample is composed mainly of Muslim (49.8%), Buddhist (29.7%), and Hindu (18.8%) households, with only a small share belonging to other faith groups. This distribution largely mirrors the cultural and historical setting of each district. Batken and Urgut are almost entirely Muslim, while Leh is overwhelmingly Buddhist. Sindhupalchok, by contrast, is predominantly Hindu, with a sizeable Buddhist minority. These patterns matter because religion is not only a marker of identity but also a potential influence on livelihood practice, local institutions, and community organization. Religious affiliation has a possible influence on social networks, norms of reciprocity, and their reactions to environmental stresses. Current knowledge indicates that cultural arrangements and beliefs may affect adaptation decisions via traditional ecological knowledge, social bonding, and other types of collective action [
18,
59].
Figure 4.
Religious Composition (%). Note: In
Figure 4, each column represents one study area and the final column represents the total sample. Percentages refer to valid responses from surveyed households and should not be interpreted as the religious composition of the whole district population.
Figure 4.
Religious Composition (%). Note: In
Figure 4, each column represents one study area and the final column represents the total sample. Percentages refer to valid responses from surveyed households and should not be interpreted as the religious composition of the whole district population.
3.7.5. Household Size
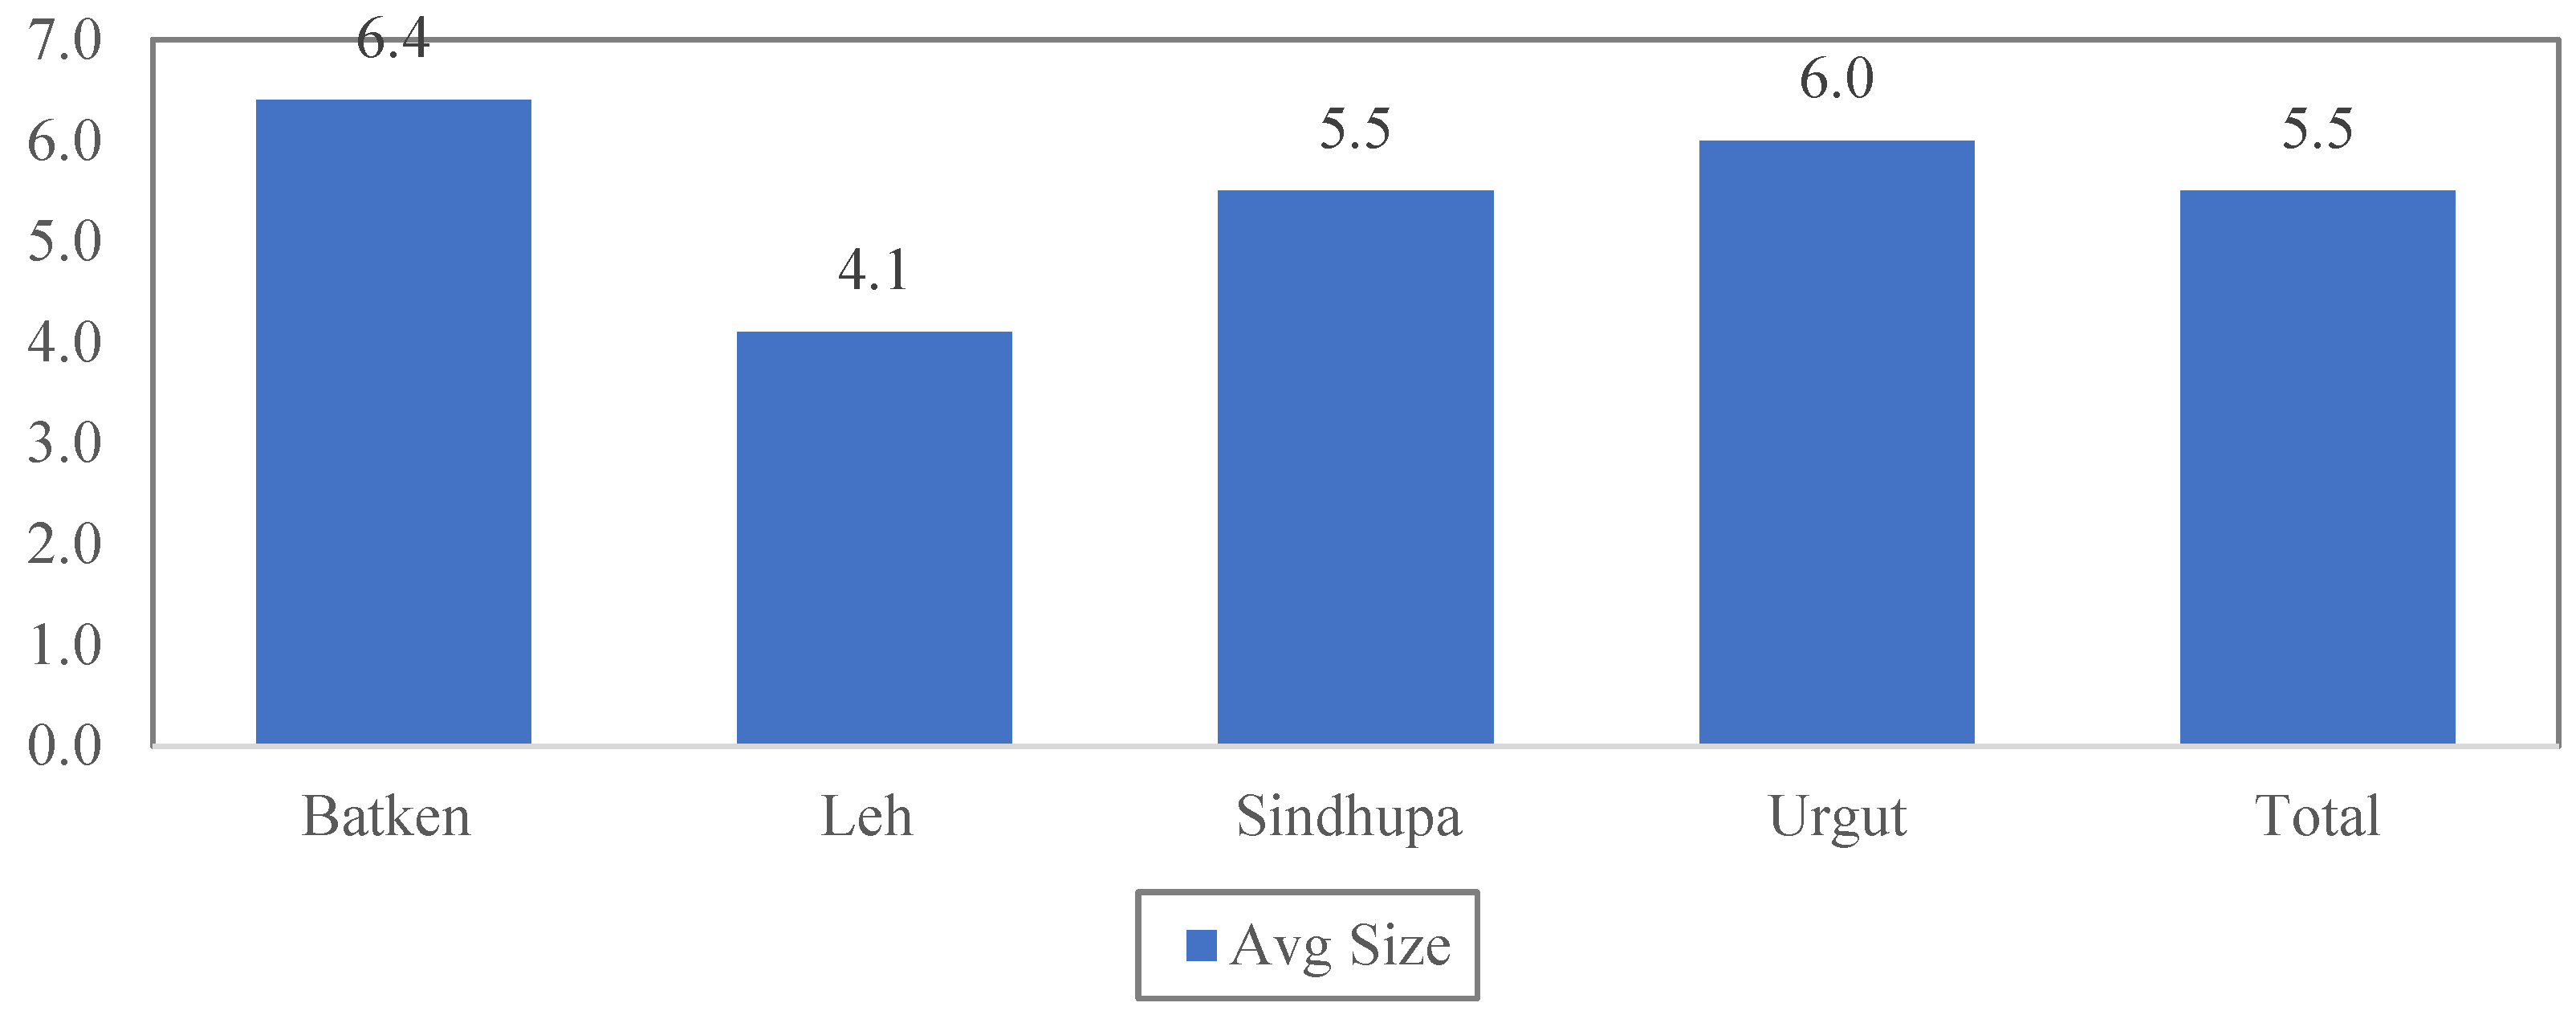
Household size is another important dimension of the sample profile because it affects both labour availability and consumption needs. As shown in
Figure 5, the average household size across the sample is 5.5 members, though the regional variation is notable. Household size in Batken and Urgut is relatively large, with an average of 6.4 and 6.0 members, respectively. Sindhupalchok lies close to the overall mean, while Leh has the smallest households, averaging 4.1 members.
There are implications for vulnerability in these differences. The larger family size may have a larger labour force, provide more opportunities to share activities and resources, but also may increase the dependency and consumption pressures. Smaller households may experience lower demand pressure, yet they may also be more constrained in labour-intensive activities, particularly where ageing is more pronounced. In this sense, the relationship between household size and vulnerability is not linear. Its importance depends on the interplay between household size and age structure, income and livelihood strategy.
The sample profile shows that livelihood vulnerability in mountain areas is rooted in socio-economic and demographic conditions as well as environmental exposure. Among surveyed households, Leh and Sindhupalchok show several features associated with greater vulnerability, including ageing, lower economic capacity, water and food insecurity, and household structures that may limit adaptive flexibility. Batken and Urgut show some advantages in income, labour availability, and market connection, but they also face structural pressures linked to resource dependence, irrigation, financial access, and climate stress. This supports the view that livelihood vulnerability is associated with the interaction of hazard exposure with household resources, institutions, and capacity to respond, adapt, and recover [
40,
41].
4. Results
This section presents the comparative results for livelihood vulnerability across the four mountain regions: Batken (Kyrgyzstan), Leh (India), Sindhupalchok (Nepal), and Urgut (Uzbekistan). Drawing on the 13 vulnerability components and three composite measures, namely the Livelihood Vulnerability Index (LVI), the LVI-IPCC, and the Livelihood Equity/Endowment Index (LEI), the results show that vulnerability is unevenly distributed across regions. More importantly, the pattern of vulnerability is related not only to environmental exposure, but also to socio-economic conditions, institutional access, and the unequal distribution of livelihood assets. This is consistent with the wider literature, which treats vulnerability as a multidimensional and socially differentiated process rather than a simple outcome of climatic stress alone [
40,
60]. In the following interpretation, qualitative evidence is used explicitly to confirm, qualify, or explain the LVI, LVI-IPCC, and LEI pattern rather than being treated as a separate descriptive addition.
4.1. Livelihood Vulnerability Index (LVI)
The overall LVI scores reveal substantial regional variation. Leh records the highest vulnerability (0.45), followed by Sindhupalchok (0.38) and Urgut (0.35), while Batken records the lowest score (0.28). This pattern indicates that structural factors are associated with livelihood vulnerability in mountain areas alongside climatic exposure. In particular, weak infrastructure, limited institutional support, financial exclusion, and dependence on natural resources appear to be key contributors to vulnerability. In other mountain and rural settings, adaptive capacity is a key determinant of vulnerability outcomes [
39,
58]. The socio-demographic component shows significant regional disparities in dependency, poverty and education (
Table 1). There is a significant difference in vulnerability, with the highest vulnerability recorded in Sindhupalchok (0.36) and Leh (0.34) and much lower vulnerability recorded in Batken (0.10) and Urgut (0.08). Among surveyed households, 58.7% in Sindhupalchok are below the poverty line, and 50.7% of the household heads in Leh have no formal education, and 37.3% of the households are living below the poverty line. The patterns highlight the role of demographic composition and human capital in influencing adaptive capacity, especially in fragile environments where the lack of human capital (low education and poverty) and labour constraints limit access to opportunities and services [
61].
The social networks component shows high vulnerability in all four areas, ranging from 0.45 in Batken to 0.55 in Urgut (
Table 2). This means that the institutional integration is low and collective support is low. In the entire study area, 87.7% of the households do not belong to any social organization, and 90.5% of the households indicated that there was no NGO affiliation. The ratio of receiving to giving support is greater than 1 in all districts, indicating that households depend more on external support than on reciprocal community networks. These findings highlight weak social capital, with implications for resilience because social networks and institutional linkages help households access information, resources, and collective action during crises [
45].
Financial vulnerability is especially pronounced in Urgut (0.68) and Leh (0.59) (
Table 3). In this survey, ‘no access to formal financial services’ refers to households reporting no direct, usable access to a bank, cooperative, microfinance provider, or other formal financial institution during the survey reference period. The 100% values for Leh and Urgut should therefore be interpreted as sample-specific measures of practical or local access, not as evidence that formal financial institutions are absent from the wider district or region. These constraints are associated with weaker capacity to smooth consumption, recover from shocks, and invest in adaptation. These findings are consistent with the literature identifying financial capital as a key determinant of resilience and adaptive capacity [
58].
Infrastructure shows one of the clearest regional contrasts (
Table 4). Leh records the highest infrastructure vulnerability (0.36), compared with very low values in Batken (0.02) and Urgut (0.05). The finding that 100% of surveyed households in Leh reported no access to a production centre refers to the absence of a directly accessible local facility or service point for storage, processing, aggregation, marketing, or other production-related support in the sampled settlements. It should be read as a sample-specific indicator of local infrastructural isolation, not as a statement about access across the whole district. In remote mountain settings, such deficits may weaken market access, communication, service delivery, mobility, and response capacity [
62].
Housing conditions further differentiate vulnerability across regions (
Table 5). Sindhupalchok records the highest housing vulnerability (0.64), followed by Leh (0.50), Batken (0.29), and Urgut (0.15). In Sindhupalchok, 39.3% of households live in non-concrete houses and 88.7% report climate-related housing damage. In Leh, the 100% value refers to surveyed households reporting some form of climate-related housing damage or stress during the survey reference period, including damage linked to floods, heavy precipitation, snowmelt, drainage problems, or temperature-related deterioration. It should not be read as evidence of house destruction or as a district-wide estimate. These results reinforce the importance of housing quality as a core dimension of sensitivity, especially in areas prone to disasters and climate extremes [
63].
Health vulnerability is highest in Leh (0.40), followed by Sindhupalchok (0.23) (
Table 6). In Leh, 48.0% of households reported a communicable disease, and all surveyed households reported exposure to malaria- or mosquito/vector-related health risks during the survey reference period, while in Sindhupalchok 49.3% of households reported work or school disruption due to illness. The malaria-related variables are not clinical malaria diagnoses, travel-history measures, or evidence of district-wide disease prevalence. They record self-reported household exposure or perceived seasonal risk related to mosquito/vector-borne health concerns in the surveyed settlements. These findings should therefore be read as household-level health-risk indicators that are associated with livelihood sensitivity in climate-sensitive settings [
64].
The knowledge and skills component show an uneven pattern (
Table 7). Urgut records the highest vulnerability (0.54), followed by Sindhupalchok (0.33), while Batken (0.16) and especially Leh (0.12) record lower values. The high score in Urgut reflects the fact that 96.0% of households report no climate-related training and no vocational training within the household. This suggests that limited knowledge and skill formation may constrain adaptive capacity. More broadly, the findings underline that training is most useful when it is relevant, accessible, and translated into practical adaptation [
43].
Food security remains a significant source of vulnerability, particularly in Leh (0.49) and Sindhupalchok (0.39) (
Table 8). In Leh, all households depend on family farming for food and 46.7% report nutritional deficiency. Sindhupalchok shows the highest number of food-insufficient months and the largest share of households without sufficient food throughout the year (60.0%). These results indicate strong sensitivity of food systems to climatic and livelihood stress, especially in mountain and rain-fed contexts where agriculture remains central to household subsistence [
65].
Livelihood strategies also differ substantially across regions (
Table 9). Vulnerability is highest in Urgut (0.60) and Sindhupalchok (0.50), reflecting limited diversification, weak savings behaviour, and continued dependence on a narrow range of activities. Batken records the lowest livelihood vulnerability (0.23), indicating relatively greater diversification. These findings support the wider rural livelihoods literature, which sees diversification as an important pathway associated with lower risk and improved resilience, particularly in climate-sensitive regions [
66].
Forest-energy dependence is another major contributor to vulnerability, particularly in Leh (0.71) and Batken (0.55) (
Table 10). In Leh, 94.0% of households rely on firewood for cooking, while in Sindhupalchok, households spend the most time collecting fuelwood. Heavy dependence on biomass energy reflects both energy poverty and ecological stress, and is associated with increased labour burdens, forest pressure, and longer-term sustainability challenges [
2].
Natural disaster exposure appears relatively similar across regions in index terms, with scores around 0.20 to 0.21 (
Table 11), yet the underlying indicators show significant variation. Sindhupalchok records the highest number of shocks (4.82), floods (3.24), and epidemics, while Leh also reports substantial exposure. Batken and Urgut record fewer direct shocks, but this does not necessarily correspond to lower vulnerability. This distinction is important because exposure alone does not explain outcomes; the ability to cope and recover remains equally important.
Water security emerges as a critical area of concern, especially in Leh (0.59) and Urgut (0.55) (
Table 12). In Leh, all households depend on natural water sources and 68.7% report inconsistent daily access. In Urgut, 92.0% rely on natural water sources and 86.7% report inconsistent access. These findings show that water insecurity is a major dimension of livelihood vulnerability in mountain settings, particularly where climate-induced changes in hydrology are already affecting access and reliability [
34].
Climate variability records some of the highest component scores across all regions and stands out as a major correlate of vulnerability (
Table 13). Leh records the highest value (0.71), followed by Sindhupalchok (0.55) and Batken (0.52). Across all districts, reports of rising temperatures are nearly universal. At the same time, many households also report changes in rainfall and crop damage linked to unusual weather. These results are consistent with evidence that mountain communities are increasingly exposed to climate instability through changing temperatures, fluctuating rainfall, and climate-related damage to agriculture and natural resources [
5,
31].
The component-wise averages show that overall LVI vulnerability (0.37) is associated most strongly with climate variability (0.55), forest-energy dependence (0.52), financial conditions (0.51), social networks (0.48), and water security (0.47) (
Table 14). These comparatively high component scores suggest that the vulneraiblity of mountain regions is linked to both environmental stressors and structural limitations, including financial marginalization, inadequate institutional linkages, and dependence on natural resources. Infrastructure (0.13) and socio-demographic variables (0.22) have smaller average scores at the overall level, but they remain important in specific regional contexts. Housing (0.40), livelihood strategies (0.41), and food security (0.32) occupy an intermediate position because they connect environmental stress with everyday livelihood outcomes. The relatively low variation in disaster exposure scores (0.21) further suggests that observed differences in vulnerability are associated less with the frequency of shocks alone and more with households’ response and adaptation capacity.
These LVI results suggest that livelihood vulnerability in mountain regions is associated with the interaction of climatic stress with structural inequalities and uneven access to assets, services, and institutions. The focus group discussions also support this interpretation, and linked higher vulnerability to water unreliability, housing damage, floods, landslides, and agricultural disruption, while accounts from Batken and Urgut emphasized drought, irrigation stress, migration, and livelihood adjustment. Similarly, the additional qualitative evidence helps explain and contextualize the LVI patterns observed across the four mountain regions. In particular, the focus group discussions in Leh and Sindhupalchok, respondents repeatedly associated vulnerability with less predictable water availability, growing unreliability of traditional water sources, agricultural uncertainty, and the rising costs of adaptation. Respondents from Leh described reduced snowfall, drying springs, and uncertainty in irrigation timing, while respondents from Sindhupalchok described recurrent floods, landslides, and damage to local infrastructure and agricultural land. In Batken and Urgut, qualitative information pointed more to gradual drought, declining water tables, pressure on water-dependent livelihoods, out-migration, and shifts toward non-farm activities. This qualitative information supports the interpretation that higher LVI scores in Leh and Sindhupalchok are associated not only with climatic exposure but also with livelihood sensitivity and institutional constraints.
4.2. Livelihood Vulnerability Index (LVI)-IPCC
The LVI-IPCC provides a more process-oriented understanding of vulnerability by explicitly incorporating exposure, sensitivity, and adaptive capacity. At the aggregate level, the overall LVI-IPCC value is low and close to zero (0.02), indicating moderate vulnerability across the study regions once the interaction between these dimensions is taken into account (
Table 15). However, there are significant variations across the regions. In Batken and Leh, the values are positive (0.05), while Sindhupalchok has a smaller positive value (0.01). Urgut, in contrast, has a negative value (−0.03), indicating relatively greater resilience. The shift in ranking relative to the LVI is important because it shows how adaptive capacity may be associated with the lower net effects of exposure and sensitivity, as emphasized in the IPCC framework and related empirical work [
40].
Exposure remains moderately high across all regions, with an overall average of 0.38 (
Table 15). Leh has the highest exposure value (0.46), followed by Sindhupalchok (0.38), Batken (0.37), and Urgut (0.32). These values correspond to climate variability and natural-disaster indicators. Exposure alone, however, does not explain the overall LVI-IPCC scores; sensitivity and adaptive capacity are associated with how exposure is reflected in livelihood risk. Sensitivity is highest in Leh (0.54) and Sindhupalchok (0.41), which is consistent with the food, health, water, housing, and forest-energy pressures reported in the LVI components. The qualitative reports help explain these patterns: respondents in Leh and Sindhupalchok described water unreliability, damage to infrastructure and housing, and disruption to agriculture, while Batken and Urgut accounts emphasized drought, irrigation stress, migration, and livelihood adjustment.
The LVI-IPCC results clarify these regional patterns. In Leh, high exposure and high sensitivity correspond to a positive score, indicating higher vulnerability. In Sindhupalchok, sensitivity and institutional constraints correspond with adaptive capacity, with the result being a score close to zero. In Urgut, stronger adaptive capacity corresponds to a negative score, suggesting relative resilience despite continuing structural constraints. These results suggest that vulnerability is not only linked to climate stress; it is also associated with the interaction of environmental risk, socio-economic conditions, institutional support, and household assets.
The qualitative results also provide further insight into the LVI-IPCC findings. Communities with higher exposure and sensitivity often described climate impacts through disruptions to water systems, crop and livestock production, and local infrastructure. Focus group discussions and case studies suggested that households with stronger social networks, diversified livelihoods, remittance income, or access to public support were better positioned to cope with climatic shocks. By contrast, households with limited access to institutional support, credit, extension services, or dependable infrastructure described greater difficulty in recovering from climate-related disruptions. These observations support the interpretation that adaptive capacity is a central correlate of vulnerability outcomes and helps explain why areas with broadly similar climate exposure may experience different livelihood effects.
4.3. Livelihood Equity/Endowment Index (LEI)
The LEI adds a structural perspective by focusing on inequalities in the distribution of livelihood assets. The overall Livelihood Equity/Endowment Index (LEI) score is 0.38, indicating a moderate level of structural vulnerability across the four regions (
Table 16). Regional differences are substantial. Leh has the highest LEI score (0.43), followed by Urgut (0.41) and Sindhupalchok (0.39), while Batken has the lowest score (0.30). These differences suggest that vulnerability is not limited to immediate climatic exposure; it is also associated with persistent inequalities in access to livelihood resources. This interpretation aligns with the sustainable livelihoods’ framework, which highlights the role of assets and institutions in enabling resilience and adaptation.
At the aggregate level, social capital (0.48), financial capital (0.46), and natural capital (0.44) show the strongest association with structural vulnerability, while human capital (0.27) and physical capital (0.26) contribute somewhat less. Social-capital scores are consistently high across regions, ranging from 0.45 in Batken to 0.55 in Urgut. This pattern indicates weak institutional engagement, low membership in organisations, and limited collective interaction. As the literature suggests, such gaps may make it harder for households to access information, mutual support, and collective action during periods of stress.
Financial capital is another key dimension of structural vulnerability. The financial-capital score is highest in Urgut (0.64), followed by Leh (0.45), Sindhupalchok (0.44), and Batken (0.31). These values are consistent with the survey findings on limited access to credit and formal financial services. Limited financial access appears to restrict the ability of households to invest in adaptation measures and recover from shocks. Financial capital is therefore closely associated with livelihood security and resilience [
58].
Natural capital contribution is 0.44, with the highest value in Leh (0.56), followed by Batken (0.41), Urgut (0.40), and Sindhupalchok (0.39). These scores indicate continued dependence on land, water, and other natural resources. In rural mountain economies, natural capital is a necessary livelihood asset, but high dependence on climate-sensitive resources may also increase exposure to environmental stress. Human capital shows a more moderate relationship with structural vulnerability, with scores of 0.36 in Urgut, 0.28 in Sindhupalchok, 0.26 in Leh, and 0.18 in Batken, suggesting that education, health, and skill differences are relevant to productivity and adaptive capacity.
Physical capital also varies substantially across regions. Leh (0.43) and Sindhupalchok (0.37) have higher physical-capital vulnerability scores, reflecting weaker infrastructure and housing conditions in the sampled settlements. Batken (0.15) and Urgut (0.10) record lower scores. These findings highlight the importance of physical infrastructure and housing quality for resilience, especially in remote and environmentally fragile mountain contexts.
The LEI results should be read as a complement to the LVI and LVI-IPCC rather than as a separate exercise. While the LVI identifies present vulnerability and the LVI-IPCC separates exposure, sensitivity, and adaptive capacity, the LEI shows the asset base that makes adaptation easier or harder over the longer term. The qualitative evidence helps interpret these LEI patterns. In Leh and Urgut, respondents’ accounts of finance, infrastructure, water access, and institutional support correspond to the higher LEI values, while Batken’s lower LEI score is consistent with a relatively more balanced asset profile but continuing adaptive-capacity constraints. The combined LVI-IPCC and LEI results show why the indices should be read together. Batken’s positive LVI-IPCC score is associated mainly with limited adaptive capacity, even though its aggregate LVI and LEI scores are lower. Urgut’s negative LVI-IPCC score corresponds to stronger adaptive capacity, but its higher LEI score points to continuing structural constraints in financial and social capital. These patterns suggest that short-term coping capacity and longer-term livelihood endowments do not necessarily move together. Policy measures, therefore, need to address both climate-related risks and the structural inequalities associated with households’ ability to respond, adapt, and recover.
Qualitative evidence also supports the LEI results. Households reporting better livelihood outcomes frequently referred to diversified livelihood strategies, community engagement, remittance support, local water-management institutions, and productive assets. Conversely, water insecurity, reduced agricultural productivity, limited access to formal finance, weak compensation mechanisms, and low institutional support were repeatedly associated with weaker livelihood outcomes. These results suggest that differences in livelihood endowments across the study areas are linked not only to environmental conditions, but also to unequal access to social, human, financial, physical, and natural capital.
4.4. Case Study Evidence: Qualitative Validation of Vulnerability Patterns
The case studies are used to connect the above results with local explanations of vulnerability. Each case highlights a different pattern revealed by the LVI and LVI-IPCC: high exposure and sensitivity in Leh, high sensitivity and institutional constraint in Sindhupalchok, lower aggregate LVI but weak adaptive capacity in Batken, and relatively stronger adaptive capacity but persistent structural constraints in Urgut. The qualitative evidence, therefore, deepens the interpretation of the numerical scores rather than serving as a separate descriptive section.
Leh has the highest LVI score (0.45), which is associated with its high exposure and water insecurity, along with its high livelihood sensitivity. Saspol, Skurbuchan, and Khaltsi show clear intra-regional variation. Khaltsi is very vulnerable to climate change, which is reflected in heat stress, irregular snowfall, frequent flash floods (2010–2024), water scarcity, declining crop productivity, and increased use of non-farm livelihoods. Local innovations, like the use of artificial glaciers, have not fully strengthened adaptive capacity, as it appears to be constrained by low institutional and financial support. Saspol is relatively low-exposed, has high adaptive capacity, has a traditional water system (zings) and crop diversification, but has risks associated with crop diseases and technological access. High exposure and moderate adaptation, floods, erosion and scarcity of land are leading to migration and livelihood diversification in Skurbuchan. This case corroborates the LVI and LVI-IPCC conclusions that high exposure and high sensitivity correspond to high vulnerability, especially where adaptive capacity remains limited.
Sindhupalchok’s relatively high LVI (0.38) and moderate LVI-IPCC score highlight the high livelihood sensitivity and institutional weaknesses in the district. Community reports suggest that rainfall has decreased, monsoons have been delayed, and snowfall has declined in the communities; these reported changes are associated with recurrent landslides and floods such as the Melamchi landslide in 2021. Agriculture is very vulnerable, and productivity has declined, owing to climate unpredictability, pest infestation and erosion of soil. The disruption of trade and damage to infrastructure further exacerbate vulnerability. Migration and remittances are among the major coping strategies, but they also place additional burdens on women and modify household structures. While awareness of climate risks is high, adaptive capacity is low, response measures are mostly short-term, reactive, and poorly implemented, and institutions are weak. This corroborates the vulnerability results that indicate the weakness of institutional mechanisms and sensitivity, not exposure, are the key factors in the vulnerability of the residents of Sindhupalchok.
Batken has the lowest LVI (0.28), but has a positive LVI-IPCC score, indicating low adaptive capacity. The case study confirms that water scarcity is the main factor of vulnerability. Communities report increasing temperatures, reduced rainfall and snowfall; these reported changes are associated with unreliable irrigation and decreases in agricultural productivity. Crop and livestock livelihoods are sensitive, and households respond by diversifying their crops and reducing livestock numbers and herd sizes, and by small-scale diversification. Migration, especially among men, is an important coping mechanism, supported by remittances, but with gendered labour burden. While there is some resilience at the local level, through cooperation and traditional resource management, adaptive capacity is not evenly distributed and appears associated with poverty, infrastructure and institutional support. This case confirms the findings of the LVI-IPCC report on how lower vulnerability observed could be a proxy for underlying limitations in adaptive capacity.
Compared with the other study areas, Urgut has a moderate LVI (0.35) and a negative LVI-IPCC score (−0.03), which suggests relatively high adaptive capacity. The case study demonstrates that although exposure to the climate is still high, through reduced rainfall, rising temperatures, and water shortages, households have diversified livelihoods with increased involvement in trade, wage labour and migration. Farming and livestock activities continue to be strained by soil erosion, limited water supply and increasing cost of inputs. Migration is a key element of livelihoods, but it also places additional burdens on the lives of women and increases reliance on remittances. There are some adaptation measures (crop diversification, water storage, community-based water management), but they remain fragmented. Vulnerability is still constrained by structural factors, such as limited financial access and institutional support. The LVI-IPCC results indicate that the adaptive capacity of the system may be associated with lower vulnerability even in the context of structural inequalities, as shown in this case.
These case studies also confirm that climate exposure is widespread, while vulnerability is more closely associated with differences in sensitivity, adaptive capacity, and structural conditions. Leh and Sindhupalchok appear more vulnerable because high sensitivity is combined with institutional constraints. Batken’s results point to adaptive-capacity constraints, while Urgut’s results show relatively stronger adaptive responses alongside persistent inequalities. These qualitative insights strengthen the interpretation of the LVI, LVI-IPCC, and LEI results.
5. Discussion
The above results suggest that livelihood vulnerability in mountain regions is not explained by environmental exposure alone. It is associated with the interaction of climate stress, socio-economic disadvantage, institutional capacity, livelihood systems, and unequal access to assets. Across Batken, Leh, Sindhupalchok, and Urgut, the three indices point to a common message: adaptive capacity appears to mediate the relationship between exposure and livelihood vulnerability. This finding is consistent with the broader literature, which views climate vulnerability as socially differentiated and embedded in structures of inequality, governance, and livelihood opportunity rather than as a direct outcome of hazard exposure alone [
60]. The qualitative evidence also shows that higher vulnerability scores in Leh and Sindhupalchok are consistent with qualitative accounts of frequent water stress, shifting snowfall and rainfall patterns, disaster losses, and growing pressure on agricultural and household livelihoods. Similarly, the lower aggregate vulnerability in Batken and Urgut does not mean the absence of climate risk, but risks often appear gradually through drought, reduced groundwater availability, irrigation constraints, and livelihood transitions. The findings show how vulnerability is embedded in local social, economic, environmental, and institutional contexts.
The comparative evidence shows why a similar type of climate pressure is associated with different livelihood outcomes. Leh and Sindhupalchok are associated with more subsistence-oriented smallholder systems, land scarcity, water stress, and migration. Batken and Urgut are more strongly associated with post-Soviet land and irrigation arrangements, orchard or semi-commercial production, labour migration, and market linkages. These differences help explain why low reliance on home-produced food in Batken and Urgut does not necessarily indicate low vulnerability. In these settings, vulnerability is mediated by access to water, market dependence, credit, infrastructure, and institutional support. The comparison, therefore, strengthens the paper’s main contribution: climate vulnerability in mountain regions should be interpreted through both ecological exposure and the political economy of land, agriculture, finance, and governance.
A key finding is that areas facing similar mountain environments do not necessarily show similar vulnerability outcomes. Overall, LVI is highest in Leh, while Sindhupalchok also shows relatively high vulnerability across several components, though the associated factors differ. In Leh, vulnerability is most closely associated with climate variability, forest-energy dependence, water insecurity, food-system sensitivity, and financial constraints. In Sindhupalchok, socio-demographic disadvantage, housing fragility, disaster exposure, and limited livelihood diversification are more closely associated with the observed vulnerability pattern. This contrast highlights the heterogeneity of mountain vulnerability and suggests that similar environmental pressures may have different livelihood implications depending on exposure, sensitivity, asset distribution, service delivery, and institutional support. This interpretation is consistent with earlier LVI studies, which show that vulnerability in rural and mountain regions is strongly associated with socio-economic conditions and adaptive capacity, not climatic events alone [
39].
A similar pattern can be observed in Batken and Urgut. Batken has the lowest LVI, but a high LVI-IPCC score associated with its weak adaptation capacity. This means a lower observed vulnerability could mask deeper limitations in coping and recovery. Urgut, on the other hand, has a negative LVI-IPCC score, which means that it is more resilient because of its adaptive capacity, despite its relatively high LEI indicating structural weaknesses in its financial and social capital. These results indicate that adaptive capacity is related, but not the same as, structural endowments. Longer-term inequalities may persist in access to livelihood assets, despite short-term coping being relatively good in a region. This distinction is well known in the literature, in which adaptive capacity is defined as a process and a function of access to knowledge, institutions, and resources and structural endowments as more enduring inequalities in livelihood opportunity [
43]. Results also indicate that climate variability continues to be a major pressure in all regions, while its livelihood effects appear to be mediated by non-climatic conditions.
The Livelihood Vulnerability Index (LVI) provides the main measure of current vulnerability, but the regional differences extend beyond climatic exposure. Financial exclusion, weak social connections, water insecurity, and reliance on forest-based energy appear to be associated with more severe livelihood effects of climatic stress. This finding is consistent with the idea that climate change can act as a stress multiplier where income, infrastructure, institutions, and essential services are limited. The findings mirror broader development literature that places climate risk within the contexts of poverty, inequality, and rural transformation [
5,
41].
Financial vulnerability is also prominent. The importance of financial conditions in both the LVI and LEI reinforces the role of income, credit, and financial services in adaptive capacity. Leh and Urgut are particularly constrained in this regard. Financial resources are linked not only to the ability to withstand shocks, but also to the ability to invest in adaptation measures, diversify income sources, and improve living standards. These observations suggest a close connection between adaptation policy, rural finance, market access, and institutional support [
28,
58].
A similar pattern is evident for social capital. In all districts, low engagement with institutions, low involvement in social groups and limited NGO presence suggest fragile support networks. This observation suggests that vulnerability is associated with factors of both household constraints and collective and institutional fragility. Social capital is an important component of access to information, resources, and coordinated responses to adverse events. Persistent deficits in different regions show more widespread governance failures. Therefore, strengthening resilience within these settings would benefit from stronger institutional connections, local organizational structures and access to public support mechanisms. The results are consistent with previous research on the need for networks and engagement to increase adaptive capacity [
45].
The findings on water, food, health, housing, and energy show that sensitivity is experienced through everyday livelihood systems. Food security, water availability, healthcare, and energy access are especially important in Leh, while Sindhupalchok shows strong housing vulnerability and frequent disaster exposure. These patterns suggest that climate-related pressures are closely linked to continuing challenges in basic service provision. Vulnerability to climate change should therefore be studied in relation to the daily systems through which households secure food, water, health, shelter, and energy [
34].
Livelihood diversification also plays a role. Batken’s lower livelihood-strategy vulnerability suggests that diversification may help reduce exposure to livelihood risk, while the limited diversification and savings observed in Urgut and Sindhupalchok correspond to higher vulnerability scores. At the same time, diversification depends on infrastructure, education, finance, and markets; it is not simply a household choice [
66]. The LEI extends this interpretation by showing longer-term imbalances in access to human, natural, social, physical, and financial resources. Higher LEI scores in Leh and Urgut suggest persistent structural constraints even where some adaptive capacity exists, while Batken’s lower LEI score indicates a relatively more balanced asset base. These findings link vulnerability to the broader distribution of resources and opportunities, not to exposure alone.
These findings point to four region-specific policy directions. In Leh, priority should be given to water security, climate-resilient irrigation, improved access to formal finance, support for older and ageing households, and clean energy alternatives that reduce pressure on forest resources. In Sindhupalchok, investment should focus on disaster-resilient housing, slope and watershed management, healthcare access, livelihood diversification, and support for women in migration-affected households. In Batken, policy should address weak adaptive capacity through irrigation reliability, extension services, livestock and orchard resilience, border-area service delivery, and financial inclusion. In Urgut, where adaptive capacity is relatively stronger, but inequality persists, interventions should focus on equitable access to land, water, credit, vocational training, and market institutions. Across all regions, local knowledge should be combined with scientific climate information and delivered through institutions that households trust.
6. Conclusions and Policy Recommendations
This study shows that vulnerability is not explained by climatic exposure alone. The central finding is that adaptive capacity mediates the relationship between exposure and livelihood outcomes. Where households have better access to finance, infrastructure, knowledge, institutions, and diversified livelihoods, climate exposure is less likely to translate into severe vulnerability. Where these capacities are weak, even moderate exposure may be associated with serious livelihood risk.
The regional comparison identifies distinct vulnerability pathways. Leh and Sindhupalchok are highly vulnerable, but for different reasons. Leh is particularly affected by water insecurity, energy dependence, food-system sensitivity, financial exclusion, and an ageing household profile. Sindhupalchok is more strongly associated with socio-demographic disadvantage, weak housing conditions, disaster exposure, and limited institutional capacity. Batken has the lowest LVI score, but the LVI-IPCC reveals weak adaptive capacity, especially around water, infrastructure, and institutional support. Urgut shows relatively stronger adaptive capacity, yet its higher LEI value points to persistent structural constraints in financial, social, and livelihood assets. These differences show the value of using more than one index, since a single aggregate measure can hide the interaction between exposure, sensitivity, adaptive capacity, and structural endowments.
The LEI results indicate that vulnerability is also linked to structural inequalities in access to human, natural, social, physical, and financial capital. Leh and Urgut show longer-term deficits in financial and physical capital, which may limit resilience over time. Batken’s comparatively more balanced asset base is not automatically associated with stronger adaptive potential. This underscores that short-term coping capacity and long-term structural resilience do not necessarily develop together, and that adaptation policy must address development inequalities as well as climate risks.
The results also highlight the role of natural-resource dependence in vulnerability. Dependence on natural water sources and forest-based energy is associated with higher sensitivity, especially under fluctuating climatic conditions. Together with widespread perceptions of rising temperatures and altered rainfall patterns, these findings suggest growing pressure on mountain ecosystems and livelihoods [
5,
34]. Moreover, weak social networks and limited institutional participation across the study areas suggest that low social capital remains a continuing constraint on access to information, support networks, and mutual coping strategies [
45].
The policy implication is clear: adaptation in mountain regions must be place-specific and asset-based. General climate-risk programmes will be insufficient if they do not address the livelihood systems and institutional histories of each region. Reducing vulnerability requires investment in water security, disaster-resilient housing, healthcare, clean energy, rural finance, training, market access, and local institutions. It also calls for attention to social differentiation, especially ageing, gendered labour burdens, migration, and unequal access to land, credit, and services. Climate adaptation should therefore be integrated into broader development policy, with resilience treated as a social, economic, and institutional goal as well as an environmental one.
One of the main strengths of the study is that it combines quantitatively derived vulnerability indices with qualitative field evidence. The indices identify comparative patterns across sites, while the focus group discussions, key informant interviews, and case studies illuminate the pathways through which climate stress is associated with livelihoods, gender relations, and adaptive capacity. The convergence between quantitative and qualitative findings supports confidence in the descriptive results and underscores the value of mixed methods for examining climate vulnerability in mountain settings.
The study contributes to climate vulnerability research by showing how an index-based approach can be supported through qualitative evidence and comparative interpretation. Its novelty lies not in proposing a new index, but in applying LVI, LVI-IPCC, and LEI together across Himalayan and Central Asian Mountain contexts and showing how vulnerability is associated with adaptive capacity, structural endowments, and institutional context. Future research can build on this work through longitudinal data, household panel surveys, formal indicator-weight sensitivity analysis, and deeper testing of causal mechanisms behind adaptation outcomes.