


Abstract
The transformation of the labour market is a significant challenge for sustainable regional development, especially in countries with pronounced socioeconomic inequalities. This study aims to analyse the spatial disparities in the Bulgarian labour market at the regional level (NUTS 3, districts) for the period of 2021–2024, combining descriptive spatial analysis, multidimensional cluster analysis, and Local Indicator of Spatial Association (Local Moran’s I-LISA). The analysis is based on three key indicators: employment rates, unemployment rates, and the relative wage index, calculated against the national average. The results of the descriptive analysis reveal clear spatial imbalances, with low labour income persisting in many districts despite relatively high employment rates. The cluster analysis identifies four types of labour markets with specific socioeconomic profiles, confirming that the spatial disparities are a result of specific combinations of indicators and economic specialisation at the regional level. The LISA analysis further reveals the existence of spatially stable cores of vulnerability and local spatial anomalies that highlight the importance of regional context and spatial proximity. The results indicate the need for a spatially differentiated approach in regional policies in line with the objectives of SDG8, SDG10, the European Pillar of Social Rights, and the EU’s cohesion policy.
1. Introduction
Labour markets play a key role in sustainable regional development, as they shape income generation, employment, and socioeconomic cohesion across territories. In a broader sense, the growing interest in investigating spatial disparities in labour markets is closely connected to the framework of the United Nations Sustainable Development Goals [1]. In this regard, the study of spatial imbalances in labour markets strongly aligns with (i) Sustainable Development Goal 8 (Decent Work and Economic Growth), focusing on productive employment and an inclusive economy, and (ii) Sustainable Development Goal 10 (Reduced Inequalities), which highlights the reduction in income disparities and enhances social inclusion, requiring integrated and territorially sensitive policies [2,3].
Existing empirical studies highlight that observed inequalities in labour markets are strongly influenced by the spatial context in which labour markets operate [4,5,6]. Regional labour markets are influenced by the political and institutional environments, economic structure and development paths, demographic dynamics, investment activity, and technological innovation, which together determine employment opportunities, workforce mobility, and income levels [7,8,9]. As a rule, the urban metropolitan regions provide better job opportunities, higher employment and incomes, but often at the expense of high inequality [10]. In contrast, the regions characterised by lower productivity, a high concentration of low-paid economic activities, and limited human capital often demonstrate higher levels of poverty among the employed, even when employment rates are relatively high [11,12,13]. This raises the question of the role of regional labour disparities as a persistent factor in the reproduction of social and economic vulnerability.
Recent analysis by the European Commission emphasises the need for more in-depth research on the spatial imbalances within the context of national and regional labour markets and the related phenomenon of the working poor [14,15]. Although many poorer regions experience growth in the European Union and the labour market has recovered from COVID-19 consequences, the regional disparities have widened in certain regions, and poverty shows clear spatial concentration [16]. As the difference in labour markets across the European states largely reflects the national specifics, it is important to investigate them within a particular national context. Therefore, Bulgaria represents a relevant case for such research due to the post-socialist economic transformation, which has been accompanied by substantial changes in the labour market and spatial development.
In recent decades, Bulgaria has experienced significant changes in the regional labour markets due to the demographic decline and the dynamics of the political and socioeconomic environment [17]. These transformations manifest themselves in both quantitative and qualitative imbalances between labour demand and supply as well as mismatches in workforce qualifications at national, regional, and local levels [18,19,20]. Consequently, the problem of spatial labour imbalances has attracted increasing academic and public attention in Bulgaria as well.
In the national scientific literature, the spatial disparities in the labour force are explored from various perspectives. Some studies focus on the interaction of macroeconomic dynamics, deepening spatial disparities in living standards, labour incomes, taxation systems, and digital development [20,21]. Other research addresses the labour force challenges and problems in peripheral regions and districts in the country [22,23,24], regional disparities in employment and unemployment rates, as well as the impact of economic crisis on the labour market [25], and the relationships between spatial changes in employment and regional economic and demographic characteristics [26]. Additionally, regional disproportions in labour market fragmentation and efficiency are examined [27].
In recent scientific research, spatial analytical approaches have become increasingly important for understanding the complex nature of labour markets and the spatial dimensions of inequalities. The previous empirical studies applied cluster analysis as a valuable tool to explore the labour market from different viewpoints, including its structural features at local, national, and cross-country scales [28,29,30], labour market polarisation and geographical inequalities [31,32]; access to employment opportunities and the working poor [33], spatial imbalances of the labour market and social vulnerability [34], and structural differences and performance of labour markets in the light of the economic shocks, such as the COVID-19 pandemic [35,36].
At the same time, Local Indicators of Spatial Association (LISA) enable the identification of local clusters and spatial outliers in labour-related data [37,38]. These methods provide an assessment for each spatial unit (e.g., regions or districts) and allow investigation of the local spatial dependencies of the labour market characteristics, such as regional income disparities [39], and regional employment divergence and the influence of COVID-19 on labour markets [40]. The simultaneous application of these approaches ensures a valuable framework for a deeper understanding of the complex nature of the labour markets and spatial disparities.
Although the studies addressing labour market disparities are growing in number, most of the research remains focused on national-level indicators. The territorial imbalances of the labour market at the regional (NUTS 3) level need additional thorough investigation, applying a framework of different multivariate and spatial statistical methods.
The manuscript offers several principal contributions to the existing literature. First, it provides a comprehensive spatial analysis of labour-market disparities at the NUTS 3 district level in Bulgaria, a territorial scale that remains comparatively underexplored in the national and regional labour-market literature. Second, the study develops a cluster-based typology combining employment, unemployment, and income indicators in order to identify different territorial patterns of labour-market performance and socioeconomic vulnerability. Third, the paper integrates multivariate clustering and Local Indicators of Spatial Association (LISA), allowing simultaneous assessment of typological similarities and local spatial dependencies between districts. This combined methodological framework contributes to a better understanding of the spatial structure of labour-market inequalities and may be applied in other post-socialist and peripheral European contexts.
2. Methodology and Data
2.1. Study Area and Research Design
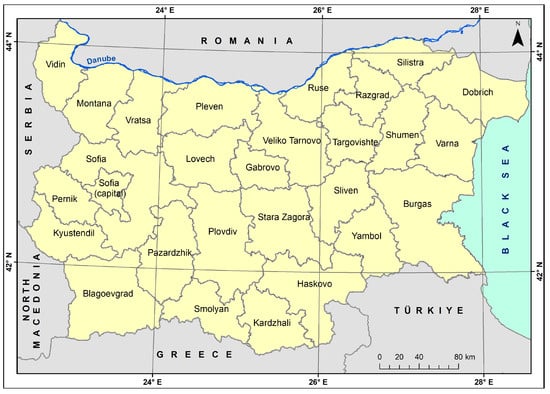
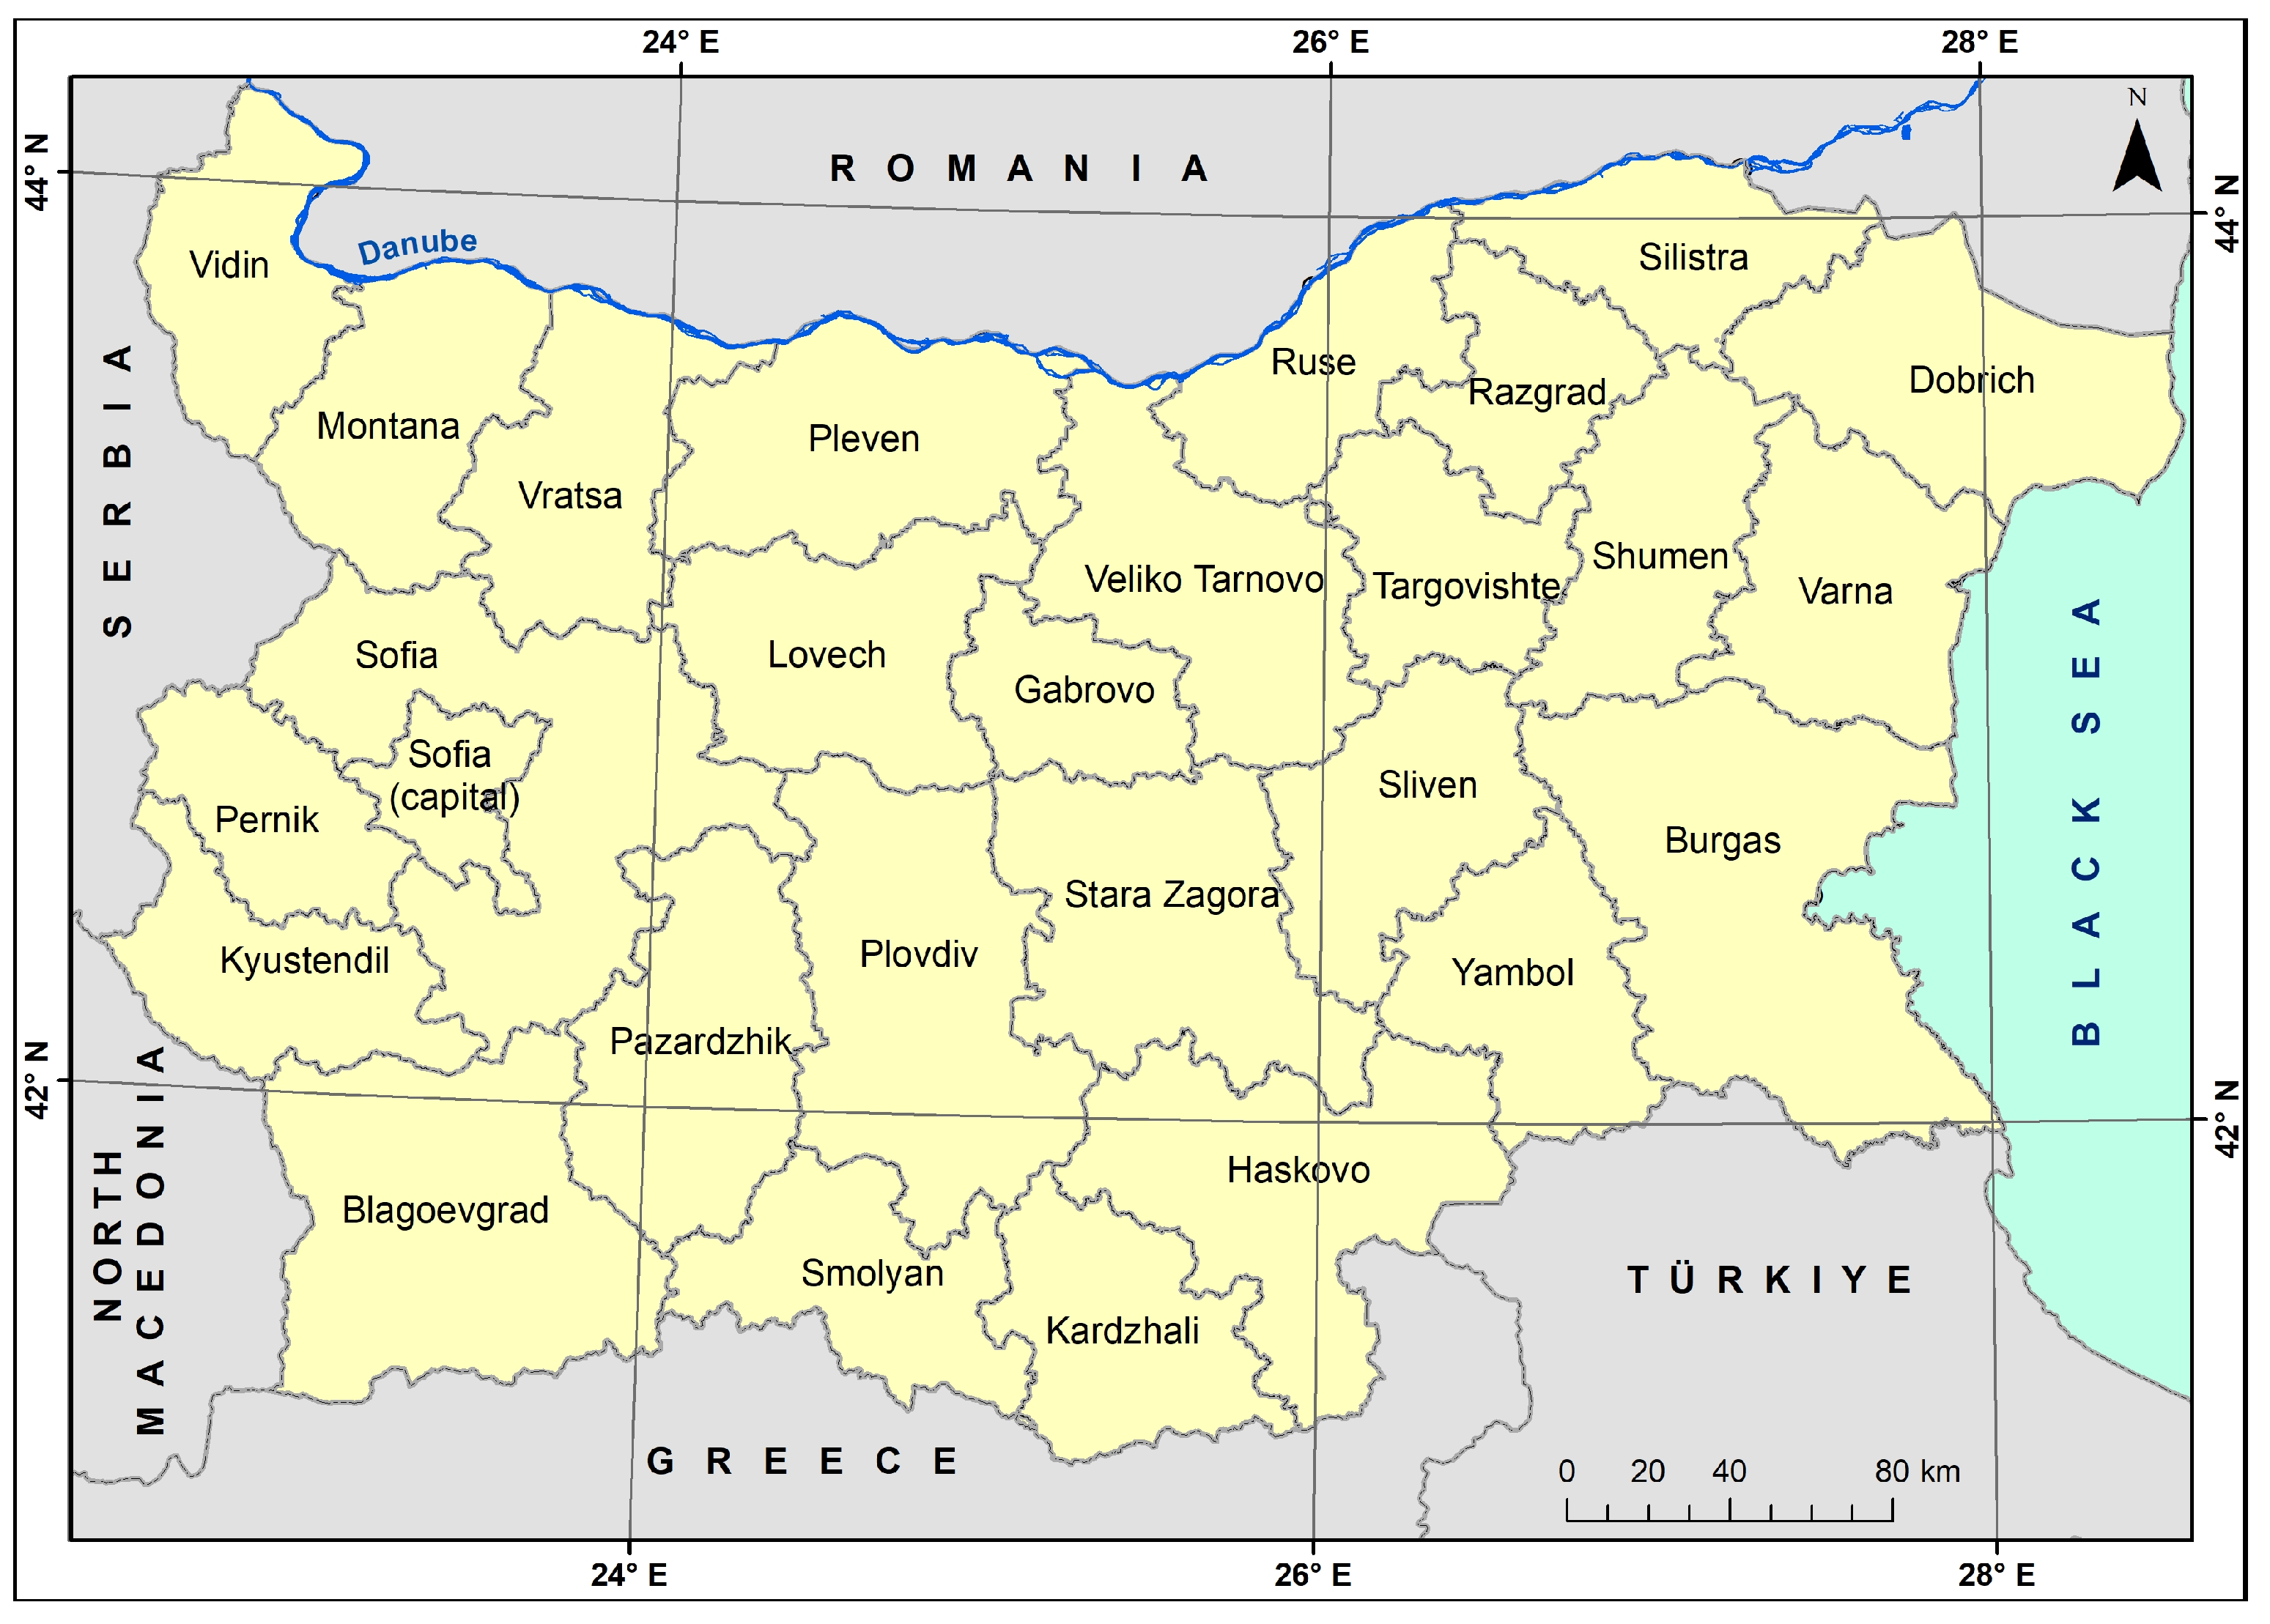
The Republic of Bulgaria is in Southeastern Europe on the Balkan Peninsula and was officially admitted to the European Union in 2007. According to the European NUTS system of administrative–territorial organisation and statistical classification, the country is structured into three hierarchical levels: NUTS 1 (Bulgaria), NUTS 2 (regions), and NUTS 3 (districts) [41]. Regarding the NUTS 3 level, Bulgaria is divided into 28 administrative districts (“oblasti”), which constitute the primary territorial units used in the current research (Figure 1).
Figure 1.
Administrative division of Bulgaria at NUTS 3 level (28 districts/“oblasti”).
The study examines spatial disparities in the labour market in Bulgaria among the 28 districts using three key socio-economic indicators: (1) the relative wage index, (2) the employment rate (aged 15–64), and (3) the unemployment rate (aged 15–64). The analytical framework integrates three complementary approaches:
- Descriptive spatial analysis with cartographic visualisation based on the standard deviation classification method;
- Multivariate cluster analysis (hierarchical Ward method and k-means algorithm);
- Spatial autocorrelation analysis using Local Indicators of Spatial Association (Local Moran’s I–LISA).
2.2. Data Sources and Indicators
The study is based on official statistical data provided by the National Statistical Institute (NSI) of the Republic of Bulgaria and the Employment Agency at the Ministry of Labour and Social Policy. All data are publicly available and were retrieved from the official websites of the institutions [42,43].
The use of administrative districts as research units ensures full territorial coverage and eliminates the need for sample-based estimations or surveys. The dataset includes annual data at the district level (NUTS 3) for the period of 2021–2024. The analysis is based on average indicator values for the analysed period to identify relatively stable regional labour-market patterns and territorial disparities across Bulgarian districts.
To identify spatial disparities in the labour market at the district level in Bulgaria, a limited but analytically robust set of three key indicators was selected: the relative wage index, employment rate, and unemployment rate. In addition, these indicators capture both income effects and structural characteristics and problems of the regional labour markets in Bulgaria. All indicators are defined in accordance with NSI and Eurostat methodological standards, ensuring temporal and territorial comparability. The main statistical tables include:
- Employed persons and employment rates—national level, statistical regions, and districts;
- Unemployed persons and unemployment rates—national level, statistical regions, and districts;
- Data on average gross annual wages by district, used to calculate the relative wage index.
The relative wage index reflects differences in generated labour income across the country, thus providing an important measure of spatial inequalities. It is calculated as the ratio between the average gross annual wage in a given district and the national average gross annual wage for the same year. The relative wage index (RWI) is defined as
where is the average gross annual wage in district i, and is the national average gross annual wage for the same year.
The employment rate measures the percentage of employed persons aged 15–64 relative to the total population in the same age group. It reflects the degree of labour market participation and serves as a key indicator of economic activity and regional resilience.
The unemployment rate measures the percentage of unemployed persons aged 15–64 relative to the economically active population in the same age group. It indicates the degree of labour market exclusion and reveals the limited capacity of regional economies to generate job opportunities.
Together, the three variables capture the interaction between income levels, labour market participation, and labour market exclusion, allowing for a multidimensional assessment of regional labour market disparities and vulnerability across Bulgarian districts.
2.3. Data Preparation and Processing
Initially, the data were organised in wide format, with separate columns for each indicator by year. For the cluster and spatial analysis, the dataset was transformed into long format, in which each observation represents a district–year combination. The transformation was conducted in Microsoft Excel using the Power Query tool and involved the following steps: harmonisation of indicator and year labels; removal of irrelevant or duplicate variables; unpivot transformation to restructure annual values into rows; separation of combined variable names into distinct attributes (indicator and year); and final restructuring through a pivot operation to produce a panel dataset.
The resulting dataset in long format included 28 districts over four years (a total of 28 × 4 × 3 = 336 observations), suitable for subsequent standardisation, cluster analysis, and spatial autocorrelation assessment.
For the cluster and LISA analysis goals, mean values for the period of 2021–2024 were calculated for each indicator and district using arithmetic averaging (pivot table in Microsoft Excel). This approach allows the identification of continuous regional patterns while minimising short-term economic fluctuations in labour markets.
For cartographic visualisation, the standard deviation classification method in ArcGIS (ArcMap 10.6.1) was applied. Districts were classified into four intervals based on deviation from the national mean:
- Below −0.50 standard deviations.
- Between −0.50 and +0.50 standard deviations.
- Between +0.50 and +1.50 standard deviations.
- Above +1.50 standard deviations.
This method was selected because it highlights the degree of deviation from the national mean and is appropriate for socioeconomic indicators characterised by structural polarisation. It also ensures consistent classification logic across variables, allowing comparative interpretation.
2.4. Multivariate Cluster Analysis
To identify groups of districts with similar labour market profiles, a multivariate cluster analysis was applied. Firstly, hierarchical clustering was performed using Ward’s agglomerative method and Euclidean distance. Ward’s method minimises within-cluster variance and is widely used for identifying relatively homogeneous groups while maintaining clear differentiation between clusters.
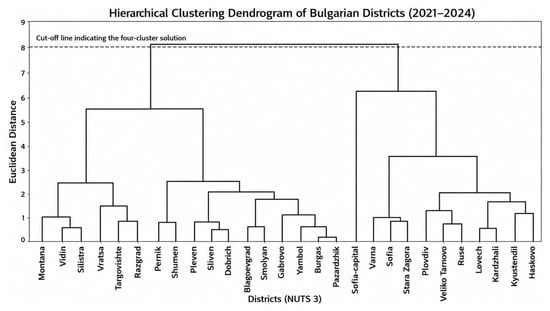
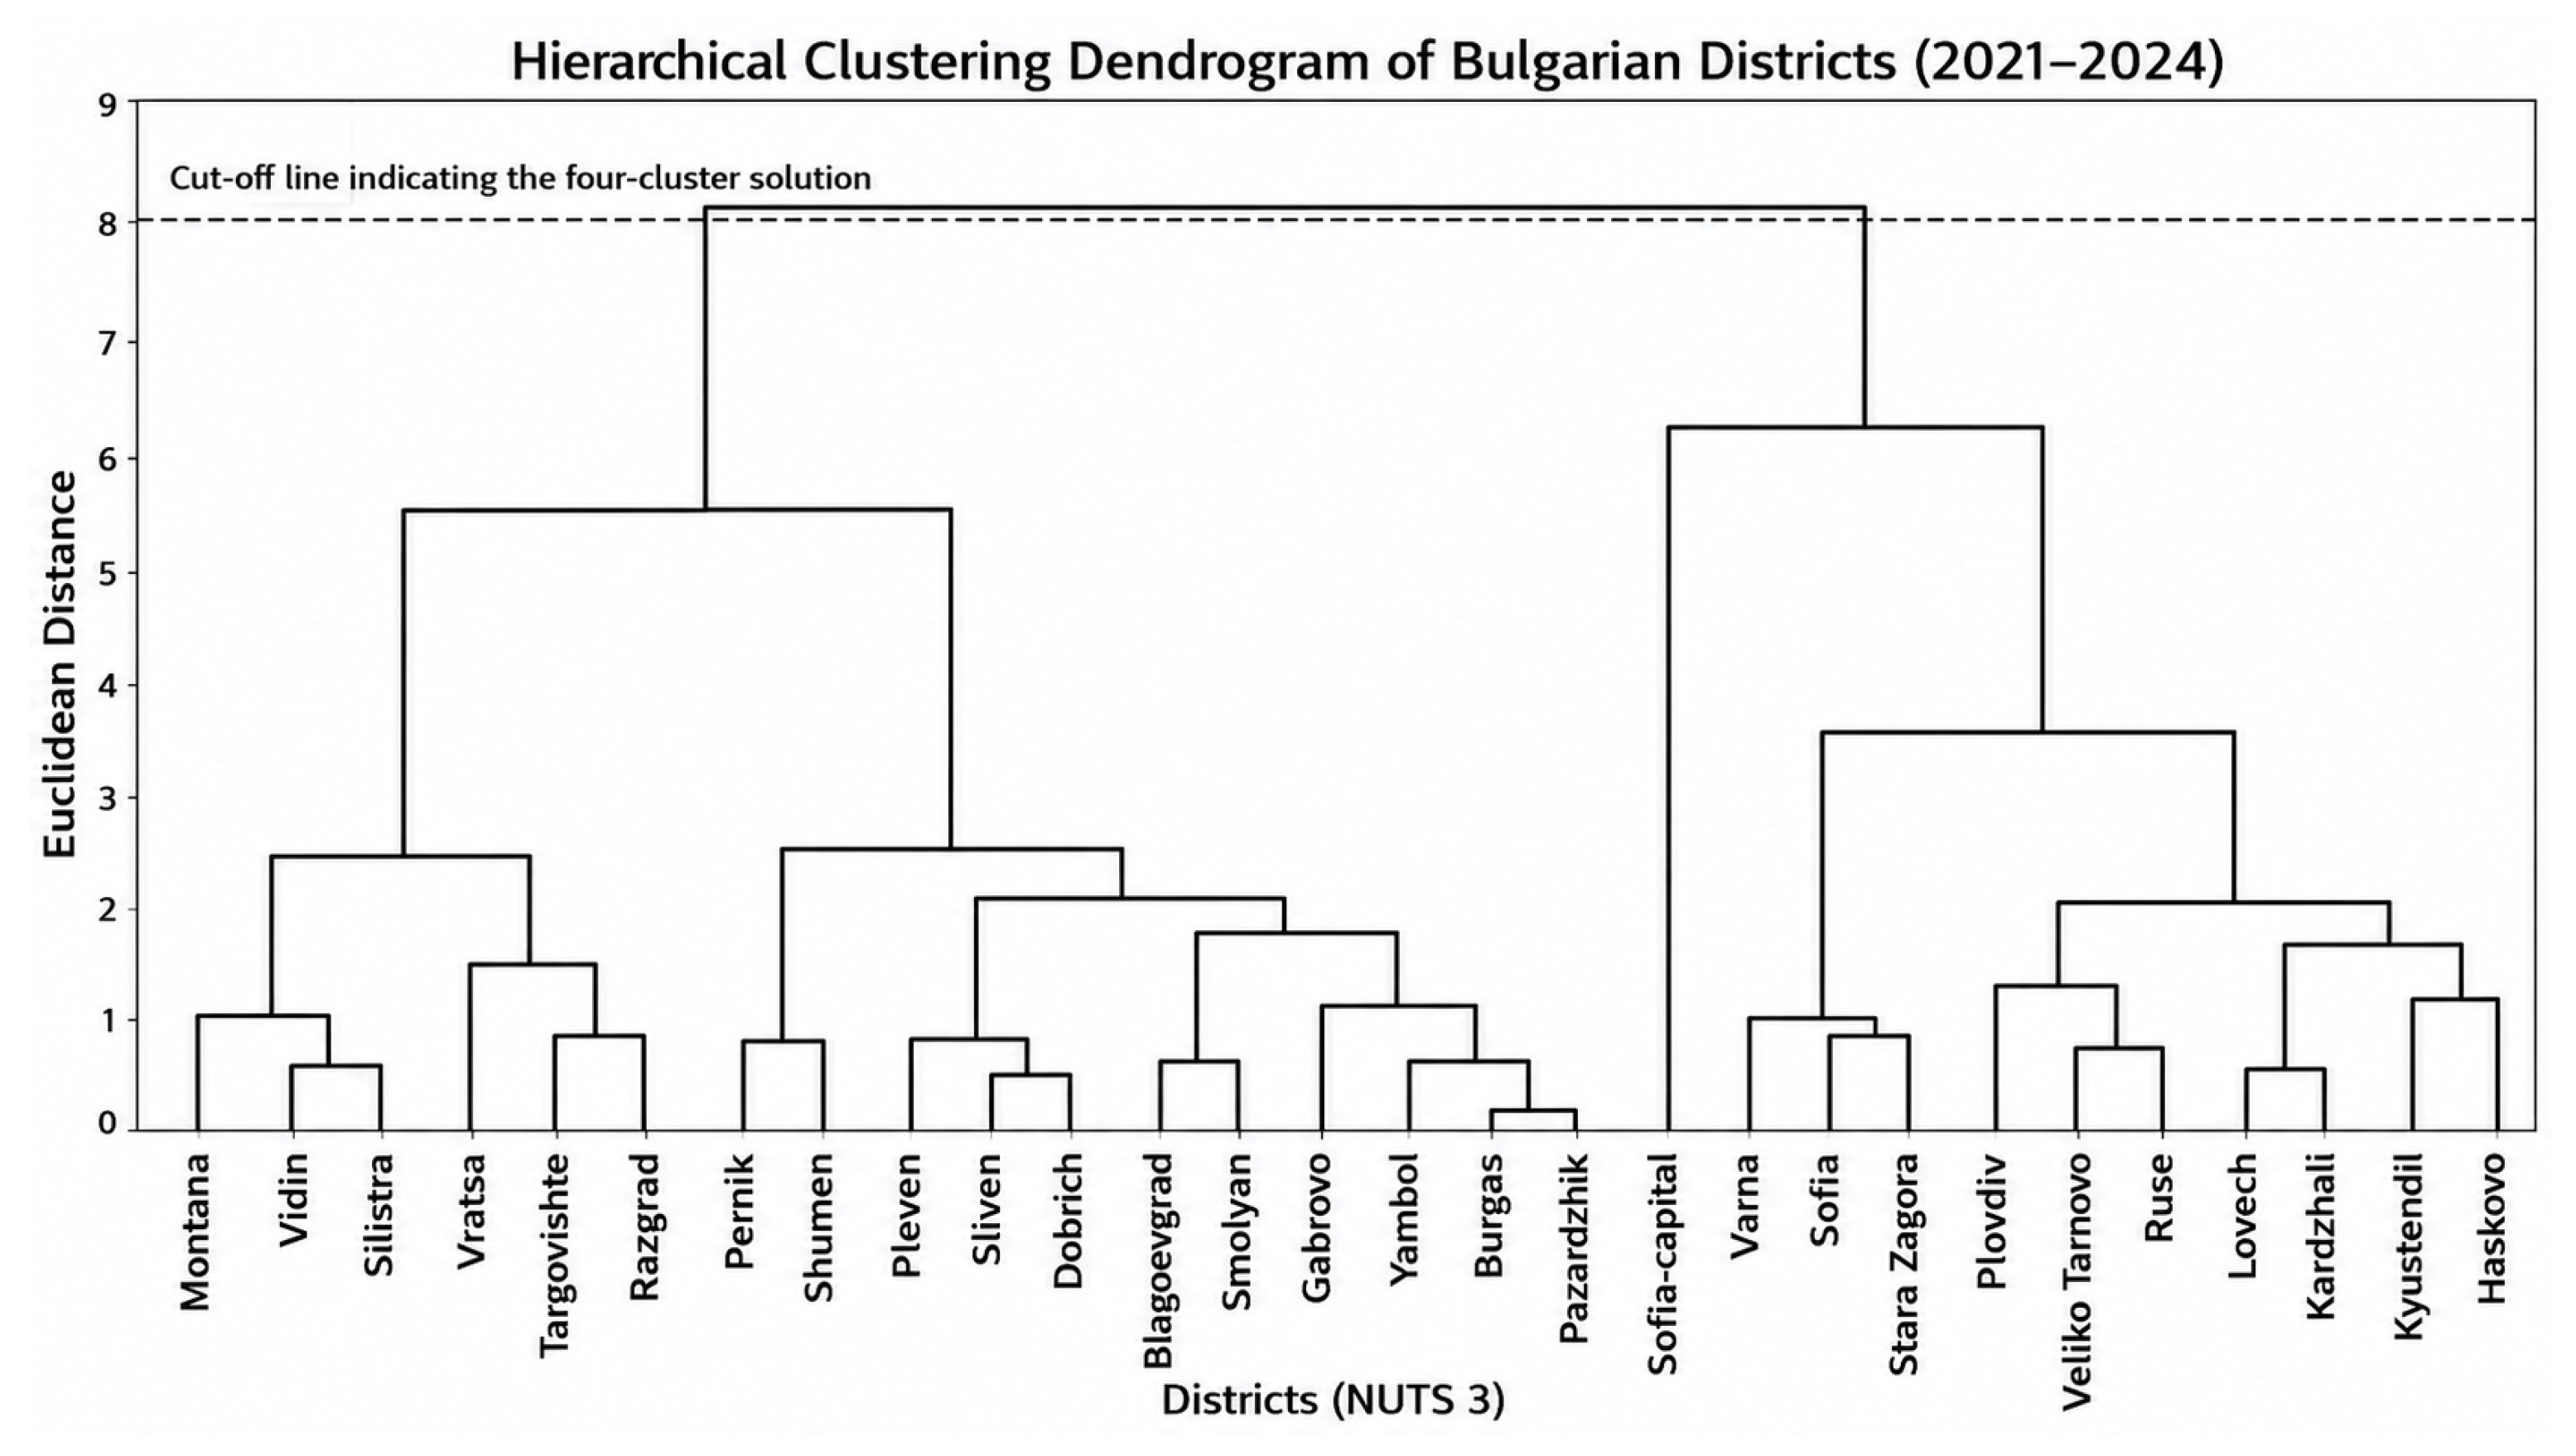
To support the selection of the optimal number of clusters, a hierarchical clustering dendrogram based on Ward’s agglomerative method and Euclidean distance was additionally examined (Figure 2). The selected four-cluster solution provided the best balance between statistical differentiation, cluster stability, and interpretability of regional labour-market typologies.
Figure 2.
Hierarchical clustering dendrogram of Bulgarian NUTS 3 districts based on labour-market indicators (2021–2024).
Secondly, a k-means clustering algorithm was applied for the final classification of districts. The analysis was performed using standardised (z-score) values of the three indicators in order to ensure equal weighting of the variables and avoid the influence of differences in measurement scales. The resulting clusters represent a regional typology revealing different combinations of labour income levels, employment, and unemployment rates across Bulgarian NUTS 3 districts.
Although the selected indicators provide a relatively simplified representation of labour-market disparities, they allow the identification of stable spatial patterns and territorial differences in regional labour-market performance during the analysed period.
2.5. Spatial Autocorrelation (LISA)
Local Indicators of Spatial Association (LISA), based on Local Moran’s I statistics, were applied to examine the spatial autocorrelation of labour-market indicators across Bulgarian NUTS 3 districts. The method allows the identification of local spatial clusters and spatial outliers by comparing the values of each district with those of neighbouring districts.
LISA analysis identifies High–High and Low–Low spatial clusters, representing districts with high or low indicator values surrounded by neighbouring districts with similarly high or low values. In addition, the method detects spatial outliers (High–Low and Low–High), which may indicate localised territorial disparities, structural imbalances, or the influence of specific regional factors.
Spatial relationships between districts were defined using a contiguity-based Queen’s spatial-weights matrix, which considers both shared borders and shared boundary points between neighbouring territorial units. The statistical significance of Local Moran’s I values was assessed using a permutation test with 999 permutations and a significance threshold of p < 0.05.
The LISA analysis was applied to identify persistent spatial patterns and territorial concentrations in district labour-market characteristics and to complement the regional typology derived from the cluster analysis.
2.6. Software
All statistical and spatial analyses were performed in ArcGIS Pro 3.3 (ESRI) and ArcMap 10.6.1 (ESRI). The Multivariate Clustering tool was used for cluster analysis, and Cluster and Outlier Analysis (Anselin Local Moran’s I) in ArcGIS Pro 3.3 was used for spatial analysis. The primary data was processed and restructured in Microsoft Excel 365 (using Power Query). Cartographic visualisation was performed in ArcMap 10.6.1 (ESRI) in accordance with the standards for thematic and spatial mapping in regional studies.
The methodological framework described above allows the identification of spatial patterns of labour market disparities across the country’s districts. The results of the three types of analysis, e.g., descriptive spatial, multivariate cluster, and spatial autocorrelation assessment, are presented in the in Section 3.
3. Results
3.1. Analysis of Indicators
3.1.1. Employment Rate
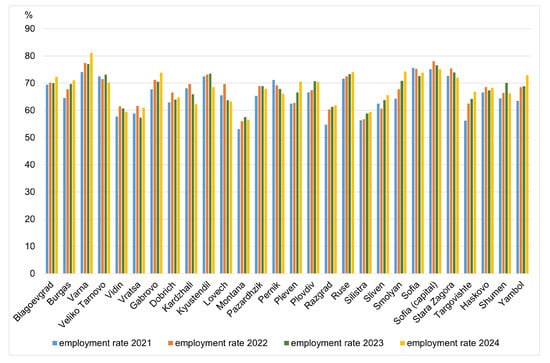
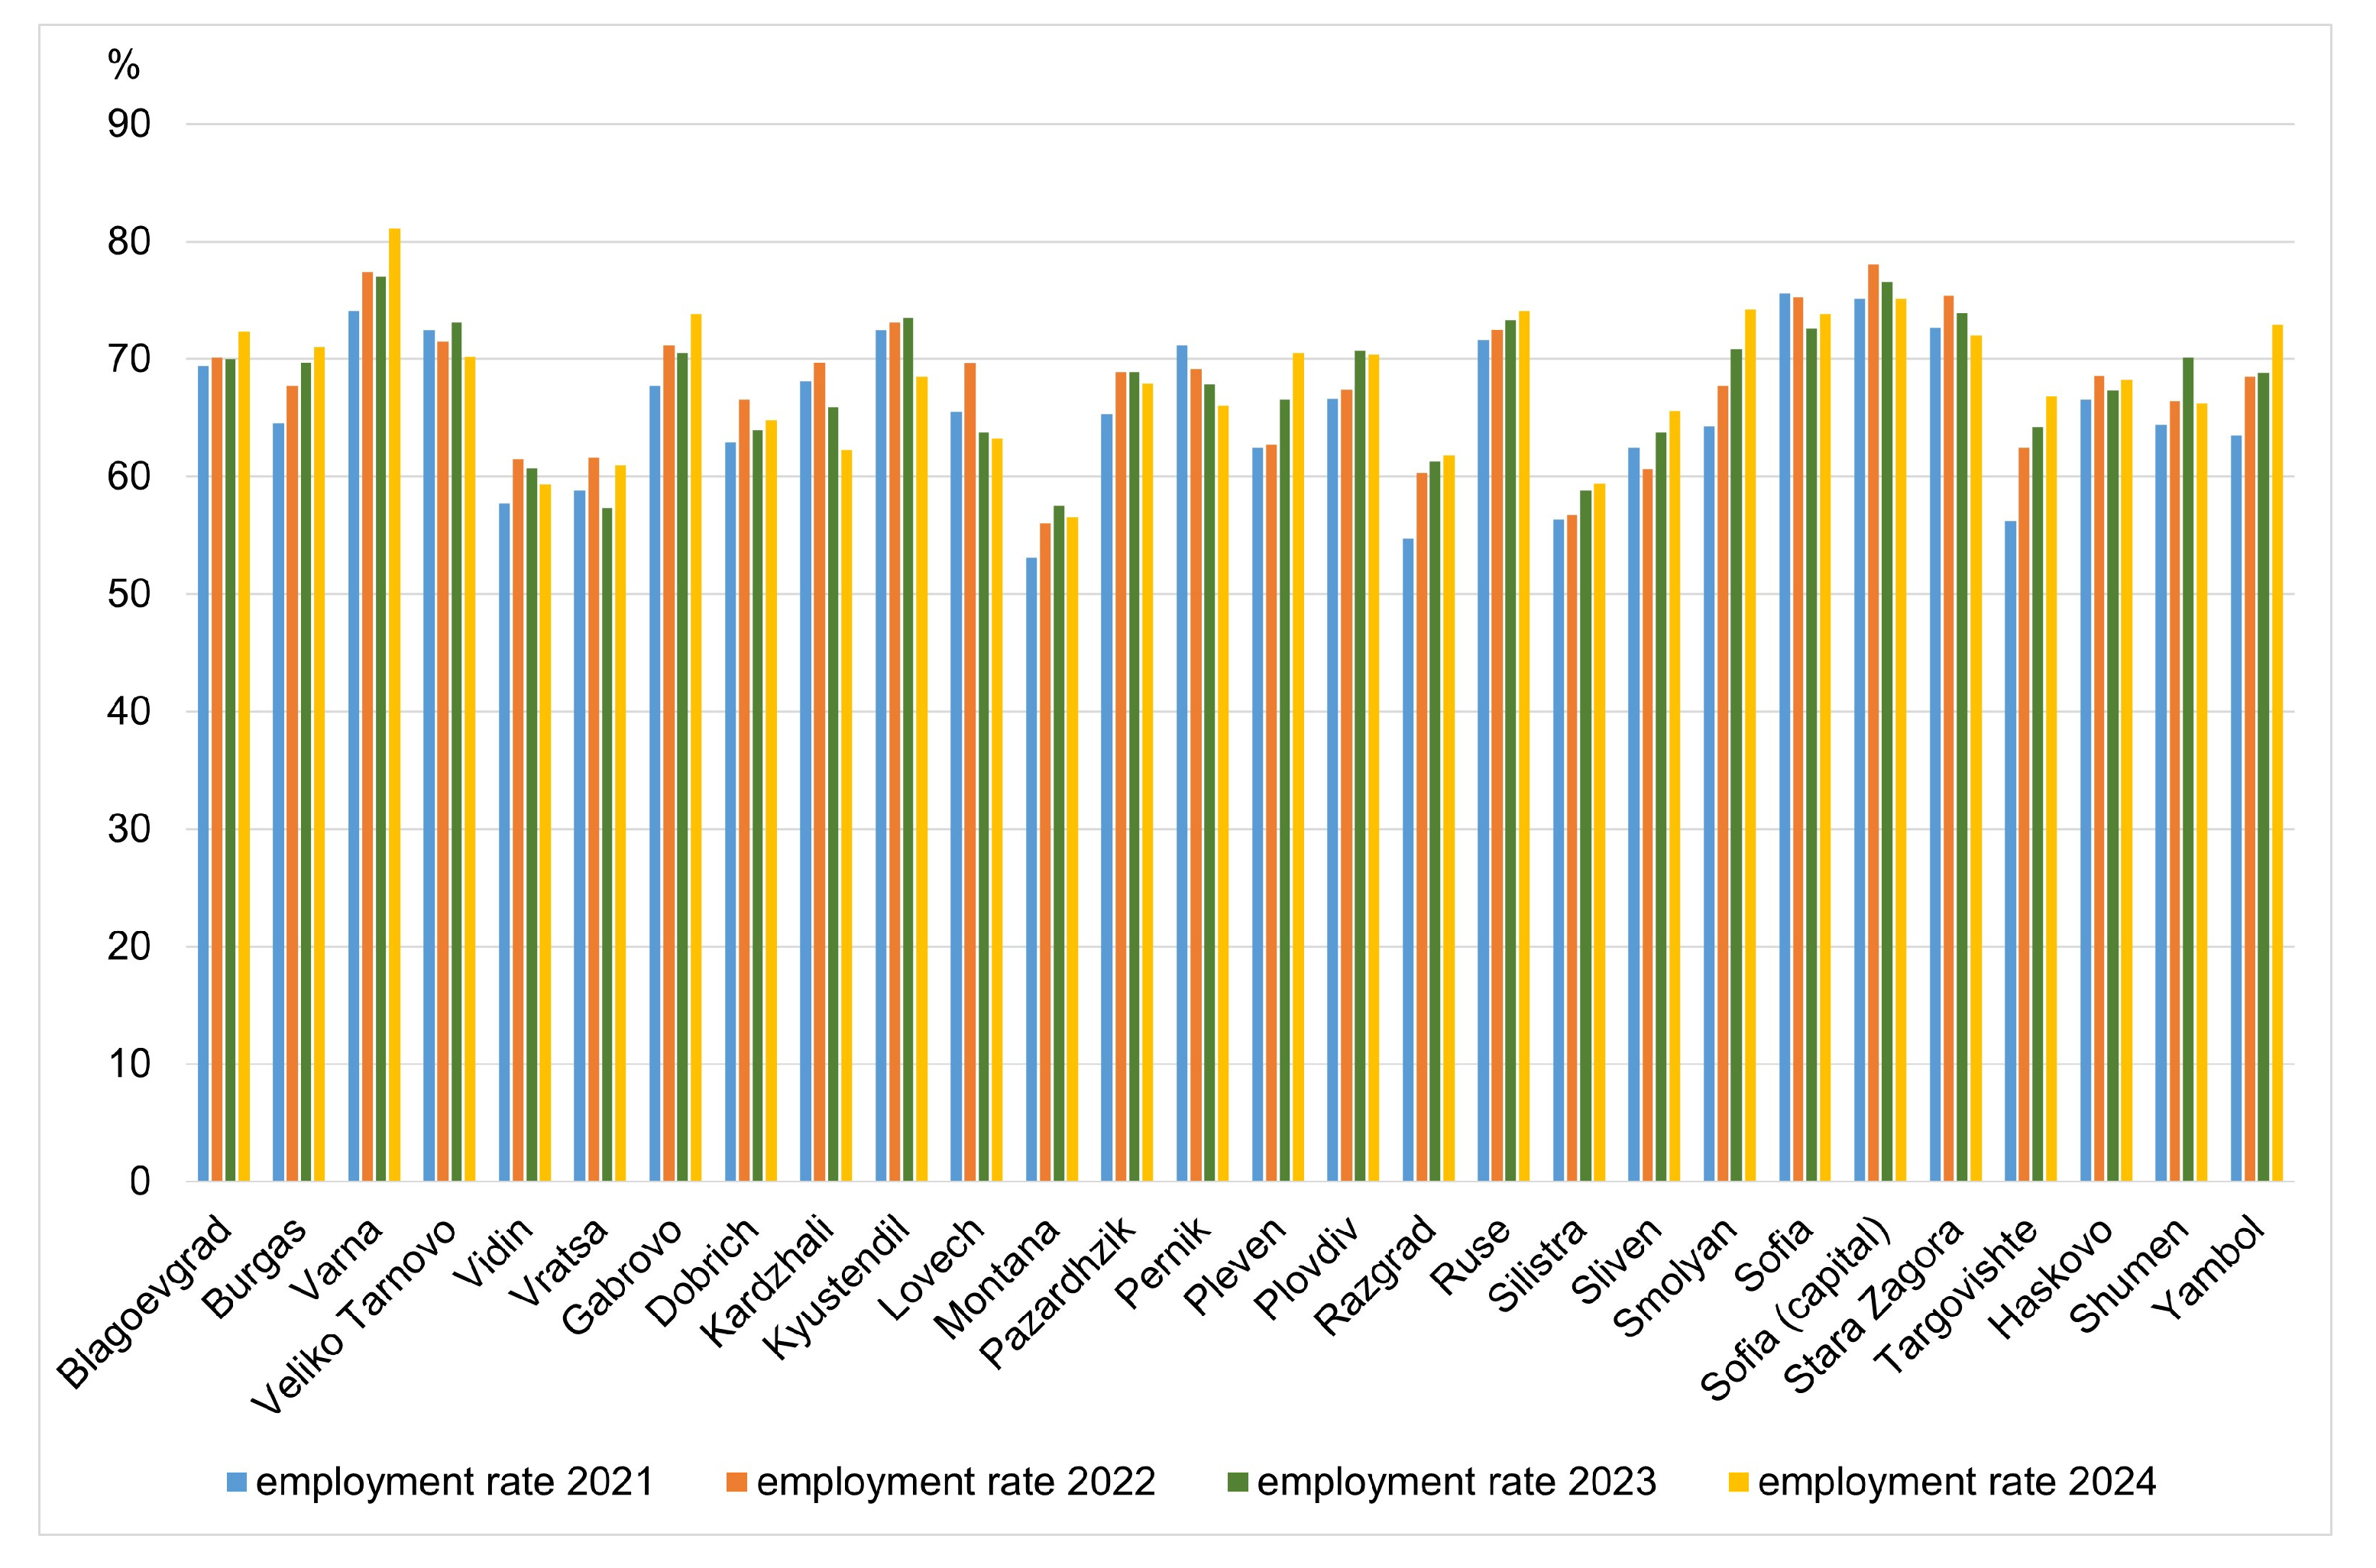
Figure 3 reveals substantial regional disparities in employment across Bulgarian districts during the period of 2021–2024. The highest employment rates are consistently observed in Sofia (capital), Varna, Stara Zagora, and Sofia, with employment exceeding 75% in several years. These districts represent some of the country’s most economically developed territories, characterised by diversified economic structures, stronger labour demand, higher investment activity, and a greater concentration of services and industrial employment.
Figure 3.
Regional disparities in employment rates across Bulgarian districts (2021–2024) (Source: authors, based on NSI data for the 2021–2024 period).
In contrast, districts such as Vidin, Montana, Razgrad, Vratsa, and Silistra exhibit considerably lower employment rates throughout the study period. Although most districts experienced gradual improvements in employment between 2021 and 2024, the gap between the leading and lagging regions remains substantial.
Notable increases are observed in districts such as Yambol, Targovishte, Smolyan and Pleven, indicating positive labour market developments during the final year of the analysis. Nevertheless, the overall pattern suggests that economic growth has not been sufficient to eliminate territorial disparities in employment opportunities.
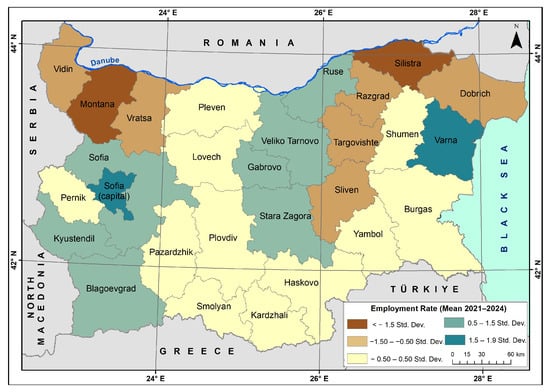
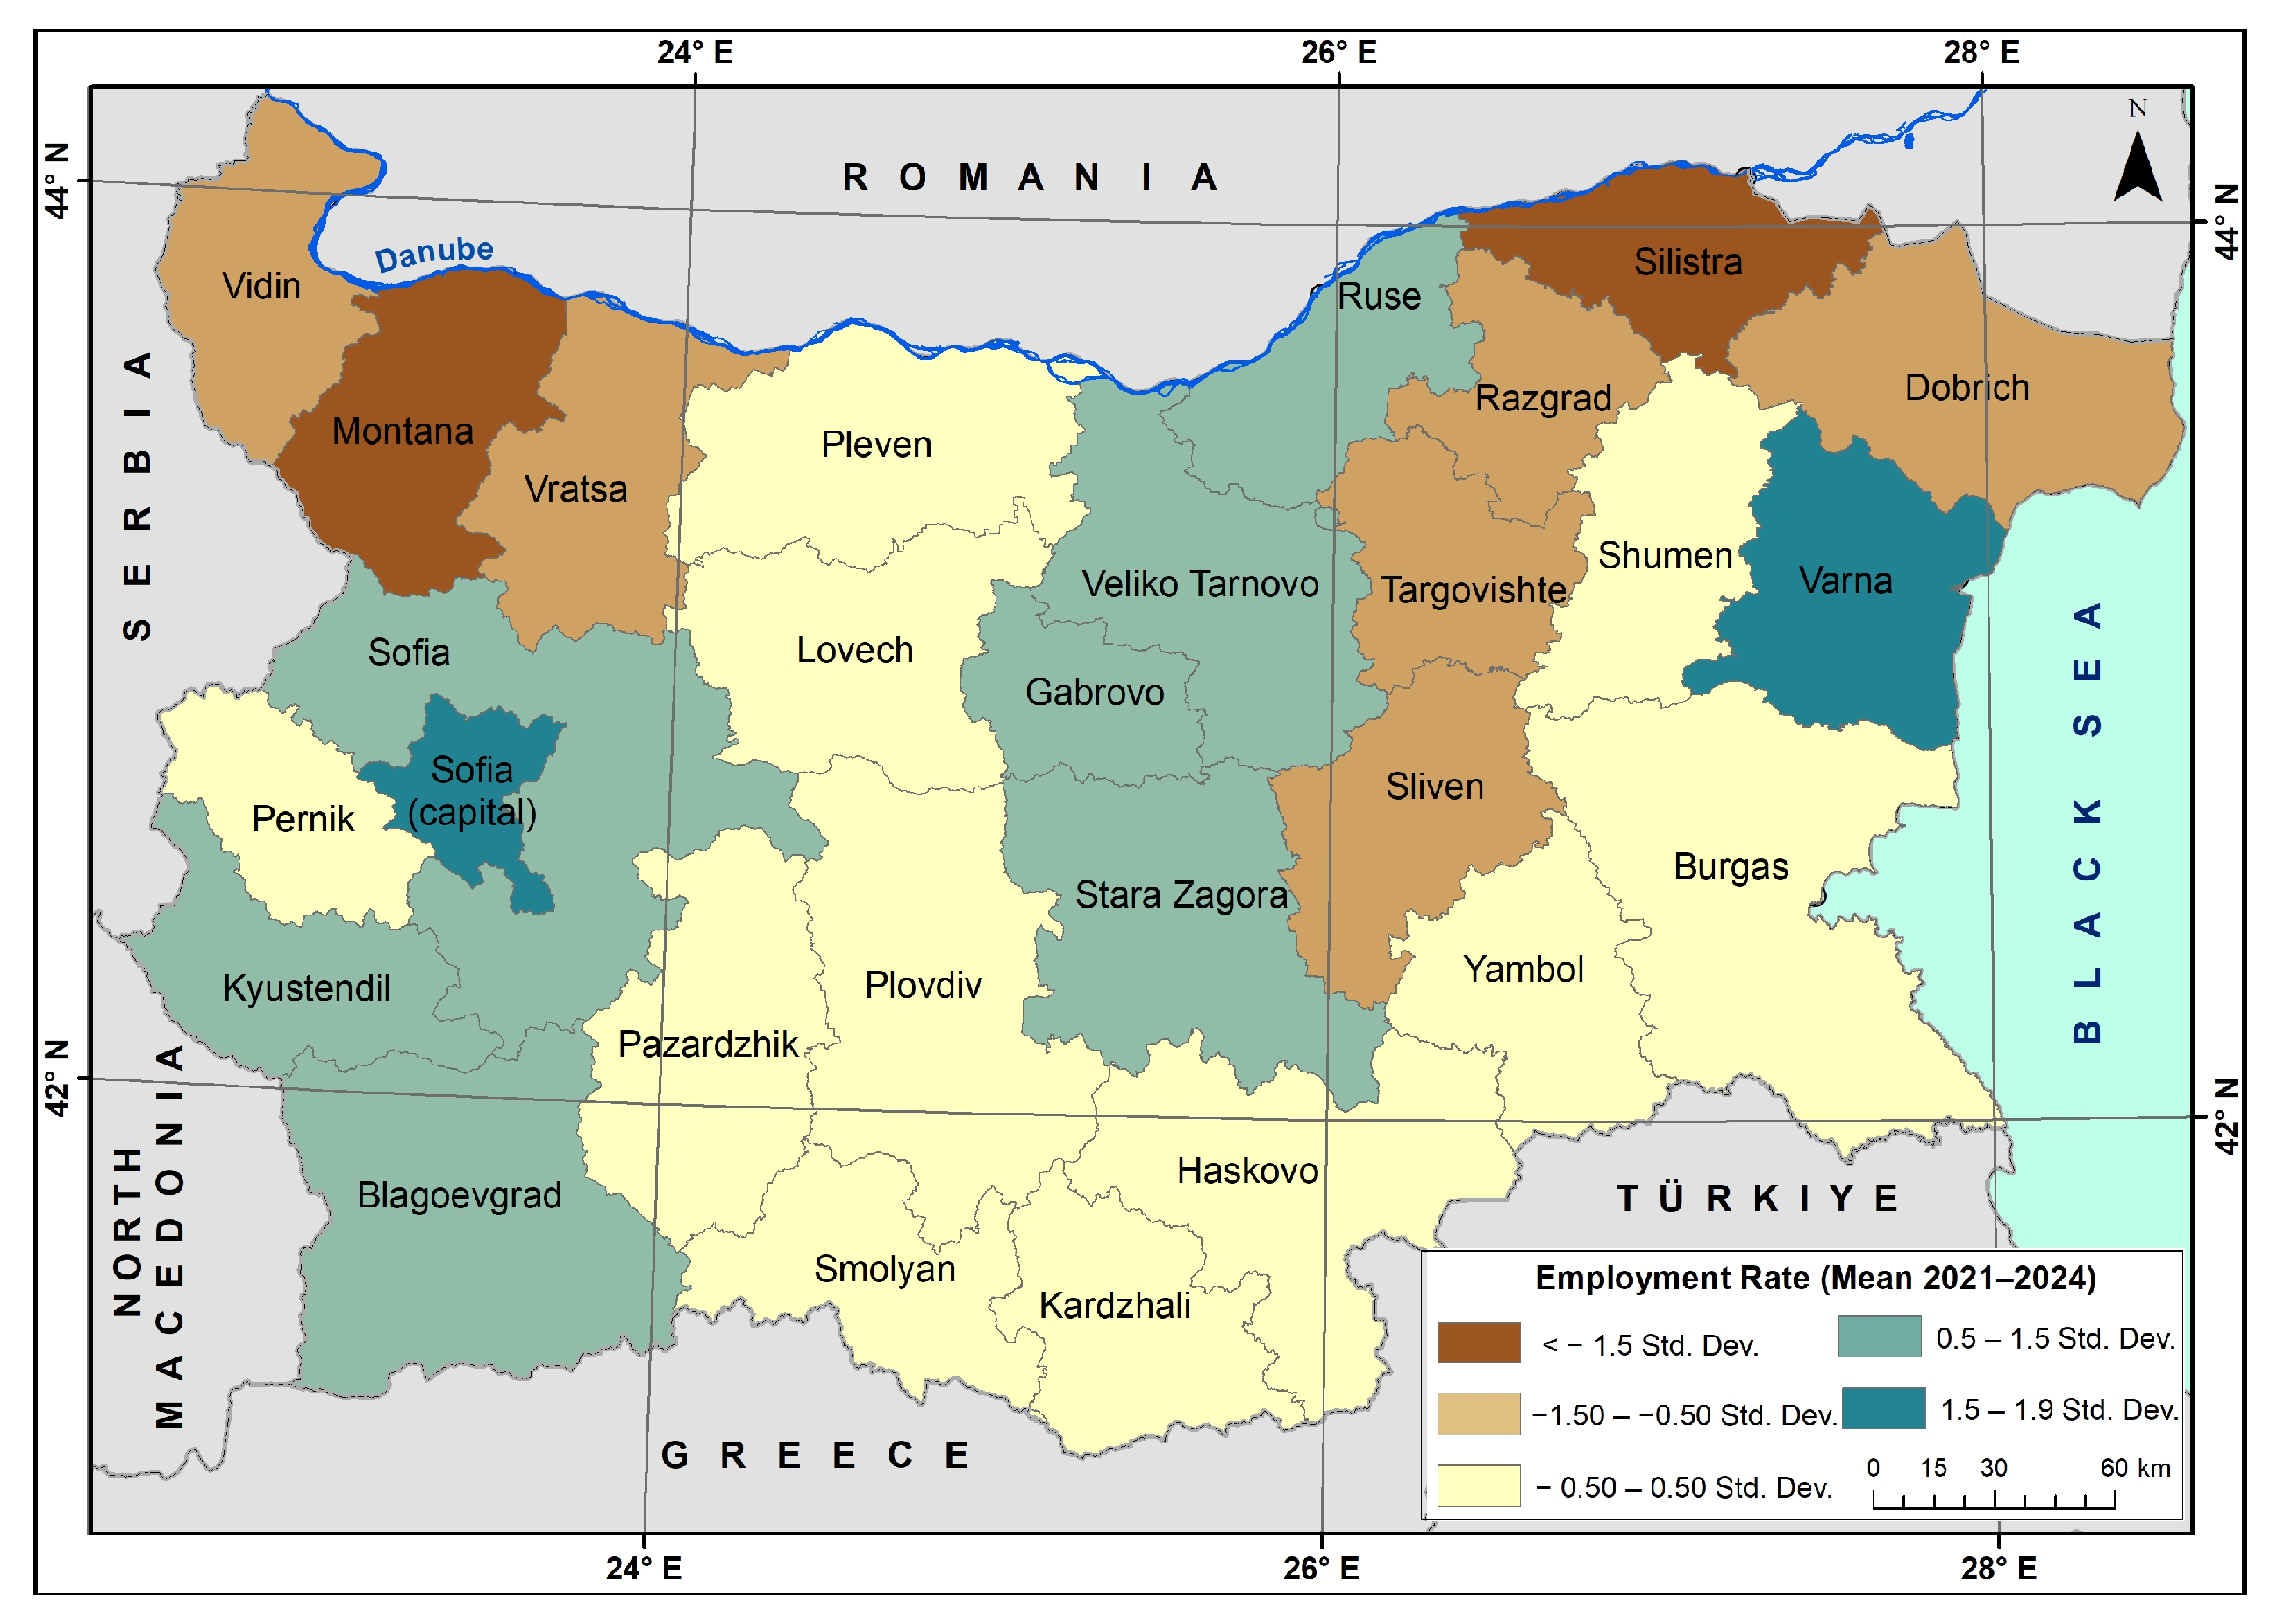
To better understand the spatial dimension of employment disparities, the average employment rate for the period of 2021–2024 was analysed at the district level. Furthermore, its spatial distribution reveals additional aspects of regional differences in labour markets in Bulgaria (Figure 4). Sofia (capital) and Varna display the most favourable combination of higher wages and higher employment rates (over 76.2%), reflecting a concentration of economic activities with high value-added and better labour-market performance. In addition, the districts of Sofia and Stara Zagora have higher employment rates (mean values above 73.5%), which is due to their economic specialisation as well as commuting effects. On the contrary, the districts of Montana and Silistra exhibit the lowest employment rates (mean values between 55.8% and 57.8%) and, together with other districts in Northern Bulgaria, form a belt of particularly vulnerable labour markets.
Figure 4.
Employment rate (mean, 2021–2024) (The maps are based on average values for the period 2021–2024. The classifications are standardised using z-scores. Data source: National Statistical Institute (NSI), processed by the authors).
Several districts have relatively high employment rates and are located predominantly in the southwestern and north-central parts of the country. However, the indicator does not necessarily correspond to higher wages in all of them. This is a result of the limited capacity and/or skill mismatches in local labour markets (e.g., Kyustendil, Veliko Tarnovo, and Blagoevgrad).
The combined investigation of employment rates and the relative wage index maps displays that high workforce activity does not lead to a proportional generation of labour income in a significant part of the country. This discrepancy is a result of employment in low-paid economic activities, mainly in labour-intensive sectors characterised by low productivity and restricted wage growth. These structural problems in the labour market and their spatial patterns highlight the core–periphery development model of the Bulgarian labour market.
3.1.2. Unemployment Rate
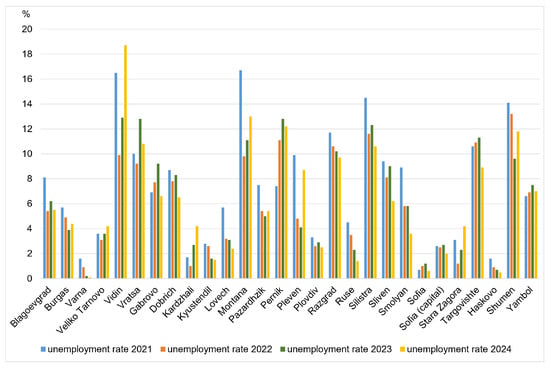
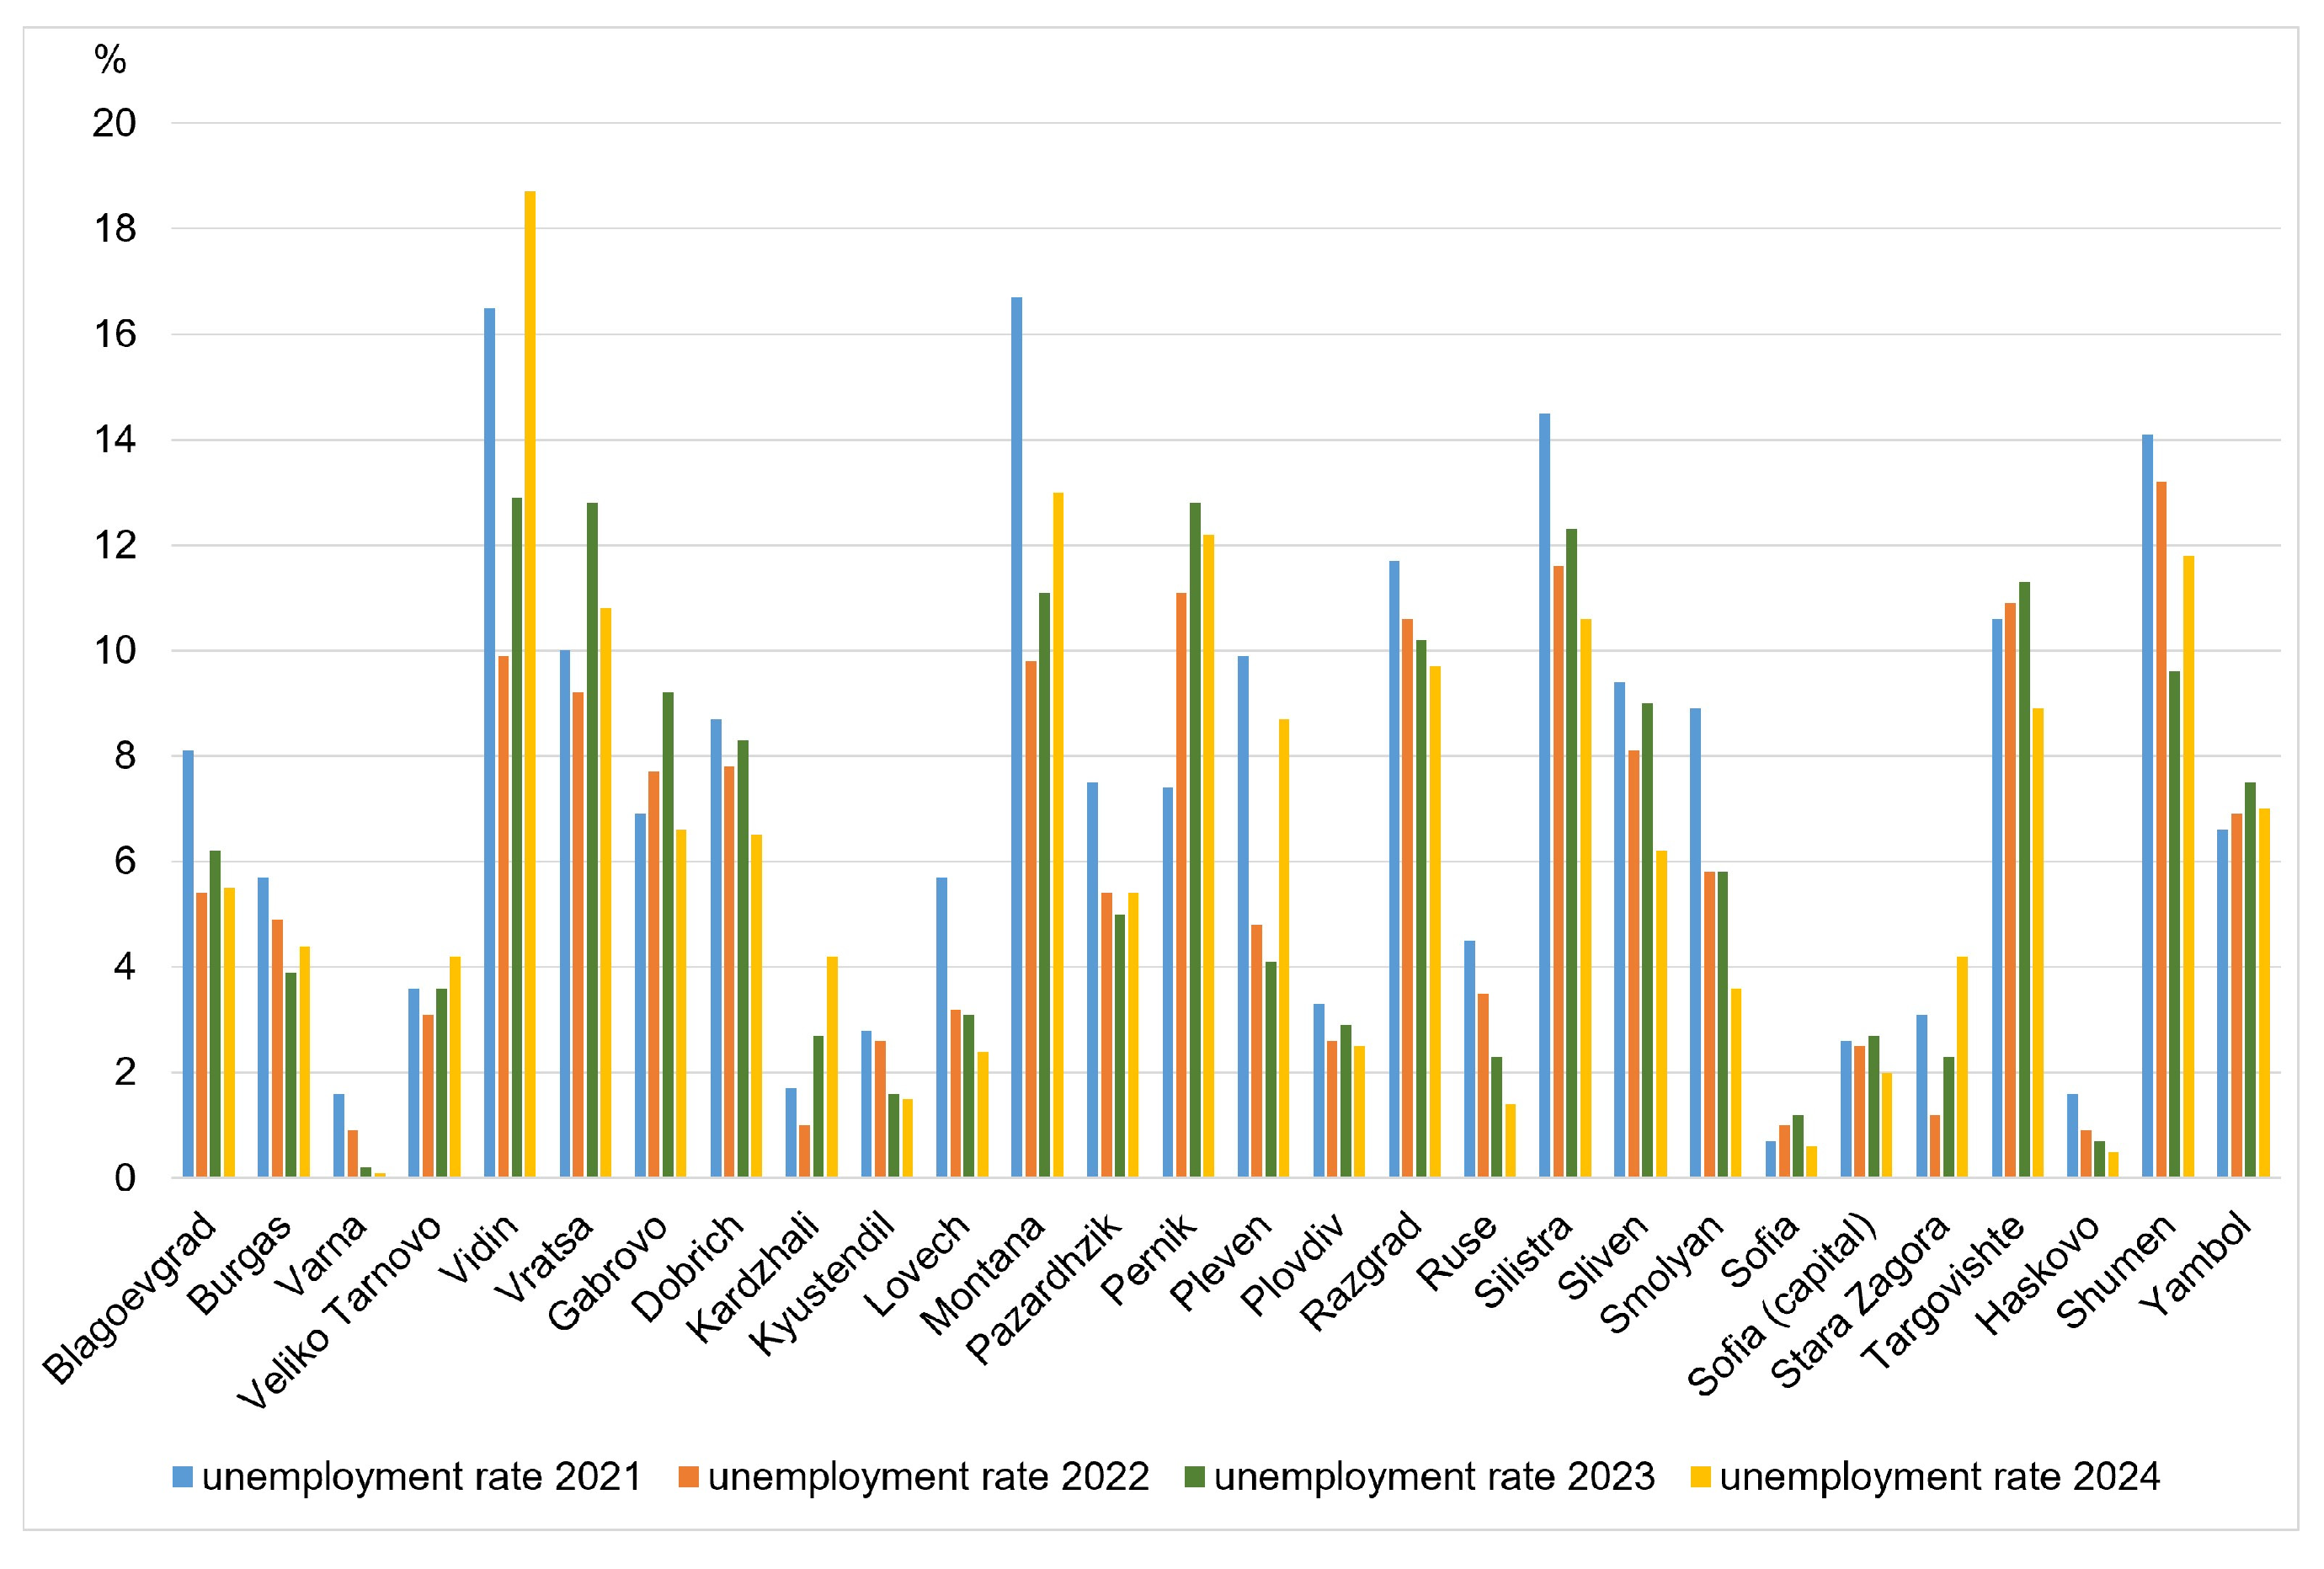
Figure 5 demonstrates a general decline in unemployment rates across Bulgaria during the study period. The lowest unemployment levels are recorded in Sofia (capital), Sofia, Varna, Haskovo, Kardzhali, and Kyustendil, where unemployment remains relatively low and stable.
Figure 5.
Regional disparities in unemployment rates across Bulgarian districts (2021–2024) (Source: authors, based on NSI data for the 2021–2024 period).
Conversely, the highest unemployment rates are concentrated in Vidin, Montana, Silistra, Shumen, Razgrad, Targovishte, and Pernik. Despite gradual improvements over time, these districts continue to experience significantly weaker labour-market performance than the national leaders.
The case of Vidin is particularly notable, as it consistently records one of the highest unemployment levels among districts throughout the study period. This finding reflects the long-standing socioeconomic challenges facing northwestern Bulgaria, including population decline, outmigration, limited investment activity, and a weaker economic base.
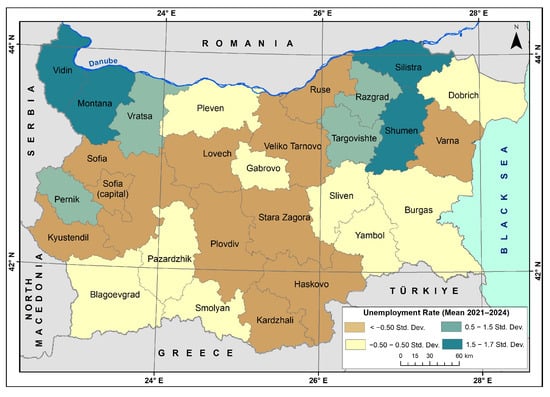
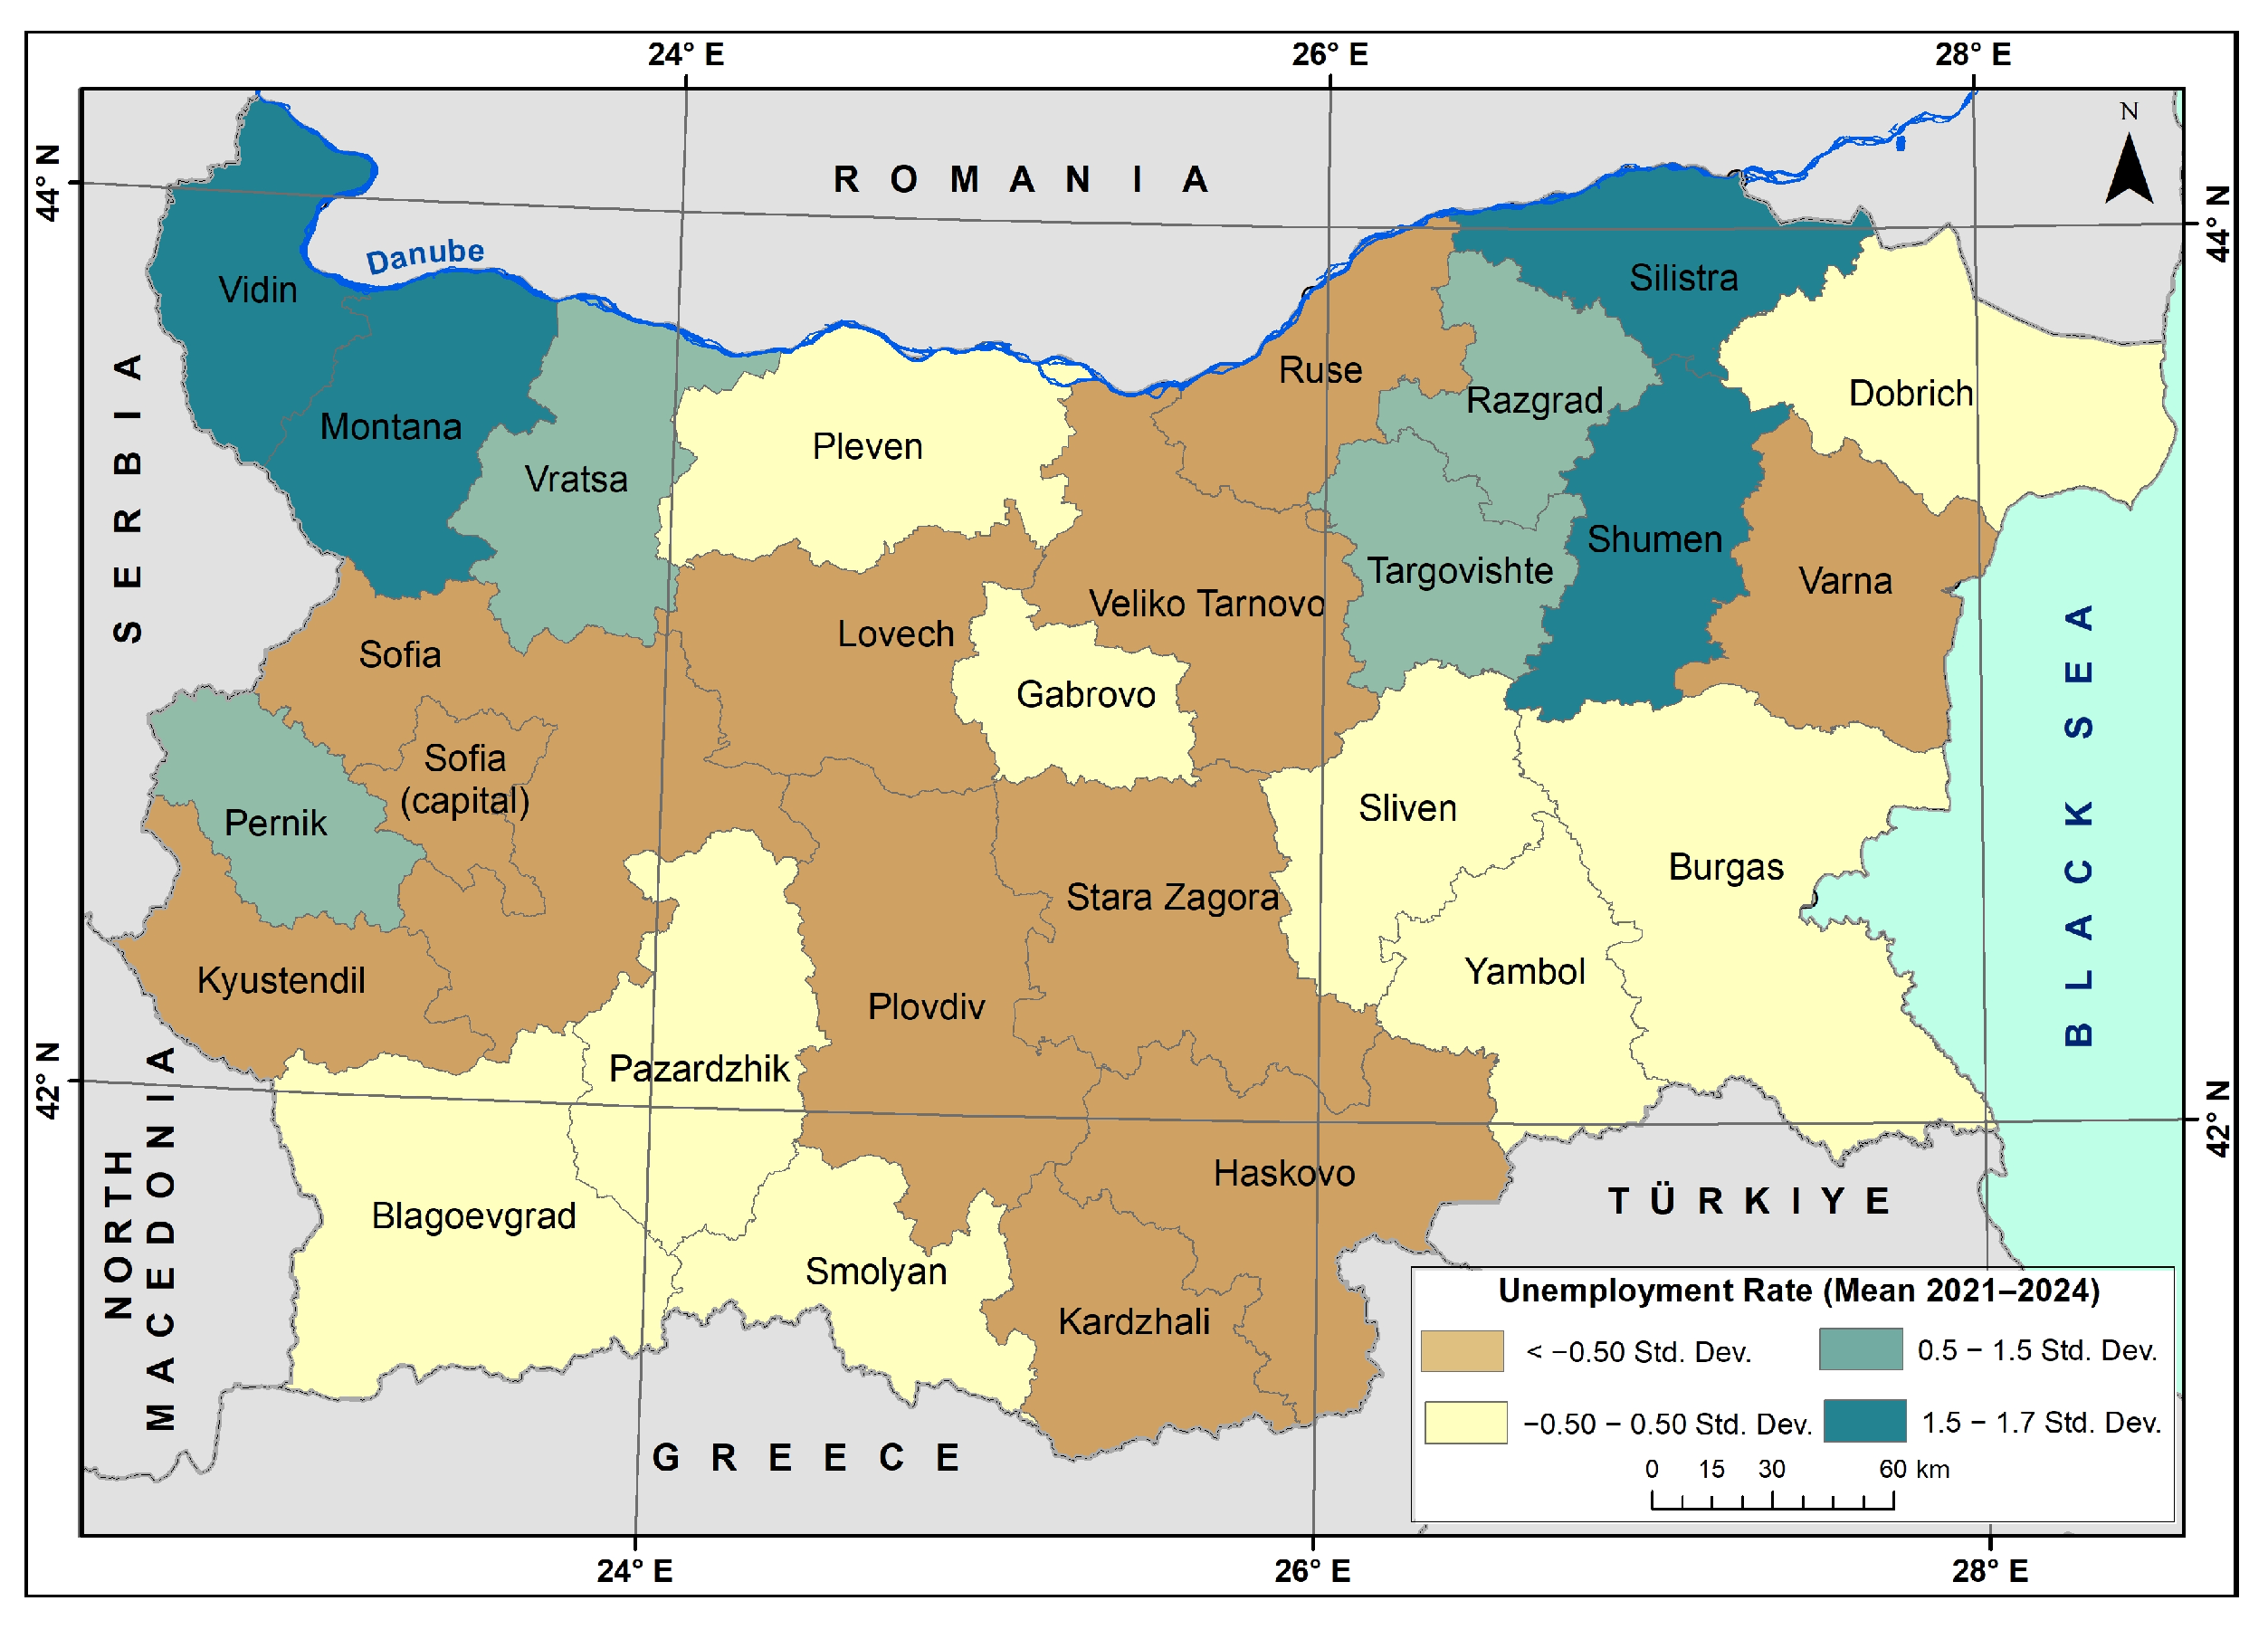
To further explore the spatial dimension of labour market disparities, the average unemployment rate for the period 2021–2024 was analysed at the district level (Figure 6).
Figure 6.
Unemployment rate (mean, 2021–2024) (The maps are based on average values for the period 2021–2024. The classifications are standardised using z-scores. Data source: National Statistical Institute (NSI), processed by the authors).
For 2021–2024, the distribution of the average unemployment rate reveals specific spatial patterns (Figure 6). The highest mean unemployment rates (ranging from 12.2% to 12.7%) are observed in the northwestern parts of Bulgaria (Montana and Vidin) and in the northeastern parts of Bulgaria (Silistra and Shumen). This is caused by the long-term economic decline in these areas, as well as unfavourable demographic and labour market characteristics. The district of Pernik has the highest mean unemployment rate (10.9%) in Southern Bulgaria. This is due to the region’s economic specialisation in mining, energy, and low-productivity industries, as well as challenges related to economic restructuring.
In contrast, the more economically developed regions, including the capital and the major economic centres (e.g., Plovdiv, Varna, and Ruse), are characterised by lower unemployment rates (below 3.0%). Most of these areas are in Central and Southern Bulgaria, and this territorial distribution indicates clear spatial inequalities in unemployment. It is important to note that low unemployment rates in certain regions of the country should be interpreted cautiously, because they do not necessarily correspond with higher wages and social sustainability. In the context of this study, this indicator is examined in conjunction with the relative income index, as the combination of low unemployment and low income is characteristic of regions with increasing vulnerability and poverty levels.
3.1.3. Relative Wage Index
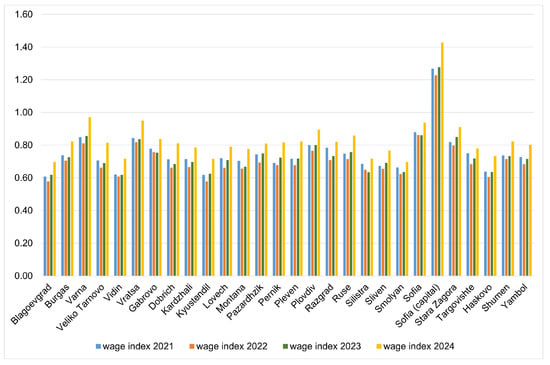
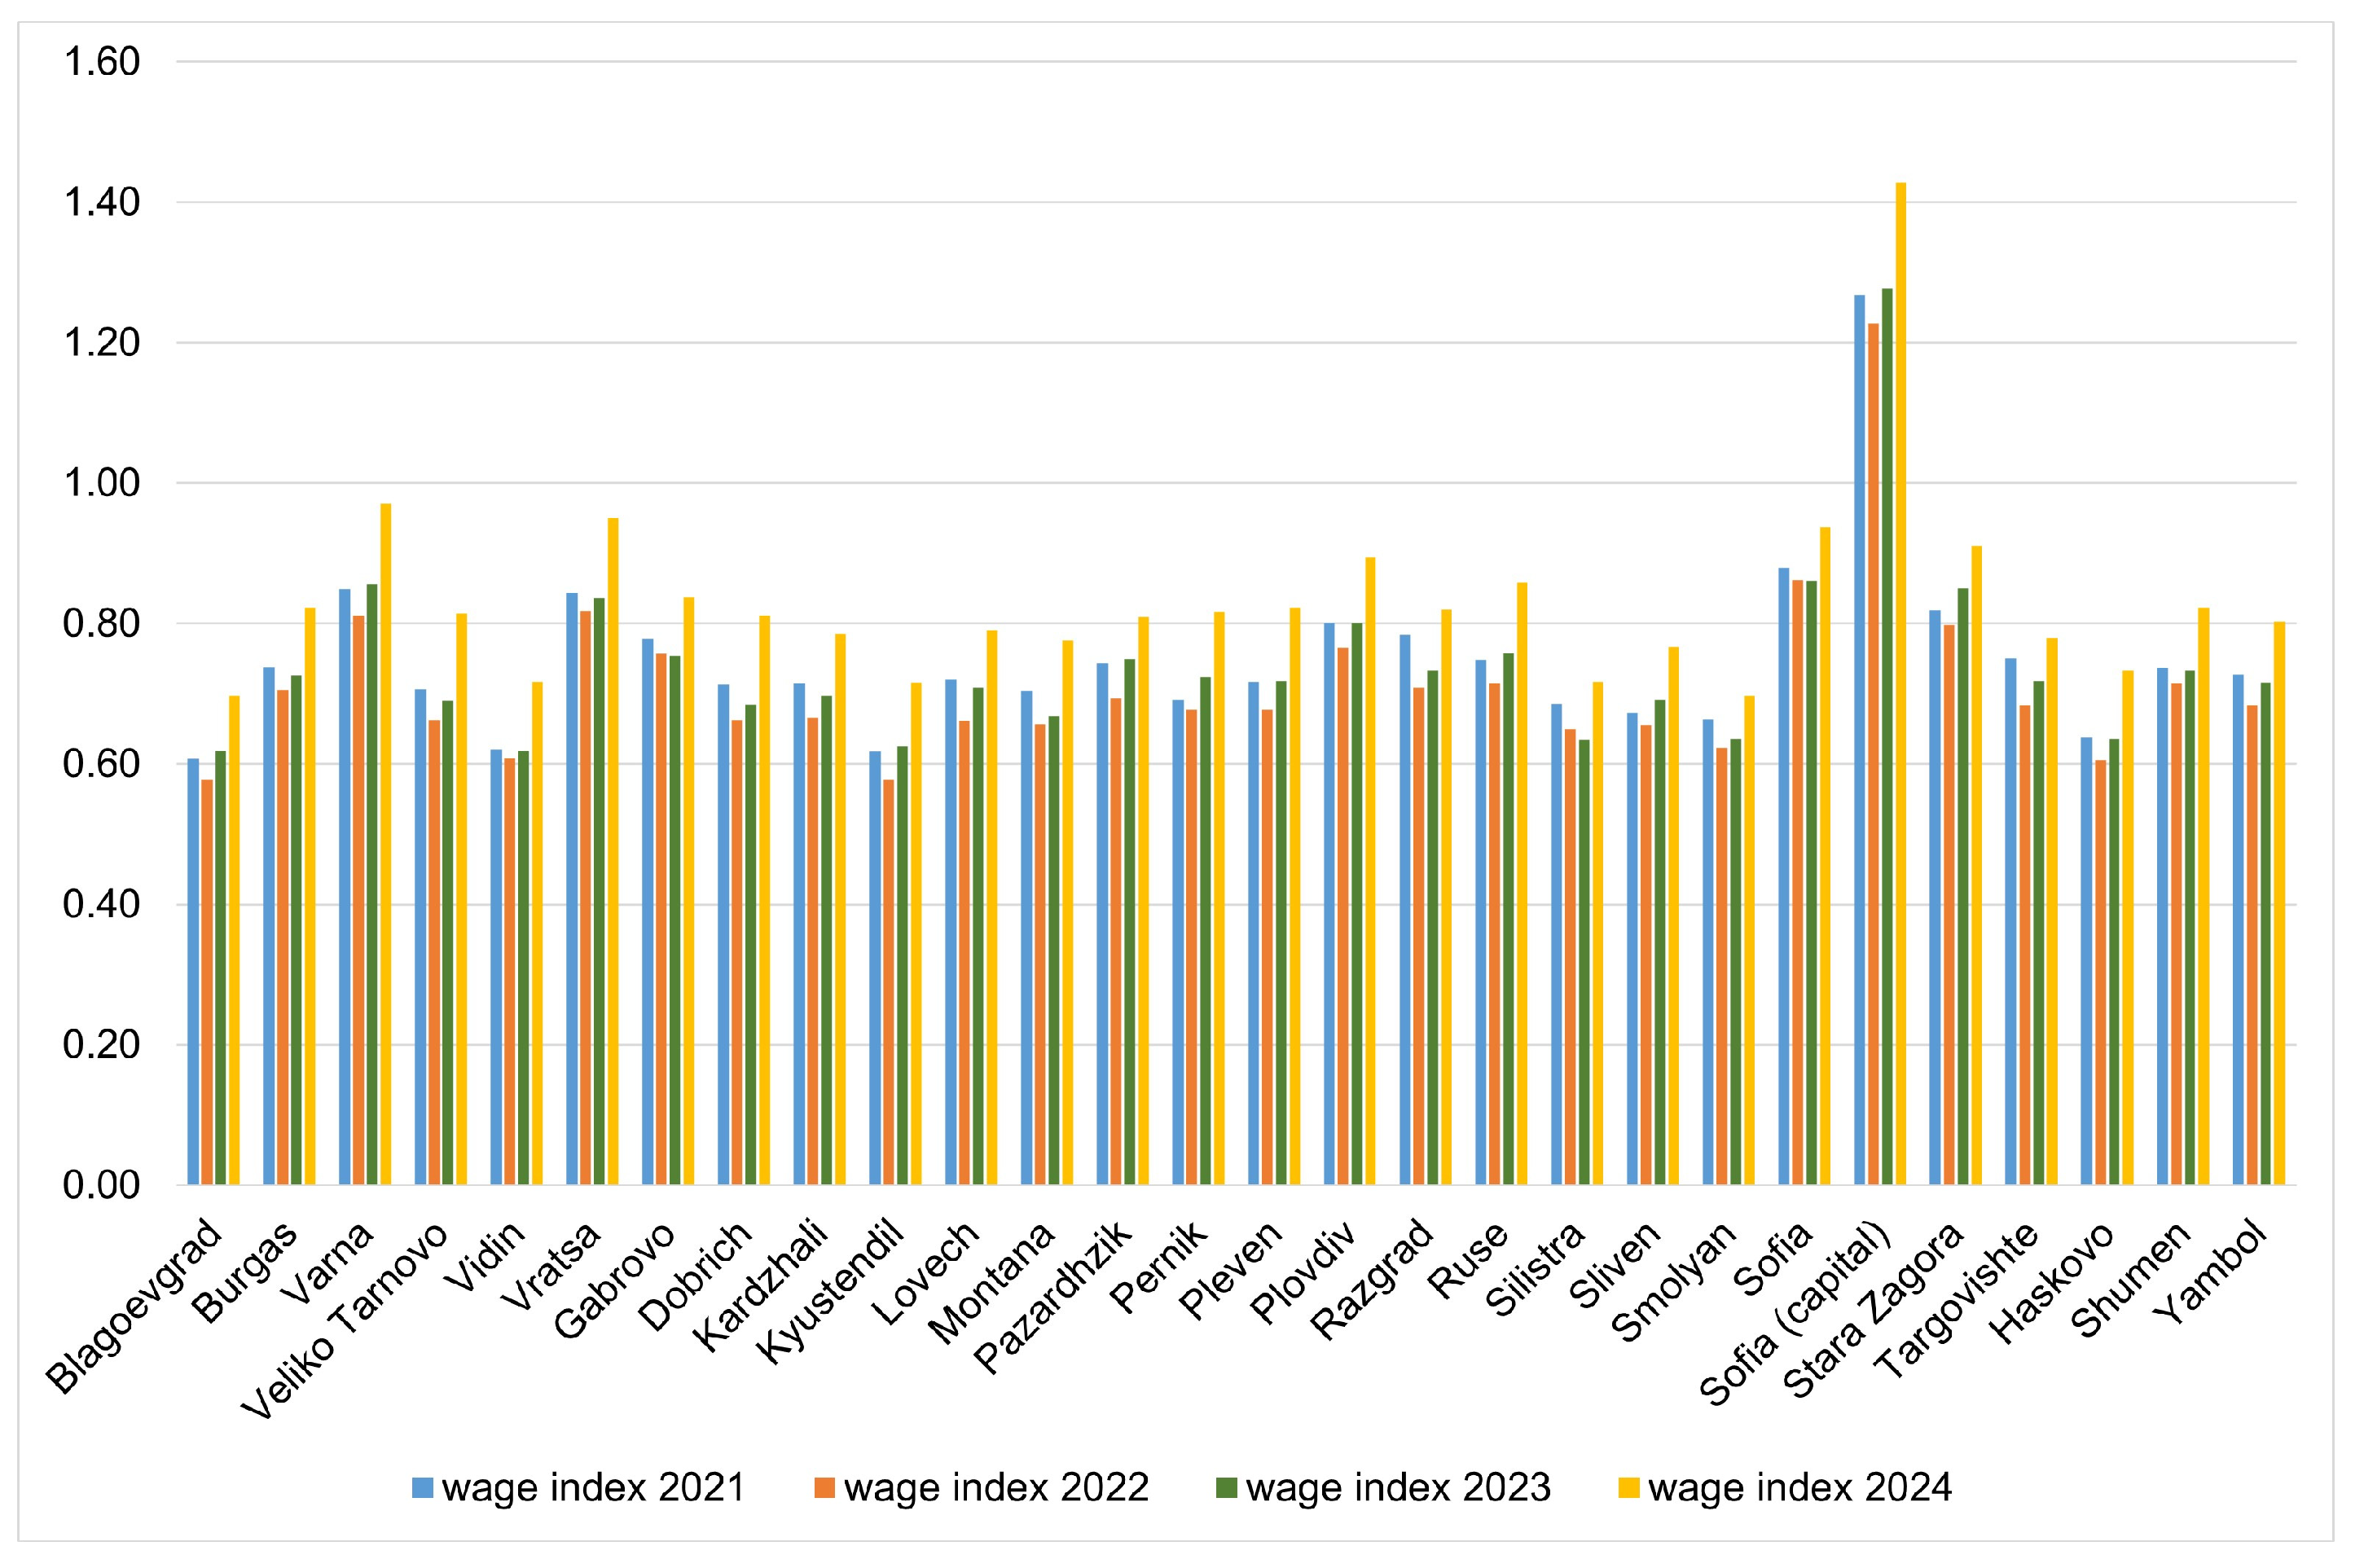
Figure 7 highlights even stronger territorial disparities in income levels than those observed for employment and unemployment.
Figure 7.
Regional disparities in wage levels across Bulgarian districts (2021–2024) (Source: authors, based on NSI data for the 2021–2024 period).
Sofia (capital) stands out as a clear outlier, with the wage index increasing from approximately 1.27 in 2021 to over 1.40 in 2024. This indicates that average wages in the capital are more than 40% higher than the national average in 2024, reflecting the concentration of high-value-added economic activities, administrative functions, financial services, and knowledge-intensive industries. Other relatively well-performing districts include Varna, Sofia, Stara Zagora, and Vratsa. However, none of these districts approaches the wage levels observed in Sofia.
The lowest wage index values are recorded in Blagoevgrad, Vidin, Kyustendil, Smolyan, and Silistra. These districts remain considerably below the national average despite moderate improvements over time.
An important observation is that many districts display relatively satisfactory employment rates while maintaining comparatively low wage levels (Figure 3 and Figure 7). This suggests that employment alone does not guarantee favourable living standards or economic well-being.
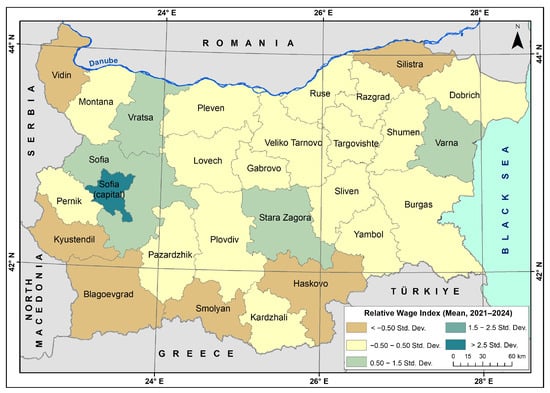
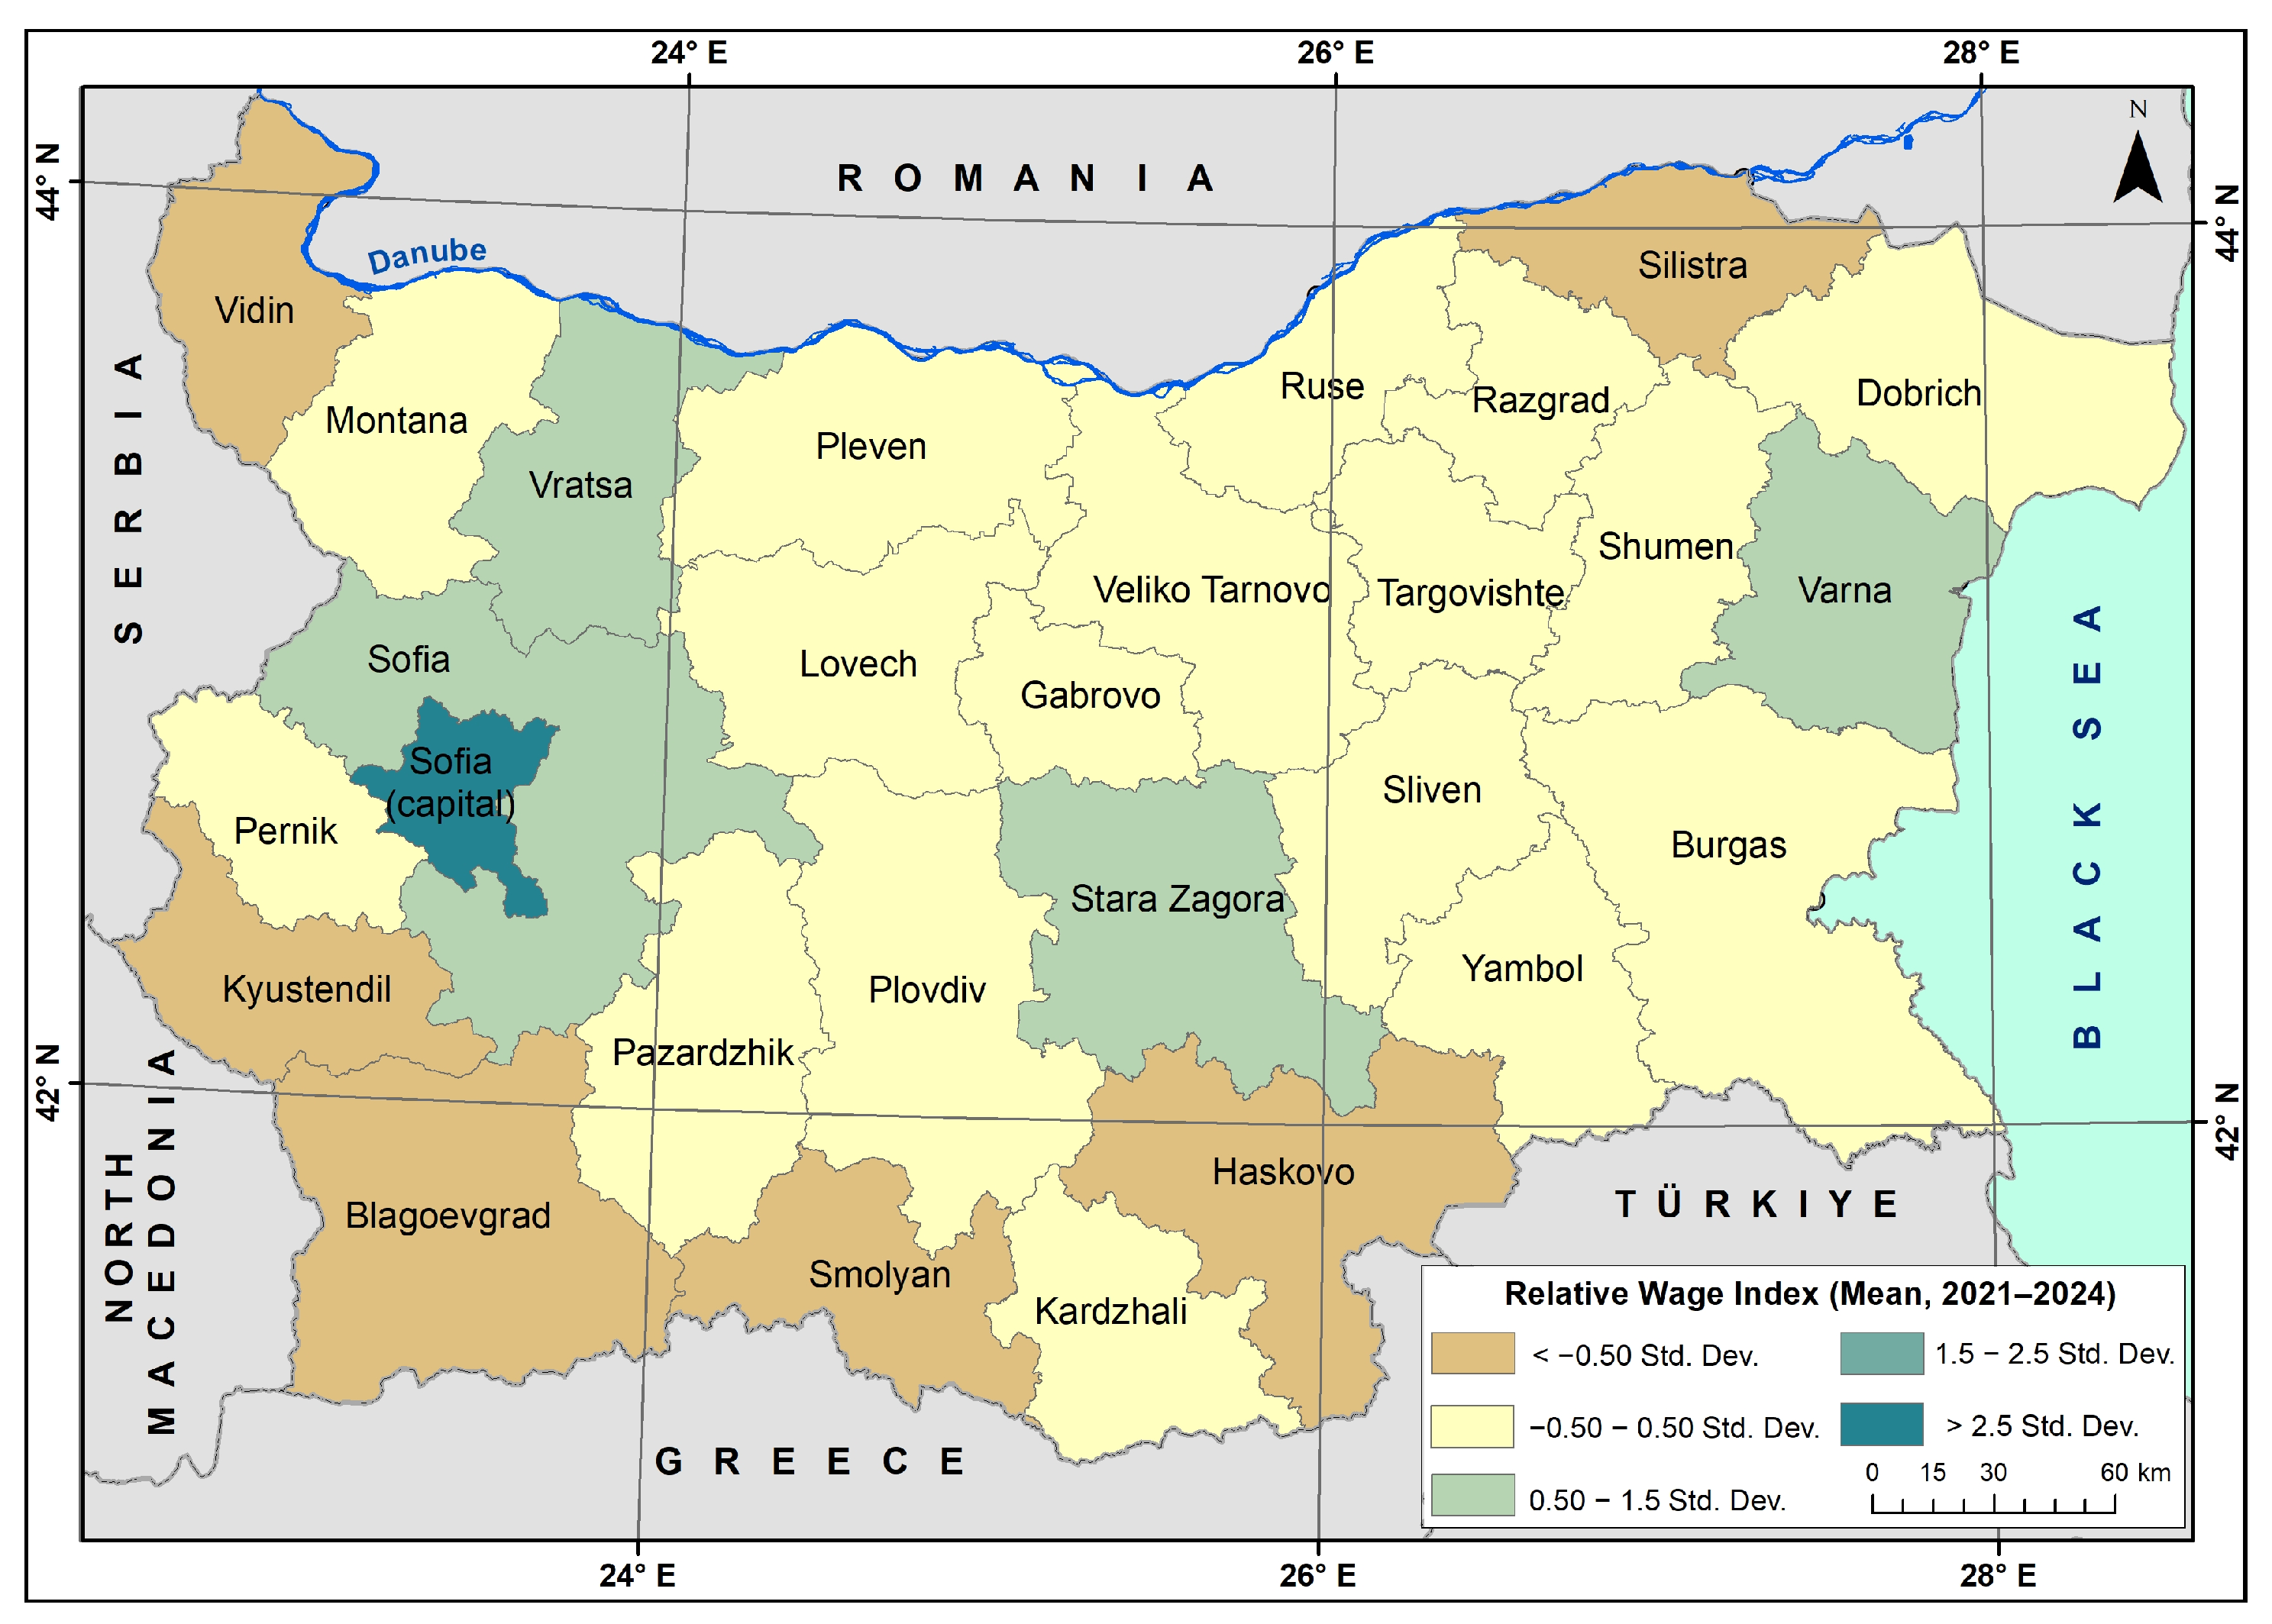
The observed temporal patterns are complemented by an analysis of the average relative wage index for the period 2021–2024, which highlights the spatial concentration of higher and lower wage levels across Bulgarian districts.
For the period 2021–2024, the spatial distribution of the average relative wage index reveals a clear spatial differentiation (Figure 8). The Sofia (capital) district stands out with the highest value relative to the national average, confirming its role as the major country’s economic hub and leading generator of labour incomes (mean value of RWI is 1.3). Other districts that show a comparatively higher wage index (mean value of RWI is between 0.84 and 0.86) include the Sofia district (which benefits from the capital neighbourhood and agglomeration effect); Varna (where economic activities benefit from Black Sea access and support diversification of the service sector); Vratsa (where the large share of the workforce is mainly employed in the Nuclear Power Plant “Kozloduy”); and Stara Zagora (whose economic development is supported by a large number of FDI and the energy sector).
Figure 8.
Relative wage index (mean, 2021–2024) (The maps are based on average values for the period 2021–2024. The classifications are standardised using z-scores. Data source: National Statistical Institute (NSI), processed by the authors).
At the same time, several peripheral regions—primarily in the southern part of the country (Blagoevgrad, Kyustendil, Smolyan, and Haskovo), as well as in the northern border regions (Vidin and Silistra)—are characterised by values below the national average (the mean value of RWI is between 0.63 and 0.67). These territories experience long-term unfavourable economic development, which may be associated with some disadvantages in their peripheral geographical location, lower investment interest, depopulation, and a shortage of a qualified workforce. The observed concentration of lower relative incomes in the economically less developed districts highlights the core–periphery inequalities in Bulgaria. The observed spatial variation in the index displays stable regional gaps in the labour income generation across the country’s districts.
The spatial patterns obtained from the descriptive analysis reveal that the indicators under consideration outline a clear picture of spatial inequalities across Bulgarian territory. These facts suggest the existence of spatial dependence and heterogeneity, which cannot be fully examined by univariate analysis alone. Therefore, this implies the application of a multidimensional analytical approach that allows for the simultaneous consideration of all three indicators and identifies typological groups of districts with similar characteristics.
3.2. Labour Market Cluster Typology
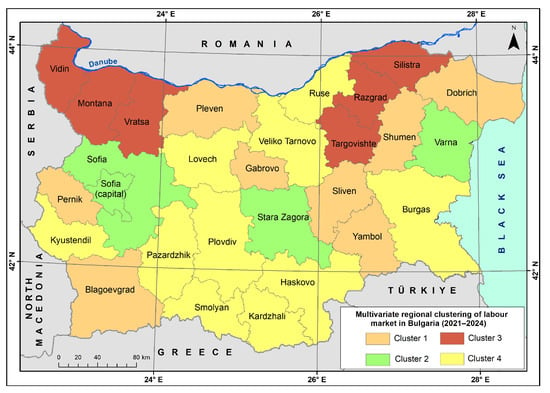
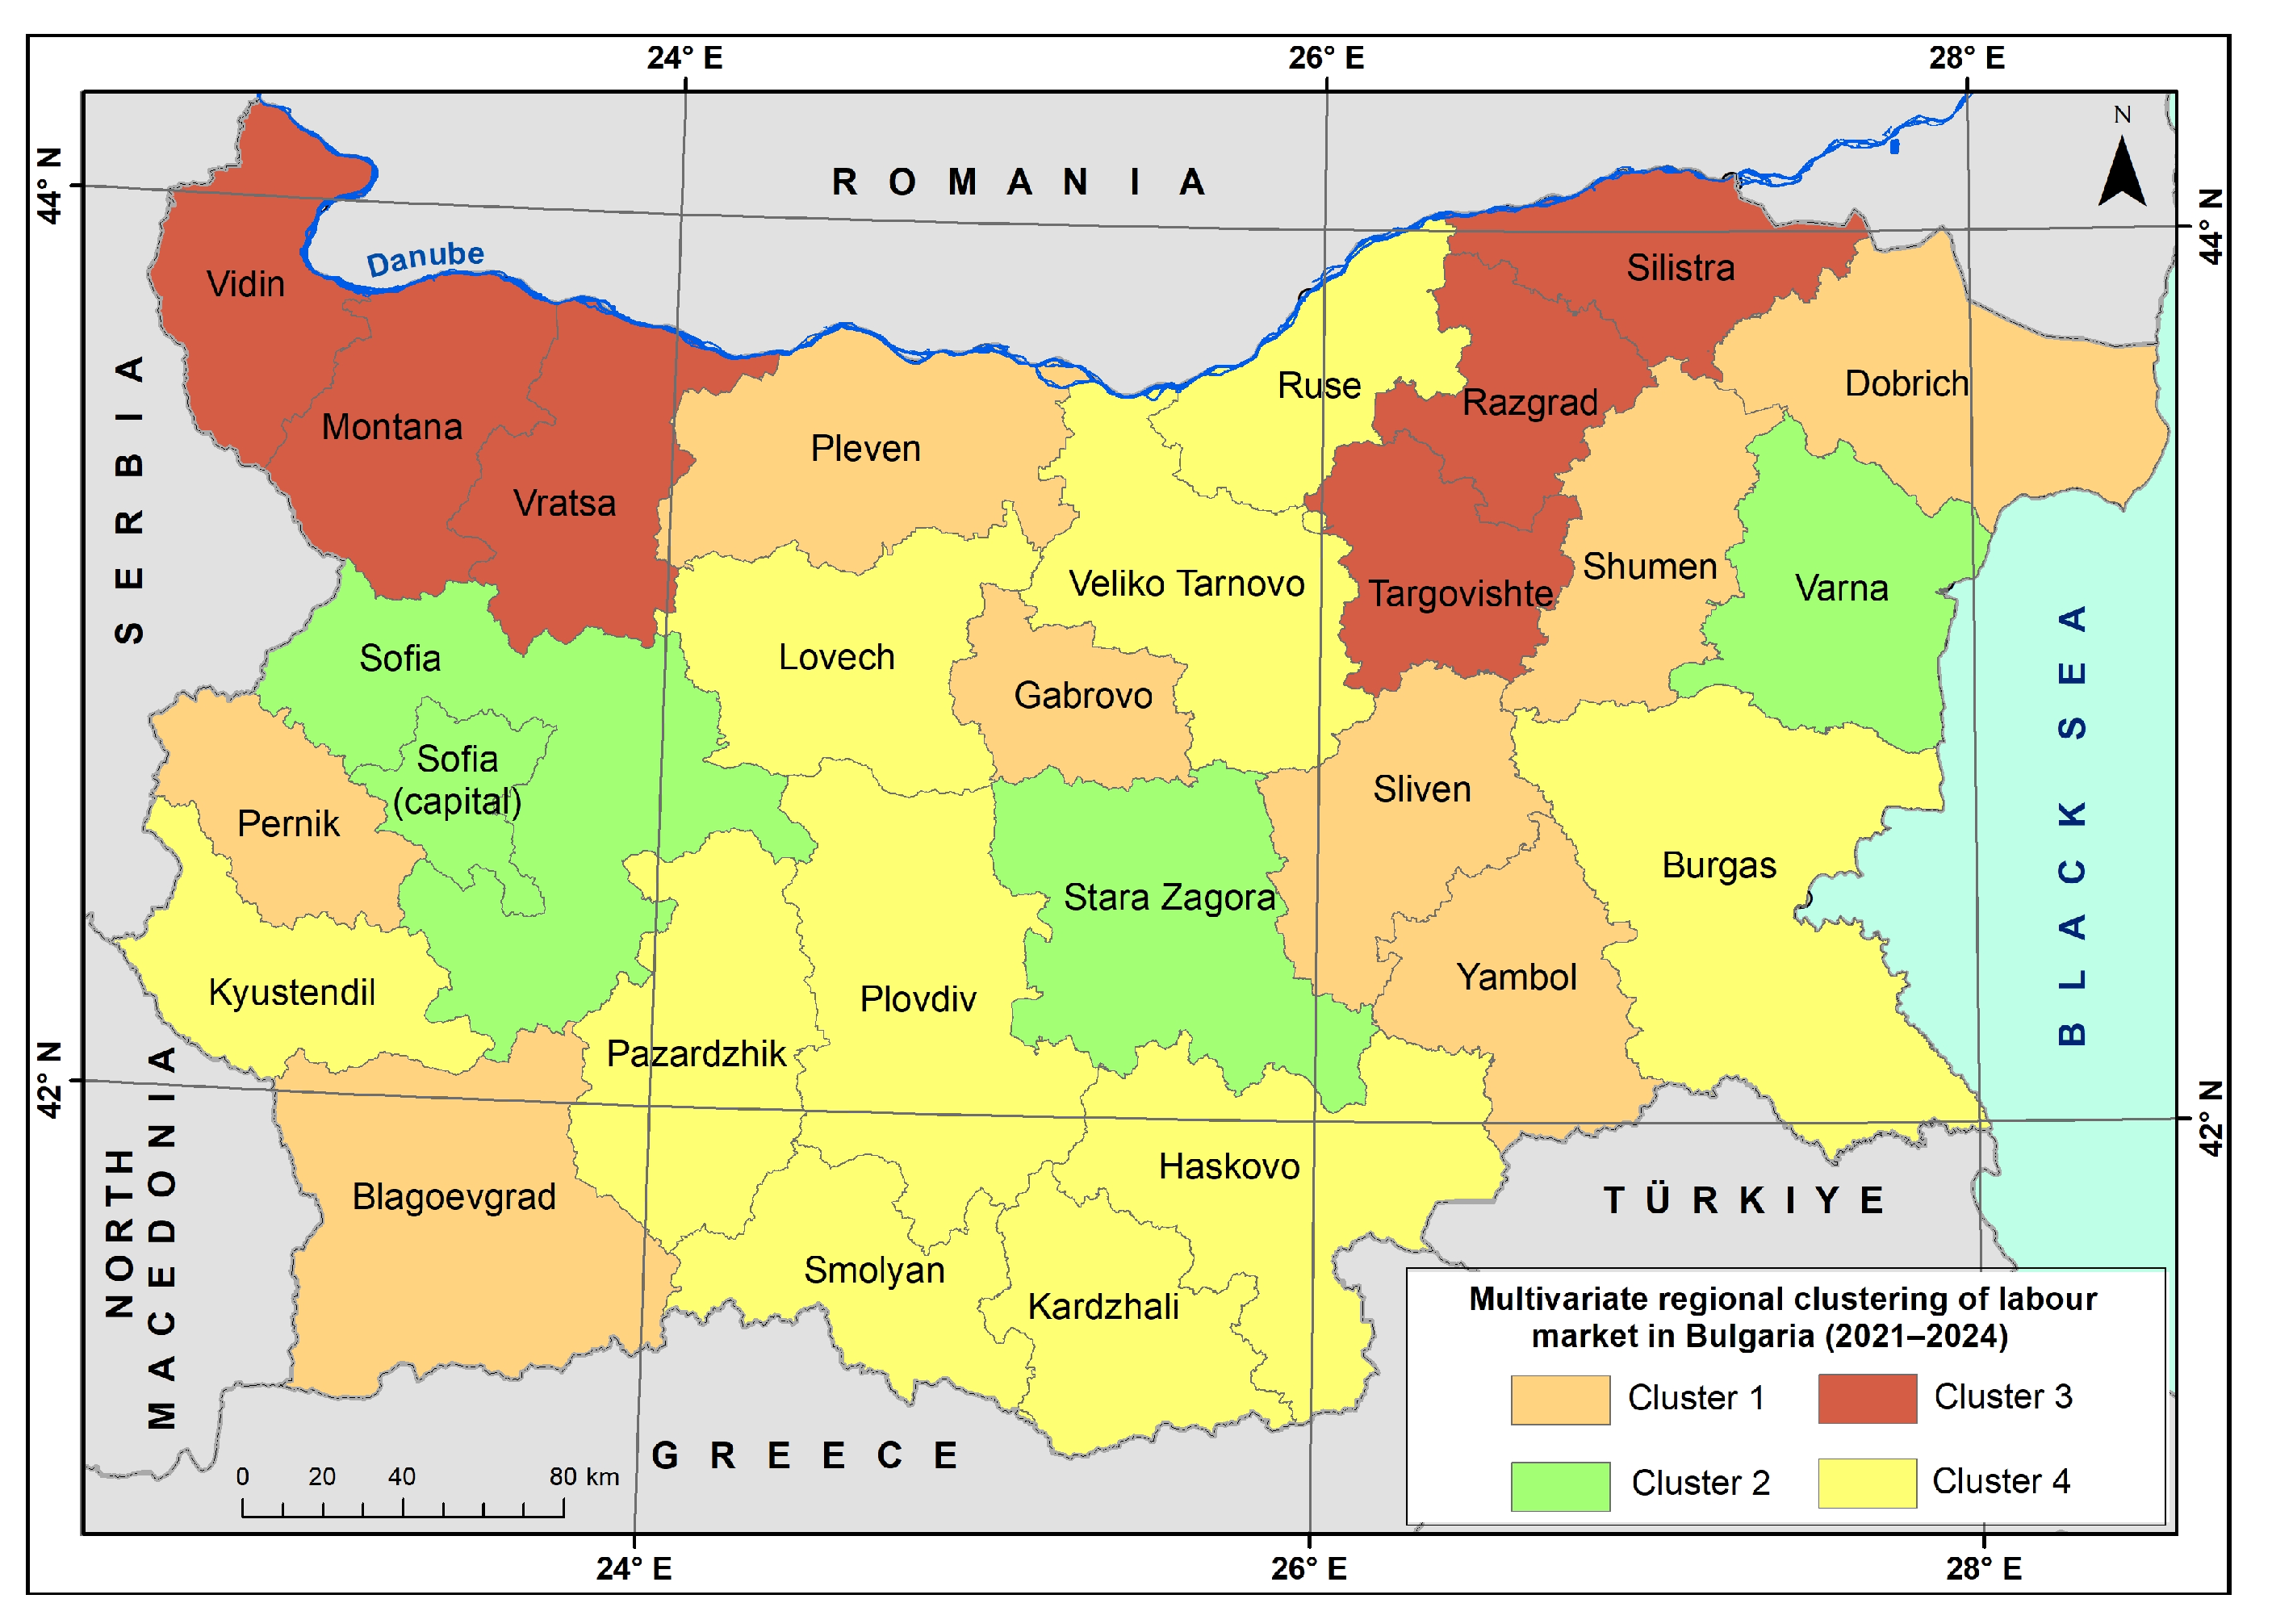
Applying multidimensional cluster analysis (K-means) based on the mean values of the relative wage index, unemployment, and employment rates for 2021–2024 results in the formation of four clusters. They reflect a distinct combination of the three indicators and show regional patterns of labour market similarity and differences, as well as spatial differentiation across the Bulgarian territory (Figure 9). The clusters are interpreted within the context of SDG8 and SDG10, allowing the identification of districts with resilient high employment and relative income convergence, employment–income mismatches, and vulnerable areas where labour exclusion reinforces territorial inequalities.
Figure 9.
Multivariate regional clustering of the labour market in Bulgaria (2021–2024) (Clusters derived using k-means multivariate clustering based on the unemployment rate, employment rate, and relative wage index. The maps are based on average values for the period 2021–2024. The classifications are standardised using z-scores. Data source: National Statistical Institute (NSI), processed by the authors).
Cluster 1, “Moderate Employment and Income Gap Regions” (SDG8 and SDG10 Challenge), consists of eight districts with a dispersed territorial distribution across the country and concentrates 19.8% of the national population [44]. It includes the Pernik, Blagoevgrad, Sliven, and Yambol districts in Southern Bulgaria, as well as Pleven, Gabrovo, Dobrich, and Shumen in the northern part of the country (Figure 9).
The cluster encompasses areas with a moderate socioeconomic profile, which positions them as a “transitional group” between resilient growth poles in Cluster 2 and disadvantaged and vulnerable districts in Cluster 3. The employment rate is close to the average for Bulgaria, but the wage index is lower due to the economic specialisation and demographic features of the labour force (Table 1).
Table 1.
Cluster profiles based on mean values of labour indicators (2021–2024).
On the one hand, the population decline and high demographic dependency ratio in the districts constrain the workforce supply, indicating the increasing need for social transfers to combat declining incomes and poverty among the population (Table S4, Supplementary Files). On the other hand, these districts have a higher share of the population with primary and lower levels of education (e.g., for Sliven, Dobrich, and Shumen, the share exceeded 22.3%), compared to the national average of 13.1% [45].
These districts show a concentration of labour-intensive industrial and service activities with relatively low added value. As a result, districts of Cluster 1 generate only 11.3% of the national GVA and have a limited contribution to Bulgaria’s economic output (Table S3, Supplementary Files). All these characteristics are linked to higher unemployment values (8.49%) than the national average (6.41%) and, together with moderately high income inequalities, contribute to the reinforcement of regional disparities, increase the at-risk-of-poverty rates, and threaten income adequacy [46,47,48] (2024).
Cluster 2, “High Employment and Income-advantaged Regions” (SDG8 leader and SDG10 challenge), includes four districts located in different parts of Bulgaria—Sofia (capital), Sofia, Stara Zagora, and Varna—and concentrates 34.9% of the national population [44] (2024).
The cluster is the most significant for the country’s economic output, as it generates almost 59% of national GVA [49] (2024). The spatial distribution shows a high concentration of economic wealth in the most powerful economic hub in Bulgaria—the capital, Sofia—as well as in the other major centres such as Varna and Stara Zagora. The effects of the ageing population are partly offset by the intensive influx of immigrants from other parts of the country, attracted by higher salaries, diverse job opportunities, and a better quality of life (Table S4, Supplementary Files).
As a result, Cluster 2 differs substantially from the other clusters, as it has the lowest unemployment (1.96%) and the highest employment rate (75.3%), compared to national levels. The districts of Sofia (capital) and Sofia are cores of relatively sustainable labour markets due to the concentration of working-age population, FDI, high-tech, finance and outsourcing services, trade, construction, tourism, and the largest share of public sector employment.
At the same time, the cluster demonstrates the highest values of the wage index among other clusters, reflecting higher value-added economic activities and more productive labour markets. However, the wage index remains slightly below the national benchmark, except for the capital, and this pattern is consistent with the so-called “metropolitan inequality effect,” whereby rapid economic growth and high-income sectors coexist with substantial income disparities within the same territory. In metropolitan regions such as Sofia (capital), the concentration of highly paid activities in finance, information technologies, and advanced business services is accompanied by lower-paid employment in retail trade, tourism, and other labour-intensive sectors.
Therefore, the cluster presents the high mean values of the Gini index (36.4), and the share of the population living below the district poverty line exceeds 20% (mean cluster values for 2024) [48] (2024) (Table S3, Supplementary Files). These findings indicate that strong economic and employment performance coexist with significant income dispersion, contributing to socioeconomic polarisation and increasing the poverty rates.
Cluster 3, “Labour-Market Disadvantaged and Inequality-Reinforcing Regions” (SDG8 and SDG10 high-risk territories), includes six districts: Vidin, Montana, Vratsa, Targovishte, Razgrad, and Silistra (Figure 9). They are spatially concentrated in the northern part of Bulgaria and constitute the smallest cluster in terms of population size (9.6% of the total) [44] (2024).
Cluster 3 presents the most adverse profile according to labour-market indicators. It has the highest unemployment rates and the lowest employment rates, but the value of the mean wage index is close to those of Clusters 1 and 4 (Table 1). This pattern occurs due to the specific sectoral specialisation, which creates high wages but limited workforce capacity (e.g., for Vratsa, it is nuclear energy production, and for Razgrad, it is the pharmaceutical industry). However, the cluster contributes only 5.95% of national GVA and reveals its limited role in the national economic output [49] (2024) (Table S3, Supplementary Files). Additionally, this cluster is associated with a high mean value of the Gini index (35.8), which reflects the possibility of a continuous widening of the income disparities [48] (2024).
The demographic decline, continuous population ageing [50], peripheral geographic location, and the long-standing lag in economic development, compared to the rest of the country, converted these districts into vulnerable labour market territories (Tables S3 and S4, Supplementary Files). Therefore, they may be interpreted as territories with a higher risk of exposure to poverty, where labour market structural problems are most profound, contributing to the formation of the low-income trap.
Cluster 4, “Employment-intensive and income-constrained regions” (Decent Work Deficit under SDG8), comprises ten districts: Kyustendil, Lovech, Veliko Tarnovo, Ruse, Burgas, Haskovo, Kardzhali, Plovdiv, Smolyan, and Pazardzhik. Like Cluster 1, the cluster has a geographically dispersed distribution across the country and encompasses 35.7% of the total national population, making it the largest cluster in demographic terms [44] (2024). Economically, these districts generate more than 23.8% of the national GVA, ranking second after Cluster 2 [49] (2024) (Table S3, Supplementary Files).
Cluster 4 includes several important economic centres in Bulgaria, such as Plovdiv, Burgas, and Ruse, together with medium-sized regional centres including Pazardzhik, Veliko Tarnovo, Haskovo, and Kardzhali. As a result, the cluster demonstrates relatively favourable labour-market performance, reflected in moderately higher employment levels and unemployment rates below the national average. This constitutes the principal difference compared to Cluster 1.
However, despite the relatively favourable employment conditions, the relative wage index remains below the national average, reflecting structural mismatches between labour income and labour-market participation (Table 1). The observed discrepancy between employment intensity and wage levels may be associated with the concentration of labour-intensive economic activities, including manufacturing, logistics, tourism, and low-value-added services. In several districts, particularly Burgas and Plovdiv, economic activity generates substantial employment opportunities but does not necessarily translate into proportional wage growth due to lower productivity segments and relatively limited value-added generation. This pattern corresponds to the broader phenomenon of the “working poor”, where labour participation alone does not guarantee adequate income levels and social resilience.
Although these regions demonstrate relatively stable labour-market conditions, they remain socially and economically vulnerable (Tables S3 and S4, Supplementary files). The mean value of the Gini index is moderate (31.9), while the share of the population living below the district poverty line reaches 16.9%, which is lower than the national average (21.7%) [48] (2024). Nevertheless, the poverty risk remains dependent on future economic development trends, labour-market transformation, and the effectiveness of social-transfer mechanisms.
The territorial distribution of the identified clusters reveals relatively stable spatial groupings of districts characterised by similar labour-market profiles and socioeconomic conditions. Overall, the cluster analysis highlights persistent regional disparities and the centre–periphery structure of the Bulgarian labour market. To further evaluate the role of spatial proximity and local territorial interactions, the analysis is complemented by the application of Local Indicators of Spatial Association (Local Moran’s I).
3.3. Spatial Autocorrelation of Labour-Market Indicators (Local Moran’s I—LISA)
Following the cluster typology, a spatial autocorrelation analysis of the three labour-market indicators was conducted to examine whether districts with similar labour-market characteristics are spatially concentrated or randomly distributed across the national territory. Using Local Moran’s I (LISA), statistically significant spatial clusters (High–High and Low–Low) and spatial outliers (High–Low and Low–High) were identified, revealing whether regional labour-market disparities in Bulgaria are territorially reinforced by neighbouring districts.
The statistically significant Local Moran’s I results, including cluster and outlier types, z-scores, and p-values, are presented in Table 2.
Table 2.
Statistically significant Local Moran’s I (LISA) results for labour-market indicators in Bulgarian NUTS 3 districts (2021–2024).
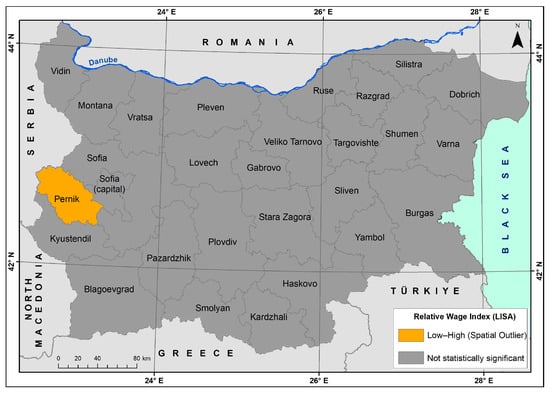
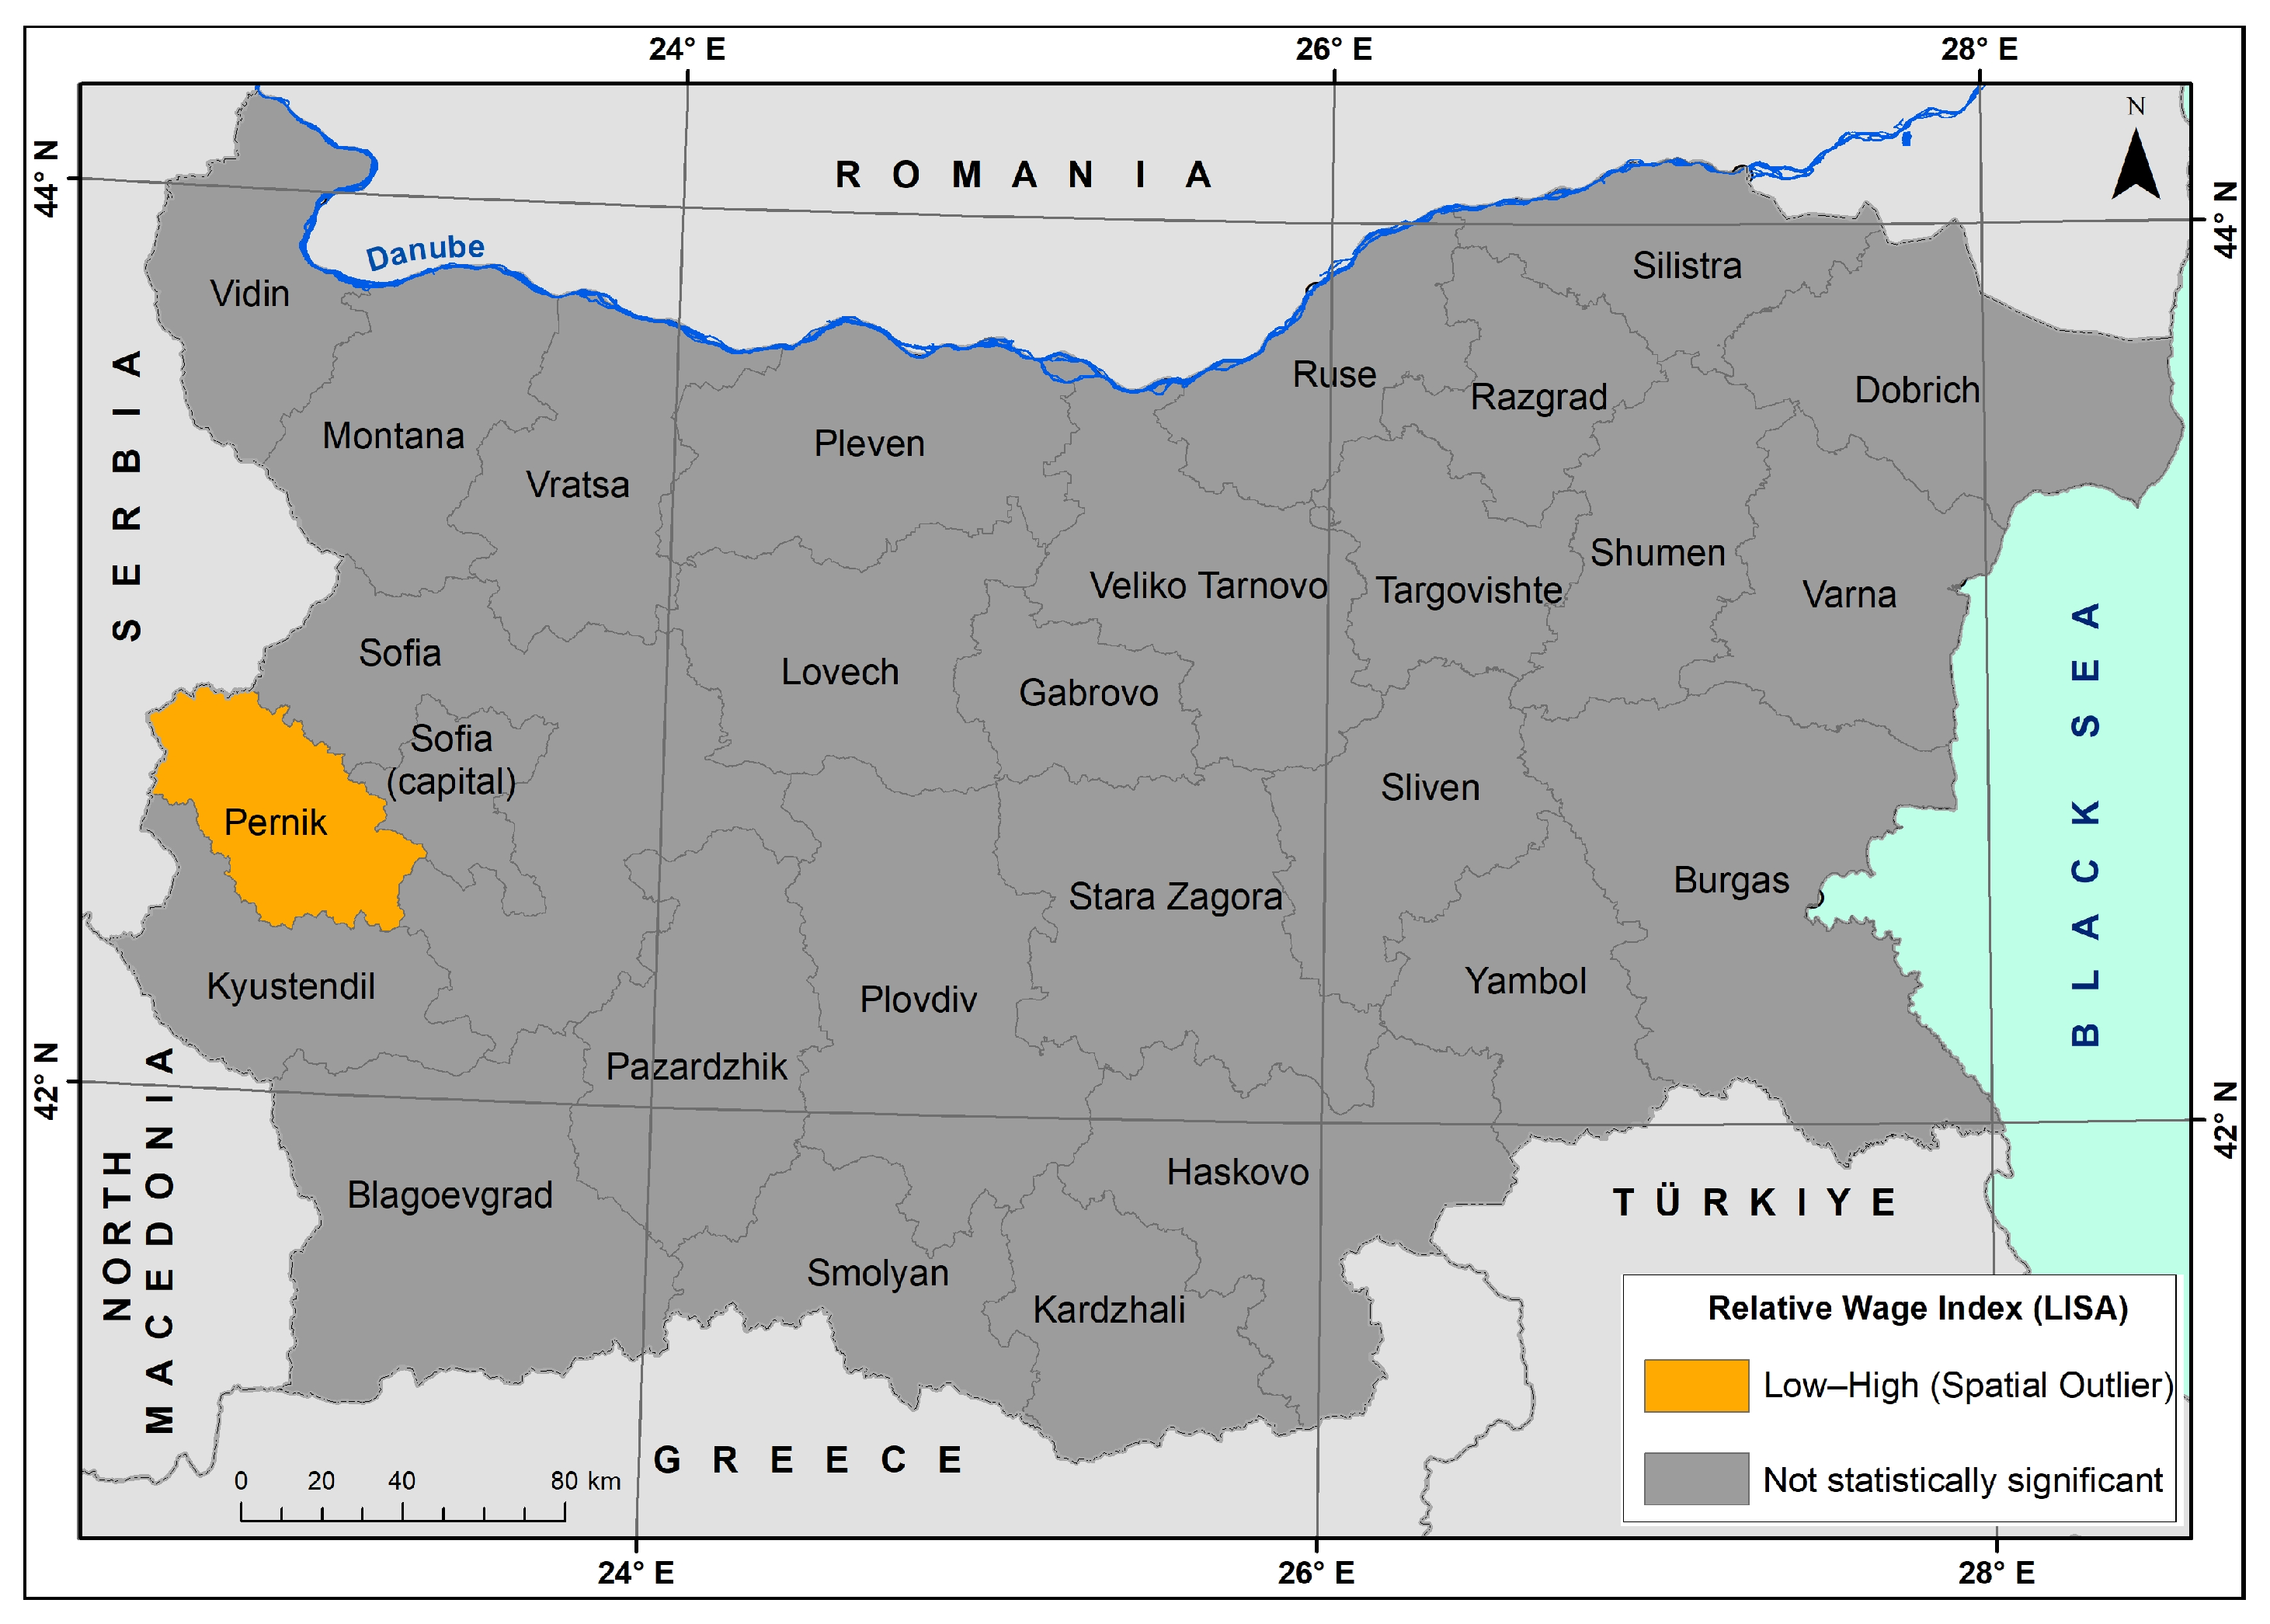
The LISA map of the relative wage index reveals limited but statistically significant local spatial dependence (Figure 10). The district of Pernik is identified as a Low–High spatial outlier, characterised by relatively lower wage levels compared to neighbouring districts, particularly due to the strong influence of Sofia, the capital, as the dominant economic centre in Bulgaria. This pattern suggests substantial territorial disparities between the capital and adjacent economically weaker regions.
Figure 10.
Local Indicators of Spatial Association (LISA) for relative wage index (mean, 2021–2024) (The analysis was performed using Local Moran’s I. Statistical significance was assessed at p < 0.05).
More generally, the absence of significant High–High wage clusters indicates that wage generation in Bulgaria is spatially fragmented and concentrated in a limited number of economically dominant urban centres rather than territorially continuous regional systems. The dispersed geographical distribution of these growth poles further suggests a relatively hierarchical urban structure of income generation.
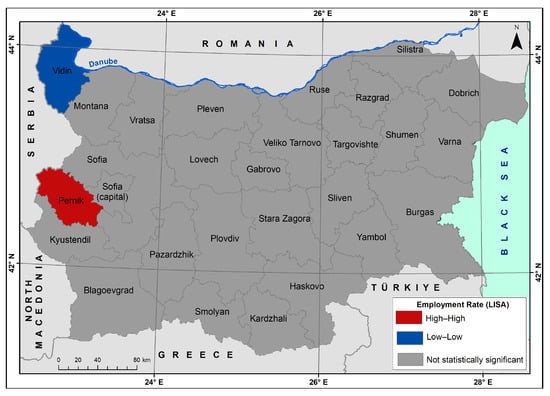
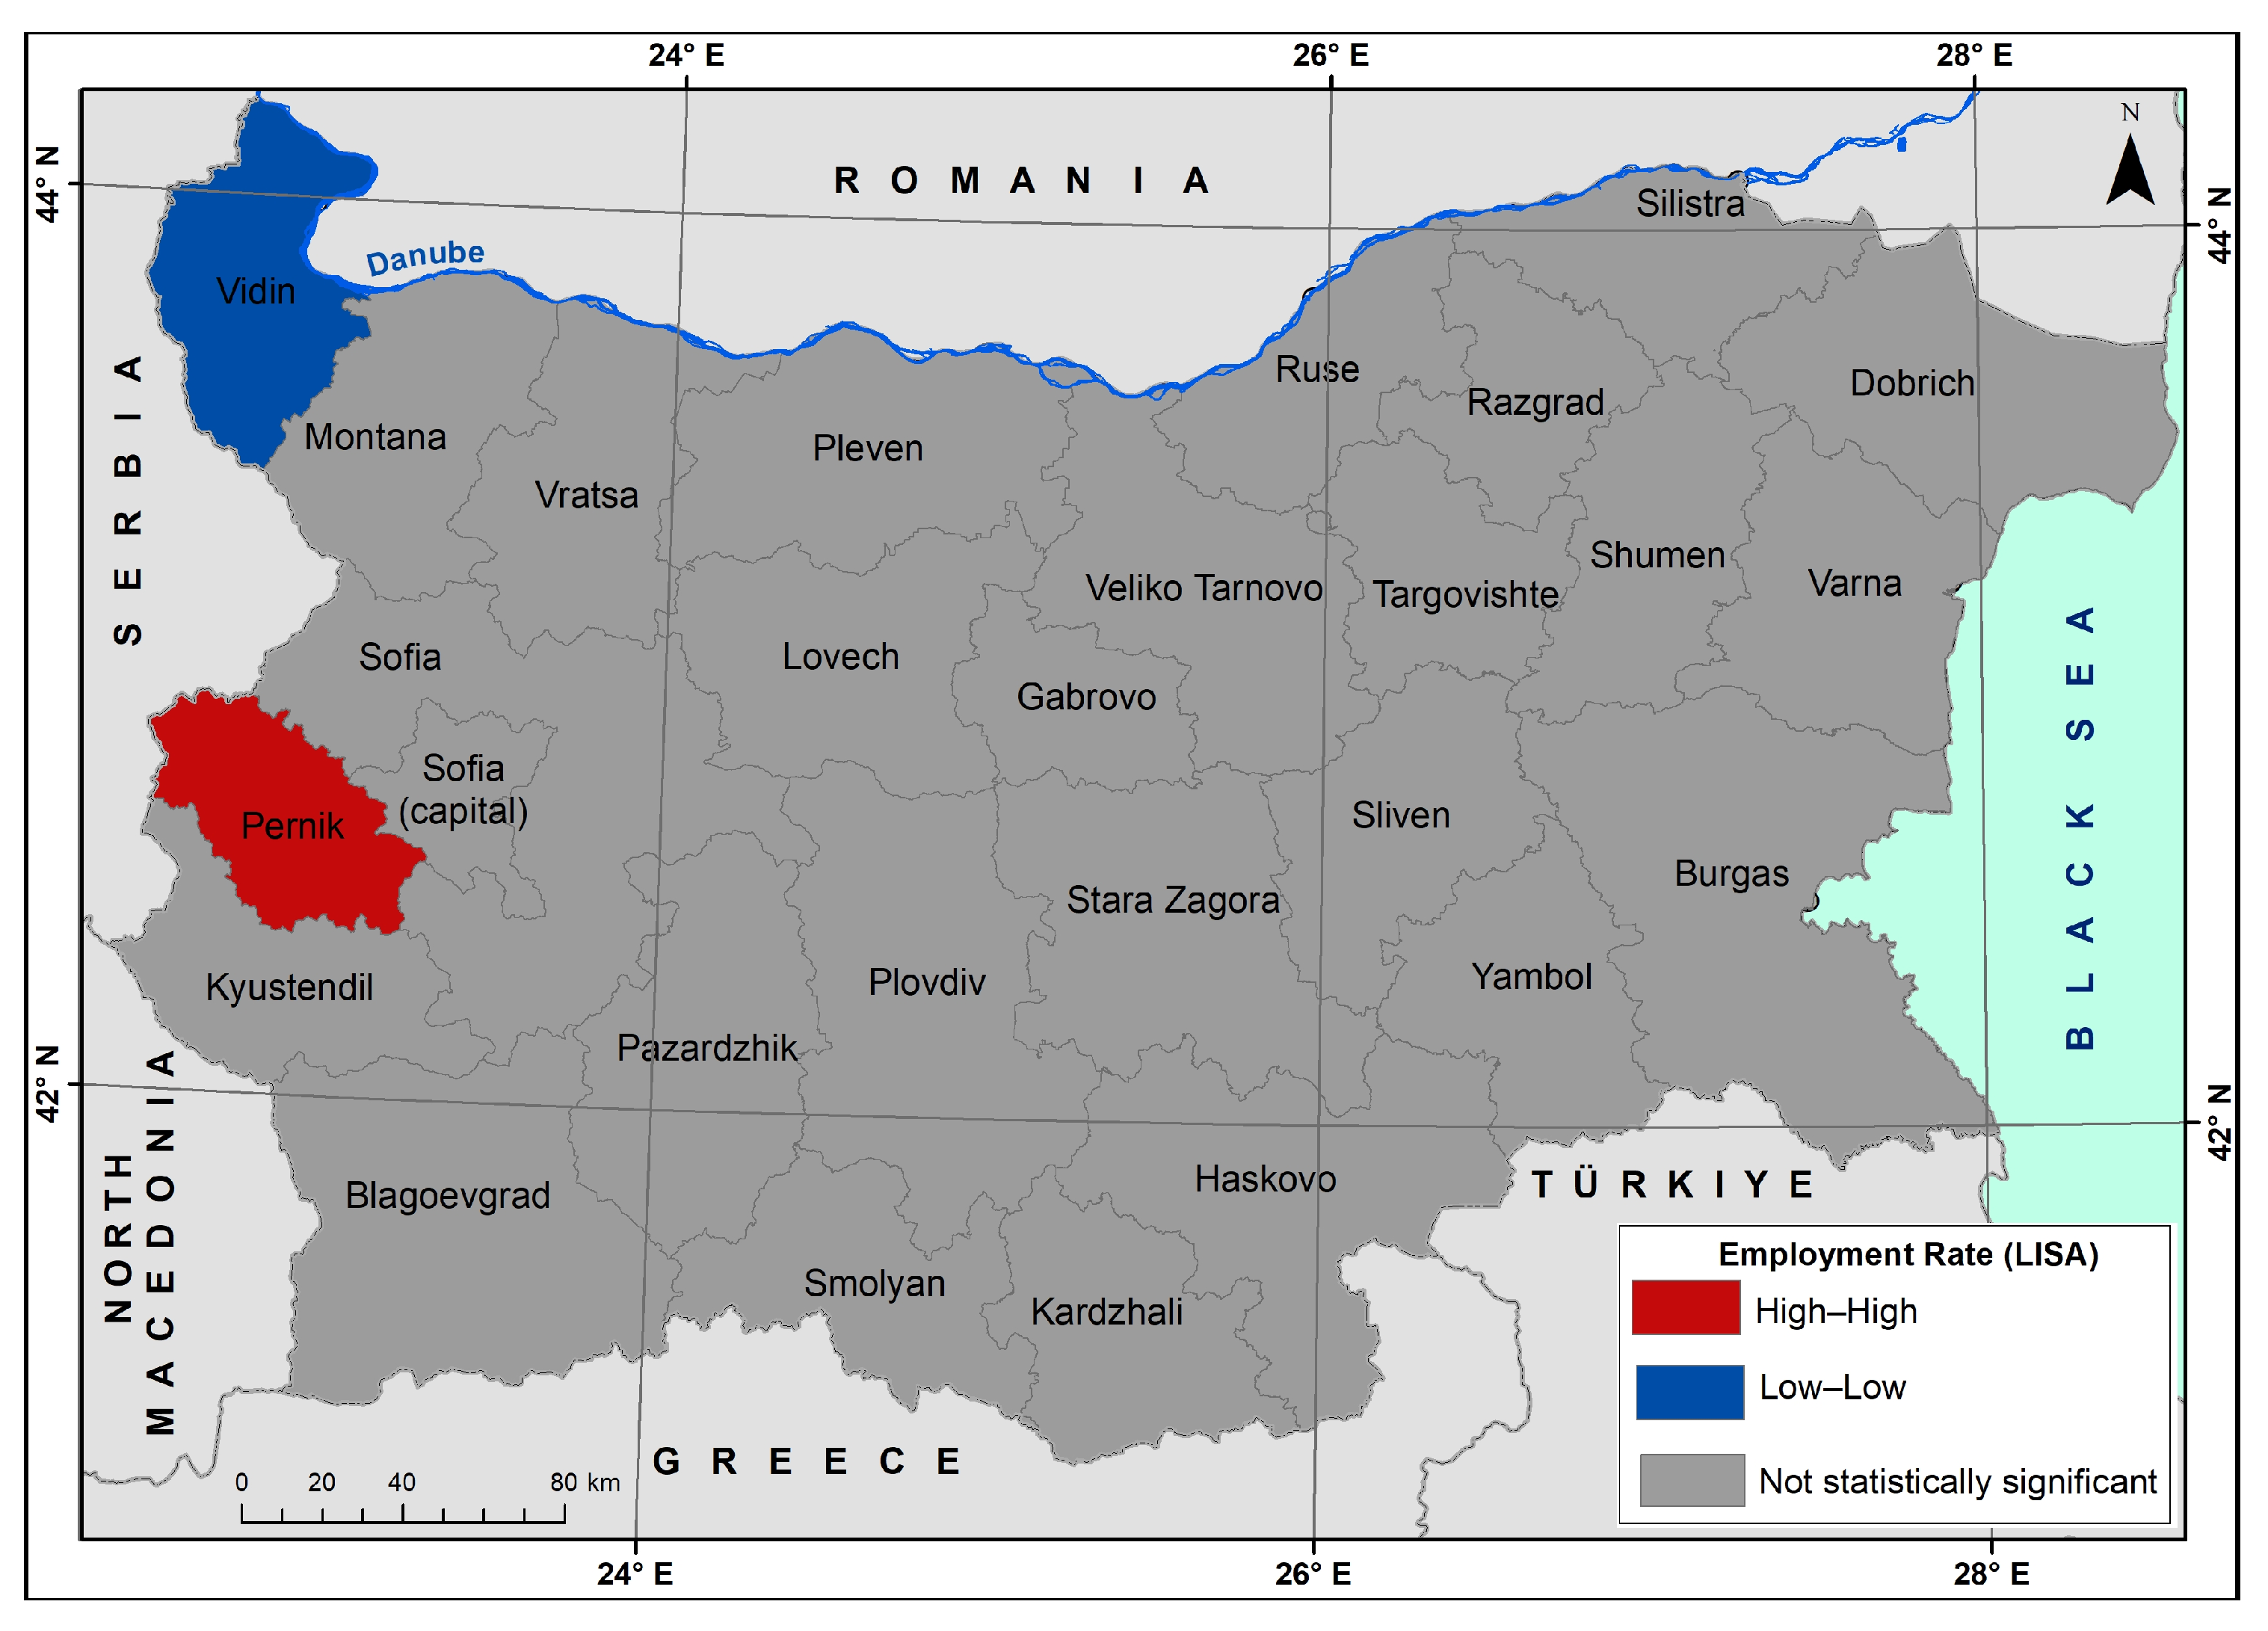
The LISA map for the employment rate reveals a limited number of statistically significant local spatial dependencies (Figure 11). A High–High cluster is observed in the Pernik district, indicating relatively high employment levels surrounded by neighbouring districts with similarly favourable labour-market conditions. This pattern may be associated with the proximity to Sofia, the capital, and the influence of commuting and agglomeration effects. In contrast, the Vidin district is identified as a Low–Low cluster, characterised by lower employment levels within a broader regional environment with similarly unfavourable labour-market conditions. This cluster reflects long-standing demographic and economic challenges concentrated in Northwestern Bulgaria.
Figure 11.
Local Indicators of Spatial Association (LISA) for employment rate (mean, 2021–2024) (The analysis was performed using Local Moran’s I. Statistical significance was assessed at p < 0.05).
Overall, the employment-rate analysis suggests relatively weak spatial clustering, indicating that employment dynamics in Bulgaria are influenced predominantly by local labour-market conditions rather than broader regional spillover effects.
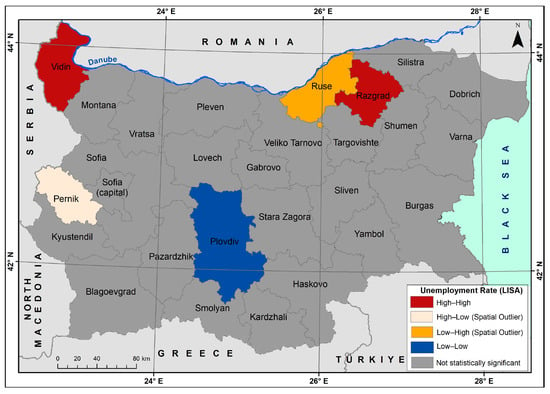
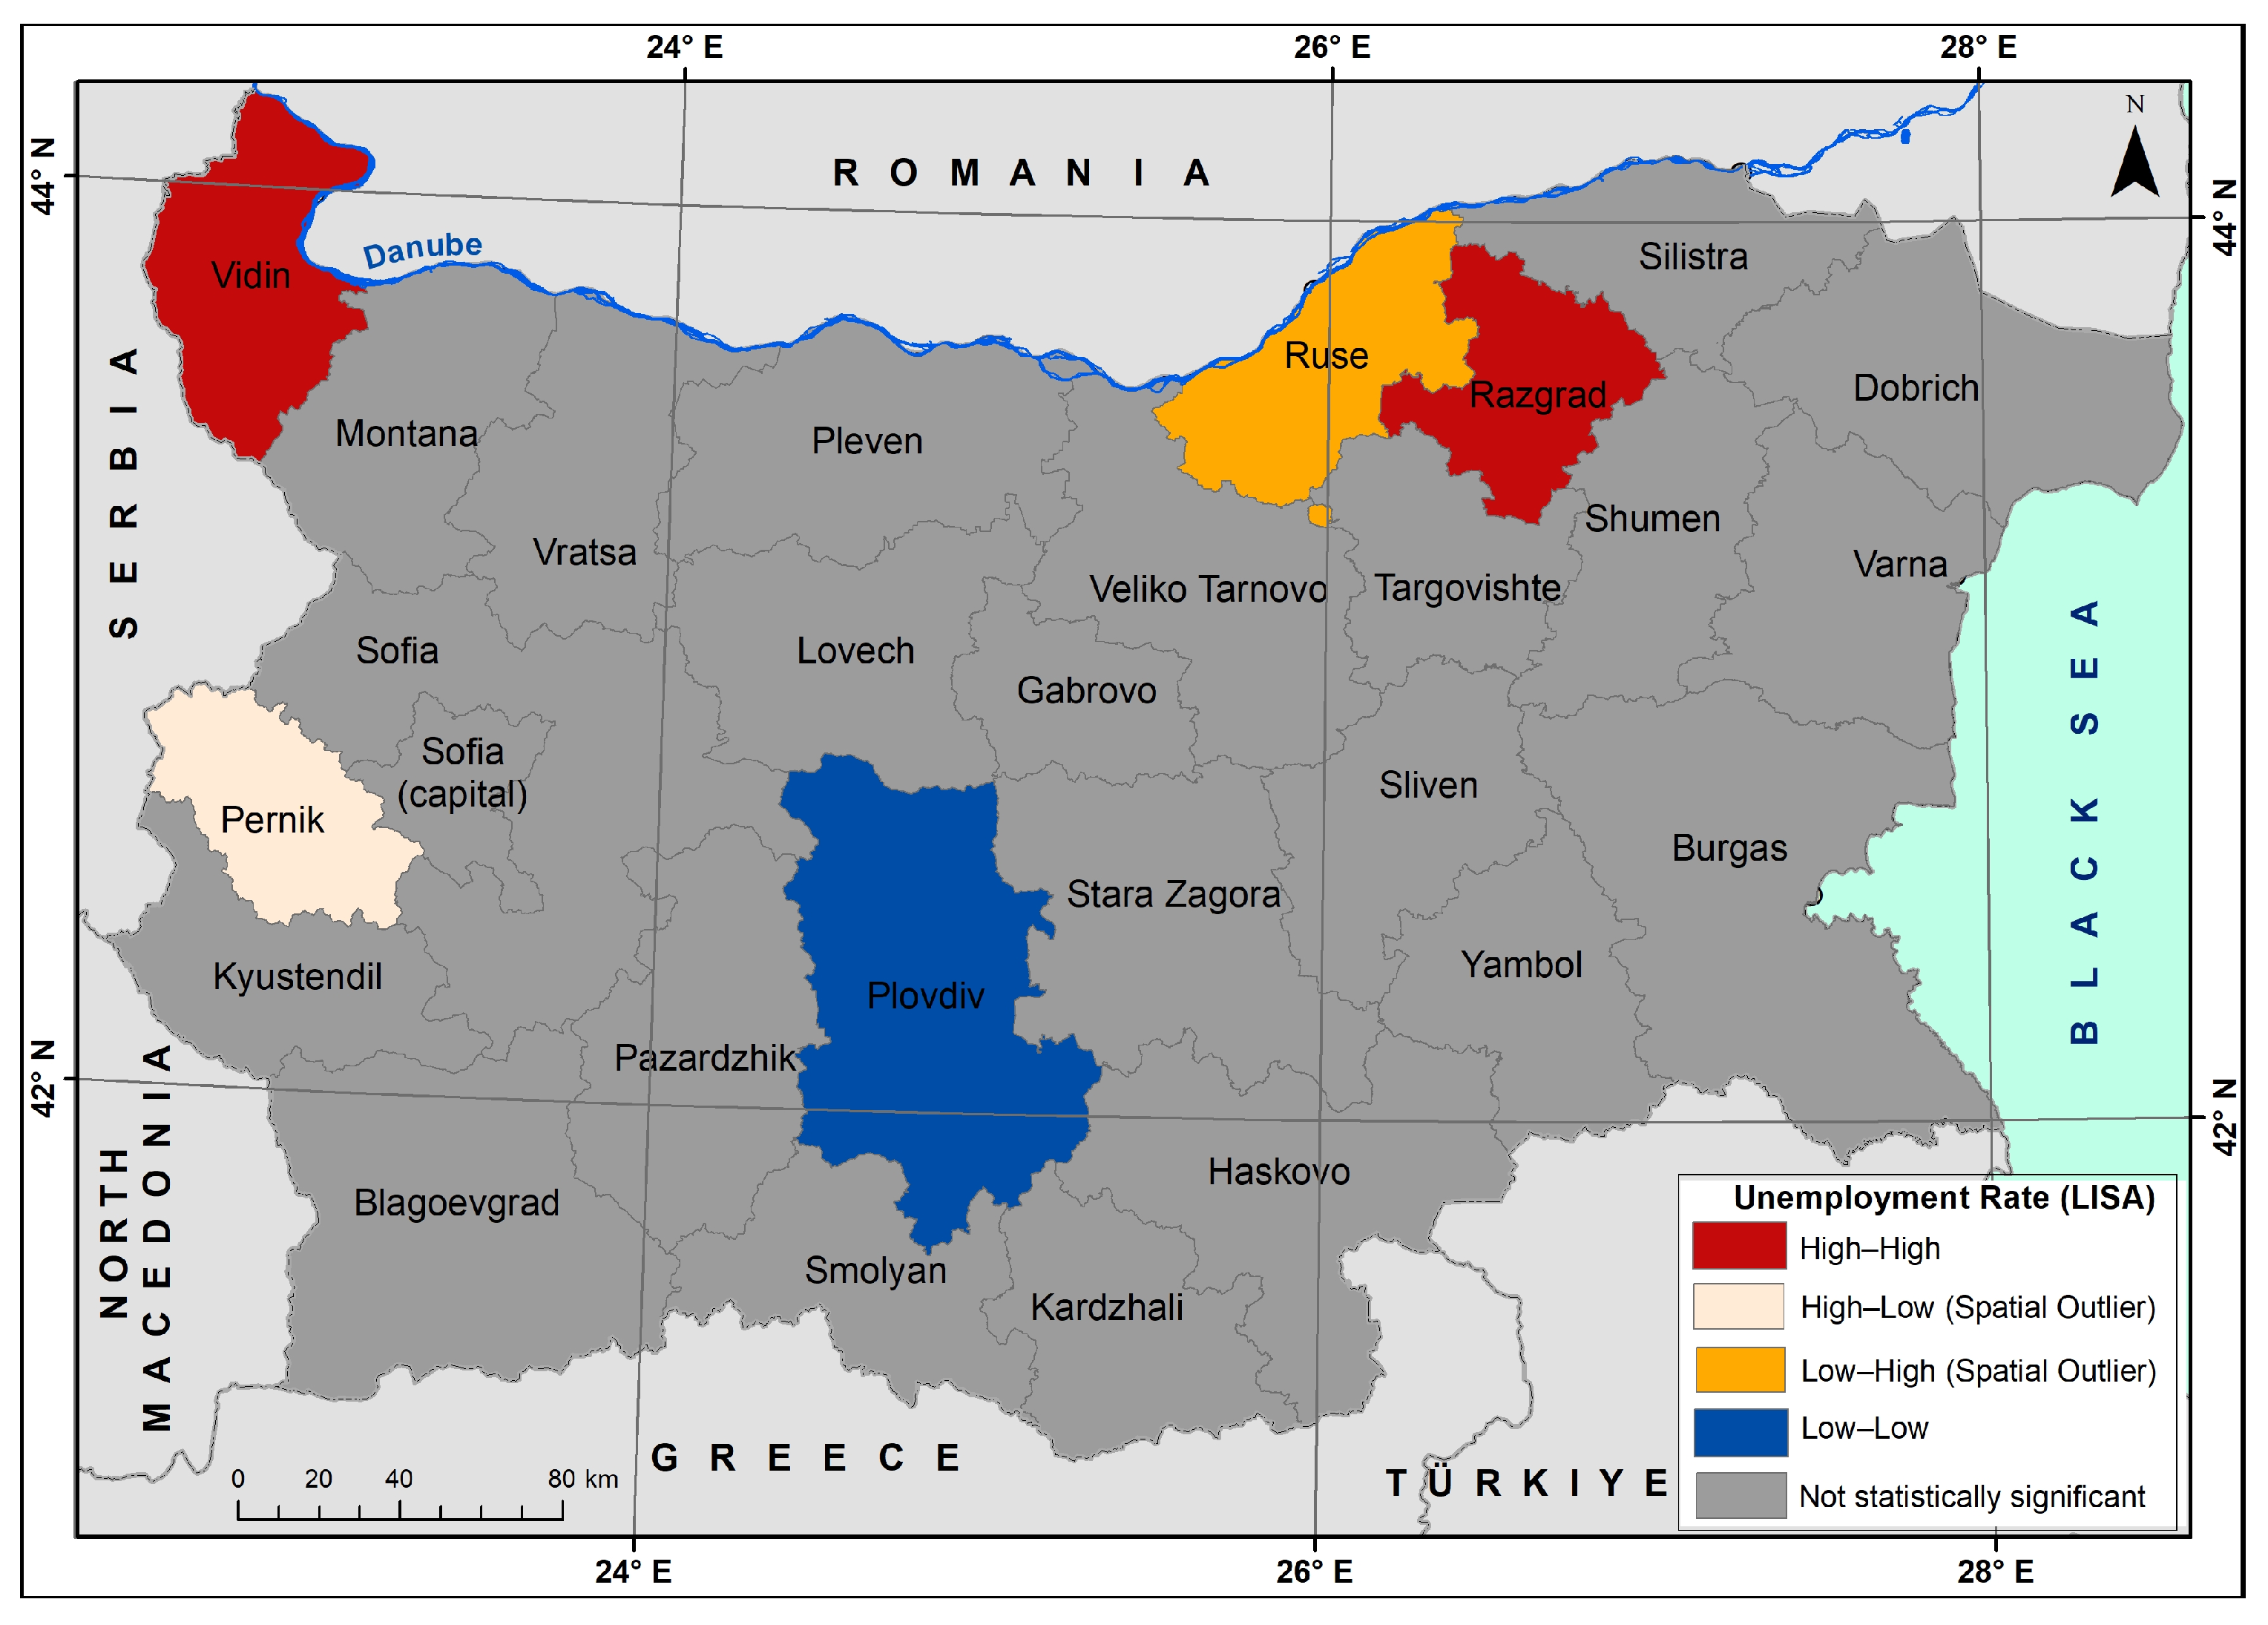
In contrast to the other indicators, the LISA analysis of unemployment rates reveals considerably stronger spatial clustering and clearer territorial differentiation (Figure 12).
Figure 12.
Local Indicators of Spatial Association (LISA) for unemployment rate (mean, 2021–2024) (The analysis was performed using Local Moran’s I. Statistical significance was assessed at p < 0.05).
Significantly High–High clusters are identified in the districts of Vidin and Razgrad, where high unemployment levels are spatially reinforced by neighbouring territories with similarly high values. These clusters reflect persistent structural labour-market disadvantages and regionally concentrated socioeconomic challenges.
At the same time, the Plovdiv district stands out as a Low–Low cluster, characterised by consistently low unemployment levels within a wider regional context. This pattern indicates relatively stable labour-market conditions and favourable economic performance, likely associated with stronger investment activity and economic diversification.
The analysis also identifies statistically significant spatial outliers, further emphasising the territorial heterogeneity of Bulgarian labour markets. The Pernik district appears as a High–Low outlier with respect to unemployment, which may be associated with lower economic productivity, less favourable sectoral specialisation, and relatively higher shares of population exposed to poverty and social vulnerability. In contrast, the Ruse district is identified as a Low–High outlier, reflecting relatively favourable labour-market conditions compared to neighbouring territories. This pattern may be influenced by the district’s cross-border location, transport connectivity, and economic activities associated with the Danube Bridge corridor.
Finally, the LISA results demonstrate that spatial dependence differs substantially across labour-market indicators. While employment and wage indicators display relatively localised and fragmented spatial patterns, unemployment demonstrates the strongest territorial clustering and regional concentration.
3.4. Cluster Analysis and LISA Results: Comparative Analysis
The comparison of cluster and LISA analysis, based on the three indicators, reveals that the Bulgarian labour market is shaped by the joint influence of socioeconomic and spatial factors. While cluster classification outlines typological groups of districts with similar characteristics, the LISA analysis reveals whether these characteristics are reinforced or mitigated by spatial proximity.
The stable cores of vulnerability and disadvantaged labour markets (higher unemployment rates, lower employment, and unfavourable relative wage index values) in Northwestern and Northeastern Bulgaria are confirmed by both applied methods. This result shows that unfavourable values of key indicators are not an isolated territorial phenomenon but are spatially supported by neighbouring areas with a similar profile, which reinforces vulnerability and limits the potential for spontaneous regional convergence.
Another coincidence, revealed by both methods, concerns the district of Plovdiv. It is included in Cluster 4, which displays relatively favourable labour market characteristics, and clearly corresponds to the LISA Low–Low cluster of the unemployment rate. This coincidence suggests the existence of spatial “islands” of stability in the workforce market, which can function as regional cores of employment and economic activity.
Of special interest are districts identified as spatial outliers (High–Low or Low–High) in the LISA analysis, while simultaneously they are part of clusters with different labour market profiles. Such spatial anomalies are observed in Cluster 1 for the district of Pernik with respect to the relative wage index, as well as in Cluster 4 for the district of Ruse, related to unemployment rates. These inconsistencies highlight the internal heterogeneity of some clusters and reveal the decisive influence of local factors on labour markets as well as their vulnerability or resilience. Therefore, cluster analysis, although effective for grouping areas by similarity, does not fully capture local spatial deviation and requires integration with spatial autocorrelation analysis.
4. Discussion
Regional labour-market inequalities reflect broader processes of uneven regional development observed across Europe and demonstrate relatively persistent spatial patterns [51,52]. These findings correspond to the broader European phenomenon described as the “geography of discontent”, where economically lagging regions remain trapped in structural disadvantages, while more developed urban territories continue to attract human capital, investments, and diversified economic activities [53,54,55,56].
Similar mechanisms of territorial reproduction of inequalities appear to exist in Bulgaria, consistent with patterns observed in other post-socialist and peripheral European regions [57,58]. Previous studies increasingly emphasise that higher employment levels do not necessarily correspond to improved income conditions, particularly in labour markets characterised by segmentation, lower productivity, and limited wage growth [12]. The results of the present study support this argument, as several Bulgarian districts, particularly those included in Cluster 4, demonstrate a mismatch between relatively favourable employment conditions and comparatively low wage levels. This pattern reflects the broader phenomenon of the “working poor”, where labour-market participation alone does not guarantee adequate income levels and social resilience.
The descriptive, multivariate, and spatial analyses confirm that labour-market disparities in Bulgaria are strongly territorially differentiated and reflect long-standing socioeconomic imbalances. The results reveal a relatively clear core–periphery structure, in which economically dynamic urban centres such as Sofia (capital), Varna, Plovdiv, and Stara Zagora demonstrate higher employment rates, stronger wage performance, and lower unemployment levels. In contrast, several districts in Northwestern and parts of Northeastern Bulgaria continue to experience persistent labour-market disadvantages associated with demographic decline, lower economic diversification, and limited investment attractiveness.
The results also underline the importance of spatial proximity and local territorial context in shaping labour-market inequalities. One of the most notable examples concerns the spatial coexistence of Sofia, the dominant economic centre of Bulgaria, with neighbouring economically vulnerable districts in Northwestern Bulgaria. This pattern may be interpreted through the framework of cumulative causation theory and the interaction between spread effects and backwash effects. While the capital generates employment opportunities, investment concentration, and commuting flows, neighbouring territories may simultaneously remain economically dependent and structurally disadvantaged.
Overall, the Bulgarian labour market reflects a spatially polarised system in which a relatively limited number of urban growth poles concentrate a disproportionate share of economic activities, labour income generation, and investment flows. At the same time, peripheral regions continue to experience structural labour-market vulnerabilities, reinforcing territorial disparities and limiting the potential for balanced regional development.
The present study has several limitations that should be acknowledged. First, the analysis is based on a limited set of indicators, including employment rate, unemployment rate, and the relative wage index, which does not allow the full incorporation of additional structural dimensions such as labour productivity, sectoral specialisation, demographic dependency, educational attainment, or migration processes. In addition, current studies highlight the increasing importance of digital transformation and the use of artificial intelligence as factors that may potentially influence labour markets, wages, and inequality levels in European countries [21]. However, this study focuses on spatial disparities in employment, unemployment, and wages at the regional level in Bulgaria, and the role of digital development offers a promising direction for future research. Second, the use of average values for the period 2021–2024 enables the identification of relatively stable spatial patterns but does not capture short-term temporal fluctuations and year-to-year labour-market dynamics. Third, the analysis is conducted at the NUTS 3 district level, which may partially mask local intra-district inequalities and heterogeneity associated with the Modifiable Areal Unit Problem (MAUP). Finally, the applied spatial autocorrelation analysis is based on a Queen contiguity spatial-weights matrix, while alternative approaches based on distance or functional economic interactions may reveal additional territorial relationships.
Future research may expand the analytical framework by incorporating additional socioeconomic and demographic indicators, panel-data approaches, and alternative spatial-weights matrices to provide a more comprehensive understanding of labour-market inequalities and territorial vulnerability in Bulgaria and other post-socialist European contexts.
5. Conclusions
The present study examined spatial disparities in the Bulgarian labour market at the NUTS 3 district level for the period 2021–2024 through the combined application of descriptive spatial analysis, multivariate cluster analysis, and Local Indicators of Spatial Association (LISA). The results reveal persistent territorial inequalities in employment, unemployment, and labour income generation, confirming the existence of a relatively clear core–periphery structure in the Bulgarian labour market.
The cluster analysis identified four distinct regional labour-market types characterised by different combinations of employment, unemployment, and relative wage index values. The results distinguish economically dynamic urban cores with relatively favourable labour-market conditions from peripheral and structurally disadvantaged territories characterised by lower employment, lower incomes, and higher unemployment. At the same time, several districts demonstrate a mismatch between relatively strong labour-market participation and comparatively low wage levels, reflecting the broader phenomenon of the “working poor” and the persistence of low-value-added economic activities.
The spatial autocorrelation analysis further demonstrated that labour-market disparities are not randomly distributed across the national territory. Persistent spatial concentrations of labour-market disadvantage are observed primarily in Northwestern and parts of Northeastern Bulgaria, while economically stronger urban centres function as regional growth poles. The identified spatial outliers additionally emphasise the importance of local territorial context, economic specialisation, and neighbouring regional conditions in shaping labour-market performance.
An important methodological contribution of the study is the combined application of multivariate clustering and LISA analysis. This integrated framework allows the simultaneous identification of typological similarities and local spatial dependencies, providing a more comprehensive understanding of the spatial structure of labour-market inequalities. The proposed approach may also be applicable in other post-socialist and peripheral European contexts characterised by strong territorial disparities.
The findings indicate that labour-market inequalities in Bulgaria require territorially differentiated policy responses consistent with the objectives of SDG8 (Decent Work and Economic Growth), SDG10 (Reduced Inequalities), and the broader framework of EU cohesion policy. In disadvantaged regions, policy efforts should focus on improving infrastructure, labour-market accessibility, human capital development, and economic diversification. In employment-intensive but income-constrained territories, greater emphasis should be placed on increasing labour productivity, supporting higher value-added economic activities, and improving income adequacy. At the same time, rapidly growing metropolitan regions require policies addressing increasing socioeconomic polarisation and territorial inequality.
Despite the analytical advantages of the applied framework, the study has several limitations, which point out the need for future research incorporating additional demographic and socioeconomic indicators, longer temporal series, and alternative spatial-weights matrices to provide a more comprehensive understanding of labour-market inequalities and regional vulnerability in Bulgaria.
Supplementary Materials
The following supporting information can be downloaded at: https://www.mdpi.com/article/10.3390/soc16060182/s1, Table S1: Mean values of the labour-market indicators by district, 2021–2024; Table S2: Cluster typology and mean values of the labour-market indicators, 2021–2024; Table S3: Supplementary demographic and socioeconomic variables used for cluster interpretation; Table S4: Supplementary demographic variables used for cluster interpretation.
Author Contributions
Conceptualisation, D.P., V.S., M.R. and N.I.; Methodology, D.P., V.S. and B.K.; Software, V.S.; Validation, D.P., V.S., P.R. and B.K.; Formal Analysis, D.P. and V.S.; Investigation, D.P., M.R. and N.I.; Resources, A.R.; Data Curation, D.P. and V.S.; Writing—Original Draft, D.P., V.S., P.R., A.R., M.R. and N.I.; Writing—Review and Editing, D.P., P.R., B.K., M.R. and N.I.; Visualisation, V.S. and B.K.; Supervision, A.R.; Project dministration, A.R.; Funding Acquisition, A.R. All authors have read and agreed to the published version of the manuscript.
Funding
This research is conducted within the framework of the project “Regional Employment—Working Poor in Bulgaria”, funded by the Bulgarian National Science Fund—MES, contract No. KП-06-H85/1 from 5 December 2024.
Institutional Review Board Statement
Not applicable.
Informed Consent Statement
Not applicable.
Data Availability Statement
The raw data supporting the conclusions of this article will be made available by the authors upon request.
Conflicts of Interest
The authors declare no conflicts of interest.
Abbreviations
The following abbreviations are used in this manuscript:
| FDI | Foreign Direct Investments |
| GVA | Gross Value Added |
| LISA | Local Indicators of Spatial Association |
| RWI | Relative Wage Index |
| SDG8 | Sustainable Development Goal 8 |
| SDG10 | Sustainable Development Goal 10 |
References
- United Nations. Transforming Our World: The 2030 Agenda for Sustainable Development; United Nations: New York, NY, USA, 2015. Available online: https://sdgs.un.org/2030agenda (accessed on 26 February 2026).
- Sustainable Development Goal#8: Decent Work and Economic Growth. International Labour Organization. Available online: https://www.ilo.org/topics-and-sectors/decent-work-and-2030-agenda-sustainable-development/sustainable-development-goal-8-decent-work-and-economic-growth (accessed on 23 February 2026).
- Sustainable Development Goals. Goal#10: Reduce Inequality Within and Among Countries. United Nations. Available online: https://www.un.org/sustainabledevelopment/inequality/ (accessed on 23 February 2026).
- Overman, H.; Xu, X. Spatial disparities across labour markets. Oxf. Open Econ. 2024, 3, i585–i610. [Google Scholar] [CrossRef] [Scilit]
- Nijman, J.; Wei, Y. Urban inequalities in the 21st century economy. Appl. Geogr. 2020, 117, 102188. [Google Scholar] [CrossRef] [Scilit]
- Bauluz, L.; Bukowski, P.; Fransham, M.; Lee, A.; López Forero, M.; Novokmet, F.; Breau, S.; Lee, N.; Malgouyres, C.; Schularick, M.; et al. Spatial Wage Inequality in North America and Western Europe: Changes Between and Within Local Labour Markets 1975–2019. World Inequality Lab-Working Paper No. 2023/14. 2023. Available online: https://wid.world/document/spatial-wage-inequality-in-north-america-and-western-europe-changes-between-and-within-local-labour-markets-1975-2019-world-inequality-lab-working-paper-2023-14/ (accessed on 27 February 2026).
- Crowley, F.; Doran, J.; McCann, P. The vulnerability of European regional labour markets to job automation: The role of agglomeration externalities. Reg. Stud. 2021, 55, 1711–1723. [Google Scholar] [CrossRef] [Scilit]
- Ciaschini, C.; Salvati, L. Enlarging spatial divides in local job markets? Insights from Italy, 2004–2013. GeoJournal 2022, 87, 5087–5100. [Google Scholar] [CrossRef] [Scilit]
- Lindley, J.; Machin, S. Spatial changes in labour market inequality. J. Urban Econ. 2014, 79, 121–138. [Google Scholar] [CrossRef] [Scilit]
- Boulant, J.; Brezzi, M.; Veneri, P. Income Levels and Inequality in Metropolitan Areas: A Comparative Approach in OECD Countries; OECD Regional Development Working Papers, No. 2016/06; OECD Publishing: Paris, France, 2016. [Google Scholar] [CrossRef]
- International Labour Organization (ILO). Global Wage Report 2022–23. The Impact of Inflation and COVID-19 on Wages and Purchasing Power; ILO: Geneva, Switzerland, 2022; Available online: https://www.ilo.org/sites/default/files/wcmsp5/groups/public/%40ed_protect/%40protrav/%40travail/documents/publication/wcms_862569.pdf (accessed on 8 February 2026).
- International Labour Organization (ILO). World Employment and Social Outlook: Trends 2025; International Labour Office: Geneva, Switzerland, 2025; Available online: https://www.ilo.org/sites/default/files/2025-01/WESO25_Trends_ExecSum_EN.pdf (accessed on 5 March 2026).
- Rodríguez-Pose, A. The revenge of the places that don’t matter (and what to do about it). Camb. J. Reg. Econ. Soc. 2018, 11, 189–209. [Google Scholar] [CrossRef] [Scilit]
- European Commission: Directorate-General for Employment, Social Affairs and Inclusion. Who Are the Working Poor? An Analysis of In-Work Poverty in the EU; European Union: Luxembourg, 2026. Available online: https://data.europa.eu/doi/10.2767/1170646 (accessed on 15 February 2026).
- Antonescu, D.; Florescu, I. Spatial patterns of regional inequalities in European Union in pandemic time: Empirical evidence from NUTS 2 regions. J. Acad. Res. Econ. 2023, 15, 596–611. [Google Scholar]
- European Commission: Directorate-General for Employment, Social Affairs and Inclusion. Labour Market and Wage Developments in Europe. Annual Review 2025; Publications Office of the European Union: Brussels, Belgium, 2025. Available online: https://data.europa.eu/doi/10.2767/1810636 (accessed on 17 February 2026).
- OECD Reviews of Labour Market and Social Policies. OECD Reviews of Labour Market and Social Policies: Bulgaria 2025; OECD Publishing: Paris, France, 2025. Available online: https://www.oecd.org/content/dam/oecd/en/publications/reports/2025/03/oecd-reviews-of-labour-market-and-social-policies-bulgaria-2025_200f5634/81e7cac7-en.pdf (accessed on 28 February 2026).
- Simeonova-Ganeva, R.; Ganev, K.; Vasilev, A.; Dimitrov, L.; Angelova, R.; Andreeva, G. Medium-Term and Long-Term Forecasts for the Development of the Labour Market in Bulgaria: Factors of Labour Demand, Employment Trends, Regional and Educational Imbalances (2008–2032); First Analytical Report; Ministry of Labour and Social Policy: Sofia, Bulgaria, 2019. Available online: https://www.mlsp.government.bg/uploads/24/politiki/zaetost/lmforecasts-report-en.pdf (accessed on 25 February 2026). (In Bulgarian)
- Beleva, I. Labour Market in Bulgaria: Dynamics, Structural Configuration and the New Challenges at the Beginning of XXI Century; Economic Research Institute at Bulgarian Academy of Sciences: Sofia, Bulgaria, 2023; Available online: https://www.iki.bas.bg/files/book_full.pdf (accessed on 22 February 2026). (In Bulgarian)
- Institute for Market Economics (IME). Employment and Unemployment in the Districts: Current Situation and Challenges. Regional Profiles: Indicators of Development; Institute for Market Economics: Sofia, Bulgaria, 2020; Available online: https://ime.bg/var/images/regional_labormarket_2020.pdf (accessed on 24 February 2026). (In Bulgarian)
- Zherlitsyn, D.; Rekova, N. Comparative analysis of labor markets in Bulgaria, Italy, and the UK: Wage dynamics, labor costs, and digital development. Economies 2026, 14, 13. [Google Scholar] [CrossRef] [Scilit]
- Pandurski, V. Labor market in the border municipalities of Southwestern Bulgaria—Challenges and trends. Int. J. Digit. Res. 2025, 1, 59–77. [Google Scholar] [CrossRef] [Scilit]
- Ravnachka, A. Demographic Situation and Labour Market in Blagoevgrad and Kyustendil Districts; National Publishing House for Education and Science “Az-buki”: Sofia, Bulgaria, 2021; Available online: https://azbuki.bg/wp-content/uploads/2022/02/Alexandra.pdf (accessed on 20 February 2026). (In Bulgarian)
- Roukova, P. Regional changes of employment in clothing industry. In Space-Society-Economy; Stoyanov, P., Stamenko, I., Tsvetkov, K., Eds.; Atlasi Press: Sofia, Bulgaria, 2019; Volume 1, pp. 287–302. Available online: https://www.atlasi.bg/SoundAtlasi/E_books_PDF/Prostranstvo_obshtestvo_ikonomika_P_Stoyanov.pdf (accessed on 19 February 2026). (In Bulgarian)
- Ivanov, L.; Angelova, P.; Petkov, P.; Slaveva, K.; Chiprianova, K. Regional aspects of employment and unemployment in Bulgaria under the conditions of economic crisis. Sci. Res. Alm. 2012, 17, 336–361. (In Bulgarian) [Google Scholar]
- Ilieva, M. Socio-Economic Transformation in Bulgaria: Features and Territorial Differences; TerArt: Sofia, Bulgaria, 2012. (In Bulgarian) [Google Scholar]
- Kosuliev, A. The Bulgarian labour market—Regional differences during the period 2013–2018. Proc. Univ. Ruse 2020, 59, 162–167. (In Bulgarian) [Google Scholar]
- Blien, U.; Hirschenauer, F.; Van, P. Classification of regional labour markets for purposes of labour market policy. Pap. Reg. Sci. 2010, 89, 859–881. [Google Scholar] [CrossRef] [Scilit]
- Nikolenko, S.; Moiseev, N.; Smirnova, E. Cluster analysis of the Russian labour market sectors. Proc. Voronezh State Univ. Ser. Econ. Manag. 2023, 2, 31–42. [Google Scholar] [CrossRef] [Scilit]
- Blien, U.; Rueb, F.; Werner, D.; Wolf, K. Classification of regional labour markets at the NUTS3 level in Germany. In Proceedings of the 46th Congress of the European Regional Science Association: Enlargement, Southern Europe and the Mediterranean, Volos, Greece, 30 August–3 September 2006; Available online: https://www.econstor.eu/handle/10419/118242 (accessed on 23 February 2026).
- Blanco, O.; Julián-Véjar, D.; Osorio-Rauld, A. Segmentation and regional analysis: Labor typologies and geographic inequality in Antofagasta and La Araucanía, Chile. Front. Sociol. 2025, 10, 1636282. [Google Scholar] [CrossRef] [Scilit]
- Syed Zwick, H.; Syed, S. The polarization impact of the crisis on the Eurozone labour markets: A hierarchical cluster analysis. Appl. Econ. Lett. 2017, 24, 472–476. [Google Scholar] [CrossRef] [Scilit]
- Boschmann, E.; Kwan, M. Metropolitan area job accessibility and the working poor: Exploring local spatial variations of geographic context. Urban Geogr. 2010, 31, 498–522. [Google Scholar] [CrossRef] [Scilit]
- Shepherd, P.; Dissart, J.-C. Exploring spatial disparities of work-shaped social vulnerability and resilience across the French Alps. Reg. Sci. Policy Pract. 2026, 18, 100261. [Google Scholar] [CrossRef] [Scilit]
- Stănciulescu, G.; Cristescu, A.; Popescu, M. Cluster analysis of the EU labour markets in the context of the COVID-19 pandemic crisis. J. East. Eur. Res. Bus. Econ. 2022, 2022, 419362. [Google Scholar] [CrossRef] [Scilit]
- Rollnik-Sadowska, E.; Cichowicz, E.; Dębkowska, K. Labor market slack in the EU during the COVID–19 crisis. Comp. Econ. Res. Cent. East. Eur. 2024, 27, 109–134. [Google Scholar] [CrossRef] [Scilit]
- Anselin, L. Local indicators of spatial association—LISA. Geogr. Anal. 1995, 27, 93–115. [Google Scholar] [CrossRef] [Scilit]
- Wozniak, M. Spatial matching on the urban labor market: Estimates with unique micro data. J. Labour Mark. Res. 2021, 55, 11. [Google Scholar] [CrossRef] [Scilit]
- Breau, S.; Saillant, R. Regional income disparities in Canada: Exploring the geographical dimensions of an old debate. Reg. Stud. Reg. Sci. 2016, 3, 463–481. [Google Scholar] [CrossRef] [Scilit]
- Belu, M.; Cimpoeru, S.; Popescu, M.; Cristescu, A. Mapping regional employment divergences in North–South Europe through spatial models. Economies 2025, 13, 345. [Google Scholar] [CrossRef] [Scilit]
- New Version of the Nomenclature of Territorial Units for Statistics (NUTS 2027) Enters Into Force. National Statistical Office, 27 February 2026. Available online: https://www.nsi.bg/en/news/new-version-of-the-nomenclature-of-territorial-units-for-statistics-nuts-2027-enters-into-force-9476 (accessed on 3 March 2026).
- National Statistical Institute of the Republic of Bulgaria. Available online: https://www.nsi.bg/ (accessed on 5 March 2026). (In Bulgarian)
- Employment Agency at the Ministry of Labour and Social Policy. Available online: https://www.az.government.bg/ (accessed on 7 March 2026). (In Bulgarian)
- Population by Districts, Municipalities, Place of Residence and Sex as of 31 December 2021. National Statistical Institute of the Republic of Bulgaria. Available online: https://www.nsi.bg/en/statistical-data/206/651 (accessed on 24 February 2026).
- Regional Statistics. National Statistical Institute of the Republic of Bulgaria. Available online: https://www.nsi.bg/en/statistical-data/46/ (accessed on 28 February 2026).
- Nikolov, A.; Ganev, P. Economic Centers in Bulgaria 2023; Institute for Market Economics: Sofia, Bulgaria, 2023; Available online: https://www.regionalprofiles.bg/var/Economic-Areas-2023-EN-final.pdf (accessed on 21 February 2026).
- Slavova, Z.; Nikolov, A.; Nedev, T. Regional Profiles. Indicators of Development 2025; Institute for Market Economics: Sofia, Bulgaria, 2025; Available online: https://www.regionalprofiles.bg/var/docs/RegionalProfiles2025-ENG.pdf (accessed on 1 March 2026).
- Poverty and Social Inclusion Indicators by District. Time Series. National Statistical Institute of the Republic of Bulgaria. Available online: https://www.nsi.bg/en/statistical-data/146/470 (accessed on 24 February 2026).
- GDP-Regional Level. National Statistical Institute of the Republic of Bulgaria. Available online: https://www.nsi.bg/statistical-data/141/429 (accessed on 24 February 2026). (In Bulgarian)
- Population Structure by Place of Residence, Sex Ratio, and Age Dependency Ratios, Time Series Data. Available online: https://www.nsi.bg/statistical-data/206/643 (accessed on 27 May 2026). (In Bulgarian)
- Iammarino, S.; Rodríguez-Pose, A.; Storper, M. Regional inequality in Europe: Evidence, theory and policy implications. J. Econ. Geogr. 2019, 19, 273–298. [Google Scholar] [CrossRef] [Scilit]
- Milijić, A.; Manasijević, A.; Đorđević, D.; Marjanović, V.; Stanojević, M. Demographic trends and regional disparities in the EU. Soc. Sci. 2025, 14, 556. [Google Scholar] [CrossRef] [Scilit]
- McCann, P. Perceptions of regional inequality and the geography of discontent: Insights from the UK. Reg. Stud. 2020, 54, 256–267. [Google Scholar] [CrossRef] [Scilit]
- Băncescu, M.; Georgescu, I. Panel cointegration and causality among socioeconomic indicators in CEE regions: Insights for regional economic resilience and sustainable development. Sustainability 2025, 17, 9947. [Google Scholar] [CrossRef] [Scilit]
- Carrera, E.; Rombaldoni, R.; Pozzi, R. Socioeconomic inequalities in Europe. Econ. Anal. Policy 2021, 71, 307–320. [Google Scholar] [CrossRef] [Scilit]
- European Commission: Directorate-General for Regional and Urban Policy; Rodríguez-Pose, A.; Dijkstra, L.; Poelman, H. The Geography of EU Discontent and the Regional Development Trap; European Union; Publications Office of the European Union: Luxembourg, 2023. [CrossRef]
- Dokov, H. Bulgaria’s regional policy: Analysing paradigm shifts and dynamics of territorial inequalities. Environ. Socio-Econ. Stud. 2024, 12, 37–50. [Google Scholar] [CrossRef] [Scilit]
- European Investment Bank; Gorzelak, G. The Eastern Horizon—A Regional Perspective; EIB Publications Office: Luxembourg, 2020; Available online: https://www.eib.org/files/publications/thematic/eib_big_ideas_the_eastern_horizon_en.pdf (accessed on 5 March 2026).

Disclaimer/Publisher’s Note: The statements, opinions and data contained in all publications are solely those of the individual author(s) and contributor(s) and not of MDPI and/or the editor(s). MDPI and/or the editor(s) disclaim responsibility for any injury to people or property resulting from any ideas, methods, instructions or products referred to in the content. |
© 2026 by the authors. Licensee MDPI, Basel, Switzerland. This article is an open access article distributed under the terms and conditions of the Creative Commons Attribution (CC BY) license.