


Abstract
People with disabilities experience disproportionately high rates of both violent and property crime victimization, yet the intersection of disability and socioeconomic disadvantage remains poorly understood. Data from the 2023 National Crime Victimization Survey are used to examine rates of property and violent crime victimization across disability and socioeconomic status groups. Multivariable models adjusted for age, race/ethnicity, and sex compute the odds of victimization. We use marginal effects to estimate the predicted probabilities of crime victimization for each demographic category. After adjusting for age, race/ethnicity, and sex, individuals who were both disabled and socioeconomically disadvantaged had significantly greater odds of victimization (2.9 for property crime; 4.9 for violent crime) than those who were neither disabled nor socioeconomically disadvantaged. Disability is an important social determinant of crime victimization. Socioeconomic disadvantage further increases the likelihood of victimization among people with disabilities, suggesting that the combined effects of disability and poverty create heightened vulnerability to both property and violent crime. Public health efforts should prioritize prevention strategies and victim services that address the needs of populations experiencing multiple forms of social and economic disadvantage.
1. Introduction
1.1. Victimization Rates by Disability Status
Adults with disabilities experience disproportionately high rates of criminal victimization relative to their nondisabled peers, a disparity documented across multiple datasets and crime typologies. Using 2017–2019 National Crime Victimization Survey (NCVS) data, Harrell [1] found that the rate of violent victimization among people with disabilities was nearly four times that of people without disabilities. Codina et al. [2] found a higher rate of lifetime victimization within a sample of adults with intellectual disability, with 96.9% of participants experiencing at least one form of victimization, and some participants experiencing 13 or more incidents of victimization throughout the lifespan. Latvala et al. [3] and Liasidou and Gregoriou [4] likewise found a higher cumulative rate of violent victimization across the lifespan for adults with disability. Collectively, this evidence demonstrates that disability is an important social determinant of victimization.
Despite consistent evidence of heightened victimization risk, less is known about how disability intersects with other forms of social disadvantage to shape vulnerability to crime. The mechanisms underlying higher victimization rates among people with disabilities remain poorly understood. Disability frequently co-occurs with other marginalized social positions, including low socioeconomic status, which may independently increase exposure to victimization. Examining disability in isolation may therefore overlook important differences in risk among subgroups of people with disabilities.
Existing research has largely focused on specific forms of victimization, particularly sexual or gender-based violence [2,5,6,7,8,9], or specific disability populations such as individuals with intellectual disabilities [10,11,12] or autism [13]. Consequently, there is limited population-level evidence examining how disability-related likelihood of victimization varies across socioeconomic groups or whether particular forms of crime disproportionately affect socially and economically disadvantaged people with disabilities.
Bauer [14] highlighted the methodological challenges of applying intersectionality within quantitative health research, including how multiple social positions are conceptualized, measured, and modeled. Nevertheless, an intersectional approach is critical for identifying groups facing compounded disadvantages and for informing more targeted prevention and intervention strategies.
1.2. Victimization Rates by Socioeconomic Status
The literature examining socioeconomic status (SES), disability, and victimization is diffuse. One challenge is the lack of consensus regarding how SES should be measured. SES measures are often constructed using some combination of individual or household income, educational attainment, and occupation, although factors such as housing characteristics, participation in assistance or benefit programs, and household composition can provide a more comprehensive picture of socioeconomic position [15,16,17].
A substantial body of research demonstrates that disabled people are more likely to have low incomes and face additional costs associated with disability [18,19,20,21,22,23]. Other studies have documented relationships between neighborhood disadvantage and likelihood of victimization [24,25,26,27,28,29,30,31,32]. Research has also explored associations between victimization and demographic characteristics such as race, sex, age, and geographic location [33,34,35,36,37,38]. Disability status has received comparably less attention in the United States, though it has been explored in international contexts [39,40,41,42].
The NCVS has multiple potential measures of SES. Berzofsky, et al. [43] explored strategies for operationalizing SES in the NCVS, examining a variety of single measure and composite approaches used in crime victimization research and other federal surveys as well as providing guidelines for creating a SES index for NCVS data.
1.3. Intersectional Analysis of Victimization Rates
Aggregate comparisons between disabled and nondisabled populations can obscure meaningful heterogeneity within the disability community itself. Examining variation in victimization rates by socioeconomic status may improve understanding of how risk is distributed among people with disabilities. Socioeconomic status, whether operationalized as family income, poverty status, educational attainment, or employment status, has been shown to independently predict victimization rates. However, the combination of disability and socioeconomic disadvantage may further increase likelihood of victimization because of factors such as differential exposure to high-risk environments and unequal access to protective resources.
There remains a significant gap in understanding the combined effects of disability status and SES on crime victimization rates. This challenge is partly attributable to the lack of standardization in how SES is defined or measured. Researchers commonly construct SES measures using indicators such as income, education, and occupation [15,16,44]. SES may also be conceptualized more broadly as access to wealth, power, and resources, including poverty status, enrollment in public assistance programs, or residence in government-subsidized housing [45]. While the NCVS includes measures of household income and educational attainment, each presents with certain limitations. Educational attainment may be less informative for younger respondents who have not yet completed their education, while household income may obscure important differences between disabled people living independently and those supported spouses or family members.
Social networks within highly disadvantaged communities may also contribute to victimization risk, particularly as it relates to violent crime. Individuals living in disadvantaged environments are more likely to have social ties to others exposed to or involved in violent crime [46,47]. This pattern does not reflect a cultural pathology; rather, concentrated disadvantage may increase exposure to violence through network proximity. Such exposure may elevate rate of victimization independently of individual behavior and may have implications for both low-SES populations and disabled people, particularly those who occupy both social positions. A deeper understanding of these relationships could help inform crime prevention efforts and identify communities most likely to benefit from intervention.
People with disabilities may also face additional constraints in their ability to relocate or alter their social environments [48]. A need for access to accessible housing, employment opportunities, transportation, and community resources may limit residential and social mobility. When combined with economic disadvantage, these constraints may further increase exposure to environments associated with greater likelihood of victimization.
This context prompts the following research questions:
RQ1: Are disability status and socioeconomic disadvantage each independently associated with the likelihood of property and violent victimization, controlling for other known demographic risk factors?
RQ2: Do adults who are both disabled and socioeconomically disadvantaged experience higher odds of victimization than adults with either characteristic alone or with neither?
RQ3: Is the combined association of disability and socioeconomic disadvantage greater than would be expected from their separate associations?
Through these analyses, we examine how exposure to crime among people with disabilities varies across intersecting social and economic positions.
To answer these questions, we examine victimization rates among people with disabilities and people of lower socioeconomic status relative to other populations identified as in the literature as being at elevated rate of victimization, including individuals who are not White, women, and younger adults. Second, we examine the odds of victimization among people who are both disabled and socioeconomically disadvantaged relative to other population groups. Third, we calculated predicted probabilities of being a crime victim for each demographic category of interest. Through this analysis, we demonstrate how exposure to crime for disabled people varies according to their intersecting social and economic positions.
2. Materials and Methods
2.1. Data
This study examines data from the 2023 National Crime Victimization Survey (NCVS), a nationally representative, multi-stage longitudinal survey administered to U.S. residents aged 12 and older. The NCVS collects self-reported information about personal and property crime experiences, including attempts and threats, over a rolling six-month reference period. A key strength of the survey is its capacity to capture crimes that go unreported to law enforcement, as well as detailed respondent characteristics (such as disability and measures of socioeconomic status) which are typically absent from administrative crime records. For these reasons, the Department of Justice designates the NCVS as its primary data source for measuring crime exposure in the United States [49].
The NCVS employs a multi-mode design in which geographic units are sampled first, followed by housing units and group quarters; all household members aged 12 or older are then eligible for interview [50]. Household-level participation in 2023 was 63.1%, with an individual-level response rate of 82.3% [51]. To distinguish from the unique experiences of youth, our focus is on adult victimization. Because we examine socioeconomic status as a primary measure of interest, we also restrict our analysis to those age 26 or older. We selected this age cutoff for two primary reasons: First, because socioeconomic status is closely related to educational attainment, it is important to identify an age at which one could have completed a college degree when following a traditional education path. The U.S. Census Bureau generally uses age 25 and older for examining educational attainment [52]. Additionally, adults must leave their parents’ health insurance plan by age 26, which is another important indicator of socioeconomic status [53]. For these reasons, analyses were conservatively restricted to respondents aged 26 and older with complete data on disability status, socioeconomic status, and victimization, yielding an analytic sample of 199,034 individuals [54].
2.2. Measures
2.2.1. Crime Victimization
The outcomes of interest are (1) any property criminal victimization or (2) any violent criminal victimization in the prior year. Respondents are screened about whether they experienced a range of crimes in the past six months. Types of property victimizations include: burglary, trespassing, motor vehicle theft, or other types of theft. Violent victimization includes rape, sexual assault, aggravated assault, or simple assault [55]. Because NCVS participants are re-interviewed at six-month intervals, responses across two interview waves are combined to yield annual victimization indicators. Some individuals may be victims of both property and violent crimes, sometimes as part of a single incident and other times as part of multiple incidents.
2.2.2. Disability
Disability status is measured using the standard six-item sequence included in the NCVS and other federal surveys, assessing functional difficulty in the domains of vision, hearing, cognition, ambulation, self-care, and independent living [1]. Respondents reporting difficulty in any one domain are classified as having a disability; those reporting no difficulty across all six items are classified as non-disabled.
2.2.3. Socioeconomic Status (SES)
Following NCVS-specific recommendations by Berzofsky et al. [43], we created a three-category measures of SES, collapsed from an index ranging in value from 0 to 8, with 0 being the lowest possible level of SES and 8 being the highest. One point is added if an individual is a homeowner and one point is added if the individual was employed over the past six months. For educational attainment, a point is added for having a high school diploma; two points if earned a bachelor’s degree; and three points if a higher level of education was attained (e.g., master’s, professional, or doctorate). Points are added if household income is above the federal poverty level (one point if 101 to 200% above; two points if 201 to 400% above, and three points if 401% or higher). Note that poverty level was assessed by comparing household income to total number of people in the household using 2023 U.S. Census Bureau poverty threshold [56]. Because household level data was captured on the instrument categorically rather than continuously, in instances where the range of income spanned multiple poverty thresholds, we utilized the category’s midpoint. Note that NCVS imputes missing values for income.
Approximately 1.5% of cases were missing one of these SES indicators (either education or employment). Analysis of these missing cases indicated that they were evenly distributed across age and victimization categories. Their exclusion is accounted for in the reporting of sample size above. In our collapsed SES measure, scale values of 1 through 3 are counted as low SES; values of 4 through 6 are middle SES; 7 and 8 are high SES.
2.2.4. Covariates
Sociodemographic covariates known to be associated with higher victimization rates are included as controls. Age is captured continuously based on self-report and included in our analyses in six 9-year categories (26 to 35; 36 to 45; 46 to 55; 56 to 65; 66 to 74; 75 and older). Race and ethnicity are captured using five categories derived from respondents’ self-reported racial identification and Hispanic origin: non-Hispanic White alone; non-Hispanic Black or African American alone; non-Hispanic Asian alone; non-Hispanic other or multiracial; and Hispanic of any race. Sex is recorded in dichotomous categories. For each of these variables, adjustments are made for nonresponse on the public use file and these imputed values are used in our analyses.
2.3. Analytic Strategy
Descriptive statistics characterize the sample and bivariable victimization patterns across demographic groups separately for property crimes and violent crimes. Logistic regression models are then used to estimate the odds of the two victimization types associated with disability status, socioeconomic status, and other key covariates [57], with average marginal effects calculated to facilitate interpretation of group differences on the probability scale. All analyses were conducted in Stata v.18 with appropriate complex sample weights applied, as recommended [58].
3. Results
Table 1 shows the percentage of the population in each demographic category along with the unweighted number of cases in each category. Just under 14% of the population aged 26 and older reported a disability, consistent with estimates reported by the adult population in the American Community Survey for the same time period [59]. Also consistent with other federal surveys, the disability population has a higher representation among older age categories (23.0% are 66 to 74; 30.1% are aged 75 or older compared to 13.4% and 6.1%, respectively, for the nondisabled population).
Table 1.
Demographic characteristics aged 26 and older, 2023 (weighted percentage; unweighted number of cases) (n = 216,852).
With respect to socioeconomic status, the no disability population is somewhat evenly distributed between low (19.4%) and high (22.9%). However, the disabled population is substantially overrepresented among the socioeconomically disadvantaged category (42.3%) and just 7.8% of the disabled population aged 26 and over are considered high SES. This is largely due to the lower education (16.8% have less than a high school diploma) and employment rates (75% were not working over the last six months) of those with disabilities. Homeownership rates for those with disabilities are similar to the overall population (67.2% compared to 70.5% overall); this is largely related to the age distribution of those with disabilities. Because of the relationship between homeownership, employment, and victimization to age as well as disability, age remains an important covariate in subsequent analysis.
Table 2 displays the bivariate relationship between victimization and various demographic characteristics, shown separately for property and violent crime. The first columns show that 3.54% of people live in a household that experienced a property crime. This rate is significantly higher for those with disabilities (5.09%, p < 0.001); those who are socioeconomically disadvantaged (4.51%, p < 0.001); the youngest category (26 to 35: 4.83%, p < 0.001); and those who are non-Hispanic and a race other than White, Black, or Asian (6.52%, p < 0.001).
Table 2.
Percentage of people aged 26+ in the U.S. reporting property crime and violent crime victimization in the last year by demographic category, 2023.
There are similar patterns for victims of violent crime, though the incidence (and therefore variation) is lower. Overall, 1.08% of people 26 and older were victims of a violent crime in the last 12 months. While the percentage of those with a disability (1.91%) is only one percentage point higher than the nondisabled population (0.94%), the rate is twice as high. Among those in the lowest socioeconomic status category, 1.58% were victims of a violent crime.
Table 3 moves beyond the bivariate relationship by including all demographic covariates in models that predict the odds of property and violent crime victimization separately. In the first column of each dependent variable, we include SES and disability separately. The second model shows the interaction of disability by lowest SES status. For property crime (columns 1 and 2), we note that age is an important control. The youngest adults (aged 26 to 35) have 4.28 higher odds of living in a household that experienced property crime compared to the oldest (those 75 or older). Those who are Black, non-Hispanic (1.36, p < 0.001); Other races (not White, Black, or Asian), non-Hispanic (1.72, p < 0.001), and Hispanic (1.62, p < 0.01) had significantly higher odds of property crime victimization compared to those who are White, non-Hispanic. After controlling for these characteristics, we found that those who are socioeconomically disadvantaged experienced 1.28 times the odds (p < 0.001) of being in households that experienced property crimes compared to higher SES individuals and that those who were disabled had 2.08 times the odds (p < 0.001) compared to nondisabled people. The second model considers the interaction of disability and SES status. Compared to those who are both not in the lowest SES category and not disabled, all three groups experienced higher odds of property victimization: those who are not disabled but are economically disadvantaged had 1.188 higher odds (p < 0.001); those who are disabled but not economically disadvantaged had 1.83 increased odds (p < 0.001). However, those who were both disabled and socioeconomically disadvantaged had almost three times higher odds of being victims of a property crime (OR = 2.89; p < 0.001).
Table 3.
Odds ratios (and standard errors) for demographic characteristics predicting victimization in the last year (ages 26+, 2023).
The final two columns of Table 3 show the odds of violent victimization. We note a much more pronounced effect of all demographic variables, particularly age. Those who are aged 26 to 35 have over 23 times increased odds of violent victimization compared to those aged 75 or older (p < 0.001). Other characteristics have patterns similar to that of property crime victimization odds. Those who are in the lowest SES category have 1.58 times the odds of being a violent crime victim (p < 0.001) and those with a disability have 2.87 times the odds (p < 0.001) relative to those not in these categories and controlling for all other demographic characteristics shown. As model 2 shows, exploring the relationship between disability and SES provides important insights. Compared to those who are neither disabled nor socioeconomically disadvantaged, those who are low SES but not disabled have 1.41 increased odds (p < 0.01) of victimization. The increased odds of those who are disabled but not socioeconomically disadvantaged is 2.4 (p < 0.001) and for those who are both low SES and disabled, the odds are almost 5 times that of those who are neither (OR = 4.95; p < 0.001).
These results provide an answer to RQ1: that disability status and socioeconomic disadvantage each are independently associated with an increased odds of portery and violent victimization (Model 1 for each dependent variable), and to RQ2: that those who are both disabled and socioeconomically disadvantaged have significantly higher odds of victimization than adults with either characteristic alone or with neither (Model 2 for each dependent variable).
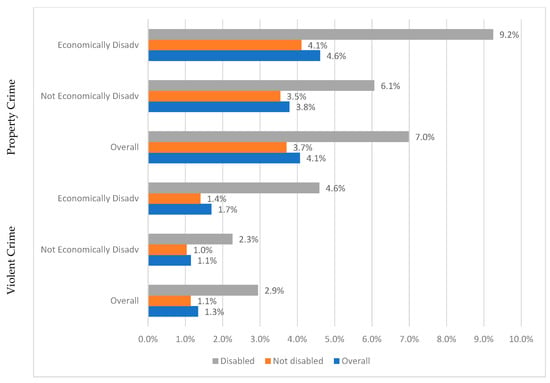
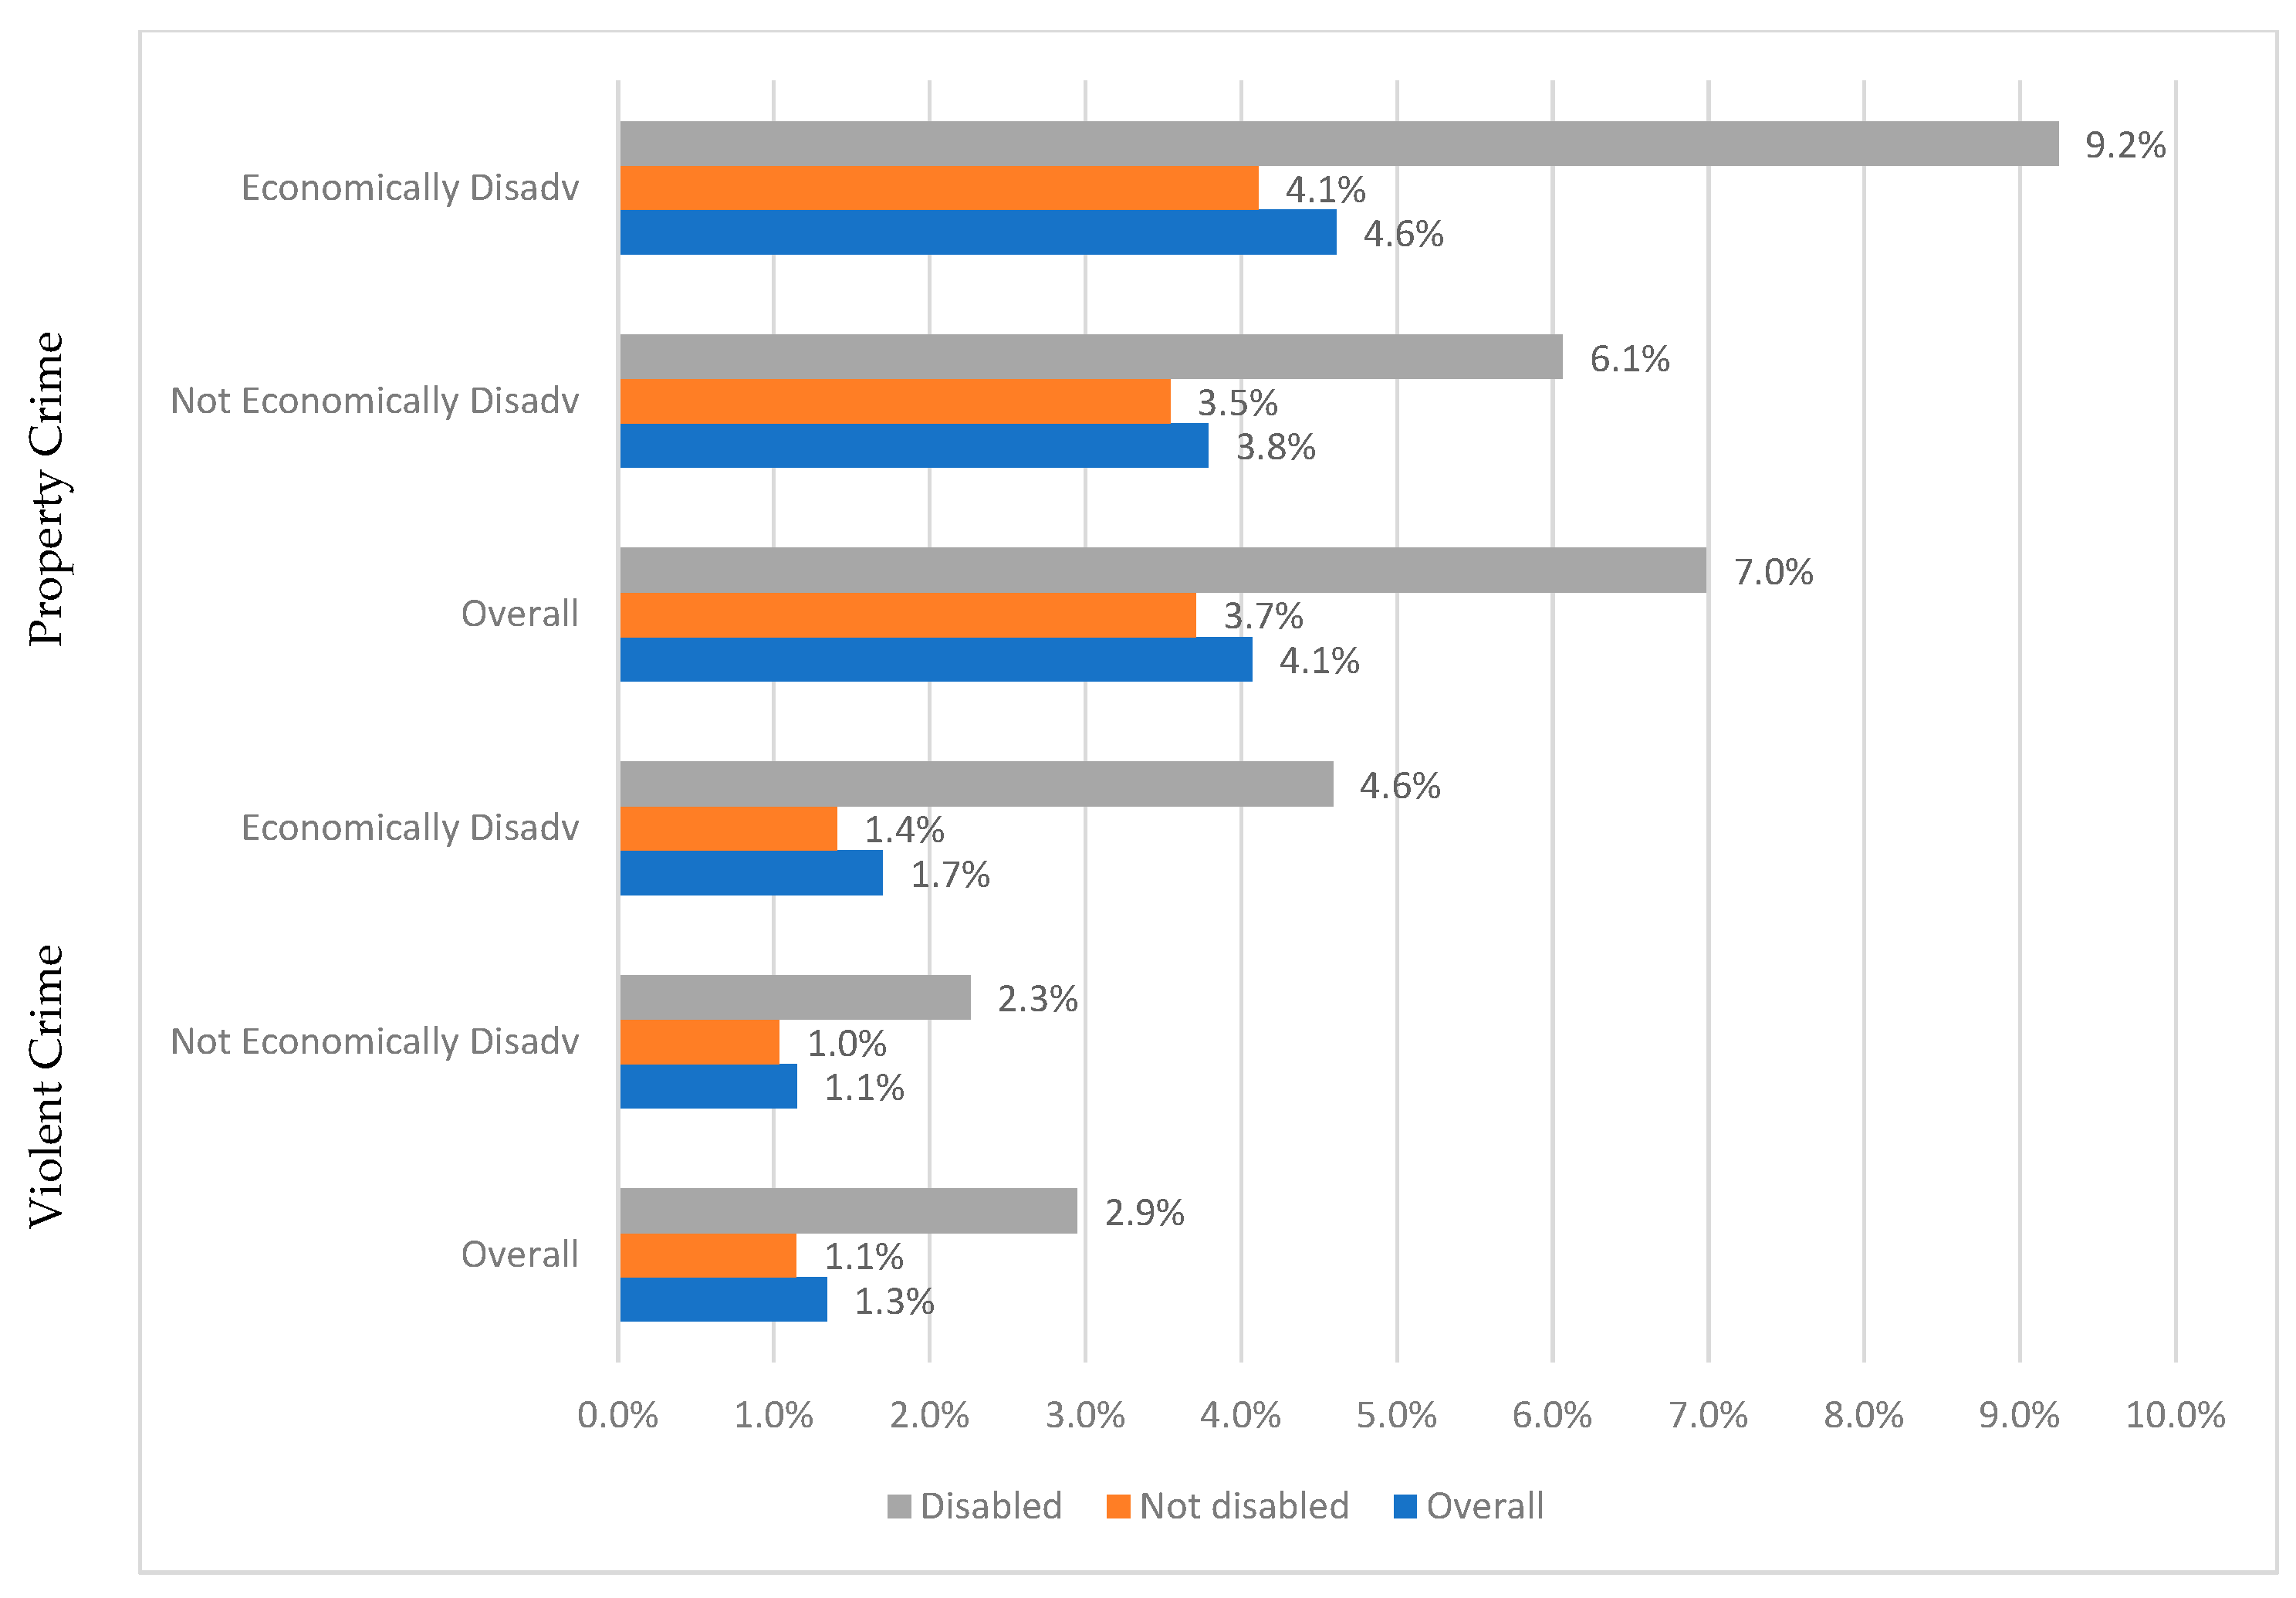
Figure 1 uses the second model to estimate marginal effects of each crime victimization type. The predicted probability of being a crime victim for each combination of SES disadvantage and disability category, while controlling for age, race/ethnicity, and sex, is displayed in this graph.
Figure 1.
Predicted probability of property and violent crime victimization, by disability and SES category, controlling for age, race/ethnicity, and gender.
What is notable about these predicted probabilities is the substantially higher rate for those who are both low SES and disabled, both in terms of larger probabilities and in terms of their size relative to other categories. Among those who already experience a higher rate of property crime due to being socioeconomically disadvantaged, those with disabilities have more than twice the predicted probability (9.2%) compared to those without disabilities (4.1%). For violent crime, among the lowest SES group, the disabled population has more than three times the predicted probability of being a victim (4.6% compared to 1.4%), even after controlling for age. We note that likelihood is higher for people with disabilities across the board. It appears that socioeconomic disadvantage is not as protective for those with disabilities as it is for those who are not, both for property and violent crimes. These predicted probabilities provide an answer to RQ3: the combined association of disability and socioeconomic disadvantage is greater than would be expected from their separate associations.
4. Discussion
Using nationally representative NCVS data, this study found that adults (aged 26+) with disabilities experience substantially higher odds of both property and violent crime victimization than adults without disabilities. Socioeconomic disadvantage was also independently associated with increased victimization rates. Most importantly, the combination of disability and socioeconomic disadvantage was associated with the highest rates of victimization. Adults who were both disabled and socioeconomically disadvantaged experienced nearly three times the odds of property victimization and nearly five times the odds of violent victimization relative to adults who were neither disabled nor socioeconomically disadvantaged. Predicted probabilities further demonstrated that higher likelihood of victimization was concentrated among individuals occupying both marginalized social positions.
These findings contribute to a growing body of literature documenting elevated victimization rates among people with disabilities. However, they also demonstrate that the disability population is not homogeneous. Aggregate comparisons between disabled and nondisabled populations may mask important variation in likelihood. While disability and socioeconomic disadvantage each increase the likelihood of victimization, their co-occurrence is associated with especially high levels of victimization. This pattern is consistent with an intersectional perspective, suggesting that likelihood of victimization is shaped not only by disability status itself but also by the broader social and economic contexts in which people live.
The findings have important public health implications. Exposure to crime and violence is associated with a range of adverse physical, psychological, and social outcomes, including injury, trauma, reduced community participation, and poorer overall health. Preventing victimization among people with disabilities should therefore be viewed as a public health priority rather than exclusively a criminal justice concern. Public health interventions aimed at reducing violence and improving community safety should explicitly consider disability status and recognize that economically disadvantaged disabled adults may face particularly elevated risk.
Several mechanisms may contribute to these observed differences. People with disabilities are more likely to experience economic hardship, depend on limited social and community resources, and face barriers to relocating to safer neighborhoods or accessing protective supports. Individuals living in socioeconomically disadvantaged communities may also have greater exposure to environmental and social conditions associated with higher victimization rates. While the present analysis cannot directly test these mechanisms, the findings suggest that future research should examine how neighborhood conditions, social networks, housing stability, service access, and economic insecurity jointly influence victimization among people with disabilities.
The association between disability and victimization remained after controlling for socioeconomic status. This suggests that there is something unique about disability that places people at risk of victimization independent of financial resources. Exposure to crime may be shaped by proximity to motivated offenders and absence of protective social networks, both of which are risk factors more common among the disability population, who may be more likely to live in high-crime (low socioeconomic status) communities, and who are more likely to have to rely on low paying careworkers to support daily care needs. This sustained proximity to potential offenders, including paid caregivers and family members, may result in an increased victimization risk because of the perpetrator’s control of essential assistance [60]. In fact, the estimates in this analysis, drawn from survey self-reports, may underestimate victimization. Further, physical, sensory, cognitive, or communication impairments can reduce a person’s ability to detect, avoid, resist, or escape a threatening situation, and offenders may perceive people with disabilities as easier targets or as less likely to report or be believed [61]. Such potential vulnerability is the result of social and physical environments that are not designed with broad needs in mind.
Several limitations should be noted. First, the cross-sectional approach does not permit causal inference or allow us to identify temporal ordering. That is, victimization may contribute to disability onset or economic hardship, just as disability and disadvantage may increase exposure to victimization. Second, the NCVS excludes institutionalized populations and relies on self- or proxy-reported disability measures that do not capture the type, severity, or onset of impairment, and it may undercount victimization perpetrated by caregivers or other people on whom respondents depend. Finally, the NCVS does not include measures of the mechanisms discussed above (e.g., neighborhood conditions, social networks, caregiving arrangements), so these pathways remain untested. Each of these potential explanations for increased rates of victimization among people with disabilities should be investigated in future studies.
From a policy perspective, these findings support targeted prevention efforts in communities with high concentrations of poverty and disability. Health and human service systems, disability service organizations, victim assistance programs, and public health agencies may benefit from greater coordination to identify and support individuals at heightened risk. Screening for victimization, strengthening community-based supports, improving access to safe and affordable housing, and reducing economic hardship may all represent important strategies for reducing victimization-related health disparities among people with disabilities.
5. Conclusions
This study demonstrates the value of applying an intersectional lens to crime victimization research. Adults with disabilities face elevated victimization rates, but elevated rates are not evenly distributed within the disability community. Socioeconomically disadvantaged adults with disabilities represent a particularly vulnerable population, highlighting the need for public health and policy responses that address both disability-related and economic sources of inequality. Prevention programs should include accessible formats, with attention paid to the economic context in which individuals are living.
Author Contributions
Conceptualization, M.H.; methodology, M.H.; software, M.H.; validation, M.H. and D.S.; formal analysis, M.H.; investigation, M.H.; resources, M.H.; data curation, M.H.; writing—original draft preparation, D.S.; writing—review and editing, D.S. and M.H.; visualization, M.H.; supervision, M.H.; project administration, M.H.; funding acquisition, M.H. All authors have read and agreed to the published version of the manuscript.
Funding
This publication was supported by a grant from the National Institute on Disability, Independent Living, and Rehabilitation Research (NIDILRR grant number 90RTGE0005). NIDILRR is a Center within the Administration for Community Living (ACL), Department of Health and Human Services (HHS). The contents of this manuscript do not necessarily represent the policy of NIDILRR, ACL, or HHS, and you should not assume endorsement by the Federal Government.
Institutional Review Board Statement
This study was a secondary analysis of publicly available, de-identified data from the National Crime Victimization Survey (NCVS), which is collected by the U.S. Census Bureau on behalf of the Bureau of Justice Statistics. Because the data contain no personally identifiable information, the analysis did not constitute human subjects research under 45 CFR 46.102 and was exempt from institutional review board review.
Informed Consent Statement
Informed consent was obtained by the original data collectors and was not required for this secondary analysis.
Data Availability Statement
Data from this manuscript are available at the Inter-university Consortium for Political and Social Research (ICPSR) Repository at https://www.icpsr.umich.edu/web/NACJD/studies/38962 (Accessed on 4 July 2026).
Acknowledgments
We would like to thank members of the Ad Hoc Advisory Group of the Disability Statistics Rehabilitation Research and Training Center who encouraged us to explore disability victimization in more depth. It was through this ongoing relationship with our key stakeholders that led us to seek funding to examine this topic.Early results from this paper were presented at the 2026 Violence Prevention Conference in Portsmouth, New Hampshire. We thank attendees who provided feedback on our preliminary results.
Conflicts of Interest
The authors declare no conflicts of interest. The funders had no role in the design of the study; in the collection, analyses, or interpretation of data; in the writing of the manuscript; or in the decision to publish the results.
Abbreviations
The following abbreviations are used in this manuscript:
| NCVS | National Crime Victimization Survey |
| SES | Socio-economic status |
References
- Harrell, E. Crime Against Persons with Disabilities, 2009–2019—Statistical Tables; Bureau of Justice Statistics: Washington, DC, USA, 2021. [Google Scholar]
- Codina, M.; Pereda, N. Characteristics and Prevalence of Lifetime Sexual Victimization Among a Sample of Men and Women with Intellectual Disabilities. J. Interpers. Violence 2022, 37, NP14117–NP14139. [Google Scholar] [CrossRef] [Scilit] [PubMed]
- Latvala, A.; Tideman, M.; Søndenaa, E.; Larsson, H.; Butwicka, A.; Fazel, S.; Lichtenstein, P. Association of intellectual disability with violent and sexual crime and victimization: A population-based cohort study. Psychol. Med. 2023, 53, 3817–3825. [Google Scholar] [CrossRef] [Scilit] [PubMed]
- Liasidou, A.; Gregoriou, A. A Longitudinal Analysis of Disability-Related Interpersonal Violence and Some Implications for Violence Prevention Work. J. Interpers. Violence 2021, 36, NP8687–NP8705. [Google Scholar] [CrossRef] [Scilit] [PubMed]
- Caluaco, H.G.F.; Hino, P.; Fernandes, F.S.L.; Siqueira, L.D.; Caldas, J.M.P.; Vieira, E.W.R.; Fernandes, H. Sexual violence against women with disabilities: Intersection between race/color and vulnerability. BMC Public Health 2022, 25, 3174. [Google Scholar]
- Chopin, J.; Beauregard, E.; Deslauriers-Varin, N. Less exposed, more vulnerable? Understanding the sexual victimization of women with disabilities under the lens of victimological theories. Int. Rev. Vict. 2024, 30, 109–129. [Google Scholar] [CrossRef] [Scilit]
- Emerson, E.; Llewellyn, G. Exposure of Women With and Without Disabilities to Violence and Discrimination: Evidence from Cross-sectional National Surveys in 29 Middle- and Low-Income Countries. J. Interpers. Violence 2023, 38, 7215–7241. [Google Scholar] [CrossRef] [Scilit] [PubMed]
- Mueller-Johnson, K.; Eisner, M.P.; Obsuth, I. Sexual Victimization of Youth With a Physical Disability: An Examination of Prevalence Rates, and Risk and Protective Factors. J. Interpers. Violence 2014, 29, 3180–3206. [Google Scholar] [CrossRef] [Scilit] [PubMed]
- Scott, C.S.; Lefley, H.P.; Hicks, D. Potential risk factors for rape in three ethnic groups. Community Ment. Health J. 1993, 29, 133–141. [Google Scholar] [CrossRef] [Scilit] [PubMed]
- Reiter, S.; Bryen, D.N.; Shachar, I. Adolescents with intellectual disabilities as victims of abuse. J. Intellect. Disabil. 2007, 11, 371–387. [Google Scholar] [CrossRef] [Scilit] [PubMed]
- Brendli, K.R.; Broda, M.D.; Brown, R. Children With Intellectual Disability and Victimization: A Logistic Regression Analysis. Child. Maltreatment 2022, 27, 320–324. [Google Scholar] [CrossRef] [Scilit] [PubMed]
- Codina, M.; Pereda, N.; Guilera, G. Lifetime Victimization and Poly-Victimization in a Sample of Adults With Intellectual Disabilities. J. Interpers. Violence 2022, 37, 2062–2082. [Google Scholar] [CrossRef] [Scilit] [PubMed]
- Sreckovic, M.A.; Brunsting, N.C.; Able, H. Victimization of students with autism spectrum disorder: A review of prevalence and risk factors. Res. Autism Spectr. Disord. 2014, 8, 1155–1172. [Google Scholar] [CrossRef] [Scilit]
- Bauer, G.R. Incorporating intersectionality theory into population health research methodology: Challenges and the potential to advance health equity. Soc. Sci. Med. 2014, 110, 10–17. [Google Scholar] [CrossRef] [Scilit] [PubMed]
- Cerutti, J. The Not-So-Straightforward Measurement of Socioeconomic Status (SES); Blog [Internet]; The Dunn Lab: Indianapolis, IN, USA, 2018; Available online: https://www.thedunnlab.com/blog/the-not-so-straightforward-measurement-of-socioeconomic-status-p983h (accessed on 17 August 2026).
- Cowan, C.D.; Hauser, R.M.; Kominski, R.A.; Levin, H.M.; Lucas, S.R.; Morgan, S.L.; Spencer, M.B.; Chapman, C. Improving the Measurement of Socioeconomic Status for the National Assessment of Educational Progress: A Theoretical Foundation--Recommendations to the National Center for Education Statistics; National Center for Education Statistics: Washington, DC, USA, 2012. Available online: https://eric.ed.gov/?id=ED542101 (accessed on 17 August 2026).
- Shavers, V.L. Measurement of socioeconomic status in health disparities research. J. Natl. Med. Assoc. 2007, 99, 1013–1023. [Google Scholar] [PubMed] [PubMed Central]
- Elwan, A. Poverty and Disability: A Survey of the literature; SP Discussion Paper; Social Protection Advisory Service: Washington, DC, USA, 1999; Volume 9932, pp. 1–48. Available online: https://documents1.worldbank.org/curated/en/488521468764667300/pdf/multi-page.pdf (accessed on 17 August 2026).
- Levy, B.S. Poverty, social injustice, and health. Soc. Med. 2013, 7, 169–171. [Google Scholar] [CrossRef] [Scilit]
- Meyer, B.D.; Mok, W.K. The Economic Consequences of Disability: Evidence from PSID. In Lifecycle Events and Their Consequences: Job Loss, Family Change, and Declines in Health; Stanford University Press: Stanford, CA, USA, 2013; pp. 240–259. ISBN 978-0-8047-8643-0. [Google Scholar]
- Morris, Z.A.; McGarity, S.V.; Goodman, N.; Zaidi, A. The Extra Costs Associated With Living With a Disability in the United States. J. Disabil. Policy Stud. 2022, 33, 158–167. [Google Scholar] [CrossRef] [Scilit]
- Rahman, M.S.; Parvez, S. Disability provokes poverty and vice versa, a review of the relationship. J. Bangladesh Coll. Physicians Surg. 2024, 42, 63–67. [Google Scholar] [CrossRef] [Scilit]
- Stapleton, D.C.; O’day, B.L.; Livermore, G.A.; Imparato, A.J. Dismantling the Poverty Trap: Disability Policy for the Twenty-First Century. Milbank Q. 2006, 84, 701–732. [Google Scholar] [CrossRef] [Scilit] [PubMed]
- Baumer, E.; Horney, J.; Felson, R.; Lauritsen, J.L. Neighborhood Disadvantage and the Nature of Violence. Criminology 2003, 41, 39–72. [Google Scholar] [CrossRef] [Scilit]
- Becker, J.H. The Dynamics of Neighborhood Structural Conditions: The Effects of Concentrated Disadvantage on Homicide over Time and Space. City Community 2016, 15, 64–82. [Google Scholar] [CrossRef] [Scilit]
- Berthelot, E. Person or Place? A Contextual, Event-History Analysis of Homicide Victimization Risk, United States, 2004–2012 [Internet]. Inter-University Consortium for Political and Social Research (ICPSR). 2018. Available online: https://www.icpsr.umich.edu/web/NACJD/studies/37079/versions/V1 (accessed on 17 August 2026). [CrossRef]
- Burraston, B.; Watts, S.J.; McCutcheon, J.C.; Province, K. Relative Deprivation, Absolute Deprivation, and Homicide: Testing an Interaction Between Income Inequality and Disadvantage. Homicide Stud. 2019, 23, 3–19. [Google Scholar] [CrossRef] [Scilit]
- Coid, J.; Zhang, Y.; Ullrich, S.; Wood, J.; Bhavsar, V.; Bebbington, P.; Bhui, K. Interpersonal violence in a deprived Scottish urban area with aggregations of physical health risks and psychiatric morbidity: An ecological study. BMC Public Health 2021, 21, 1121. [Google Scholar] [CrossRef] [Scilit] [PubMed]
- Johnson, L.T.; Kane, R.J. Deserts of Disadvantage: The Diffuse Effects of Structural Disadvantage on Violence in Urban Communities. Crime. Delinq. 2018, 64, 143–165. [Google Scholar] [CrossRef] [Scilit]
- Lawrence, P.R.; Anderson, R.K. Poverty and Disability: A State-Level Geospatial Analysis. Clin. Nurs. Res. 2024, 33, 344–354. [Google Scholar] [CrossRef] [Scilit] [PubMed]
- Miethe, T.D.; Stafford, M.C.; Long, J.S. Social Differentiation in Criminal Victimization: A Test of Routine Activities/Lifestyle Theories. Am. Sociol. Rev. 1987, 52, 184–194. [Google Scholar] [CrossRef] [Scilit]
- Armstead, T.L.; Wilkins, N.; Nation, M. Structural and social determinants of inequities in violence risk: A review of indicators. J. Community Psychol. 2019, 49, 878–906. [Google Scholar] [CrossRef] [Scilit] [PubMed]
- Block, P. Race, Poverty and Disability: Three Strikes and You’re Out! Or Are You? Soc. Policy 2002, 33, 34. [Google Scholar]
- Clark, C.R.; Kawachi, I.; Ryan, L.; Ertel, K.; Fay, M.E.; Berkman, L.F. Perceived neighborhood safety and incident mobility disability among elders: The hazards of poverty. BMC Public Health 2009, 9, 162. [Google Scholar] [CrossRef] [Scilit] [PubMed]
- Paik, L. Critical perspectives on intersectionality and criminology: Introduction. Theor. Criminol. 2017, 21, 4–10. [Google Scholar] [CrossRef] [Scilit]
- Frederick, A.; Shifrer, D. Race and Disability: From Analogy to Intersectionality. Sociol. Race Ethn. 2019, 5, 200–214. [Google Scholar] [CrossRef] [Scilit]
- Sampson, R.J.; Wilson, W.J.; Katz, H. REASSESSING “TOWARD A THEORY OF RACE, CRIME, AND URBAN INEQUALITY”: Enduring and New Challenges in 21st Century America. DU. Bois Rev. Soc. Sci. Res. Race 2018, 15, 13–34. [Google Scholar] [CrossRef] [Scilit]
- Semenza, D.C.; Testa, A.; Jackson, D.B. Intersectional differences in serious violent victimization trajectories across the life course. Prev. Med. Rep. 2022, 26, 101732. [Google Scholar] [CrossRef] [Scilit] [PubMed]
- Aaltonen, M.; Kivivuori, J.; Martikainen, P.; Sirén, R. Socioeconomic differences in violent victimization: Exploring the impact of data source and the inclusivity of the violence concept. Eur. J. Criminol. 2012, 9, 567–583. [Google Scholar] [CrossRef] [Scilit]
- Reilly, J.-J.; Naumann, D.N.; Morris, L.; Blackburn, L.; Brooks, A. Injury by knife crime amongst children is associated with socioeconomic deprivation: An observational study. Pediatr. Surg. Int. 2023, 39, 8. [Google Scholar] [CrossRef] [Scilit] [PubMed]
- Tessema, Z.; Gebrie, W.; Tesema, G.; Alemneh, T.; Teshale, A.; Yeshaw, Y. Intimate partner violence and its associated factors among reproductive-age women in East Africa:-A generalized mixed effect robust poisson regression model. PLoS ONE 2023, 18, e0288917. [Google Scholar] [CrossRef] [Scilit] [PubMed]
- Tura, F.; Healy, J.C.; Evans, C.R.; Leckie, G. An intersectional analysis of stranger, acquaintance and domestic violence victimisation in England and Wales using MAIHDA. Criminol. Crim. Justice 2025. online first. [Google Scholar] [CrossRef] [Scilit]
- Berzofsky, M.; Smiley-McDonald, H.; Moore, A.; Krebs, C. Measuring Socioeconomic Status (SES) in the NCVS: Background, Options, and Recommendations; Report no.: 248562; Bureau of Justice Statistics: Washington, DC, USA, 2014. Available online: https://www.ojp.gov/library/publications/measuring-socioeconomic-status-ses-ncvs-background-options-and-recommendations (accessed on 30 June 2026).
- Broer, M.; Bai, Y.; Shipan, R. Proposal for a NAEP SES Index: Background, Findings, and Remaining Challenges; AIR: Washington, DC, USA, 2023; Available online: https://www.air.org/resource/report/proposal-naep-ses-index-background-findings-and-remaining-challenges (accessed on 17 August 2026).
- Weinberger, A.H.; Steinberg, M.L.; Mills, S.D.; Dermody, S.S.; Heffner, J.L.; Kong, A.Y.; Pang, R.D.; Rosen, R.L. Assessing Sex, Gender Identity, Sexual Orientation, Race, Ethnicity, Socioeconomic Status, and Mental Health Concerns in Tobacco Use Disorder Treatment Research: Measurement Challenges and Recommendations From a Society for Research on Nicotine and Tobacco Pre-conference Workshop. Nicotine Tob. Res. 2022, 24, 643–653. [Google Scholar] [CrossRef] [Scilit] [PubMed]
- Feldman, J.M.; Gruskin, S.; Coull, B.A.; Krieger, N. Police-Related Deaths and Neighborhood Economic and Racial/Ethnic Polarization, United States, 2015–2016. Am. J. Public Health 2019, 109, 458–464. [Google Scholar] [CrossRef] [Scilit] [PubMed]
- King, C.; Huang, X. Neighbourhood violence and housing instability: An exploratory study of low-income women. Hous. Stud. 2022, 39, 651–670. Available online: https://www.tandfonline.com/doi/full/10.1080/02673037.2022.2074970 (accessed on 17 August 2026). [CrossRef] [Scilit]
- Lindsay, S.; Fuentes, K.; Ragunathan, S.; Li, Y.; Ross, T. Accessible independent housing for people with disabilities: A scoping review of promising practices, policies and interventions. PLoS ONE 2024, 19, e0291228. [Google Scholar] [CrossRef] [PubMed]
- Eckroth, S. Historical Perspective on the National Crime Victimization Survey…50 Years of Data and Counting. Bureau of Justice Statistics. 2023. Available online: https://bjs.ojp.gov/blogs/historical-perspective-national-crime-victimization-survey50-years-data-and-counting (accessed on 22 June 2026).
- Cantor, D. Methodological Developments and Innovations of the National Crime Victimization Survey, 1972–2023. J. Contemp. Crim. Justice 2025, 41, 9–29. [Google Scholar] [CrossRef] [Scilit]
- Morgan, R.; Bielamowicz, R.; Coen, E.; Tapp, S.; Thompson, A.; Tinney, E.; Truman, J. National Crime Victimization Survey (NCVS), 1973–2024. 2025. Available online: https://bjs.ojp.gov/data-collection/ncvs (accessed on 18 December 2025).
- U.S. Census Bureau. American Community Survey, ACS 1-Year Estimates Subject Tables, 2024 [Internet]. S1501: Educational Attainment. 2026. Available online: https://data.census.gov/table/ACSST1Y2024.S1501 (accessed on 29 June 2026).
- Lucas, S.R. Health insurance in the United States: A case of effectively maintained inequality? SSM-Popul Health 2024, 28, 101687. [Google Scholar] [CrossRef] [Scilit] [PubMed]
- U.S. Bureau of Justice Statistics. National Crime Victimization Survey, [United States], 2023 [Internet]. Inter-University Consortium for Political and Social Research. 2024. Available online: https://www.icpsr.umich.edu/web/NACJD/studies/38962 (accessed on 2 June 2025). [CrossRef]
- U.S. Bureau of Justice Statistics. NCVS Dashboard: Terms and Definitions. 2025. Available online: https://ncvs.bjs.ojp.gov/terms#terms (accessed on 5 June 2026).
- U.S. Census Bureau. Poverty Thresholds. Census.gov. 2026. Available online: https://www.census.gov/data/tables/time-series/demo/income-poverty/historical-poverty-thresholds.html (accessed on 4 July 2026).
- Ranganathan, P.; Aggarwal, R.; Pramesh, C.S. Common pitfalls in statistical analysis: Odds versus risk. Perspect. Clin. Res. 2015, 6, 222–224. [Google Scholar] [CrossRef] [Scilit] [PubMed] [PubMed Central]
- Shook-sa, B.; Couzens, G.L.; Berzofsky, M. User’s Guide to National Crime Victimization Survey (NCVS) Direct Variance Estimation: Appendix F—Examples in STATA; Report no.: 249478; RTI International: Research Triangle, NC, USA, 2015. Available online: https://www.ojp.gov/ncjrs/virtual-library/abstracts/users-guide-national-crime-victimization-survey-ncvs-direct-3 (accessed on 6 August 2025).
- Thomas, N.; Paul, S.; Bach, S.; Houtenville, A. Annual Disability Statistics Compendium: 2024; University of New Hampshire, Institute on Disability: Durham, NH, USA, 2024; Available online: https://www.researchondisability.org/ADSC/compendium-table-contents (accessed on 21 August 2024).
- Dever, M. Recruitment, Assessment, and Retention in the Direct Care Workforce for Individuals with Criminal Records: A Comprehensive Model Approach; U.S. Department of Justice, Office of Justice Programs, National Institute of Justice: Washington, DC, USA, 2021. Available online: https://www.ojp.gov/pdffiles1/nij/302092.pdf (accessed on 13 November 2026).
- Byrne, G. Prevalence and psychological sequelae of sexual abuse among individuals with an intellectual disability: A review of the recent literature—Gary Byrne, 2018. J. Intellect. Disabil. 2017, 22, 294–310. [Google Scholar] [CrossRef] [Scilit] [PubMed]

Disclaimer/Publisher’s Note: The statements, opinions and data contained in all publications are solely those of the individual author(s) and contributor(s) and not of MDPI and/or the editor(s). MDPI and/or the editor(s) disclaim responsibility for any injury to people or property resulting from any ideas, methods, instructions or products referred to in the content. |
© 2026 by the authors. Licensee MDPI, Basel, Switzerland. This article is an open access article distributed under the terms and conditions of the Creative Commons Attribution (CC BY) license.