


Abstract
A single indicator, most often fan or air-conditioner ownership, cannot capture cooling deprivation, since heat-trapping building shells and unreliable water supply can leave device-owning households thermally unsafe. This paper implements the Systemic Cooling Poverty (SCP) framework for Jordan using data from 18,434 households in the 2023 Demographic and Health Survey, building a three-dimensional deprivation index across cooling equipment, building shell quality, and water reliability, linked to SSP1-2.6 temperature projections. Informal dwellings are by far the largest predictor of SCP; rural residence is insignificant once wealth and governorate are controlled, and 12.6% of the variance lies between governorates. Aqaba, where 73.2% of households own an air conditioner against 47.1% in Amman, ranks highest on the multidimensional score once building shell and water reliability are considered, a reversal that a single-indicator analysis would miss. Five governorates (Mafraq, Aqaba, Jarash, Karak, and Madaba) combine high deprivation with future heat burden under every weighting and aggregation rule tested, with Ma’an a conditional sixth. Policy should prioritize upgrading informal settlements, cross-sectoral coordination, and a household cooling-access indicator within the water-security, urban-heat, and building-standards commitments of Jordan’s NDC 3.0.
1. Introduction
The summer of 2024 was the warmest on record, and the years on either side of it have not offered much relief. Jordan was no exception: the 2024 summer was the hottest in the 1981–2025 Earth Map series, with a mean maximum of 35.6 °C across the 12 governorates. Summer maxima in Jordan rose by about 0.55 °C per decade over the same period [1]. Heat is now one of the deadliest climate hazards in many regions of the world, and its burden falls hardest on households that did least to cause the warming and can do least to escape it [2,3]. For most of its history, the energy poverty literature treated this as a winter problem. The established image was a household choosing between heating and eating, and the established metric counted homes too cold to be healthy. That framing made sense for northern Europe, where it was built, but it quietly wrote the hot half of the year, and much of the hot half of the world, out of the analysis [4,5].
Over the past decade, a body of work has argued that the inability to keep a home adequately cool is itself a form of energy deprivation, with its own drivers, its own health consequences, and a distributional logic that does not mirror the winter case [5,6,7]. Cooling has been added to the sustainable development agenda as a service in its own right rather than a luxury, and the gap between who needs cooling and who can obtain it has been mapped at a global scale [8,9,10]. Nevertheless, much of this work still measures cooling through a single lens, most often ownership of an air conditioner. That lens is useful, and it is also misleading, because a household can own a cooling device and still be unsafe in the heat if its walls trap solar gain, its water supply fails during a heatwave, or its neighborhood offers no shade and no respite [3,11].
Systemic Cooling Poverty (SCP) was proposed to capture exactly this layered quality, as Mazzone et al. [3] define it as the condition in which households and individuals are exposed to the harms of heat stress due to inadequate infrastructure that would keep them safe. They distinguish three kinds of such infrastructure: physical systems, such as building fabric and cooling devices; social systems, such as reliable utilities and community facilities; and intangible capacities, such as the knowledge to adapt. The concept has since moved from theory to measurement, including a large cross-country assessment by Falchetta et al. [12]. This systemic perspective provides the conceptual basis for the present study.
Jordan is a lower-middle-income country in the MENA region, energy import-dependent at around ninety-four per cent, growing rapidly, and hosting one of the largest refugee populations per capita in the world. It is also hot and getting hotter. On the face of it, it looks like a textbook candidate for severe cooling poverty. However, in the first large cross-country SCP assessment, Jordan appears among the better-performing hot countries, precisely because its infrastructure, service access, and policy frameworks are relatively strong [12]. While such a national score may offer a useful aggregate benchmark, its value for policy design is limited because it obscures household-level variation. In particular, it cannot identify which households and governorates experience overlapping deprivations that require coordinated, rather than sector-specific, interventions. The gap this paper addresses is therefore not whether Jordan is cooling-poor on average, but where within Jordan systemic cooling poverty concentrates, how it is structured across households, and what the country-level “good performer” label conceals.
This paper asks the following questions: (1) How prevalent is systemic cooling poverty in Jordan when it is measured as a multidimensional condition spanning cooling equipment, building shell quality, and water reliability, rather than through any single indicator? (2) Which household and geographic characteristics determine a household’s position on this multidimensional measure, and does the rural-urban divide survive once wealth and location are controlled? (3) How much of the variation in systemic cooling poverty is attributable to the governorate a household lives in, and where does current deprivation converge with projected future heat?
The contribution is threefold. Empirically, this paper provides the first household-level, nationally representative measurement of systemic cooling poverty for Jordan and, to the authors’ knowledge, one of the first such measurements anywhere in the MENA region, drawing on the 2023 Demographic and Health Survey. Methodologically, it implements the SCP framework inside a survey-corrected, multilevel design that keeps water reliability, building fabric, and cooling equipment in a single measure, and it shows what a single-dimension analysis would have missed. For policy, it identifies the specific governorates and household types where deprivations compound, and it links current deprivation to near-term warming, giving Jordanian planners a targeting map rather than a national average.
The remainder of the paper is organized as follows, with Section 2 reviewing the literature, Section 3 describing the data, the measurement of systemic cooling poverty, and the analytical strategy, Section 4 reporting the results, Section 5 discussing them, and Section 6 concluding with policy implications.
2. Literature Review
2.1. Conceptualizing Cooling Poverty: From Energy Deprivation to Systemic Thermal Protection
Energy poverty was first theorized in cold climates, and its dominant metrics still carry that inheritance, defined as a household’s failure to reach an adequate level of domestic energy services, a framing broad enough to cover cooling but rarely applied that way in practice [5,13]. Thomson et al. [5] and Sánchez-Guevara Sánchez et al. [7] were among the first to show that summer energy poverty is not winter poverty with the sign reversed. Overheating has its own exposure pathways, at-risk groups, and coping behaviors, several of which are invisible to affordability metrics, so that a household protected by a winter-oriented subsidy can still be dangerously hot in summer [6,14]. Cooling deprivation therefore requires explicit measurement rather than being inferred from indicators designed primarily for heating.
A central conceptual question is whether cooling poverty should be understood primarily as inadequate access to energy and appliances or as the absence of the wider conditions needed for thermal safety [8,10]. Heat vulnerability is produced, not merely distributed, by infrastructures, institutions, and histories that decide whose neighborhood has shade, whose building has insulation, and whose work exposes them to the sun [3,15,16]. Qualitative work gives this structure a human shape. Households cope without devices through vernacular practice [4], thermal safety is stratified by race, gender, and income [17,18], and low-income households in both hemispheres end up too cold in winter and too hot in summer [19]. These findings indicate that cooling deprivation cannot be reduced to appliance ownership or household expenditure alone.
Systemic Cooling Poverty is an expression of this broader understanding. Mazzone et al. [3] organize cooling adequacy into physical, social, and intangible infrastructures, spanning climate exposure, infrastructure and assets, social and thermal inequality, health, and education. The justice literature supplies an analytical vocabulary of distribution, procedure, and recognition, and finds that planning over-invests in distributional fixes while neglecting the other two [20]. It also argues that cooling should be treated as a habitability requirement rather than an amenity given how systematically low-income and minority households go without it [21]. Read together, these strands shift the analytical focus from the possession of cooling technologies to the unevenly distributed conditions that make protection against heat possible.
2.2. Measuring Cooling Deprivation: Single Indicators and Multidimensional Approaches
The most common single indicator, air conditioner ownership, is easy to collect but captures a device rather than a state of safety [8,10]. Cong et al. [22] show that households often own cooling equipment but ration its use to avoid bills, a hidden deprivation invisible to ownership-based metrics. Conversely, the absence of air conditioning does not describe the protection offered by building design or other cooling practices. The methodological question is therefore not simply whether a household owns a device, but which combination of indicators adequately represents its capacity to cope with heat.
The field has responded with multidimensional, climate-aware measures that combine household resources, dwelling quality, and the heat actually faced [23,24]. Falchetta et al. [12] quantify SCP across twenty-eight countries and roughly 1.2 million households, and report that close to 600 million people live under severe, multidimensional cooling deprivation, with education, working conditions, and climate exposure emerging as widespread drivers rather than device ownership alone. Their findings show that the dimensions driving deprivation are frequently not the ones a device-ownership metric would flag. A place where everyone owns an air conditioner is therefore not automatically free of cooling poverty.
The determinants of cooling poverty are similarly multidimensional, with the literature highlighting (1) household’s financial situation, (2) housing conditions, (3) climatic exposure and (4) water supply [3,12,22,25]. Income is the most consistent. Poorer households are both more exposed to heat and less able to translate exposure into cooling, whether because they cannot afford the device, cannot afford to run it, or live in the housing that needs it most, though the relationship is not always linear [8,22,26]. Housing operates through the building shell, which decides how much outdoor heat becomes indoor heat and can defeat any amount of device ownership. Building materials, thermal mass, ventilation, and codes are decisive, and passive measures can materially improve indoor conditions at low cost [11,27]. Climate turns both into a moving target as rising cooling degree days raise the energy required for a given level of comfort, so the same household becomes more deprived without anything about the household changing [8,28].
Water introduces a further measurement question: whether essential services supporting heat coping should be treated as part of cooling deprivation or as separate infrastructure deficits. Physiological coping with extreme heat depends on adequate hydration and on the ability to cool the body through water use. Hence, a household with cooling equipment but an intermittent water supply is not as safe as its device ownership suggests. The people-centered cooling framework of Martinez et al. [29] makes this interdependence explicit by placing water and services alongside devices and buildings, consistent with the systemic approach of Mazzone et al. [3]. In a severely water-scarce setting such as Jordan, this relationship provides a substantive reason to consider water reliability alongside cooling equipment and building quality.
A broader conceptual framework nevertheless creates practical challenges for measurement. Multidimensional approaches require choices about which dimensions are included, which thresholds identify deprivation, and how the dimensions are aggregated. They also depend on what household surveys actually observe. A survey-based index may therefore improve on a single indicator without capturing the full range of infrastructures and capacities identified by SCP. This distinction is important for the present study: its three-part measure of cooling equipment, building shell quality, and water reliability is a data-constrained operationalization of selected SCP components, not a complete measure of thermal safety.
2.3. Household and Spatial Inequalities: The Importance of Analytical Scale
The choice of analytical scale is closely connected to the choice of indicators. National comparisons establish broad patterns, but do not by themselves identify how deprivations overlap among households or where they concentrate within a country. Yang et al. [30] find that more than half of the variance in cooling infrastructure inequity across Texas sits at the county level rather than the household level, which both justifies a multilevel framing and warns that determinants decisive in one setting may behave differently in another. Kim and Kim [21] likewise treat the spatial clustering of vulnerable populations as the object of policy design.
The urban-rural dimension of heat exposure deserves attention because climate change and urbanization interact. The urban heat island arises because sealed surfaces, dense building mass, reduced vegetation, and anthropogenic heat store and release more energy than rural land, raising urban air temperatures most strongly at night, when bodies and buildings would otherwise recover [31,32]. This does not protect rural households, which often face higher daytime exposure through outdoor work, lower-quality building fabric, and weaker access to services. In hot desert cities, the contrast can even reverse during the day, when irrigated urban vegetation produces a relatively cool island against bare surrounding land [33]. Urban or rural residence therefore cannot be interpreted as a direct measure of heat exposure; its association with deprivation also depends on housing, resources, and service provision. The mitigation literature translates these mechanisms into indicators at two scales. At the city scale, they include tree canopy and green-space cover, surface albedo and the share of cool or green roofs, street shading, and morphological indicators such as building density and sky-view factor, often organized through the local climate zone typology [34,35,36]. At the settlement and dwelling scale, which is more relevant for rural and peri-urban areas, they include roof and wall materials, shading devices, natural ventilation, evaporative cooling, and reliable water for these practices [11,27].
These distinctions matter when linking household surveys to spatial patterns. The Demographic and Health Survey (DHS) does not record neighborhood heat-island exposure, so the urban-rural variable in this study cannot directly measure microclimate differences. The building-shell and water dimensions, by contrast, correspond directly to the dwelling-scale heat-reduction indicators summarized in Table 1. Household and governorate-level analyses can thus reveal spatial inequalities in the measured components of cooling deprivation without claiming to capture every source of local thermal exposure.
Table 1.
SCP dimensions, DHS indicators, deprivation cut-offs, and heat-protection function.
The evidence base itself is geographically lopsided, dense in Europe, the United States, and parts of Asia and Latin America, and sparse in MENA despite the region’s exposure [8,12,28]. The cross-national SCP assessment that places Jordan among the better-performing hot countries is valuable precisely because such comparative evidence remains rare. However, a national-level classification does not establish how protection and deprivation are distributed across governorates or among households with different resources and housing conditions [12]. Subnational analysis is therefore necessary to determine what a favorable national position may conceal.
At the dwelling level, passive design and building fabric reduce the cooling needed before any device is switched on [11,27], and pairing rooftop photovoltaics with building thermal mass can substantially improve summer comfort where active cooling is unavoidable [37]. At the neighborhood and city level, urban greening and shade lower ambient temperature for every household beneath them, though the urban heat island remains a structural amplifier that dwelling-level measures cannot address alone [31,34]. At the widest scale, sustainable cooling agendas tie cooling to the full set of development goals and argue for treating summer energy poverty as a distinct object of policy with its own indicators [9,38], and the people-centered framework of Martinez et al. [29] integrates all three scales into nested protection layers requiring government action at every layer.
Two lessons bear directly on Jordan. Compounded, multidimensional deprivation calls for cross-sectoral responses spanning housing, water, and energy that a single-program response is bound to miss [3,39], and near-invisible summer energy poverty statistics are a cautionary tale for any country relying on winter-oriented or single-indicator monitoring, since what is not measured cannot be targeted [38,40]. These lessons reinforce the need to measure compounded deprivation directly and resolve it to the scale at which Jordanian housing, water, and energy policy is made.
2.4. Research Gap and Contribution of the Present Study
The preceding literature leaves three connected gaps. First, SCP research has developed through conceptual work, qualitative fieldwork, cross-national assessments, and emerging subnational applications [18,30,41], but the intermediate scale (households within sub-national units, where policies are actually implemented) remains underexplored. Second, the MENA region is underrepresented in the cooling poverty literature despite its high exposure; most household-level data come from Europe, the Americas, and South and Southeast Asia [8,28]. Jordan’s own studies on energy poverty show this pattern: national-level research has examined multidimensional energy poverty across governorates [42,43] and subjective fuel poverty factors at the sub-national level [44], but neither specifically considers cooling as a separate, multidimensional issue. Third, the role of water reliability alongside cooling equipment and building quality requires closer examination, given the physiological links between water availability and heat coping during extreme heat [3,29]. Jordan’s severe water scarcity makes it an especially revealing case for examining whether including water reliability changes the identification of cooling deprivation.
This study addresses these gaps by combining cooling equipment, building shell quality, and water reliability in a household-level deprivation index and examining their distribution across Jordan’s governorates. Its measurement contribution lies not in a new aggregation method, but in a context-sensitive operationalization of selected SCP components that makes overlapping infrastructure deficits visible beyond appliance ownership alone. Alternative index specifications, including the exclusion of water reliability, assess how these measurement choices affect the findings. The study thus contributes to the SCP literature by examining what multidimensional measurement reveals at the subnational scale that national comparisons and single indicators may conceal.
3. Methodology
3.1. Data and Analysis Sample
This study uses the 2023 Jordan Demographic and Health Survey, administered by the Department of Statistics (DoS) in partnership with ICF under the USAID-funded DHS Program [45]. The survey employs a stratified, two-stage probability design. All descriptive and inferential statistics apply the normalized household sample weight, and the survey design was declared in Stata 13 using the svyset command with 26 strata and 965 primary sampling units. Of the 19,476 interviewed households, the analysis retains the 18,434 with complete information on the model covariates and on household heating fuel. The 1042 excluded households are those reporting no heating or an unclassifiable “other” heating fuel and those with missing education of the household head. The fan, air-conditioner, wall, and roof variables have no missing values in the retained sample. The only incomplete SCP item is the water question, with 13 “do not know” responses, and all models are estimated on complete cases without imputation.
3.2. Measuring Systemic Cooling Poverty
Systemic Cooling Poverty is measured here as a three-dimensional deprivation index, following the consensual approach to multidimensional poverty measurement [46] and anchored in the SCP framework of Mazzone et al. [3], which identifies physical systems, social systems, and intangible capacities as the three infrastructure layers of cooling adequacy. The DHS instrument directly measures two physical-system dimensions and one social-system proxy, which are summarized with their indicators, cut-offs, and heat-protection functions in Table 1. These three dimensions are not presented as the complete set of SCP components, since the intangible layer and several physical attributes such as shading, ventilation, and neighborhood heat exposure are not observed in the DHS, but as the core subset that is both conceptually central to household thermal safety in a hot, water-scarce setting and measured consistently for a nationally representative sample.
Indicators were selected on five criteria: a direct link to one SCP infrastructure layer [3], a documented heat-protection mechanism, availability for every household in the 2023 JDHS, enough variation to discriminate between households, and low redundancy with the other indicators. The pairwise weighted correlations between the three indicators range from 0.03 to 0.09, so each dimension carries information the others do not. Only one indicator is a direct measure. Device ownership measures directly whether the household owns a fan or an air conditioner, but it is a proxy for access to active cooling, because it records neither use, capacity, working condition, nor the ability to pay for electricity. Wall and roof material is a proxy for passive thermal protection. It indicates likely solar heat gain but not insulation, orientation, ventilation, shading, or indoor temperature. Drinking-water sufficiency is a proxy for the reliability of water available for heat coping. It refers to drinking water over the last month, not to water used for evaporative cooling or to supply during heatwaves. Table 1 reports the measurement status of each indicator.
The first dimension, cooling equipment deprivation, is defined as the absence of both a fan and an air conditioner. This captures the SCP’s cooling-device sub-component of the physical system layer. A third DHS appliance variable (water cooler) was excluded because it records drinking-water dispensers rather than space-cooling devices. The second dimension, building shell deprivation, is defined as the presence of mud bricks, mud bricks with stones, or zinc-sheet construction in either the walls or the roof. These materials are thermally inadequate in summer: zinc roofs and walls generate extreme solar heat gain, and mud construction has poor insulation continuity. This dimension captures the SCP’s safe-buildings sub-component. The third dimension, water reliability deprivation, is defined as reporting insufficient drinking water in the last month. This captures supply intermittency rather than mere access, reflecting the SCP’s social-systems layer, specifically the adequacy of water infrastructure as a co-determinant of household thermal coping under heat stress. Three mechanisms justify treating it as a cooling dimension rather than as a separate measure of water poverty. Hydration is the first physiological defense against heat strain, and sweat-based body cooling, wetting the skin and clothing, and bathing all depend on water at hand [2]. Many low-cost household cooling practices, including evaporative coolers, floor wetting, and roof spraying, also consume water. Finally, piped supply in Jordan is rationed and delivered intermittently, so that households depend on storage tanks and purchased tanker water to bridge supply interruptions [47]. Because 99.2% of households have water on premises, the indicator isolates the reliability of supply rather than general access, which is the feature that links it to cooling adequacy. The 13 households reporting “do not know” are conservatively treated as non-deprived on this dimension.
To make the direction of the scale explicit, each indicator is coded 1 when the household is deprived and 0 otherwise, so that higher values always indicate greater deprivation. Cooling equipment deprivation equals 1 when the household owns neither an air conditioner nor a fan, while building shell deprivation equals 1 when the main wall material is mud bricks (21), mud bricks with stones (22), or zinc (35), or when the main roof material (hv215) is mud bricks (21), mud bricks with stones (22), or zinc (32). Water reliability deprivation equals 1 when the household reports that drinking water was not sufficient at least once in the last month (hv201b = 1), and the 13 “do not know” responses (hv201b = 8) are coded 0. The composite score, as the sum of the three indicators, runs from 0 (no deprivation) to 3 (deprived on all three dimensions), so the governorate values reported in Section 4 are mean deprivation scores on this 0 to 3 scale, and odds ratios above 1 in the regression results and Appendix A indicate higher odds of a higher, more deprived score. Because the wealth index runs from 1 (poorest) to 5 (richest), an odds ratio below 1 indicates that richer households are less deprived.
The composite SCP score is the unweighted sum of the three binary deprivation indicators (1 = deprived, 0 = adequate), ranging from 0 (adequate on all three) to 3 (deprived on all three). We weight the three dimensions equally, first, because the SCP framework treats physical and social infrastructures as jointly necessary for thermal safety and offers no basis for ranking one above another [3]. In the absence of such a basis, equal weighting is the standard default in counting approaches to multidimensional poverty, since any other set of weights embeds value judgments that the analyst would have to defend [48,49]. Second, data-driven weights add little in this setting, because the indicators are weakly correlated (0.03 to 0.09); the first principal component explains 37% of their variance, which is close to the 33% expected with no common structure, and its normalized loadings (0.29, 0.38, and 0.33) are close to equal. Third, equal weights keep the index transparent for monitoring, since a one-point change in the score always means one more deprivation. Because weights remain a normative choice, Section 4.7 reports how the results respond to alternative weights and identification rules. Five robustness checks are reported in Section 4.6, namely (A) excluding the 13 “do not know” water responses, (B) a stricter building definition requiring inadequacy in both walls and roof simultaneously, (C) a binary outcome contrasting any deprivation with none, (D) a binary outcome contrasting deprivation on two or more dimensions with fewer, and (E) a two-dimension index that omits water reliability, which tests whether the main findings depend on the water dimension, and Section 4.7 extends these checks to the weighting and aggregation of the index.
Three DHS variables are available in the Jordan 2023 file but excluded from the index; merit brief comment. Refrigerator ownership was excluded because 97.6% of households own a refrigerator, providing no meaningful variation for an index intended to differentiate deprivation. Toilet type and shared toilet status were excluded for the same reason (less than 5% deprived on either). Time to water source was excluded because 99.2% of households report water on premises. This pattern of near-universal provision on several SCP dimensions is itself a substantive finding: Jordan’s SCP challenge is concentrated in cooling equipment, building shell quality, and water reliability, not in sanitation, food cold chain, or physical water access.
3.3. Analytical Approach
The primary analytical approach combines a variance-decomposition model and a survey-corrected regression model, following the two-model strategy recommended [50,51,52] for complex survey data when a fully weighted multilevel estimator is unavailable [53]. In the first model, we fitted an unweighted random-intercept ordered logistic regression (meologit in Stata 13) without covariates, using governorate as the level-2 grouping variable. Its sole purpose is to compute the intraclass correlation (ICC), which measures the share of total SCP score variance attributable to the governorate level versus the household level. Because Stata 13 does not accept sampling weights in meologit, the ICC is unweighted and is interpreted as a descriptive approximation of the between-governorate share rather than a design-based estimate [50,52]. The ICC was computed manually from the printed random-intercept variance using the formula ICC = σ2_u/(σ2_u + π2/3), where π2/3 = 3.290 is the variance of the standard logistic distribution. The full multilevel model with covariates did not converge, which is expected with only twelve level-2 units; this is a well-documented constraint of random-effects estimation with few clusters, which also widens the uncertainty of the variance estimate itself [54,55,56,57]. To reflect this uncertainty, we report a 95% confidence interval for the ICC, obtained by transforming the confidence limits of the random-intercept variance, together with the median odds ratio (MOR), which expresses the same between-governorate variance on the odds-ratio scale [58,59].
In the second model, a survey-corrected ordered logistic regression (svy: ologit in Stata 13) with governorate entered as a fixed effect (eleven indicator variables, reference Amman) provides the main coefficient estimates and confidence intervals. This approach is design-consistent for the DHS’s clustered, stratified sampling scheme and produces valid standard errors and significance tests for the household-level predictors. Household-level covariates include household size and the household head’s age (continuous); rural residence and sex of head (binary); the DHS wealth index (ordinal 1–5); dwelling type (reference Apartment); and the household head’s educational attainment (reference No education). We computed average marginal effects for rural residence and the wealth index on the probability of each SCP score outcome (0, 1, 2, 3).
The ordered logit assumes proportional odds, meaning that each predictor has the same effect at every threshold of the outcome [60]. We tested this assumption with the Brant test [61], but the sparse top category (103 households at SCP = 3) produced perfect prediction, so we collapsed the outcome to 0, 1, and 2 or more and estimated a partial proportional-odds model with gologit2, whose autofit procedure relaxes the constraint only for predictors that violate it at the 5% level [62,63]. We report model fit with McFadden’s pseudo-R2, information criteria, and, for the binary survey logits, the Archer–Lemeshow F-adjusted goodness-of-fit test [64]. We assessed multicollinearity with variance inflation factors from the linear counterpart of the main model.
We assess the sensitivity of the index to its construction in three steps, following the uncertainty-analysis approach for composite indicators [65]. First, we recompute the household score under five alternative weighting schemes, each summing to one, namely a nested scheme that follows the SCP layers (physical systems 1/2, split equally between cooling equipment and building shell, and social systems 1/2), a cooling-led and a building-led scheme (1/2 on the lead dimension and 1/4 on each other dimension), frequency-based weights proportional to ln(1/p), where p is the weighted national deprivation rate of each dimension [49], and weights from the first principal component of the weighted correlation matrix. Second, we vary the identification rule of the counting approach [46], classifying households as deprived on at least one dimension (union), at least two, or all three (intersection), and report the headcount (H) and the adjusted headcount (M0). Third, we draw 1000 weight vectors from a flat Dirichlet distribution, which samples all non-negative weight combinations summing to one with equal probability. For each specification we recompute the governorate means, the vulnerability score, its ranking, and the priority set, and we compare them with the baseline using Spearman’s rank correlation. We assess household-level stability with survey-corrected fractional logit models of the weighted score (0 to 1) on the covariates [66].
3.4. Climate Linkage
Governorate-level SCP means were merged with projected near-term temperature anomalies derived from the EC-Earth3 CMIP6 model under SSP1-2.6 (the low-emissions pathway most consistent with the Paris Agreement’s 1.5 °C target), extracted for Jordan’s twelve governorates from the World Bank Climate Change Knowledge Portal [67]. The temperature anomaly is the difference between the projected 2021–2040 mean and the ERA5 reanalysis baseline mean for 1986–2005. Projected additional cooling-degree days (CDD, base 18 °C) were approximated as the temperature anomaly multiplied by 365. This linear approximation assumes that daily mean temperature exceeds the 18 °C base on every day of the year. The assumption holds in the hot season but not in winter, so the approximation overstates absolute CDD gains, most strongly in the cooler highland governorates, and we use it only to rank governorates by relative exposure. We computed a composite vulnerability score as the product of each governorate’s weighted mean SCP score and its projected additional CDD, measuring the convergence of current deprivation with future heat burden. Because this is a single-model projection, we interpret the vulnerability scores as relative rankings rather than absolute burdens and discuss the associated uncertainty in Section 3.5. We described observed summer heat with ERA5-Land monthly maximum temperature for 1981–2025, obtained from Earth Map [68] and averaged over each governorate and over June, July, and August. This observed layer is descriptive and does not enter the vulnerability score.
To set priorities for adaptation, we classify a governorate as a priority when its vulnerability score lies in the top half of the twelve governorates, that is, above the median score of 287. We use the median rather than a national reference value because the national mean SCP score (0.254) multiplied by the mean projected CDD gives a threshold of about 197, which ten of the twelve governorates exceed and which would therefore not discriminate between them. Under the baseline index, the rule selects Mafraq, Aqaba, Jarash, Karak, Madaba, and Ma’an, and the governorates that remain in the priority set under all weighting schemes in Section 4.7 form the core priority set, while the others are treated as conditional priorities.
3.5. Limitations
This study has six limitations. First, the SCP measure is confined to dimensions measurable in the DHS instrument; the social-system and intangible-capacity layers of SCP (community cooling facilities, adaptive knowledge and behaviors, and the role of urban greenery and building thermal design) are not captured. Second, the DHS cooling variables record ownership rather than use or adequacy; a household owning a fan or air conditioner that is broken or underused would be misclassified as cooling-adequate. The building and water indicators are also proxies, as set out in Section 3.2 and Table 1. Third, the cross-sectional design precludes causal inference. Fourth, the climate linkage uses a single CMIP6 model run; it does not propagate ensemble uncertainty into the vulnerability score, and the linear CDD approximation overstates absolute cooling-degree-day gains, so the scores are best read as relative rankings. Fifth, with only twelve governorates, the between-governorate variance is imprecisely estimated (ICC 95% CI 6.0–24.3%) and the ICC is unweighted. Multilevel models with covariates or random slopes could not be estimated, so we capture governorate effects through fixed effects rather than modeling them explicitly. Sixth, the analytic sample excludes 1042 households with no or unclassifiable heating fuel or missing education of the household head, which may slightly under-represent households without any heating, a group that may overlap with cooling deprivation.
4. Results
4.1. Prevalence and Distribution of SCP Deprivation
Water reliability is the most prevalent SCP deprivation in Jordan’s national household population, affecting 14.69% of households on a weighted basis. Cooling equipment deprivation affects 5.96%, and building shell deprivation affects 4.77%, so the three rates add up to a mean composite score of 0.254 on the 0 to 3 scale. The unweighted proportions are higher across all three dimensions, confirming that the DHS sample overrepresents deprived subpopulations relative to their true national weights. Weighted descriptive statistics for all three dimensions and the composite SCP score are presented in Table 2.
Table 2.
SCP deprivation dimensions and composite score distribution (N = 18,434).
At the composite level, 77.49% of Jordanian households are free of SCP deprivation on all three dimensions, while 19.75% are deprived on one, 2.59% on two, and 0.16% (approximately 31 weighted households out of a nationally representative sample) on all three simultaneously. The 1325 households deprived on two or more dimensions (SCP ≥ 2) constitute the policy-critical cluster; their thermal vulnerability is compounded across multiple infrastructure systems and cannot be addressed by any single-dimension intervention.
4.2. Geographic Profile of SCP Deprivation
Governorate-level SCP means range from 0.157 in Amman to 0.667 in Aqaba, with the highest-SCP cluster comprising Aqaba (0.667), Mafraq (0.644), Jarash (0.580), Karak (0.509), and Madaba (0.445). The most striking finding in the governorate profile is Aqaba’s top position in the SCP ranking. Aqaba has the highest air-conditioner ownership in the country (73.2%, against 47.1% in Amman, Figure 1), yet its multidimensional SCP score is the highest nationally, driven by the building shell dimension (27.3%, the highest of any governorate) and water reliability (35.3%). This reversal illustrates the core analytical value of the SCP framework, as a single-dimension analysis of cooling equipment access would have misclassified Aqaba as a cooling success, concealing severe deprivation on the physical infrastructure and water reliability dimensions.
Figure 1.
Household ownership of air conditioners and fans by governorate, Jordan, 2023 (%). Estimates are weighted and corrected for the survey design (26 strata, 965 PSUs). Error bars show 95% confidence intervals. Source: authors’ calculation from the Jordan DHS 2023 household recode (N = 18,434).
Air-conditioner ownership peaks in Aqaba at 73.2%, far above Balqa (48.9%), Irbid (47.6%), and Amman (47.1%), the next-highest governorates (Figure 1). Air-conditioner ownership is lowest in Karak (22.2%), Tafiela (22.6%), Mafraq (27.2%), and Ma’an (29.5%). Fan ownership ranges from 85.2% to 95.0% in every governorate except Ma’an, where it falls to 74.6%, and this gap accounts for Ma’an’s high cooling deprivation rate of 19.1% (Table 3). Aqaba combines the highest air-conditioner ownership with the highest SCP score, so a device-only measure would misclassify it as a cooling success.
Table 3.
Governorate-level SCP means, dimension rates, and climate vulnerability scores (weighted).
Mafraq and Jarash present a different multidimensional crisis pattern. Both are deprived across all three dimensions simultaneously: Mafraq shows cooling deprivation of 11.2%, building-shell deprivation of 14.9%, and water-reliability deprivation of 38.3%, the second highest in the country; Jarash shows cooling deprivation of 7.4%, building-shell deprivation of 9.9%, and water-reliability deprivation of 40.7%, the highest water-reliability deprivation nationally. These northern governorates were already identified by Jaber [42] as the most energy-deprived for heating fuel, confirming a persistent, multi-seasonal concentration of energy vulnerability in Jordan’s northern peripheral governorates. Governorate-level SCP profiles and climate vulnerability scores are presented in Table 3, sorted by vulnerability score.
4.3. Between-Governorate Variance Decomposition
The unweighted null meologit model, fitted without household-level covariates, yields an intraclass correlation coefficient (ICC) of 12.6%, indicating that this share of the total variance in SCP scores is attributable to which governorate a household lives in. The LR test against an ordinary ordered logit strongly rejects the null hypothesis of no between-governorate variance (p < 0.001). The 95% confidence interval is wide (6.0–24.3%), as expected with twelve governorates. The corresponding median odds ratio of 1.93 (95% CI 1.55–2.67) implies that moving a household from the lower-risk to the higher-risk of two randomly selected governorates would, in the median case, nearly double its odds of a higher SCP score. The ICC shows that governorate membership accounts for a meaningful share of the variance, but the null model does not identify which governorate characteristics produce it. Candidate explanations include differences in water infrastructure, housing stock, and climate, which we treat as hypotheses.
4.4. Determinants of SCP in Jordan
The survey-corrected ordered logistic model achieves an overall Wald F(22, 918) = 74.59 (p < 0.001). Table 4 presents the full results. The most important finding is that rural residence is not significant (OR = 1.067, Table 4). After controlling for wealth, governorate, dwelling type, and other covariates, rural households are no more likely than urban households to have a higher SCP score. Before adjustment, rural households are more deprived than urban households on every dimension (cooling equipment 9.2% against 5.6%, building shell 6.9% against 4.5%, and water reliability 24.4% against 13.6%). The rural gap disappears once wealth, governorate, and dwelling type are controlled, which suggests that it reflects the composition of rural households rather than rural location itself. One possible explanation is the wide reach of Jordan’s electricity and piped-water networks, which this analysis does not test. The robustness checks qualify this result, since rural residence becomes weakly protective at the multiple-deprivation threshold, as the threshold-specific estimates below show. The finding is best read as the absence of a rural penalty rather than as evidence that a household’s position on the urban-rural spectrum is irrelevant.
Table 4.
Survey-corrected ordered logistic regression: determinants of SCP deprivation score.
Wealth is the dominant individual-level predictor, and its effect is monotonic and consistent. Each wealth-quintile increase reduces the odds of a higher SCP score by approximately 30% (Table 4), and the probability of all-three-dimension deprivation (SCP = 3) declines by 0.06 percentage points per quintile, which may appear small in absolute terms but corresponds to a 38% reduction in a very rare outcome. Household size, age of head, sex of head, and all three education categories are not significant at conventional levels (Table 4). Education’s non-significance is noteworthy. In the multidimensional SCP index, once wealth and governorate are controlled, education contributes no independent explanatory power.
Dwelling type produces the single largest coefficient in the model. Households in informal or non-permanent dwellings have odds of an SCP score 14.67 times higher than apartment-dwelling households (Table 4). This effect is almost three times larger than the next largest, the Aqaba effect (OR = 5.477). Informal dwellings combine the three SCP deficits. Among them, 91.3% are deprived on the building shell, 32.2% on water reliability, and 19.1% of cooling equipment, against 4.8%, 14.7%, and 6.0% nationally. Part of this association is mechanical, because huts and barracks are usually built of zinc or mud, which the building dimension counts directly. Among informal-dwelling households with any cooling device, only 14.4% own an air conditioner, compared with 47.4% in apartments. Dar (detached houses) shows a borderline positive effect (OR = 1.242), and Villa is not significant (Table 4).
Among governorates, ten of eleven show significantly higher SCP odds than Amman (Table 4). Aqaba shows the largest effect (OR = 5.477), followed by Jarash (OR = 3.997), Karak (OR = 3.065), and Madaba (OR = 3.045). Irbid is the sole governorate not significantly different from Amman (OR = 0.824). The Aqaba governorate effect, which yields the highest OR in the model, deserves specific attention: controlling for wealth, household size, dwelling type, and all other covariates, the Aqaba effect (OR = 5.477) exceeds the entire gap between the poorest and richest wealth quintiles, whose odds differ by a factor of about 4.2 (0.6974 ≈ 0.24). The Aqaba effect is consistent with the governorate’s deficits in the building shell and water reliability dimensions. It persists after controlling for the household characteristics that would otherwise explain much of the observed deprivation, although the cross-sectional design cannot establish that these deficits cause it.
Because the proportional-odds assumption does not hold for all predictors, the partial proportional-odds model (Appendix A, Table A1) shows how these effects differ across thresholds, and its estimates refine the main results without reversing them. Informal dwellings exert their largest effect on entering deprivation (OR = 32.4 for any deprivation versus 9.2 for multiple deprivation), whereas Aqaba (3.7 versus 25.2), Jarash (3.6 versus 10.3), and Karak (2.7 versus 9.7) matter most for the accumulation of deprivations, and the wealth gradient steepens at the higher threshold (0.71 versus 0.47). Housing type is thus most closely associated with whether a household becomes deprived, while place is most closely associated with whether deprivations compound, a pattern consistent with a systemic reading of cooling poverty. Rural residence is not significant at either threshold of this model and is weakly protective in the survey-corrected multiple-deprivation logit (OR = 0.70, p = 0.015), although the poor fit of that model (Archer–Lemeshow p < 0.001) warrants caution.
4.5. Climate Vulnerability Matrix
Linking governorate SCP scores to projected climate data under SSP1-2.6 produces the vulnerability matrix shown in Table 3. All twelve Jordanian governorates are projected to experience temperature increases of 1.92–2.35 °C above the 1986–2005 baseline by 2021–2040, consistent with evidence that the Eastern Mediterranean and Middle East is warming almost twice as fast as the global average [69]. Mafraq ranks first in composite vulnerability (score = 497), combining the second-highest SCP mean (0.644) with 772 additional projected cooling-degree days. Aqaba ranks second (482), combining the highest SCP mean (0.667) with 723 additional CDD. Jarash ranks third (478), with the highest projected additional CDD among the three (823) and an SCP mean of 0.580. Karak (375) and Madaba (347) complete the top five.
Figure 2 shows that the hottest governorates in summer are Mafraq (35.5 °C), Zarqa (35.3 °C), and Ma’an (34.8 °C). The coolest are the highland governorates of Ajloun (32.2 °C), Karak (32.2 °C), Tafiela (32.2 °C), and Madaba (32.0 °C). Mafraq ranks first both in observed summer heat and in composite vulnerability, whereas Irbid and Ajloun show the largest projected CDD gains despite cooler observed summers. Aqaba’s area average (33.4 °C) understates conditions in Aqaba city, because the governorate polygon includes highland grid cells, and station records for the city report summer maxima near 39–41 °C.
Figure 2.
Mean summer (June to August) maximum near-surface air temperature by governorate, Jordan, 1981–2025 (°C). Values are area averages of gridded reanalysis data over each governorate. Source: authors’ calculation from FAO Earth Map [1], based on the ECMWF ERA5-Land reanalysis.
A critical observation from the climate matrix is that the two governorates with the largest projected increases in cooling-degree days, Irbid (+857 CDD, the highest nationally) and Ajloun (+834 CDD), are not among the most vulnerable overall, because their SCP scores are relatively low (Irbid 0.158; Ajloun 0.328). Conversely, the most SCP-deprived governorates, Aqaba and Mafraq, face moderate rather than extreme CDD increases (723 and 772, respectively). The vulnerability matrix thus produces a ranking that differs from either a deprivation-only or a climate-only ranking, and this non-redundancy is the primary analytical contribution of the cross-paper linkage: the households most likely to be harmed by climate change in Jordan are not simply the hottest governorates or the most deprived governorates, but those where moderate deprivation and moderate warming converge.
4.6. Robustness Checks and Model Diagnostics
The main results hold across the alternative specifications in Appendix A (Table A1). Excluding the 13 “do not know” water responses leaves all estimates virtually unchanged, and the stricter building definition, which flags 1318 rather than 2367 households, reduces the informal-dwelling odds ratio from 14.67 to 10.62 and the Aqaba odds ratio from 5.48 to 4.68 while leaving the wealth gradient intact (OR = 0.70). Removing the water dimension altogether preserves the dominance of informal dwellings (OR = 32.49) and the Aqaba effect (OR = 5.15), but Mafraq and Jarash lose significance, and the Spearman correlation between governorate rankings with and without water is 0.79 (p = 0.002). The household-level findings therefore do not depend on the water dimension, but the dimension is needed to identify two of the three most vulnerable governorates, Mafraq and Jarash, which supports retaining it in a water-scarce setting.
The diagnostics support the specification, since the McFadden pseudo-R2 is 0.110 for the weighted and 0.151 for the unweighted model (AIC = 26,648; BIC = 26,843), the mean variance inflation factor is 1.73 with no value above 4.1, and the binary any-deprivation model fits well (Archer–Lemeshow F(9, 931) = 0.21, p = 0.993; Table A1). The proportional-odds assumption does not hold for all predictors, since rural residence, wealth, dwelling type, and six governorates require threshold-specific coefficients in the partial proportional-odds model, while the remaining twelve predictors satisfy the parallel-lines constraint. The final model passes the global parallel-lines test (Wald χ2(12) = 11.16, p = 0.516). Housing type is thus most closely associated with whether a household becomes deprived, while place is most closely associated with whether deprivations compound, a pattern consistent with a systemic reading of cooling poverty. Rural residence is not significant at either threshold of this model and is weakly protective in the survey-corrected multiple-deprivation logit (OR = 0.70, p = 0.015), although the poor fit of that model (Archer–Lemeshow p < 0.001) warrants caution.
4.7. Sensitivity to Weighting and Aggregation
Table A2 in Appendix A shows that the main conclusions hold across the weighting and identification choices, since across the six weighting schemes the governorate ranking of mean deprivation correlates with the baseline at ρ = 0.91 to 0.99 and the vulnerability ranking at ρ = 0.89 to 0.99. Five governorates (Mafraq, Aqaba, Jarash, Karak, and Madaba) are in the priority set under every scheme and under all three identification rules, while the sixth position changes, with Ma’an holding it under four schemes, Ajloun under the nested scheme, and Tafiela under the building-led scheme. The Monte Carlo analysis confirms this pattern (Table A3), as Mafraq enters the priority set in all 1000 draws, Jarash in 99.7%, Aqaba in 93.3%, Karak in 92.3%, and Madaba in 86.4%, while Ma’an enters in 51.5% and no other governorate in more than 34%. The median correlation with the baseline vulnerability ranking is 0.92, with a 5th percentile of 0.71 and a minimum of 0.48.
At the household level, wealth is protective under every scheme (OR = 0.65 to 0.78, p < 0.001), and rural residence is never significant (OR = 0.99 to 1.04). Informal dwellings remain significant under all schemes (OR = 3.19 to 8.27) and are the largest predictor in five of the six, ranking third behind Aqaba and Jarash only under the nested scheme, which gives water half the weight, while the Aqaba effect is significant under all schemes (OR = 2.96 to 5.97). The identification rule changes the scale of SCP more than its geography, since the union rule identifies 22.5% of households, the two-dimension rule 2.8%, and the intersection rule 0.2% (M0 = 0.085, 0.019, and 0.002). Because the intersection rule rests on only 103 households and is too sparse to support governorate comparisons, we treat Mafraq, Aqaba, Jarash, Karak, and Madaba as the core priority set and Ma’an as a conditional priority.
5. Discussion
These results demonstrate that cooling poverty in Jordan cannot be adequately characterized by any single dimension. The SCP framework [3] generates a different and more policy-relevant picture of vulnerability than a single-dimension analysis would. A governorate ranked first for cooling-equipment access (Aqaba) ranks highest for multidimensional SCP deprivation. Rural residence, often assumed to be a significant predictor of energy deprivation, carries no independent penalty in the multidimensional index once wealth and location are controlled. The model’s largest predictor, informal dwelling type, is not the factor a conventional single-indicator analysis would flag as dominant. This corroborates the broader finding of the first large-scale, cross-country SCP assessment that the dimensions driving deprivation are frequently not the ones a device-ownership metric would flag [12], and it extends that finding to the sub-national scale, which cross-country work cannot reach.
The absence of a rural penalty is the finding most directly relevant to Jordanian energy policy. Where social protection relies on geographic proxies that assume a rural disadvantage, these results suggest that such proxies may miss the households most exposed to SCP. One possible explanation, which we do not test, is that electricity and piped-water networks reach rural households widely enough that wealth, rather than location, now separates the deprived from the non-deprived. This does not mean geography is irrelevant, only that it operates differently than a rural-urban split implies. The between-governorate ICC of 12.6% confirms a real and statistically significant place effect, but one considerably smaller than the 53–62% of cooling-infrastructure variance that Yang et al. [30] attribute to the county level in Texas, where educational attainment rather than wealth is the dominant predictor. The contrast is instructive. Where Yang et al. find geography and education compounding one another, Jordan’s geography appears to work through housing typology and infrastructure provision rather than through education or a strict rural-urban divide. Instruments targeted by household wealth, such as income support or appliance subsidies, therefore deserve evaluation alongside geographic targeting.
The finding on informal dwellings suggests a different framing of the policy problem. The informal-dwelling effect means that living in an informal or non-permanent dwelling is, by far, the single strongest predictor of multidimensional SCP, after controlling for wealth, governorate, and all other household characteristics. This is not simply because informal-dwelling households are poorer; wealth is controlled. Informal dwellings are deprived on all three dimensions far more often than other dwellings (Section 4.4), although part of the building-shell association follows from how these units are built. Informal and non-permanent dwellings (huts, barracks, and other units) house 1.2% of Jordanian households, almost all of them (94%) in urban areas, and they are concentrated in Mafraq, where they house 14.1% of households, and in Zarqa (2.7%), with less than 1% in every other governorate. Read through the justice literature on heat mitigation, this pattern can be interpreted as a recognitional as well as a distributional problem. Kianmehr [20] finds that heat planning consistently over-invests in distributional fixes, such as subsidies or hardware transfers, while under-investing in the procedural and recognitional dimensions that would identify informal and migrant communities as a distinct policy constituency in the first place. Oppermann et al. [16] make the same point through the capabilities approach, arguing that cool inclusion requires recognizing the specific struggles of populations routinely rendered invisible in energy transition planning, not merely distributing appliances to them. This distributional-and-recognitional framing shapes the policy recommendation developed in the conclusion below.
The Aqaba reversal is the strongest empirical argument for the SCP multidimensional approach, and it resolves a puzzle that the cross-national literature could set up but not solve. Aqaba’s households have the highest air-conditioner ownership in the country (73.2%, about 26 percentage points above the 47.1% in Amman, Figure 1), making it the apparent success story of Jordan’s cooling landscape by that single measure. In the present analysis, Aqaba has the highest mean SCP score among governorates and the highest regression OR relative to Amman. The reconciliation lies in the other two SCP dimensions, since Aqaba’s building shell deprivation rate is nearly three times the national weighted average, and its water reliability deprivation is more than double the national average. The DHS does not identify why air-conditioner ownership is so high in Aqaba, although the governorate’s hotter coastal climate and its port and tourism economy are two possible explanations that this study does not test. The building-shell deprivation does not reflect informal dwelling types, which are almost absent in Aqaba (0.0% of households), but mud and zinc walls or roofs in conventional dwellings. This is precisely the configuration the first cross-country SCP assessment could not see. That assessment classifies Jordan among the better-performing hot countries in the Global South, on the strength of its national infrastructure, service access, and policy frameworks [12]. The present household-level analysis shows what that classification conceals within a single governorate. A country-level score based on national averages and a governorate-level score based on AC ownership alone would each tell a reassuring story about Aqaba. Only the multidimensional, sub-national measure catches the deprivation that both would have missed.
Mafraq and Jarash are the governorates that most clearly require immediate multidimensional intervention. Both appear in the top three of the climate vulnerability matrix and show elevated deprivation across all three SCP dimensions simultaneously. Mafraq also combines the highest observed summer heat with the highest composite vulnerability (Figure 2). Mafraq’s water-reliability deprivation is the second highest in the country (38.3%, after Jarash at 40.7%), combined with a cooling deficit nearly twice Amman’s rate (11.2% against 5.7%) and a significant building shell deficit. This pattern is consistent with Mafraq’s documented status as the governorate with the highest multidimensional energy-poverty rate in Jordan across the 2009, 2018, and 2023 survey waves [42,43]. Mafraq also hosts a large refugee population. This analysis does not use refugee status, so this context is a possible explanation rather than a tested mechanism. Jarash’s profile is similar in structure if somewhat different in magnitude. The climate linkage worsens this, since both governorates face above-average temperature anomalies under SSP1-2.6 and among the highest additional cooling-degree-day projections in the country. Electric fans lose effectiveness at very high air temperatures [2], and the region is warming faster than the global average [69]. Households without air conditioning in Mafraq and Jarash therefore face growing heat risk as temperatures rise.
The climate vulnerability analysis also reveals that Jordan’s Nationally Determined Contribution (NDC 3.0, submitted in September 2025) does not explicitly address the cooling-access adaptation gap identified by this analysis. Jordan’s NDC commitments are concentrated on mitigation through renewable energy and storage, electric mobility, and high-performance building standards, with adaptation priorities centered on water security, agricultural resilience, and urban heat mitigation but without a household cooling-access target [70]. Kim and Kim [21] argue, using Los Angeles County as a case, that home cooling should be treated as a habitability requirement on a par with heating, water, and electricity, rather than as an amenity outside the scope of adaptation policy. Jordan’s own adaptation architecture currently reflects the older framing. The SCP vulnerability matrix demonstrates a specific, geographically concentrated adaptation gap in the priority governorates defined in Section 3.4, namely the core set of Mafraq, Aqaba, Jarash, Karak, and Madaba, with Ma’an as a conditional priority. Because the three SCP dimensions measured here sit across energy, housing, and water portfolios, closing this gap is unlikely to succeed as a single-ministry program. The people-centered cooling framework of Martinez et al. [29], which nests interventions from the individual body through the dwelling to the region and insists that every layer needs the enabling power of government, describes the coordination problem well. These three threads (the informal-dwelling lever, the multi-sectoral coordination requirement, and the case for a named cooling-adaptation target) are taken up in turn in the conclusion below.
These interpretations are subject to the six limitations noted in Section 3.5. The most consequential for the discussion is the DHS instrument’s inability to capture passive building design, urban heat-island exposure, or community cooling resources. Aqaba’s building-shell deprivation captures zinc-wall and mud-roof construction, but not the absence of shading, reflective surfaces, or green space that compounds thermal discomfort in deprived neighborhoods. A full accounting of the SCP physical-system layer would require additional data sources, and the vulnerability scores reported here may understate SCP severity in the most deprived communities.
6. Conclusions
This study has implemented the Systemic Cooling Poverty framework for Jordan using the 2023 Demographic and Health Survey, constructing a three-dimensional deprivation index across cooling equipment, building shell quality, and water reliability, and linking the resulting governorate-level deprivation profile to near-term temperature projections under the SSP1-2.6 climate pathway. The central finding is that multidimensional SCP in Jordan is driven by informal dwelling status, concentrated in five governorates that are robust to the index assumptions, with Ma’an a conditional sixth, not independently associated with rural residence, and disproportionately exposed to future heat stress in precisely those governorates where current deprivation is highest.
Three research questions were formulated to structure the study. The first question concerned how prevalent systemic cooling poverty is in Jordan when it is measured as a multidimensional condition spanning cooling equipment, building shell quality, and water reliability, rather than through any single indicator. Our results show that at the composite level, almost 78% of Jordanian households are free of SCP deprivation on all three dimensions, while the other 22% are deprived on at least one, and governorate-level SCP means range from 0.157 in Amman to 0.667 in Aqaba.
To answer the second question (Which household and geographic characteristics determine a household’s position on this multidimensional measure, and does the rural-urban divide survive once wealth and location are controlled?), once wealth, governorate, dwelling type, and other covariates are controlled, rural households are no more likely than urban households to have a higher SCP score. One possible explanation is the wide reach of Jordan’s electricity and piped-water networks, which this study does not test. Rural residence becomes weakly protective at the multiple-deprivation threshold (Section 4.4). However, the results highlight the importance of the informal-dwelling effect, which means that living in an informal or non-permanent dwelling is the single strongest predictor of multidimensional SCP.
The answer to the third question (How much of the variation in systemic cooling poverty is attributable to the governorate a household lives in, and where does current deprivation converge with projected future heat?) is that the governorate accounts for 12.6% of the variance in SCP scores, and that deprivation and projected heat converge most in Mafraq, Aqaba, Jarash, Karak, and Madaba, a set that holds under every weighting and aggregation rule tested.
Three policy conclusions can be drawn. First, Jordan should base its cooling adaptation strategy on upgrading informal settlements rather than rural targeting. Informal dwelling status is the strongest household-level predictor of SCP, and its deprivations lie mainly in the building shell and water supply, which income support or geographic targeting alone do not address. In practice, Jordan could use the SCP dwelling indicators (mud or zinc walls and roofs) as an eligibility criterion within existing household targeting systems such as the National Aid Fund registry. Municipal upgrading programs could then finance low-cost shell retrofits, including roof insulation, reflective coatings, and external shading, starting with Mafraq, where 14.1% of households live in huts, barracks, or other non-permanent units, and with mud and zinc dwellings in Aqaba (27.3% building-shell deprivation), Karak (18.2%), and Tafiela (14.5%) [11,27]. Second, coordinated efforts across sectors are crucial, because the three SCP dimensions fall under the energy, housing, and water portfolios. Successful responses require inter-ministerial programs that simultaneously improve building quality, water supply reliability, and access to cooling equipment for the same households and communities. One practical mechanism is a joint delivery protocol among the Ministry of Energy and Mineral Resources, the Ministry of Water and Irrigation, and the Housing and Urban Development Corporation. Under such a protocol, the same households would receive combined packages, for example an efficient fan or air conditioner, a shell retrofit, and household water storage with priority summer supply schedules in the core priority governorates. Third, Jordan’s NDC 3.0 [70] already places water security and urban heat mitigation at the center of its adaptation agenda and lists high-performance building standards among its mitigation measures. The cooling-access gap could therefore be narrowed by extending commitments the country has already made, without creating a separate policy pillar. The implementation of NDC 3.0 and the National Adaptation Plan [71] should include a cooling-access adaptation goal with a measurable indicator, namely the share of households deprived on two or more SCP dimensions. This indicator would take the 2023 weighted baseline of 2.8% nationally and the governorate values reported here as reference points, prioritize the core priority governorates, and track progress through successive DHS rounds and Department of Statistics household surveys.
Each recommendation can be tied to the dimension it addresses and to the governorates where measured deprivation on that dimension is highest. Cooling equipment deprivation is highest in Ma’an (19.1%), Mafraq (11.2%), and Karak (11.0%), where the Ministry of Energy and Mineral Resources and the National Aid Fund could provide efficient fans or air conditioners to deprived households through the National Aid Fund registry, with progress monitored through the share of households owning neither a fan nor an air conditioner. Building shell deprivation is highest in Aqaba (27.3%), Karak (18.2%), Mafraq (14.9%), and Tafiela (14.5%), where the Housing and Urban Development Corporation and municipalities could finance shell retrofits, including roof insulation, reflective coatings, and shading, for mud and zinc dwellings, tracked through the share of households with mud or zinc walls or roofs. Water reliability deprivation is highest in Jarash (40.7%), Mafraq (38.3%), Aqaba (35.3%), and Madaba (28.2%), where the Ministry of Water and Irrigation and the water utilities could support household storage and priority summer supply schedules, monitored through the share of households reporting insufficient drinking water in the last month. For the 2.8% of households deprived on two or more dimensions nationally, a joint protocol of these bodies could deliver a combined package in the core priority governorates defined in Section 3.4, and the headcount at two or more dimensions, reported under NDC 3.0, would serve as the overall indicator of progress, with the weighted 2023 JDHS rates as the baseline.
Future research should extend this analysis in four directions, namely longitudinal data, when available, to assess whether the SCP profile is widening or narrowing over time; a richer SCP measure incorporating urban heat-island exposure, passive building design, and community cooling resource data; a multi-model CMIP6 ensemble to propagate climate uncertainty into the vulnerability scores reported here, using directly projected cooling-degree days and at least one higher-emission scenario such as SSP2-4.5; and evaluations of whether the dwelling and water interventions proposed above reduce measured deprivation, ideally through quasi-experimental designs that can support the causal inference this cross-sectional study cannot.
Author Contributions
Conceptualization, M.M.J.; methodology, M.M.J.; software, M.M.J.; validation, M.M.J.; formal analysis, M.M.J.; investigation, M.M.J.; resources, M.M.J.; data curation, M.M.J.; writing—original draft preparation, M.M.J. and T.S.; writing—review and editing, M.M.J. and T.S.; visualization, M.M.J.; supervision, M.M.J.; funding acquisition, T.S. All authors have read and agreed to the published version of the manuscript.
Funding
This paper was supported by the János Bolyai Research Scholarship of the Hungarian Academy of Sciences. This paper was supported by the University Research Scholarship Programme (EKÖP) of the Ministry for Culture and Innovation, funded by the National Research, Development and Innovation Fund, under grant number 2026-2.1.1-EKÖP-2026-00025.
Institutional Review Board Statement
Not applicable.
Informed Consent Statement
Not applicable.
Data Availability Statement
Restrictions apply to the availability of these data. Data were obtained from the DHS Program website (https://www.dhsprogram.com/) with DHS permission.
Acknowledgments
Mohammad Jaber would like to acknowledge the support of the University Research Scholarship Programme (EKÖP) of the Ministry for Culture and Innovation, funded by the National Research, Development and Innovation Fund, under grant number 2026-2.1.1-EKÖP-2026-00025. Tekla Szép would like to acknowledge the support of the János Bolyai Research Scholarship of the Hungarian Academy of Sciences. During the preparation of this manuscript, the authors used Grammarly Pro Edition (v1.2.285.1937) for the purposes of language editing. The authors have reviewed and edited the output and take full responsibility for the content of this publication.
Conflicts of Interest
The authors declare no conflicts of interest.
Appendix A
Table A1.
Robustness checks: odds ratios for key predictors across alternative specifications.
Table A2.
Sensitivity of governorate rankings, priority set, and household-level odds ratios to weighting and identification rules.
Table A3.
Monte Carlo weight uncertainty: governorate ranks and inclusion in the priority set over 1000 random weight vectors.
References
- Morales, C.; Díaz, A.S.-P.; Dionisio, D.; Guarnieri, L.; Marchi, G.; Maniatis, D.; Mollicone, D. Earth Map: A Novel Tool for Fast Performance of Advanced Land Monitoring and Climate Assessment. J. Remote Sens. 2023, 3, 0003. [Google Scholar] [CrossRef] [Scilit]
- Jay, O.; Capon, A.; Berry, P.; Broderick, C.; de Dear, R.; Havenith, G.; Honda, Y.; Kovats, R.S.; Ma, W.; Malik, A.; et al. Reducing the Health Effects of Hot Weather and Heat Extremes: From Personal Cooling Strategies to Green Cities. Lancet 2021, 398, 709–724. [Google Scholar] [CrossRef] [Scilit] [PubMed]
- Mazzone, A.; De Cian, E.; Falchetta, G.; Jani, A.; Mistry, M.; Khosla, R. Understanding Systemic Cooling Poverty. Nat. Sustain. 2023, 6, 1533–1541. [Google Scholar] [CrossRef] [Scilit]
- Mazzone, A. Thermal Comfort and Cooling Strategies in the Brazilian Amazon. An Assessment of the Concept of Fuel Poverty in Tropical Climates. Energy Policy 2020, 139, 111256. [Google Scholar] [CrossRef] [Scilit]
- Thomson, H.; Simcock, N.; Bouzarovski, S.; Petrova, S. Energy Poverty and Indoor Cooling: An Overlooked Issue in Europe. Energy Build. 2019, 196, 21–29. [Google Scholar] [CrossRef] [Scilit]
- Choi, Y.; Song, D.; Ozaki, A.; Baek, S. A Study of the Unexplored Aspect of Energy Poverty: Overheating Risk Analysis. Sage Open 2024, 14, 21582440241290967. [Google Scholar] [CrossRef] [Scilit]
- Sánchez-Guevara Sánchez, C.; Neila González, F.J.; Hernández Aja, A. Energy Poverty Methodology Based on Minimal Thermal Habitability Conditions for Low Income Housing in Spain. Energy Build. 2018, 169, 127–140. [Google Scholar] [CrossRef] [Scilit]
- Falchetta, G.; Cian, E.D.; Pavanello, F.; Wing, I.S. Inequalities in Global Residential Cooling Energy Use to 2050. Nat. Commun. 2024, 15, 7874, Correction in Nat. Commun. 2024, 15, 9425. [Google Scholar] [CrossRef] [Scilit] [PubMed]
- Khosla, R.; Miranda, N.D.; Trotter, P.A.; Mazzone, A.; Renaldi, R.; McElroy, C.; Cohen, F.; Jani, A.; Perera-Salazar, R.; McCulloch, M. Cooling for Sustainable Development. Nat. Sustain. 2021, 4, 201–208. [Google Scholar] [CrossRef] [Scilit]
- Mastrucci, A.; Byers, E.; Pachauri, S.; Rao, N.D. Improving the SDG Energy Poverty Targets: Residential Cooling Needs in the Global South. Energy Build. 2019, 186, 405–415. [Google Scholar] [CrossRef] [Scilit]
- Kajjoba, D.; Wesonga, R.; Lwanyaga, J.D.; Kasedde, H.; Olupot, P.W.; Kirabira, J.B. Assessment of Thermal Comfort and Its Potential for Energy Efficiency in Low-Income Tropical Buildings: A Review. Sustain. Energy Res. 2025, 12, 25. [Google Scholar] [CrossRef] [Scilit]
- Falchetta, G.; Mazzone, A.; Bhasin, S.; Davide, M.; Bezerra, P.; Fabbri, K.; Bertarelli, G.; Pistorio, A.; Dal Barco, I.; De Cian, E. A Multidimensional Assessment of Systemic Cooling Poverty in the Global South. Nat. Sustain. 2026, 9, 1266–1276. [Google Scholar] [CrossRef] [Scilit]
- Mazzone, A.; De Cian, E.; de Paula, E.; Ferreira, A.; Khosla, R. Understanding Thermal Justice and Systemic Cooling Poverty from the Margins: Intersectional Perspectives from Rio de Janeiro. Local Environ. 2024, 29, 1026–1043. [Google Scholar] [CrossRef] [Scilit]
- Pistorio, A. Systemic Cooling Poverty at the Urban Scale: Evidence from Venice Provincial Area. Master’s Thesis, Ca’ Foscari University, Venice, Italy, 2024. Available online: https://unitesi.unive.it/handle/20.500.14247/25773 (accessed on 29 July 2026).
- Yang, Y.; Han, H.; Li, S.; Fu, J.; Su, X.; Fan, C. A Multilevel Regression Model to Explain Disparities in Residential Cooling Infrastructure across Heat-Threatened Regions. Appl. Geogr. 2026, 189, 103939. [Google Scholar] [CrossRef] [Scilit]
- Mastrucci, A.; Byers, E.; Pachauri, S.; Rao, N.; van Ruijven, B. Cooling Access and Energy Requirements for Adaptation to Heat Stress in Megacities. Mitig. Adapt. Strateg. Glob. Change 2022, 27, 59. [Google Scholar] [CrossRef] [Scilit]
- Jaber, M.M. Multidimensional Energy Poverty in Jordan between 2009 and 2018: Progress and Possible Policy Interventions. Reg. Stat. 2023, 13, 434–450. [Google Scholar] [CrossRef] [Scilit]
- Jaber, M.M.; Stojilovska, A.; Yoon, H. Assessing the Determinants of Energy Poverty in Jordan Based on a Novel Composite Index. Urban. Sci. 2025, 9, 263. [Google Scholar] [CrossRef] [Scilit]
- Jaber, M.M.; Szép, T. Subjective Indicators of Fuel Poverty in Zarqa Governorate, Jordan. Energy Effic. 2024, 17, 21. [Google Scholar] [CrossRef] [Scilit]
- Martinez, G.S.; Camarasa, C.; Kazanci, O.B. People-Centered Cooling: Protecting Health against Hazardous Heat, from the Person to the Planet. Int. J. Biometeorol. 2025, 69, 2141–2156. [Google Scholar] [CrossRef] [Scilit] [PubMed]
- Bouzarovski, S.; Petrova, S. A Global Perspective on Domestic Energy Deprivation: Overcoming the Energy Poverty–Fuel Poverty Binary. Energy Res. Soc. Sci. 2015, 10, 31–40. [Google Scholar] [CrossRef] [Scilit]
- Palma, P.; Gouveia, J.P.; Mahoney, K.; Bessa, S. It Starts at Home: Space Heating and Cooling Efficiency for Energy Poverty and Carbon Emissions Reduction in Portugal. PPP 2022, 16, 13–32. [Google Scholar] [CrossRef] [Scilit]
- Cong, S.; Nock, D.; Qiu, Y.L.; Xing, B. Unveiling Hidden Energy Poverty Using the Energy Equity Gap. Nat. Commun. 2022, 13, 2456. [Google Scholar] [CrossRef] [Scilit] [PubMed]
- Kwon, M.; Cong, S.; Nock, D.; Huang, L.; Qiu, Y.; Xing, B. Forgone Summertime Comfort as a Function of Avoided Electricity Use. Energy Policy 2023, 183, 113813. [Google Scholar] [CrossRef] [Scilit]
- Jiménez Torres, M.; May Tzuc, O.; Bienvenido-Huertas, D.; Herrera, J.I.; Canul Turriza, R.A.; Pérez-Fargallo, A. Assessing Vulnerability and Energy Poverty with Emphasis on Comfort Adaptability: A Case Study of Southeastern Mexico. Energy Policy 2026, 213, 115226. [Google Scholar] [CrossRef] [Scilit]
- Rakotomena, M.; Ricci, O. Measuring Energy Poverty: A Climate-Aware Multidimensional Approach. Soc. Indic. Res. 2025, 180, 943–969. [Google Scholar] [CrossRef] [Scilit]
- Igawa, M.; Piao, X.; Managi, S. The Impact of Cooling Energy Needs on Subjective Well-Being: Evidence from Japan. Ecol. Econ. 2022, 198, 107464. [Google Scholar] [CrossRef] [Scilit]
- Santamouris, M.; Pavlou, K.; Synnefa, A.; Niachou, K.; Kolokotsa, D. Recent Progress on Passive Cooling Techniques: Advanced Technological Developments to Improve Survivability Levels in Low-Income Households. Energy Build. 2007, 39, 859–866. [Google Scholar] [CrossRef] [Scilit]
- Fobi Kontor, M.; Brown, A.; Núñez Collado, J.R. Climate Justice and Heat Inequity in Poor Urban Communities: The Lens of Transitional Justice, Green Climate Gentrification, and Adaptation Praxis. Urban. Sci. 2025, 9, 226. [Google Scholar] [CrossRef] [Scilit]
- Oppermann, E.; Walker, G.; Cross, J. Cool Inclusion: Thermal Inequality in an Overheating Climate. In Post-Carbon Inclusion; Bristol University Press: Bristol, UK, 2024; pp. 138–155. [Google Scholar]
- Mazzone, A. The Forgotten Thermal Comfort. Lived Experiences of Cooling Poverty from the Trans Community in Rio de Janeiro. Local Environ. 2026, 31, 350–377. [Google Scholar] [CrossRef] [Scilit]
- Berger, T. Too Cool or Too Hot: Thermal Comfort in Low-Income Homes and Lived Experiences of Energy Poverty in India and Austria. In Living with Energy Poverty; Routledge: London, UK, 2023. [Google Scholar]
- Kianmehr, A. Toward Equity in Heat Mitigation Planning: A Review of Literature, Current Practices, and Future Pathways. Local Environ. 2025, 31, 1872–1893. [Google Scholar] [CrossRef] [Scilit]
- Kim, S.; Kim, D. Climate Change and Cooling Equity: Spatial Dynamics of Vulnerable Populations. Growth Change 2024, 55, e12701. [Google Scholar] [CrossRef] [Scilit]
- Romero Rodríguez, L.; Sánchez Ramos, J.; Guerrero Delgado, M.; Molina Félix, J.L.; Álvarez Domínguez, S. Mitigating Energy Poverty: Potential Contributions of Combining PV and Building Thermal Mass Storage in Low-Income Households. Energy Convers. Manag. 2018, 173, 65–80. [Google Scholar] [CrossRef] [Scilit]
- Bowler, D.E.; Buyung-Ali, L.; Knight, T.M.; Pullin, A.S. Urban Greening to Cool Towns and Cities: A Systematic Review of the Empirical Evidence. Landsc. Urban Plan. 2010, 97, 147–155. [Google Scholar] [CrossRef] [Scilit]
- Chapman, S.; Watson, J.E.M.; Salazar, A.; Thatcher, M.; McAlpine, C.A. The Impact of Urbanization and Climate Change on Urban Temperatures: A Systematic Review. Landsc. Ecol. 2017, 32, 1921–1935. [Google Scholar] [CrossRef] [Scilit]
- Koukoufikis, G.; Roca Reina, J.C.; Katoufa, N.; Ozdemir, E.; Volt, J.; Carlsson, J. Addressing Residential Cooling Demand and Summer Energy Poverty in the EU—Towards a Cooler Future; Publications Office of the European Union: Luxembourg, 2026. [Google Scholar] [CrossRef]
- Roy, J.; Some, S.; Das, N.; Pathak, M. Demand Side Climate Change Mitigation Actions and SDGs: Literature Review with Systematic Evidence Search. Environ. Res. Lett. 2021, 16, 043003. [Google Scholar] [CrossRef] [Scilit]
- Torrego-Gómez, D.; Gayoso-Heredia, M.; San-Nicolás Vargas, P.; Núñez-Peiró, M.; Sánchez-Guevara, C. Recognising Summer Energy Poverty. Evidence from Southern Europe. Local Environ. 2024, 29, 495–523. [Google Scholar] [CrossRef] [Scilit]
- Oke, T.R. The Energetic Basis of the Urban Heat Island. Q. J. R. Meteorol. Soc. 1982, 108, 1–24. [Google Scholar] [CrossRef] [Scilit]
- Lazzarini, M.; Molini, A.; Marpu, P.R.; Ouarda, T.B.M.J.; Ghedira, H. Urban Climate Modifications in Hot Desert Cities: The Role of Land Cover, Local Climate, and Seasonality. Geophys. Res. Lett. 2015, 42, 9980–9989. [Google Scholar] [CrossRef] [Scilit]
- Stewart, I.D.; Oke, T.R. Local Climate Zones for Urban Temperature Studies. Bull. Am. Meteorol. Soc. 2012, 93, 1879–1900. [Google Scholar] [CrossRef] [Scilit]
- Santamouris, M. Cooling the Cities—A Review of Reflective and Green Roof Mitigation Technologies to Fight Heat Island and Improve Comfort in Urban Environments. Sol. Energy 2014, 103, 682–703. [Google Scholar] [CrossRef] [Scilit]
- Department of Statistics (DoS); ICF. Jordan Population and Family Health Survey 2023; DoS: Amman, Jordan; ICF: Rockville, MD, USA, 2024.
- Alkire, S.; Foster, J. Counting and Multidimensional Poverty Measurement. J. Public Econ. 2011, 95, 476–487. [Google Scholar] [CrossRef] [Scilit]
- Klassert, C.; Sigel, K.; Gawel, E.; Klauer, B. Modeling Residential Water Consumption in Amman: The Role of Intermittency, Storage, and Pricing for Piped and Tanker Water. Water 2015, 7, 3643–3670. [Google Scholar] [CrossRef] [Scilit]
- Alkire, S.; Roche, J.M.; Ballon, P.; Foster, J.; Santos, M.E.; Seth, S. Multidimensional Poverty Measurement and Analysis; Oxford University Press: Oxford, UK, 2015. [Google Scholar]
- Decancq, K.; Lugo, M.A. Weights in Multidimensional Indices of Wellbeing: An Overview. Econom. Rev. 2013, 32, 7–34. [Google Scholar] [CrossRef] [Scilit]
- Rabe-Hesketh, S.; Skrondal, A. Multilevel Modelling of Complex Survey Data. J. R. Stat. Soc. Ser. A Stat. Soc. 2006, 169, 805–827. [Google Scholar] [CrossRef] [Scilit]
- Asparouhov, T. General Multi-Level Modeling with Sampling Weights. Commun. Stat.-Theory Methods 2006, 35, 439–460. [Google Scholar] [CrossRef] [Scilit]
- Carle, A.C. Fitting Multilevel Models in Complex Survey Data with Design Weights: Recommendations. BMC Med. Res. Methodol. 2009, 9, 49. [Google Scholar] [CrossRef] [Scilit] [PubMed]
- Pfeffermann, D.; Skinner, C.J.; Holmes, D.J.; Goldstein, H.; Rasbash, J. Weighting for Unequal Selection Probabilities in Multilevel Models. J. R. Stat. Soc. Ser. B. Stat. Methodol. 1998, 60, 23–40. [Google Scholar] [CrossRef] [Scilit]
- Maas, C.J.M.; Hox, J.J. Sufficient Sample Sizes for Multilevel Modeling. Methodology 2005, 1, 86–92. [Google Scholar] [CrossRef] [Scilit]
- Bryan, M.L.; Jenkins, S.P. Multilevel Modelling of Country Effects: A Cautionary Tale. Eur. Sociol. Rev. 2016, 32, 3–22. [Google Scholar] [CrossRef] [Scilit]
- McNeish, D.M.; Stapleton, L.M. The Effect of Small Sample Size on Two-Level Model Estimates: A Review and Illustration. Educ. Psychol. Rev. 2016, 28, 295–314. [Google Scholar] [CrossRef] [Scilit]
- Elff, M.; Heisig, J.P.; Schaeffer, M.; Shikano, S. Multilevel Analysis with Few Clusters: Improving Likelihood-Based Methods to Provide Unbiased Estimates and Accurate Inference. Br. J. Political Sci. 2021, 51, 412–426. [Google Scholar] [CrossRef] [Scilit]
- Merlo, J.; Chaix, B.; Ohlsson, H.; Beckman, A.; Johnell, K.; Hjerpe, P.; Råstam, L.; Larsen, K. A Brief Conceptual Tutorial of Multilevel Analysis in Social Epidemiology: Using Measures of Clustering in Multilevel Logistic Regression to Investigate Contextual Phenomena. J. Epidemiol. Community Health 2006, 60, 290–297. [Google Scholar] [CrossRef] [Scilit] [PubMed]
- Goldstein, H.; Browne, W.; Rasbash, J. Partitioning Variation in Multilevel Models. Underst. Stat. 2002, 1, 223–231. [Google Scholar] [CrossRef] [Scilit] [PubMed]
- McCullagh, P. Regression Models for Ordinal Data. J. R. Stat. Soc. Ser. B Stat. Methodol. 1980, 42, 109–142. [Google Scholar] [CrossRef] [Scilit]
- Brant, R. Assessing Proportionality in the Proportional Odds Model for Ordinal Logistic Regression. Biometrics 1990, 46, 1171–1178. [Google Scholar] [CrossRef] [Scilit]
- Williams, R. Generalized Ordered Logit/Partial Proportional Odds Models for Ordinal Dependent Variables. Stata J. 2006, 6, 58–82. [Google Scholar] [CrossRef] [Scilit]
- Peterson, B.; Harrell, F.E. Partial Proportional Odds Models for Ordinal Response Variables. J. R. Stat. Soc. Ser. C (Appl. Stat.) 1990, 39, 205–217. [Google Scholar] [CrossRef] [Scilit]
- Archer, K.J.; Lemeshow, S. Goodness-of-Fit Test for a Logistic Regression Model Fitted Using Survey Sample Data. Stata J. 2006, 6, 97–105. [Google Scholar] [CrossRef] [Scilit]
- Saisana, M.; Saltelli, A.; Tarantola, S. Uncertainty and Sensitivity Analysis Techniques as Tools for the Quality Assessment of Composite Indicators. J. R. Stat. Soc. Ser. A (Stat. Soc.) 2005, 168, 307–323. [Google Scholar] [CrossRef] [Scilit]
- Papke, L.E.; Wooldridge, J.M. Econometric Methods for Fractional Response Variables with an Application to 401(k) Plan Participation Rates. J. Appl. Econom. 1996, 11, 619–632. [Google Scholar] [CrossRef] [Scilit]
- World Bank. Climate Change Knowledge Portal [WWW Document]. 2024. Available online: https://climateknowledgeportal.worldbank.org/country/jordan (accessed on 29 July 2026).
- Muñoz-Sabater, J.; Dutra, E.; Agustí-Panareda, A.; Albergel, C.; Arduini, G.; Balsamo, G.; Boussetta, S.; Choulga, M.; Harrigan, S.; Hersbach, H.; et al. ERA5-Land: A State-of-the-Art Global Reanalysis Dataset for Land Applications. Earth Syst. Sci. Data 2021, 13, 4349–4383. [Google Scholar] [CrossRef] [Scilit]
- Zittis, G.; Almazroui, M.; Alpert, P.; Ciais, P.; Cramer, W.; Dahdal, Y.; Fnais, M.; Francis, D.; Hadjinicolaou, P.; Howari, F.; et al. Climate Change and Weather Extremes in the Eastern Mediterranean and Middle East. Rev. Geophys. 2022, 60, e2021RG000762. [Google Scholar] [CrossRef] [Scilit]
- Government of Jordan. Jordan’s Nationally Determined Contribution (NDC) 3.0; Ministry of Environment: Amman, Jordan, 2025.
- Ministry of Environment. The National Climate Change Adaptation Plan of Jordan; Ministry of Environment: Amman, Jordan, 2021.
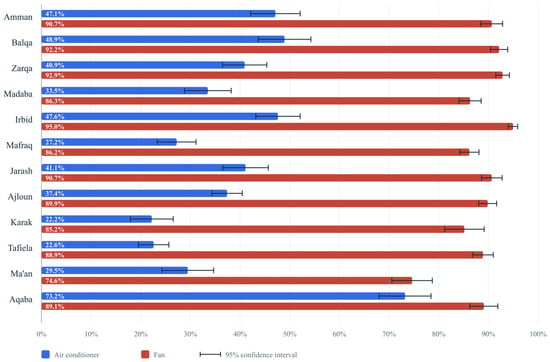
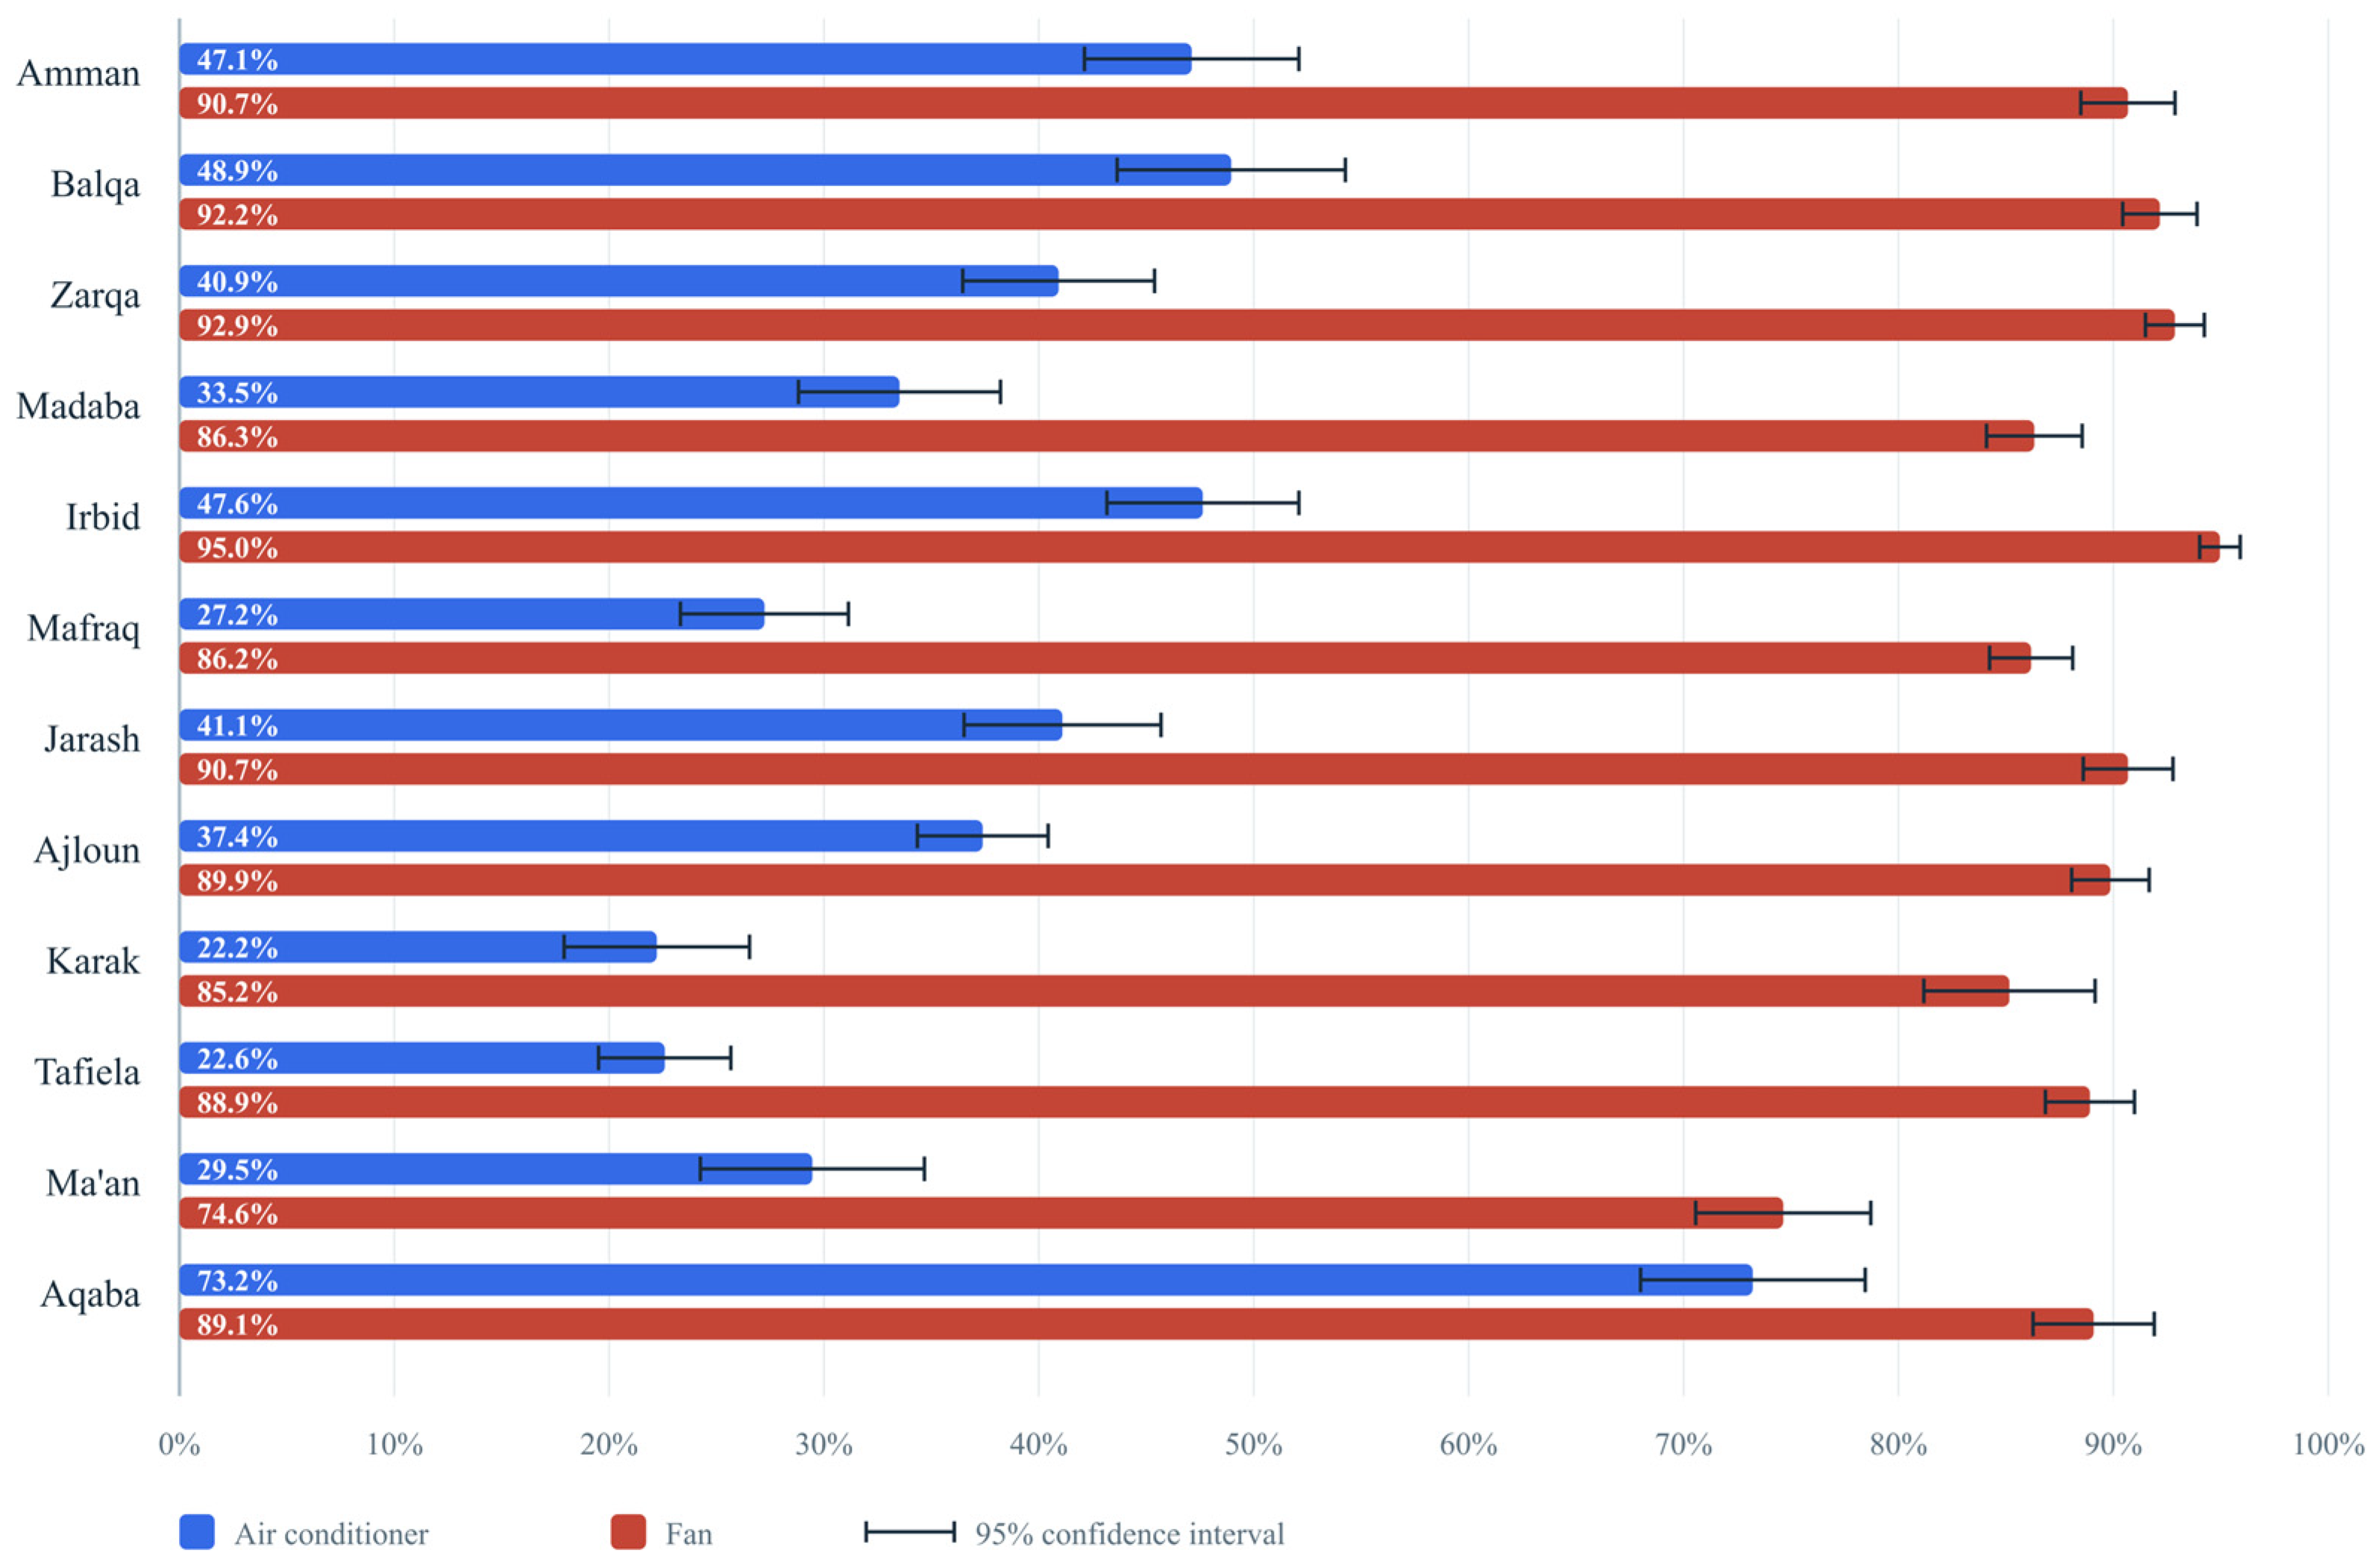
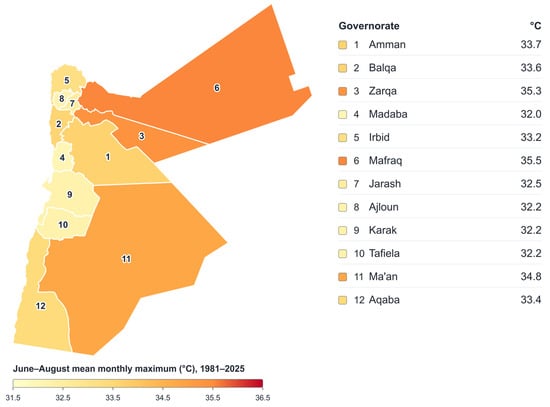
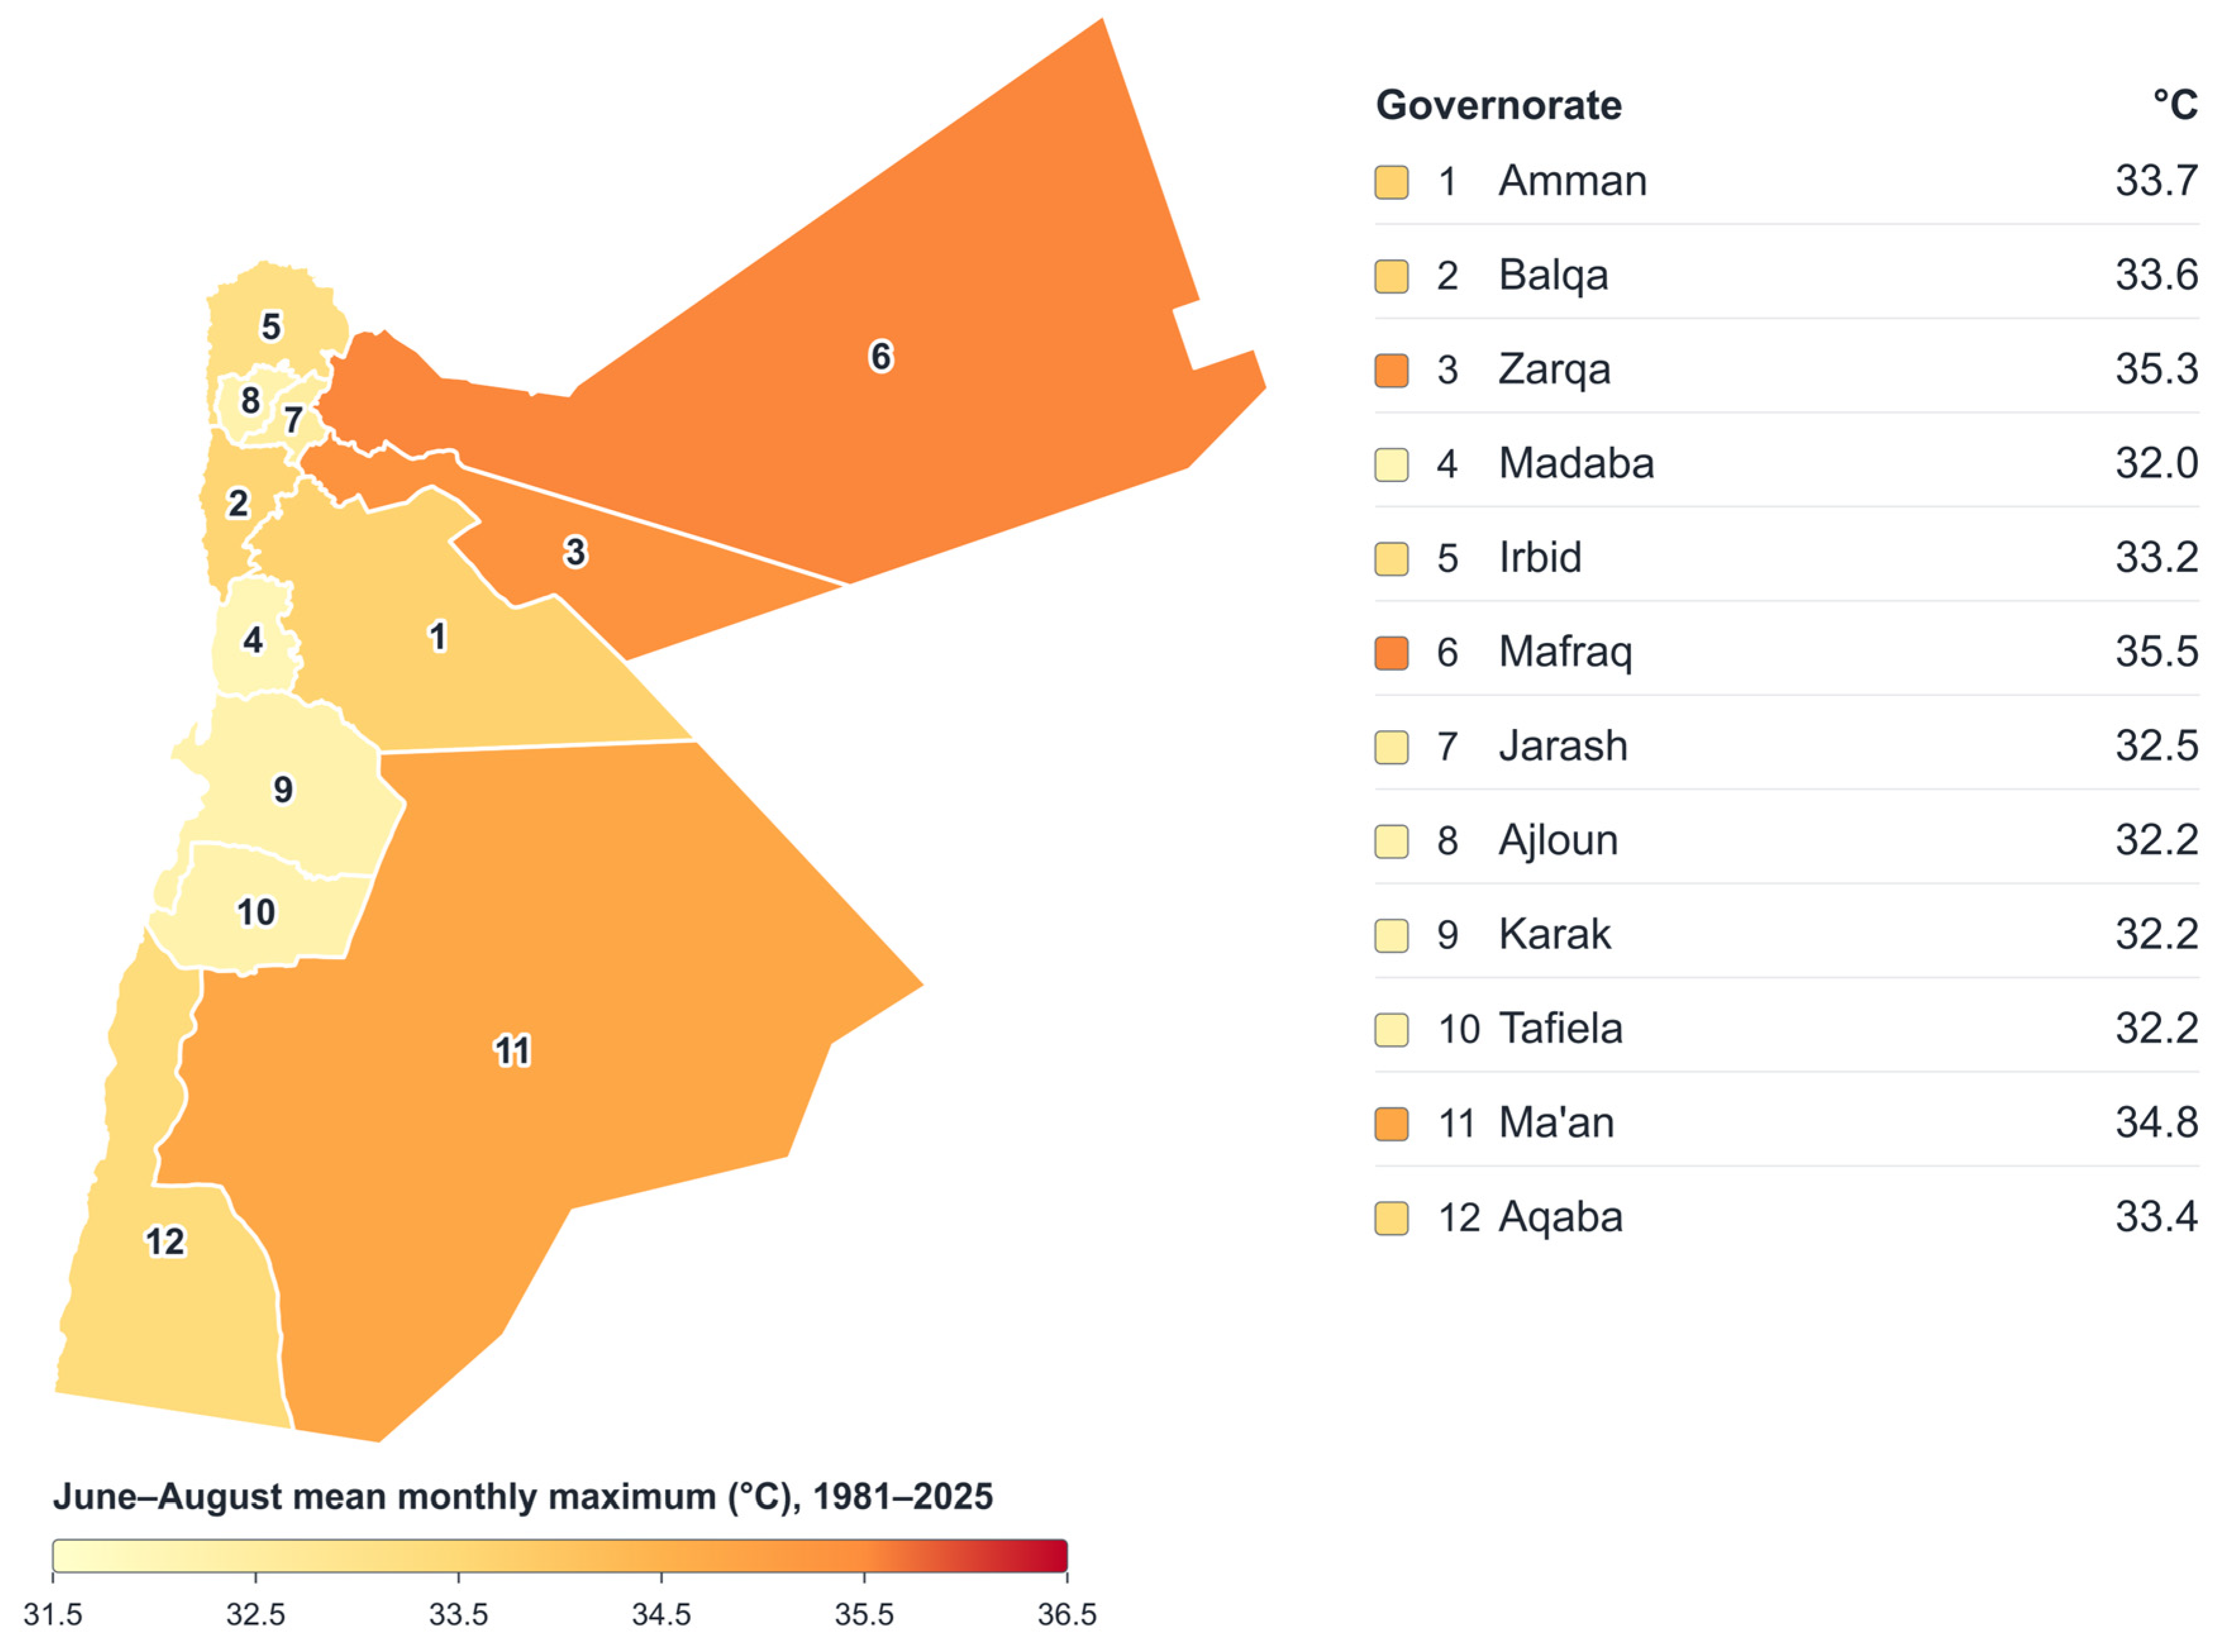

Disclaimer/Publisher’s Note: The statements, opinions and data contained in all publications are solely those of the individual author(s) and contributor(s) and not of MDPI and/or the editor(s). MDPI and/or the editor(s) disclaim responsibility for any injury to people or property resulting from any ideas, methods, instructions or products referred to in the content. |
© 2026 by the authors. Licensee MDPI, Basel, Switzerland. This article is an open access article distributed under the terms and conditions of the Creative Commons Attribution (CC BY) license.