


Abstract
Valid assessment of mathematical competencies in secondary education is essential yet insufficiently documented. This systematic review (PRISMA 2020), with protocol procedures documented in Parsifal and deposited in the OSF repository, characterizes and evaluates the psychometric quality of instruments designed, validated, or adapted to measure mathematical competencies in secondary school students. Scopus, Web of Science, and ERIC were searched on 9 December 2025 for studies published between 2015 and 2025. Methodological quality was assessed using 16 criteria adapted from the AERA/APA/NCME Standards (2014) and the COSMIN checklist, applied independently by two reviewers. Given substantial heterogeneity, results were synthesised narratively. Of 833 records identified, 19 studies met the inclusion criteria (N = 13,018 participants; 8 countries). Instruments were predominantly cognitive performance tests (78.9%) grounded in PISA-based or proprietary frameworks. Content validity was universally reported, but convergent validity appeared in only 15.8% of studies, differential item functioning in 10.5%, and measurement invariance in 15.8%. No study achieved high methodological quality; 73.7% were classified as low quality. The evidence base is geographically concentrated (Indonesia, 42.1%) and systematically deficient in external validity and fairness evidence, limiting the cross-contextual applicability of available instruments. Cross-national validation and longitudinal designs are identified as priority directions for future research.
1. Introduction
Mathematical competence has become established as one of the most widely debated constructs in educational research over recent decades, reflecting a profound conceptual shift from content-centered visions toward process- and competence-oriented approaches. This reorientation has been driven both by theoretical advances in mathematics education and by large-scale international assessments that demand a more nuanced understanding of what it means to master mathematics. Defining and measuring mathematical competence is thus situated at the intersection of curriculum theory, cognitive psychology, and psychometric methodology.
The most influential theoretical framework in defining mathematical competence is the KOM project (Competencies and Mathematical Learning), developed by Niss and collaborators in Denmark. Niss and Højgaard articulated eight distinct mathematical competencies: mathematical thinking, problem posing and solving, modelling, reasoning, communication, representation, use of symbols and formalisms, and use of tools. They argued that these competencies collectively capture the full scope of what it means to master mathematics [1]. In a subsequent reformulation, the same authors refined this framework, emphasizing the dynamic and contextually situated nature of competence and its applicability across all educational levels [2]. The KOM framework has been adopted or adapted in numerous national curricula and assessment designs worldwide.
At the international level, the Programme for International Student Assessment (PISA) has operationalized mathematical competence through the construct of mathematical literacy, defined as the capacity to formulate, employ, and interpret mathematics in a variety of contexts [3]. This framework relates directly to the KOM tradition while incorporating functional and applied dimensions, emphasizing students’ ability to reason mathematically and use mathematics in real-world problem solving. In a complementary direction, the Trends in International Mathematics and Science Study (TIMSS) has systematically assessed the mathematical performance of fourth- and eighth-grade students since 1995, providing longitudinal evidence on content mastery and cognitive processes across more than sixty countries [4]. For its part, the National Council of Teachers of Mathematics (NCTM) has articulated a vision of mathematical proficiency that integrates conceptual understanding, procedural fluency, adaptive reasoning, strategic competence, and productive disposition toward mathematics, through its standards documents and, more recently, Principles to Actions [5]. These complementary frameworks converge in conceptualizing competence not as a mere accumulation of procedural knowledge, but as an integrated and generative capacity for mathematical action.
Secondary education occupies a pivotal position in this landscape. It is the stage at which students consolidate fundamental competencies and develop the abstract reasoning capacities required for higher academic studies, professional training, and active civic participation. The transition from primary to secondary education entails greater cognitive demands, increased curricular differentiation, and more decisive consequences in terms of educational trajectories. Understanding how mathematical competence develops and how it can be reliably assessed during this stage is therefore of considerable theoretical and practical importance.
The urgency of improving mathematical competence assessment is underscored by deeply concerning trends in student performance on a global scale. The 2022 PISA cycle documented the steepest decline in mathematical performance since the assessment’s inception, with a 15-point drop from 2018 that cannot be attributed entirely to disruptions caused by the COVID-19 pandemic [3]. More significantly, one in four students in OECD countries failed to reach the minimum competence threshold in mathematics, a level corresponding to the ability to perform basic numerical tasks in familiar contexts. The TIMSS 2023 results reinforce this concern by showing that performance gaps between high- and low-income countries remain wide and, in some cases, have widened in the post-pandemic period [4]. These findings point to systemic weaknesses in mathematics education that predate the pandemic and demand sustained evidence-based responses.
Such responses must be grounded in high-quality assessments. Valid and reliable measurement of mathematical competencies is not a minor technical prerequisite; it is the foundation upon which instructional decisions, curricular reforms, and educational policies are built. Without instruments that accurately capture the multidimensional nature of mathematical competence, it becomes impossible to diagnose learning difficulties, evaluate the effectiveness of pedagogical interventions, or monitor the impact of systemic reforms over time. Stacey and Turner have argued that the design and interpretation of mathematical literacy assessments involve complex decisions about what is measured, how it is measured, and how results are used. These decisions carry far-reaching consequences for students, teachers, and educational policymakers [6].
Despite the proliferation of large-scale assessments such as PISA and TIMSS, their applicability for detailed classroom-level assessment of mathematical competencies in secondary education remains limited. These assessments are designed for population-level monitoring rather than as diagnostic or formative instruments. There exists, therefore, a persistent need for psychometrically robust instruments that can be used at the classroom, institutional, or national system level to assess secondary students’ mathematical competencies in ways sensitive to local curricula, cultural contexts, and specific competence dimensions of interest.
Research on assessment in mathematics education has grown substantially in recent years, with increasing attention to alignment between theoretical frameworks of competence and the psychometric properties of instruments used to measure them [7,8]. However, the field remains fragmented: instruments have been developed independently in different national and cultural contexts, with heterogeneous validation methodologies and operationalizations of mathematical competence that are not always directly comparable. Synthesizing this evidence base through a systematic review is consequently both timely and necessary.
The psychometric evaluation of educational instruments is governed by established standards that specify the evidence required to support inferences about test score validity, reliability, and fairness [9]. These standards distinguish among multiple sources of validity evidence, including evidence based on test content, internal structure, relations with other variables, and consequences of test use. They require instrument developers to demonstrate that their tools measure intended constructs adequately and consistently in the populations for which they were designed.
In the domain of mathematical competence assessment, adherence to these standards has been uneven. A growing body of research has examined the psychometric properties of instruments designed to assess specific components of mathematical competence (such as problem solving, mathematical reasoning, or modelling), but systematic syntheses of this evidence are scarce. Bicer conducted a review of mathematical creativity assessment instruments and identified significant methodological heterogeneity, including the use of non-standardized measures and insufficient reporting of reliability and validity evidence [10]. In a similar direction, Hakkarainen et al. reviewed mathematical assessment tools in early childhood and found that, while most instruments reported some type of content review, very few met acceptable thresholds across multiple validity domains simultaneously [11]. For their part, Bicer et al. identified conceptual fragmentation as a systemic obstacle to knowledge accumulation in the assessment of creative mathematical thinking [12], a pattern that Cevikbas et al. confirmed in the context of mathematical modelling assessment [8].
Several critical gaps characterize the existing literature. First, there is no comprehensive synthesis of instruments specifically designed or validated to measure mathematical competencies (as a construct distinct from mathematical performance or achievement) in secondary education contexts. For the purposes of this review, mathematical competence is understood as the integrated capacity to formulate, employ, and interpret mathematics across varied contexts; mathematical performance refers to the observed outcome scores obtained when this capacity is exercised under standardized, typically test-based conditions; and self-perceived mathematical literacy refers to students’ own appraisal of their competence, captured through self-report instruments rather than direct performance measures. Although conceptually related, these constructs are not interchangeable, and the instruments included in this review operationalize them through different response formats (correct/incorrect performance tasks versus Likert-type self-report scales; see Section 3.3). Second, the relationship between theoretical frameworks of mathematical competence (such as KOM, PISA, TIMSS, or NCTM) and the operationalization of constructs in actual instruments has not been systematically examined. Third, the cultural and geographical distribution of instrument development and validation efforts remains poorly understood, raising questions about the generalizability of available tools to diverse educational contexts. Fourth, the methodological quality of validation studies supporting published instruments has not been evaluated using a consistent quality appraisal framework.
These gaps represent a significant obstacle to advancing both research and practice in mathematics education. Without a consolidated map of available instruments (their theoretical foundations, psychometric properties, and contexts of application) researchers, practitioners, and policymakers lack a common reference point for selecting measures, identifying classroom tools, and evaluating competence-based assessment reforms.
The present study addresses the identified gaps through a systematic review conducted in accordance with PRISMA 2020 guidelines [13]. The review synthesizes evidence from empirical studies published between 2015 and 2025 that report the design, validation, or adaptation of psychometric instruments for assessing mathematical competencies in secondary education. The systematic nature of the review (including predefined eligibility criteria, comprehensive multi-database searching, double independent screening and data extraction, and standardized quality appraisal) ensures that the synthesis is transparent, reproducible, and minimally susceptible to selection bias.
The rationale for this review is threefold. First, the available literature is scattered across disciplines, databases, and languages, making it difficult for any individual researcher to obtain a comprehensive picture of the field without a systematic approach. Second, the psychometric quality of instruments in this domain has not been evaluated against a consistent and rigorous standard; applying the AERA/APA/NCME framework [9] to all included studies provides a principled methodological basis for quality appraisal. Third, the geographical and cultural diversity of contexts in which mathematical competence instruments have been developed and validated has important implications for the scope of applicability of existing tools and for future research directions.
The review is guided by five research questions, formulated to address both the descriptive landscape of available instruments and substantive aspects of theoretical grounding, psychometric quality, contextual applicability, and implications for future research: (RQ1) What instruments have been designed, validated, or adapted to measure mathematical competencies in secondary education? (RQ2) What psychometric methods have been employed to validate these instruments? (RQ3) What dimensions or components of mathematical competence does each instrument assess? (RQ4) In what educational, cultural, or geographical contexts have these instruments been applied? (RQ5) What are the main limitations, gaps, and recommendations identified in the literature regarding the assessment of mathematical competencies in secondary education?
By addressing these questions, the present review contributes to the field of mathematics education research on several levels. It provides the first comprehensive and systematically conducted synthesis of psychometric instruments for assessing mathematical competencies in secondary education. It maps the theoretical frameworks underlying these instruments, enabling an assessment of the degree to which assessment practice aligns with current conceptualizations of mathematical competence. It documents the geographical and cultural distribution of instrument development, illuminating both the global reach of competence-based assessment and the limitations of its current evidence base. And it identifies priorities for future instrument development and validation, particularly in underrepresented regions and for insufficiently assessed competence dimensions.
The review is conceived as a resource for three audiences: researchers seeking to select or develop instruments for empirical studies; practitioners and curriculum leaders engaged in competence-based assessment reform; and policymakers requiring an evidence base for decisions on standardizing and evaluating mathematical assessment tools. In an era of heightened global concern about students’ mathematical competence, a rigorous and comprehensive review of available tools for measuring competence in this domain is both timely and essential.
2. Materials and Methods
2.1. Protocol and Registration
This systematic review was designed and conducted in accordance with the Preferred Reporting Items for Systematic Reviews and Meta-Analyses (PRISMA 2020) guidelines [13]. Prior to initiating the bibliographic search, a priori protocol was developed comprising the research questions, eligibility criteria, information sources, search strategy, selection and data extraction procedures, methodological quality appraisal instrument, and synthesis plan. All procedural decisions were documented and time-stamped in the Parsifal systematic review management platform.
The protocol was not registered in PROSPERO or any other public registration platform. This decision is because PROSPERO is primarily oriented toward systematic reviews with clinical or public health implications, a scope that does not correspond to the present investigation, whose focus is the psychometric properties of educational assessment instruments. Transparency and traceability of the process are ensured through complete documentation of the protocol in Parsifal, a priori specification of all methodological criteria, and availability of Supplementary Materials accompanying this article. The full review protocol, including the a priori research questions, eligibility criteria, and planned analyses, is available in the Supplementary Materials and at the OSF repository. No amendments were made to the protocol or eligibility criteria after its specification in Parsifal; all methodological decisions reported in this article correspond to those specified a priori.
2.2. Eligibility Criteria
Studies were selected using the PICOC framework (Population, Intervention, Comparison, Outcome, Context), adapted to the domain of methodological reviews in educational assessment [14]. Table 1 presents the inclusion and exclusion criteria operationalized from this framework.
Table 1.
Inclusion and exclusion criteria for systematic review.
2.3. Information Sources
The bibliographic search was conducted in three academic databases of international scope, selected for their relevance to education sciences, psychology, and educational assessment: Scopus (Elsevier, Amsterdam, The Netherlands), Web of Science (Clarivate Analytics, Philadelphia, PA, USA, WoS Core Collection), and ERIC (Education Resources Information Center, ProQuest, Ann Arbor, MI, USA). The search was performed on 9 December 2025.
No complementary searches were conducted in trial registries, institutional websites, reference lists of included studies, or grey literature, because the aim was to analyze evidence reported in scientific articles published in peer-reviewed journals, as the primary formal medium for communicating scientific advancement. Nevertheless, this methodological delimitation may have restricted the comprehensiveness of the search and constitutes a limitation discussed subsequently.
2.4. Search Strategy
A structured search string was designed comprising four conceptual blocks connected by the Boolean operator AND: (1) assessed construct (mathematical competence and synonymous terms), (2) type of assessment instrument, (3) psychometric process, and (4) educational level. Within each block, terms were combined using the Boolean operator OR. Truncation was applied (psychometric*, competenc*) to broaden morphological coverage. The search was applied to title, abstract, and keyword fields. Table 2 presents the complete search strings by database.
Table 2.
Search strings by database.
No language filters were applied in the search phase; linguistic eligibility criteria were applied during the selection process. A homogeneous document type filter was applied across all three databases comprising: article, conference paper, and review. A time limit of 2015–2025 was established.
The initial search retrieved 420 records from Scopus, 242 from Web of Science, and 171 from ERIC (N = 833 raw records). Following application of the temporal filter (last ten years) across all three databases during the import process, 460 records were loaded into the Parsifal platform for systematic management.
2.5. Selection Process
Retrieved records were exported and imported into the Parsifal platform. Following upload, an automated deduplication step removed 73 duplicate records, resulting in 387 unique studies for screening.
The selection process was carried out in two sequential phases by two independent reviewers:
2.5.1. Phase 1. Title and Abstract Screening
The 387 records were independently evaluated by both reviewers applying criteria IC1–IC5 and EC1–EC5. A total of 353 studies were excluded, leaving 34 for full-text review. The main reasons for exclusion in this phase were: (a) studies that did not report the development or validation of a measurement instrument; (b) instruments targeting primary or higher education populations; (c) instruments measuring general academic achievement rather than mathematical competencies specifically; and (d) studies published in languages outside the scope of translation.
2.5.2. Phase 2. Full-Text Review
The 34 studies were read in full by both reviewers and evaluated against the complete set of eligibility criteria (IC1–IC7 and EC1–EC7). An additional 15 studies were excluded with documented justification, resulting in 19 records that met all inclusion criteria. The reasons for exclusion in this phase were: studies using previously validated instruments without reporting original psychometric data (n = 6); studies that did not report any formal validity evidence beyond face validity (n = 5); studies focused on curriculum design rather than instrument construction or validation (n = 3); and one study with preliminary data without a completed validation process (n = 1).
In both phases, disagreements between reviewers were resolved through consensus. It was not necessary to resort to a third arbiter, as all discrepancies were resolved through direct discussion. No automation tools were employed in any phase of the selection process. The complete selection flow is presented in Figure 1.
Figure 1.
PRISMA 2020 flow diagram illustrating the article selection process [13].
2.6. Data Collection Process
Data extraction was performed using a structured form designed ad hoc and coded in the Parsifal platform. The form comprised more than 80 fields organized into the following categories: study identification (study ID, APA 7 reference, year, country), instrument characteristics (name, type, language, number of items, dimensions, response format), sample characteristics (size, grade level, age, type of institution, context), theoretical framework, validity evidence (content, construct, criterion, consequential, invariance), and reliability evidence (internal consistency, test–retest, inter-rater reliability, standard error of measurement).
Each of the 19 included studies was coded independently by two reviewers. Discrepancies in data extraction were resolved through consensus between both coders. Study authors were not contacted to confirm or supplement information. When information was reported ambiguously or incompletely, it was recorded as “Not reported,” without imputation or estimation.
2.7. Data Items
2.7.1. Outcome Variables
Psychometric evidence for each instrument, including:
- Content validity: method employed (expert judgment, curriculum analysis), number of experts, reported quantitative indices (Aiken’s V, CVR, CVI, Fleiss’ Kappa).
- Construct validity: type of analysis (EFA, CFA, IRT), model fit indices (chi-square, CFI, TLI, RMSEA, SRMR, GFI), factor loadings, item parameters (difficulty, discrimination).
- Criterion validity: type (concurrent or predictive), external criterion, correlation coefficients (r, R2).
- Differential item functioning (DIF): variables analyzed, number of items with significant DIF, method employed.
- Measurement invariance: levels tested (configural, metric, scalar, strict), change indices (ΔCFI, ΔRMSEA).
- Reliability: Cronbach’s alpha (α), McDonald’s omega (ω), KR-20, EAP/PV reliability (IRT), test–retest reliability (r or ICC), inter-rater reliability (κ, ICC, % agreement), standard error of measurement (SEM).
2.7.2. Descriptive and Moderator Variables
Study characteristics (country, year, educational level, grade level, age, sample size, sampling method, type of institution, funding, conflicts of interest) and instrument characteristics (theoretical framework, number of items, dimensions, assessed mathematical domains, response format, administration mode, analytical software).
2.8. Methodological Quality Assessment
Methodological quality evaluation was performed in two stages with differentiated instruments. In the first stage, corresponding to Phase 2 of the selection process (full-text review), a 15-item checklist adapted from the AERA/APA/NCME Standards for Educational and Psychological Testing [9] was applied as a minimum quality screening instrument. Each item was scored on a 0/0.5/1 scale (No = 0; Partial = 0.5; Yes = 1), with a maximum score of 15 points. The inclusion threshold was set at 9.0 points (60%); studies that did not reach this threshold were excluded due to insufficient methodological quality to support valid psychometric conclusions.
In the second stage, the 19 records that exceeded the inclusion threshold underwent comprehensive methodological quality assessment using an expanded 16-criterion instrument organized into eight domains: (1) conceptual clarity and construct definition, (2) content validity evidence, (3) internal structure evidence, (4) reliability evidence, (5) relations with other variables, (6) fairness and generalization, (7) score interpretation and norms, and (8) transparency and replicability. Each criterion was scored on a 0/1/2 scale (Not met = 0; Partially met = 1; Fully met = 2), with a uniform maximum score of 32 points for all studies. Criteria not applicable to a study’s design (e.g., inter-rater reliability for instruments using only selected-response items) were scored as 0. This reflects a limitation in the comprehensiveness of available evidence, regardless of whether the absence was structurally inevitable or an omission by the study authors. This conservative approach is consistent with the review’s central purpose, which is to characterize the state of psychometric evidence in the field.
The domain structure and bias risk assessment logic of the second instrument were additionally supported by principles from the COSMIN Risk of Bias checklist [15], a framework originally designed for the health domain but increasingly adopted in educational research, since it offers an explicit structure for assessing the quality of measurement-properties studies that complements the AERA/APA/NCME standards. The specific criteria of the instrument derive entirely from the AERA/APA/NCME standards [9], while the organization by domains and bias risk logic are informed by COSMIN [15]. Table 3 presents the complete checklist of the second instrument.
Table 3.
Checklist for comprehensive methodological quality assessment (adapted from AERA/APA/NCME [9], with domain structure informed by COSMIN [15]).
Each study was assessed independently by two reviewers. Scoring discrepancies were resolved through consensus. Quality assessment serves a descriptive function and was not used as an exclusion criterion for studies in this second stage, given that the review’s central purpose is precisely to characterize the state of psychometric evidence in the field [13].
2.9. Effect Measures
This systematic review did not conduct a quantitative meta-analysis. Included studies report heterogeneous psychometric properties (factor loadings, fit indices, reliability coefficients, IRT item parameters) rather than comparable effect sizes (e.g., Cohen’s d, OR, Pearson’s r on a common relationship), precluding a unified effect measure suitable for statistical aggregation. Consequently, psychometric statistics are reported as documented in each primary study.
2.10. Synthesis Methods
2.10.1. Eligibility for Synthesis
All studies that passed the selection process (N = 19) were included in the synthesis. No subgroups were established a priori for differentiated synthesis, given the exploratory and descriptive nature of the review.
2.10.2. Data Preparation
Extracted data were organized into thematic synthesis matrices structured in tables. No scale conversions or imputations of missing statistics were performed. Missing values were recorded as “Not reported.”
2.10.3. Presentation of Individual Results
Results from each study are presented in tabular format (instrument characteristics, validity evidence, reliability evidence, methodological quality). Absolute and relative frequencies were calculated for each category over the total of included studies.
2.10.4. Synthesis of Results
The synthesis adopted a qualitative narrative approach, given that heterogeneity in theoretical frameworks, designs, and reported statistics precludes quantitative aggregation. The narrative synthesis followed Popay et al.’s guidelines [16], organizing findings around the study’s five research questions.
2.10.5. Exploration of Heterogeneity
A descriptive analysis was conducted of potential sources of variation in the quality of reported psychometric evidence, considering moderator variables such as the instrument’s theoretical framework (PISA, national curriculum, own framework), geographical-cultural context, type of instrument (test vs. scale), and sample size. No formal subgroup analyses or meta-regression were performed.
2.10.6. Sensitivity Analysis
The robustness of findings was explored through narrative comparison of studies with different levels of methodological quality. Additionally, quality classifications were recalculated under two alternative threshold configurations to examine the stability of conclusions.
2.11. Reporting Bias Assessment
Given that no quantitative meta-analysis was conducted, formal statistical tests for reporting bias were not applied (e.g., funnel plot, Egger’s test). Nevertheless, the potential publication bias inherent in restricting the corpus to articles published in indexed journals, excluding grey literature, doctoral theses, and non-indexed conference proceedings, is acknowledged. This limitation is addressed in the Discussion.
2.12. Certainty of Evidence Assessment
The GRADE system or any other formal certainty of evidence framework designed for reviews of clinical interventions or public health was not applied, given that these systems are not directly applicable to reviews of psychometric properties of educational instruments. The quality of psychometric evidence in each study was evaluated using the AERA/APA/NCME checklist. Quality findings are interpreted collectively as indicators of the field’s methodological maturity, rather than as evidence of bias risk in the strict sense. The certainty ratings (high, moderate, low, or very low) subsequently assigned to each evidence domain (Section 3.14). These ratings reflect three qualitative criteria applied by consensus between both reviewers, without numerical scoring: (a) the proportion of included records reporting evidence for that domain; (b) the consistency of findings among the records that did report such evidence; and (c) methodological limitations affecting the interpretability of the available evidence (e.g., informal versus quantitative indices, or heterogeneous analytic approaches). This qualitative procedure was adopted instead of a formal framework such as GRADE for the reasons stated above.
3. Results
3.1. Study Selection
The search was conducted on 9 December 2025, across three databases: Scopus, Web of Science (WoS), and ERIC. The initial search yielded 833 records in total (Scopus: n = 420; WoS: n = 242; ERIC: n = 171). Following application of the temporal filter corresponding to the 2015–2025 period during the import process, 460 records were loaded into the Parsifal platform for systematic management. Once the automated deduplication step was applied within the platform, 73 duplicate records were removed, resulting in 387 unique records for title and abstract screening.
Title and abstract screening applying predefined eligibility criteria resulted in the exclusion of 353 records. The main reasons for exclusion were: (a) studies that did not report the development or validation of a measurement instrument; (b) instruments targeting primary or higher education populations; (c) instruments measuring general academic achievement rather than mathematical competencies specifically; and (d) studies published in languages other than English or Spanish. The remaining 34 records were retrieved for full-text review.
Full-text evaluation led to the exclusion of an additional 15 studies with documented justification: studies using previously validated instruments without reporting original psychometric data (n = 6); studies without formal validity evidence beyond face validity (n = 5); studies focused on curriculum design rather than instrument construction or validation (n = 3); and one study with an incomplete validation process (n = 1). Following this process, 19 records met all inclusion criteria, corresponding to 19 unique studies. The analyzed corpus comprises 19 records derived from 19 unique studies, with a notable geographical concentration in Indonesia detailed subsequently. The complete selection flow is presented in Figure 1.
3.2. Studies Excluded at Full Text
The 15 studies excluded after full-text review are categorized by exclusion reason in Section 3.1. Of relevance are three studies that passed the initial screening by reporting instrument development in secondary mathematics education, but were ultimately excluded for lacking structural validity analysis or reported reliability coefficients: these instruments were employed as data collection tools in experimental designs without constituting validation studies per se.
3.3. Characteristics of Included Studies
The 19 included records correspond to publications between 2015 and 2025, from 8 countries distributed across 4 continents. Indonesia was the most represented country (n = 8; 42.1% of unique studies; for example: [17]), followed by Turkey (n = 3; 15.8%), the United States (n = 2; 10.5%), and Thailand (n = 2; 10.5%), while China, Germany, Vietnam, and Italy each contributed one study (5.3% respectively). All instruments were published in English; 13 were originally developed in languages other than English (Bahasa Indonesia: 8; Turkish: 3; Thai: 1; Vietnamese: 1). The 19 unique studies report originally developed instruments; none constitutes an adaptation of a previously published instrument in another language, although five adopt the PISA framework as a conceptual reference for item construction.
Sample sizes varied considerably across studies, from n = 44 [18] to n = 3430 [19]. Several studies employed multiphase designs with differentiated samples by phase: Suciati et al. [20] reported 150 participants in the content validation phase, 200 in the construct phase, and 1193 in the final evaluation, with a cumulative total of 1543 participants; Primi et al. [21] combined two independent studies with n = 822 and n = 1060 respectively, for a total of 1882 participants. The aggregated sample across all included records amounts to N = 13,018 participants. The median sample size per study is approximately 420 participants. The predominant sampling method was convenience sampling (n = 11; 57.9%), followed by cluster sampling (n = 4; 21.1%) and random sampling (n = 1; 5.3%); three studies did not specify the sampling method employed (15.8%).
Regarding educational level, most studies focused on lower secondary education (grades 6–9; n = 12), five studies included both lower and upper secondary students, and two focused exclusively on upper secondary education. Concerning instrument characteristics, 15 of the 19 records (78.9%) correspond to performance tests with correct/incorrect scoring, and 4 (21.1%) to Likert-type scales measuring self-perceived mathematical literacy. The number of items in final versions ranged from 7 [22] to 90 items before calibration [23]. The most frequent reference framework was an original conceptual framework developed by the authors (n = 8; 42.1%), followed by PISA-based frameworks (n = 5; 26.3%), national curricular standards (n = 4; 21.1%), and mixed frameworks (n = 2; 10.5%). Response formats included open-response items (n = 7), multiple choice (n = 4), mixed format (n = 6), and Likert scale (n = 4). Administration was predominantly in-person paper-based (n = 14), with two instruments in digital format and one in hybrid format. A detailed characterization of each included study is presented in Table 4, with extended details available in Table S1 of the Supplementary Material.
Table 4.
Characteristics of Included Studies and Instruments.
3.4. Methodological Characteristics and Quality of Reporting
Table 5 synthesizes the methodological characteristics and quality of reporting of the 19 included records. Statistical software was specified in 14 of the 19 records (73.7%); the most frequent packages were SPSS (n = 6), R with specialized IRT packages (n = 4), and LISREL (n = 3). Item analysis was conducted in 15 of the 19 records (78.9%), with a median of 1.5 items eliminated per study (range: 0–60). The most frequent elimination criteria were insufficient factor loadings in CFA or EFA, MNSQ fit indices outside the acceptable range in IRT models, and item-total correlations below the established threshold.
Table 5.
Methodological Characteristics and Reporting Quality of Included Studies.
The verification of assumptions was reported in 9 of the 19 records (47.4%), with normality and multicollinearity being the most frequently tested assumptions. Public accessibility of the instrument was partial or complete in 14 of the 19 records (73.7%): six instruments are available in their entirety free of charge, nine partially, and four have no reported availability. All instruments with specified availability are open access. Study limitations were reported in 18 of the 19 records (94.7%), making this the reporting domain with the highest compliance across the entire corpus. Norms or cut-off scores for score interpretation were established in 11 of the 19 records (57.9%), with formats ranging from hierarchical levels based on the IRT logit scale to cut-off points derived from the mean and standard deviation in CTT studies.
3.5. Results of the Methodological Quality Assessment
Methodological quality was evaluated using the 16-criterion instrument adapted from the AERA/APA/NCME standards [9], with domain structure informed by COSMIN [15]. No study achieved a high-quality level (≥24.0 points out of 32). Five records (26.3%) were classified as moderate quality and 14 (73.7%) as low quality. Table 6 summarizes the quality classifications by study.
Table 6.
Evaluation of the methodological quality of reporting in studies describing the validation results of the instruments.
This pattern reflects a systematic gap in the field’s reporting practices, particularly in the domains of external validity (convergent, discriminant, and criterion), fairness analysis (DIF and measurement invariance), and standard error of measurement, rather than intrinsic deficiencies of the instruments themselves.
3.6. Content Validity Evidence
All 19 records (100%) reported some form of content validity evidence, making this the most universally applied validation procedure in the corpus (see Table 7).
Table 7.
Summary of Validity Evidence for Mathematical Competency Instruments.
Expert judgment was the predominant method (n = 14; 73.7%), with panels that typically included mathematics teachers, curriculum specialists, or psychometricians who evaluated the relevance, clarity, and representativeness of items with respect to the target construct. Four studies (Studies 4, 6, 7, and 22) relied on literature review or alignment with validated external frameworks as the primary content validity strategy, and one study (Study 26) employed an iterative construct modelling approach based on Wilson’s framework [25].
The quality of content validity reporting varied substantially. Only five studies reported quantitative indices of expert agreement: Study 12 reported Aiken’s V (range: 0.78–0.91); Study 17 reported Aiken’s V (range: 0.27–1.00, with 25 items above 0.80); Study 16 reported the Content Validity Index (CVI > 0.80 using Davis’s technique); and Studies 19 and 24 reported Cohen’s Kappa (κ = 0.72–0.94) and Kendall’s W (W ≥ 0.814) respectively. The remaining 14 records reported content validity qualitatively through expert panel endorsement or agreement percentages without quantitative indices. Expert panel sizes ranged from 2 to 8 raters.
3.7. Internal Structure Evidence
Internal structure was examined in 13 of the 19 records (68.4%), although analytical approaches varied considerably. Exploratory Factor Analysis (EFA) was conducted in four records (Studies 7, 11, 16, and 33), and Confirmatory Factor Analysis (CFA) in six (Studies 6, 11, 12, 14, 16, and 17). Item Response Theory (IRT) models were applied in seven studies (Studies 4, 14, 19, 21, 22, 26, and 33). Six records (31.6%) did not report any formal analysis of the instrument’s dimensionality.
Among studies with CFA, model fit indices were acceptable where reported. Record 11 (employing the MLS instrument) obtained CFI = 0.98, RMSEA = 0.06, and SRMR = 0.04 for a unidimensional model. Study 12 reported CFI = 0.97, RMSEA = 0.049, and GFI = 0.97 for a second-order hierarchical model. Study 6 obtained CFI = 0.98, TLI = 0.98, and RMSEA = 0.09 for a bifactor model with correlation. Study 16 reported CFI = 0.97, RMSEA = 0.034, and GFI = 0.94 for a four-factor model. Study 17 reported significant factor loadings (0.26–0.72) but did not report global fit indices, which constitutes a relevant methodological limitation. For IRT-based studies, item fit statistics (MNSQ) fell within acceptable ranges (0.70–1.33) in Studies 14, 19, 26, and 33, supporting model-data fit under Rasch and Partial Credit models.
3.8. Reliability Evidence
Reliability evidence constituted the most heterogeneous domain across the 19 records (see Table 8). Cronbach’s alpha coefficients were reported in 7 records (36.8%), with values ranging from 0.61 (Study 22) to 0.97 (Study 11). Two records reported values equal to or greater than 0.90 (Studies 6 and 11), four records reported values between 0.70 and 0.89 (Studies 7, 16, 17, and 29), and Study 22 reported a total alpha of 0.61, below the commonly accepted 0.70 threshold for research [26]. However, this value should be interpreted in light of the test’s 11 heterogeneous cognitive attributes, for which alpha values by dimension ranged from 0.63 to 0.95.
Table 8.
Summary of Reliability Evidence for Mathematical Competency Instruments.
IRT-based reliability indices (EAP/PV reliability) were reported in four studies (Studies 19, 21, 26, and 33), with values between 0.77 and 0.84. KR-20 was employed in Study 33 for its three dichotomous response subscales (0.71–0.79). Intraclass correlation coefficients (ICC) for inter-rater reliability were reported in Study 6 (ICC ≥ 0.95 across all coding categories), and weighted Cohen’s Kappa in Study 19 (κ = 0.72–0.94). Study 16 was the only record to report test–retest reliability (r = 0.71, 28-day interval, n = 31). Four records (Studies 10, 12, 23, and 36, corresponding to Efriani et al. [18], Suciati et al. [20], Ramadhani et al. [27], and Purnomo et al. [22]) did not report any reliability evidence, which constitutes a significant methodological gap.
Standard Error of Measurement (SEM) was reported in six studies (Studies 4, 14, 19, 21, 26, and 33), all of which employed IRT frameworks. IRT-based SEM values were systematically reported as conditional on ability level (θ), revealing that measurement precision was higher at intermediate ability levels and decreased at the distribution extremes—a finding with direct implications for the interpretation of scores for students at the lowest and highest performance levels.
3.9. Evidence Based on Relations with Other Variables
Evidence based on relations with other variables was the least developed domain across the entire corpus. Convergent validity was examined in only three records (15.8%): Study 11 (r = 0.79 with the Visual Mathematical Literacy Self-Efficacy Perception Scale), Study 6 (AVE = 0.98), and Study 4 (r = 0.59 with mathematical prerequisite tasks and cognitive reasoning). Discriminant validity was reported exclusively in Study 4, which documented small negative correlations with mathematics anxiety (r = −0.16, AMAS) and gambling behaviour (r = −0.16, SOGS-RA), confirming the expected divergence from theoretically unrelated constructs. Criterion validity was evaluated in two studies (10.5%): Study 6 reported concurrent validity (r = 0.38, R2 = 0.14), and Study 4 reported predictive validity with respect to school grades (r = 0.32, R2 = 0.16). The absence of convergent, discriminant, and criterion evidence in 84–89% of records represent a critical gap in the validation evidence available for mathematical competence instruments in secondary education.
3.10. Fairness and Generalization
Differential Item Functioning (DIF) analysis was conducted in only two studies (10.5%). Kartianom and collaborators [28] examined DIF by gender using the Mantel-Haenszel method and identified three items with significant DIF, acknowledging as a limitation the absence of expert review to contextualize the statistical findings. Study 4 (Primi et al. [21]) applied likelihood ratio DIF analysis with Bonferroni correction across gender, educational level, and language (Italian vs. English), identifying two items with gender DIF in difficulty parameters and two items with educational level DIF, while discrimination parameters remained invariant across all groupings.
Measurement invariance testing, a necessary condition for the validity of score comparisons across groups, was conducted in three studies (15.8%): Study 33 demonstrated equivalence among three test forms through factorial ANOVA; Study 22 employed IRT parameter correlations as an approximate indicator of equivalence between groups; and Study 4 achieved partial measurement invariance. The remaining 16 records did not conduct any evaluation of item fairness or score comparability across demographic groups, even though several instruments are designed for use in diverse educational contexts.
3.11. Score Interpretation and Norms
Eleven of the 19 records (57.9%) established normative data or cut-off scores to guide score interpretation. The nature of normative frameworks varied considerably: IRT-based studies typically established hierarchical competence levels anchored to the logit scale (Studies 14, 21, 26, and 33), offering theoretically grounded interpretive references. PISA-referenced studies employed the six PISA competence levels as a normative framework (Studies 22 and 29). Studies with Likert scales derived interpretive cut-off points from the mean and standard deviation (Study 11). Study 34 (LOCUS) established three developmental levels (Beginning, Intermediate, Advanced) through standard-setting procedures aligned with the GAISE and CCSSM frameworks. Eight records (42.1%) did not provide any normative information, offering only raw scores without interpretive guidance—a limitation that severely restricts the practical applicability of these instruments for those who lack such information.
3.12. Narrative Synthesis of Findings
Given the substantial heterogeneity in instrument types, measurement frameworks, target populations, and psychometric methodologies across the 19 records, a quantitative meta-analysis of psychometric parameters was not conducted. The high methodological diversity (including the coexistence of Classical Test Theory (CTT) and Item Response Theory (IRT) frameworks, the mixture of performance tests and self-report scales, and variable coverage of mathematical competence domains) precluded statistical aggregation of validity or reliability indices. This decision is consistent with PRISMA 2020 guidelines [13] and the COSMIN methodology for systematic reviews of measurement instruments [15], both of which recommend narrative synthesis when statistical aggregation is inappropriate due to methodological heterogeneity. The following synthesis is consequently narrative and structured around the key psychometric domains evaluated in this review.
3.12.1. Validation Approach and Psychometric Framework
A clear division was observed between studies employing CTT-based approaches and those using IRT frameworks. The 12 CTT-based records (63%) relied predominantly on EFA or CFA for structural validation and reported Cronbach’s alpha as the primary reliability index. The 7 IRT-based studies (37%) applied Rasch (1PL), Two-Parameter Logistic (2PL), or Partial Credit models and reported EAP/PV reliability and conditional SEM as precision indices. IRT-based studies provided substantially richer information on measurement precision across the ability continuum, including variable maps and test information functions, whereas most CTT studies reported only aggregate reliability coefficients without conditional precision estimates.
3.12.2. Coverage of Content Domains
Across the 19 records, the most frequently assessed mathematical competence domains were reasoning (n = 18; 95%), problem solving (n = 17; 89%), and application (n = 14; 74%). Communication, representation, and use of symbolic language were covered by approximately 64–69% of instruments. Algebraic thinking appeared in 12 instruments (63%), arithmetic in 11 (58%), and geometry in 8 (42%). Probability and statistics was the domain most frequently addressed by specialized instruments (Studies 4, 24, and 34), but appears as a secondary domain in only 7 of the 17 general mathematical literacy instruments. No instrument covered all identified competence domains.
3.12.3. Methodological Quality Patterns
Systematic patterns in methodological quality were observed according to geographical region and study type. Indonesian studies, which constitute 42.1% of the corpus, consistently showed lower quality scores, primarily due to reduced sample sizes in several cases, absence of structural validity analysis, and the virtually universal absence of external validity evidence. Turkish and U.S. studies demonstrated higher median scores, largely attributable to the application of factor analysis and more comprehensive reliability reporting. The instruments with the most complete evidence profiles [17,19,21] demonstrate that rigorous multi-source validation is achievable within the constraints of academic research and constitute benchmarks for future development work.
3.12.4. Results of the Sensitivity Analysis
To examine the robustness of quality classification, classifications were recalculated under two alternative threshold configurations: (a) the original thresholds established in Methodology (High ≥ 75%, Moderate 50–74%, Low < 50%) and (b) more permissive thresholds (High ≥ 60%, Moderate ≥ 40%). Under the original thresholds, the distribution remained identical to the main analysis (0 High, 5 Moderate, 14 Low), given that no study approached the 75% threshold. Under the more permissive thresholds, Study 4 and Study 11 would be reclassified as High, and three additional studies would transition from Low to Moderate. Regardless of the threshold configuration applied, the general pattern of predominantly low to moderate quality remains constant, indicating that the main conclusions of this review are robust to reasonable variations in classification criteria.
3.13. Reporting Biases
Risk of reporting bias was evaluated at two levels. At the study level, selective outcome reporting was considered a plausible concern: several studies reported validity and reliability analyses only for indices with favorable results, without documenting analyses that might have yielded inadequate values. The absence of study protocols or preregistration in all 19 included records precludes formal assessment of selective reporting. At the synthesis level, publication bias represents a potential concern given that studies reporting instruments with poor psychometric properties are less likely to be published, which could lead to an overestimation of the quality of available instruments in the field. The inclusion of studies from ERIC (which indexes a broader range of educational research products) and the observation that several included studies explicitly reported instruments with limited validity evidence suggest that this concern was at least partially mitigated.
3.14. Certainty of Evidence
The certainty of the body of evidence was assessed by the main psychometric domain. For content validity evidence, certainty was classified as moderate: all records reported content validity procedures, but the predominance of informal expert review without quantitative indices and variability in panel size and documentation reduce confidence in the comprehensiveness of this evidence. For structural validity evidence, certainty was classified as low: only 57.9% of studies formally examined dimensionality, and among those that did, methodological heterogeneity (EFA vs. CFA vs. IRT) and incomplete reporting of fit indices limit the solidity of conclusions about the dimensional structure of mathematical competence instruments. For reliability evidence, certainty was classified as low: the high proportion of studies without reliability evidence (21.1%), the absence of test–retest data in 94.7% of studies, and heterogeneity in the indices employed preclude drawing solid conclusions about the temporal stability of instruments. For evidence based on relations with other variables, certainty was classified as very low: the virtually universal absence of convergent (84.2%), discriminant (94.7%), and criterion (89.5%) evidence in the corpus means that the nomological network of mathematical competence constructs measured by these instruments remains largely unmapped. For fairness and generalization evidence, certainty was classified as very low: with DIF analysis conducted in only 10.5% of studies and measurement invariance examined in 15.8%, the evidence base for equitable and generalizable use of these instruments across diverse student populations is critically insufficient.
4. Discussion
4.1. Interpretation of Results in the Context of Prior Evidence
The present systematic review identified 19 records reporting the design, validation, or adaptation of psychometric instruments for assessing mathematical competencies in secondary education, revealing an actively developing but structurally uneven field. The global distribution of studies is markedly asymmetric: Indonesia concentrates eight of the nineteen unique studies (42.1%), followed at a distance by Turkey (15.8%) and the United States (10.5%). This pattern partially converges with previous systematic reviews in mathematics education, which have noted the predominance of Southeast Asian contexts in research on PISA-aligned assessment [6,29,30]. However, the scale of Indonesian overrepresentation in the present corpus exceeds what has been previously documented.
The concentration of Indonesian studies reflects at least three converging dynamics. First, Indonesia’s persistent underperformance in international assessments (with 366 points on the PISA 2022 mathematics test compared to an OECD average of 472, and only 18% of students reaching Level 2 competence [3]) has generated intense national investment in developing and evaluating locally relevant instruments [30]. Second, the Minimum Competency Assessment reform (Asesmen Kompetensi Minimum, AKM), implemented from 2020 onward, created institutional demand for numeracy measurement tools that PISA-derived frameworks could partially satisfy [22]. Third, the growing academic productivity of Indonesian mathematics education journals (several recently indexed in Scopus and Web of Science) has amplified the international visibility of this production. These factors explain the geographical concentration without invalidating the findings but necessarily limit the generalization of the synthesized evidence to other secondary education contexts.
Regarding theoretical frameworks employed, the predominance of PISA-derived or PISA-inspired constructs (31.6% of studies) is consistent with previous reviews [6] and reflects the global influence of the OECD’s mathematical literacy framework [3]. Nevertheless, a non-trivial proportion of instruments (26.3%) operationalize original conceptual frameworks developed by the authors, suggesting that the field has not converged on a shared definitional core. This fragmentation reflects a broader pattern identified in reviews of creative mathematical thinking [12] and mathematical modeling assessment [8], both of which documented conceptual heterogeneity as a systemic obstacle to knowledge accumulation.
The AERA/APA/NCME Standards for Educational and Psychological Testing [9] establish the reference standard for constructing validity arguments, requiring convergent evidence from multiple independent sources: test content, response processes, internal structure, relations with other variables, and consequences of test use. Against this benchmark, the present review finds that universal adherence to content validity (100% of records) reflects only minimum compliance, given that most studies employed informal expert review without quantitative indices such as Aiken’s V or CVI. This pattern parallels that identified by Hakkarainen et al. in their review of mathematical assessment instruments in early childhood, where most tools reported some form of content review, but very few met acceptable thresholds across multiple validity domains simultaneously [11].
4.2. Psychometric Gaps as the Central Finding
The most relevant finding of this review is not the quality profile of any individual instrument, but the systematic pattern of under-reporting in validity and reliability domains. Assessment using the 16-criterion instrument adapted from AERA/APA/NCME [9] revealed that 73.7% of records (n = 14) scored less than 50% of the 32 possible points, and none reached the high-quality threshold (≥75%). This finding should not be interpreted as criticism of individual researchers. Rather, it reflects a structural feature of the field: the construction and validation of mathematical competence instruments in secondary education remains, collectively, insufficiently documented with respect to current international standards.
The most severe gaps lie in the external validity domain. Convergent validity evidence (established through examination of correlations with measures of theoretically related constructs [9]) was reported in only three records (15.8%), and discriminant validity in only one (Study 4, Primi et al. [21]). Evidence of consequential and predictive validity was virtually absent from the corpus. These gaps are consistent with criticisms formulated in adjacent fields: Bicer et al. concluded their systematic review of creative mathematical thinking assessment by noting that validity and reliability evidence for instruments must be collected and reported in future research [12], a recommendation equally pertinent to the present corpus.
The gap between content validation (nearly universal) and construct validation (sporadic) reflects not so much an intrinsic limitation of instruments as incomplete reporting practice in the field. While content validation through expert panels constitutes an appropriate first step, the systematic absence of reports on convergent, discriminant, and criterion validity suggests that researchers either have not conducted these analyses or have chosen not to document them in their publications [9]. This pattern is characteristic of emerging fields where reporting standards are still being internalized and where space constraints in journals may prioritize reporting positive or more locally relevant results. The implication is that the actual psychometric quality of many instruments may be higher than reflected in the published literature. This underscores the need for researchers to adopt more comprehensive reporting practices in alignment with AERA/APA/NCME standards [9].
The under-reporting of reliability evidence in four records (Studies 10, 12, 23, and 36, corresponding to Efriani et al. [18], Suciati et al. [20], Ramadhani et al. [27], and Purnomo et al. [22]) merits particular attention. Reliability is a necessary, though not sufficient, condition for validity [9], and its absence in reporting makes it impossible to determine whether observed differences in scores reflect genuine variation in competence or measurement error. This omission is especially problematic in studies that draw substantive conclusions about student performance profiles or between-group differences.
4.3. Classical Test Theory and Item Response Theory: Complementary Paradigms
The coexistence of Classical Test Theory (CTT) and Item Response Theory (IRT) approaches in the reviewed literature reflects the field’s broader methodological pluralism. CTT-based analyses (primarily Cronbach’s alpha and KR-20) appeared in seven records, while IRT-based calibrations (predominantly Rasch and two-parameter logistic models) appeared in seven. This equitable representation differs from the global pattern of large-scale assessment programs, in which IRT has become the dominant paradigm due to its superior capacity for form equating, adaptive testing, and sample-independent item parameter estimation [31,32].
The advantages of IRT over CTT for educational measurement are well established. IRT models produce item statistics that are theoretically invariant across examinee samples, and person statistics that are independent of the specific item pool administered, overcoming the circular dependency that characterizes CTT-based indices [32]. IRT also provides conditional standard errors of measurement, allowing measurement precision to be described as a function of ability level—a critical feature for instruments intended for diagnostic or formative functions. Conversely, CTT requires more modest sample sizes (as small as n = 30 for preliminary analyses) and simpler computational resources, which may explain its continued prevalence in resource-limited research contexts.
A notable finding is that studies employing IRT did not systematically show better psychometric quality than CTT-based studies. Record 11 (which applied both CFA and convergent validation within a CTT framework) achieved a moderate quality classification comparable to that of Rasch-based studies (Studies 19 and 26). This convergence suggests that the critical variable is not the choice between CTT and IRT per se, but the comprehensiveness with which researchers address multiple sources of validity evidence. Future instrument development in this domain would benefit from integrated psychometric strategies that combine CTT for preliminary item screening with IRT for final calibration and invariance testing, as recommended by the AERA/APA/NCME standards [9] and exemplified by the LOCUS instrument (Study 34, Jacobbe et al. [19]), which represents the methodologically most complete instrument in the reviewed corpus.
4.4. Limitations of Included Studies
Several limitations of included studies restrict the conclusions that can be drawn from this review. First, the documented geographical concentration means that the synthesized evidence is structurally biased toward specific educational, cultural, and linguistic contexts. Most instruments were developed and validated within their country of origin using local student samples, with none reporting cross-cultural or transnational validation. The absence of measurement invariance testing across cultural groups (present in only three records: Studies 4, 22, and 33) means that the degree to which reviewed instruments measure the same construct across different populations remains unknown. This is a particularly serious gap for instruments grounded in the PISA mathematical literacy framework, which aspires by design to cross-cultural applicability [3,6].
Second, sample sizes varied considerably across studies, from n = 44 (Study 10, Efriani et al. [18]) to n = 3430 (Study 34, Jacobbe et al. [19]). IRT models, particularly the two-parameter logistic model, typically require minimum samples of 200–500 participants for stable parameter estimation, and more complex models may require 1000 or more [31]. Several IRT-based studies in the present corpus operated with samples that may be insufficient for robust calibration, which could compromise the accuracy of reported parameters.
Third, the predominance of cognitive–behavioural dimensions in reviewed instruments (with corresponding underrepresentation of affective, motivational, and metacognitive components of mathematical competence) reflects a narrow operationalization of the construct. Blömeke et al. conceptualized mathematical competence as a continuum from cognitive dispositions to specific situational performance [33], but very few instruments in the present corpus assessed the full scope of this model. The absence of instruments addressing mathematical self-efficacy, problem-solving strategies, or epistemic beliefs alongside cognitive performance limits the ecological validity of the identified measurement tools.
4.5. Limitations of the Review
This review presents several methodological limitations that must be acknowledged transparently. First, the search was restricted to three internationally indexed databases (Scopus, Web of Science, and ERIC). Although these offer comprehensive coverage of peer-reviewed educational research, they may not capture relevant work published in regional or nationally indexed journals, a limitation particularly relevant for high-production contexts such as Indonesia and Turkey.
Second, while investigating only scientific articles was intentionally established as an inclusion criterion, the review did not include grey literature, doctoral theses, or technical reports, which may contain valuable psychometric data for instruments not yet published in indexed journals. This exclusion may introduce publication bias, given that instruments with weaker psychometric properties are less likely to appear in indexed sources. Nevertheless, the deliberate focus on peer-reviewed literature ensures that the synthesized evidence meets a minimum threshold of external methodological scrutiny.
Third, although study selection, data extraction, and quality assessment were conducted independently by two reviewers with discrepancy resolution through consensus (thus minimizing subjective bias in these critical phases), the thematic synthesis and interpretation of findings remain necessarily interpretive. Different analytical or theoretical frameworks might have emphasized alternative patterns in the data. To enhance transparency, all quality assessment criteria and scoring procedures are provided in the Supplementary Materials, allowing readers to verify the application of AERA/APA/NCME standards [9] to each study.
Finally, the corpus of N = 19 unique studies, while sufficient for rigorous qualitative synthesis, does not support meta-analytic quantification of effect sizes or reliability coefficients across studies. The heterogeneity of constructs, theoretical frameworks, and psychometric models employed in reviewed instruments precludes meaningful statistical aggregation. Future reviews with more homogeneous inclusion criteria (restricted, for example, to IRT-calibrated instruments or a single competence framework) might enable meta-analytic synthesis of specific parameters such as discrimination indices or test information functions.
4.6. Implications for Practice, Policy, and Future Research
For practitioners and educational policymakers, this review’s findings carry a clear caveat: most available instruments for assessing mathematical competence in secondary education have not undergone the multi-source validation process required to confidently support high-stakes decisions such as grade retention, program placement, or systemic accountability. Suurtamm et al.’s synthesis [7] for ICME-13 emphasized that the psychometric tradition and competence modelling tradition must be integrated in instrument design; the present review suggests that this integration remains an aspiration rather than realized practice in most available tools. Educational systems seeking to monitor or improve mathematical competence should prioritize adoption of instruments with demonstrated evidence in at least the domains of content validity, internal structure, and convergent validity—a profile that in this review only Studies 4 (Primi et al. [21]), 11 (Katrancı and Şengül [17]), and 34 (Jacobbe et al. [19]) satisfy.
For researchers, the field presents multiple priority directions for future work. First, the development of instruments with cross-cultural validation evidence is an urgent need. The PISA framework offers a common conceptual currency that could facilitate transnational comparison, but this potential will remain unrealized as long as measurement invariance testing across educational and linguistic contexts is not systematically conducted [3,6]. Second, longitudinal or repeated-measures designs are conspicuously absent from the corpus: only one study (Study 16) reported test–retest reliability. Establishing temporal stability is essential for instruments intended to monitor competence development over time [9]. Third, the integration of digital and adaptive assessment formats (currently absent from reviewed instruments) represents a structural gap relative to the broader trajectory of large-scale assessment programs, which increasingly employ computer-assisted delivery and IRT-based adaptive algorithms [7,32]. Fourth, future instrument development should explicitly model affective and metacognitive components of mathematical competence alongside cognitive performance, drawing on frameworks such as Blömeke et al.’s competence continuum [33] to construct measurement tools with greater ecological validity.
5. Conclusions
This systematic review identified 19 records (corresponding to 19 unique studies) reporting the design, validation, or adaptation of psychometric instruments for assessing mathematical competencies in secondary education, revealing an actively developing but structurally uneven field. The corpus encompasses 8 countries across 4 continents, with a marked geographical concentration in Indonesia (42.1% of unique studies), reflecting the convergence of persistent underperformance in international assessments, the national AKM assessment reform, and the growing productivity of internationally indexed Indonesian mathematics education journals. This concentration necessarily limits the generalization of the synthesized evidence and itself constitutes a relevant finding about the state of the field.
The most significant finding is the systematic gap between content validity (universally applied across all 19 records, though frequently informally) and the multi-source validation required by international psychometric assessment standards. No record achieved high quality level (≥75% of applied criteria); 73.7% were classified as low quality. The most critical absences are concentrated in convergent validity (reported in 15.8% of records), discriminant validity (5.3%), differential item functioning analysis (10.5%), and measurement invariance testing (15.8%). Reliability was not reported in four records. These are not isolated deficiencies but a structural pattern reflecting incomplete reporting practices in the field: content validation through expert panels constitutes the default first step, while convergent, discriminant, and fairness evidence accumulates (when it does) in subsequent research cycles or remains undocumented in publications.
The instruments with the most complete evidence profiles (the Probabilistic Reasoning Scale, the Mathematical Literacy Scale, and the LOCUS assessment) demonstrate that rigorous multi-source validation is achievable within the constraints of academic research and constitute methodological benchmarks for future development work. The predominance of original conceptual frameworks (36.8% of instruments) alongside PISA-derived approaches (26.3%) reveals that the field has not converged on shared definitional standards, mirroring the conceptual fragmentation documented in adjacent domains such as mathematical modelling assessment and creative mathematical thinking.
For educational systems facing the consequences of declining mathematical performance documented in the most recent cycles of international assessments, these findings have a direct practical implication: most instruments currently available for assessing mathematical competence in secondary education have not undergone the multi-source validation process necessary to confidently support high-stakes instructional or policy decisions. Systems seeking to monitor or improve mathematical competence should prioritize instruments with demonstrated evidence in content validity, internal structure, and convergent validity simultaneously—a profile that in this review only three of the nineteen included studies satisfy. The integration of theoretically grounded competence frameworks with rigorous psychometric methodology remains an aspiration rather than a realized standard in most available tools.
Three future research directions emerge directly from the identified gaps. First, cross-cultural validation is the most urgent methodological priority: the absence of measurement invariance testing across demographic groups, languages, and educational systems in 84.2% of records means that the cross-contextual applicability of available instruments remains largely unestablished. Future instrument development should treat multi-group invariance analysis as a standard component of the validation process, not as an optional extension. Second, longitudinal designs are conspicuously absent from the corpus: only one study reported test–retest reliability, despite temporal stability being a fundamental requirement for instruments intended to monitor competence development over time. Third, integrating affective and metacognitive dimensions alongside cognitive performance remains a largely unexplored frontier in the reviewed corpus. This gap is consistent with competence models that conceptualize mathematical competence as a continuum from cognitive dispositions to situational performance. Addressing it would substantially broaden both the theoretical validity and practical utility of the next generation of mathematical competence instruments for secondary education.
Supplementary Materials
The following supporting information can be downloaded at https://doi.org/10.17605/OSF.IO/HNG2S.
Author Contributions
Conceptualization, M.H.-M. and J.P.H.-R.; methodology, M.H.-M. and J.P.H.-R.; software, M.H.-M.; validation, M.H.-M., J.P.H.-R. and E.M.-P.; formal analysis, M.H.-M.; investigation, M.H.-M. and E.M.-P.; data curation, M.H.-M.; writing—original draft preparation, M.H.-M.; writing—review and editing, M.H.-M., J.P.H.-R. and E.M.-P.; visualization, M.H.-M.; supervision, J.P.H.-R.; project administration, M.H.-M.; funding acquisition, M.H.-M. All authors have read and agreed to the published version of the manuscript.
Funding
The APC was funded by Universidad Técnica del Norte.
Institutional Review Board Statement
Not applicable.
Informed Consent Statement
Not applicable.
Data Availability Statement
The data supporting the results of this study are openly available in a public repository at Psychometric Instruments for Assessing Mathematical Competencies in Secondary Education: A Systematic Review—Supplementary Materials. Retrieved from osf.io/hng2s. These data include all materials generated and/or analysed during the current study.
Conflicts of Interest
The authors declare no conflicts of interest.
Abbreviations
The following abbreviations are used in this manuscript:
| AERA | American Educational Research Association |
| AKM | Minimum Competency Assessment (Asesmen Kompetensi Minimum) |
| AMAS | Abbreviated Math Anxiety Scale |
| APA | American Psychological Association |
| AVE | Average Variance Extracted |
| CCSSM | Common Core State Standards for Mathematics |
| CFA | Confirmatory Factor Analysis |
| CFI | Comparative Fit Index |
| CCI | Intraclass Correlation Coefficient |
| COSMIN | COnsensus-based Standards for the selection of health Measurement INstruments |
| CTT | Classical Test Theory |
| CVI | Content Validity Index |
| CVR | Content Validity Ratio |
| DIF | Differential Item Functioning |
| DOI | Digital Object Identifier |
| EAP | Expected A Posteriori |
| EFA | Exploratory Factor Analysis |
| ERIC | Education Resources Information Center |
| GAISE | Guidelines for Assessment and Instruction in Statistics Education |
| GFI | Goodness of Fit Index |
| ICC | Intraclass Correlation Coefficient |
| ICME | International Congress on Mathematical Education |
| IRT | Item Response Theory |
| ITPO | Integrating Technology into Probability and Statistics |
| KOM | Competencies and Mathematical Learning |
| KR-20 | Kuder-Richardson Formula 20 |
| LOCUS | Levels of Conceptual Understanding in Statistics |
| MLS | Mathematical Literacy Scale |
| MLT | Mathematical Literacy Test |
| MNSQ | Mean Square |
| NCME | National Council on Measurement in Education |
| NCTM | National Council of Teachers of Mathematics |
| OECD | Organisation for Economic Co-operation and Development |
| OSF | Open Science Framework |
| PICOC | Population, Intervention, Comparison, Outcome, Context |
| PISA | Programme for International Student Assessment |
| PRISMA | Preferred Reporting Items for Systematic Reviews and Meta-Analyses |
| PRS | Probabilistic Reasoning Scale |
| PV | Plausible Values |
| RMSEA | Root Mean Square Error of Approximation |
| SEM | Standard Error of Measurement |
| SMLLPS | Scale for Measuring Levels of Learning Progression in Statistics |
| SOGS-RA | South Oaks Gambling Screen—Revised for Adolescents |
| SRMR | Standardized Root Mean Square Residual |
| STEM | Science, Technology, Engineering, and Mathematics |
| TLI | Tucker–Lewis Index |
| TIMSS | Trends in International Mathematics and Science Study |
| IRT | Item Response Theory |
| WoS | Web of Science |
References
- Niss, M.; Højgaard, T. Competencies and Mathematical Learning: Ideas and Inspiration for the Development of Mathematics Teaching and Learning in Denmark; IMFUFA Tekst No. 485; Roskilde University: Roskilde, Denmark, 2011. [Google Scholar]
- Niss, M.; Højgaard, T. Mathematical competencies revisited. Educ. Stud. Math. 2019, 102, 9–28. [Google Scholar] [CrossRef] [Scilit]
- OECD. PISA 2022 Results (Volume I): The State of Learning and Equity in Education; OECD Publishing: Paris, France, 2023. [Google Scholar]
- IEA. TIMSS 2023 International Results in Mathematics and Science; International Association for the Evaluation of Educational Achievement: Amsterdam, The Netherlands, 2024.
- NCTM. Principles to Actions: Ensuring Mathematical Success for All; National Council of Teachers of Mathematics: Reston, VA, USA, 2014. [Google Scholar]
- Stacey, K.; Turner, R. The evolution and key concepts of the PISA mathematics frameworks. In Assessing Mathematical Literacy: The PISA Experience; Stacey, K., Turner, R., Eds.; Springer: Cham, Switzerland, 2015; pp. 5–33. [Google Scholar]
- Suurtamm, C.; Thompson, D.R.; Kim, R.Y.; Moreno, L.D.; Sayac, N.; Schukajlow, S.; Silver, E.; Ufer, S.; Vos, P. Assessment in Mathematics Education: Large-Scale Assessment and Classroom Assessment; Springer: Cham, Switzerland, 2016. [Google Scholar]
- Cevikbas, M.; Kaiser, G.; Schukajlow, S. A systematic literature review of mathematical modeling assessment in mathematics education context. Educ. Sci. 2022, 12, 561. [Google Scholar]
- AERA; APA; NCME. Standards for Educational and Psychological Testing; American Educational Research Association: Washington, DC, USA, 2014. [Google Scholar]
- Bicer, A. A systematic literature review: Discipline-specific and general instructional practices fostering the mathematical creativity of students. Int. J. Educ. Math. Sci. Technol. 2021, 9, 252–281. [Google Scholar] [CrossRef] [Scilit]
- Hakkarainen, A.; Holopainen, L.; Savolainen, H. Measuring mathematical skills in early childhood: A systematic review of the psychometric properties of early maths assessments and screeners. Educ. Psychol. Rev. 2024, 36, 103. [Google Scholar] [CrossRef] [Scilit]
- Bicer, A.; Lee, Y.; Perihan, C.; Capraro, M.M.; Capraro, R.M. Assessment of mathematical creative thinking: A systematic review. Think. Ski. Creat. 2022, 44, 101019. [Google Scholar] [CrossRef] [Scilit]
- Page, M.J.; McKenzie, J.E.; Bossuyt, P.M.; Boutron, I.; Hoffmann, T.C.; Mulrow, C.D.; Shamseer, L.; Tetzlaff, J.M.; Akl, E.A.; Brennan, S.E.; et al. The PRISMA 2020 statement: An updated guideline for reporting systematic reviews. BMJ 2021, 372, n71. [Google Scholar] [CrossRef] [Scilit] [PubMed]
- Petticrew, M.; Roberts, H. Systematic Reviews in the Social Sciences: A Practical Guide; Blackwell Publishing: Oxford, UK, 2006. [Google Scholar]
- Mokkink, L.B.; de Vet, H.C.W.; Prinsen, C.A.C.; Patrick, D.L.; Alonso, J.; Bouter, L.M.; Terwee, C.B. COSMIN risk of bias checklist for systematic reviews of patient-reported outcome measures. Qual. Life Res. 2018, 27, 1171–1179. [Google Scholar] [CrossRef] [Scilit] [PubMed]
- Popay, J.; Roberts, H.; Sowden, A.; Petticrew, M.; Arai, L.; Rodgers, M.; Britten, N.; Roen, K.; Duffy, S. Guidance on the Conduct of Narrative Synthesis in Systematic Reviews; ESRC Methods Programme: Lancaster, UK, 2006. [Google Scholar]
- Katrancı, Y.; Şengül, S. The relationship between mathematical literacy and visual math literacy self-efficacy perceptions of middle school students. Pegem Egit. Ogret. Derg. 2019, 9, 1113–1138. [Google Scholar] [CrossRef] [Scilit]
- Efriani, A.; Putri, R.I.I.; Hapizah. Sailing context in PISA-like mathematics problems. J. Math. Educ. 2019, 10, 265–276. [Google Scholar] [CrossRef] [Scilit]
- Jacobbe, T.; delMas, R.; Hartlaub, B.; Haberstroh, J.; Case, C.; Foti, S.; Whitaker, D. Establishing the validity and reliability of the LOCUS assessments. Numeracy 2023, 16, 5. [Google Scholar] [CrossRef] [Scilit]
- Suciati; Munadi, S.; Sugiman; Febriyanti, W.D.R. Design and validation of mathematical literacy instruments for assessment for learning in Indonesia. Eur. J. Educ. Res. 2020, 9, 865–875. [Google Scholar] [CrossRef] [Scilit]
- Primi, C.; Morsanyi, K.; Donati, M.A.; Galli, S.; Chiesi, F. Measuring probabilistic reasoning: The construction of a new scale applying item response theory. J. Behav. Decis. Mak. 2017, 30, 1086–1098. [Google Scholar] [CrossRef] [Scilit]
- Purnomo, H.; Sa’dijah, C.; Hidayanto, E.; Sisworo; Permadi, H.; Anwar, L. Development of instrument numeracy skills test of minimum competency assessment (MCA) in Indonesia. Int. J. Instr. 2022, 15, 635–648. [Google Scholar] [CrossRef] [Scilit]
- Leiss, D.; Ehmke, T.; Heine, L. Reality-based tasks for competency-based education: The need for an integrated analysis of subject-specific, linguistic, and contextual task features. Learn. Individ. Differ. 2024, 114, 102518. [Google Scholar] [CrossRef] [Scilit]
- Davis, L.L. Instrument review: Getting the most from a panel of experts. Appl. Nurs. Res. 1992, 5, 194–197. [Google Scholar] [CrossRef] [Scilit]
- Wilson, M. Constructing Measures: An Item Response Modeling Approach; Lawrence Erlbaum Associates: Mahwah, NJ, USA, 2005. [Google Scholar]
- Nunnally, J.C. Psychometric Theory, 2nd ed.; McGraw-Hill: New York, NY, USA, 1978. [Google Scholar]
- Ramadhani, R.; Nuraeni, E.; Purwianingsih, W. PISA-based assessment development in environmental issues: Fostering numeracy literacy through waste management context. JPBI (J. Pendidik. Biol. Indones.) 2025, 11, 811–827. [Google Scholar] [CrossRef] [Scilit]
- Kartianom, K.; Retnawati, H.; Hidayati, K. Assessing the fairness of mathematical literacy test in Indonesia: Evidence from gender-based differential item function analysis. J. Pedagog. Res. 2024, 8, 191–208. [Google Scholar] [CrossRef] [Scilit]
- Marhami; Juandi, D.; Dasari, D. Indonesian students’ numeracy skills based on PISA mathematical problems in secondary school: A meta-synthesis. J. Pendidik. MIPA 2024, 25, 14–26. [Google Scholar] [CrossRef] [Scilit]
- Wijaya, T.T.; Hidayat, W.; Hermita, N.; Alim, J.A.; Talib, C.A. Exploring contributing factors to PISA 2022 mathematics achievement: Insights from Indonesian teachers. Infinity J. 2024, 13, 139–156. [Google Scholar] [CrossRef] [Scilit]
- Hambleton, R.K.; Swaminathan, H.; Rogers, H.J. Fundamentals of Item Response Theory; Sage: Newbury Park, CA, USA, 1991. [Google Scholar]
- Thompson, N.A. Item Response Theory: Better Assessment with ML; Assessment Systems: Stillwater, MN, USA, 2024; Available online: https://assess.com/what-is-item-response-theory/ (accessed on 9 December 2025).
- Blömeke, S.; Gustafsson, J.-E.; Shavelson, R.J. Beyond dichotomies: Competence viewed as a continuum. Z. Psychol. 2015, 223, 3–13. [Google Scholar]
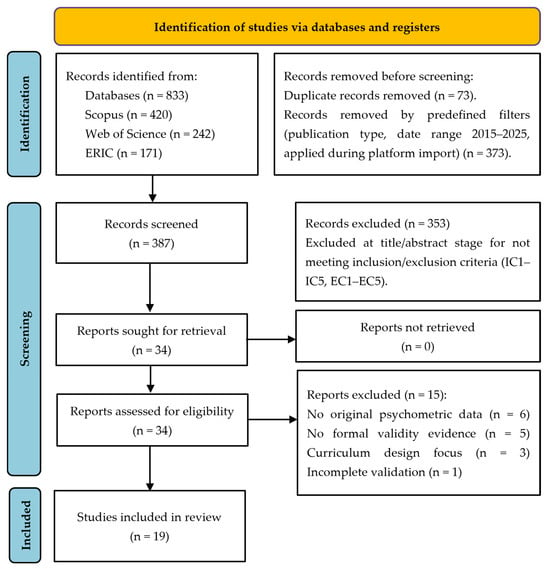

Disclaimer/Publisher’s Note: The statements, opinions and data contained in all publications are solely those of the individual author(s) and contributor(s) and not of MDPI and/or the editor(s). MDPI and/or the editor(s) disclaim responsibility for any injury to people or property resulting from any ideas, methods, instructions or products referred to in the content. |
© 2026 by the authors. Licensee MDPI, Basel, Switzerland. This article is an open access article distributed under the terms and conditions of the Creative Commons Attribution (CC BY) license.