


Abstract
Purpose: We aimed to compare neuromuscular performance between academy soccer players (U-17, U-19, and U-21 categories) and first-team players, and to establish neuromuscular performance thresholds associated with the first-team level. Methods: Ninety-four male players participated and were followed over two seasons. Neuromuscular performance was assessed using force-plate and force-sensing frame technologies, including isometric hip adduction and abduction, Nordic hamstring exercise, countermovement jump (CMJ), and isometric squat hold. Peak force, eccentric and concentric peak force, rate of force development, impulse, modified reactive strength index (RSI-modified), dynamic strength index (DSI) and limb asymmetry were analyzed. Linear mixed models, binary logistic generalized estimating equations (GEE), and receiver operating characteristic (ROC) curve analyses were performed. Results: The neuromuscular variables that best discriminated between soccer academy and first-team were maximal hip pull force (OR = 2.53, p < 0.001), concentric peak force (OR = 2.42, p < 0.001), eccentric peak force (OR = 1.31, p = 0.046), modified RSI (OR = 2.00, p < 0.001), RFD at 200 ms (OR = 1.46, p = 0.004), and DSI (OR = 2.13, p < 0.001). ROC analysis identified practical cutoff values for maximal hip abduction force (442 N), maximal concentric and eccentric forces during the CMJ (1856 and 1804 N, respectively), modified RSI (0.58 m·s−1) and DSI (0.57). Conclusions: First-team players demonstrate superior neuromuscular performance to academy players. The identified cutoff values should be considered exploratory benchmarks for distinguishing current competitive levels and require external, prospective validation in independent cohorts from other clubs before practical application.
1. Introduction
Physical performance in soccer is characterized by the repeated execution of explosive actions such as sprinting, accelerating, decelerating, changing direction, jumping, tackling, and kicking, all of which depend on the ability to generate force rapidly [1]. Consequently, maximal and rapid force production are now recognized as fundamental physical qualities underpinning athletic performance in soccer [2]. Recent evidence indicates that neuromuscular capabilities progressively improve with both age and competitive level [3]. Furthermore, assessing different manifestations of strength, together with force–time characteristics, provides a more comprehensive understanding of neuromuscular function than traditional performance outcomes alone [4].
Advances in force-platform technologies have facilitated the objective assessment of multiple neuromuscular qualities within routine soccer practice. Systems such as ForceFrame, NordBord, and ForceDecks enable practitioners to quantify maximal strength, eccentric and concentric forces, rapid force production, reactive and dynamic strength, and inter-limb asymmetries using standardized and reliable protocols [5,6,7]. Consequently, these assessments are increasingly implemented in professional soccer to monitor physical development and guide individualized strength and conditioning programs. In youth soccer academies, the NordBord and ForceFrame have been highlighted as practical and time-efficient tools for evaluating hamstring eccentric strength and adductor isometric strength across large numbers of players, while also demonstrating sensitivity to changes in neuromuscular performance over time [8]. Their implementation is further supported by evidence showing that neuromuscular performance develops progressively throughout the academy pathway, with squat jump, countermovement jump, and relative mean propulsive power increasing across age categories until the U20 level, where values become comparable to those of senior professional players [9]. Accordingly, the assessment of lower-limb strength has become a key component of long-term athletic development programs aimed at improving physical quality and muscular strength throughout youth development [10].
Despite the increasing use of force-platform technologies, current evidence has primarily focused on establishing normative values, evaluating test reliability, or comparing age groups using isolated tests or competitive standards [11,12], as well as examining the sensitivity of countermovement jumps (CMJs) to detect fatigue from both quantitative and qualitative movement perspectives [13]. Previous studies [14] reported that physical performance characteristics contribute to distinguishing players who successfully progress through elite development pathways, while Hwang et al. [15] showed that countermovement jump performance, lower-limb strength, and soccer-specific fitness tests were associated with progression to the professional level and could be integrated into predictive talent-identification models. Nevertheless, despite the widespread implementation of force-platform technologies in soccer, normative neuromuscular profiles across academy age groups remain scarce, particularly within professional clubs from the CONCACAF region. Determining age-specific reference values and identifying neuromuscular variables with good discriminatory ability through receiver operating characteristic (ROC) analysis may provide practitioners with objective cutoff values to support player profiling, longitudinal monitoring, and evidence-based decision-making during the transition from academy to first teams. Therefore, the aim of this study was to compare neuromuscular performance between academy (U17, U19, and U21) and first-team soccer players and to examine the ability of neuromuscular performance measures to differentiate first-team from academy players.
2. Materials and Methods
2.1. Participants
The a priori sample-size calculation was based on the primary repeated-measures analysis. A total of 94 players were included in the study. Across the eight scheduled assessment sessions, 739 of 752 possible assessments were completed (98.3%), with 13 assessments (1.7%) missing. The GEE and ROC analyses were considered exploratory discrimination analyses, and no analysis-specific a priori sample-size calculation was performed for these analyses [16]. Players were allocated into four competitive categories according to their official team: U17 (n = 22; age 15.8 ± 0.66 years; body mass 70.3 ± 8.7 kg), U19 (n = 23; age 17.5 ± 0.90 years; body mass 69.3 ± 9.2 kg), U21 (n = 24; age 18.1 ± 0.92 years; body mass 72.0 ± 8.6 kg), and first team (n = 25; age 25.5 ± 5.24 years; body mass 72.4 ± 7.9 kg). All assessments were conducted over two competitive seasons under standardized testing conditions. Inclusion criteria were: (i) registration as an active player in one of the club’s official squads (U17, U19, U21, or first team); (ii) regular participation in team training and competition during the year; and (iii) completion of at least 80% of all neuromuscular testing procedures. The exclusion criteria were: (i) musculoskeletal injury or pain that limited participation in testing; (ii) surgery or major lower-limb injury within the previous four months; and (iii) or incomplete or invalid test data. The study received ethical approval under reference UNA-CECUNA-CIRCLE-001-2026. All data were collected as part of routine institutional monitoring, and all players provided informed consent to participate. For participants under 18 years of age, written informed consent was obtained from a parent or legal guardian, and participant assent was obtained when applicable. The study was observational and descriptive, involved no biomedical or clinical intervention, contained no individually identifiable data, and posed minimal risk to participants.
2.2. Study Designs
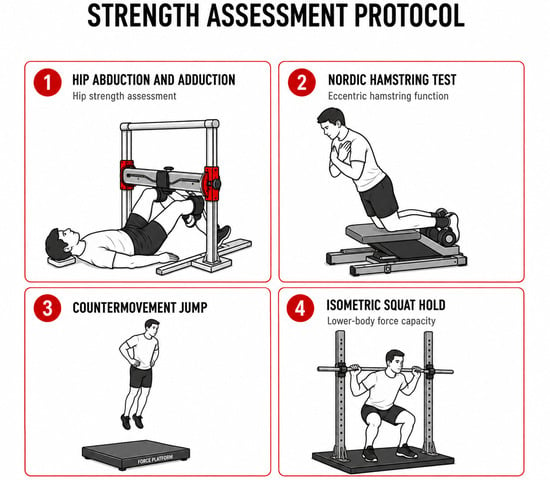
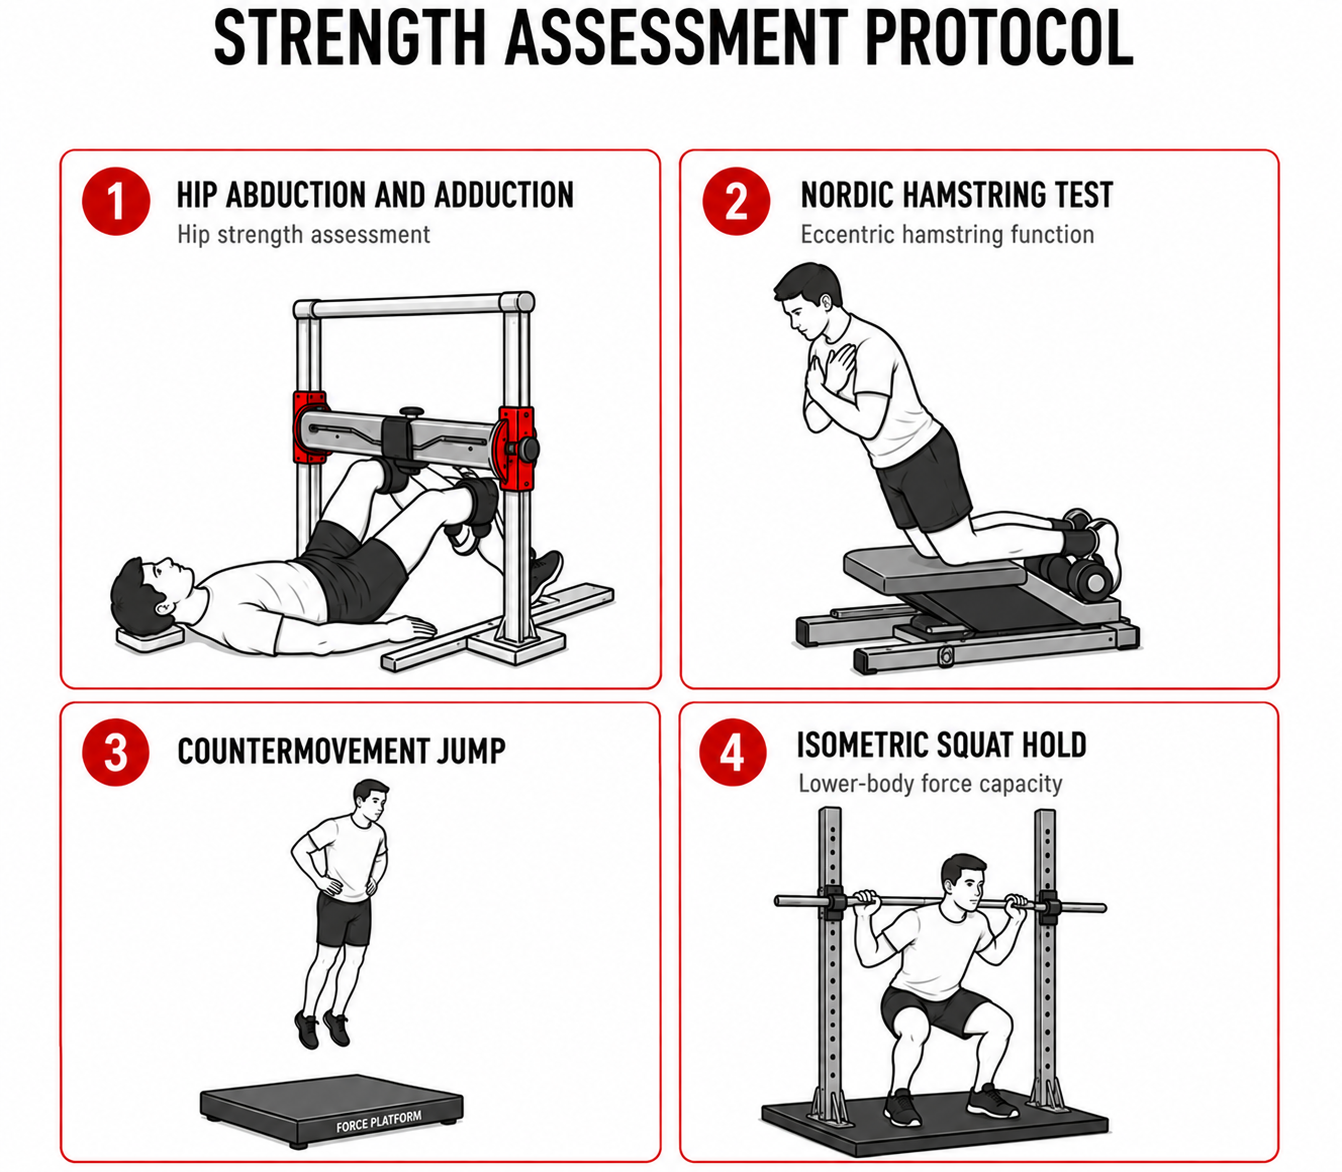
This observational cohort study was reported in accordance with the STROBE Statement [17] to evaluate neuromuscular performance across four soccer player categories (U17, U19, U21, and first team). Players were assessed on eight occasions throughout two competitive seasons, with testing sessions conducted once per month, resulting in 739 longitudinal player assessments. Thirteen assessments were not completed because of temporary physical complaints or injury-related limitations, recommendations from the medical or coaching staff, or absence from the scheduled testing session. Each testing session was performed under standardized conditions and followed the same assessment protocol for all participants. Each testing session lasted approximately 2 hours and was conducted at the club’s training facilities. To minimize the influence of fatigue and circadian variation, all assessments were performed at the same time of day for each group. The testing battery followed a standardized sequence consisting of hip pull, hip squeeze, Nordic test, CMJ, and isometric squat (see Figure 1), with standardized recovery periods provided between tests. The players maintained their usual controlled nutrition and hydration habits at the club’s facilities. All assessments were supervised by the club’s Director of Sports Sciences along with the physical trainers for each age group.
Figure 1.
Neuromuscular testing battery performed in the LDA Professional Soccer Academy. Note: The assessment battery consisted of five neuromuscular tests performed in the following order: (1) hip abduction and adduction strength test, (2) Nordic hamstring exercise test, (3) countermovement jump (CMJ) using force plates, and (4) isometric squat hold. All tests were conducted under standardized conditions as part of the routine neuromuscular monitoring program of the Soccer Academy.
2.3. Neuromuscular Assessments
2.3.1. Hip Adduction and Abduction Strength
Maximum isometric hip adduction or “squeeze exercise” and abduction or “pull exercise” strength was assessed using the ForceFrame system (Vald Performance, Newstead, QLD, Australia). The ForceFrame enables the simultaneous assessment of bilateral hip strength and the quantification of inter-limb asymmetry [7]. Participants were positioned supine beneath the ForceFrame with the hips flexed to 45° and the knees flexed to approximately 90°, following the manufacturer’s standardized testing protocol. During the squeeze assessment, the medial femoral condyles and tibial condyles were aligned with the central force pads, whereas during the pull assessment, the lateral femoral condyles and fibular heads were aligned with the external force pads (Figure 1) [18].
Participants were instructed to maintain contact between the pelvis, trunk, and examination table throughout the assessment and to produce a maximal isometric contraction “as fast and as hard as possible” for 5 s. Three maximal trials were performed for each test with 10 s of passive recovery between repetitions. Standardized verbal encouragement was provided during every trial. The ForceFrame software (v3.1.1) recorded Squeeze and Pull exercises variables, including peak force (N), Max Ratio (unitless), Max Impulse (N·s), and peak force asymmetry (%) based on absolute magnitude. The highest values obtained across the three trials were retained for statistical analysis. The hip adduction and abduction tests demonstrated good reliability, with ICC values ranging from 0.82 to 0.85 [5].
2.3.2. Nordic Hamstring Exercise
Eccentric knee flexor strength was assessed using the NordBord Hamstring Testing System (Vald Performance, Newstead, QLD, Australia), which samples force data at 50 Hz. Participants assumed a kneeling position on the padded platform with the ankles secured immediately superior to the lateral malleoli using the device’s ankle hooks. Following the standardized testing protocol, participants maintained an upright trunk and hip position while gradually leaning forward, resisting the forward movement maximally with the hamstring muscles until they could no longer control the descent. During the movement, the arms remained flexed in front of the body to safely arrest the fall [19]. Before testing, participants completed two familiarization repetitions without data collection. Following a 3 min passive recovery period, two maximal trials were performed with standardized verbal encouragement during each repetition. The NordBord software (v3.1.1) automatically recorded peak force (N), maximum torque (N·m), maximum impulse (N·s), and peak force asymmetry (%) based on absolute magnitude. The highest values obtained across the two trials were retained for statistical analysis. The NordBord system has demonstrated good-to-excellent reliability for the assessment of eccentric hamstring strength (ICC = 0.83–0.90) [20].
2.3.3. Countermovement Jump
CMJ performance was assessed using dual ForceDecks FD4000 force platforms (Vald Performance, Newstead, QLD, Australia), sampling force data at 1000 Hz. Participants stood quietly with one foot positioned on each force platform and their hands placed on their hips throughout the test. Following a self-selected countermovement depth, participants performed a maximal vertical jump while minimizing horizontal displacement and maintaining their hands on their hips during the entire movement. Standardized verbal encouragement was provided during each trial.
Two maximal CMJ were performed with 60 s of passive recovery between attempts. Any trial in which participants removed their hands from their hips or exhibited an obvious technical error was discarded and repeated following the recovery period. The ForceDecks software (v3.1.1) automatically identified the eccentric and concentric phases of the jump from the vertical ground reaction force–time curve and calculated jump height (cm), relative peak power (W·kg−1), concentric peak force (N), eccentric peak force (N), peak force asymmetry (%), and Reactive Strength Index–Modified (RSI–modified; m·s−1). RSI–modified was calculated as jump height divided by time to take-off. The highest values obtained across the two trials were retained for statistical analysis. The ForceDecks system has previously demonstrated good reliability for the assessment of jump performance in soccer players academy (ICC > 0.81) [21].
2.3.4. Isometric Squat Hold Test
Maximal isometric squat hold test was assessed using dual ForceDecks FD4000 force platforms (Vald Performance, Newstead, QLD, Australia), sampling force data at 1000 Hz. Participants stood with one foot positioned on each force platform beneath a fixed barbell secured within a squat rack. The bar height was individually adjusted to achieve a knee flexion angle of approximately 140° while maintaining a standardized hip position across participants. Following a progressive preload, participants were instructed to exert maximal force against the immovable bar “as fast and as hard as possible” for 5 s while maintaining their feet in contact with the force platforms. Two maximal trials were performed with 1 min of passive recovery between attempts. Standardized verbal encouragement was provided during each trial. The ForceDecks software automatically identified contraction onset as the first instantaneous force increase ≥20 N above the force recorded during the weighing period. Contraction onset was visually verified before the final analysis. The software calculated peak vertical force (N), relative peak vertical force (N·kg−1), impulse at 200 ms (N·s), rate of force development at 200 ms (RFD200; N·s−1), peak force asymmetry (%), and dynamic strength index (DSI). DSI was calculated as the ratio of countermovement jump peak force to isometric squat peak force [22]. The highest values obtained across the two trials were retained for statistical analysis. The isometric squat test variables demonstrated acceptable-to-good reliability, with ICC values ≥ 0.75 [6].
2.3.5. Statistical Analysis
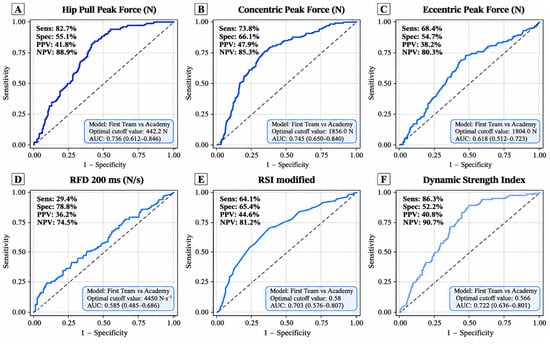
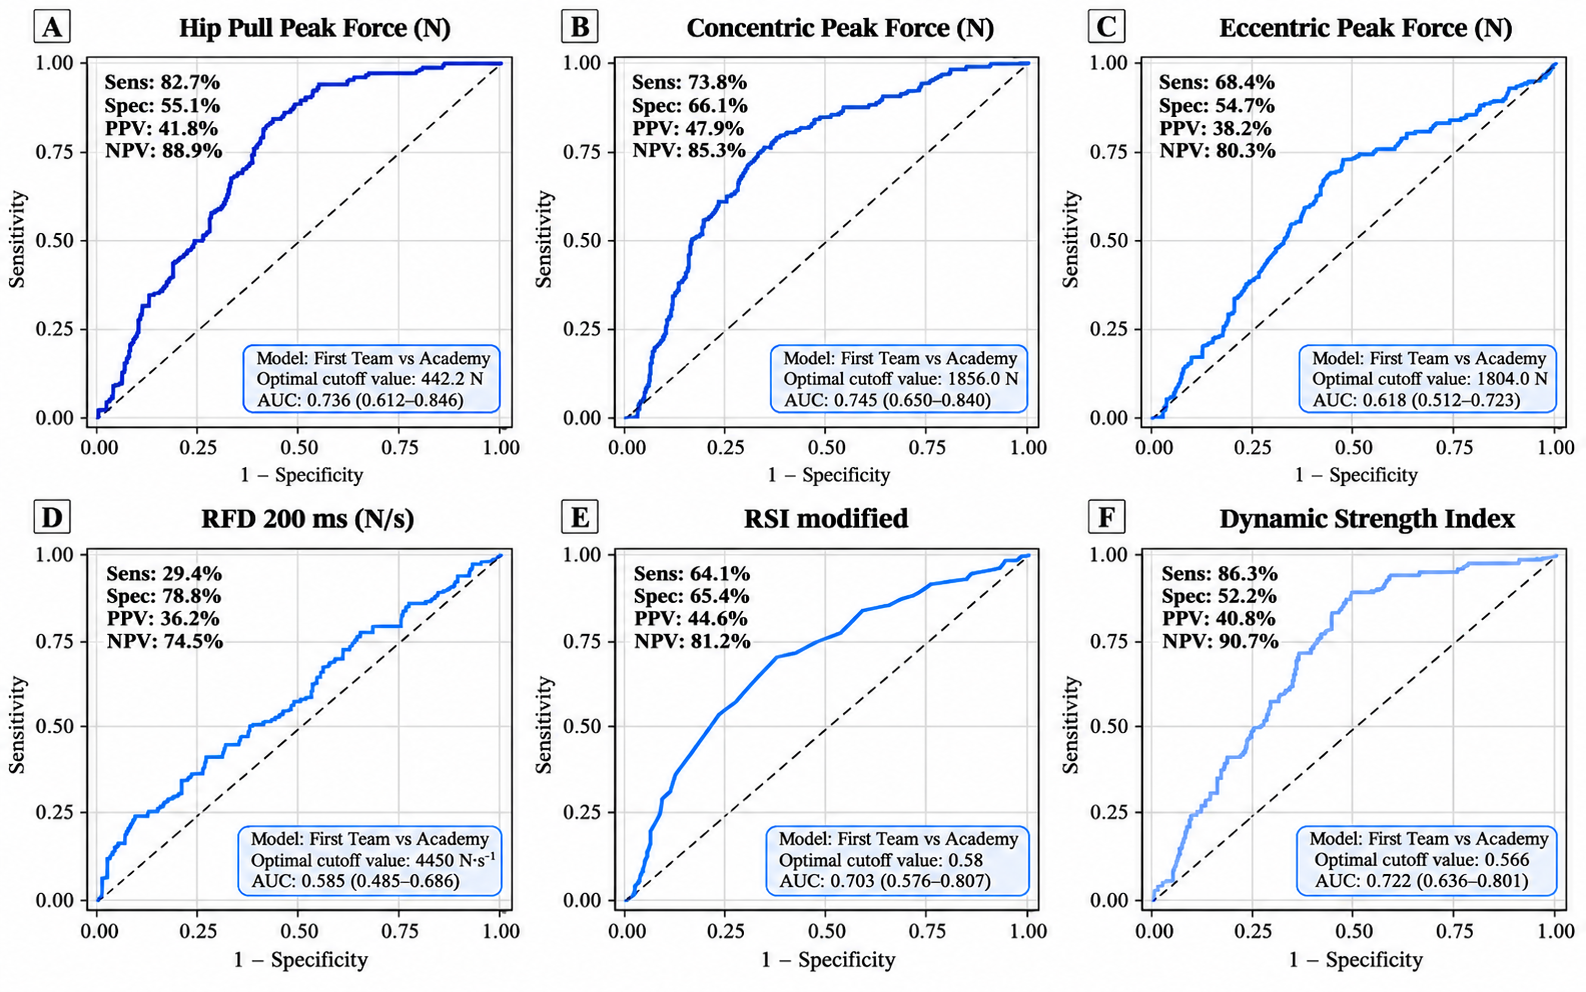
Normality of the data was examined using Shapiro–Wilk tests and visual inspection of Q–Q plots, and descriptive data are presented as mean ± standard deviation (SD). A predefined hierarchical analytical strategy was used. Neuromuscular variables were first evaluated for differences across player categories (U17, U19, U21, and first team) using a linear mixed model (LMM), with player category included as a fixed effect and player ID as a random intercept to account for repeated measurements within players across the season [23]. The LMM were estimated using restricted maximum likelihood (REML), and model assumptions were evaluated by inspection of residual and Q–Q plots. When a significant overall category effect was observed, post hoc pairwise comparisons were performed using Tukey-adjusted tests. Additionally, sensitivity analyses included the time of assessment as a fixed adjustment factor to determine whether category effects were robust against potential intra-season variations; however, category × occasion interactions were not examined because temporal differences between categories were outside the prespecified study objective (see the Supplementary Material S1). Variables showing significant between-category differences in the LMM were subsequently examined using separate binary logistic generalized estimating equation (GEE) models, in which academy players (U17, U19, and U21) were grouped and compared with first-team players. Player ID was specified as the subject variable, with an independent working correlation structure and robust sandwich covariance estimator [24]. Odds ratios (ORs), robust 95% confidence intervals (CIs), Wald χ2 statistics, and p-values were reported, with regression coefficients and ORs expressed per 1-SD increase in each neuromuscular variable to facilitate comparisons across measures with different scales. Additionally, sensitivity analyses adjusting for assessment timing were conducted for both LMM and GEE models, with the results presented in Supplementary Material S1. Only variables remaining statistically significant in the GEE models were taken forward to exploratory receiver operating characteristic (ROC) curve analyses to evaluate their ability to discriminate between academy and first-team players. Optimal cutoff values were determined in the full sample using the Youden index [25]. The ROC curves and AUC values presented in Figure 2 were obtained from the full dataset and represent apparent discrimination estimates.
Figure 2.
Receiver operating characteristic (ROC) curves for the neuromuscular variables discriminating first-team and academy soccer players. Note: (A) Hip pull peak force (N); (B) Concentric peak force (N); (C) Eccentric peak force (N); (D) Rate of force development at 200 ms (RFD 200 ms; N/s); (E) Modified reactive strength index (RSI-mod; m/s); and (F) Dynamic strength index (DSI). The solid blue lines represent the ROC curves, while the dashed diagonal lines indicate chance-level discrimination (AUC = 0.50). Each panel presents sen-sitivity, specificity, positive predictive value (PPV), negative predictive value (NPV), optimal cutoff value, and area under the curve (AUC) with its 95% confidence interval. Optimal cutoff values were determined using the Youden index.
Internal validation was subsequently performed using player-level cluster bootstrap resampling with 2000 iterations, preserving all repeated assessments within each resampled player cluster [26]. AUC, sensitivity, specificity, positive predictive value (PPV), and negative predictive value (NPV) were evaluated using out-of-bag observations, with 95% CIs derived from the bootstrap distributions [27]. Cutoff stability was assessed through the bootstrap-derived distribution of optimal thresholds, with uncertainty expressed as 95% percentile confidence intervals. AUC values were interpreted as excellent (0.90–1.00), good (0.80–0.89), fair (0.70–0.79), poor (0.60–0.69), or fail (<0.60) [27]. The sequential analytical strategy was prespecified to progressively reduce the number of variables evaluated at each stage; GEE and ROC analyses were considered exploratory, and their findings should therefore be interpreted as hypothesis-generating and requiring confirmation in independent cohorts. All statistical tests were performed using jamovi (version 2.7.37) and IBM SPSS Statistics (version 28.0), while graphical representations were generated using R (version 4.6.1). Statistical significance was set at p < 0.05.
3. Results
Table 1 summarizes hip pull, hip squeeze, and Nordic hamstring exercise performance across soccer player categories. In the hip abduction test, significant between-category differences were observed for peak force (p < 0.001) and maximum impulse (p = 0.015), whereas maximum ratio and peak force asymmetry did not differ between categories. First-team players produced greater peak force than the U17, U19, and U21 groups, while maximum impulse was higher in first-team and U21 players compared with the U17 category.
Table 1.
Neuromuscular performance in the hip pull, hip squeeze, and Nordic tests across soccer player categories.
In the hip adduction test, significant differences were found for peak force (p = 0.007) and maximum impulse (p = 0.010), whereas Max Ratio and peak force asymmetry did not differ between categories. U21 players demonstrated greater peak force than U17 players, while U17 players exhibited greater maximum impulse than the U21 category. In the Nordic hamstring exercise, significant differences were observed for peak force (p = 0.005) and maximum torque (p = 0.010), whereas maximum impulse and peak force asymmetry did not differ between categories. U21 players demonstrated greater peak force than U19 players, while U19 players exhibited greater maximum torque than first-team and U17 players.
Table 2 summarizes CMJ and isometric squat hold performance across soccer player categories. In the CMJ, no significant between-category differences were observed for jump height, peak power relative to body mass, or peak force asymmetry. Significant differences were found for concentric peak force (p < 0.001), eccentric peak force (p = 0.005), and RSI-modified (p < 0.001). First-team players demonstrated greater concentric peak force than the U19 and U21 groups, while U17 and U19 players also showed greater values than the U21 group. For eccentric peak force, first-team players demonstrated greater values than the U19 players. First-team players also exhibited greater RSI-modified values than the U17, U19, and U21 groups.
Table 2.
Neuromuscular performance in the CMJ and isometric squat hold test across soccer player categories.
In the isometric squat hold test, peak vertical force, relative peak vertical force, and peak force asymmetry did not differ between categories. Significant between-category differences were observed for absolute impulse at 200 ms (p = 0.036), RFD at 200 ms (p = 0.013), and DSI (p < 0.001). First-team players demonstrated greater absolute impulse than the U19 and U17 group and greater RFD at 200 ms than the U19 group. DSI was greater in first-team players than in the U17, U19, and U21 players.
Table 3 presents the results of the GEE analyses. Significant associations with first-team players were observed for hip pull maximal force (OR = 2.535, p < 0.001), concentric peak force (OR = 2.416, p < 0.001), eccentric peak force (OR = 1.315, p = 0.046), RSI-modified (OR = 2.004, p < 0.001), RFD at 200 ms (OR = 1.468, p = 0.004), and DSI (OR = 2.135, p <0.001). In contrast, hip squeeze maximal force (p = 0.060) and Nordic maximal force (p = 0.078) were not significantly associated with First-team players.
Table 3.
Logistic regression analyses of neuromuscular variables distinguishing first-team and academy soccer players.
Figure 2 shows the ROC curve analyses for the six neuromuscular variables that remained statistically significant in the GEE models. Hip pull peak force showed an AUC of 0.736 with an optimal cutoff of 442 N (95% CI: 407.50–463.50 N), while concentric and eccentric peak force showed AUC values of 0.745 and 0.618, with optimal cutoffs of 1856 N (95% CI: 1776–1994 N) and 1804 N (95% CI: 1763–1931 N), respectively. RFD at 200 ms showed an AUC of 0.585 with an optimal cutoff of 4450 N·s−1 (95% CI: 2858–5900 N·s−1), whereas RSI-modified showed an AUC of 0.703 with an optimal cutoff of 0.58 m·s−1 (95% CI: 0.57–0.65 m·s−1). Finally, DSI showed an AUC of 0.722 with an optimal cutoff of 0.57 (95% CI: 0.563–0.609).
4. Discussion
The present study compared neuromuscular performance between academy players (U21, U19, and U17) and first-team players; additionally, it examined the ability of neuromuscular performance measures to differentiate first-team from academy players. The main results indicated that several measures of maximal strength differed across categories, with first-team players generally demonstrating superior performance; likewise, variables related to rapid force production, including modified RSI and DSI—were associated with current competitive level and showed varying degrees of discriminative ability between first-team and academy players.
The results of the hip pull and squeeze tests (abductor and adductor, respectively) and Nordic hamstring test indicate that measures of absolute force production are more sensitive in differentiating category level than measures of limb asymmetry and force ratios. First-team players consistently demonstrated greater hip peak force than the younger categories, particularly U17 and U19 players, indicating differences in maximal force production across current competitive categories rather than demonstrating longitudinal progression from academy to first-team status. These findings agree with previous studies reporting lower hip strength values in youth soccer players (321.0 ± 73.9 N) [28] and higher values in professional players from the Polish league (435 ± 71 N) [11], and Premier League players, who have been reported to exceed 470 N [29]. Similarly, our findings indicate that academy soccer players exhibited lower strength values than those previously described in elite U18 Premier League players [12]. Regarding eccentric hamstring strength, the Nordic hamstring test values observed in the present study were consistent with the range previously reported in elite professional soccer players (approximately 200–400 N) [8,30], suggesting that differences in biological maturation and competitive level may contribute to the progressive increase in hip force production. This development is possibly associated with differences in accumulated resistance training exposure, high-intensity match demands, and neuromuscular characteristics between competitive categories [11], although these mechanisms were not directly examined in the present study. In contrast, neither inter-limb asymmetry nor maximum force ratio differed between competitive categories, suggesting that these variables may reflect individual neuromuscular characteristics rather than competitive level, and may therefore be more relevant for injury monitoring than for distinguishing playing standard.
The CMJ and isometric squat results further reinforce the importance of rapidly generating force as a fundamental neuromuscular characteristic underpinning progression through the soccer development pathway [2,31]. Although jump height, relative peak power, maximal isometric force, and inter-limb asymmetry remained largely comparable across competitive categories, variables reflecting explosive neuromuscular function, including concentric peak force, RSI-modified, impulse at 200 ms, RFD200, and DSI showed clear differences between groups. These results suggest that the ability to rapidly generate and transmit force may better characterize competitive level than maximal force capacity alone, and studies have shown that the explosive action during these tests (CMJ and isometric maximal force) is associated with the high demands of specific soccer actions such as sprinting, accelerating, decelerating, jumping, and change of direction [32,33]. Interestingly, jump height did not discriminate competitive level; first-team players generated substantially greater concentric and eccentric forces, indicating that the neuromuscular adaptations associated with elite performance are more effectively captured by force–time characteristics than by jump height alone [34]. Furthermore, jump height is influenced by movement coordination during the CMJ and may also be affected by neuromuscular fatigue [13,35].
Also, our findings are consistent with previous reports showing greater concentric and eccentric peak forces, together with higher RSI-modified values, in older and more advanced soccer players. Springham et al. [12] reported progressive increases in concentric peak force (U18: 1979 ± 373 N; U23: 2173 ± 461 N), eccentric peak force (U18: 1924 ± 417 N; U23: 2156 ± 499 N), and RSI-modified (U18: 0.55 ± 0.09; U23: 0.67 ± 0.15) across the Premier League development pathway, providing comparative evidence of neuromuscular differences between age categories that is consistent with the cross-sectional differences observed in the present study. Likewise, the RSI-modified values observed in our first-team players were comparable to those reported in young soccer players (~0.57 m·s−1) [36] and professional players (>0.60 m·s−1) [37]. Lastly, the DSI values observed in the present study were generally consistent with previously proposed interpretative thresholds, whereby values below approximately 0.60 may indicate a greater need to improve explosive ballistic performance relative to maximal strength [38].
Another important methodological strength of the present study is the application of binary GEE to examine neuromuscular variables associated with competitive level while accounting for repeated assessments within players. Unlike conventional between-group comparisons, GEE models account for the within-player correlation arising from repeated measurements and estimate the association between each neuromuscular variable and the odds of belonging to the first team [24,39]. Hip pull peak force showed one of the strongest associations, with each one-standard-deviation increase associated with approximately 2.5-fold higher odds of belonging to the first team (OR = 2.53). Similarly, higher concentric peak force (OR = 2.42), DSI (OR = 2.13), RSI-modified (OR = 2.00), RFD at 200 ms (OR = 1.46), and eccentric peak force (OR = 1.31) were all positively associated with first-team status, reinforcing the importance of explosive neuromuscular qualities for progression through the soccer development pathway.
The ROC curve analysis further examined the discriminatory ability of the identified neuromuscular variables and established exploratory performance thresholds associated with current first-team status. Although the discriminative ability of some identified variables was acceptable rather than excellent (AUC = 0.70–0.75) the derived cutoff values provide preliminary descriptive reference points for comparing neuromuscular profiles between academy and first-team players, rather than validated criteria for talent identification or future professional progression. To our knowledge, relatively few studies have applied ROC analysis within the context of talent identification using objective physical performance assessments. Among these, Woods et al. [14,40] demonstrated the utility of ROC-derived thresholds to discriminate talent identified, whereas other studies [15] reported moderate discriminatory performance (AUC = 0.73) for predicting progression from elite youth to professional soccer using physical performance variables. Building upon this line of research, the present study represents one of the few investigations to combine GEE logistic regression with ROC curve analysis to identify objective neuromuscular variables associated with first-team level and establish practical cutoff values using force-platform technologies. Specifically, hip pull peak force (>442 N), concentric peak force (>1856 N), RSI-modified (>0.58 m·s−1) and DSI (>0.57) may serve as preliminary descriptive reference values for comparing the neuromuscular profiles of academy and first-team players. Although RFD at 200 ms was significantly associated with competitive level in the GEE analysis, its ROC performance indicated insufficient discriminatory ability (AUC = 0.585). This distinction highlights that a statistically significant association does not necessarily translate into meaningful classification performance. Furthermore, the low sensitivity (29.5%) indicates that the proposed cutoff of 4450 N·s−1 has limited ability to identify first-team players. Therefore, this threshold should not be interpreted as a practical benchmark for player classification or decision-making. Furthermore, consistent with recent recommendations in talent identification research [41], these thresholds should be interpreted as exploratory indicators of current neuromuscular characteristics with potential relevance for future player progression: this requires longitudinal validation and should be considered alongside technical, tactical, psychological, and contextual factors.
Limitations
Although a comprehensive protocol comprising five neuromuscular assessments was implemented throughout the competitive season to characterize different aspects of neuromuscular performance in soccer players, limitations should be acknowledged. Chronological age, biological maturation, body size and body composition, training history, training load, match participation, and playing position were not incorporated as covariates in the models (LMM and GEE) and may have influenced the observed differences between competitive categories. This is relevant because the categories differed substantially in age and several of the neuromuscular measures were expressed as absolute force values rather than relative values. Therefore, the identified cutoff values should be interpreted, population-specific discriminatory reference values rather than universal first-team thresholds. Furthermore, these values were derived from a single professional soccer club and require external validation in other soccer academies, mainly in Costa Rica, Central America and the Caribbean. Future studies should incorporate potential confounding factors such as age, maturation, body size/body composition, training history, and playing position, and examine body-mass-normalized or allometrically scaled neuromuscular measures.
5. Conclusions
Neuromuscular performance differed across soccer player categories, with first-team players generally demonstrating greater force-generating and explosive neuromuscular characteristics than academy players. Hip pull peak force, concentric peak force, RSI-modified and DSI were associated with first-team level. However, the identified cutoff values should be interpreted as exploratory neuromuscular references for distinguishing current competitive levels rather than predicting future promotion. These findings may contribute to a better understanding of neuromuscular differences between academy and first-team players, although external and prospective validation in independent cohorts from other clubs is required before their application in player profiling and development programs.
Supplementary Materials
The following supporting information can be downloaded at: https://www.mdpi.com/article/10.3390/sports14110522/s1, Supplementary Material S1: Temporal sensitivity analyses of neuromuscular performance across competitive levels in soccer players.
Author Contributions
Conceptualization, J.D.J.L. and D.R.-V.; methodology, A.A.V.-B. and D.R.-V.; formal analysis, A.A.V.-B.; investigation, A.A.V.-B. and J.D.J.L.; resources, J.D.J.L.; data curation, J.D.J.L.; writing—original draft preparation, A.A.V.-B.; writing—review and editing, A.A.V.-B., J.D.J.L. and D.R.-V.; supervision, D.R.-V.; project administration, J.D.J.L. All authors have read and agreed to the published version of the manuscript.
Funding
This work was funded by the Government of the Autonomous Community of Extremadura (Junta de Extremadura) and the European Social Fund (ESF) through the postdoctoral research grants program for doctoral researchers within the Extremadura System of Science, Technology, and In-novation (grant number: PO_24148).
Institutional Review Board Statement
The study was approved by the National University of Costa Rica Ethics Committee (UNA-CECUNA-CIRCLE-001-2026; 20 April 2026). Data were collected as part of routine team monitoring, and informed consent was obtained from the participants’ parents or legal guardians.
Informed Consent Statement
All data was collected as part of routine institutional monitoring, and players agreed to participate using informed consent. For participants under 18 years of age, written informed consent was obtained from a parent or legal guardian, and participant assent was obtained when applicable.
Data Availability Statement
The anonymized dataset supporting the findings of this study is publicly available in Figshare at https://doi.org/10.6084/m9.figshare.33012203.
Acknowledgments
The authors sincerely thank the sports director, coaching staff, and academy players, for their in-valuable collaboration. Their support and participation made this longitudinal study possible.
Conflicts of Interest
The authors declare no conflicts of interest.
References
- Barnes, C.; Archer, D.T.; Hogg, B.; Bush, M.; Bradley, P.S. The Evolution of Physical and Technical Performance Parameters in the English Premier League. Int. J. Sports Med. 2014, 35, 1095–1100. [Google Scholar] [CrossRef] [Scilit] [PubMed]
- Suchomel, T.J.; Nimphius, S.; Stone, M.H. The Importance of Muscular Strength in Athletic Performance. Sports Med. 2016, 46, 1419–1449. [Google Scholar] [CrossRef] [Scilit] [PubMed]
- Soriano, M.A.; Paredes, V.; Comfort, P.; Jiménez-Ormeño, E.; Areces-Corcuera, F.; Giráldez-Costas, V.; Gallo-Salazar, C.; Alonso-Aubín, D.A.; Menchén-Rubio, M.; McMahon, J.J. “You Are Not Wrong About Getting Strong:” An Insight Into the Impact of Age Group and Level of Competition on Strength in Spanish Football Players. Int. J. Sports Physiol. Perform. 2024, 19, 629–636. [Google Scholar] [CrossRef] [Scilit] [PubMed]
- Badby, A.J.; Ripley, N.J.; McMahon, J.J.; Mundy, P.D.; Comfort, P. Scoping Review of Methods of Monitoring Acute Changes in Lower Body Neuromuscular Function via Force Plates. PLoS ONE 2025, 20, e0322820. [Google Scholar] [CrossRef] [Scilit] [PubMed]
- Desmyttere, G.; Gaudet, S.; Begon, M. Test-Retest Reliability of a Hip Strength Assessment System in Varsity Soccer Players. Phys. Ther. Sport 2019, 37, 138–143. [Google Scholar] [CrossRef] [Scilit] [PubMed]
- McGoldrick, C.D.; Iacono, A.D.; Morgan, O.J.; Nayler, J.; Buchanan, J.; McCart, C.; Unnithan, V.B. Reliability, Familiarization Effect, and Comparisons Between a Predetermined and a Self-Determined Isometric-Squat Testing Protocol. Int. J. Sports Physiol. Perform. 2023, 18, 718–725. [Google Scholar] [CrossRef] [Scilit] [PubMed]
- Ryan, S.; Kempton, T.; Pacecca, E.; Coutts, A.J. Measurement Properties of an Adductor Strength-Assessment System in Professional Australian Footballers. Int. J. Sports Physiol. Perform. 2019, 14, 256–259. [Google Scholar] [CrossRef] [Scilit] [PubMed]
- Ferguson, J.; Gibson, N.V.; Weston, M.; McCunn, R. Reliability of Measures of Lower-Body Strength and Speed in Academy Male Adolescent Soccer Players. J. Strength Cond. Res. 2024, 38, e96–e103. [Google Scholar] [CrossRef] [Scilit] [PubMed]
- Loturco, I.; Jeffreys, I.; Kobal, R.; Cal Abad, C.C.; Ramirez-Campillo, R.; Zanetti, V.; Pereira, L.A.; Nakamura, F.Y. Acceleration and Speed Performance of Brazilian Elite Soccer Players of Different Age-Categories. J. Hum. Kinet. 2018, 64, 205–218. [Google Scholar] [CrossRef] [Scilit] [PubMed]
- Imal, O.; Verbruggen, F.F.; Hank, M.; Kalata, M.; Zahalka, F.; Maly, T. The Determination of Functional Movement Proficiency and Lower Body Strength Based On Age-Related Deficiency in Adolescent Soccer Players. J. Mot. Learn. Dev. 2025, 13, 672–687. [Google Scholar] [CrossRef] [Scilit]
- Królikowska, P.; Gołaś, A.; Stastny, P.; Kokstejn, J.; Grzyb, W.; Krzysztofik, M. Abductor and Adductor Strength Relation to Sprint Performance in Soccer Players. Balt. J. Health Phys. Act. 2023, 15, 6. [Google Scholar] [CrossRef] [Scilit]
- Springham, M.; Singh, N.; Stewart, P.; Matthews, J.; Jones, I.; Norton-Sherwood, C.; May, D.; Trehan Sharma, S.; Salter, J.; Strudwick, A.J.; et al. Acute Neuromuscular and Perceptual Responses to U-18 English Premier League Academy Football Match Play. Eur. J. Sport Sci. 2024, 24, 1405–1413. [Google Scholar] [CrossRef] [Scilit] [PubMed]
- Soslu, R.; Eraslan, M.; Taş, M.; Devrilmez, M.; Kırkaya, İ.; Özkan, A.; Yarar, H.; Çuvalcıoğlu, İ.C.; Doğan, A.A.; Uysal, A.; et al. Fatigue-Induced Alterations in Arm Swing Contribution to Countermovement Jump Mechanics. BMC Sports Sci. Med. Rehabil. 2026, 18, 208. [Google Scholar] [CrossRef] [Scilit] [PubMed]
- Woods, C.T.E.; Raynor, A.J.; Bruce, L.; McDonald, Z.; Collier, N. Predicting Playing Status in Junior Australian Football Using Physical and Anthropometric Parameters. J. Sci. Med. Sport 2015, 18, 225–229. [Google Scholar] [CrossRef] [Scilit] [PubMed]
- Hwang, S.; Kim, J.; Park, I. Predictive Validity of Lower Extremity Muscle Strength, Strength Asymmetry, and Soccer-Specific Fitness for Talent Identification in Elite Male Youth Soccer Players: A Retrospective Cohort Study. Meas. Phys. Educ. Exerc. Sci. 2025, 29, 11–23. [Google Scholar] [CrossRef] [Scilit]
- Akoglu, H. User’s Guide to Sample Size Estimation in Diagnostic Accuracy Studies. Turk. J. Emerg. Med. 2022, 22, 177–185. [Google Scholar] [CrossRef] [Scilit] [PubMed]
- Von Elm, E.; Altman, D.G.; Egger, M.; Pocock, S.J.; Gøtzsche, P.C.; Vandenbroucke, J.P. The Strengthening the Reporting of Observational Studies in Epidemiology (STROBE) Statement: Guidelines for Reporting Observational Studies. Lancet 2007, 370, 1453–1457. [Google Scholar] [CrossRef] [Scilit] [PubMed]
- O’Connor, C.; McIntyre, M.; Delahunt, E.; Thorborg, K. Reliability and Validity of Common Hip Adduction Strength Measures: The ForceFrame Strength Testing System versus the Sphygmomanometer. Phys. Ther. Sport 2023, 59, 162–167. [Google Scholar] [CrossRef] [Scilit] [PubMed]
- Opar, D.A.; Williams, M.D.; Timmins, R.G.; Hickey, J.; Duhig, S.J.; Shield, A.J. Eccentric Hamstring Strength and Hamstring Injury Risk in Australian Footballers. Med. Sci. Sports Exerc. 2015, 47, 857–865. [Google Scholar] [CrossRef] [Scilit] [PubMed]
- van Dyk, N.; Witvrouw, E.; Bahr, R. Interseason Variability in Isokinetic Strength and Poor Correlation with Nordic Hamstring Eccentric Strength in Football Players. Scand. J. Med. Sci. Sports 2018, 28, 1878–1887. [Google Scholar] [CrossRef] [Scilit] [PubMed]
- Suarez-Balsera, C.; Figueiredo, P.; Bishop, C.; Rago, V. Identifying Relevant Countermovement-Jump Parameters for Academy Soccer Players. Int. J. Sports Physiol. Perform. 2026, 21, 106–117. [Google Scholar] [CrossRef] [Scilit] [PubMed]
- Pleša, J.; Kozinc, Ž.; Bishop, C.; Šarabon, N. Association Between Dynamic Strength Index Derived from Isometric Squat and Squat Jump or Countermovement Jump and Force-Velocity Profile. Meas. Phys. Educ. Exerc. Sci. 2024, 28, 57. [Google Scholar] [CrossRef] [Scilit]
- Stawski, R.S. Multilevel Analysis: An Introduction to Basic and Advanced Multilevel Modeling (2nd Edition). Struct. Equ. Model. Multidiscip. J. 2013, 20, 541–550. [Google Scholar] [CrossRef] [Scilit]
- Naderi, A.; Kohe, V.R.; Calmeiro, L. Athletic Ability Discrepancy, Risk-Taking, and Recovery Quality as Predictors of Match-Related Injuries in Adolescent Soccer Players. Sci. Rep. 2026, 16, 19149. [Google Scholar] [CrossRef] [Scilit] [PubMed]
- Fluss, R.; Faraggi, D.; Reiser, B. Estimation of the Youden Index and Its Associated Cutoff Point. Biom. J. Biom. Z. 2005, 47, 458–472. [Google Scholar] [CrossRef] [Scilit] [PubMed]
- Hanawa, H.; Inaba, H.; Hoshino, F.; Edama, M.; Sekine, C.; Kikumoto, T.; Ishigaki, T.; Matsuura, Y.; Omori, G. Potential Usefulness of Urinary Hepcidin Measurement for Iron Deficiency Anemia in Female Athletes. Eur. J. Sport Sci. 2026, 26, e70198. [Google Scholar] [CrossRef] [Scilit] [PubMed]
- Hassanzad, M.; Hajian-Tilaki, K. Methods of Determining Optimal Cut-Point of Diagnostic Biomarkers with Application of Clinical Data in ROC Analysis: An Update Review. BMC Med. Res. Methodol. 2024, 24, 84. [Google Scholar] [CrossRef] [Scilit] [PubMed]
- Rago, V.; Oliva-Lozano, J.M.; Cost, R.; Arnaiz-Lastras, J.; Nakamura, F.Y.; Figueiredo, P. Hip Adduction and Abduction Isometric Force Production in Young Football Players: Reliability of Different Testing Protocols. Sci. Rep. 2025, 16, 3459. [Google Scholar] [CrossRef] [Scilit] [PubMed]
- Callaway, A.; Dunne, C.; Williams, J. The Choice of Asymmetry Index Affects Clinical Interpretation of Hip Adduction and Abduction Strength in Elite Soccer Players: A Season-Long Investigation. Eur. J. Sport Sci. 2027. [Google Scholar]
- Tondelli, E.; Tomaghelli, L.; Tedesco, F.; Feroldi, A.; Herbella, J.; Baldjian, A.; Van Dyk, N. Exploring Eccentric Hamstring Strength: Peak Force, Torque, and Impulse Metrics in Elite Academy Soccer Players. Res. Q. Exerc. Sport 2026, 97, 68–76. [Google Scholar] [CrossRef] [Scilit] [PubMed]
- Cormie, P.; McGuigan, M.R.; Newton, R.U. Developing Maximal Neuromuscular Power: Part 1--Biological Basis of Maximal Power Production. Sports Med. 2011, 41, 17–38. [Google Scholar] [CrossRef] [Scilit] [PubMed]
- He, J.; Li, M.; Zhang, Q.; Zhang, Z. Associations between the Performance of Vertical Jump and Accelerative Sprint in Elite Sprinters. Front. Bioeng. Biotechnol. 2025, 13, 1539197. [Google Scholar] [CrossRef] [Scilit] [PubMed]
- Nagahara, R.; Naito, H.; Miyashiro, K.; Morin, J.B.; Zushi, K. Traditional and Ankle-Specific Vertical Jumps as Strength-Power Indicators for Maximal Sprint Acceleration. J. Sports Med. Phys. Fit. 2014, 54, 691–699. [Google Scholar]
- McMahon, J.J.; Jones, P.A.; Suchomel, T.J.; Lake, J.; Comfort, P. Influence of the Reactive Strength Index Modified on Force– and Power–Time Curves. Int. J. Sports Physiol. Perform. 2018, 13, 220–227. [Google Scholar] [CrossRef] [Scilit] [PubMed]
- Soslu, R.; Özer, Ö.; Uysal, A.; Pamuk, Ö. Deaf and Non-Deaf Basketball and Volleyball Players’ Multi-Faceted Difference on Repeated Counter Movement Jump Performances: Height, Force and Acceleration. Front. Sports Act. Living 2022, 4, 941629. [Google Scholar] [CrossRef] [Scilit] [PubMed]
- Franceschi, A.; Robinson, M.A.; Owens, D.; Brownlee, T.; Ferrari Bravo, D.; Enright, K. Reliability and Sensitivity to Change of Post-Match Physical Performance Measures in Elite Youth Soccer Players. Front. Sports Act. Living 2023, 5, 1173621. [Google Scholar] [CrossRef] [Scilit] [PubMed]
- Vieira, A.; Tufano, J.J. Reactive Strength Index-Modified: Reliability, between Group Comparison, and Relationship between Its Associated Variables. Biol. Sport 2020, 38, 451–457. [Google Scholar] [CrossRef] [Scilit] [PubMed]
- Liu, Y.; Bishop, C.; James, L.; Lu, C.; Meng, F.; Yuan, X. Force vs. Impulse: Assessing the Applicability of Dynamic Strength Indices in Individualized Training Recommendations. Biol. Sport 2026, 43, 743–752. [Google Scholar] [CrossRef] [Scilit] [PubMed]
- Bennett, K.J.; Novak, A.R.; Pluss, M.A.; Coutts, A.J.; Fransen, J. A Multifactorial Comparison of Australian Youth Soccer Players’ Performance Characteristics. Int. J. Sports Sci. Coach. 2020, 15, 17–25. [Google Scholar] [CrossRef] [Scilit]
- Woods, C.T.; Raynor, A.J.; Bruce, L.; McDonald, Z.; Robertson, S. The Application of a Multi-Dimensional Assessment Approach to Talent Identification in Australian Football. J. Sports Sci. 2016, 34, 1340–1345. [Google Scholar] [CrossRef] [Scilit] [PubMed]
- Tang, Q.; Wei, X.; Tan, B. The Role of Machine Learning in Talent Identification for Team Sports: A Systematic Review. J. Sports Sci. Med. 2026, 25, 58–83. [Google Scholar] [CrossRef] [Scilit] [PubMed]

Disclaimer/Publisher’s Note: The statements, opinions and data contained in all publications are solely those of the individual author(s) and contributor(s) and not of MDPI and/or the editor(s). MDPI and/or the editor(s) disclaim responsibility for any injury to people or property resulting from any ideas, methods, instructions or products referred to in the content. |
© 2026 by the authors. Licensee MDPI, Basel, Switzerland. This article is an open access article distributed under the terms and conditions of the Creative Commons Attribution (CC BY) license.