


Abstract
Evidence on indicators that accompany winning comes mainly from elite leagues. This study examined the association between technical–tactical indicators and match outcome in the Bulgarian First Professional Football League. Wyscout team statistics were analysed for 829 matches (2022/23–2024/25). Nine process indicators describing possession, progression, penalty-area entry, transition and pressing were expressed as home-minus-away differences per 90 min. An ordinal mixed model of the outcome (loss, draw, win) included season effects, pre-match team strength and club and club-season effects shared across home and away appearances; out-of-sample classification was assessed chronologically (training 2022/23–2023/24, testing 2024/25). Penalty-area entries via runs (OR = 1.62, 1.33–1.97), counterattacks (1.65, 1.39–1.97), interceptions (1.36, 1.10–1.70) and deep completions (1.35, 1.07–1.70) were associated with a more favourable outcome, whereas penalty-area entries via crosses (0.49, 0.39–0.63) and less intense pressing (higher PPDA; 0.60, 0.44–0.83) were associated with a less favourable outcome. Possession was negatively associated with outcome in the primary model (0.64, 0.44–0.92), but this association was not robust across specifications. The other associations were robust to alternative strength measures, random-effect structures and dyadic-robust inference. Outcomes were differentiated by how teams entered the penalty area rather than by possession; these retrospective associations cannot separate tactical choice from game-state effects.
1. Introduction
Performance indicators are selections or combinations of action variables that describe some or all aspects of a performance [1], and identifying those that distinguish successful from unsuccessful teams is a central aim of football performance analysis [1,2,3]. Event- and tracking-data providers now allow technical and tactical behaviour to be quantified in considerable detail [4], yet the indicators that accompany winning remain context-dependent [5,6]. A recurring finding is the possession paradox: a larger share of ball possession does not reliably translate into better results, even though possession is central to many tactical philosophies [7].
Most of this evidence comes from the wealthiest and most-studied competitions—the English Premier League, La Liga, the Bundesliga and major international tournaments [6,8]. Studies from these and other European leagues point to penetrative and transitional actions rather than possession per se, as in Norwegian professional football [9,10]. In La Liga, for example, counterattacks and fast attacks were several times more likely than combinative attacks to produce a scoring opportunity [11]. Machine-learning methods are increasingly used to identify outcome-relevant indicators at both team and player level [12,13,14], and work on expected goals (xG) shows that xG accumulated during a match describes its outcome well precisely because it is generated concurrently with the result [15].
Smaller national leagues remain under-represented, although they differ from elite competitions in technical homogeneity, in the spread of quality between clubs and in stylistic norms [16,17]. Clubs and analysts in these leagues must nevertheless base decisions on evidence produced in structurally different environments. Evidence from south-eastern Europe suggests that the elite-league pattern may partly transfer: in the Greek Super League, shots on target, counterattacks and set pieces were among the strongest correlates of winning [18], and across eleven European first divisions successful teams counterattacked during offensive transitions, attacked centrally and crossed less [19].
Two methodological problems complicate this literature. First, many studies analyse team-match records in which both teams of a fixture contribute an observation. When indicators are expressed relative to the opponent, the two records are mirror images, which inflates the effective sample size. Second, match statistics accumulate during the match and are shaped by its development: teams that are losing tend to have more possession, for example [20]. Indicators recorded over a whole match therefore describe the match rather than predict it, and analyses should control team strength with information that was available before kick-off.
The present study addressed these problems in a match-level analysis of three seasons of the Bulgarian First Professional Football League. Each fixture contributed one observation; team strength was measured before each match; repeated appearances of the same clubs, at home and away, were modelled with club effects shared across both roles; process indicators were separated from outcome-proximal indicators (xG, shots on target); and out-of-sample classification was assessed chronologically. The study also distinguished between two modes of entering the penalty area, carrying the ball in (runs) and delivering it by crosses, to test whether different routes to the same area carry different outcome value. We hypothesised that (H1) penetrative progression and transition indicators would be positively associated with a favourable outcome; (H2) ball possession would not be positively associated with outcome once these indicators and team strength were accounted for; and (H3) penalty-area entries via runs and via crosses would show associations of opposite direction. The association of pressing intensity (PPDA) with outcome was examined without a directional hypothesis.
2. Materials and Methods
2.1. Design and Data Source
This was a retrospective, observational, match-level study. Team match statistics were obtained from Wyscout (Hudl, Lincoln, NE, USA; https://www.hudl.com/products/wyscout, accessed on 10 November 2026), a provider widely used in performance analysis research [4], for the 2022/23, 2023/24 and 2024/25 seasons of the Bulgarian First Professional Football League. In each season, 16 clubs played a 30-round double round-robin, after which the table was split into three groups whose size differed between seasons (six, four and six clubs in 2022/23 and 2023/24; four, four and eight clubs in 2024/25), followed by play-off matches for European qualification. All matches labelled as First League fixtures in Wyscout were included, which comprises these play-off matches. Data were exported as team-level files (57 files covering 39 club-seasons; some club-seasons were exported in several parts), each containing the statistics of the club and of its opponent for every match.
Exports were available for 13, 12 and 14 clubs in the three seasons, so the data contained the fixtures in which at least one of these clubs took part: 272, 268 and 289 fixtures, respectively. Matches between two clubs without an export (mainly newly promoted or relegated clubs) were therefore not available, and three further league fixtures between clubs with an export were absent from both clubs’ exports. Comparison with the complete fixture list of each season (Section 2.4) showed that 11, 15 and 4 fixtures were missing, so that the sample covers 96%, 95% and 99% of the fixtures of the three seasons (829 of 859, including the European play-off matches). The different numbers of fixtures per season reflect these gaps and the different split formats (Supplementary Tables S1 and S10). Every available fixture contained complete records for both teams, so no fixtures were excluded during data processing. The analytical sample comprised 829 matches involving 18 clubs (48 club-seasons).
Because column positions differed between export templates (6 of 57 files), every variable was located in each file by its header text, and sub-columns (e.g., entries via runs and via crosses) by their position relative to that header. A total of 1166 team-match records appeared in more than one file (in the exports of both clubs, or in overlapping files of the same club); the duplicate records were identical for all variables used, which provided an internal check of extraction accuracy. The originally submitted analysis had used an earlier extraction that addressed these sub-columns by their generic column labels; in one export file (Beroe, April–May 2025), whose layout differed, this read penalty conversion (%) in place of entries via runs for both teams in 7 fixtures. The present extraction corrects this; the effect of the correction, separated from the effect of the revised models, is shown in Supplementary Table S9.
2.2. Performance Indicators
Following Hughes and Bartlett [1], we use “performance indicator” for an action variable, or combination of action variables, that describes an aspect of team performance. Indicators were classified as process indicators, which describe how a team played (possession, progression, penetration, transition and defensive pressure), and outcome-proximal indicators (xG and shots on target), which describe shot generation and are closely tied to goals and therefore to the result itself. Process indicators were the focus of the analysis; outcome-proximal indicators were analysed separately to quantify how much they add to the process indicators.
Indicators were selected a priori to represent the dimensions of play documented in the performance-indicator literature [3,19]—possession and circulation, progression, penetration of the penalty area, transition, and defensive pressure and recovery—subject to their availability for every match in the export. Shot volume and touches in the penalty area were not entered because they are largely downstream of the included penetration and outcome-proximal indicators; set pieces were not entered because the study concerned open play; and ratio indicators that incorporate goals (e.g., conversion rates) were not used because they include the outcome by construction. Eleven candidate process indicators, two outcome-proximal indicators and the strength control were thus considered. Their operational definitions, following the Wyscout data glossary [21], are given in Table 1.
Table 1.
Operational definitions of the indicators. All indicators entered the models as home-minus-away differences.
2.3. Normalisation
Wyscout records match duration as the full duration of the match including added time (median 97 min, interquartile range 96–99, range 88–133 min); this is not effective ball-in-play time. Count indicators were converted to rates per 90 min as x90 = x × 90/D, where x is the count, and D is the recorded duration of the match. Both teams share the same duration, so the home-minus-away difference of a normalised indicator equals (90/D) multiplied by the difference in raw counts, i.e., normalisation rescales the difference to a common match length. Ratio and percentage indicators (possession, PPDA, match tempo) were not normalised. A sensitivity analysis used non-normalised differences.
2.4. Outcome, Predictors and Team Strength
The outcome was the result from the home team’s perspective, coded as an ordered three-level variable (loss < draw < win), which retains drawn matches. Each predictor was the home value minus the away value, so each fixture contributed once, and match location was fixed by design.
Team strength was controlled with information available before each match. The primary measure was the difference in pre-match points per game (PPG) within the season. To stabilise early-season values, PPG was shrunk towards the league mean: PPG_pre = (P + m·μ)/(N + m), where P and N are the points and matches accumulated before the fixture, μ = 1.38 is the league-average PPG of the three seasons, and m = 3 matches is the weight of the prior. Points were accumulated over the complete fixture list of each season, because pre-match strength requires only results, not match statistics: the 829 fixtures in the exports were supplemented with the results of the 30 fixtures that were not (27 between clubs without an export and 3 absent from the exports), taken from the Rec.Sport.Soccer Statistics Foundation [22,23,24]. The completed list reproduced the official final tables (matches, wins, draws, losses, goals and points) of all 48 club-seasons exactly (Supplementary Table S10). Two club names that were spelt differently in some Wyscout match labels were harmonised. Two alternatives were used in sensitivity analyses: a pre-match Elo rating [25] (initial rating 1500, K = 20, home advantage 60 points, one-third regression towards 1500 between seasons) and, for comparison with the originally submitted analysis, the difference in final league points, which includes information from after the match.
2.5. Statistical Analysis
Multicollinearity among the 11 candidate process indicators and the strength control was assessed with the variance inflation factor (VIF). At each step, the indicator with the highest VIF above 5 [26] was removed, and VIFs were recomputed; possession, PPDA and pre-match strength were retained a priori. All predictors were standardised (z-scores), so that odds ratios (OR) refer to a one-standard-deviation increase in the home-minus-away difference.
The primary model was an ordinal logistic (cumulative logit, proportional-odds) mixed model for the ordered outcome. Fixed effects were the nine retained process indicators, pre-match strength and season (two indicator variables). Because each club appeared repeatedly, both at home and away, the linear predictor of a match between home club h and away club a in season s included club and club-season effects entering through the home–away contrast: η = Xβ + (c_h − c_a) + (u_hs − u_as), with c ~ N(0, σ_c2) for the 18 clubs and u ~ N(0, σ_u2) for the 48 club-seasons. A club’s home and away appearances therefore inform the same effect, which represents its strength (across seasons and within a season) not captured by the fixed effects, and the residual dependence between all matches that involve the same club is modelled in either role. Because this multiple-membership structure is not available in the cumulative link mixed-model software used previously, it was fitted as a penalised ordinal regression in which an identity penalty on the club and club-season coefficients corresponds to Gaussian random effects, with the variance components estimated by Laplace-approximate restricted maximum likelihood (R package mgcv, ordered categorical family) [27,28].
Four alternative structures were compared with the same fixed effects, using the restricted likelihood and Akaike’s information criterion: club-season effects only; the primary structure plus a club-season home-advantage effect (entering for the home club only); separate, crossed random intercepts for the home and the away club-season, which was the primary model of the previous version of this manuscript (R package ordinal [29]); and fixed club-season effects entering through the home–away contrast. Two further checks addressed the dependence between matches in the fixed-effects model: two-way cluster-robust standard errors clustered by home and away club-season [30], and dyadic-robust standard errors [31], which allow the scores of any two matches that share a club, in either role, to be correlated (computed for club-seasons and for clubs; with 48 and 18 clusters these are large-sample approximations). The proportional-odds assumption was tested on the fixed-effects model with the Brant test [32], globally and for each predictor.
This model of process indicators is referred to as Model 1. Model 2 additionally included xG and shots on target. The increase in fit was tested with a likelihood-ratio test in the fixed-effects models, for which McFadden’s pseudo-R2 is also reported.
Sensitivity analyses repeated Model 1 with (i) pre-match Elo rating instead of PPG; (ii) final league points without season effects, as in the originally submitted analysis; (iii) no strength variable; (iv) non-normalised differences; (v) matches with a final goal margin of fewer than three goals (excluding lopsided matches); and (vi) drawn matches and one-goal margins only. Analyses (v) and (vi) address only the most extreme score effects in lopsided matches; they do not remove game-state effects, because a team can spend much of a match that ends with a one-goal margin defending a lead [20]. Minute-by-minute match status was not available.
2.6. Out-of-Sample Classification and Variable Importance
Out-of-sample performance was assessed chronologically, so that no information from the test season was used for model construction: within each split, the league-average PPG used as the prior of the strength measure was estimated from the training seasons only and pre-match PPG was recomputed with it for the training and test matches; collinearity screening was repeated on the training matches only; and standardisation and tuning used the training data only. In the primary split, models were trained on 2022/23 and 2023/24 (n = 540) and tested on 2024/25 (n = 289); a second split trained on 2022/23 (n = 272) and tested on 2023/24 (n = 268). Three predictor sets were compared: pre-match strength only, process indicators only, and process indicators plus pre-match strength. Each set was fitted with an ordinal logistic regression and with a Random Forest classifier [33,34] (500 trees, balanced class weights). Random Forest hyperparameters (minimum leaf size 1, 5, 10 or 20; features per split √p or 0.5p) were selected within the training data only, by leave-one-season-out cross-validation for the primary split and by 5-fold cross-validation for the second split, using macro-averaged F1. A model that predicts the training-set outcome frequencies served as the baseline.
Performance was summarised by accuracy, macro-averaged F1, precision, recall and F1 for each outcome class, log loss, and the ranked probability score (RPS), a proper scoring rule for ordered outcomes in which lower values indicate better probabilistic predictions [35]. Because the process indicators are recorded during the match, this evaluation measures how well the match statistics classify the result of unseen matches; it is not a pre-match forecast.
Variable importance was assessed for the Random Forest with process indicators plus strength, on the primary test season. Permutation importance was the mean increase in log loss over 100 random permutations of each indicator, with a 95% interval from the permutation distribution. SHapley Additive exPlanations (SHAP) [36,37] were computed for the home-win class. Because permutation importance and mean absolute SHAP values describe magnitude, but not direction, direction was assessed separately as the Spearman correlation (ρ) between each indicator’s value and its SHAP value. Direction was interpreted only for indicators whose permutation-importance interval excluded zero; these intervals reflect variability between permutations, not sampling uncertainty, and serve as a descriptive threshold.
A structural equation model with a latent progression factor, reported in the originally submitted version, is presented with its complete standardised solution in Supplementary Table S8 [38]; because of its limited fit (Section 3.7), it was not used to support the conclusions.
2.7. Software and Reproducibility
Analyses were performed in Python 3.13 (pandas 3.0, NumPy 2.5, statsmodels 0.15, scikit-learn 1.9, SHAP 0.54 and semopy 2.3) and R 4.3.3 (ordinal 2023.12-4 and mgcv 1.9-1). Statistical significance was set at α = 0.05. The complete analysis code, which reproduces every table and figure from the raw Wyscout exports, is provided as Supplementary Code S1, together with the complete model outputs and the convergence diagnostics of the mixed models (Supplementary Table S11). Generative artificial intelligence was used during the preparation of this study as described in the Acknowledgements.
3. Results
3.1. Descriptive Characteristics
Of the 829 matches, the home team won 379 (45.7%), drew 186 (22.4%) and lost 264 (31.8%). Table 2 shows the home-minus-away differences by outcome. Expected goals and shots on target showed the clearest gradient from losses to wins. Possession differences were positive in all three outcome categories. Penalty-area entries via runs increased from losses (−1.17 per 90 min) to wins (+1.61), whereas entries via crosses were higher in draws and losses than in wins.
Table 2.
Home-minus-away differences in the indicators by match outcome, mean (SD). Count indicators per 90 min.
3.2. Multicollinearity
Total crosses (VIF = 12.1), which overlapped with entries via crosses, was removed first, followed by passes to the final third (VIF = 6.6). The nine retained process indicators and pre-match strength had VIFs between 1.13 (counterattacks) and 4.39 (possession) (Supplementary Table S2).
3.3. Primary Model
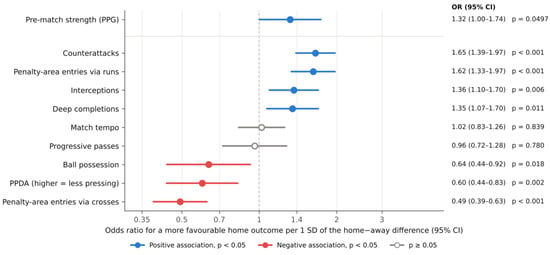
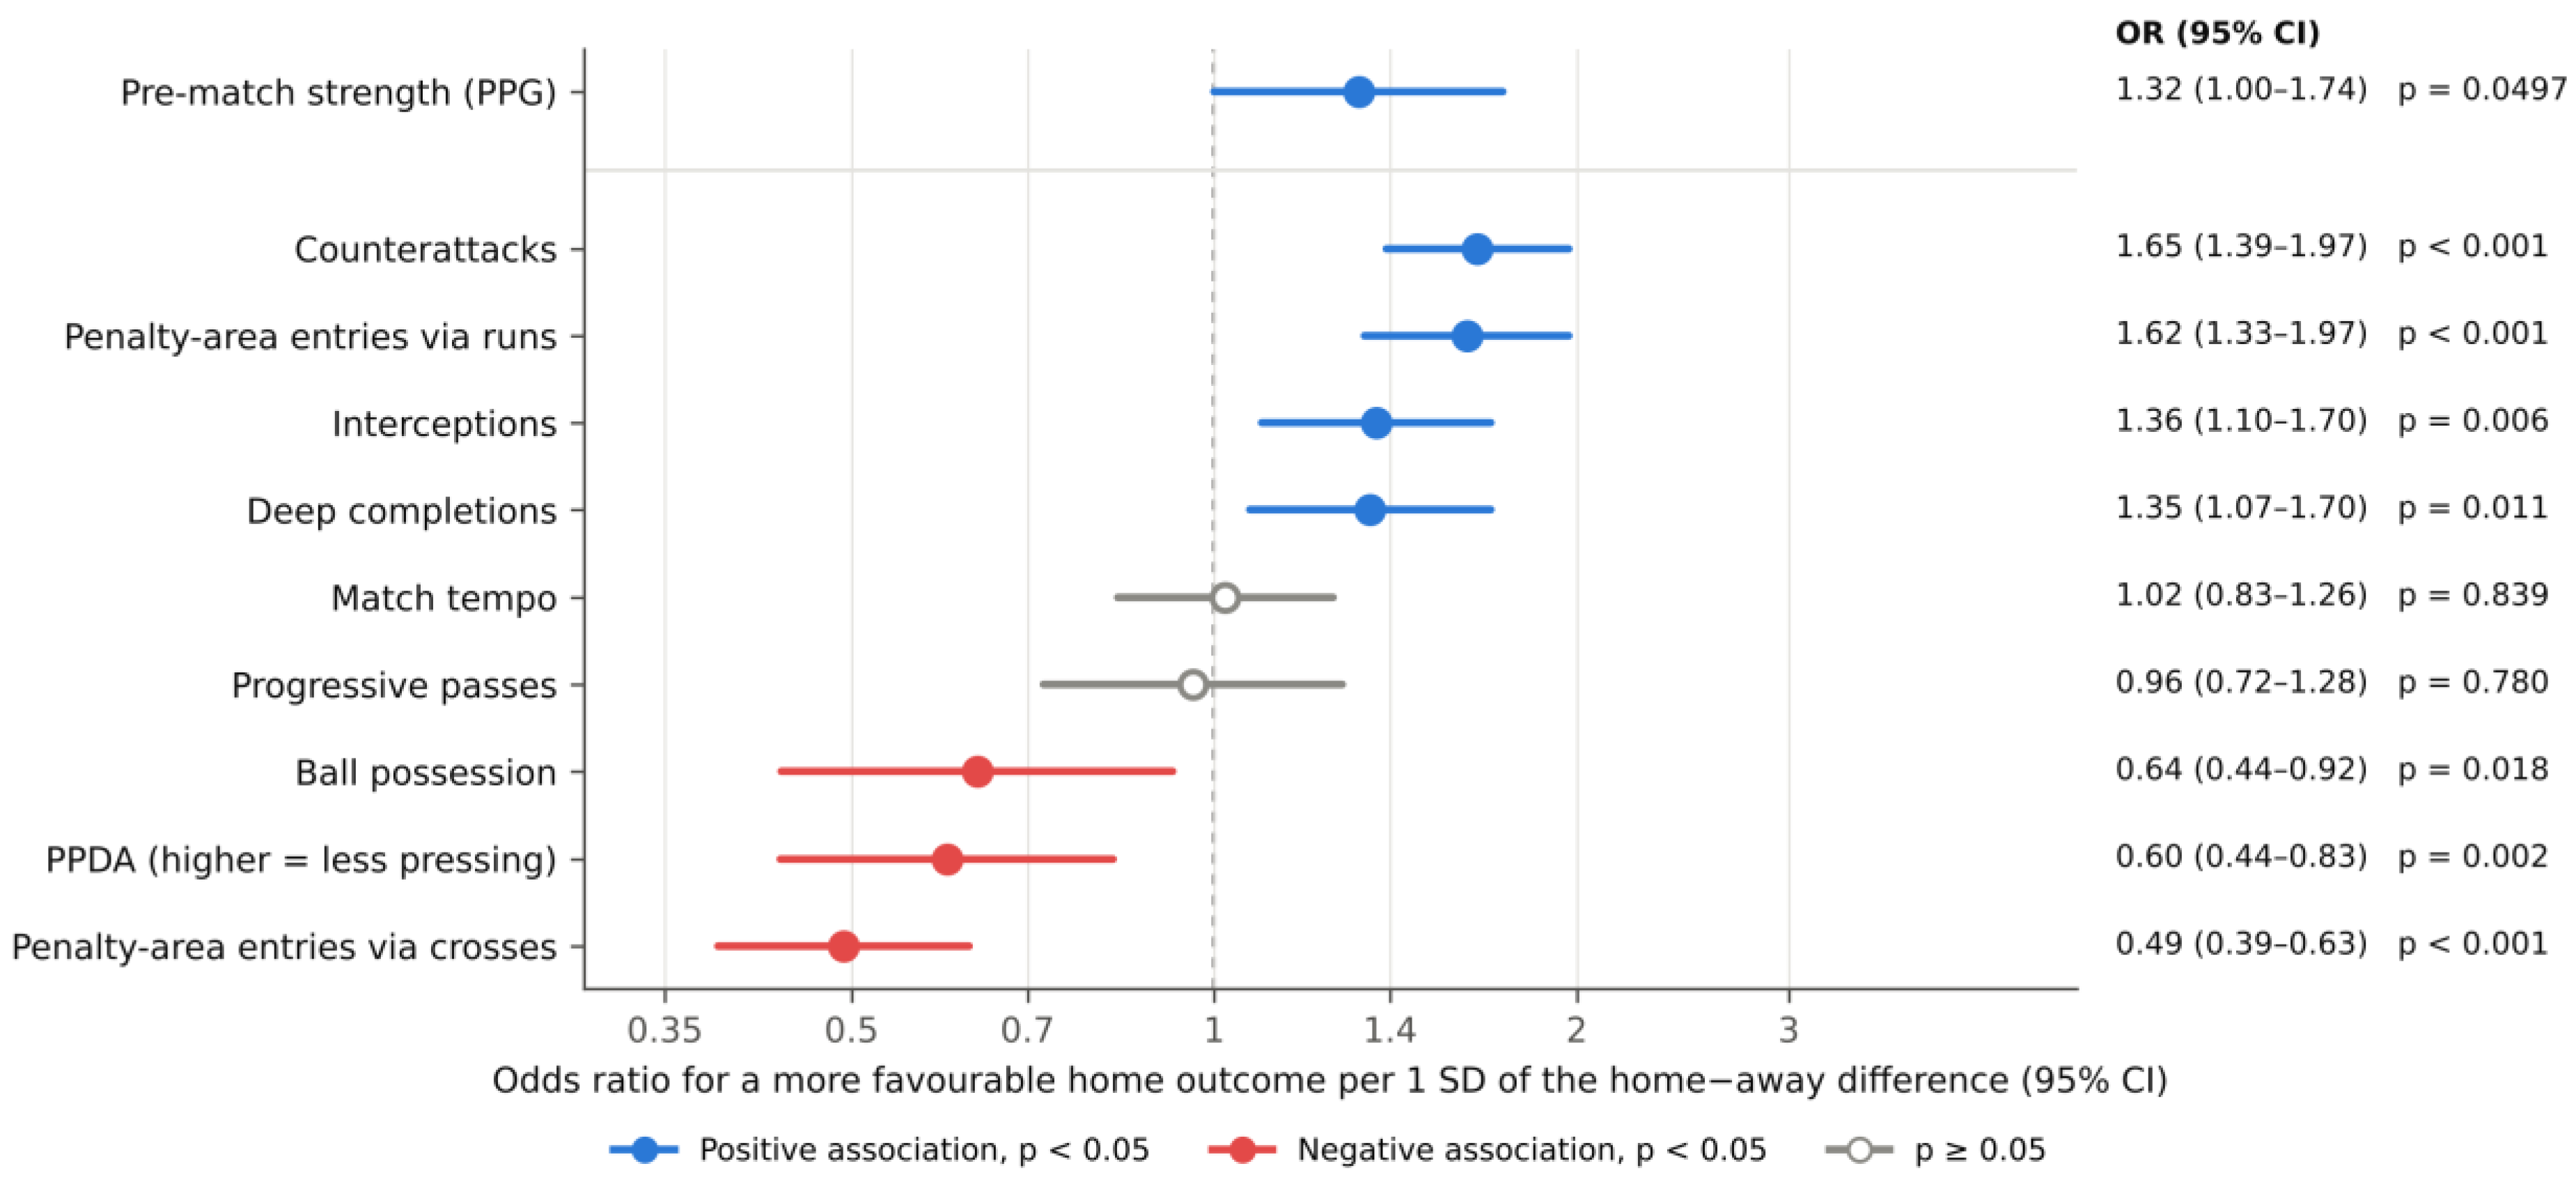
Model 1 is shown in Table 3 and Figure 1. Penalty-area entries via runs (OR = 1.62, 95% CI 1.33–1.97), counterattacks (OR = 1.65, 95% CI 1.39–1.97), interceptions (OR = 1.36, 95% CI 1.10–1.70) and deep completions (OR = 1.35, 95% CI 1.07–1.70) were associated with a more favourable outcome. Penalty-area entries via crosses (OR = 0.49, 95% CI 0.39–0.63) and PPDA (OR = 0.60, 95% CI 0.44–0.83) were associated with a less favourable outcome; that is, the team that pressed more intensely than its opponent tended to obtain the better result. Ball possession was negatively associated with outcome (OR = 0.64, 95% CI 0.44–0.92, p = 0.018), but this association was not robust across specifications (Section 3.4). Progressive passes and match tempo were not associated with outcome. Pre-match strength was associated with outcome (OR = 1.32, 95% CI 1.00–1.74); its odds ratio was smaller than in models without club effects (Supplementary Table S4) because the club effects also capture stable differences in team quality.
Table 3.
Ordinal models of match outcome (loss < draw < win; n = 829). Odds ratios (95% CI) per 1 SD increase in the home-minus-away difference.
Figure 1.
Adjusted odds ratios (95% CI) from Model 1 (ordinal logistic mixed model with club and club-season effects shared across home and away appearances, pre-match strength and season effects; n = 829). Odds ratios refer to a 1 SD increase in the home-minus-away difference and to a more favourable home outcome (loss < draw < win). Blue, positive association; red, negative association (filled markers, p < 0.05); grey, open markers, p ≥ 0.05. Higher PPDA indicates less intense pressing.
The standard deviation of the shared club effects was 0.83, and that of the club-season effects was 0.43 on the logit scale. This structure fitted better than club-season effects only (restricted log-likelihood criterion 699.1 vs. 707.7; AIC 1361.8 vs. 1396.2; lower is better) and than separate home and away club-season intercepts (709.9; AIC 1419.9), whereas an additional club-season home-advantage effect was small (SD 0.25) and did not improve the AIC (1370.4). The season effects were not significant (p = 0.34 and 0.17). Estimates for the process indicators were similar under all random-effect structures, with fixed club-season effects, and in the fixed-effects model with two-way cluster-robust or dyadic-robust standard errors (Table 3; Supplementary Tables S4 and S7). All mixed models converged (Supplementary Table S11). The proportional-odds assumption held globally (Brant χ2(12) = 6.77, p = 0.87) and for each process indicator (p = 0.26–0.71; Supplementary Table S3).
3.4. Robustness of Model 1
The direction and significance of the associations for penalty-area entries via runs and via crosses, counterattacks, interceptions and PPDA were unchanged in all six sensitivity analyses (Table 4) and under all random-effect structures (Supplementary Table S4). Replacing pre-match PPG with Elo rating or with final league points, or removing the strength control altogether, changed the magnitude of some estimates but not their direction. The negative association for possession was the least stable result. Its point estimate was below 1 in all 12 strength-adjusted specifications (OR 0.59–0.77), but its confidence interval excluded 1 in 8 of them and included 1 in the others, including the drawn and one-goal matches, the non-normalised differences and the separate home and away club-season intercepts; without any control for team strength (no strength variable and no club effects) the estimate was close to null (OR = 0.92). Deep completions lost significance when the analysis was restricted to drawn and one-goal matches (n = 533; OR = 1.07). In this subset, the estimates for entries via runs (OR = 1.41), via crosses (0.63) and counterattacks (1.46) moved towards the null but remained significant.
Table 4.
Sensitivity analyses of Model 1: odds ratios (95% CI) per 1 SD increase in the home-minus-away difference.
3.5. Outcome-Proximal Indicators
Adding xG and shots on target (Model 2) increased the pseudo-R2 of the fixed-effects model from 0.208 to 0.324 (χ2(2) = 203.6, p < 0.001); both indicators were strongly associated with outcome (Table 3). The estimates for interceptions (OR = 1.33) and PPDA (0.53) were similar in both models; entries via crosses (0.39) and counterattacks (1.43) remained significant with changed magnitude, and the association for entries via runs was attenuated (1.26).
The association for deep completions changed direction, from positive in Model 1 (OR = 1.35) to negative and of borderline significance in Model 2 (OR = 0.79, 95% CI 0.61–1.01, p = 0.062). This was not a computational artefact: deep completions were strongly correlated with xG (r = 0.63) and shots on target (r = 0.60), their VIF in Model 2 was 2.52, and the change occurred stepwise as the outcome-proximal indicators were added (fixed-effects OR 1.47 (1.18–1.82) in Model 1; 0.96 (0.76–1.21) with xG added; 0.90 (0.70–1.14) with shots on target added; 0.79 (0.62–1.01) with both). The Model 2 coefficient is a conditional association: it compares matches with different deep-completion differences but the same differences in xG and shots on target. Because the indicators are match aggregates, it does not identify particular completions that failed to produce shots, and it does not establish mediation. One interpretation is that much of the association of deep completions with outcome is shared with the shot quality and shots on target that accompany them; the overall association is given by Model 1.
3.6. Out-of-Sample Classification
In the 2024/25 test season (Table 5), the ordinal model with process indicators and pre-match strength gave the best probabilistic predictions (RPS = 0.187, against 0.215 for strength only and 0.235 for the baseline) and the highest accuracy (0.567). Process indicators alone outperformed pre-match strength alone (RPS 0.197 vs. 0.215). The same ranking was observed in the 2023/24 test season. The Random Forest did not improve on the ordinal model; its probabilistic predictions were worse (RPS = 0.197). Estimating the strength prior and repeating the collinearity screening within the training seasons selected the same nine indicators in both splits and changed the league-average PPG by less than 0.004 points, so these results are practically identical to those obtained with the full-data prior and indicator set.
Table 5.
Out-of-sample classification of match outcome. Primary split: training 2022/23–2023/24 (n = 540), test 2024/25 (n = 289). Second split: training 2022/23 (n = 272), test 2023/24 (n = 268).
Draws were the main weakness of all models. In the 2024/25 test season, the ordinal model with process indicators and strength assigned the highest probability to a draw in only 5 of 289 matches, one of them correctly (draw recall 0.02; 0.18 in the 2023/24 test season); the Random Forest, trained with balanced class weights, identified 36% of draws, with a draw precision of 0.28 and F1 of 0.31. Class-specific F1 for this model was 0.50 for home losses and 0.62 for home wins (precision and recall for all models in Supplementary Table S5). Its higher macro-F1 than the ordinal model (0.477 vs. 0.431) reflects this better recall of draws at the cost of accuracy and calibration.
3.7. Variable Importance, Direction and Structural Equation Model
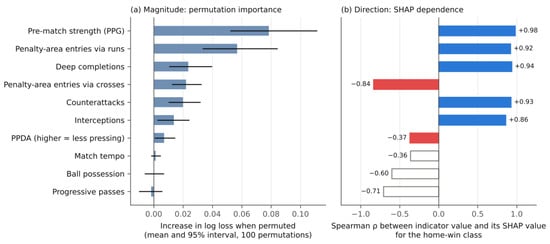
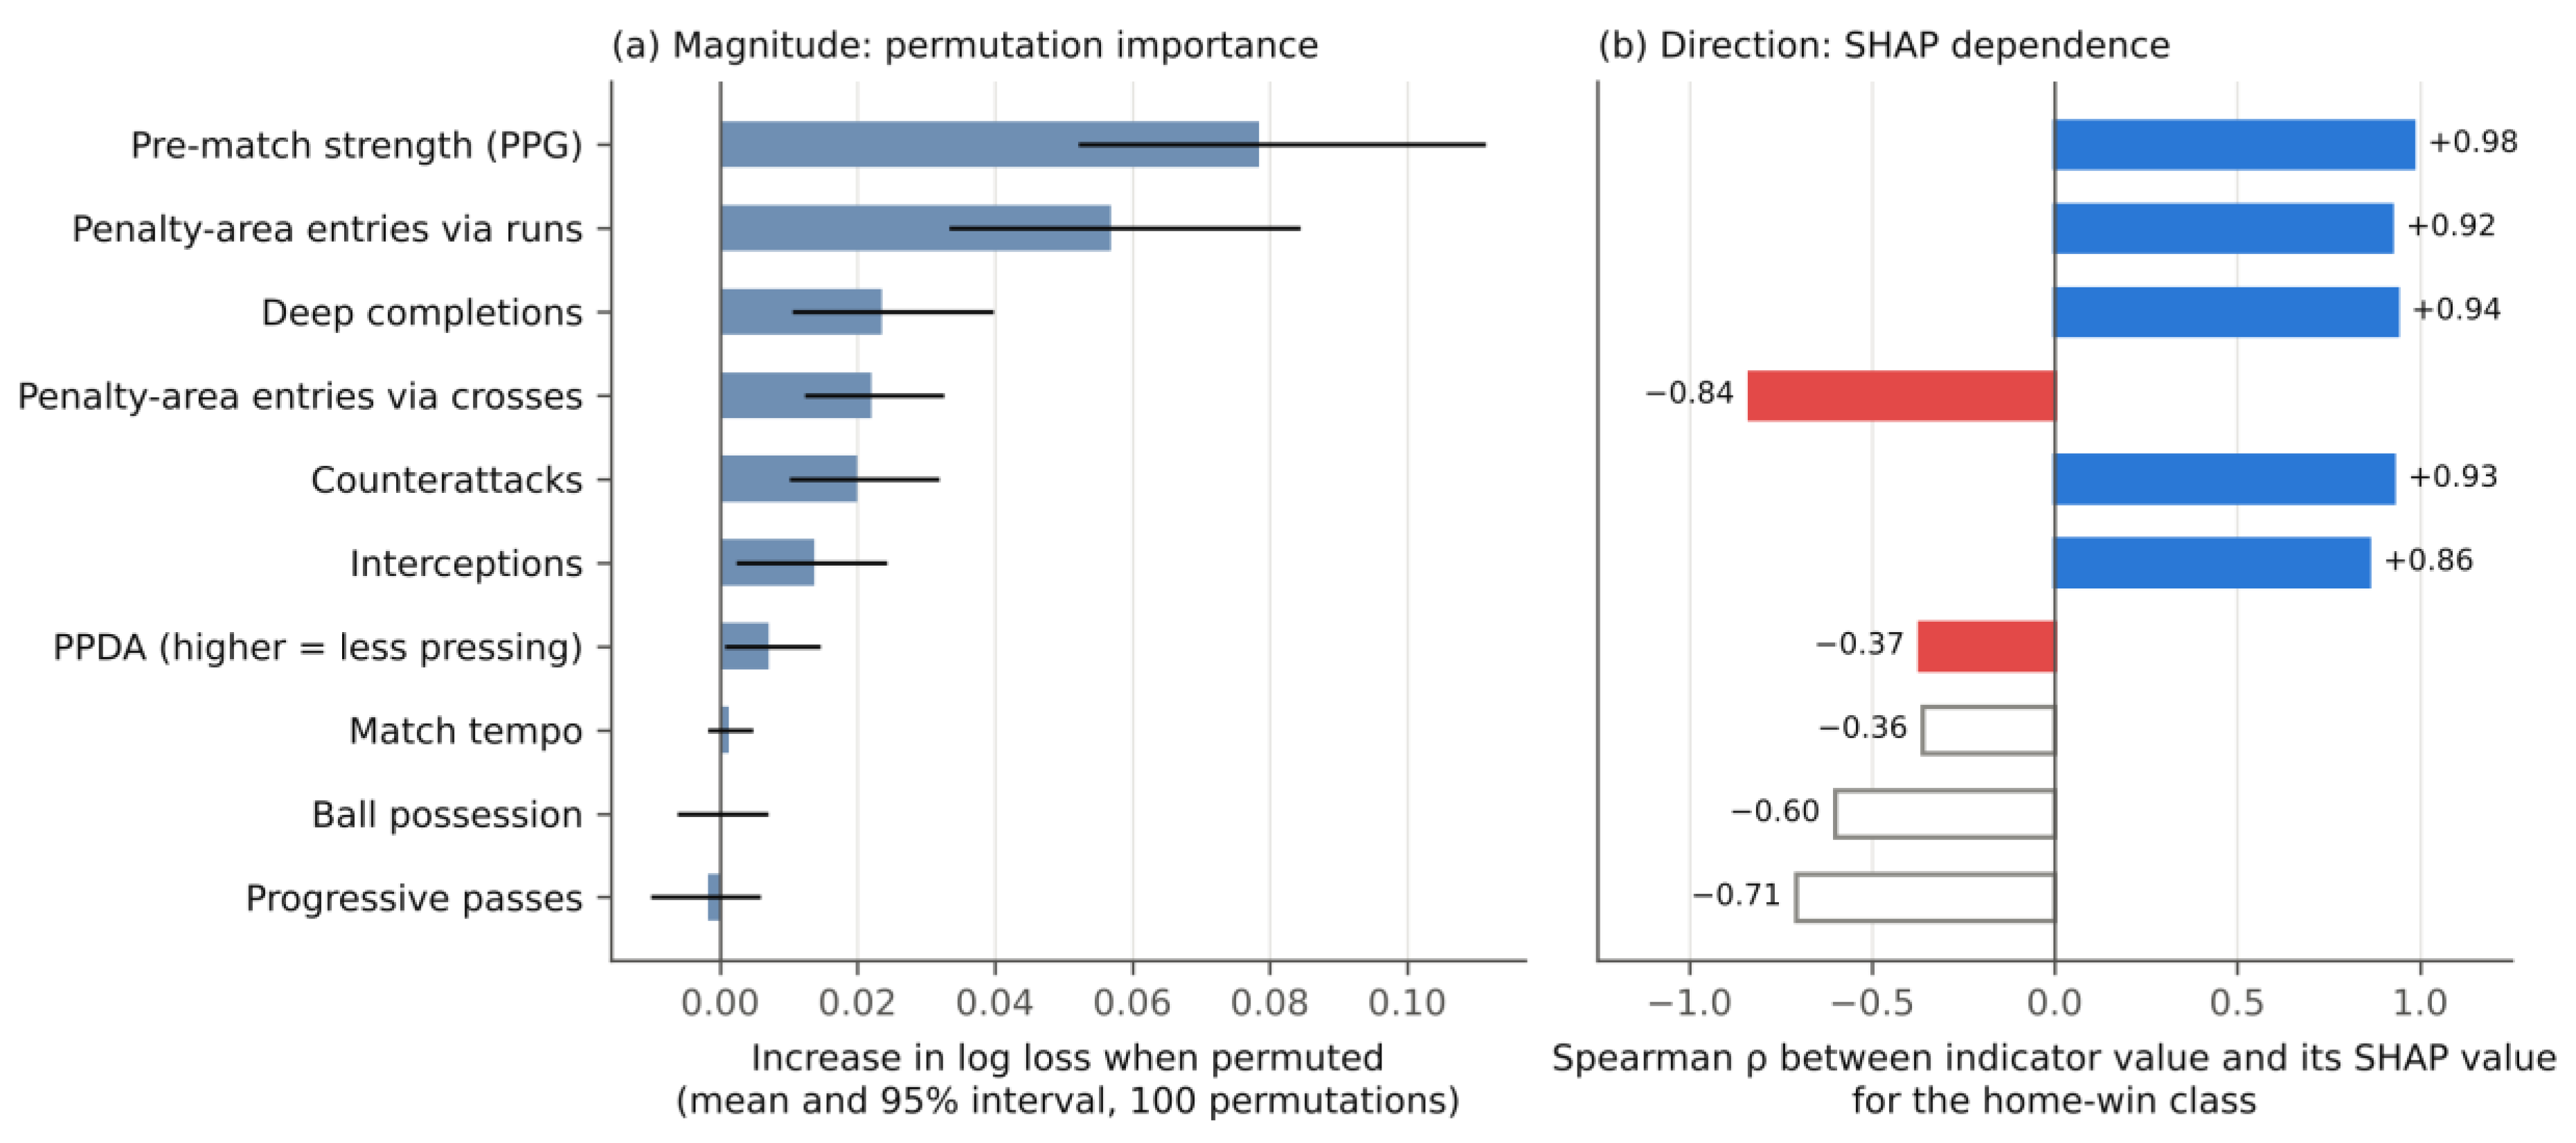
In the 2024/25 test season (Figure 2), pre-match strength (0.078 (95% interval 0.052 to 0.111)) and penalty-area entries via runs (0.057 (95% interval 0.034 to 0.084)) were the most important indicators, followed by deep completions, entries via crosses, counterattacks, interceptions and PPDA, all with intervals excluding zero. The permutation importance of possession (0.000; 95% interval −0.006 to 0.007), progressive passes and match tempo did not differ from zero.
Figure 2.
Variable importance and direction in the Random Forest (process indicators plus pre-match strength) in the 2024/25 test season (n = 289). (a) Increase in log loss when the indicator is permuted (mean and 95% interval over 100 permutations). (b) Spearman correlation between the indicator’s value and its SHAP value for the home-win class; positive values indicate that higher values move predictions towards a home win. Blue, positive direction; red, negative direction. Grey open bars mark indicators whose importance interval in (a) includes zero; their direction is not interpretable.
For the six process indicators with non-zero importance, the direction derived from SHAP agreed with the sign of the Model 1 coefficient: higher values of entries via runs (ρ = 0.92), deep completions (0.94), counterattacks (0.93) and interceptions (0.86) moved predictions towards a home win, and higher values of entries via crosses (−0.84) and PPDA (−0.37) moved them away from it. The two approaches differed in the ranking: deep completions ranked above counterattacks by importance but below them by odds ratio, and PPDA, the second-strongest negative association in the regression, ranked lowest among the indicators with non-zero importance. Permutation importance and SHAP show how much an indicator contributes to the Random Forest’s predictions, not whether its association is positive or negative, and these results are therefore an independent check of the regression only in the limited sense described here.
The structural equation model of the original submission, re-estimated on the corrected data, had a χ2(20) of 175.6 (p < 0.001), a CFI of 0.974, a TLI of 0.933 and an RMSEA of 0.097. With pre-match strength, the RMSEA was 0.095, and the standardised coefficient of the latent progression factor was 1.03. No estimate was inadmissible (no negative variances). The standardised coefficient above 1 is a partial coefficient and reflects suppression: the latent progression factor correlated strongly with possession (r = 0.85) and with PPDA (r = −0.76), and possession had a large negative path in the same equation. Together with an RMSEA above 0.08, which indicates inadequate fit, this made the paths difficult to interpret, so the model was not used to support the conclusions (complete standardised solution in Supplementary Table S8).
4. Discussion
The main finding of this study is that, in the Bulgarian First Professional Football League, match outcome was associated with how teams entered the opponent’s penalty area rather than with how much of the ball they had. Entering the penalty area by carrying the ball was associated with a more favourable outcome, and entering it by crosses with a less favourable one. Counterattacks, interceptions, deep completions and more intense pressing than the opponent were also associated with a more favourable outcome, whereas possession was negatively associated with outcome in the primary model, an association that was not robust across specifications. These associations held after controlling for pre-match team strength and for club effects shared across each club’s home and away appearances, and most were stable across the sensitivity analyses. The results support H1 and H3. H2 was supported in the sense that possession was not positively associated with outcome; the negative association for possession in the primary model was not consistent across specifications and is not interpreted as a robust finding.
4.1. Mode of Penalty-Area Entry
Entries via runs and via crosses deliver the ball to the same area but showed associations in opposite directions, although the two indicators were only weakly correlated (r = 0.29). A carried entry usually brings a player and the ball into the area under control, often centrally, whereas a cross is contested in the air against a defence that is set and frequently outnumbers the attackers. This is consistent with evidence from eleven European first divisions that successful teams attacked centrally and crossed less [19]. The attenuation of the association for runs once xG and shots on target were added suggests that much of their value works through the shots they produce. Two interpretations of the crosses finding should be distinguished. The first is tactical: crossing may be a less effective way to create chances than entering the area with the ball under control. The second concerns match status: teams that are behind may rely more on crosses, so part of the negative association may reflect the score rather than the effectiveness of crossing. The data cannot separate the two. The association persisted when lopsided matches were excluded and in drawn and one-goal matches, but this does not rule out a game-state explanation, because a close final score is compatible with long periods in which one team defended a lead.
4.2. Transition, Defensive Recovery and Pressing
The positive associations for counterattacks and interceptions agree with evidence from Spanish and Norwegian professional football that attacks launched against an unorganised defence are more efficient routes to scoring opportunities than elaborate attacks [9,10,11] and with findings from the Greek league [18]. Unlike the original submission, the corrected and extended analysis showed a consistent association for pressing: the team with the lower PPDA, i.e., the more intense press, tended to obtain the better result in every specification, and PPDA had non-zero importance in the Random Forest. This association runs against the direction expected from score effects, because a leading team that defends its advantage typically presses less and therefore has a higher PPDA. Score effects would thus, if anything, attenuate the observed association. Counterattacks, in contrast, are expected to increase for the leading team when the opponent pushes forward, so part of their association may reflect match status.
4.3. Ball Possession
Possession showed no positive association with outcome after adjustment for team strength and the other indicators, which extends the possession paradox [5,7] to this league. In the primary model, possession was negatively associated with outcome (OR = 0.64, 95% CI 0.44–0.92). This association was not robust: the point estimate was below 1 in every strength-adjusted specification, but the confidence interval included 1 in several plausible specifications (Section 3.4). Even where the negative estimate reached significance, it should not be interpreted as a harmful effect of possession: teams that are losing tend to have more of the ball [20], and possession that is not converted into penetration characterises teams that circulate the ball without progressing [39]. The negative estimate appeared only when team strength was controlled (by the strength variable or the club effects), which suggests that it reflects possession relative to what would be expected from the teams’ strength, which is in turn likely to depend on the score.
4.4. Outcome-Proximal Indicators and Model Comparison
The large improvement in fit when xG and shots on target were added confirms that these indicators describe the result more than they explain how it was produced, in agreement with Bundesliga data showing that post-match xG classified match outcomes better than expected possession value [15]. Model 2 is therefore not the appropriate model for the process indicators: conditioning on variables that lie between a process indicator and the outcome changes the meaning of its coefficient, as the reversal for deep completions illustrates; that reversal is a conditional association between match aggregates and does not show which completions failed to produce shots. Out of sample, the ordinal regression gave better probabilistic predictions and higher accuracy than the Random Forest, whereas the Random Forest had a higher macro-F1 because it recognised more draws; both struggled with draws. That process indicators classified results of an unseen season better than pre-match strength is expected, because they are recorded during the same match; this does not mean that they would forecast matches before kick-off.
4.5. Physical Demands
The indicators associated with a favourable outcome—carried entries, counterattacks and ball recoveries—are high-intensity actions. Straight sprints are the most frequent action of the scoring and assisting player before goals [40], high-intensity running is unevenly distributed across match phases and positions [41], and the ability to reproduce such efforts depends on repeated-sprint ability, in which fatigue is linked to limitations in energy supply from phosphocreatine, anaerobic glycolysis and oxidative metabolism [42]. Our data contain no physical measures, so these links remain hypotheses; integrating event data with tracking or GPS data would allow testing whether the teams that carry the ball into the area and counterattack more often also cover more high-intensity distance and recover faster between efforts.
4.6. Limitations
Several limitations apply. First, the design is observational, and the indicators were accumulated over the whole match, so the associations cannot be interpreted causally. Minute-by-minute match status was not available. The subgroup analyses by goal margin address only the most extreme score effects and cannot show that game-state effects were small, because a team can spend much of a one-goal match defending a lead; the associations for counterattacks, crosses and possession may partly reflect match status. Second, 30 of 859 fixtures had no match statistics—mainly matches between newly promoted or relegated clubs—so the sample under-represents matches among the weakest clubs; their results were nevertheless used for the strength measures, which are therefore based on complete fixture lists. Third, pre-match strength measured by points per game is less precise early in the season, although Elo ratings carried across seasons gave similar results. Fourth, the dyadic-robust and cluster-robust standard errors rely on 18 clubs and 48 club-seasons, a modest number of clusters; the mixed models, which model this dependence directly, gave similar conclusions. Fifth, the Wyscout definitions of entries via runs and via crosses are provider-specific, and the results may differ with other providers. Sixth, the study concerned open-play indicators of one national league over three seasons, and generalisation to other leagues should be made with caution.
4.7. Practical Implications
The results describe which match profiles accompanied winning in this league; they do not show that changing an indicator would change the result. With this caveat, they suggest hypotheses that coaches and analysts in comparable leagues can test: that attacking play built on carrying the ball into the penalty area and on fast transitions after recoveries is more productive than a strategy based on crossing volume, and that pressing intensity relative to the opponent deserves monitoring. The separation of process from outcome-proximal indicators is also useful for match analysis: xG and shots on target summarise a match after the fact, whereas the mode of penalty-area entry, counterattacks and recoveries describe how chances were created and can be tracked and trained.
5. Conclusions
In 829 matches of the Bulgarian First Professional Football League (2022/23–2024/25), penalty-area entries via runs (OR = 1.62), counterattacks (1.65), interceptions (1.36) and deep completions (1.35) were associated with a more favourable outcome, and penalty-area entries via crosses (0.49) and less intense pressing (0.60 per SD of PPDA difference) with a less favourable outcome, independently of pre-match team strength and of club effects. Ball possession was negatively associated with outcome in the primary model, but this association was not robust across specifications, and there was no indication of a positive one. The associations for the other indicators were robust to the measure of team strength, to the modelling of repeated club appearances and to excluding lopsided matches, and the indicators classified the outcomes of an unseen season better than team strength alone. Outcome in this league was therefore differentiated by the mode of penalty-area entry and by transitions, not by possession. Because the indicators were recorded during the match, the findings are retrospective associations; establishing whether they reflect tactical choices or game-state effects requires minute-level data.
Supplementary Materials
The following supporting information can be downloaded at: https://www.mdpi.com/article/10.3390/sports14110520/s1, Table S1: Fixtures per season at each stage of data processing; Table S2: Variance inflation factors (VIF) of the candidate predictors before and after iterative screening (threshold 5); Table S3: Brant test of the proportional-odds assumption; Table S4: Ordinal mixed models with alternative random-effect structures: odds ratios (95% CI) and model comparison; Table S5: Out-of-sample classification: class-specific precision, recall and F1, and Random Forest hyperparameters; Table S6: Variable importance in the Random Forest (process indicators plus pre-match strength), 2024/25 test season; Table S7: Model 1 under alternative specifications: odds ratios (95% CI); Table S8: Structural equation models: complete standardised solution and fit (corrected data); Table S9: Effect of correcting the data extraction and of revising the models: odds ratios for the same three models fitted to each version of the data; Table S10: Results of the 30 fixtures without match statistics, used only to compute pre-match strength; Table S11: Convergence diagnostics of the mixed and fixed-effects ordinal models; Code S1: Python and R code reproducing all analyses, with complete model outputs and a README file.
Author Contributions
Conceptualisation, D.I. and G.G.; methodology, D.I.; software, D.I.; validation, D.I. and G.G.; formal analysis, D.I.; investigation, D.I. and G.G.; resources, D.I.; data curation, D.I.; writing—original draft preparation, D.I.; writing—review and editing, D.I. and G.G.; visualisation, D.I.; supervision, D.I.; project administration, D.I. All authors have read and agreed to the published version of the manuscript.
Funding
This research received no external funding.
Institutional Review Board Statement
Not applicable. The study used team-level match statistics only and did not involve human participants or identifiable personal data.
Informed Consent Statement
Not applicable.
Data Availability Statement
Restrictions apply to the availability of the raw data, which were obtained from Wyscout (Hudl) under licence and are available from the authors with the permission of Wyscout. The analysis code, the complete model outputs and the results of the fixtures without match statistics are provided as Supplementary Code S1.
Acknowledgments
During the preparation of this study, the authors used Claude (Anthropic, San Francisco, CA, USA; Claude Opus 5.5) for the purposes of developing and checking the statistical analysis code, data processing and language editing. The authors have reviewed and edited the output and take full responsibility for the content of this publication.
Conflicts of Interest
The authors declare no conflicts of interest.
References
- Hughes, M.; Bartlett, R. The use of performance indicators in performance analysis. J. Sports Sci. 2002, 20, 739–754. [Google Scholar] [CrossRef] [Scilit]
- Mackenzie, R.; Cushion, C. Performance analysis in football: A critical review and implications for future research. J. Sports Sci. 2013, 31, 639–676. [Google Scholar] [CrossRef] [Scilit]
- Sarmento, H.; Marcelino, R.; Anguera, M.T.; Campaniço, J.; Matos, N.; Leitão, J.C. Match analysis in football: A systematic review. J. Sports Sci. 2014, 32, 1831–1843. [Google Scholar] [CrossRef] [Scilit]
- Pappalardo, L.; Cintia, P.; Rossi, A.; Massucco, E.; Ferragina, P.; Pedreschi, D.; Giannotti, F. A public data set of spatio-temporal match events in soccer competitions. Sci. Data 2019, 6, 236. [Google Scholar] [CrossRef] [Scilit]
- Lago-Peñas, C.; Lago-Ballesteros, J.; Dellal, A.; Gómez, M. Game-related statistics that discriminated winning, drawing and losing teams from the Spanish soccer league. J. Sports Sci. Med. 2010, 9, 288–293. [Google Scholar]
- Liu, H.; Gómez, M.A.; Lago-Peñas, C.; Sampaio, J. Match statistics related to winning in the group stage of 2014 Brazil FIFA World Cup. J. Sports Sci. 2015, 33, 1205–1213. [Google Scholar] [CrossRef] [Scilit]
- Collet, C. The possession game? A comparative analysis of ball retention and team success in European and international football, 2007–2010. J. Sports Sci. 2013, 31, 123–136. [Google Scholar] [CrossRef] [Scilit]
- Castellano, J.; Casamichana, D.; Lago, C. The use of match statistics that discriminate between successful and unsuccessful soccer teams. J. Hum. Kinet. 2012, 31, 139–147. [Google Scholar] [CrossRef] [Scilit]
- Tenga, A.; Holme, I.; Ronglan, L.T.; Bahr, R. Effect of playing tactics on goal scoring in Norwegian professional soccer. J. Sports Sci. 2010, 28, 237–244. [Google Scholar] [CrossRef] [Scilit]
- Tenga, A.; Holme, I.; Ronglan, L.T.; Bahr, R. Effect of playing tactics on achieving score-box possessions in a random series of team possessions from Norwegian professional soccer matches. J. Sports Sci. 2010, 28, 245–255. [Google Scholar] [CrossRef] [Scilit]
- González-Rodenas, J.; Aranda-Malavés, R.; Tudela-Desantes, A.; Calabuig Moreno, F.; Casal, C.A.; Aranda, R. Effect of match location, team ranking, match status and tactical dimensions on the offensive performance in Spanish ‘La Liga’ soccer matches. Front. Psychol. 2019, 10, 2089. [Google Scholar] [CrossRef] [Scilit]
- Bunker, R.; Susnjak, T. The application of machine learning techniques for predicting match results in team sport: A review. J. Artif. Intell. Res. 2022, 73, 1285–1322. [Google Scholar] [CrossRef] [Scilit]
- Moustakidis, S.; Plakias, S.; Kokkotis, C.; Tsatalas, T.; Tsaopoulos, D. Predicting football team performance with explainable AI: Leveraging SHAP to identify key team-level performance metrics. Future Internet 2023, 15, 174. [Google Scholar] [CrossRef] [Scilit]
- Samosir, F.V.P.; Pasaribu, A.T.K.; Ananta, G.P. Data-driven prediction of striker productivity using Random Forest regression: Insights for enhancing Indonesian football performance. Procedia Comput. Sci. 2026, 284, 380–387. [Google Scholar] [CrossRef] [Scilit]
- Forcher, L.; Forcher, L.; Woll, A.; Altmann, S. AI in Bundesliga match analysis—Expected possession value (EPV) vs. expected goals (xG) to predict match outcomes in soccer. Front. Sports Act. Living 2025, 7, 1713852. [Google Scholar] [CrossRef] [Scilit]
- Gómez, M.A.; Mitrotasios, M.; Armatas, V.; Lago-Peñas, C. Analysis of playing styles according to team quality and match location in Greek professional soccer. Int. J. Perform. Anal. Sport 2018, 18, 986–997. [Google Scholar] [CrossRef] [Scilit]
- Plakias, S.; Moustakidis, S.; Mitrotasios, M.; Kokkotis, C.; Tsatalas, T.; Papalexi, M.; Giakas, G.; Tsaopoulos, D. Analysis of playing styles in European football: Insights from a visual mapping approach. J. Phys. Educ. Sport 2023, 23, 1385–1393. [Google Scholar] [CrossRef] [Scilit]
- Stafylidis, A.; Mandroukas, A.; Michailidis, Y.; Vardakis, L.; Metaxas, I.; Kyranoudis, A.E.; Metaxas, T.I. Key performance indicators predictive of success in soccer: A comprehensive analysis of the Greek soccer league. J. Funct. Morphol. Kinesiol. 2024, 9, 107. [Google Scholar] [CrossRef] [Scilit]
- Plakias, S.; Tsatalas, T.; Armatas, V.; Tsaopoulos, D.; Giakas, G. Tactical situations and playing styles as key performance indicators in soccer. J. Funct. Morphol. Kinesiol. 2024, 9, 88. [Google Scholar] [CrossRef] [Scilit]
- Lago, C. The influence of match location, quality of opposition, and match status on possession strategies in professional association football. J. Sports Sci. 2009, 27, 1463–1469. [Google Scholar] [CrossRef] [Scilit]
- Wyscout. Wyscout Data Glossary. Available online: https://dataglossary.wyscout.com (accessed on 20 October 2026).
- RSSSF. Bulgaria 2022/23. The Rec.Sport.Soccer Statistics Foundation. Available online: https://rsssf.org/tablesb/bulg2023.html (accessed on 30 October 2026).
- RSSSF. Bulgaria 2023/24. The Rec.Sport.Soccer Statistics Foundation. Available online: https://rsssf.org/tablesb/bulg2024.html (accessed on 30 October 2026).
- RSSSF. Bulgaria 2024/25. The Rec.Sport.Soccer Statistics Foundation. Available online: https://rsssf.org/tablesb/bulg2025.html (accessed on 30 October 2026).
- Hvattum, L.M.; Arntzen, H. Using ELO ratings for match result prediction in association football. Int. J. Forecast. 2010, 26, 460–470. [Google Scholar] [CrossRef] [Scilit]
- Hair, J.F.; Black, W.C.; Babin, B.J.; Anderson, R.E. Multivariate Data Analysis, 8th ed.; Cengage: Andover, UK, 2019. [Google Scholar]
- Wood, S.N. Fast stable restricted maximum likelihood and marginal likelihood estimation of semiparametric generalized linear models. J. R. Stat. Soc. Ser. B Stat. Methodol. 2011, 73, 3–36. [Google Scholar] [CrossRef] [Scilit]
- Wood, S.N.; Pya, N.; Säfken, B. Smoothing parameter and model selection for general smooth models. J. Am. Stat. Assoc. 2016, 111, 1548–1563. [Google Scholar] [CrossRef] [Scilit]
- Christensen, R.H.B. Ordinal—Regression Models for Ordinal Data. R Package Version 2023.12-4. Available online: https://CRAN.R-project.org/package=ordinal (accessed on 20 October 2026).
- Cameron, A.C.; Gelbach, J.B.; Miller, D.L. Robust inference with multiway clustering. J. Bus. Econ. Stat. 2011, 29, 238–249. [Google Scholar] [CrossRef] [Scilit]
- Aronow, P.M.; Samii, C.; Assenova, V.A. Cluster–robust variance estimation for dyadic data. Political Anal. 2015, 23, 564–577. [Google Scholar] [CrossRef] [Scilit]
- Brant, R. Assessing proportionality in the proportional odds model for ordinal logistic regression. Biometrics 1990, 46, 1171–1178. [Google Scholar] [CrossRef] [Scilit]
- Breiman, L. Random forests. Mach. Learn. 2001, 45, 5–32. [Google Scholar] [CrossRef] [Scilit]
- Pedregosa, F.; Varoquaux, G.; Gramfort, A.; Michel, V.; Thirion, B.; Grisel, O.; Blondel, M.; Prettenhofer, P.; Weiss, R.; Dubourg, V.; et al. Scikit-learn: Machine learning in Python. J. Mach. Learn. Res. 2011, 12, 2825–2830. [Google Scholar]
- Constantinou, A.C.; Fenton, N.E. Solving the problem of inadequate scoring rules for assessing probabilistic football forecast models. J. Quant. Anal. Sports 2012, 8, 1–14. [Google Scholar] [CrossRef] [Scilit]
- Lundberg, S.M.; Lee, S.I. A unified approach to interpreting model predictions. Adv. Neural Inf. Process. Syst. 2017, 30, 4765–4774. [Google Scholar]
- Lundberg, S.M.; Erion, G.; Chen, H.; DeGrave, A.; Prutkin, J.M.; Nair, B.; Katz, R.; Himmelfarb, J.; Bansal, N.; Lee, S.I. From local explanations to global understanding with explainable AI for trees. Nat. Mach. Intell. 2020, 2, 56–67. [Google Scholar] [CrossRef] [Scilit]
- Igolkina, A.A.; Meshcheryakov, G. semopy: A Python package for structural equation modeling. Struct. Equ. Model. 2020, 27, 952–963. [Google Scholar] [CrossRef] [Scilit]
- Lago-Ballesteros, J.; Lago-Peñas, C.; Rey, E. The effect of playing tactics and situational variables on achieving score-box possessions in a professional soccer team. J. Sports Sci. 2012, 30, 1455–1461. [Google Scholar] [CrossRef] [Scilit]
- Faude, O.; Koch, T.; Meyer, T. Straight sprinting is the most frequent action in goal situations in professional football. J. Sports Sci. 2012, 30, 625–631. [Google Scholar] [CrossRef] [Scilit]
- Bradley, P.S.; Sheldon, W.; Wooster, B.; Olsen, P.; Boanas, P.; Krustrup, P. High-intensity running in English FA Premier League soccer matches. J. Sports Sci. 2009, 27, 159–168. [Google Scholar] [CrossRef] [Scilit]
- Girard, O.; Mendez-Villanueva, A.; Bishop, D. Repeated-sprint ability—Part I: Factors contributing to fatigue. Sports Med. 2011, 41, 673–694. [Google Scholar] [CrossRef] [Scilit]

Disclaimer/Publisher’s Note: The statements, opinions and data contained in all publications are solely those of the individual author(s) and contributor(s) and not of MDPI and/or the editor(s). MDPI and/or the editor(s) disclaim responsibility for any injury to people or property resulting from any ideas, methods, instructions or products referred to in the content. |
© 2026 by the authors. Licensee MDPI, Basel, Switzerland. This article is an open access article distributed under the terms and conditions of the Creative Commons Attribution (CC BY) license.