


Abstract
Whether individualized active recovery enhances the decline in blood lactate during ice hockey intermissions without increasing subsequent demand remains unclear. This randomized crossover pilot study compared cycling guided by an individualized heart-rate target informed by the Fatmax assessment (HRFatmax) with passive seated recovery and examined physiological, perceptual, and circulating biomarker responses. Ten male university-level ice hockey players completed 18 high-intensity skating bouts in three blocks simulating three game periods. Two 18 min intermissions included 15 min of HRFatmax-guided cycling or passive seated recovery. The main comparison was the absolute pre-to-post-intermission decrease in blood lactate. Heart rate, perceived exertion, and perceptual responses were assessed throughout. Six circulating biomarkers were assessed before, 30 min after, and 24 h after exercise. Blood lactate decreased more during active than passive recovery (3.89 vs. 2.83 mmol·L−1; paired difference 1.06 mmol·L−1; 95% CI 0.05–2.08; p = 0.042). No significant recovery-condition effects were detected for subsequent skating heart rate or perceived exertion. Psychological fatigue showed an exploratory condition-by-block interaction, with differences already present before the first intermission. The biomarker panel showed time-dependent changes in myoglobin and creatinine, but no recovery-condition effects or interactions were detected. In this laboratory simulation, Fatmax-informed cycling enhanced the short-term decline in blood lactate. Its implications for skating performance and perceived readiness require further study. These findings warrant confirmation in a larger trial incorporating direct performance measures.
1. Introduction
Ice hockey requires repeated 30–80 s high-intensity skating shifts separated by bench recovery across three periods. This intermittent pattern places substantial demands on aerobic and anaerobic metabolism, and fatigue may accumulate during match play [1,2]. Between-period intermissions therefore provide an opportunity to support recovery without adding fatigue before the next period. Active recovery generally accelerates the decrease in blood lactate compared with passive rest, although this response has not consistently improved subsequent performance [3,4,5,6,7]. Because blood lactate reflects the balance between lactate appearance and disposal, a faster decrease is a physiological response rather than direct evidence of restored performance capacity [7]. Recovery intensity influences this response, supporting individualized rather than uniform prescription [4,8]. Fatmax, the intensity eliciting maximal whole-body fat oxidation, provides a measurable individual reference point [9]. In trained endurance athletes, Fatmax has been reported near the intensity at which blood lactate first rises above baseline [10], providing a physiological rationale for exploring this prescription.
Evidence specific to ice hockey remains sparse and inconsistent. Fifteen minutes of bench stepping accelerated the post-exercise decrease in blood lactate without preserving subsequent skating performance [11], whereas low-intensity cycling produced no significant differences in blood lactate, heart rate, or subsequent skating distance compared with seated recovery [12]. Light activity during a brief period of bench recovery after one simulated shift maintained cardiac output, but its effects across full intermissions and repeated periods were not examined [13]. It therefore remains unclear whether cycling prescribed based on an individual physiological target can improve recovery across multiple simulated periods. Perceptual and biochemical responses are also poorly characterized, despite their relevance to perceived readiness and systemic stress [7,14].
Accordingly, this randomized crossover pilot study compared 15 min of cycling guided by an individualized heart-rate target informed by each player’s Fatmax assessment during cardiopulmonary exercise testing (CPET) with passive seated recovery during a skating-treadmill simulation of three ice hockey periods. The main analytical focus was the absolute pre-to-post-intermission decrease in blood lactate concentration. Skating heart rate and rating of perceived exertion (RPE), additional perceptual ratings, circulating biomarkers, and the association with aerobic fitness were evaluated as exploratory outcomes.
2. Materials and Methods
2.1. Participants
Twelve healthy male university-level ice hockey players were recruited for this randomized crossover pilot study. Participants were recruited between April and September 2025. Two participants completed their first experimental trial but were unable to complete the second due to the start of preseason preparation; one had completed passive recovery (PR) first and the other active recovery (AR) first. They were excluded from crossover analyses, leaving ten participants who completed both recovery conditions. All participants reported beginning to play organized ice hockey between 4 and 7 years of age and were actively competing at the time of the study. They were free from cardiovascular disease, musculoskeletal injury, or any other condition contraindicating high-intensity exercise. Medication and supplement use was recorded in the baseline screening questionnaire.
Their baseline characteristics are presented in Table 1. All participants received verbal and written information about the procedures, potential risks, and expected benefits before providing written informed consent. The study was approved by the Ethics Committee of the University Hospital Pilsen and the Faculty of Medicine in Pilsen, Charles University (Approval No. 336/24; 7 November 2024) and conducted in accordance with the Declaration of Helsinki. The study was not registered in a trial registry, and no prospectively dated study protocol was available.
Table 1.
Participant anthropometric and exercise-test characteristics (n = 10). Values are presented as mean ± standard deviation (SD) and the observed range. BMI, body mass index; VO2peak, peak oxygen uptake; HRmax, maximal heart rate; HRFatmax, heart rate at maximal fat oxidation; HRVT1 and HRVT2, heart rates at the first and second ventilatory thresholds. Where HRFatmax was recorded as a range, its midpoint was used.
2.2. Study Design
A balanced, randomized, two-condition crossover design was used, with each participant completing PR and AR and therefore serving as his own control. A random condition-order sequence was generated by the principal investigator before recruitment, with equal numbers assigned to each sequence. Participants received study identification numbers consecutively in recruitment order, and each number had a preassigned recovery sequence. The principal investigator implemented allocation and had access to the sequence list; allocation was not concealed. Among all 12 recruits, six were assigned AR first and six PR first. Following one withdrawal from each sequence after the first trial, five participants in each sequence completed both trials. Where applicable, participants were tested in pairs with opposite sequences, allowing the same stationary exercise bike to be used for all AR interventions.
The study comprised one preliminary assessment and two experimental trials separated by at least 6 days. Among the ten participants who completed both trials, the median interval between CPET and the first experimental trial was 4 days (range 1–22 days). When these visits occurred on consecutive days, at least 24 h elapsed between the completion of CPET and the start of the experimental trial. The minimum six-day interval between trials was selected to reduce potential carryover of exercise-induced biomarker responses from the preceding trial. Each trial included the same repeated high-intensity skating protocol, with either AR or PR applied during both simulated intermissions, followed by blood sampling 24 h later. The median interval between experimental trials was 11 days (range: 6–177 days). One participant completed the second trial after a 177-day interval because of recovery from an injury.
Participants were instructed to abstain from exercise, strenuous physical activity, and alcohol 24 h before each experimental session until completion of the 24 h follow-up sampling. Both experimental sessions began between 09:00 and 10:00. Participants were instructed to maintain their habitual diet and to consume the same breakfast and amount of coffee before both experimental sessions. Breakfast, coffee and alcohol instructions were checked verbally, and participants agreed to follow the protocol. Water or an electrolyte drink was available ad libitum according to need; consumed volumes were not recorded. The same dietary, coffee and alcohol instructions were also provided for the day before CPET. Before CPET, participants were instructed to consume a light breakfast and refrain from eating for at least 2 h before the test. Actual meal composition and time since the last meal were not recorded.
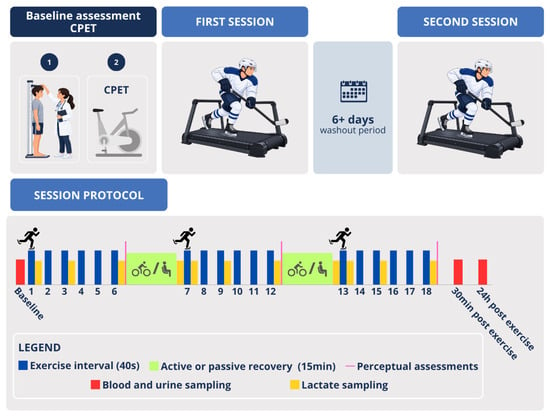
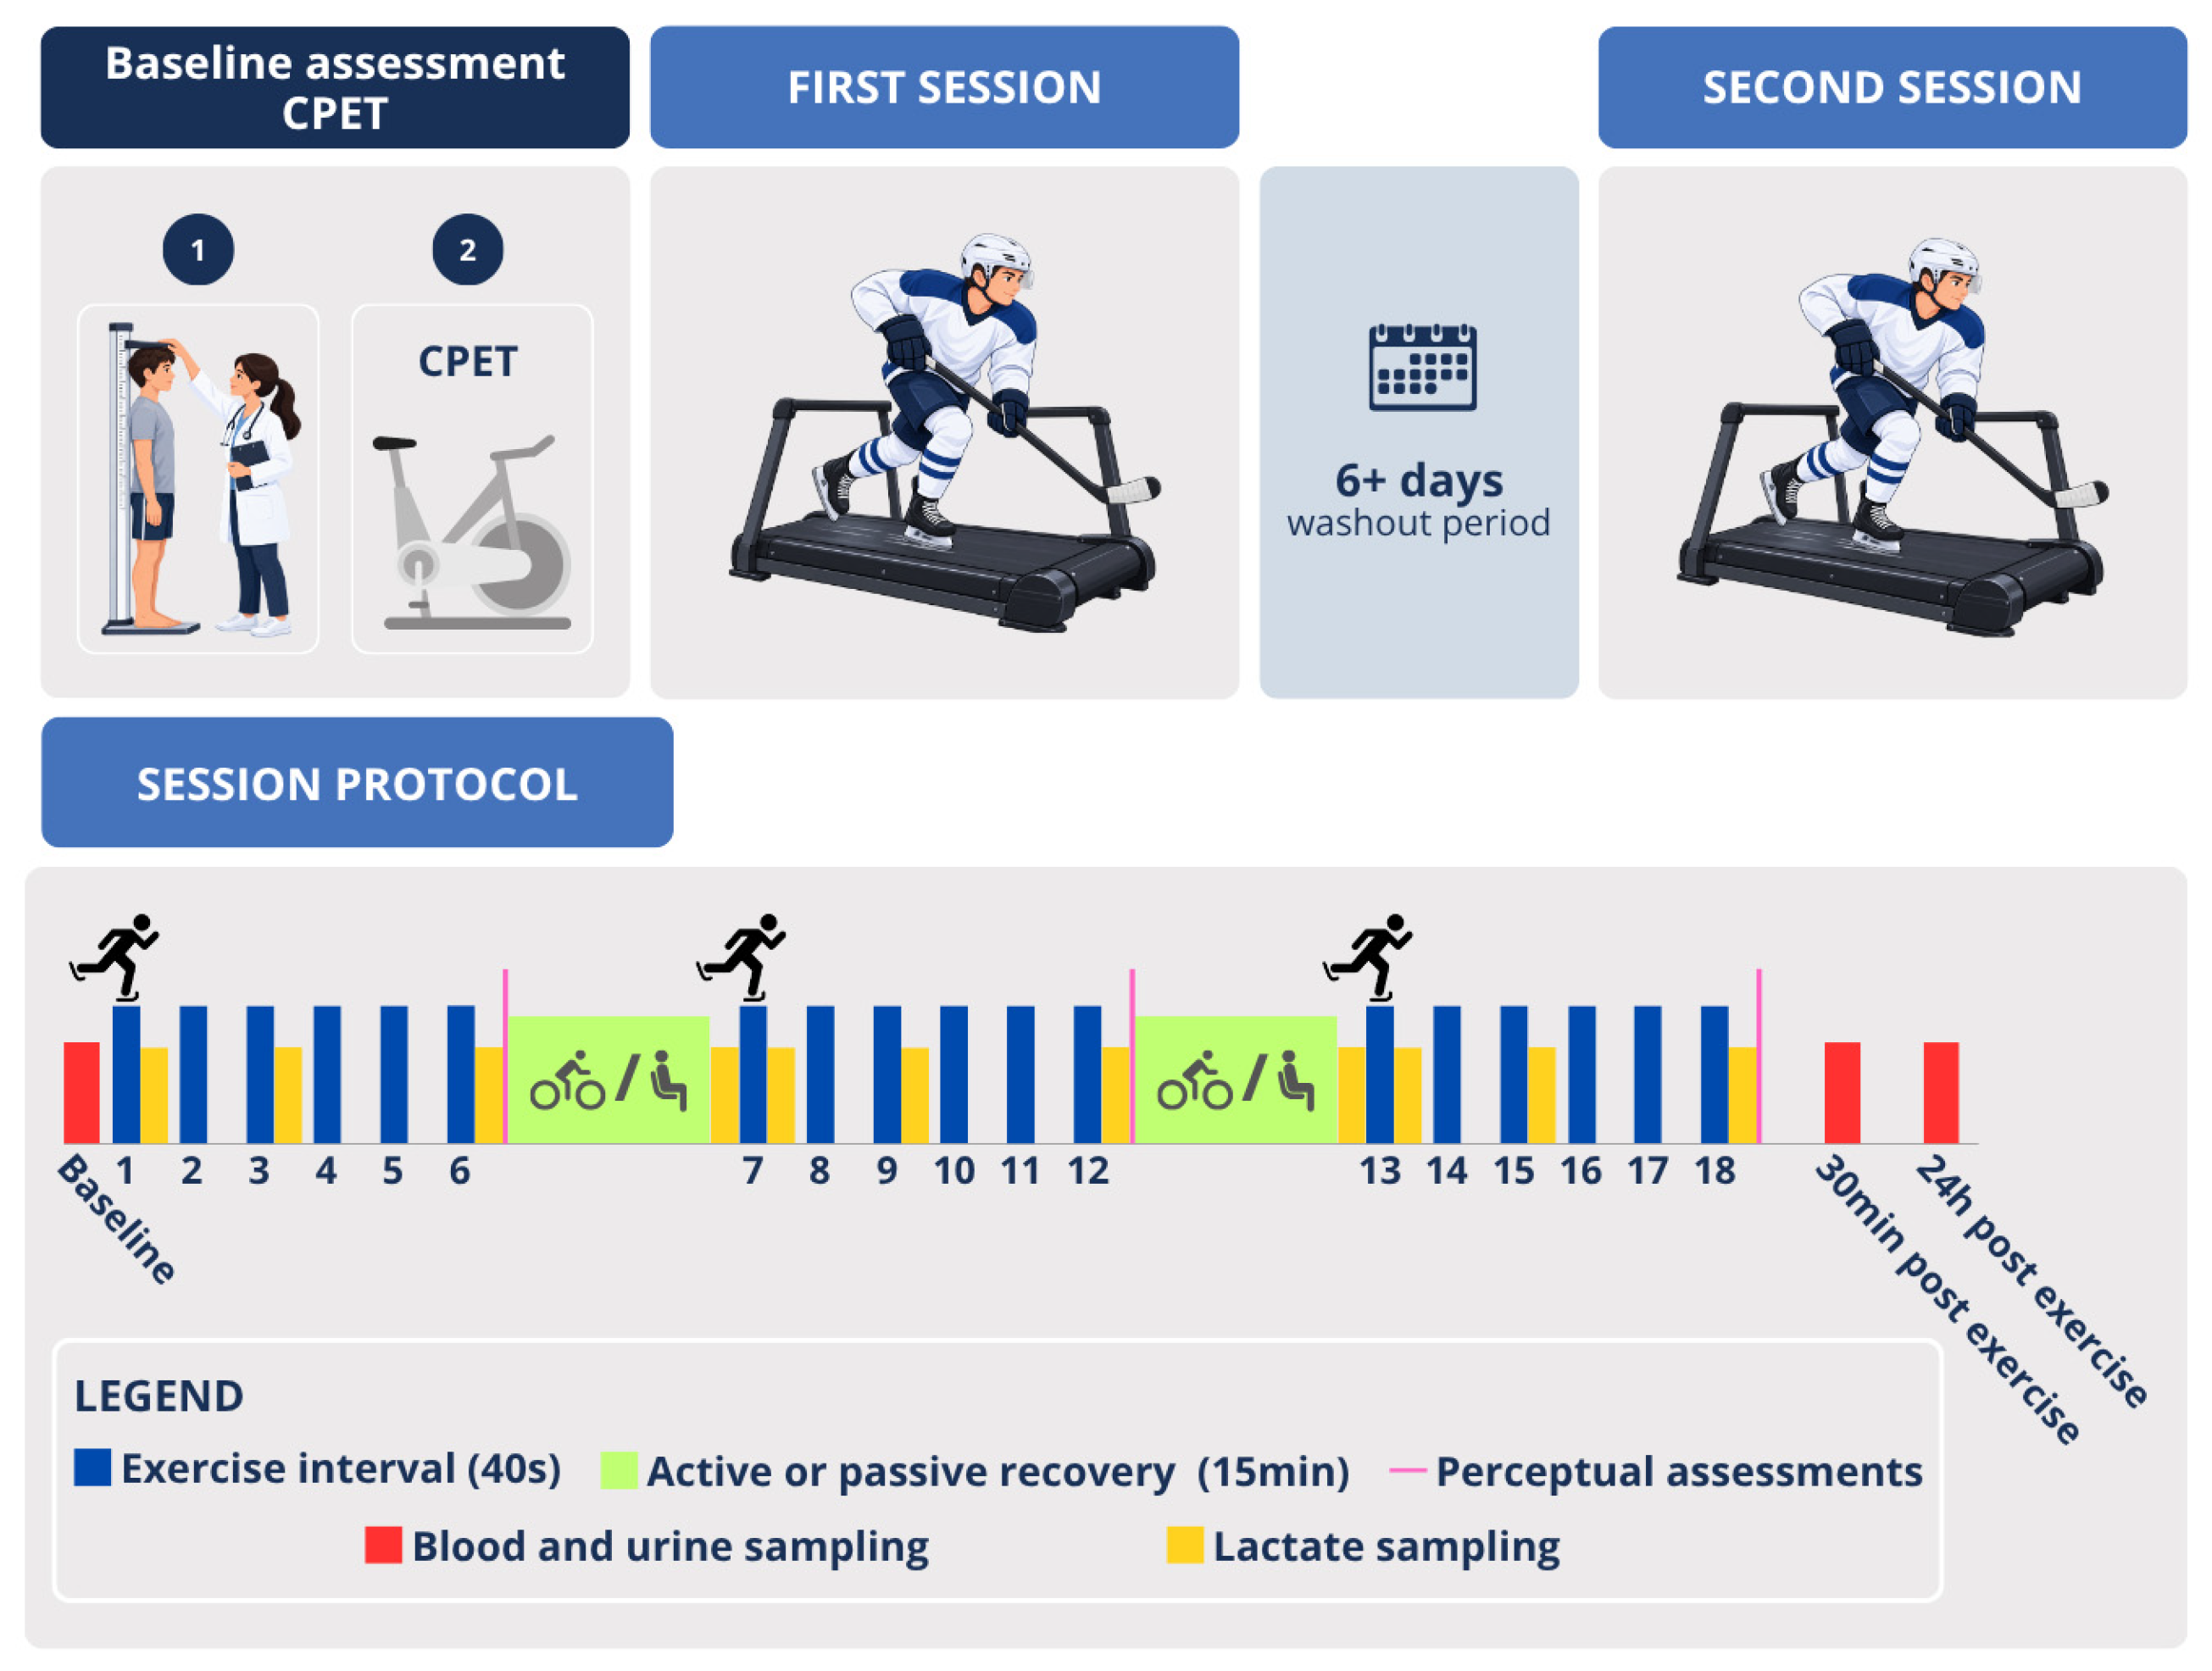
Both trials followed the same planned exercise and measurement schedule apart from the recovery intervention. The study protocol is summarized in Figure 1.
Figure 1.
Overview of the study design and experimental protocol. Following baseline assessment and cardiopulmonary exercise testing (CPET), participants completed two experimental sessions in randomized order, with either active cycling or passive seated recovery, separated by a washout period of at least 6 days. Each session comprised three blocks of six 40 s skating intervals, separated by 15 min recovery interventions. Venous blood and urine samples were collected at baseline, 30 min after exercise, and 24 h after exercise. Capillary blood lactate and perceptual responses were assessed during the protocol. Illustrative elements were generated using ChatGPT (OpenAI), and the study schematic was assembled using the web-based Canva application (Canva Pty Ltd, Sydney, Australia).
2.3. Preliminary Assessment and Determination of Fatmax
Height and weight were measured, and body mass index was calculated. Participants then completed a maximal CPET on an electronically braked Lode Excalibur Sport cycle ergometer (Lode B.V., Groningen, The Netherlands). Breath-by-breath pulmonary gas exchange was measured continuously using a METALYZER 3B system (CORTEX Biophysik GmbH, Leipzig, Germany) and processed in MetaSoft Studio version 5.17.3 SR2; heart rate was recorded simultaneously within the CORTEX system. Before each CPET, gas and flow calibration were performed according to the CORTEX calibration protocol. Gas calibration used ambient air and a reference gas containing 15% O2 and 5% CO2, with N2 as the balance gas. Flow calibration was performed using a calibration syringe following the software-guided procedure.
Work rate was prescribed relative to body mass. The test began at 1.0 W·kg−1 for 2 min, followed by 2 min stages at 1.5 and 2.0 W·kg−1 and a subsequent ramp increase of 0.5 W·kg−1 every minute until volitional exhaustion. Peak oxygen uptake (VO2peak) was defined as the highest 30 s rolling average of oxygen uptake, and maximal heart rate (HRmax) as the highest recorded heart rate.
The first ventilatory threshold (VT1) was identified by visual inspection of the VCO2-versus-VO2 relationship using the V-slope method, and the second ventilatory threshold (VT2; respiratory compensation point) by the rise in VE/VCO2, with confirmation using the corresponding gas-exchange plots. VE denotes minute ventilation. Two assessors evaluated the responses independently and then agreed on the final determinations. The corresponding heart rates were recorded as HRVT1 and HRVT2. Heart rate at VT2 (HRVT2) was retained as the individual reference used to establish the skating-treadmill incline during warm-up. Fat oxidation during the submaximal portion of the test was estimated from breath-by-breath oxygen uptake (VO2) and carbon dioxide output (VCO2) data in MetaSoft Studio. Respiratory data were processed using the software’s automatic filters. Fatmax was defined as the intensity associated with the highest software-calculated fat-oxidation rate. The assessor selected the Fatmax band by inspecting the software-calculated fat-oxidation curve and identifying the region around its maximum (g/h). The corresponding CPET work-rate ranges are reported in Supplementary Table S8. The software-derived result and corresponding heart-rate reference were reviewed independently by two assessors, followed by agreement. A 30 s time-based rolling average was used for the original Fatmax assessment in all participants. This approach follows the general principles of graded Fatmax testing [9] and is supported by studies using 1 min or ramp-based incremental cycling protocols in physically active and trained males [15,16]. The recorded recovery reference is referred to as HRFatmax. When a heart-rate range was recorded, the midpoint of the recorded range was used as the recovery target; when a single value was identified, that value was used. Thus, active recovery was prescribed based on each participant’s CPET-derived internal-load target rather than on a common external workload. HRFatmax was selected as an individualized reference for low-intensity cycling during the intermissions, with the aim of maintaining activity while limiting additional exercise demand before the next skating block.
2.4. Experimental Skating Protocol and Recovery Interventions
After collection of the resting blood lactate sample, participants completed a 2–4 min individualized warm-up and familiarization period on the skating treadmill (TM-PRO, Shanghai Henchman Sports Trading Co., Ltd., Shanghai, China). The warm-up and familiarization continued until they reported being ready to begin. There was no separate familiarization visit, and warm-up duration was matched between the two experimental trials.
The protocol comprised three blocks of six 40 s high-intensity skating intervals (18 intervals in total). Each interval was followed by 80 s of passive between-shift recovery, occasionally extended to a maximum of 100 s for technical reasons related to treadmill operation. The frequency and individual durations of these extensions were not systematically recorded. Belt speed was 32.2 km·h−1 in both trials. The incline was individualized during warm-up to obtain a heart rate close to the participant’s HRVT2 [17,18]. The selected setting was recorded as vertical elevation in centimeters relative to the level position and was held constant throughout the exercise blocks and across both experimental visits for that participant. Thus, incline differed between participants but was not adjusted during the exercise blocks in response to heart rate. Individual incline settings were recorded to reproduce the same setting at the second visit, but these records were not retained and are unavailable for numerical reporting.
The blocks were separated by two 18 min simulated intermissions. During AR, participants cycled for the first 15 min on a standard gym-based stationary exercise bike with manually adjustable mechanical resistance. Cadence was maintained at ≥60 rev·min−1. Heart rate was checked approximately every 20 s, and resistance was adjusted as necessary to maintain heart rate as close as possible to the prespecified HRFatmax target. Pre-intermission samples were collected within 1 min after completion of the sixth skating interval, and post-intermission samples were collected immediately after the 15 min recovery intervention, before skate preparation. External cycling power was not measured. During PR, participants remained seated for the corresponding 15 min. The remaining 3 min were allocated to skate preparation. The same recovery condition was applied during both intermissions within each trial.
2.5. Physiological and Perceptual Measurements
Heart rate was recorded continuously using Polar chest-strap monitors connected to the Polar Team application (Polar Electro Oy, Kempele, Finland). The value recorded at the end of each 40 s skating interval was retained, and the six interval-specific values were averaged for each exercise block.
Capillary blood was collected from the earlobe at rest before the warm-up, after the first, third, and sixth intervals of each exercise block, and immediately after each 15 min recovery intervention. Blood lactate concentration was measured using a Biosen C-Line analyzer (EKF-diagnostic GmbH, Barleben, Germany). The three within-block measurements were averaged for block-level analysis. The decrease in blood lactate during each intermission was calculated as the concentration after the sixth interval of the preceding block minus the post-recovery concentration; positive values therefore indicated a decrease.
Rating of perceived exertion (RPE) was recorded immediately after each interval using the Borg category-ratio 10 scale [19], and the six ratings were averaged for each block. After each block, fatigue, muscle soreness, psychological fatigue, stress, motivation, mood, discomfort, and perceived performance were assessed using study-specific single-item numerical rating scales ranging from 1 (lowest level) to 10 (highest level). Higher scores indicated greater fatigue, muscle soreness, psychological fatigue, stress, and discomfort, but more favorable motivation, mood, and perceived performance. Domain selection was informed in part by Nässi et al. [20]. Item labels and scoring directions are provided in Supplementary Methods S1.
2.6. Sample Collection and Analyses
2.6.1. Blood and Urine Collection
Venous blood was collected from an antecubital vein at baseline before the protocol, after participants had remained seated for 5 min (sample A), 30 min after the protocol (sample B), and 24 h after the protocol (sample C). At time point A, three 4 mL tubes were collected: one tripotassium ethylenediaminetetraacetic acid (K3EDTA) tube, one lithium-heparin separator tube (LiHep), and one serum separator tube (all VACUETTE®, Greiner Bio-One GmbH, Kremsmünster, Austria). At time points B and C, one LiHep tube and one serum separator tube were collected. Urine was collected at the same time points in VACUETTE® urine tubes. LiHep and serum samples were centrifuged at 2000× g for 10 min; the resulting plasma and serum were aliquoted and stored at −80 °C until analysis.
2.6.2. Laboratory Analyses
Routine screening analyses were performed for all participants using the K3EDTA samples collected at time point A and included erythrocyte, leukocyte, and platelet counts and hemoglobin concentration. The following parameters were analyzed in the lithium-heparin (LiHep) samples collected at time point A: bilirubin, aspartate aminotransferase (AST), alanine aminotransferase (ALT), creatinine, cystatin C, and total protein. Basic urinalysis was performed using the urine samples collected at time point A.
Erythrocyte, leukocyte, and platelet counts, and hemoglobin concentration were measured using an automated hematology analyzer (DxH 900, Beckman Coulter, Brea, CA, USA).
Blood biomarkers can provide complementary information on exercise-related physiological responses and recovery [21,22,23]. At all three sampling time points (A, B, and C), the following circulating biochemical parameters were quantified in serum or plasma, as appropriate: interleukin-6 (IL-6), high-sensitivity cardiac troponin T (hs-cTnT), myoglobin, creatine kinase (CK), creatinine, cystatin C, total protein, and albumin. The six biomarkers reported in the main text were IL-6, hs-cTnT, myoglobin, CK, creatinine, and cystatin C; total protein and albumin are reported in the Supplementary Material. Urinary albumin and creatinine concentrations were determined in urine samples collected at all three time points. All biochemical and urinary analyses were performed using the Cobas 8000 system (modules c702 and e602; Roche Diagnostics, Basel, Switzerland). For presentation, CK values recorded in µkat·L−1 were converted to U·L−1 by multiplying by 60. Reported IL-6 values of 1.5 ng·L−1 and hs-cTnT values of 3.0 ng·L−1 corresponded to the respective lower measurement limits and were retained at these values in the statistical analyses.
2.7. Statistical Analysis
Data are presented as mean ± standard deviation (SD) unless otherwise stated. Analyses were performed using JASP 0.17.1, R 4.5.3, and Python 3.14.6. Figures were prepared in Python. All tests were two-sided, with statistical significance set at p < 0.05.
Two-way repeated-measures analysis of variance (RM ANOVA) was used to analyze blood lactate concentration, heart rate, RPE, and the additional perceptual outcomes, with recovery condition (AR and PR) and exercise block (blocks 1–3) as within-subject factors. Blood lactate decrease was analyzed using a separate two-way RM ANOVA, with recovery condition and intermission as within-subject factors. Each laboratory outcome measured at all three sampling time points was analyzed using a separate two-way RM ANOVA, with recovery condition and sampling time (baseline, 30 min post-exercise, and 24 h post-exercise) as within-subject factors. Total protein and albumin were analyzed on their original scales; uACR was analyzed on the natural-log scale, with original-scale and alternative censoring-substitution analyses reported in the Supplementary Material.
Sphericity was assessed using Mauchly’s test, with Greenhouse–Geisser-corrected p-values reported when the assumption was violated. Significant main effects or interactions were followed by Holm-adjusted pairwise comparisons where appropriate. Effect sizes are reported as partial eta squared (ηp2). Holm correction was applied within each set of post hoc comparisons, but p-values were not adjusted across different physiological, perceptual, or biochemical outcomes because of the exploratory pilot design. For main-text reporting, six circulating biomarkers were selected to represent inflammatory, cardiac, skeletal-muscle, and renal responses: IL-6, hs-cTnT, myoglobin, CK, creatinine, and cystatin C. Total protein and albumin are reported in Supplementary Table S2 and Figure S2. This reporting choice was made to conserve space and was not based on statistical significance.
For the main lactate contrast, each player’s intermission decreases were averaged within condition before calculating the paired AR-minus-PR mean difference and its t-based 95% CI. A sensitivity model included participant fixed effects, recovery condition, and trial period (first or second visit), using one mean decrease per participant and visit. Baseline values were summarized descriptively by sequence and period; no preliminary carryover test was used to select the analysis. Between-condition differences in change from block 1 to blocks 2 and 3 were also examined for psychological fatigue and perceived performance. Two-sided paired tests were Holm-adjusted across the two change contrasts within each outcome. All CIs were unadjusted for multiplicity, and inferential results were interpreted as exploratory.
For the exploratory analysis of aerobic fitness and the individual response to AR, blood lactate decrease was averaged across the two intermissions within each condition, and the PR mean was subtracted from the AR mean. Positive recovery-effect scores therefore indicated a greater decrease during AR. The association between this score and VO2peak was examined using simple linear regression with ordinary least-squares estimation and Pearson’s correlation coefficient. The 95% CI for Pearson’s r was calculated using Fisher’s z transformation; regression coefficients and their 95% CIs were also reported.
No a priori sample-size calculation was performed; recruitment was determined by the feasibility of the pilot protocol. Physiological and perceptual analyses included all ten participants who completed both trials. Complete-case analyses included nine participants for all eight blood markers and eight for uACR. One PR blood sample at 24 h was missing for all eight blood markers. Two participants each lacked one PR urine sample, at 30 min or 24 h. Available observations from incomplete participants were retained in the source data but were excluded from the corresponding complete-case models. No missing observations were imputed. Outcome-specific analysis populations and missing samples are summarized in Supplementary Table S7.
3. Results
3.1. Physiological Responses to Repeated Exercise and Recovery
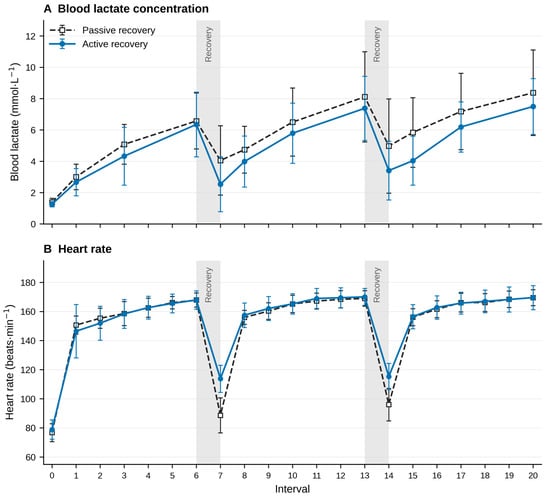
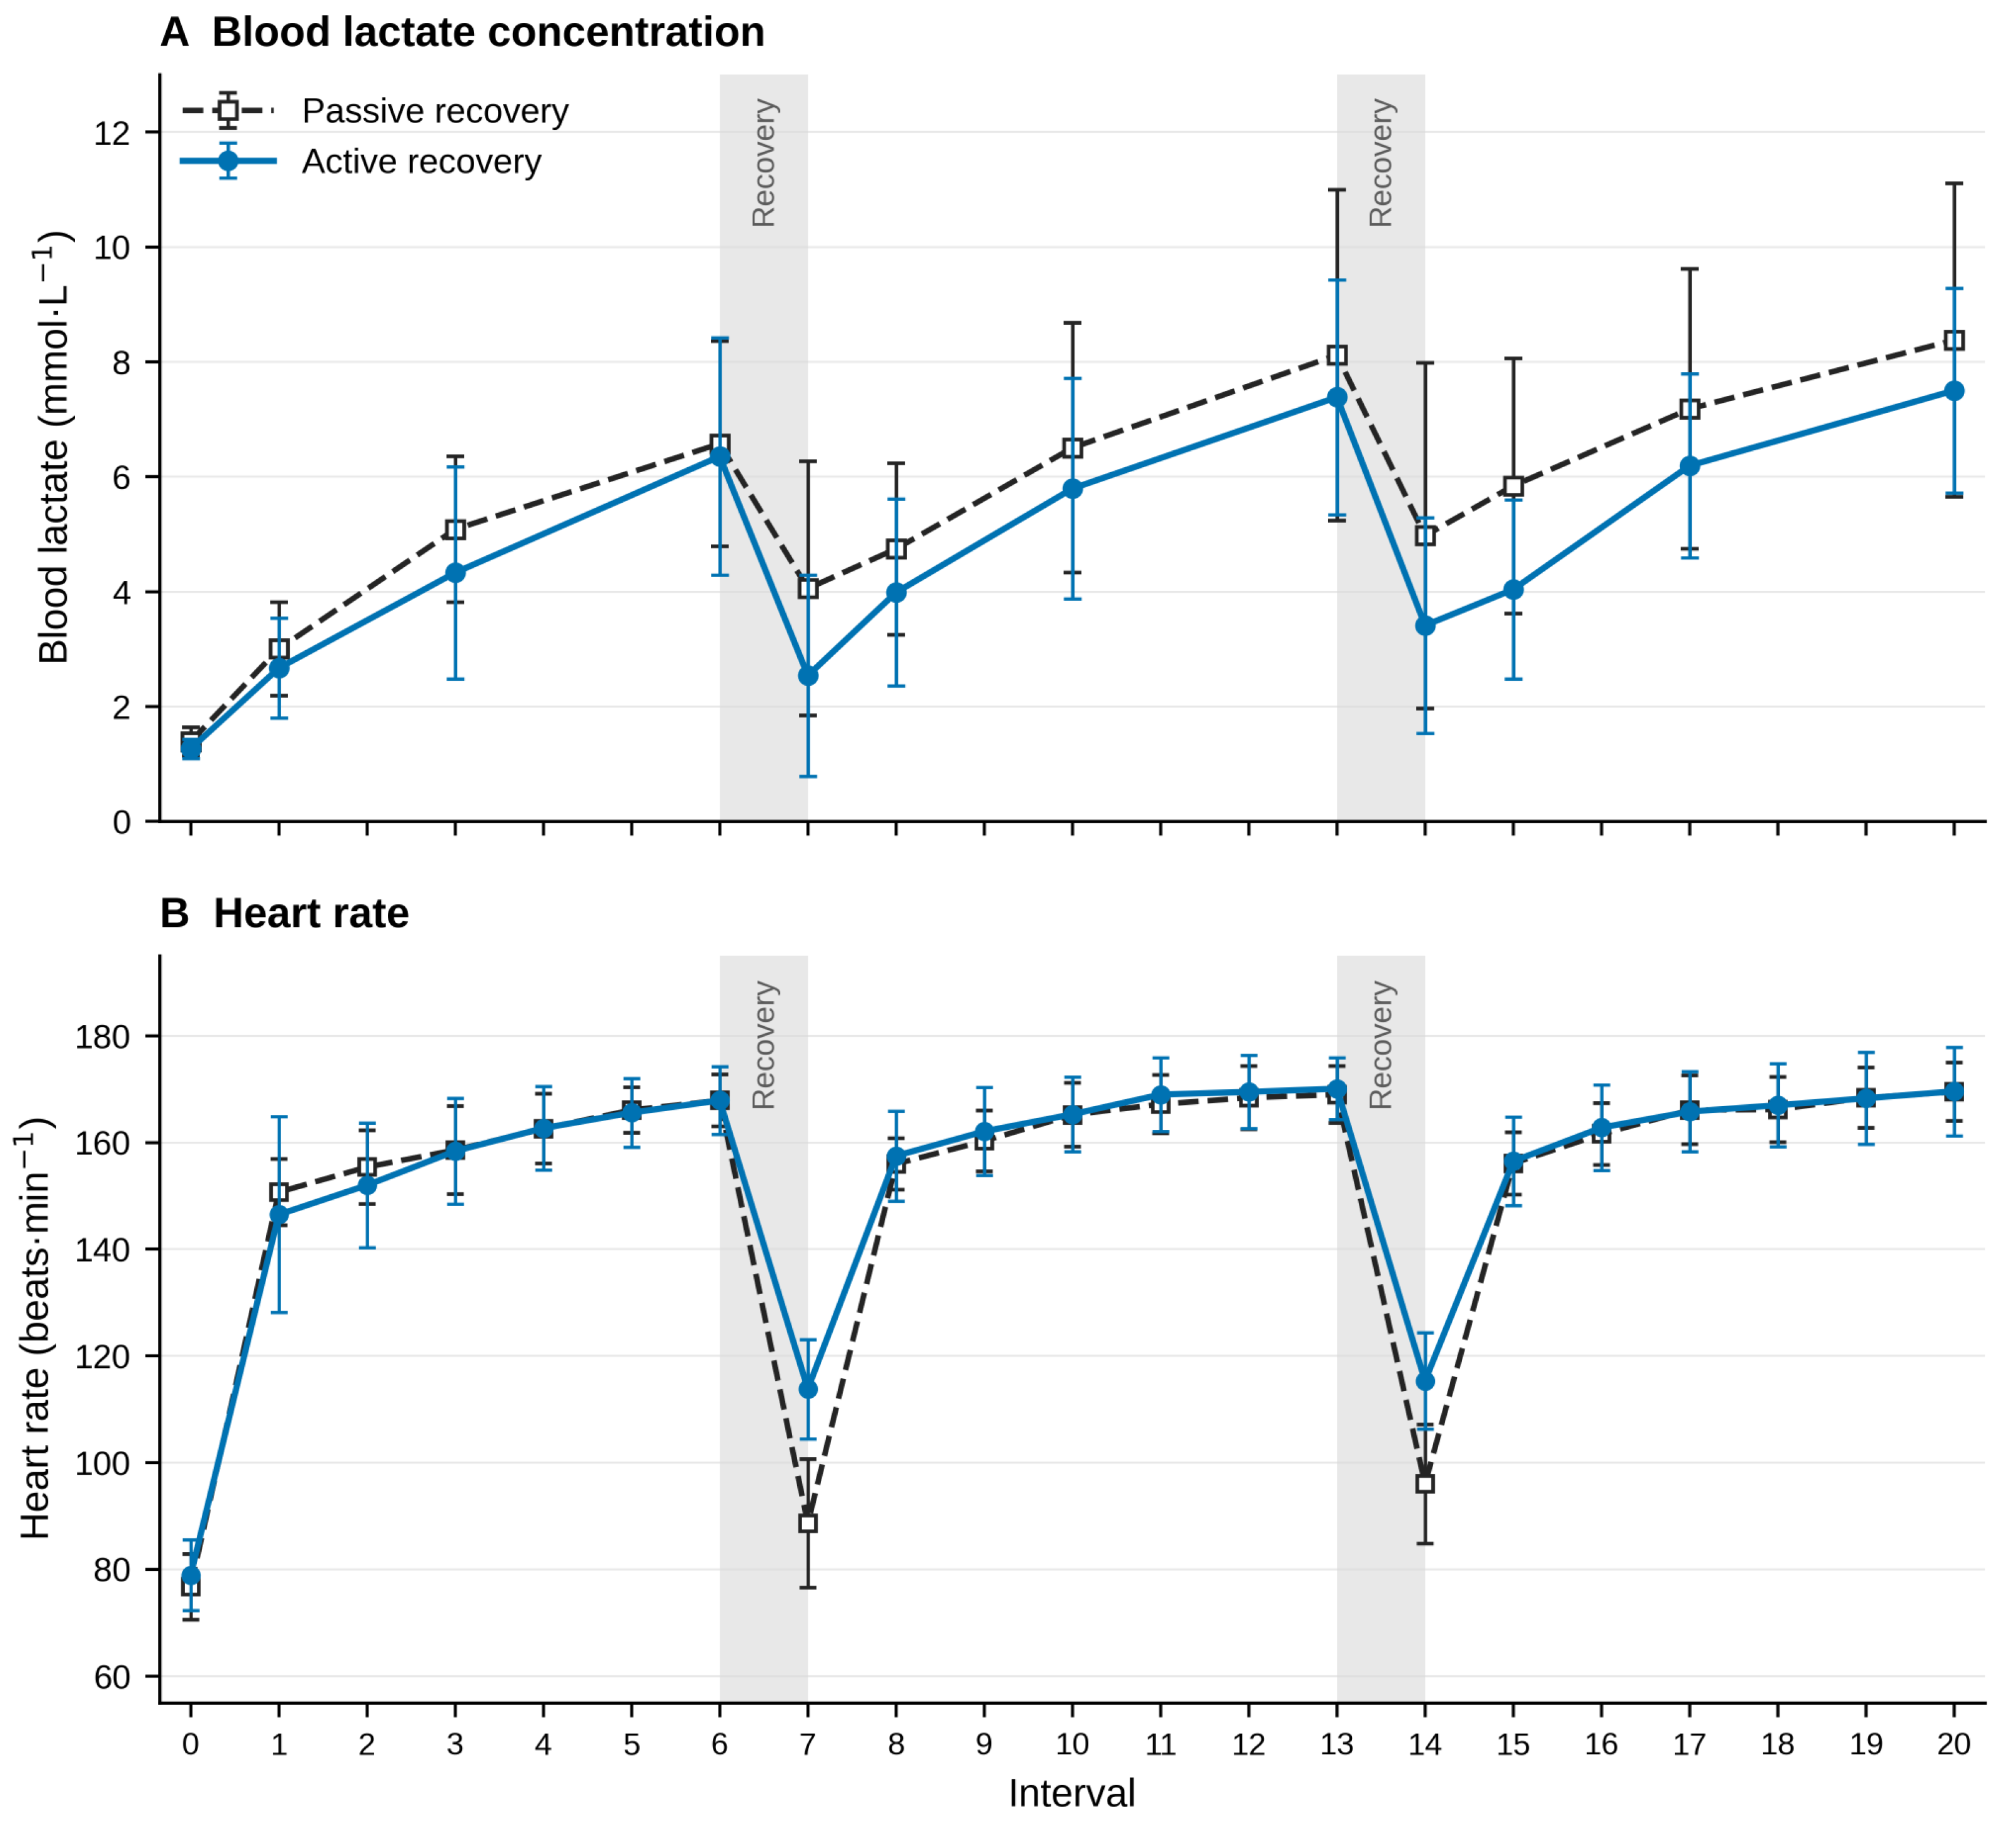
Blood lactate concentration and heart rate increased significantly across exercise blocks, whereas neither variable showed a significant main effect of recovery condition or a recovery condition × block interaction (Table 2, Figure 2). Mean heart rate across the full 15 min active recovery intervention was 97.2 ± 10.2% and 98.3 ± 8.0% of the prespecified HRFatmax target during the first and second intermissions, respectively, indicating close adherence to the individualized intensity prescription. Across both intermissions, active-recovery heart rate averaged 81.8 ± 5.6% of the originally recorded HRVT1 reference. These summaries describe average target attainment and do not quantify time spent within a predefined target tolerance.
Table 2.
Physiological responses during repeated exercise and recovery.
Figure 2.
Blood lactate concentration (A) and heart rate (B) during the skating protocol under passive and active recovery conditions. Shaded areas denote the two intermissions. Lactate recovery points represent samples obtained after the 15 min intervention, whereas heart-rate recovery points represent retained mean values across that intervention. Exercise lactate samples were taken after intervals 1, 3, and 6 of each block; exercise heart-rate points represent end-interval values. The x-axis numbering includes 18 skating intervals and two recovery positions (7 and 14), which represent post-recovery lactate concentrations in panel (A) and mean heart rate during recovery in panel (B). Lines connect observations and do not represent continuous lactate measurement. Values are mean ± standard deviation (SD) (n = 10).
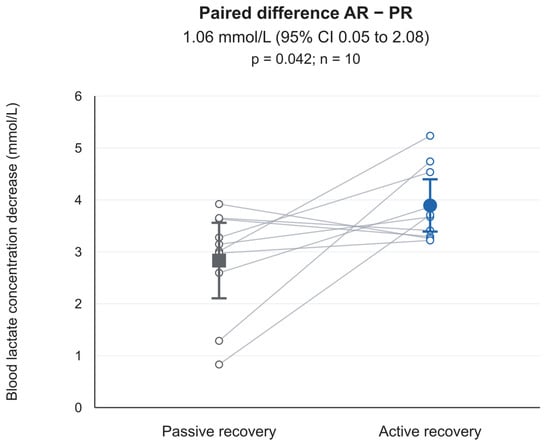
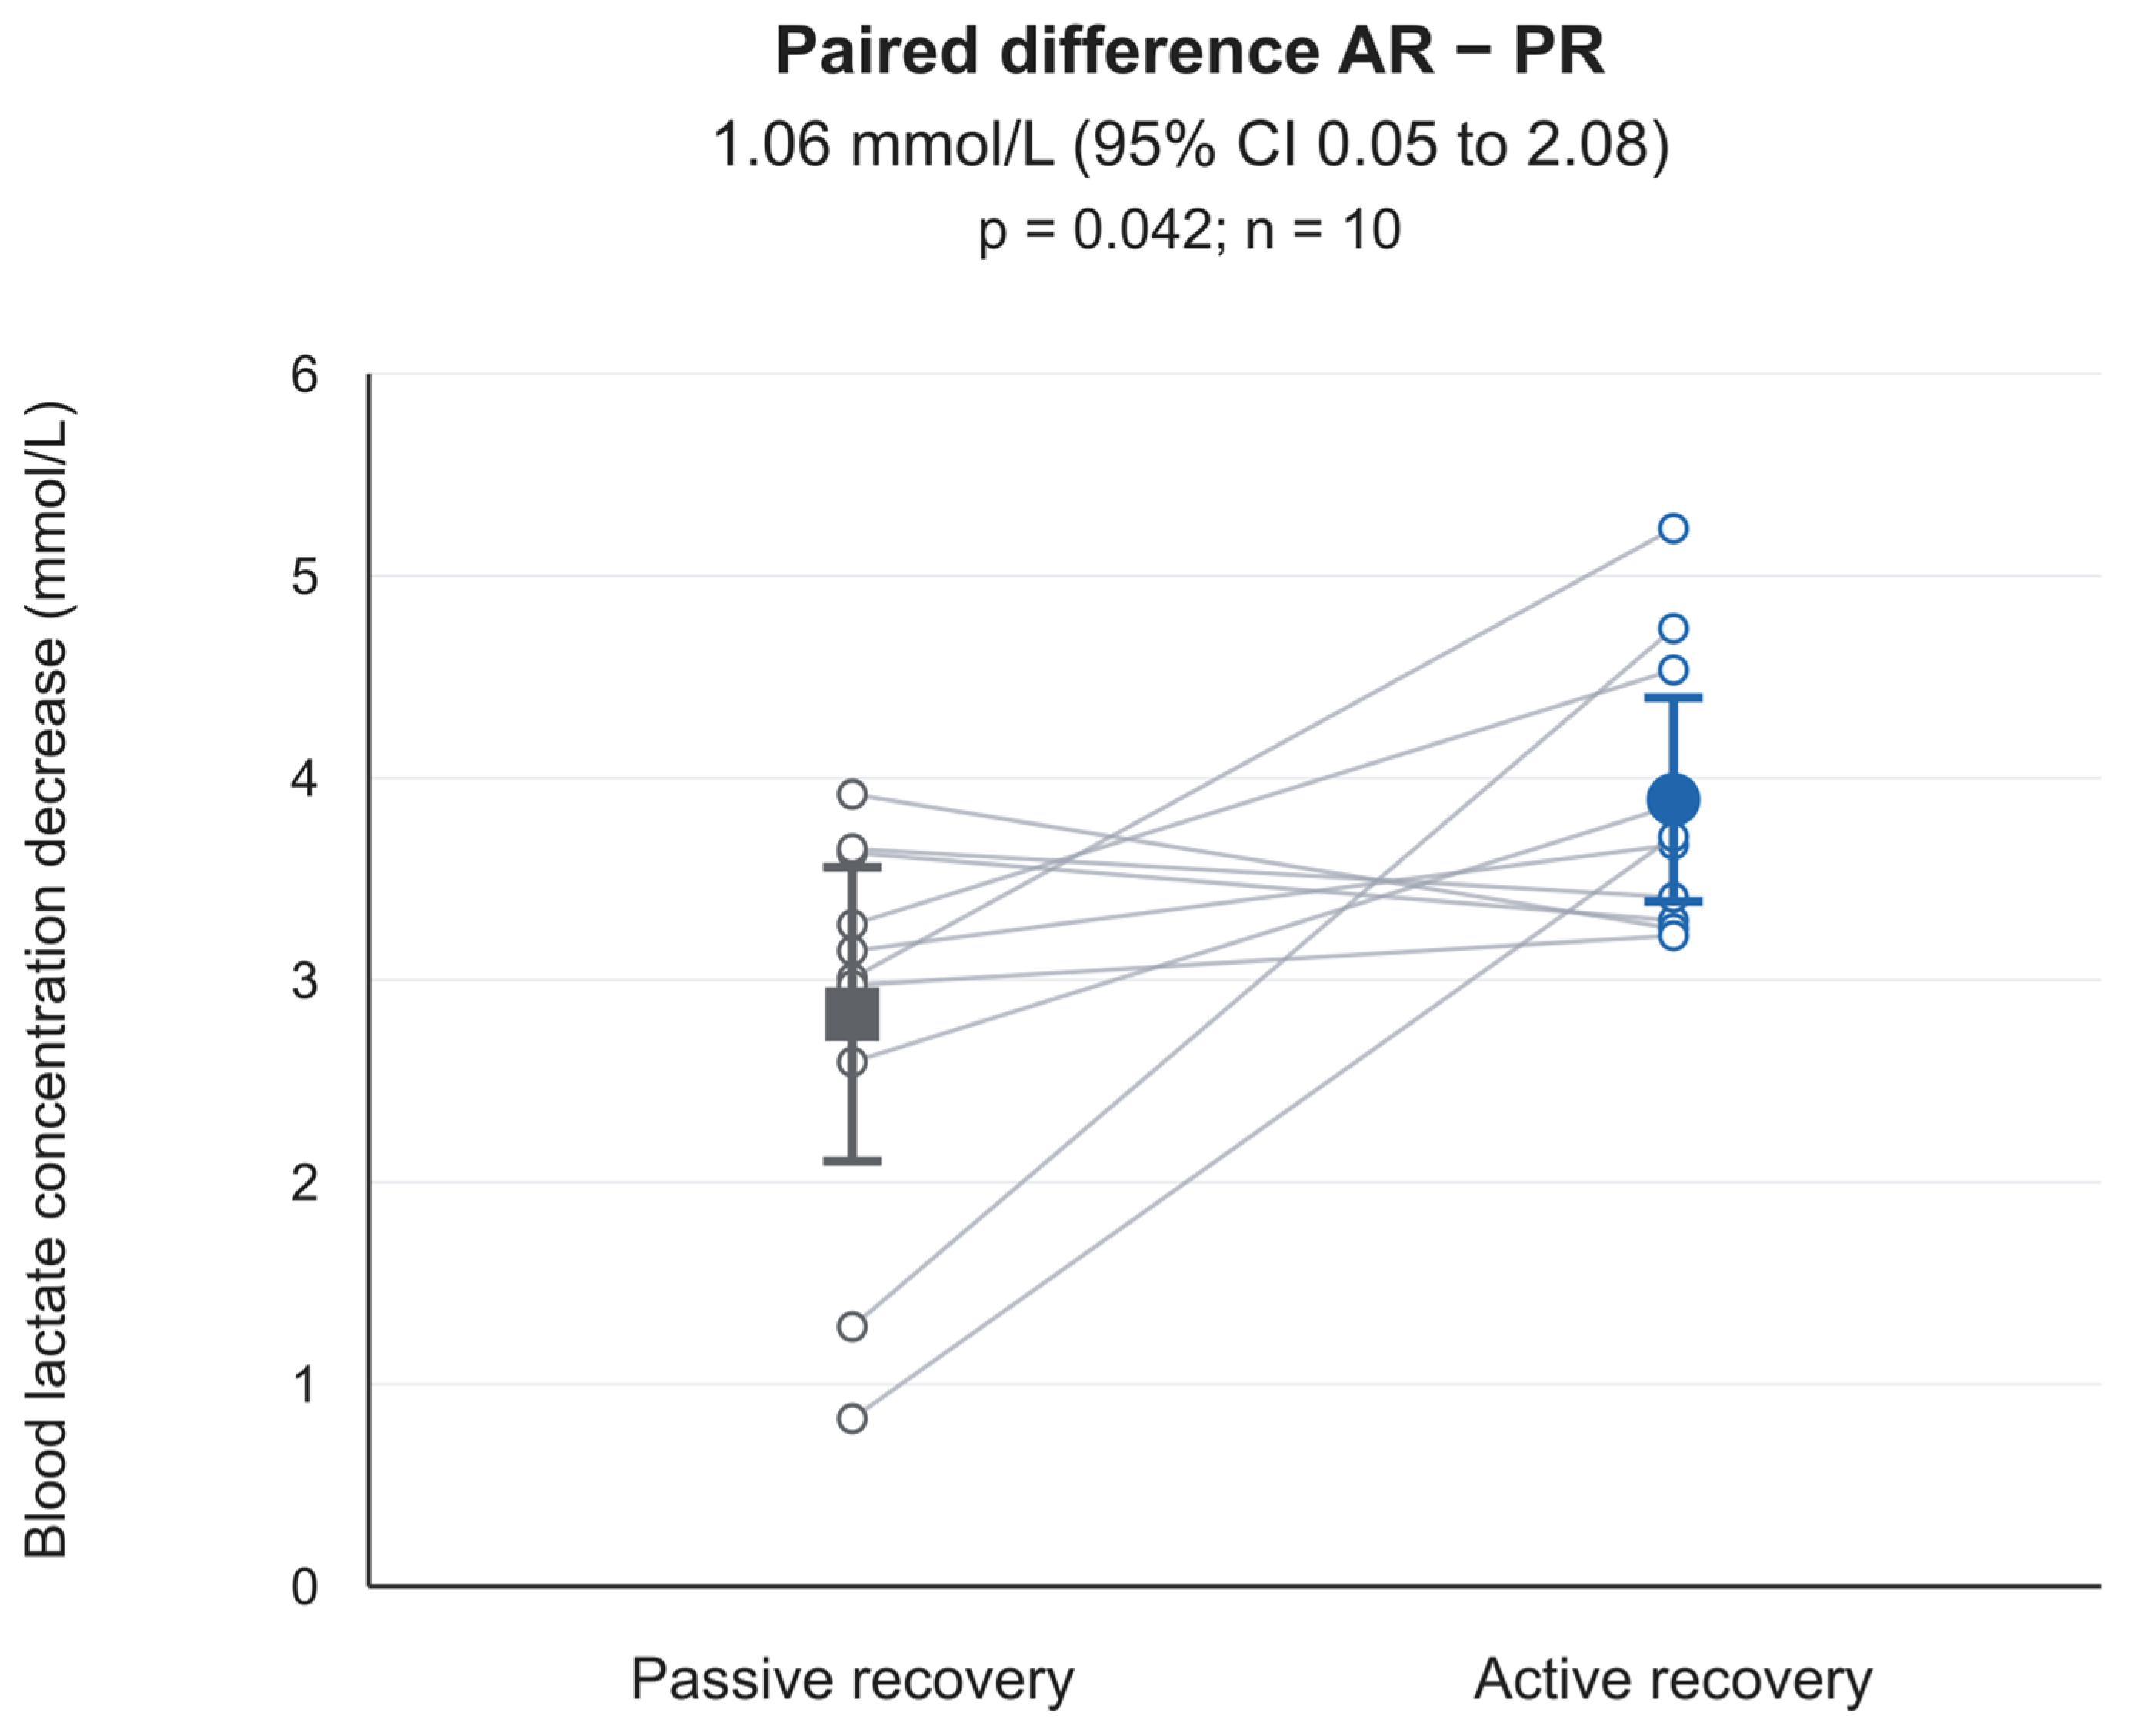
Mean blood lactate decrease across the two intermissions was 3.89 mmol·L−1 during AR and 2.83 mmol·L−1 during PR. The mean paired AR-minus-PR difference was 1.06 mmol·L−1 (95% CI 0.05–2.08; p = 0.042; Table 2; Figure 3). Mean differences had the same direction in both intermissions: 1.29 mmol·L−1 in intermission 1 (95% CI −0.13–2.72) and 0.83 mmol·L−1 in intermission 2 (95% CI 0.19–1.47). Pre- and post-intermission concentrations and paired individual observations are provided in Supplementary Table S3. The period-adjusted sensitivity estimate was 1.062 mmol·L−1 (95% CI 0.008–2.116; p = 0.049). The estimated second-versus-first trial-period effect was 0.367 mmol·L−1 (95% CI −0.687–1.421; p = 0.445). Descriptive values by trial period and sequence are provided in Supplementary Table S4.
Figure 3.
Comparison of the decrease in blood lactate between passive and active recovery. Values for each participant were averaged across the two recovery periods. Individual paired observations are connected by grey lines. Large symbols represent condition means, and error bars indicate their separate 95% confidence intervals (n = 10). The mean paired AR-minus-PR difference, its 95% confidence interval and p-value are reported above the plot.
3.2. Subjective Parameters
RPE, fatigue, and muscle soreness increased significantly across exercise blocks, whereas no significant main effects of recovery condition or recovery condition × block interactions were observed. Stress, motivation, mood, and discomfort showed no significant main effects or interactions (Table 3; Supplementary Table S1).
Table 3.
Subjective responses during repeated exercise and recovery. Descriptive statistics and repeated-measures ANOVA results for rating of perceived exertion (RPE), psychological fatigue, and perceived performance. Results for the remaining subjective variables are presented in Supplementary Table S1. Values in Panel A are mean ± standard deviation (SD). Panel B presents p-values with partial eta squared (ηp2) in parentheses. Recovery condition and exercise block were included as within-subject factors. a Greenhouse–Geisser-corrected p-value.
Psychological fatigue showed a recovery condition × block interaction (Table 3). At block 1, before the first recovery intervention, ratings were higher in the AR trial than the PR trial (2.50 versus 1.60). The AR-minus-PR difference in change from block 1 to block 3 was −2.20 scale points (95% CI −3.50 to −0.90; Holm-adjusted p = 0.008). Perceived performance also showed an exploratory interaction (Greenhouse–Geisser-corrected p = 0.049) and was lower in AR at block 1 (5.90 versus 7.10). Exploratory change contrasts and their CIs are reported in Supplementary Table S5; these findings require consideration of the pre-intervention differences and outcome multiplicity.
3.3. Blood Biomarkers
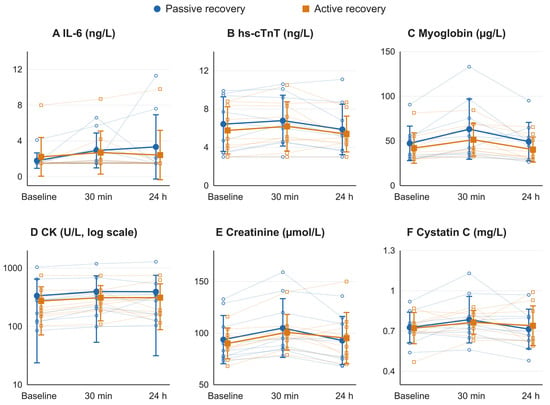
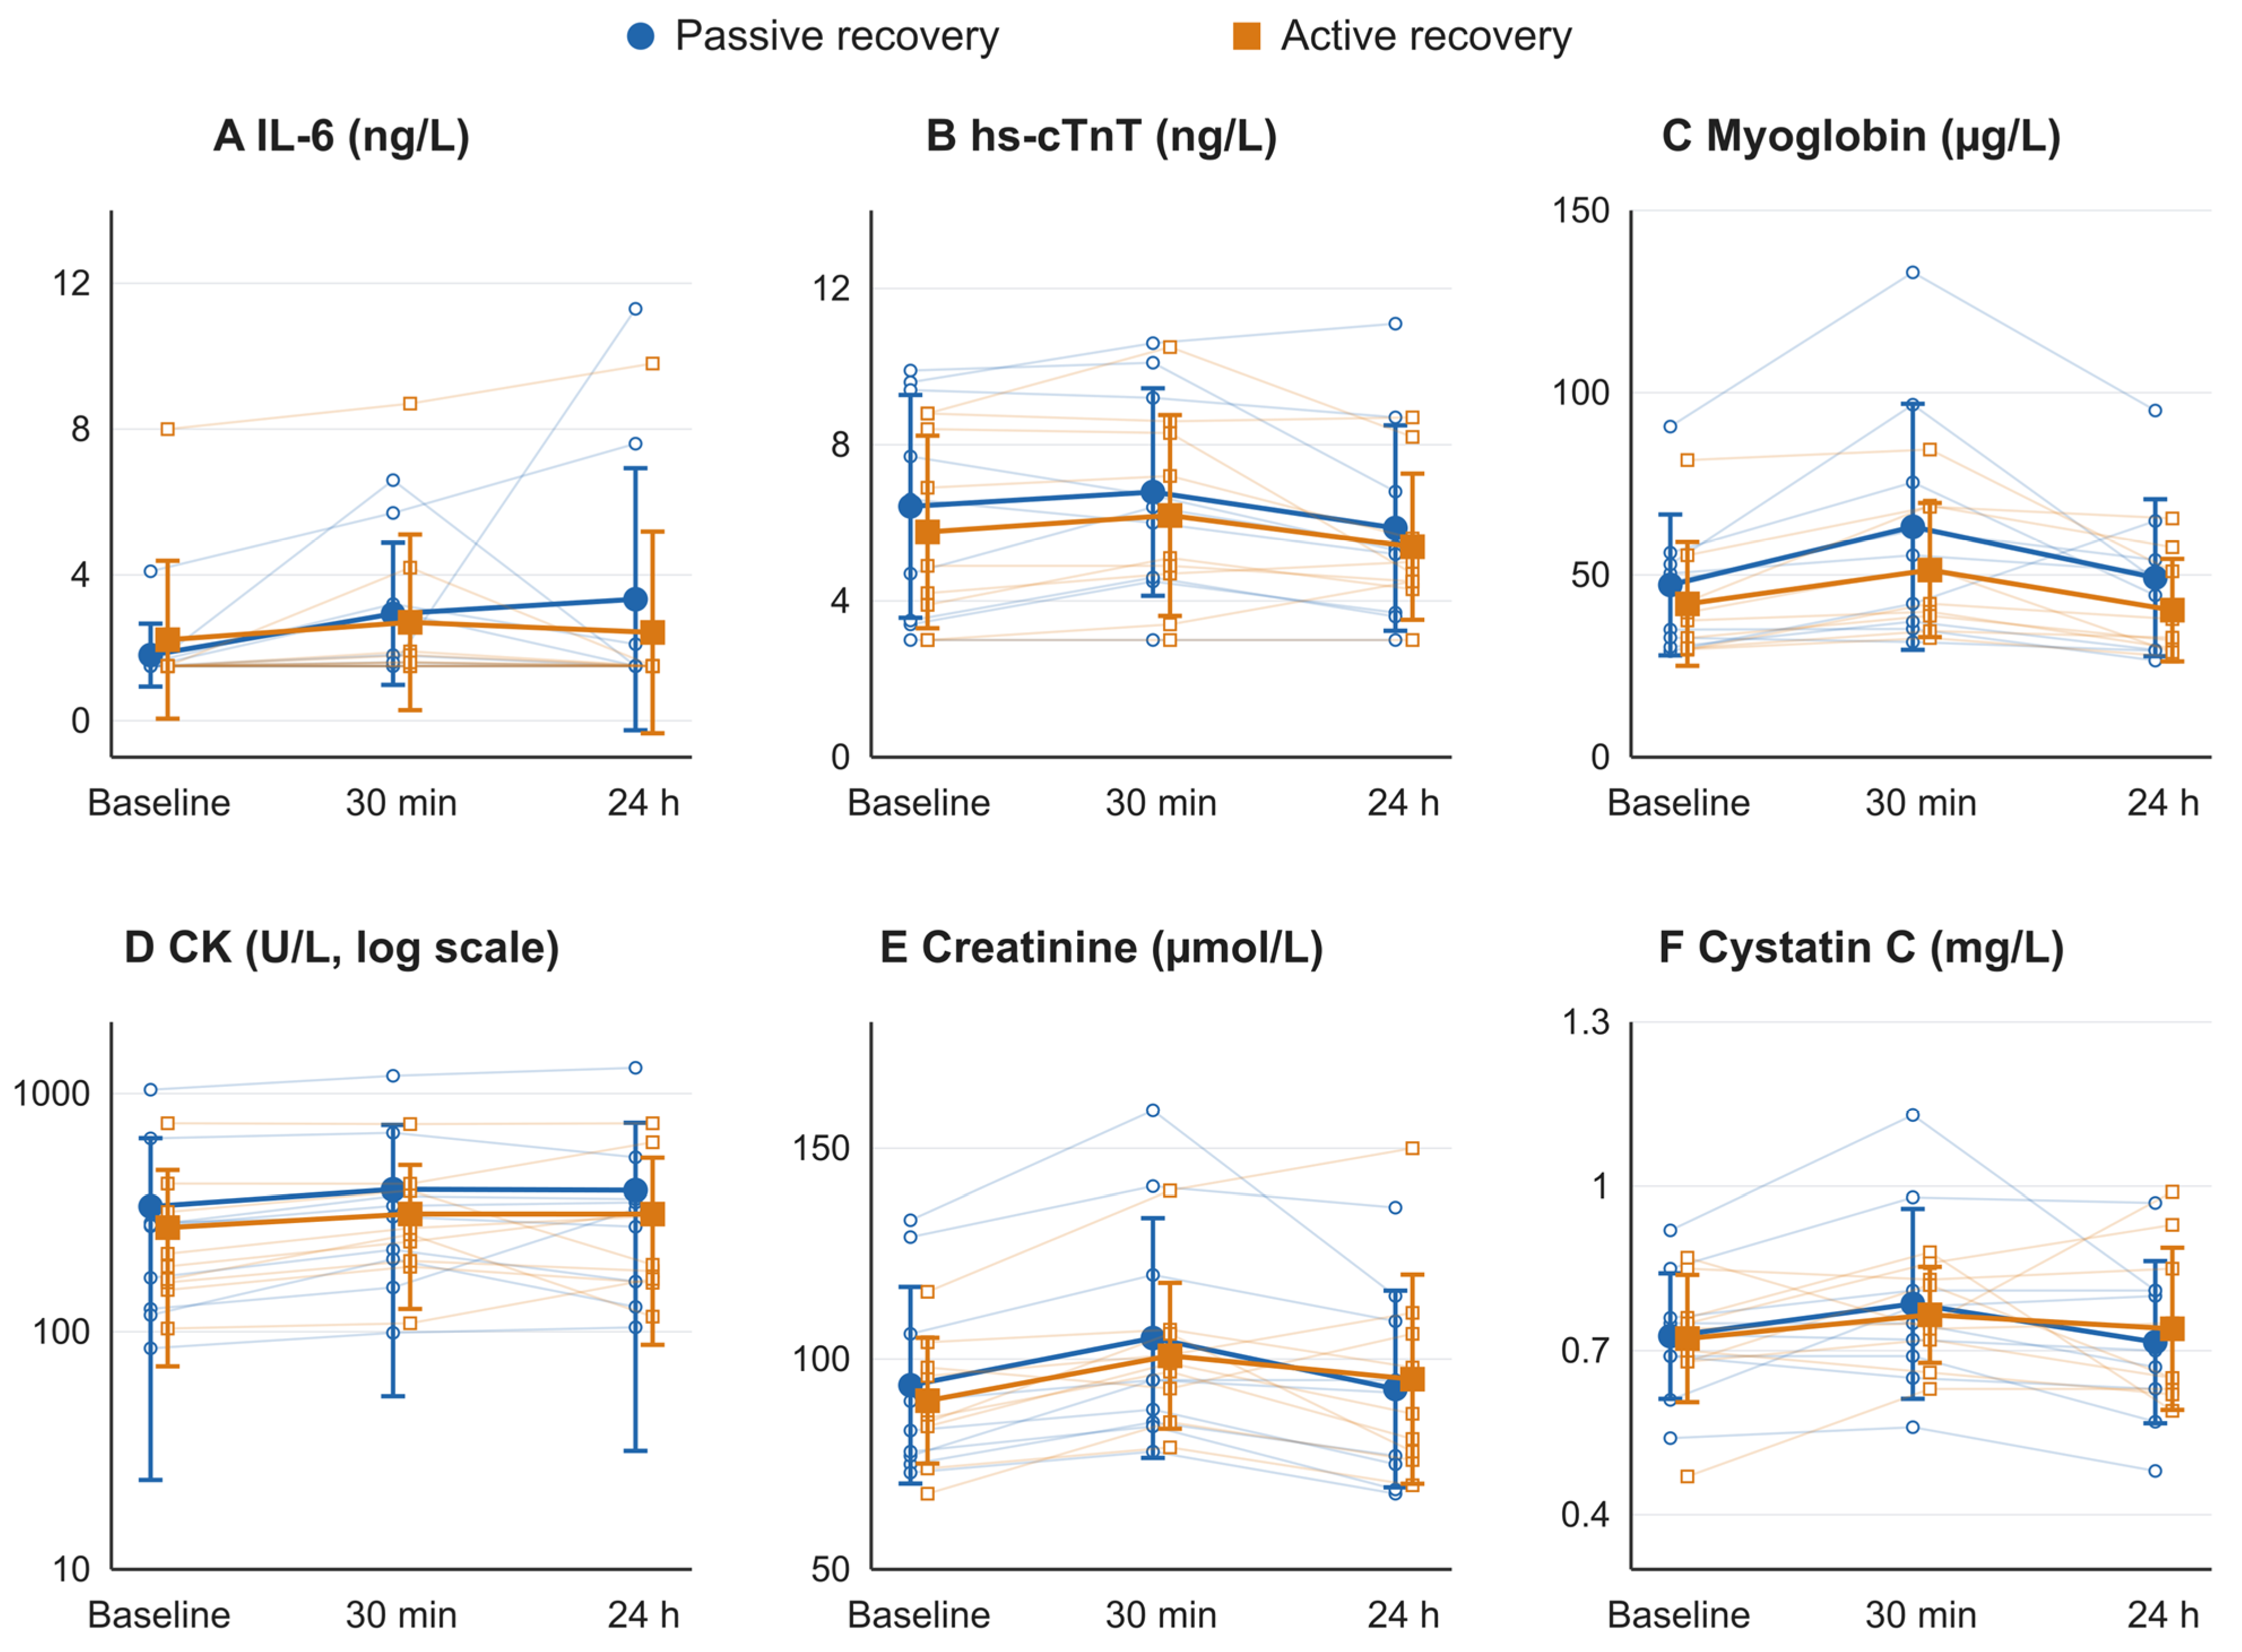
No statistically significant recovery-condition effects or recovery condition × sampling time interactions were detected for the six selected blood biomarkers (Table 4; Figure 4). Sampling-time effects were detected for myoglobin and creatinine. Averaged within players across conditions, myoglobin increased from baseline to 30 min (Holm-adjusted p = 0.033) and decreased from 30 min to 24 h (p = 0.033); the 24 h versus baseline comparison was not significant (p = 0.972). Corresponding creatinine comparisons yielded p = 0.007, p = 0.023, and p = 0.333. These results indicate temporal changes but do not establish equivalence to baseline at 24 h. Estimates and CIs are reported in Supplementary Table S6. No significant sampling-time effects were detected for IL-6, hs-cTnT, CK, or cystatin C. Total protein, albumin, and uACR results are reported in Supplementary Table S2 and Figure S2.
Table 4.
Responses of the six selected circulating biomarkers under passive and active recovery conditions. Panel A presents mean ± standard deviation (SD) (range); Panel B presents p-values with partial eta squared (ηp2) in parentheses. Recovery condition and sampling time were within-subject factors (n = 9). a Greenhouse–Geisser-corrected p-value. IL-6, interleukin-6; hs-cTnT, high-sensitivity cardiac troponin T.
Figure 4.
Responses of the six selected circulating biomarkers across sampling time points under passive and active recovery conditions. Thin lines and open symbols represent individual participants; bold lines and filled symbols represent means, and error bars indicate standard deviation (SD) (n = 9). The CK y-axis is logarithmic for display only; values are in U·L−1. Means and SD were calculated on the original scale, and the analyses reported in Table 4 were performed on that scale. IL-6, interleukin-6; hs-cTnT, high-sensitivity cardiac troponin T; CK, creatine kinase.
3.4. Association Between VO2peak and the Lactate Recovery Response
VO2peak was not significantly associated with the lactate recovery-effect score (r = −0.591, 95% CI −0.890 to 0.061; p = 0.072; Supplementary Figure S1). The point estimate was negative, indicating a smaller additional lactate decrease during active relative to passive recovery at higher VO2peak values, although the confidence interval included zero.
4. Discussion
The main observation was a greater absolute pre-to-post-intermission decline in blood lactate concentration with individualized active cycling than with passive seated recovery. The estimated difference was 1.06 mmol·L−1 and remained positive in the period-adjusted sensitivity analysis, although both estimates were imprecise and their lower confidence limits were close to zero. Treadmill speed and each participant’s incline setting were held constant across trials. No recovery-condition effect on skating heart rate or RPE was detected. Because treadmill work and subsequent skating performance were not quantified, the lactate finding does not establish improved functional recovery or next-period performance.
The greater decrease in blood lactate concentration during active recovery is consistent with previous crossover studies showing lower concentrations during low-intensity activity than during passive rest across several exercise modes [4,24,25]. Kojima et al. [3] also reported lower post-recovery blood lactate after 15 min of light cycling than after seated rest following circuit exercise, without significant between-trial differences in countermovement-jump height or subjective fatigue. Their cycling workload was selected to elicit a common heart-rate target of 120 beats·min−1, whereas the present study used each player’s HRFatmax. Continued contractile activity may have maintained muscle blood flow and increased lactate metabolism within active skeletal muscle, although these processes were not measured directly in the present study [26]. Recovery intensity also influences this response. Menzies et al. [4] reported the fastest lactate removal at 80–100% of the running velocity at the individually determined first lactate threshold (LT1), defined as the point at which blood lactate began to rise during incremental running. Baldari et al. [27] similarly found effective lactate removal during active recovery at and below the individual ventilatory threshold. In the present study, heart rate during active recovery averaged approximately 82% of HRVT1. This is consistent with a low-intensity, subthreshold recovery approach, although percentages of threshold heart rate cannot be equated with percentages of threshold running velocity. The use of each player’s measured Fatmax provided an individualized prescription and extends the evidence for individualized active recovery to repeated high-intensity skating blocks within a simulated ice hockey protocol.
These findings support Fatmax-informed cycling as an individualized strategy for increasing intermission lactate decrease relative to seated rest; whether it offers advantages over LT1-, VT1-, or other active-recovery prescriptions requires direct comparison.
However, previous studies have shown that active recovery can accelerate the decline in blood lactate concentration without necessarily improving subsequent performance [5,6]. The distinction between metabolic responses and performance is also illustrated by a soccer-specific simulation, in which lower blood lactate concentrations after a late versus early peak-intensity period coexisted with higher perceived exertion and similar decrements in sprint performance [28]. The present 15 min intervention was selected to fit within an approximately 18 min ice hockey intermission while allowing 3 min for skate preparation. The observed response therefore supports a short-term effect of active recovery on blood lactate concentration, while its implications for subsequent on-ice performance remain to be established.
Psychological fatigue and perceived performance showed exploratory interactions, but these patterns do not establish preserved readiness. Before the first recovery intervention, the AR trial already had higher psychological-fatigue and lower perceived-performance ratings. Differences in change therefore need to be interpreted alongside these imbalances, possible regression to the mean, and multiple testing. The study-specific single-item ratings were not validated measures of readiness, and participants could identify the intervention, allowing expectation effects. Future trials should assess perceptual recovery using validated instruments alongside direct performance measures [14,21].
No statistically significant recovery-condition effects were detected for the selected biomarkers, but these analyses do not establish equivalence or absence of additional physiological disturbance. Only nine players contributed complete blood data, several outcomes were tested, and IL-6 and hs-cTnT included observations at their reporting limits. Biomarker kinetics also differ: myoglobin responds relatively rapidly, whereas CK responses may extend beyond the 24 h observation window [21]. Sampling only at 30 min and 24 h may therefore miss relevant responses. Time effects in total protein and albumin further warrant caution when interpreting changes in circulating concentrations; hydration-related contributions cannot be excluded. The biomarker results should be treated as limited exploratory observations rather than evidence that the intervention is physiologically neutral.
The exploratory VO2peak analysis yielded a negative point estimate for the association with the active–passive difference in lactate decrease, although the confidence interval included zero. Roczniok et al. [29] reported that higher VO2max was associated with a greater post-exercise lactate decrease and faster between-shift heart-rate recovery in amateur ice hockey players. However, their study assessed recovery characteristics rather than the additional response to active versus passive recovery. Our finding therefore does not imply slower recovery in fitter players. Instead, it raises the hypothesis that the additional effect of active recovery on lactate decrease may vary with aerobic fitness. This hypothesis requires confirmation because our estimate was based on ten participants and was not statistically significant.
The practical strength of this study lies in its controlled, sport-specific model of recovery between periods of an ice hockey match. The repeated-skating protocol reproduced the number, duration, and spacing of shifts across three simulated periods, with each 18 min break including a 15 min recovery intervention and 3 min for skate preparation [2]. Cycling was deliberately selected as a feasible off-ice method of maintaining lower-limb activity without additional skating exposure. Previous hockey studies have used 15 min low-intensity cycling or bench stepping but reported inconsistent effects on blood lactate and subsequent skating [11,12]. Across sports, effective active-recovery intensities have ranged from approximately 35% of maximal oxygen uptake (VO2max) to individualized work rates at or below VT1 or the lactate threshold, with faster lactate decline reported closer to the lactate threshold in some protocols [4,27,30]. Recent basketball research also reported more favorable lactate and agility responses with active recovery combined with foam rolling than with active recovery combined with massage [31]. These combined interventions provide context for recovery-modality selection but differ from the present comparison of individualized cycling alone with passive recovery.
The use of cycling-derived HRVT2 to individualize skating intensity warrants consideration. Previous ice hockey research has used heart rates corresponding to ventilatory thresholds determined during cycling CPET to classify on-ice exercise intensity, supporting the practical application of laboratory-derived physiological reference values [32]. However, direct comparisons between exercise modalities have demonstrated differences in physiological threshold responses. duManoir et al. [33] reported a higher ventilatory threshold during skating treadmill exercise than during cycling, while Durocher et al. [34] found that the lactate threshold occurred at a higher percentage of maximal heart rate during on-ice skating compared with cycling. Although these findings do not directly establish differences in HRVT2, they highlight the limitations of transferring physiological thresholds between exercise modalities. Therefore, cycling-derived HRVT2 was used in the present study as an individualized reference for prescribing skating intensity rather than as a validated skating-specific threshold. Maintaining identical treadmill speed and incline within participants across both experimental conditions helped standardize mechanical settings.
The randomized crossover design and standardized skating-treadmill protocol supported paired within-player comparisons under controlled, sport-specific laboratory conditions and allowed recovery to be examined across two intermissions. Integrating individualized cycling with three skating periods, repeated physiological and perceptual assessments, and serial blood sampling enabled characterization of recovery across several complementary outcomes within the same players.
As a pilot feasibility study, however, the investigation provides preliminary effect estimates that require confirmation in a larger sample. The small cohort limits precision, and analyses across multiple outcomes were not adjusted for multiplicity. One participant had a prolonged between-trial interval due to injury recovery. Changes in training exposure or fitness over this interval may have affected the within-player comparison and cannot be excluded by adjustment for trial period.
Perceptual findings warrant particular caution because the study-specific items had no established measurement properties in this setting, participants could identify the intervention, and ratings differed before the first intermission. External workload and direct skating performance were not quantified, limiting conclusions about performance benefits. The short-stage and ramp CPET protocol may have limited gas-exchange stabilization and reduced the precision of Fatmax estimation, and substrate oxidation was not measured during recovery. Although at least 24 h separated CPET from the first experimental trial, residual effects of the preceding maximal test on baseline biomarker concentrations cannot be excluded. Blood lactate concentration changes describe the response to the tested intervention but do not distinguish lactate appearance from disposal or establish whether another active-recovery intensity would be more effective. Adherence to preparation instructions was assessed verbally, without detailed records of actual dietary intake or meal timing, and fluid intake was not quantified. Nutritional and hydration conditions therefore could not be confirmed as equivalent between visits.
Biomarker findings are further constrained by smaller complete-case samples, reporting-limit substitutions, and limited sampling schedules, with potential sensitivity to the missing-data mechanism and incomplete capture of marker-specific responses. Generalizability remains limited to male university-level players and the laboratory protocol studied. Although these findings do not establish equivalence or an optimal recovery prescription, they provide preliminary effect estimates and methodological guidance for a larger confirmatory trial.
5. Conclusions
In this randomized crossover pilot study, HRFatmax-targeted cycling produced a greater short-term decline in blood lactate concentration during simulated ice hockey intermissions than passive seated recovery, without detectable increases in subsequent internal exercise demand or measured biomarker responses. Exploratory perceptual findings warrant further investigation using validated measures of readiness. These findings support further evaluation of individualized cycling as an intermission strategy in a larger trial comparing active-recovery intensities and incorporating direct measures of skating performance.
Supplementary Materials
The following supporting information can be downloaded at: https://www.mdpi.com/article/10.3390/sports14110511/s1, Supplementary Methods S1: Perceptual items; Supplementary Table S1: Perceptual responses; Supplementary Table S2: Total protein, albumin, and uACR; Supplementary Figure S1: VO2peak and lactate recovery; Supplementary Figure S2: Total protein, albumin, and uACR; Table S3: Lactate before and after intermissions; Table S4: Trial-period sensitivity analysis; Table S5: Exploratory perceptual change contrasts; Table S6: Blood-biomarker time contrasts; Table S7: Analysis populations and missing samples; and Table S8: CPET work rates within the assessor-selected Fatmax band.
Author Contributions
Conceptualization and methodology, J.V. and P.B.; investigation, J.V., D.F., V.J. and P.B.; formal analysis, J.V. and P.B.; literature search, J.V. and V.J.; writing—original draft preparation, J.V.; supervision, A.K. and P.B.; funding acquisition, A.K. and P.B. All authors have read and agreed to the published version of the manuscript.
Funding
This work was supported by Charles University through grant SVV 260774 and the Cooperatio Program (research area: Immunity and Infection).
Institutional Review Board Statement
The study was conducted in accordance with the Declaration of Helsinki and approved by the Ethics Committee of the University Hospital Pilsen and the Faculty of Medicine in Pilsen, Charles University (Approval No. 336/24; 7 November 2024).
Informed Consent Statement
Written informed consent was obtained from all participants involved in the study.
Data Availability Statement
The anonymized data supporting the findings of this study are publicly available through Zenodo at https://zenodo.org/records/23010848 (accessed on 9 September 2026).
Acknowledgments
The authors warmly thank Anna Holíková for her invaluable assistance with blood and urine sample collection and her dedicated support throughout the study. During the preparation of this manuscript, the authors used ChatGPT (GPT-6.1; OpenAI) to generate illustrative elements for Figure 1 and to assist with manuscript formatting. Figure 1 was assembled using the web-based Canva application (v1.126.2; Canva Pty Ltd, Sydney, Australia); the version was not recorded. The authors reviewed and edited the AI-assisted content and take full responsibility for the content of this publication.
Conflicts of Interest
The authors declare no conflicts of interest.
References
- Vigh-Larsen, J.F.; Ermidis, G.; Rago, V.; Randers, M.B.; Fransson, D.; Nielsen, J.L.; Gliemann, L.; Piil, J.F.; Morris, N.B.; De Paoli, F.V.; et al. Muscle Metabolism and Fatigue during Simulated Ice Hockey Match-Play in Elite Players. Med. Sci. Sports Exerc. 2020, 52, 2162–2171. [Google Scholar] [CrossRef] [Scilit] [PubMed]
- Vigh-Larsen, J.F.; Mohr, M. The Physiology of Ice Hockey Performance: An Update. Scand. J. Med. Sci. Sports 2024, 34, e14284. [Google Scholar] [CrossRef] [Scilit] [PubMed]
- Kojima, C.; Morishima, T.; Ito, R.; Yasunaga, S.; Shimogaki, T.; Hashimoto, T.; Isaka, T.; Iemitsu, M. Blood and Salivary Lactate Responses to Active Rest Following Circuit Exercise. Front. Physiol. 2025, 16, 1534668. [Google Scholar] [CrossRef] [Scilit] [PubMed]
- Menzies, P.; Menzies, C.; McIntyre, L.; Paterson, P.; Wilson, J.; Kemi, O.J. Blood Lactate Clearance during Active Recovery after an Intense Running Bout Depends on the Intensity of the Active Recovery. J. Sports Sci. 2010, 28, 975–982. [Google Scholar] [CrossRef] [Scilit] [PubMed]
- Monedero, J.; Donne, B. Effect of Recovery Interventions on Lactate Removal and Subsequent Performance. Int. J. Sports Med. 2000, 21, 593–597. [Google Scholar] [CrossRef] [Scilit] [PubMed]
- Ouergui, I.; Hammouda, O.; Chtourou, H.; Gmada, N.; Franchini, E. Effects of Recovery Type after a Kickboxing Match on Blood Lactate and Performance in Anaerobic Tests. Asian J. Sports Med. 2014, 5, 99–107. [Google Scholar] [PubMed]
- Van Hooren, B.; Peake, J.M. Do We Need a Cool-Down After Exercise? A Narrative Review of the Psychophysiological Effects and the Effects on Performance, Injuries and the Long-Term Adaptive Response. Sports Med. 2018, 48, 1575–1595. [Google Scholar] [CrossRef] [Scilit] [PubMed]
- Ortiz, R.O., Jr.; Sinclair Elder, A.J.; Elder, C.L.; Dawes, J.J. A Systematic Review on the Effectiveness of Active Recovery Interventions on Athletic Performance of Professional-, Collegiate-, and Competitive-Level Adult Athletes. J. Strength. Cond. Res. 2019, 33, 2275–2287. [Google Scholar] [CrossRef] [Scilit] [PubMed]
- Achten, J.; Gleeson, M.; Jeukendrup, A.E. Determination of the Exercise Intensity That Elicits Maximal Fat Oxidation. Med. Sci. Sports Exerc. 2002, 34, 92–97. [Google Scholar] [CrossRef] [Scilit] [PubMed]
- Achten, J.; Jeukendrup, A.E. Relation between Plasma Lactate Concentration and Fat Oxidation Rates over a Wide Range of Exercise Intensities. Int. J. Sports Med. 2004, 25, 32–37. [Google Scholar] [CrossRef] [Scilit] [PubMed]
- Watson, R.C.; Hanley, R.D. Application of Active Recovery Techniques for a Simulated Ice Hockey Task. Can. J. Appl. Sport Sci. 1986, 11, 82–87. [Google Scholar] [PubMed]
- Lau, S.; Berg, K.; Latin, R.W.; Noble, J. Comparison of Active and Passive Recovery of Blood Lactate and Subsequent Performance of Repeated Work Bouts in Ice Hockey Players. J. Strength. Cond. Res. 2001, 15, 367–371. [Google Scholar] [CrossRef] [Scilit]
- Burr, J.F.; Slysz, J.T.; Boulter, M.S.; Warburton, D.E.R. Influence of Active Recovery on Cardiovascular Function During Ice Hockey. Sports Med. Open 2015, 1, 27. [Google Scholar] [CrossRef] [Scilit] [PubMed]
- Kellmann, M.; Bertollo, M.; Bosquet, L.; Brink, M.; Coutts, A.J.; Duffield, R.; Erlacher, D.; Halson, S.L.; Hecksteden, A.; Heidari, J.; et al. Recovery and Performance in Sport: Consensus Statement. Int. J. Sports Physiol. Perform. 2018, 13, 240–245. [Google Scholar] [CrossRef] [Scilit] [PubMed]
- Michalik, K.; Danek, N.; Zatoń, M. Comparison of the Ramp and Step Incremental Exercise Test Protocols in Assessing the Maximal Fat Oxidation Rate in Youth Cyclists. J. Hum. Kinet. 2021, 80, 163–172. [Google Scholar] [CrossRef] [Scilit] [PubMed]
- Purge, P.; Lehismets, P.; Jürimäe, J. A New Method for the Measurement of Maximal Fat Oxidation: A Pilot Study. Acta Kinesiol. Univ. Tartu. 2014, 20, 90–99. [Google Scholar] [CrossRef] [Scilit]
- Lowery, M.R.; Tomkinson, G.R.; Peterson, B.J.; Fitzgerald, J.S. The Relationship between Ventilatory Threshold and Repeated-Sprint Ability in Competitive Male Ice Hockey Players. J. Exerc. Sci. Fit. 2018, 16, 32–36. [Google Scholar] [CrossRef] [Scilit] [PubMed]
- Stanula, A.J.; Gabryś, T.T.; Roczniok, R.K.; Szmatlan-Gabryś, U.B.; Ozimek, M.J.; Mostowik, A.J. Quantification of the Demands During an Ice-Hockey Game Based on Intensity Zones Determined From the Incremental Test Outcomes. J. Strength. Cond. Res. 2016, 30, 176–183. [Google Scholar] [CrossRef] [Scilit] [PubMed]
- Borg, G. Borg’s Perceived Exertion and Pain Scales; Human Kinetics: Champaign, IL, USA, 1998. [Google Scholar]
- Nässi, A.; Ferrauti, A.; Meyer, T.; Pfeiffer, M.; Kellmann, M. Development of Two Short Measures for Recovery and Stress in Sport. Eur. J. Sport Sci. 2017, 17, 894–903. [Google Scholar] [CrossRef] [Scilit] [PubMed]
- Haller, N.; Behringer, M.; Reichel, T.; Wahl, P.; Simon, P.; Krüger, K.; Zimmer, P.; Stöggl, T. Blood-Based Biomarkers for Managing Workload in Athletes: Considerations and Recommendations for Evidence-Based Use of Established Biomarkers. Sports Med. 2023, 53, 1315–1333. [Google Scholar] [CrossRef] [Scilit] [PubMed]
- Nowakowska, A.; Kostrzewa-Nowak, D.; Buryta, R.; Nowak, R. Blood Biomarkers of Recovery Efficiency in Soccer Players. Int. J. Environ. Res. Public Health 2019, 16, 3279. [Google Scholar] [CrossRef] [Scilit] [PubMed]
- Pérez-Castillo, Í.M.; Rueda, R.; Bouzamondo, H.; López-Chicharro, J.; Mihic, N. Biomarkers of Post-Match Recovery in Semi-Professional and Professional Football (Soccer). Front. Physiol. 2023, 14, 1167449. [Google Scholar] [CrossRef] [Scilit] [PubMed]
- Draper, N.; Bird, E.L.; Coleman, I.; Hodgson, C. Effects of Active Recovery on Lactate Concentration, Heart Rate and RPE in Climbing. J. Sports Sci. Med. 2006, 5, 97–105. [Google Scholar] [PubMed]
- Nalbandian, H.M.; Radak, Z.; Takeda, M. Active Recovery between Interval Bouts Reduces Blood Lactate While Improving Subsequent Exercise Performance in Trained Men. Sports 2017, 5, 40. [Google Scholar] [CrossRef] [Scilit] [PubMed]
- Bangsbo, J.; Graham, T.; Johansen, L.; Saltin, B. Muscle Lactate Metabolism in Recovery from Intense Exhaustive Exercise: Impact of Light Exercise. J. Appl. Physiol. 1994, 77, 1890–1895. [Google Scholar] [CrossRef] [Scilit] [PubMed]
- Baldari, C.; Videira, M.; Madeira, F.; Sergio, J.; Guidetti, L. Lactate Removal during Active Recovery Related to the Individual Anaerobic and Ventilatory Thresholds in Soccer Players. Eur. J. Appl. Physiol. 2004, 93, 224–230. [Google Scholar] [CrossRef] [Scilit] [PubMed]
- Vigh-Larsen, J.F.; Ørtenblad, N.; Stoltz, V.; Fransson, D.; Yousefian, F.; Panduro, J.; Randers, M.B.; Ehlers, T.S.; Krustrup, P.; Mohr, M. Muscle Metabolism and Performance During Simulated Peak-Intensity Periods Occurring Early and Late in a Soccer-Specific Exercise Protocol in Well-Trained Male Players. Scand. J. Med. Sci. Sports 2025, 35, e70075. [Google Scholar] [CrossRef] [Scilit] [PubMed]
- Roczniok, R.; Terbalyan, A.; Stastny, P.; Zielonka, H.; Manilewska, D.; Ornowski, K.; Blaha, M.; Pietraszewski, P. The Relationship Between Aerobic Capacity, Lactate Clearance, and Heart Rate Recovery in Ice Hockey Players. Appl. Sci. 2025, 15, 10310. [Google Scholar] [CrossRef] [Scilit]
- Dodd, S.; Powers, S.K.; Callender, T.; Brooks, E. Blood Lactate Disappearance at Various Intensities of Recovery Exercise. J. Appl. Physiol. Respir. Environ. Exerc. Physiol. 1984, 57, 1462–1465. [Google Scholar] [CrossRef] [Scilit] [PubMed]
- Maan, K.S.; Yadav, R.C. Comparative Evaluation of Recovery Interventions—Individually and in Combination—On Lactate Clearance and Physical Performance Metrics Following 3 versus 3 Basketball Matches. J. Bodyw. Mov. Ther. 2025, 42, 431–440. [Google Scholar] [CrossRef] [Scilit] [PubMed]
- Stanula, A.; Roczniok, R. Game Intensity Analysis of Elite Adolescent Ice Hockey Players. J. Hum. Kinet. 2014, 44, 211–221. [Google Scholar] [CrossRef] [Scilit] [PubMed]
- duManoir, G.R.; Coughlin, M.A.; Lovshin, J.A.; Boulay, M.R. Comparison of Maximal Oxygen Uptake and Ventilatory Threshold During Skating, Running and Cycling Exercise in Ice Hockey Players. Adv. Exerc. Sports Physiol. 2005, 11, 9–14. [Google Scholar]
- Durocher, J.J.; Guisfredi, A.J.; Leetun, D.T.; Carter, J.R. Comparison of On-Ice and off-Ice Graded Exercise Testing in Collegiate Hockey Players. Appl. Physiol. Nutr. Metab. 2010, 35, 35–39. [Google Scholar] [CrossRef] [Scilit] [PubMed]

Disclaimer/Publisher’s Note: The statements, opinions and data contained in all publications are solely those of the individual author(s) and contributor(s) and not of MDPI and/or the editor(s). MDPI and/or the editor(s) disclaim responsibility for any injury to people or property resulting from any ideas, methods, instructions or products referred to in the content. |
© 2026 by the authors. Licensee MDPI, Basel, Switzerland. This article is an open access article distributed under the terms and conditions of the Creative Commons Attribution (CC BY) license.