


Abstract
Background/Objectives: Sex- and category-specific body-composition references are scarce for Latin American and female football players. We used dual-energy X-ray absorptiometry (DXA), which quantifies lean soft tissue, fat, and bone mineral content (BMC) regionally in one low-dose scan, to describe body composition across Mexican national squads and to explore associations with playing position. Methods: We analyzed 272 DXA records acquired in 2026 under one standardized protocol (females: n = 133, under-15 [U15] to senior; males: n = 139, under-14 [U14] to senior) using 95% confidence intervals and height-adjusted, sex-stratified linear models with heteroscedasticity-consistent (HC3) standard errors and Holm correction. Results: Senior squads had 8.83 kg (females) and 13.23 kg (males) more total lean mass than the youngest category (Hedges’ g > 2) and 6.32 and 2.59 percentage points less body fat. Male fat mass was similar across categories (10.4–11.7 kg), suggesting that the lower body-fat percentage of older male squads reflected greater lean mass; in females, it reflected both greater lean mass and lower fat mass. Category remained associated with lean mass and BMC after height adjustment (Holm-adjusted p < 0.001) but was not significantly associated with male body-fat percentage (p = 0.118). No association between position and body composition was observed in females; male forwards had more lean mass and less fat than goalkeepers. Conclusions: These preliminary cross-sectional references allow staff to benchmark players against their own squad and to flag atypical lean or bone values for multidisciplinary review; they are not developmental trajectories or body-composition targets.
1. Introduction
Body composition is monitored in association football because it relates to health, training tolerance, recovery, and performance [1,2]. However, its value as a target is limited. A critical review by a subgroup of the International Olympic Committee (IOC) consensus on Relative Energy Deficiency in Sport (REDs) found that gains in muscle mass benefit performance across sports. The same review found that body composition did not contribute to early talent identification and that no single cut-off value signals a performance advantage [3]. These cautions concern the use of values as targets, not the measurement itself. Whole-body and regional assessment quantifies the lean-tissue response to training, detects inter-limb asymmetries relevant to injury risk and return to play, and identifies players whose values fall outside their reference group [4,5,6]. Lower-limb lean mass relates to sprint, jump, and kicking performance in football players [6,7], and whole-body bone mineral content (BMC) is a health-monitoring signal in young and female athletes [8,9]. Dual-energy X-ray absorptiometry (DXA) estimates total and regional lean soft tissue, fat mass, and BMC in a single low-dose scan [4]. In team-sport athletes, its precision is high for lean mass and BMC and acceptable for fat mass [10], provided that food and fluid intake, prior exercise, and positioning are standardized. Without such control, the random error of lean-tissue change scores roughly doubles [11]. Because absolute values differ between assessment methods and between DXA manufacturers [12,13], studies can only be compared when they used the same device, software, preparation, and analysis protocol [12].
Most DXA evidence in football comes from male professional squads. In English Premier League players, goalkeepers differed from outfield players, whereas outfield positions were largely homogeneous [14]. Within one club, the first team had more lean mass than the under-21 and under-18 squads but similar fat mass, so its lower body-fat percentage reflected greater lean mass rather than less fat [15]. Body composition also changes along the age pathway. During the adolescent growth spurt, lean mass and BMC accrue rapidly, and body-fat percentage falls in boys but rises in girls [16,17,18]. In male youth players, 12-month gains in lean mass and bone mineral are largest around peak height velocity (PHV) [19], and lean mass continues to increase into the early twenties. Age-category squads therefore differ for reasons that combine maturation, growth, training exposure, and selection rather than training alone [15,16,20]. Selection into representative squads favors relatively older and earlier-maturing players, whose transient advantage in size and lean mass inflates between-category differences [16,21,22,23]. Cross-sectional contrasts between categories can describe a program as it is, but they cannot show how individual athletes develop. Similarly, apparent position effects may partly reflect stature, category distribution, or selection rather than an independent positional influence [24].
Evidence in female football is scarcer. Research on female players has concentrated on match demands and physical capacity [25], whereas body composition, talent identification, relative age, and maturation remain understudied [26]. Male-derived reference values cannot simply be transferred to female squads. The female pathway differs in the timing of puberty, the direction of adolescent fat accrual, and the prevalence of low energy availability and its consequences for bone [9,27]. The few DXA datasets in female players describe single collegiate, professional, or national senior squads, in which lean mass increased and body-fat percentage decreased over a season or a collegiate career [28,29,30,31]. The squads that feed a women’s national team, from under-15 to under-23, therefore have no category-specific DXA references, and staff currently interpret individual scans against adult or male data. Bone deserves specific attention in this population. Football provides osteogenic loading during growth [8], and elite female players typically show high bone mineral density [31]. However, low bone mass is one of the health consequences of problematic low energy availability [9], and reduced or low energy availability was observed in most players of a professional female squad during a competitive season [27]. Category-specific BMC values can therefore serve a health-monitoring function in addition to a descriptive one.
Reference data suitable for this setting are limited. Sport-specific DXA percentiles were derived from Portuguese athletes of many sports [32], and population references [17,18] do not reflect the physique of trained players. Moreover, the relationship between body size and adiposity differs between ancestries, and Mexican-American individuals show higher body-fat percentages than non-Hispanic white individuals of the same age in DXA population data [17,33]. Population- and sport-specific benchmarks are therefore needed that cover both sexes and the full age pathway under one acquisition protocol, so that each player can be interpreted against the squad she or he competes for. Within the Mexican Football Federation, previous work developed an anthropometric equation for body fat against DXA in the senior women’s national team [34] and related anthropometric profile to jump performance and match load in national-team players [35]. To our knowledge, no study has described DXA-derived body composition across the full female and male national-team pathway of any federation.
The primary objective of this study was therefore to describe sex- and age-category-specific DXA-derived body-composition profiles, including regional (arm, leg, and trunk) lean mass, fat mass, and BMC, in Mexican national football squads assessed during 2026, as a baseline for internal monitoring. The secondary, exploratory objectives were to examine whether playing position was associated with total lean mass, leg lean mass, BMC, or body-fat percentage after accounting for category and height, and to quantify how these outcomes related to chronological age between and within categories. Analyses were stratified by sex; no inferential comparison between females and males was planned because the category structures were not identical. The study was designed to provide baseline descriptive references; it does not aim to provide mechanistic or developmental insights, which require longitudinal designs with direct maturity assessment.
2. Materials and Methods
2.1. Study Design and Setting
This was an observational, cross-sectional study with a descriptive primary aim and secondary exploratory multivariable analyses, reported according to the Strengthening the Reporting of Observational Studies in Epidemiology (STROBE) recommendations for cross-sectional studies [36]. Assessments were conducted within the performance program of the Mexican national teams between February and August 2026 at the High-Performance Centre (Centro de Alto Rendimiento; CAR) of the Mexican Football Federation in Mexico City, which provides controlled laboratory conditions for body-composition assessment [34]. Assessments were part of routine athlete monitoring and were scheduled during national-team training camps. The unit of analysis was one DXA evaluation record. The study design, data flow, measurement protocol, and analyses are summarized in Figure 1.
Figure 1.
Schematic overview of the study design, eligibility, squads, standardized DXA acquisition protocol, outcomes, and statistical analyses, reported according to STROBE [36], with quality assurance and pediatric scanning following the ISCD positions [37,38] and maturity offset estimated with the equations of Moore et al. [39]. DXA, dual-energy X-ray absorptiometry; ALMI, appendicular lean mass index; BMC, bone mineral content; CAR, Centro de Alto Rendimiento; CI, confidence interval; FMI, fat mass index; HC3, heteroscedasticity-consistent covariance estimator type 3; ISCD, International Society for Clinical Densitometry; LOWESS, locally weighted scatterplot smoothing; OLS, ordinary least squares; PHV, peak height velocity; QA, quality assurance; SD, standard deviation; STROBE, Strengthening the Reporting of Observational Studies in Epidemiology; U14–U23, under-14 to under-23; UAM, Universidad Autónoma Metropolitana.
2.2. Participants and Data Source
The analytic dataset comprised 272 complete records: 133 female records from the under-15 (U15), under-17 (U17), under-20 (U20), under-23 (U23), and senior squads, and 139 male records from the under-14 (U14), U15, U17, U20, U23, and senior squads. Categories followed the age-eligibility rules used by the federation for national-team competition; no female U14 squad was assessed. Inclusion criteria were (i) a current call-up to a Mexican national-team squad during the 2026 assessment period, (ii) attendance at the squad’s scheduled body-composition assessment at the CAR, and (iii) a complete whole-body DXA scan free of positioning or movement artifacts. No additional exclusion criteria were applied by design: the aim was to describe each squad as selected by the technical staff, and excluding players on the basis of injury status, maturity, or body composition would have produced a subsample that no longer represents the squads for which the references are intended. No scan had to be discarded for quality reasons, so the eligible and analytic samples coincide. Study size was determined by the number of athletes called up and assessed within the program, and no a priori sample-size calculation was performed. Following precision-based planning principles [40], we report the precision achieved: with 21–28 records per category, the 95% confidence interval (CI) half-width for a category mean is 0.39–0.46 standard deviations (SD), and the minimal detectable standardized difference between two categories at 80% power (two-sided α = 0.05) is approximately 0.8 SD (1.1 SD for the goalkeeper–forward contrast in males). Smaller differences are therefore reported with their CIs but could not be detected reliably.
Playing position was classified as goalkeeper, defender, midfielder, or forward according to the position assigned by the technical staff of each squad (Table 1). Athlete identifiers confirmed that the 133 female records corresponded to 133 distinct athletes. The male data files did not include a persistent identifier across squads. Because a player may be called up to more than one category within a season, we screened all cross-squad pairs of male records for an identical implied birth date (evaluation date minus decimal age, both recorded to the day) together with anthropometric consistency. Only one pair shared a birth date, and these two records differed by 16 cm in stature and 14 kg in body mass and therefore belonged to different athletes. In addition, the male U15 and U17 squads and the U20 and U23 squads were assessed on the same dates, which precludes duplication within these pairs of categories. We therefore found no evidence that any male athlete contributed more than one record, and all 139 male records were treated as distinct athletes; because this conclusion rests on inferred rather than recorded identity, it is retained as a minor limitation.
Table 1.
Analytic records, age range, and playing-position distribution by sex and category.
2.3. DXA Acquisition
Whole-body scans were acquired with a Lunar iDXA densitometer (GE Healthcare, Madison, WI, USA) in standard scan mode and analyzed using the GE enCORE software platform (version 18; GE Healthcare, Madison, WI, USA). The scanner’s daily quality-assurance procedure (calibration block/phantom scan) was performed before athlete measurements on every scanning day, as recommended by the manufacturer and the International Society for Clinical Densitometry (ISCD) [37]; all quality-control results were within the manufacturer’s tolerance, and no scanner recalibration, hardware service, or software change occurred during the assessment period. All squads were scanned on the same device in the same laboratory, and all scans were acquired and analyzed by the same trained technician, so that device-, software-, and operator-related variance was held constant across categories and sexes. Participants wore close-fitting Lycra clothing, removed all metal objects, and were positioned supine and centered within the scan field following standardized procedures for athletes [4]. Timing and preparation were standardized identically for every squad: scans were scheduled in the morning session at the start of the training-camp day, before breakfast and before the first training session, after an overnight fast and bladder voiding, and with no strenuous exercise in the preceding 12 h. Players were required to reside in national-team camps, where staff coordinated meals, training, and travel schedules to ensure that all squads were scanned before the first meal and training session of the day. Compliance with these instructions was verified verbally by the technician immediately before each scan using a standardized pre-scan checklist (time of last meal and fluid intake, time of last training session, bladder voiding); players who did not meet the conditions were rescheduled within the camp. No biochemical verification of hydration status was performed except in the senior female squad (see below). These conditions limit the biological error introduced by food and fluid intake and recent exercise [11,41]. The in vivo precision of the iDXA for total-body composition in adults is 0.5% for lean mass, 0.6% for BMC, and 0.9% for body-fat percentage [42].
In the senior female squad, hydration status was assessed before DXA by salivary osmolality with the MX3 Hydration Testing System (MX3 Diagnostics, Austin, TX, USA); values of 65–100 mOsm/L were required, and all screened players met this criterion [34]. This screening was implemented because the senior women’s camp coincided with a parallel project that validated an anthropometric body-fat equation against DXA and required a defined hydration state [34]; the device was not available at the other camps, so for the remaining squads, hydration was standardized procedurally (overnight fast, morning scan, voiding) rather than verified biochemically. This asymmetry is acknowledged as a limitation. Stretch stature was measured to the nearest 1 mm using a portable stadiometer (SECA® 217, SECA GmbH & Co. KG, Hamburg, Germany), and body mass was measured to the nearest 50 g using a calibrated digital scale (SECA® 874, SECA GmbH & Co. KG, Hamburg, Germany), both immediately before the scan.
2.4. Ethical and Radiation-Safety Safeguards
The DXA assessments were part of the routine medical and nutritional monitoring program of the national teams: they were requested and supervised by the Federation’s sports-nutrition and medical staff as part of athlete care, and were not performed solely for research purposes. The research use of the de-identified records was approved by the Research Ethics Committee of the Universidad Autónoma Metropolitana, Xochimilco Unit (reference DCBS.CD.071.2), under a protocol registered at ClinicalTrials.gov (NCT06941064), in accordance with the Declaration of Helsinki and the Regulations of the General Health Law for Health Research in Mexico. Written informed consent was obtained from all adult players; for players younger than 18 years, written informed consent was obtained from a parent or legal guardian, and the player provided written assent after an age-appropriate explanation. The effective dose of a whole-body iDXA scan in standard mode is in the low-microsievert range (below 10 µSv, a small fraction of the daily natural background exposure) [43], and pediatric scanning followed the ISCD pediatric positions (whole-body acquisition, standard mode, a single acquisition per assessment, and interpretation by trained staff) [38]. No player was scanned more than once within the study period.
2.5. Outcomes
The prespecified outcomes were stature (cm), body mass (kg), total lean mass (kg), leg lean mass (kg), whole-body BMC (kg), and body-fat percentage. Total lean mass corresponds to lean soft tissue excluding bone mineral; it was analyzed instead of fat-free mass because DXA separates lean soft tissue from BMC and both compartments were of interest. Leg lean mass was the sum of the right and left leg regions defined by the default regions of interest of the analysis software, and body-fat percentage was taken as reported by the software. To provide a comprehensive regional assessment, the regional outcomes exported by the software were also analyzed: arm lean mass (sum of both arms, kg), trunk lean mass (kg), appendicular lean mass (arms plus legs, kg) and the appendicular lean mass index (appendicular lean mass/height2, kg/m2), fat mass (kg) and the fat mass index (kg/m2), and the lean mass index (total lean mass/height2, kg/m2) for comparison with published cohorts [44]. Regional values are expressed in absolute terms and as a percentage of total lean soft tissue. Chronological age at assessment was summarized descriptively and was not modeled as a covariate because it is almost collinear with category; its correlation with each outcome was instead examined in a secondary analysis (Section 2.8).
2.6. Estimated Somatic Maturity (Post Hoc)
Biological maturation was not assessed prospectively: sitting height, parental height, and skeletal age were not collected within the monitoring program. To characterize the maturational position of the youth squads, we estimated maturity offset (years from PHV) post hoc with the sex-specific age × height equations of Moore et al. [39] (boys: −7.999994 + 0.0036124 × age × height; girls: −7.709133 + 0.0042232 × age × height, with age in years and height in cm) and derived the predicted age at PHV as chronological age minus maturity offset. Players were classified as pre-PHV (offset < −1 y), circa-PHV (−1 to +1 y), or post-PHV (>+1 y). These equations have well-documented limitations: the prediction error increases with distance from PHV, predictions regress toward the mean (early maturers are predicted later and late maturers earlier than their true timing), and within a narrow age band, the estimate is largely a function of stature [45]. Maturity estimates were therefore used only to describe the maturational status of the U14–U17 squads and to illustrate within-squad heterogeneity; they were not entered as covariates, and the models adjusted for height are to be read as adjusting for body size, not for biological maturity.
2.7. Data Management and Quality Control
Column labels and playing-position terms were harmonized across data files. Female U15–U23 BMC values exported in grams were converted to kilograms, and senior female body-fat values exported as proportions were converted to percentages; all converted values were checked against physiologically plausible ranges and against the original DXA reports. Regional lean values were additionally checked for internal consistency (arm + leg + trunk + head lean soft tissue equal to total lean soft tissue; regional proportions within physiological ranges). No values were missing for the core outcomes. Evaluation dates were available for 79 out of 133 female records and for all 139 male records; all evaluations took place in 2026. Playing position was available for all female records and for 93 male records; positions were not recorded for the male U15 and U17 squads.
2.8. Statistical Analysis
The primary analysis was descriptive. Continuous variables are reported as mean ± SD, with 95% CIs for means based on the t distribution (mean ± t0.975, n − 1 × SD/√n). Because each age category comprised a different squad, category estimates were not connected or described as within-athlete change. To express the magnitude of the difference between the youngest category and the senior squad, Hedges’ g with 95% CI was calculated from the pooled SD, and its absolute value was interpreted with the scale of Hopkins et al. [46]: trivial, <0.20; small, 0.20–0.59; moderate, 0.60–1.19; large, 1.20–1.99; very large, 2.00–3.99; and extremely large, ≥ 4.00. The lower limit of each band is inclusive (e.g., g = 0.60 is moderate), and the same labels are used throughout the text and tables. Hedges’ g was computed as the mean difference divided by the pooled SD and multiplied by the small-sample correction factor J = 1 − 3/[4(n1 + n2) − 9]; its 95% CI was obtained as g ± 1.96 × SE(g), with the standard error SE(g) = √[(n1 + n2)/(n1n2) + g2/(2(n1 + n2))] [47]. The same statistic was calculated for each pair of adjacent categories to locate where the largest between-squad differences occurred; these descriptive contrasts were not tested for significance. All standardized differences cited in the Results are tabulated: those for the primary outcomes, between adjacent categories and between the youngest and senior squads, are given in Section 3.4, , and those for the regional outcomes and height-normalized indices in Table S4. Pearson correlations with chronological age are displayed for the primary outcomes in Section 3.6; ; those for the arm and trunk lean mass, which were secondary, are reported in the text only to avoid an additional figure of near-identical panels.
Secondary analyses were performed separately by sex. For body mass, total lean mass, leg lean mass, BMC, and body-fat percentage, ordinary least-squares models included category as a categorical term and height as a continuous covariate. Height was included because stature differed across categories and scales absolute lean and bone mass; height-normalized indices such as the lean mass index [44] offer an alternative that assumes a fixed scaling exponent, which covariate adjustment does not. Global category effects were assessed with Wald tests using heteroscedasticity-consistent (HC3) covariance estimates [48], which remain valid when residual variance differs between squads of unequal size. Specifically, the global test was a Wald χ2 test of the joint null hypothesis that all category (or position) indicator coefficients equal zero, with degrees of freedom equal to the number of indicators and the HC3 covariance matrix as the variance estimate; 95% CIs for coefficients and linear contrasts were Wald intervals computed as estimate ± 1.96 × HC3 standard error. This is the large-sample inference implemented by default in the statsmodels library when a robust covariance estimator is requested. Because several subgroups were small (21–28 records per category and 10 male goalkeepers), all global tests were repeated as F tests with residual degrees of freedom and all contrasts with t quantiles as a small-sample sensitivity analysis; conclusions that changed under this analysis are reported explicitly. Pairwise contrasts between categories from the height-adjusted models were Holm-adjusted within each outcome (10 contrasts in females, 15 in males) and are reported in the Supplementary Materials (Table S1). The additional regional outcomes (arm lean mass, trunk lean mass, and fat mass) were analyzed with identical models as a separate family of three outcomes (Table S2), so that the prespecified families and their Holm adjustments remained unchanged. Residual distributions were inspected graphically, and no influential observations required exclusion.
Position models used total lean mass, leg lean mass, BMC, and body-fat percentage as outcomes and included position, category, and height as predictors. Category-by-position interactions were not estimated because several cells were small and position data were unavailable for the male U15 and U17 squads. The Holm procedure controlled the familywise error rate across outcomes within each sex and analysis family [49]: five outcomes in the category family and four in the position family. When an omnibus position effect remained significant, pairwise contrasts between positions were Holm-adjusted within that outcome. Two-sided adjusted p < 0.05 was considered statistically significant. Adjusted position means were standardized to the observed category and height distributions within each sex-specific position sample. The association between chronological age and each outcome was quantified with Pearson’s r (95% CI from Fisher’s z transformation) across all records within each sex and with within-category correlations computed after centering age and the outcome on their category means, which separates the between-category component of the age association from the within-squad component; locally weighted scatterplot smoothing (LOWESS, span 0.6) was used to visualize the shape of the age relationships without imposing linearity. The magnitude of correlation coefficients was interpreted with the corresponding scale [46]: trivial, |r| < 0.10; small, 0.10–0.29; moderate, 0.30–0.49; large, 0.50–0.69; very large, 0.70–0.89; and extremely large, ≥0.90. Analyses were conducted in Python 3.13.16 (Python Software Foundation, Wilmington, DE, USA) with NumPy 2.5.3, pandas 3.0.5, SciPy 1.18.1, and statsmodels 0.15.0; figures were produced with Matplotlib 3.11.2.
3. Results
3.1. Sample Composition
All 272 records had complete values for the six primary descriptive variables. Position analyses included 133 female and 93 male records. The smallest position subgroup was male goalkeepers (n = 10 across categories with recorded position); female goalkeepers numbered 16. Midfielders and defenders were the most frequent positions in both sexes (Table 1).
3.2. Estimated Maturity Status of the Youth Squads
Estimated maturity offset and predicted age at PHV for the U14–U17 squads are given in Table S3 and Figure S1. The male U14 squad was, on average, approximately six months after estimated PHV (offset 0.54 ± 0.38 y; range −0.06 to 1.39 y): 21 out of 23 players were classified as circa-PHV and 2 as post-PHV, with a predicted age at PHV of 13.3 ± 0.4 y (range 12.7–14.1 y). The male U15 (1.70 ± 0.44 y) and U17 squads (3.01 ± 0.39 y) were entirely post-PHV. Both female youth squads were also post-PHV (U15: 2.43 ± 0.45 y, range 1.63–3.17 y, predicted age at PHV 12.4 ± 0.4 y; U17: 3.58 ± 0.51 y). Within the male U14 squad, estimated maturity offset correlated with total lean mass (r = 0.88), leg lean mass (r = 0.87), and BMC (r = 0.78) almost as strongly as stature did (r = 0.90 and 0.83 for lean mass and BMC), and the coefficient of variation of total lean mass was higher in U14 (12.2%) than in U15 (8.0%) or U17 (6.5%). Together, these estimates suggest that the U14 squad was assessed during the period of maximal maturational heterogeneity and that between-player variation in lean and bone mass within that squad is likely to be largely a function of body size and maturational timing.
3.3. Category Profiles
In females, mean total lean mass ranged from 38.90 ± 3.48 kg in U15 to 47.73 ± 4.15 kg in the senior squad; mean leg lean mass ranged from 13.08 ± 1.57 to 16.35 ± 1.60 kg, BMC from 2.27 ± 0.24 to 2.99 ± 0.34 kg, and body fat from 27.01 ± 2.64% to 20.69 ± 3.57% (Table 2; Figure 2). The corresponding differences between the U15 and senior squads (Section 3.4) were +8.83 kg (Hedges’ g = 2.27, 95% CI 1.58 to 2.96), +3.27 kg (g = 2.03, 1.37 to 2.70), +0.72 kg (g = 2.40, 1.70 to 3.11), and −6.32 percentage points (g = −1.98, −2.63 to −1.32), respectively; all were large or very large.
Table 2.
Female DXA-derived profiles by national-team category.
Figure 2.
Means and 95% CIs for DXA-derived outcomes by sex and national-team category (circles, female; squares, male). Points are not connected because each category is a different squad. No female U14 squad was assessed. (A) Height; (B) body mass; (C) total lean mass; (D) leg lean mass; (E) whole-body BMC; (F) body-fat percentage. Symbols summarize the height-adjusted pairwise contrasts from the sex-stratified models (Table S1; Holm-adjusted p < 0.05): * different from the youngest category of the same sex; † different from the immediately preceding category (marked only when that category is not the youngest). Height (A) was not modeled; plotted means and CIs are unadjusted. BMC, bone mineral content; CI, confidence interval; DXA, dual-energy X-ray absorptiometry; U14–U23, under-14 to under-23.
In males, mean total lean mass ranged from 48.84 ± 5.95 kg in U14 to 62.07 ± 6.00 kg in the senior squad; mean leg lean mass ranged from 16.58 ± 2.43 to 21.31 ± 2.53 kg, BMC from 2.73 ± 0.32 to 3.48 ± 0.41 kg, and body fat from 17.54 ± 2.73% to 14.95 ± 3.11% (Table 3; Figure 2). The corresponding differences between the U14 and senior squads (Section 3.4) were +13.23 kg (g = 2.18, 1.47 to 2.89), +4.73 kg (g = 1.87, 1.20 to 2.55), +0.75 kg (g = 1.99, 1.31 to 2.68), and −2.59 percentage points (g = −0.87, −1.45 to −0.28), so the body-fat difference was moderate, in contrast to the large to very large lean-mass and BMC differences. Differences were not strictly ordered by category: female BMC was lower in U20 than in U17, and the male U23 squad had lower lean mass and higher body fat than the U20 squad. These contrasts compare different squads and must not be interpreted as individual changes.
Table 3.
Male DXA-derived profiles by national-team category.
Regional lean mass followed the same pattern as total lean mass (Table 4; Figure 3; standardized differences in Table S4). The proportional distribution of lean soft tissue was stable across categories in both sexes (legs ≈ 34%, trunk ≈ 47–50%, arms ≈ 9–13% of total lean mass), which suggests similar regional proportions rather than regional redistribution along the pathway; the arm share increased slightly in both sexes (from 9.4% in U15 to 10.6% in the senior squad in females and from 11.7% in U14 to 12.7% in U20 in males). Between the youngest and senior squads, the largest standardized regional difference occurred in arm lean mass in females (+1.40 kg; g = 2.78, 95% CI 2.02 to 3.53) and in trunk lean mass in males (+6.92 kg; g = 2.59, 1.83 to 3.35). Appendicular lean mass was 4.67 kg higher in senior than in U15 females (g = 2.35, 1.65 to 3.05) and 6.40 kg higher in senior than in U14 males (g = 1.88, 1.20 to 2.55). In contrast, absolute fat mass differed little across male categories (10.40 ± 2.16 kg in U14 vs. 10.95 ± 2.63 kg in the senior squad; small difference, g = 0.22, −0.34 to 0.79) and was not associated with category after height adjustment (Holm-adjusted p = 0.78; Table S2), whereas in females, fat mass was 2.06 kg lower in the senior squad than in U15 (moderate difference, g = −0.74, −1.29 to −0.18; Holm-adjusted p < 0.001). These data suggest that the lower body-fat percentage of older male squads reflected greater lean mass with similar fat mass, whereas in females, both greater lean mass and lower fat mass contributed to the lower body-fat percentage. The lean mass index rose from 16.7 ± 1.0 kg/m2 (U14) to 19.4 ± 1.0 kg/m2 (senior) in males and from 14.9 ± 1.1 kg/m2 (U15) to 17.0 ± 1.0 kg/m2 (senior) in females.
Table 4.
Regional lean mass, appendicular and height-normalized indices, and fat mass by sex and national-team category.
Figure 3.
Regional body composition by sex and national-team category. (A,B) Mean lean soft tissue of the legs, trunk, and arms (stacked; values in kg) in female (A) and male (B) squads, with total lean mass above each bar (the total also includes head lean soft tissue, which is not shown as a separate segment). (C) Absolute fat mass (mean and 95% CI; circles, female; squares, male), with the global height-adjusted category effect for each sex (HC3 Wald test; Table S2) shown in the legend below the panel. (D) Regional distribution of lean soft tissue as a percentage of total lean mass (solid lines, female; dashed lines, male). In every panel, the legend is placed below the plotting area. Each category is a different squad. CI, confidence interval; HC3, heteroscedasticity-consistent covariance estimator type 3; U14–U23, under-14 to under-23.
3.4. Differences Between Adjacent Categories
Standardized differences between adjacent categories, and between the youngest and senior squads, are shown in Table 5. In males, the largest lean-mass difference, which was moderate, occurred between the U14 and U15 squads (+5.83 kg; g = 1.09, 95% CI 0.47 to 1.72), followed by moderate differences between U15 and U17 and between U17 and U20 (g = 0.81 and 0.74); beyond U20, differences in lean mass and BMC were trivial or small (|g| ≤ 0.49), and those between U20 and U23 were negative. In females, adjacent-category differences in total lean mass were small (g = 0.44 to 0.55), except for a moderate difference between U17 and U20 (g = 0.65), and were similar in size along the pathway, whereas the largest BMC difference, which was large, occurred between U15 and U17 (g = 1.34, 0.74 to 1.94). Female body fat was almost identical in the U15 and U17 squads (trivial difference, g = −0.03) and was lower in each subsequent category, with moderate differences between U20 and U23 (g = −0.63) and between U23 and the senior squad (g = −0.80). In males, all adjacent differences in body fat were small, with 95% CIs that included zero.
Table 5.
Standardized differences (Hedges’ g, 95% CI) between adjacent national-team categories and between the youngest and senior squads.
3.5. Secondary Category Models
After height adjustment and multiplicity correction (Table 6), category was associated with all five modeled outcomes in females (Holm-adjusted p ≤ 0.006). In males, category was associated with body mass, total lean mass, leg lean mass, and BMC (Holm-adjusted p < 0.001), but was not significantly associated with body-fat percentage (Holm-adjusted p = 0.118). All conclusions were unchanged when F tests with residual degrees of freedom were used instead of Wald χ2 tests (Holm-adjusted p = 0.008 for female body mass and 0.126 for male body fat; all others p < 0.001). Pairwise height-adjusted contrasts (Table S1) located these differences. In females, total lean mass was higher than in U15 from U20 onward and BMC was higher than in U15 in every older category (Holm-adjusted p ≤ 0.018), and the senior squad exceeded U20 in total lean mass (+2.63 kg, 95% CI 0.74 to 4.53; p = 0.032) and BMC (+0.39 kg, 0.28 to 0.50; p < 0.001), whereas no two adjacent categories differed significantly in total or leg lean mass; body-fat percentage was lower than in U15 from U23 onward (−3.80 and −6.48 percentage points) and lower in the senior squad than in U23 (−2.68 points, −4.48 to −0.88; p = 0.018). In males, the U14 squad differed from every older category in total lean mass and leg lean mass (Holm-adjusted p ≤ 0.044) and from U17 onward in BMC, whereas no differences were detected among the U20, U23, and senior squads for any outcome, and no pairwise body-fat difference survived correction. The age-related gradient in male lean and bone mass was therefore concentrated between U14 and U20.
Table 6.
Global category effects from sex-stratified models adjusted for height.
3.6. Correlations with Chronological Age
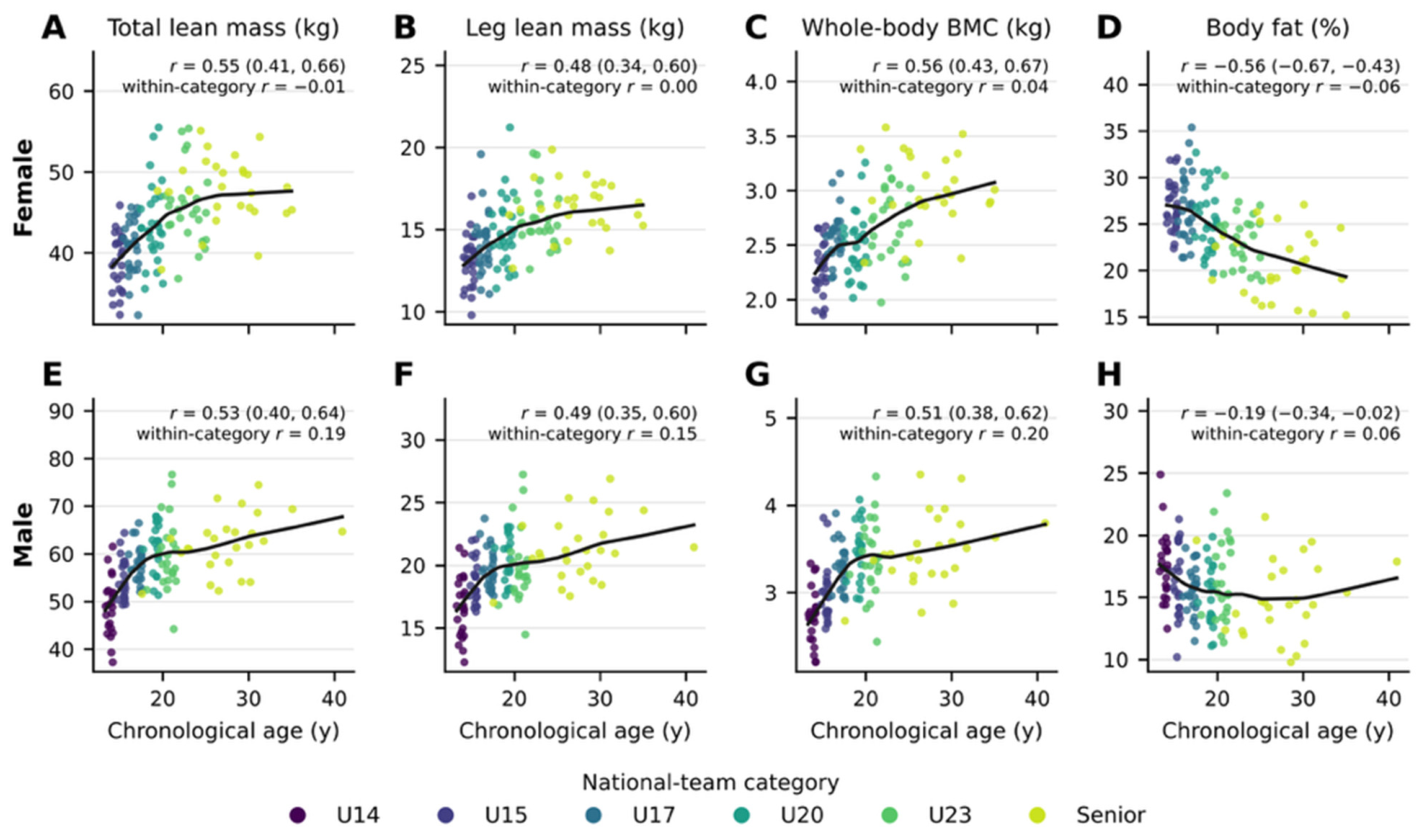
Chronological age correlated positively with total lean mass (r = 0.55, 95% CI 0.41 to 0.66, in females; r = 0.53, 0.40 to 0.64, in males), leg lean mass (r = 0.48 and 0.49), arm and trunk lean mass (r = 0.52–0.57), and BMC (r = 0.56 and 0.51), and negatively with body-fat percentage (r = −0.56, −0.67 to −0.43, in females; r = −0.19, −0.34 to −0.02, in males) (Figure 4); these associations were large, except for those with leg lean mass (moderate in both sexes) and with male body-fat percentage (small). The LOWESS curves show that lean mass and BMC rose steeply up to approximately 19–20 years in males and more gradually up to approximately 25 years in females and plateaued thereafter, and that male body-fat percentage showed no age trend beyond approximately 17 years. Within-category correlations were trivial in females (r = −0.09 to 0.06 for all outcomes) and small but positive in males for lean outcomes and BMC (r = 0.15–0.25) and trivial for body fat (r = 0.06). These results suggest that age-related differences in body composition occurred mainly between categories rather than within squads, with a small residual maturation-related gradient within the male squads, whose age ranges overlap with ongoing growth. Years of competitive experience were not recorded, so category and chronological age serve here as proxies of pathway stage.
Figure 4.
Relationship between chronological age and DXA-derived outcomes in female (A–D) and male (E–H) players: total lean mass (A,E), leg lean mass (B,F), whole-body BMC (C,G), and body-fat percentage (D,H). Points are individual records colored by national-team category; black curves are LOWESS smoothers (span 0.6). Pearson r with 95% CI (pooled within sex) and the within-category r (after centering on category means) are shown in each panel. All pooled correlations had 95% CIs excluding zero; within-category correlations are descriptive. BMC, bone mineral content; CI, confidence interval; DXA, dual-energy X-ray absorptiometry; LOWESS, locally weighted scatterplot smoothing; U14–U23, under-14 to under-23.
3.7. Exploratory Playing-Position Models
No independent playing-position association was observed in females after adjustment for category and height (Table 7; Holm-adjusted p = 1.000 for all outcomes). In males, omnibus position effects remained for total lean mass (Holm-adjusted p = 0.042) and body-fat percentage (p = 0.036), whereas leg lean mass and BMC did not remain significant after correction (both p = 0.067). In pairwise contrasts, forwards had 4.27 kg more adjusted total lean mass than goalkeepers (95% CI 1.52 to 7.03; Holm-adjusted p = 0.014) and 3.63 percentage points less adjusted body fat (95% CI −5.74 to −1.51; p = 0.005) (Figure 5). These estimates are exploratory because male positions were missing for two complete categories and only 10 goalkeepers contributed to the models. In the small-sample sensitivity analysis (F tests with residual degrees of freedom), the omnibus position effect for male total lean mass was no longer statistically significant (Holm-adjusted p = 0.055) while that for body-fat percentage remained significant (p = 0.048); the forward–goalkeeper contrasts were unchanged (t-based 95% CI 1.48 to 7.07 kg and −5.77 to −1.48 percentage points). Among the regional outcomes (Table S2), trunk lean mass differed by position in males (Holm-adjusted p = 0.005): forwards (+2.29 kg, 95% CI 1.04 to 3.55) and defenders (+1.80 kg, 0.58 to 3.02) had more adjusted trunk lean mass than goalkeepers, whereas arm lean mass did not differ (p = 0.26); fat mass differences by position did not survive correction (p = 0.083). In females, no regional outcome differed by position (Holm-adjusted p ≥ 0.23).
Table 7.
Global playing-position effects adjusted for category and height.
Figure 5.
Estimated marginal means and 95% CIs by playing position from sex-stratified models adjusted for category and height, in female (A–D) and male (E–H) players: total lean mass (A,E), leg lean mass (B,F), whole-body BMC (C,G), and body-fat percentage (D,H). Male estimates exclude the U15 and U17 squads because playing position was not recorded. Brackets with * mark the male forward–goalkeeper contrasts described in Section 3.7, which remained significant after Holm adjustment within each outcome (total lean mass, p = 0.014; body-fat percentage, p = 0.005). Pairwise contrasts were computed only for the outcomes whose omnibus position effect remained significant after Holm correction (Table 7). BMC, bone mineral content; CI, confidence interval; DEF, defender; FWD, forward; GK, goalkeeper; MID, midfielder; U15, under-15; U17, under-17.
4. Discussion
To our knowledge, this study provides the first DXA-based description of body composition across the female and male national-team pathway of a Latin American federation, including regional lean mass, fat mass, and BMC under one acquisition protocol. Older-category squads generally had greater total and leg lean mass and BMC, and female body-fat percentage was lower in successively older squads. These patterns persisted after adjustment for height, except for body-fat percentage in males, whose absolute fat mass was similar across categories (10.4–11.7 kg) from U14 to the senior squad. Regional lean mass differed proportionally, so that the distribution of lean tissue among legs, trunk, and arms was almost identical in every category. Chronological age accounted for approximately 23–32% of the variance (r2 from r = 0.48–0.57) in lean mass and BMC across the pathway but almost none within squads, and the age gradient flattened after approximately 20 years in males and 25 years in females. Playing position was not associated with body composition in females, whereas in males, the evidence was limited to an exploratory contrast between goalkeepers and forwards (and defenders for trunk lean mass). Because each category is a different squad, these contrasts describe the program at one point in time rather than the development of individual athletes.
4.1. Lean and Fat Mass Across Categories
In males, the difference between the youngest and senior squads appeared to be driven mainly by lean mass: the standardized difference was very large for lean mass but only moderate for body-fat percentage, and body fat was not associated with category after height adjustment. The regional analysis suggests a possible explanation: absolute fat mass was not associated with category after height adjustment (Holm-adjusted p = 0.78; Table S2), so the 2.6-percentage-point lower body fat of the senior squad is consistent with approximately 13 kg of additional lean tissue on a similar fat compartment. This pattern mirrors the English Premier League academy, where the lower body-fat percentage of the first team reflected more lean mass rather than less fat mass [15]. The Mexican senior male squad had less absolute lean mass than that first team (62.1 vs. 66.9 kg) [15] and a lower lean mass index (19.4 vs. 20.0 kg/m2), while its fat mass was about 3 kg higher (11.0 vs. 7.8 kg), a difference that may partly reflect body size and ancestry. Such cross-cohort comparisons should be limited to DXA data acquired under comparable protocols, because body-composition values in football players vary systematically with the assessment method [4,12] and between DXA manufacturers [13]. The lower lean mass and higher body fat of the male U23 squad compared with U20 illustrate that squad composition, timing within the season, and selection can outweigh age-related differences in a cross-sectional design [50,51].
In females, the gradient in body-fat percentage across categories was larger (−6.32 percentage points) and was accompanied by a very large difference in lean mass. Unlike in males, absolute fat mass was also lower in the older female squads (−2.1 kg between U15 and senior), so both compartments contributed to the lower body-fat percentage of senior players. This is consistent with longitudinal evidence of lean-mass gains across a season in young elite players [28] and of lean-mass and bone accretion with a concurrent decrease in body-fat percentage over collegiate careers [30]. Continued lean-tissue accretion after age 18, rather than fat loss alone, is therefore a plausible contributor to the lower body-fat percentage of older female squads, although the design cannot separate maturation, training exposure, and selection. The Mexican senior female squad had somewhat less lean mass (47.7 vs. 50.4 kg) but similar whole-body BMC (2.99 vs. 3.05 kg) compared with the Danish women’s national team assessed by DXA [31]. Because stature and scanner models may differ between cohorts, these comparisons are indicative only.
The location of the largest adjacent-category differences is consistent with the timing of the adolescent growth spurt. Boys typically reach peak height velocity about two years later than girls [16], so the male U14 and U15 squads span the period of most rapid growth, whereas most players in the youngest female squad (mean age 14.8 years) were probably past it. The post hoc maturity estimates support this reading: the male U14 squad was on average 0.5 years past estimated PHV with 21 out of 23 players circa-PHV, whereas every player in the female U15 squad was estimated to be more than 1.6 years past PHV (Table S3). This may explain why the largest male lean-mass difference occurred between U14 and U15, whereas female lean-mass differences were smaller and evenly distributed along the pathway. The body-fat pattern also reflects normal sex differences in growth: in the general population, body-fat percentage falls during male adolescence but rises during female adolescence [17,18]. The body-fat percentage of the female U15 and U17 squads should therefore be interpreted against the physiological fat accrual of female puberty rather than against senior values, and the senior profile should not be used as a target for adolescent players. Attempts to reduce body fat during growth increase the risk of low energy availability and its consequences for bone and health [3,9].
4.2. Age Category, Competitive Experience, and Body Composition
In a national-team pathway, age category is a composite marker of chronological age, biological maturity, training age, and accumulated competitive experience, and these components cannot be separated in a cross-sectional design. The age analyses nevertheless suggest what the category gradient may represent. Chronological age showed moderate to large correlations with lean mass and BMC (r = 0.48–0.57), and in females, a large correlation with body-fat percentage (r = −0.56), but the within-category correlations were trivial in females and small in males. The age gradient therefore appears to mainly be a between-squad phenomenon: within a given squad, being older by a year or two was not associated with a more “favorable” profile in females and only weakly so in males, where the youth squads still span the final stages of growth. This is consistent with the view that once maturation is complete, differences in body composition between a U23 and a senior squad reflect selection and years of systematic training rather than age itself [15,30]. The shape of the age relationship, a steep rise up to approximately 20 years in males and 25 years in females followed by a plateau, parallels the longitudinal accrual of lean mass and bone over collegiate careers [30], and the absence of further lean-mass differences among the male U20, U23, and senior squads suggests that in this program, the senior lean-mass profile may be largely attained by the U20 stage.
Whether a more favorable body composition in older categories is a cause or a consequence of progression along the pathway cannot be determined here. Players who accrue lean mass earlier may be preferentially selected and retained [16,22,23], and selected players subsequently receive more systematic strength training and nutritional support, which further increases lean mass; the two processes reinforce each other and would produce the same cross-sectional gradient. The confounding factors most likely to inflate the gradient are maturational timing in the youth squads (Section 4.5), stature (partly addressed by height adjustment), and the different seasonal moments at which squads were assessed [50,51]. Years of competitive experience and training age were not recorded and could not be modeled; a prospective registry that records training age, international caps, and maturity indicators would allow the independent contribution of competitive experience to be estimated with mixed-effects models, as discussed in Section 4.7.
4.3. Body-Fat Percentage in Context
The body-fat percentages observed here (15–18% in male and 21–27% in female squads) are higher than the values usually quoted for elite football players, and three non-exclusive explanations should be considered before they are interpreted as excess adiposity. First, the measurement method: DXA yields systematically higher body-fat percentages than skinfold equations or bioimpedance, which dominate the published literature; a recent meta-analysis of male professional players reported a pooled DXA value of approximately 13.5% against an overall pooled value of 11.9% across methods [12], and field methods underestimate DXA-derived fat in elite players [52]. In addition, GE Lunar and Hologic densitometers differ systematically in lean and fat estimates, so the 10–12% reported for English Premier League squads [14,15] is not directly comparable without cross-calibration [13]. Second, population: in DXA population references, Mexican-American individuals have higher body-fat percentages than non-Hispanic White individuals at the same age and body size [17,33], and the national-team players described here were drawn from that population. Third, developmental stage and season: the youth squads were assessed during or shortly after puberty, when body-fat percentage is physiologically higher in girls and still declining in boys [17,18], and the senior squads were assessed at different moments of the competitive calendar [50,51]. Consistent with the second and third explanations, absolute fat mass in the male squads (10.4–11.7 kg) was about 3 kg higher than in an English first team [15], while lean mass was about 5 kg lower, so both compartments contribute to the difference in percentage. Whether this represents a modifiable margin or a population characteristic cannot be decided from cross-sectional data and should not be translated into fat-loss targets, least of all in adolescents [3]. The female values are within the range reported for trained female players [26,28,29,30] and are consistent with the physiological fat accrual of female puberty.
4.4. Bone Mineral Content
BMC was greater in older squads in both sexes and remained associated with category after height adjustment. This agrees with the osteogenic effect of football during growth [8,19] and with the close coupling between lean mass and bone mass in elite male youth players, in whom lean mass was the strongest predictor of BMC and playing position was unrelated to bone outcomes [53]. Our position findings for BMC are consistent with that report: no position effect was observed in females, and the male effect did not survive multiplicity correction.
In female players, BMC also has a health dimension. Elite female players generally show high bone mass [31,54], but low bone mass is a recognized consequence of problematic low energy availability [9], and reduced or low energy availability was common in a professional female squad [27]. The lower mean BMC of the female U20 squad compared with U17 is unlikely to reflect developmental change and may reflect squad composition, but it illustrates how category-specific distributions can help staff identify players whose bone values warrant clinical review together with menstrual function and energy-availability screening.
4.5. Maturation, Selection, and Interpretation of Category Differences
The sex-stratified category models support the use of category-specific rather than pooled reference summaries. Adjustment for height, however, does not remove confounding by biological maturity, training age, selection, ancestry, or other unmeasured characteristics. In youth squads, chronological age categories contain athletes at different maturational stages, and national youth selections over-represent players born early in the selection year and those who mature early [16,21,22]. Biological maturation was not assessed or controlled in this study, and we state this explicitly as a key limitation, particularly for the male U14 squad. The post hoc estimates indicate that this squad was assessed within about six months of estimated PHV, i.e., during the window of maximal inter-individual variation in somatic growth [16,39], and within the squad estimated maturity offset explained most of the variance in lean mass and BMC. Differences between U14 and older categories in lean mass and BMC are therefore likely to reflect maturational timing and growth at least as much as training adaptations, and the U14 reference values should be interpreted with the greatest caution: an individual U14 player who is late-maturing may lie far below the squad mean for reasons that have nothing to do with training or nutrition. The estimates themselves are also imperfect: the age × height equations compress true maturational variation toward the mean, so the real heterogeneity within the U14 squad is probably larger than the 1.4-year range of predicted age at PHV suggests, and the apparently early mean predicted age at PHV (13.3 years) is consistent with, but cannot confirm, the maturity-selection bias described in youth football [22,23,45]. The influence of relative age and maturation on selection is even less understood in female football [26]. Routine estimation of maturity status, for example, through maturity offset or the percentage of predicted adult height [16,55], would allow future analyses to separate maturity-related from training-related differences; maturity-based grouping (bio-banding) and maturity-adjusted interpretation of body composition have been proposed precisely for this purpose [20,23]. Until then, the present models estimate conditional associations, not developmental or causal effects.
4.6. Playing Position
Position findings differed by sex. In females, there was no independent positional effect after category and height adjustment, consistent with substantial overlap among position groups. Several factors may explain the absence of positional differences in females. First, positional differences in match physical demands are less consistently reported in women’s than in men’s football, and outfield roles overlap considerably in running and high-intensity demands [25,26], so the positional specialization that shapes body composition in senior male players may be weaker, particularly in youth squads where players frequently rotate roles. Second, goalkeepers, the position that most consistently differs from outfield players in males [14,24], numbered only 16 in the female sample, and adjusting for height removes the stature difference that largely defines the goalkeeper profile; with these numbers, only differences of about one SD or more were detectable. Third, selection into female national squads may weigh technical and tactical attributes more than anthropometric ones at the current stage of development of the women’s game. The null finding should therefore be read as absence of evidence for large positional differences, not as evidence that positional demands are irrelevant to body composition in women. In males, forwards had greater adjusted total lean mass and lower body-fat percentage than goalkeepers, and forwards and defenders had more trunk lean mass than goalkeepers, a pattern compatible with the greater volume of high-intensity running, duels, shielding, and aerial contests of outfield roles compared with the intermittent, explosive but low-volume demands of goalkeeping. The distinction between goalkeepers and outfield players agrees with previous data in professional and youth male players, in whom outfield positions were largely homogeneous [14,24]. These male findings nevertheless require replication because U15 and U17 had no position data, goalkeeper numbers were small, the omnibus lean-mass effect was not statistically significant under small-sample inference, and the associations may reflect selective missingness or unmeasured squad characteristics. The results should not be used to prescribe position-specific targets.
4.7. Practical Applications
The distinction between a reference distribution and a performance target is central to the use of these data. Squad means and SDs allow nutritionists to see where an athlete sits relative to the current category, but they do not identify an optimal value, diagnose a condition, or justify a body-composition intervention in isolation. The IOC REDs subgroup found no body-composition cut-off that signals a performance advantage and recommended that body-composition data be treated as confidential medical information and interpreted by a multidisciplinary team [3]. Decisions should integrate individual history, maturation, menstrual and endocrine health where relevant, training load, availability, injury status, dietary intake, performance objectives, and measurement error [2,3].
Within these constraints, the reference distributions have four concrete uses. (i) Benchmarking along the pathway: a player’s lean mass, BMC, and fat mass can be expressed as a z-score relative to the squad she or he is competing for, or to the next category when transition is being planned, which tells the staff whether the player’s profile is typical of that stage without implying that a particular value should be reached; for example, a U17 female player with 2.2 kg of BMC lies about 1.7 SD below her squad mean and would be a candidate for clinical review of energy availability, menstrual function, and bone health, whereas the same value is typical in U15. (ii) Interpreting change: because the regional distribution of lean tissue was stable along the pathway, a disproportionate regional change in an individual (for example, trunk gain without leg gain) points to a specific training or nutritional process rather than to normal growth. (iii) Physiological interpretation of profiles: lean mass of the lower limbs is the compartment most directly related to force production, sprinting, jumping, and kicking [6,7], whereas fat mass is non-contributing mass that increases the energy cost of locomotion; the finding that male categories differ in lean but not fat mass suggests that in this pathway, monitoring lean-tissue development may be more informative than a focus on fat reduction, as also concluded in the English academy [15]. (iv) Screening for health: whole-body BMC values well below the category distribution, particularly in female players, warrant evaluation for low energy availability [9,27] rather than being read as a deficit to be “trained”.
The main applied value of the dataset lies in prospective standardization. If future assessments use the same scanner, software, preparation protocol, variable definitions, and a persistent athlete identifier, the program can estimate typical error, the least significant change, and individual trajectories [5,11,37,56]. As an illustration, applying the 95% least-significant-change factor of 2.77 to the published iDXA precision for lean mass (0.24 kg) [42] gives a threshold of about 0.7 kg, but each program should derive its own precision estimate in its athletes [5,37]. A longitudinal registry would also permit mixed-effects models that separate within-athlete change from between-athlete and between-cohort differences, as applied in collegiate players [30], and the inclusion of maturity indicators (sitting height, parental height, or percentage of predicted adult height), training age, and international caps would allow maturation, competitive experience, and selection to be disentangled.
4.8. What This Study Adds
This study is novel in four respects. First, to our knowledge, it is the first DXA dataset covering both sexes and all age categories of a national-team pathway—from U14/U15 to senior—acquired with a single device, software version, operator, and preparation protocol, which is the condition under which category references are interpretable; existing athlete references pool sports and countries [32] or describe single squads [15,28,29,30,31]. Second, to our knowledge, it is the first to provide category-specific DXA references for female youth national squads, for which we found no comparable data, and it quantifies the female pathway with the same resolution as the male pathway. Third, by analyzing absolute fat mass and regional lean mass alongside the conventional outcomes, it suggests that the age gradient in body-fat percentage has different compositional bases in the two sexes—greater lean mass with similar fat mass in males, greater lean mass plus lower fat mass in females—and that lean tissue is distributed in similar proportions across regions; this shifts the practical emphasis from “fat reduction” towards “lean-tissue development” in male youth squads. Fourth, it quantifies how much of the age association is between rather than within squads and characterizes the maturity status of the youth squads, which defines the limits within which these references can be used and provides a template for the standardized, maturity-informed monitoring that national federations in Latin America and elsewhere could adopt.
4.9. Strengths and Limitations
Strengths of this study include the coverage of multiple national-team categories in both sexes, assessment in a single laboratory with one scanner model, complete core outcomes, transparent unit harmonization, 95% CIs and standardized effect sizes, sex-stratified analyses, height adjustment, heteroscedasticity-robust inference, and multiplicity correction, together with comprehensive regional reporting, pairwise category contrasts, and small-sample sensitivity analyses. The main limitation is the cross-sectional design, which does not allow definitive parameters to be established for coaches and the scientific community; these data should therefore be interpreted with caution. Future studies should follow players longitudinally, building on these preliminary findings to establish robust normative parameters for Latin American football players. Biological maturation was not measured, which is the key limitation for the youth squads and especially for the male U14 squad, whose between-player differences in lean and bone mass are largely maturity-driven (Section 4.5); the post hoc age × height estimates characterize the squads but cannot substitute for direct maturity assessment. Training age and years of competitive experience were not recorded, so the contribution of experience could not be separated from that of age, maturation, and selection. Category structures differed by sex, and dietary intake, menstrual status, ancestry, injury, and performance covariates were not available. Squads were assessed at different times between February and August 2026, so differences in competitive phase may have contributed to between-category contrasts, given the seasonal variation in body composition [50,51]. Hydration screening was documented only for the senior female squad, and compliance with fasting and exercise restrictions was verified by checklist and verbal confirmation rather than biochemically. Evaluation dates were missing for two female squads, male positions were missing for U15 and U17, position groups were small and unequal, and the uniqueness of male athletes was inferred from implied birth date and anthropometry rather than from a recorded identifier. Standardized differences were derived from summary statistics and were not adjusted for height. Inference for the position models relied on large-sample (z-based) HC3 Wald tests, and one omnibus result (male total lean mass) was no longer statistically significant under F-based inference, which reinforces their exploratory status. Finally, the sample consists of selected national-team players, so the estimates are internal references for this program rather than population norms. Regarding generalizability, the values describe Mexican national-team players measured on one Lunar iDXA system; they may be informative for other Mexican and Latin American programs with similar ancestry and selection practices if the same manufacturer and preparation protocol are used, but they should not be applied to players of other competitive levels, to other sports, or to data from other DXA manufacturers without cross-calibration [13], nor to populations with different ancestry, in whom the relationship between body size and adiposity differs [33].
5. Conclusions
The 2026 assessments provide a preliminary sex- and category-specific cross-sectional description of DXA-derived body composition across Mexican national football squads. Older categories had markedly more lean mass and BMC in both sexes, and this association persisted after height adjustment; lower body fat in older squads was evident in females but not, after adjustment, in males, in whom fat mass was similar across categories and the age gradient in body-fat percentage appeared to reflect greater lean mass. Lean tissue was distributed in similar proportions across the arms, trunk, and legs, and age-related differences appeared mainly between rather than within squads. Evidence for playing-position differences was limited to an exploratory goalkeeper–forward contrast in males. The dataset can serve as an internal baseline for individualized nutrition and performance decisions—benchmarking players against their own category, interpreting regional change, and flagging atypical bone or lean values for multidisciplinary review—but it does not establish optimal targets, causal effects, or longitudinal development. Because the design was cross-sectional, these values should be interpreted with caution. Longitudinal follow-up with standardized reassessment, persistent athlete identifiers, direct maturity indicators, and training-age records is required to establish robust normative parameters for Latin American football players.
Supplementary Materials
The following supporting information can be downloaded at: https://www.mdpi.com/article/10.3390/sports14110504/s1, Table S1: Pairwise height-adjusted contrasts between national-team categories (Holm-adjusted within outcome); Table S2: Height-adjusted category and playing-position models for regional outcomes (arm lean mass, trunk lean mass, fat mass); Table S3: Estimated somatic maturity of the U14–U17 squads (Moore et al. age × height equations); Table S4: Standardized differences (Hedges’ g, 95% CI) between the youngest and senior squads for regional outcomes and height-normalized indices; Figure S1: Estimated maturity offset and predicted age at peak height velocity by youth squad.
Author Contributions
All authors meet the four International Committee of Medical Journal Editors (ICMJE) authorship criteria. I.R.-L., C.A.H.-A. and R.Y.-S.: conceptualization, methodology, formal analysis, visualization, writing—original draft, writing—review and editing. C.D.M.-L., M.F.S.-M., K.J.M.-S., G.A., R.F., U.G. and A.L.: investigation, data curation, writing—original draft, writing—review and editing. J.F.L.-G.: supervision, critical review, writing—review and editing. All authors have read and agreed to the published version of the manuscript.
Funding
This research received no external funding.
Institutional Review Board Statement
The study was conducted in accordance with the Declaration of Helsinki and the Regulations of the General Health Law for Health Research (Mexico), and was approved by the Research Ethics Committee of the Universidad Autónoma Metropolitana, Xochimilco Unit (reference DCBS.CD.071.2). The overarching research protocol was registered at ClinicalTrials.gov (NCT06941064).
Informed Consent Statement
Written informed consent was obtained from all adult participants. For participants younger than 18 years, written informed consent was obtained from a parent or legal guardian, and athletes provided assent.
Data Availability Statement
The data presented in this study are available on reasonable request from the corresponding author. The data are not publicly available because of athlete privacy and federation data-governance restrictions.
Acknowledgments
The authors thank the technical staff of the CAR and the athletes of the Mexican national teams for their participation.
Conflicts of Interest
The authors declare no conflicts of interest.
Abbreviations
The following abbreviations are used in this manuscript:
| ALMI | Appendicular lean mass index |
| BMC | Bone mineral content |
| CAR | Centro de Alto Rendimiento (High-Performance Centre) |
| CI | Confidence interval |
| DEF | Defender |
| DXA | Dual-energy X-ray absorptiometry |
| FMI | Fat mass index |
| FWD | Forward |
| GK | Goalkeeper |
| HC3 | Heteroscedasticity-consistent covariance estimator type 3 |
| IOC | International Olympic Committee |
| ISCD | International Society for Clinical Densitometry |
| LMI | Lean mass index |
| LOWESS | Locally weighted scatterplot smoothing |
| MID | Midfielder |
| OLS | Ordinary least squares |
| PHV | Peak height velocity |
| QA | Quality assurance |
| REDs | Relative Energy Deficiency in Sport |
| SD | Standard deviation |
| SE | Standard error |
| STROBE | Strengthening the Reporting of Observational Studies in Epidemiology |
| U14 | Under-14 |
| U15 | Under-15 |
| U17 | Under-17 |
| U20 | Under-20 |
| U23 | Under-23 |
| UAM | Universidad Autónoma Metropolitana |
References
- Ackland, T.R.; Lohman, T.G.; Sundgot-Borgen, J.; Maughan, R.J.; Meyer, N.L.; Stewart, A.D.; Müller, W. Current Status of Body Composition Assessment in Sport: Review and Position Statement on Behalf of the Ad Hoc Research Working Group on Body Composition Health and Performance, under the Auspices of the I.O.C. Medical Commission. Sports Med. 2012, 42, 227–249. [Google Scholar] [CrossRef] [Scilit]
- Collins, J.; Maughan, R.J.; Gleeson, M.; Bilsborough, J.; Jeukendrup, A.; Morton, J.P.; Phillips, S.M.; Armstrong, L.; Burke, L.M.; Close, G.L.; et al. UEFA Expert Group Statement on Nutrition in Elite Football. Current Evidence to Inform Practical Recommendations and Guide Future Research. Br. J. Sports Med. 2021, 55, 416. [Google Scholar] [CrossRef] [Scilit]
- Mathisen, T.F.; Ackland, T.; Burke, L.M.; Constantini, N.; Haudum, J.; Macnaughton, L.S.; Meyer, N.L.; Mountjoy, M.; Slater, G.; Sundgot-Borgen, J. Best Practice Recommendations for Body Composition Considerations in Sport to Reduce Health and Performance Risks: A Critical Review, Original Survey and Expert Opinion by a Subgroup of the IOC Consensus on Relative Energy Deficiency in Sport (REDs). Br. J. Sports Med. 2023, 57, 1148–1158. [Google Scholar] [CrossRef] [Scilit]
- Nana, A.; Slater, G.J.; Stewart, A.D.; Burke, L.M. Methodology Review: Using Dual-Energy X-Ray Absorptiometry (DXA) for the Assessment of Body Composition in Athletes and Active People. Int. J. Sport Nutr. Exerc. Metab. 2015, 25, 198–215. [Google Scholar] [CrossRef] [Scilit]
- Hind, K.; Slater, G.; Lees, M.; Thurlow, S.; Barlow, M.; Oldroyd, B.; Shepherd, J. Interpretation of Dual-Energy X-Ray Absorptiometry-Derived Body Composition Change in Athletes: A Review and Recommendations for Best Practice. J. Clin. Densitom. 2018, 21, 429–443. [Google Scholar] [CrossRef] [Scilit]
- Hart, N.H.; Nimphius, S.; Spiteri, T.; Newton, R.U. Leg Strength and Lean Mass Symmetry Influences Kicking Performance in Australian Football. J. Sports Sci. Med. 2014, 13, 157–165. [Google Scholar]
- Silvestre, R.; West, C.; Maresh, C.M.; Kraemer, W.J. Body Composition and Physical Performance in Men’s Soccer: A Study of a National Collegiate Athletic Association Division I Team. J. Strength Cond. Res. 2006, 20, 177–183. [Google Scholar] [CrossRef] [Scilit]
- Lozano-Berges, G.; Matute-Llorente, Á.; González-Agüero, A.; Gómez-Bruton, A.; Gómez-Cabello, A.; Vicente-Rodríguez, G.; Casajús, J.A. Soccer Helps Build Strong Bones during Growth: A Systematic Review and Meta-Analysis. Eur. J. Pediatr. 2018, 177, 295–310. [Google Scholar] [CrossRef] [Scilit]
- Mountjoy, M.; Ackerman, K.E.; Bailey, D.M.; Burke, L.M.; Constantini, N.; Hackney, A.C.; Heikura, I.A.; Melin, A.; Pensgaard, A.M.; Stellingwerff, T.; et al. 2023 International Olympic Committee’s (IOC) Consensus Statement on Relative Energy Deficiency in Sport (REDs). Br. J. Sports Med. 2023, 57, 1073–1097. [Google Scholar] [CrossRef] [Scilit]
- Bilsborough, J.C.; Greenway, K.; Opar, D.; Livingstone, S.; Cordy, J.; Coutts, A.J. The Accuracy and Precision of DXA for Assessing Body Composition in Team Sport Athletes. J. Sports Sci. 2014, 32, 1821–1828. [Google Scholar] [CrossRef] [Scilit]
- Nana, A.; Slater, G.J.; Hopkins, W.G.; Halson, S.L.; Martin, D.T.; West, N.P.; Burke, L.M. Importance of Standardized DXA Protocol for Assessing Physique Changes in Athletes. Int. J. Sport Nutr. Exerc. Metab. 2016, 26, 259–267. [Google Scholar] [CrossRef] [Scilit]
- Sebastiá-Rico, J.; Soriano, J.M.; González-Gálvez, N.; Martínez-Sanz, J.M. Body Composition of Male Professional Soccer Players Using Different Measurement Methods: A Systematic Review and Meta-Analysis. Nutrients 2023, 15, 1160. [Google Scholar] [CrossRef] [Scilit]
- Shepherd, J.A.; Fan, B.; Lu, Y.; Wu, X.P.; Wacker, W.K.; Ergun, D.L.; Levine, M.A. A Multinational Study to Develop Universal Standardization of Whole-Body Bone Density and Composition Using GE Healthcare Lunar and Hologic DXA Systems. J. Bone Miner. Res. 2012, 27, 2208–2216. [Google Scholar] [CrossRef] [Scilit]
- Sutton, L.; Scott, M.; Wallace, J.; Reilly, T. Body Composition of English Premier League Soccer Players: Influence of Playing Position, International Status, and Ethnicity. J. Sports Sci. 2009, 27, 1019–1026. [Google Scholar] [CrossRef] [Scilit]
- Milsom, J.; Naughton, R.; O’Boyle, A.; Iqbal, Z.; Morgans, R.; Drust, B.; Morton, J.P. Body Composition Assessment of English Premier League Soccer Players: A Comparative DXA Analysis of First Team, U21 and U18 Squads. J. Sports Sci. 2015, 33, 1799–1806. [Google Scholar] [CrossRef] [Scilit]
- Malina, R.M.; Rogol, A.D.; Cumming, S.P.; Coelho e Silva, M.J.; Figueiredo, A.J. Biological Maturation of Youth Athletes: Assessment and Implications. Br. J. Sports Med. 2015, 49, 852–859. [Google Scholar] [CrossRef] [Scilit]
- Kelly, T.L.; Wilson, K.E.; Heymsfield, S.B. Dual Energy X-Ray Absorptiometry Body Composition Reference Values from NHANES. PLoS ONE 2009, 4, e7038. [Google Scholar] [CrossRef] [Scilit]
- Zemel, B.S.; Shepherd, J.A.; Grant, S.F.A.; Lappe, J.M.; Oberfield, S.E.; Mitchell, J.A.; Winer, K.K.; Kelly, A.; Kalkwarf, H.J. Reference Ranges for Body Composition Indices by Dual Energy X-Ray Absorptiometry from the Bone Mineral Density in Childhood Study Cohort. Am. J. Clin. Nutr. 2023, 118, 792–803. [Google Scholar] [CrossRef] [Scilit]
- Costa, D.C.; Valente-dos-Santos, J.; Sousa-e-Silva, P.; Martinho, D.V.; Duarte, J.P.; Tavares, O.M.; Castanheira, J.M.; Oliveira, T.G.; Abreu, S.; Leite, N.; et al. Growth, Body Composition and Bone Mineral Density among Pubertal Male Athletes: Intra-Individual 12-Month Changes and Comparisons between Soccer Players and Swimmers. BMC Pediatr. 2022, 22, 275. [Google Scholar] [CrossRef] [Scilit]
- Towlson, C.; Salter, J.; Ade, J.D.; Enright, K.; Harper, L.D.; Page, R.M.; Malone, J.J. Maturity-Associated Considerations for Training Load, Injury Risk, and Physical Performance in Youth Soccer: One Size Does Not Fit All. J. Sport Health Sci. 2021, 10, 403–412. [Google Scholar] [CrossRef] [Scilit]
- Helsen, W.F.; van Winckel, J.; Williams, A.M. The Relative Age Effect in Youth Soccer across Europe. J. Sports Sci. 2005, 23, 629–636. [Google Scholar] [CrossRef] [Scilit]
- Toselli, S.; Mauro, M.; Grigoletto, A.; Cataldi, S.; Benedetti, L.; Nanni, G.; Di Miceli, R.; Aiello, P.; Gallamini, D.; Fischetti, F.; et al. Maturation Selection Biases and Relative Age Effect in Italian Soccer Players of Different Levels. Biology 2022, 11, 1559. [Google Scholar] [CrossRef] [Scilit]
- Malina, R.M.; Cumming, S.P.; Rogol, A.D.; Coelho-e-Silva, M.J.; Figueiredo, A.J.; Konarski, J.M.; Kozieł, S.M. Bio-Banding in Youth Sports: Background, Concept, and Application. Sports Med. 2019, 49, 1671–1685. [Google Scholar] [CrossRef] [Scilit]
- Slimani, M.; Nikolaidis, P.T. Anthropometric and Physiological Characteristics of Male Soccer Players According to Their Competitive Level, Playing Position and Age Group: A Systematic Review. J. Sports Med. Phys. Fit. 2019, 59, 141–163. [Google Scholar] [CrossRef] [Scilit]
- Datson, N.; Hulton, A.; Andersson, H.; Lewis, T.; Weston, M.; Drust, B.; Gregson, W. Applied Physiology of Female Soccer: An Update. Sports Med. 2014, 44, 1225–1240. [Google Scholar] [CrossRef] [Scilit]
- Randell, R.K.; Clifford, T.; Drust, B.; Moss, S.L.; Unnithan, V.B.; De Ste Croix, M.B.A.; Datson, N.; Martin, D.; Mayho, H.; Carter, J.M.; et al. Physiological Characteristics of Female Soccer Players and Health and Performance Considerations: A Narrative Review. Sports Med. 2021, 51, 1377–1399. [Google Scholar] [CrossRef] [Scilit]
- Moss, S.L.; Randell, R.K.; Burgess, D.; Ridley, S.; ÓCairealláin, C.; Allison, R.; Rollo, I. Assessment of Energy Availability and Associated Risk Factors in Professional Female Soccer Players. Eur. J. Sport Sci. 2021, 21, 861–870. [Google Scholar] [CrossRef] [Scilit]
- Lesinski, M.; Prieske, O.; Helm, N.; Granacher, U. Effects of Soccer Training on Anthropometry, Body Composition, and Physical Fitness during a Soccer Season in Female Elite Young Athletes: A Prospective Cohort Study. Front. Physiol. 2017, 8, 1093. [Google Scholar] [CrossRef] [Scilit]
- Oliveira, R.; Francisco, R.; Fernandes, R.; Martins, A.; Nobari, H.; Clemente, F.M.; Brito, J.P. In-Season Body Composition Effects in Professional Women Soccer Players. Int. J. Environ. Res. Public Health 2021, 18, 12023. [Google Scholar] [CrossRef] [Scilit]
- Tinsley, G.M.; Meyer, M.K.; Ptak, S.M.; Yu, D.; Provost, J.A.; Hansen, N.J.; Carbuhn, A.F. Body Composition Changes over a Collegiate Playing Career in NCAA Division I Women’s Soccer Players. J. Strength Cond. Res. 2025, 39, e40–e55. [Google Scholar] [CrossRef] [Scilit]
- Jackman, S.R.; Scott, S.; Randers, M.B.; Orntoft, C.; Blackwell, J.; Zar, A.; Helge, E.W.; Mohr, M.; Krustrup, P. Musculoskeletal Health Profile for Elite Female Footballers versus Untrained Young Women before and after 16 Weeks of Football Training. J. Sports Sci. 2013, 31, 1468–1474. [Google Scholar] [CrossRef] [Scilit]
- Santos, D.A.; Dawson, J.A.; Matias, C.N.; Rocha, P.M.; Minderico, C.S.; Allison, D.B.; Sardinha, L.B.; Silva, A.M. Reference Values for Body Composition and Anthropometric Measurements in Athletes. PLoS ONE 2014, 9, e97846. [Google Scholar] [CrossRef] [Scilit]
- Heymsfield, S.B.; Peterson, C.M.; Thomas, D.M.; Heo, M.; Schuna, J.M. Why Are There Race/Ethnic Differences in Adult Body Mass Index–Adiposity Relationships? A Quantitative Critical Review. Obes. Rev. 2016, 17, 262–275. [Google Scholar] [CrossRef] [Scilit]
- Herrera-Amante, C.A.; Ríos-Limas, I.; Carvajal-Veitía, W.; Yáñez-Sepúlveda, R.; Morón-López, C.D.; Mendoza-Sánchez, K.J.; Figueroa-Conde, J.A.; Ramos-García, C.O.; López-Gil, J.F. Body Fat Estimation in the Mexican Women’s National Soccer Team: A Cross-Sectional Agreement Study between a Derived Mexican Football Federation Anthropometric Equation and Dual-Energy X-Ray Absorptiometry. J. Int. Soc. Sports Nutr. 2026, 23, 2690002. [Google Scholar] [CrossRef] [Scilit]
- Rios-Limas, I.; Herrera-Amante, C.A.; Carvajal-Veitía, W.; Yáñez-Sepúlveda, R.; Ayala-Guzmán, C.I.; Ortiz-Hernández, L.; López-Sagarra, A.; Lorente-Solá, P.; López-Gil, J.F. Relating Anthropometric Profile to Countermovement Jump Performance and External Match Load in Mexican National Team Soccer Players: An Exploratory Study. Sports 2025, 13, 236. [Google Scholar] [CrossRef] [Scilit]
- von Elm, E.; Altman, D.G.; Egger, M.; Pocock, S.J.; Gøtzsche, P.C.; Vandenbroucke, J.P. The Strengthening the Reporting of Observational Studies in Epidemiology (STROBE) Statement: Guidelines for Reporting Observational Studies. Lancet 2007, 370, 1453–1457. [Google Scholar] [CrossRef] [Scilit]
- Shepherd, J.A.; Baim, S.; Bilezikian, J.P.; Schousboe, J.T. Executive Summary of the 2013 International Society for Clinical Densitometry Position Development Conference on Body Composition. J. Clin. Densitom. 2013, 16, 489–495. [Google Scholar] [CrossRef] [Scilit]
- Crabtree, N.J.; Arabi, A.; Bachrach, L.K.; Fewtrell, M.; El-Hajj Fuleihan, G.; Kecskemethy, H.H.; Jaworski, M.; Gordon, C.M. Dual-Energy X-Ray Absorptiometry Interpretation and Reporting in Children and Adolescents: The Revised 2013 ISCD Pediatric Official Positions. J. Clin. Densitom. 2014, 17, 225–242. [Google Scholar] [CrossRef] [Scilit]
- Moore, S.A.; McKay, H.A.; Macdonald, H.; Nettlefold, L.; Baxter-Jones, A.D.G.; Cameron, N.; Brasher, P.M.A. Enhancing a Somatic Maturity Prediction Model. Med. Sci. Sports Exerc. 2015, 47, 1755–1764. [Google Scholar] [CrossRef] [Scilit]
- Rothman, K.J.; Greenland, S. Planning Study Size Based on Precision Rather Than Power. Epidemiology 2018, 29, 599–603. [Google Scholar] [CrossRef] [Scilit]
- Kerr, A.; Slater, G.J.; Byrne, N. Impact of Food and Fluid Intake on Technical and Biological Measurement Error in Body Composition Assessment Methods in Athletes. Br. J. Nutr. 2017, 117, 591–601. [Google Scholar] [CrossRef] [Scilit]
- Hind, K.; Oldroyd, B.; Truscott, J.G. In Vivo Precision of the GE Lunar iDXA Densitometer for the Measurement of Total Body Composition and Fat Distribution in Adults. Eur. J. Clin. Nutr. 2011, 65, 140–142. [Google Scholar] [CrossRef] [Scilit]
- Damilakis, J.; Adams, J.E.; Guglielmi, G.; Link, T.M. Radiation Exposure in X-Ray-Based Imaging Techniques Used in Osteoporosis. Eur. Radiol. 2010, 20, 2707–2714. [Google Scholar] [CrossRef] [Scilit]
- VanItallie, T.B.; Yang, M.U.; Heymsfield, S.B.; Funk, R.C.; Boileau, R.A. Height-Normalized Indices of the Body’s Fat-Free Mass and Fat Mass: Potentially Useful Indicators of Nutritional Status. Am. J. Clin. Nutr. 1990, 52, 953–959. [Google Scholar] [CrossRef] [Scilit]
- Kozieł, S.M.; Malina, R.M. Modified Maturity Offset Prediction Equations: Validation in Independent Longitudinal Samples of Boys and Girls. Sports Med. 2018, 48, 221–236. [Google Scholar] [CrossRef] [Scilit]
- Hopkins, W.G.; Marshall, S.W.; Batterham, A.M.; Hanin, J. Progressive Statistics for Studies in Sports Medicine and Exercise Science. Med. Sci. Sports Exerc. 2009, 41, 3–13. [Google Scholar] [CrossRef] [Scilit]
- Hedges, L.V.; Olkin, I. Statistical Methods for Meta-Analysis; Academic Press: Orlando, FL, USA, 1985. [Google Scholar]
- Long, J.S.; Ervin, L.H. Using Heteroscedasticity Consistent Standard Errors in the Linear Regression Model. Am. Stat. 2000, 54, 217–224. [Google Scholar] [CrossRef] [Scilit]
- Holm, S. A Simple Sequentially Rejective Multiple Test Procedure. Scand. J. Stat. 1979, 6, 65–70. [Google Scholar]
- Milanese, C.; Cavedon, V.; Corradini, G.; De Vita, F.; Zancanaro, C. Seasonal DXA-Measured Body Composition Changes in Professional Male Soccer Players. J. Sports Sci. 2015, 33, 1219–1228. [Google Scholar] [CrossRef] [Scilit]
- Devlin, B.L.; Kingsley, M.; Leveritt, M.D.; Belski, R. Seasonal Changes in Soccer Players’ Body Composition and Dietary Intake Practices. J. Strength Cond. Res. 2017, 31, 3319–3326. [Google Scholar] [CrossRef] [Scilit]
- Suarez-Arrones, L.; Petri, C.; Maldonado, R.A.; Torreno, N.; Munguía-Izquierdo, D.; Di Salvo, V.; Méndez-Villanueva, A. Body Fat Assessment in Elite Soccer Players: Cross-Validation of Different Field Methods. Sci. Med. Footb. 2018, 2, 203–208. [Google Scholar] [CrossRef] [Scilit]
- Cavedon, V.; Zancanaro, C.; Milanese, C. The Muscle–Bone Unit in Male Elite Soccer Players Aged 14–19. J. Funct. Morphol. Kinesiol. 2025, 10, 432. [Google Scholar] [CrossRef] [Scilit]
- Hagman, M.; Helge, E.W.; Fristrup, B.; Jørgensen, N.R.; Helge, J.W.; Krustrup, P. High Bone Mineral Density in Lifelong Trained Female Team Handball Players and Young Elite Football Players. Eur. J. Appl. Physiol. 2021, 121, 2825–2836. [Google Scholar] [CrossRef] [Scilit]
- Mirwald, R.L.; Baxter-Jones, A.D.G.; Bailey, D.A.; Beunen, G.P. An Assessment of Maturity from Anthropometric Measurements. Med. Sci. Sports Exerc. 2002, 34, 689–694. [Google Scholar] [CrossRef] [Scilit]
- Hopkins, W.G. Measures of Reliability in Sports Medicine and Science. Sports Med. 2000, 30, 1–15. [Google Scholar] [CrossRef] [Scilit]
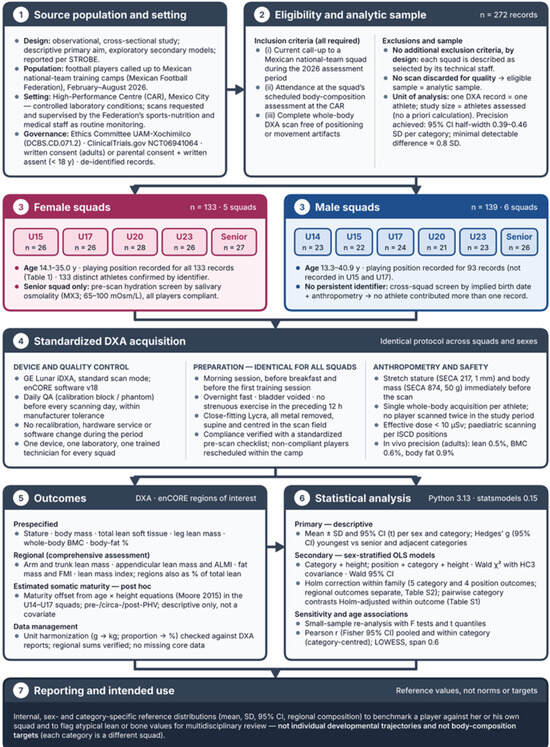
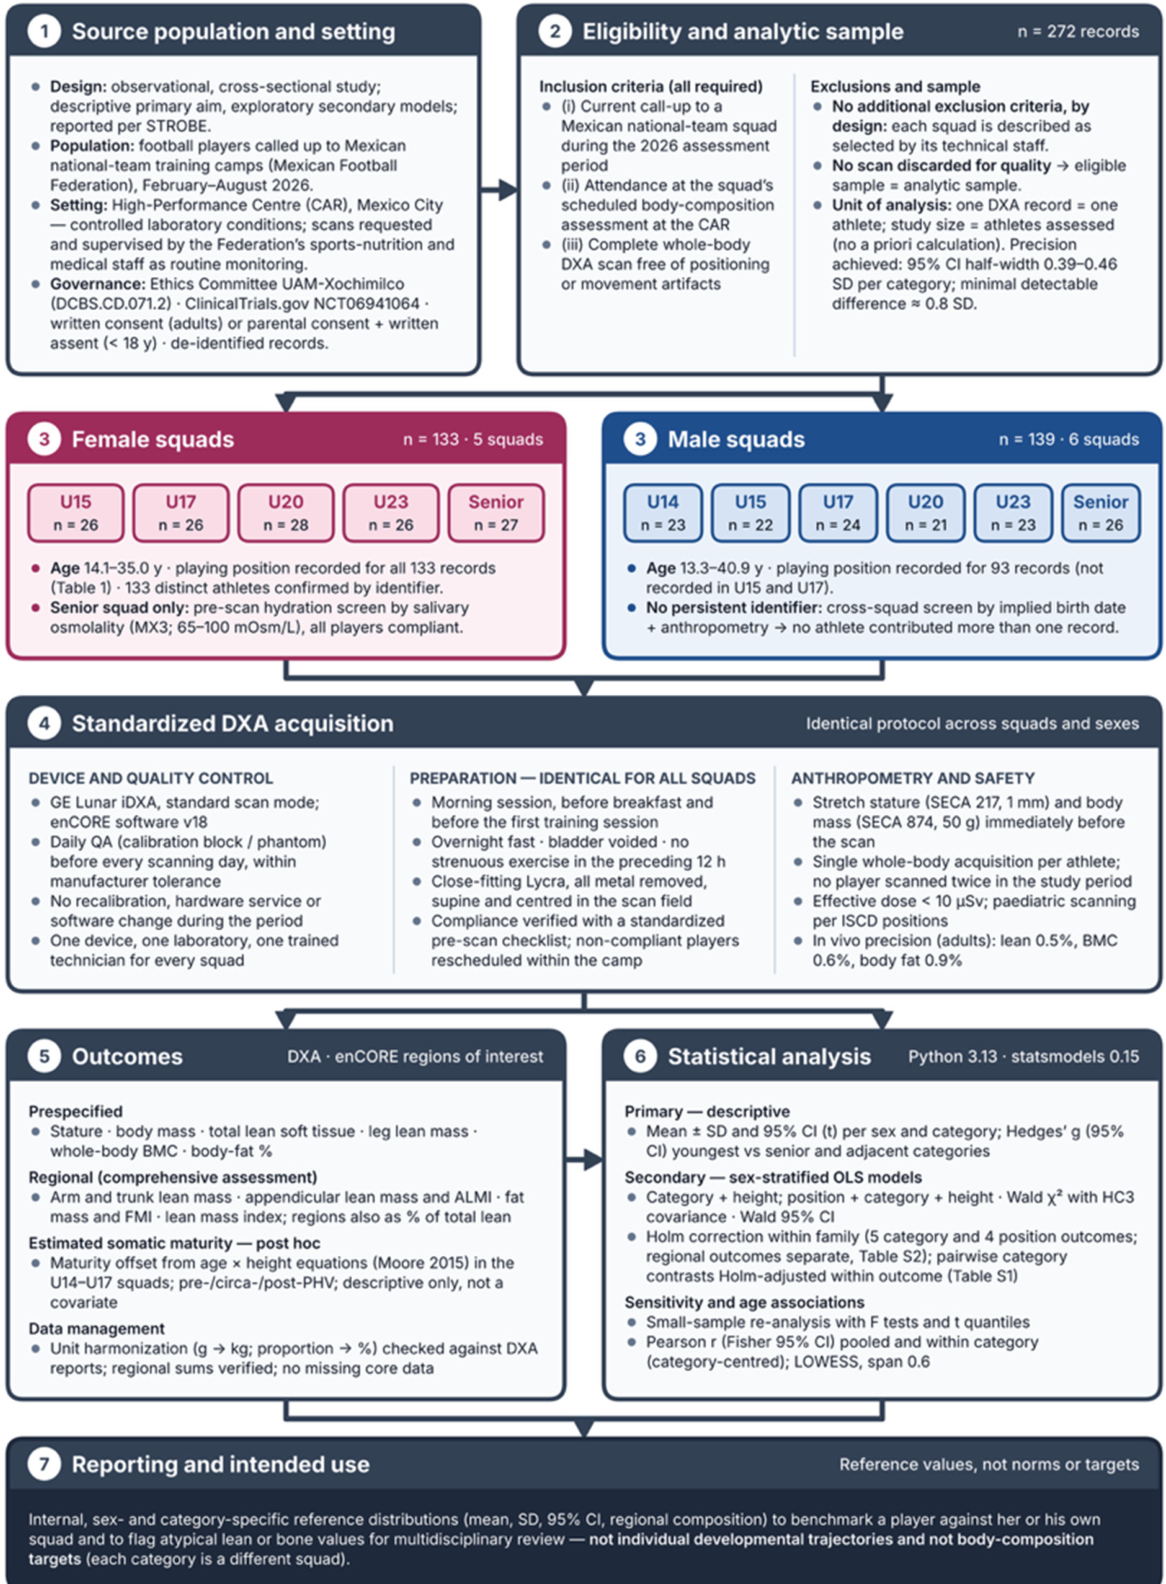
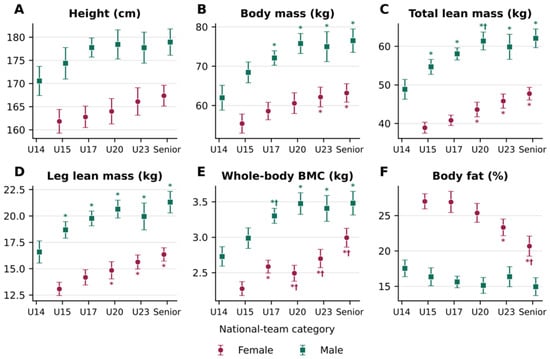
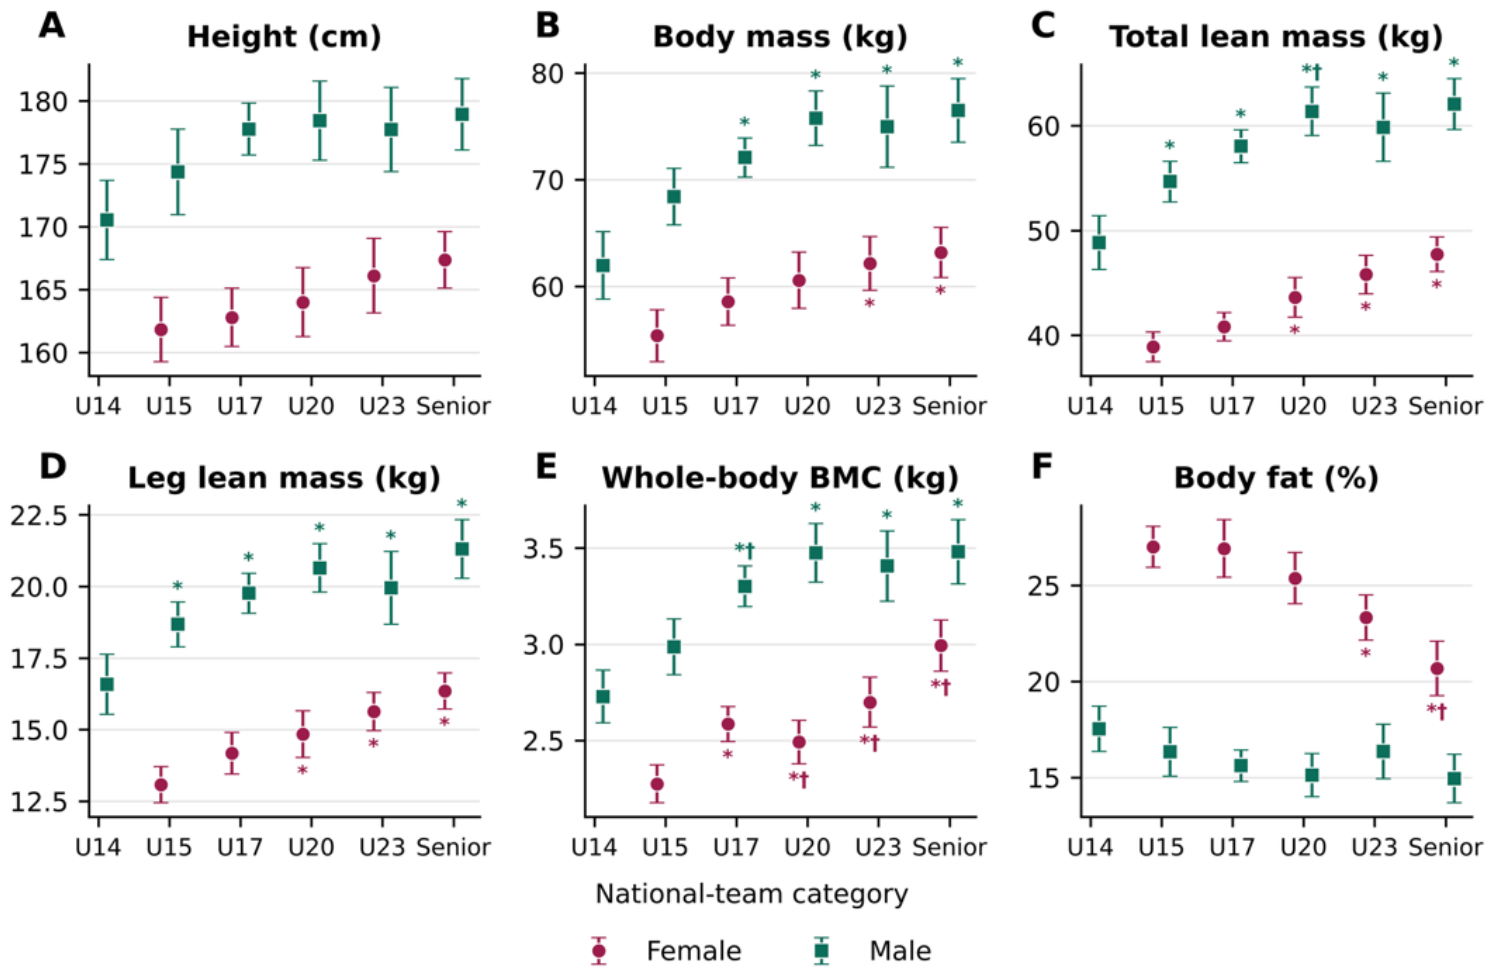
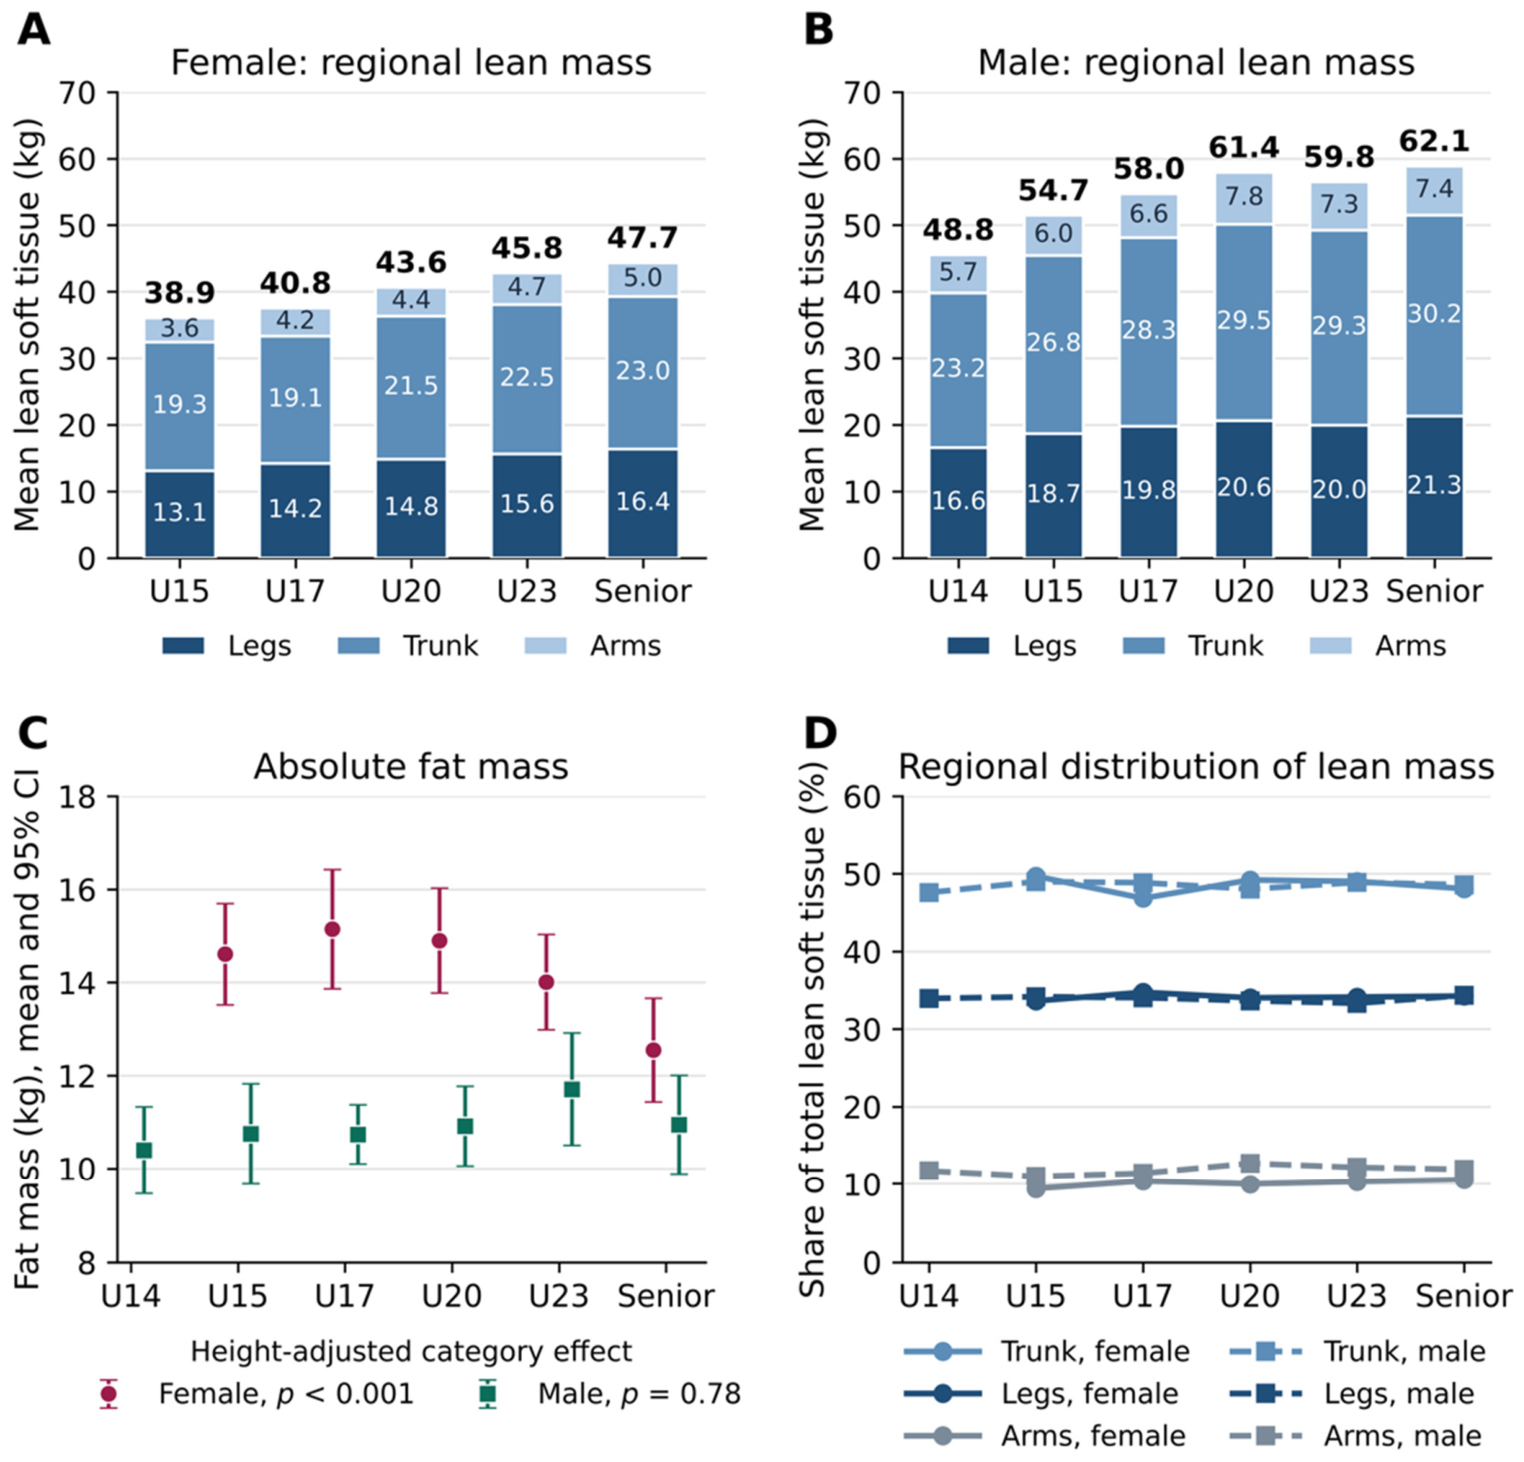
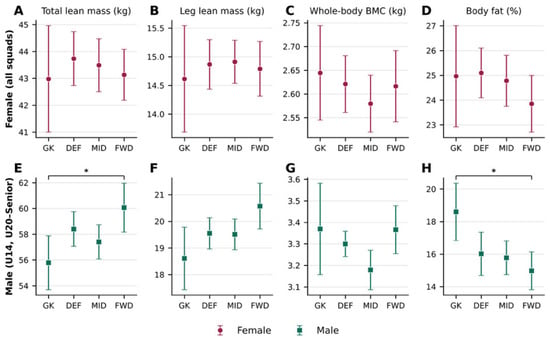
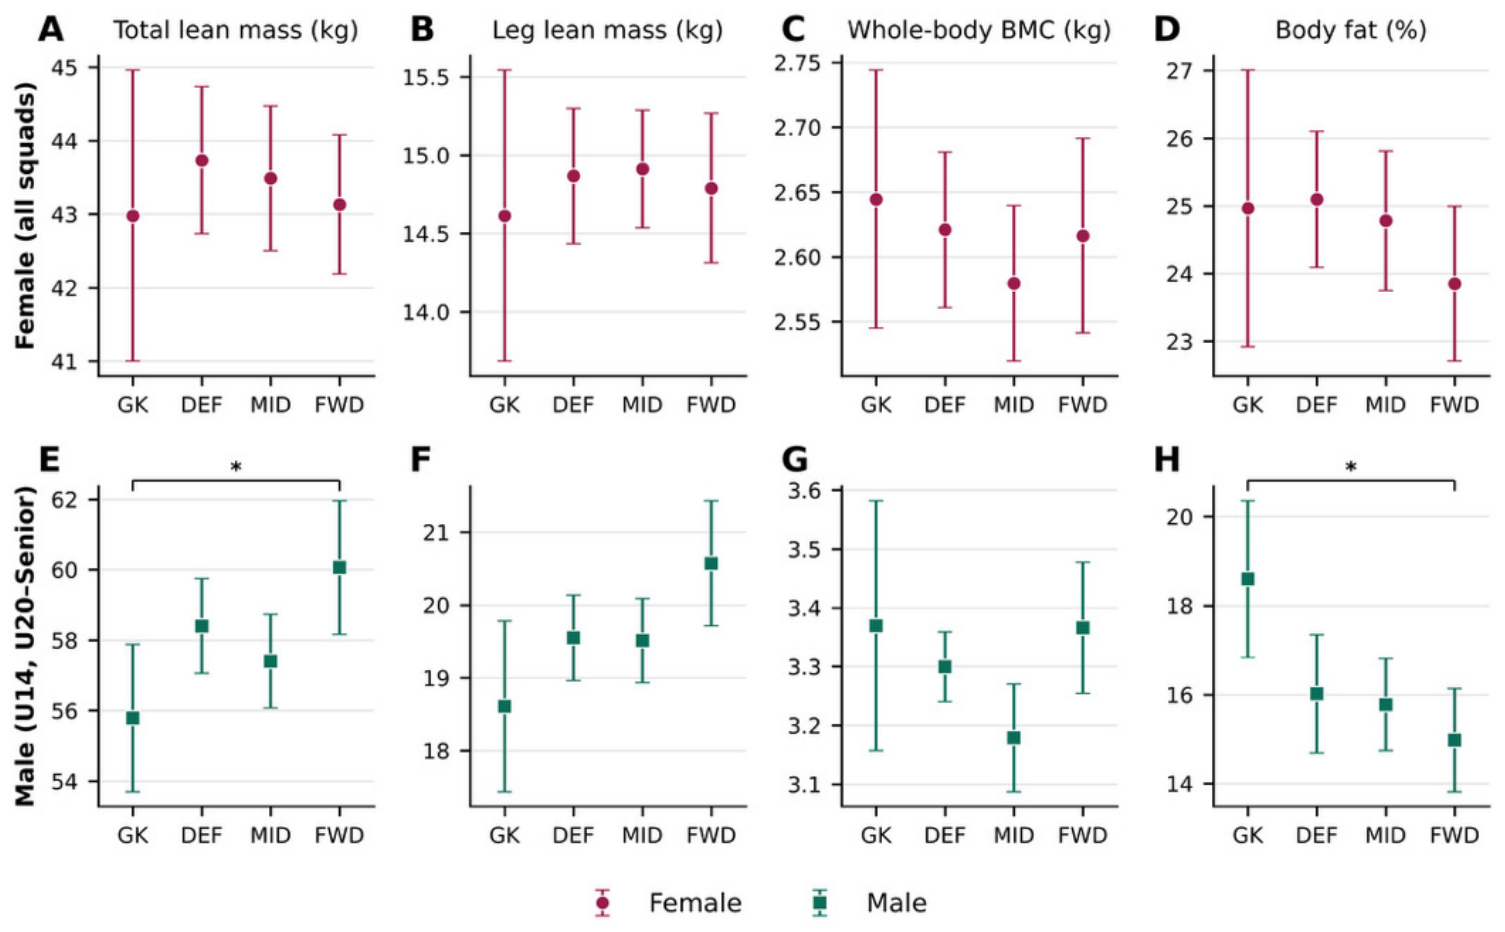

Disclaimer/Publisher’s Note: The statements, opinions and data contained in all publications are solely those of the individual author(s) and contributor(s) and not of MDPI and/or the editor(s). MDPI and/or the editor(s) disclaim responsibility for any injury to people or property resulting from any ideas, methods, instructions or products referred to in the content. |
© 2026 by the authors. Licensee MDPI, Basel, Switzerland. This article is an open access article distributed under the terms and conditions of the Creative Commons Attribution (CC BY) license.