


Simple Summary
We used ensemble species distribution models combining climate, elevation, vegetation, and human footprint to project current and future habitats for the Parnassius imperator, a rare endemic and endangered butterfly in China. Our findings indicate that suitable habitats will contract significantly, and P. imperator will face a sharply increasing risk of extinction in the future. We propose expanded protected areas, monitoring, habitat restoration, and public education, providing a scientific basis for climate-adaptive conservation.
Abstract
Climate change and habitat loss pose severe threats to the survival of alpine butterflies worldwide. Parnassius imperator is a rare, endemic, and endangered butterfly in China, yet the spatiotemporal dynamics of its suitable habitats under climate change remain largely unknown. In this study, we applied ensemble species distribution models to simulate the shifts of its current and future suitable habitats, incorporating bioclimatic variables, elevation, normalized difference vegetation index, and human footprint. Results showed that the current suitable habitats cover 185.87 × 10⁴ km2 and are concentrated in western China, mainly regulated by elevation, temperature seasonality (BIO4), precipitation of the wettest month (BIO13), precipitation of the warmest quarter (BIO18), and precipitation of the driest month (BIO14). Under future climate change scenarios, suitable habitats will shrink drastically, even to only 82.16 × 10⁴ km2 under SSP585 in the 2070s, with nearly a complete loss of highly suitable habitats. In addition, centroid shift analyses reveal that the distribution centroid will shift eastward. Our findings indicate that suitable habitats will contract significantly, and P. imperator will face a sharply increasing risk of extinction in the future. Considering the overlap between suitable habitats and existing nature reserves, we recommend implementing integrated conservation strategies, including expanding protected areas, establishing long-term monitoring programs, restoring habitats, and strengthening law enforcement and public education. This study provides a scientific basis for the climate-adaptive conservation of P. imperator and other vulnerable alpine insects.
1. Introduction
Climate change and habitat degradation have exerted profound and far-reaching impacts on the survival and geographical distribution of species worldwide. This often triggers a decline in global biodiversity, which has been formally recognized as the “biodiversity crisis” [1,2]. This ongoing ecological disruption not only undermines the structural stability and functional integrity of entire ecosystems but also poses formidable challenges to global biodiversity conservation efforts [1,3]. Against the backdrop of escalating species loss, especially for threatened and protected taxa, developing science-based strategies to mitigate biodiversity decline has emerged as a pivotal and urgent research focus in the field of ecology [1,3]. Clarifying the spatiotemporal dynamics of species distributions is a fundamental component of ecological and conservation research, as it typically serves as an indispensable prerequisite for formulating and implementing targeted, effective conservation measures [4,5,6].
Species distribution models (SDMs) stand as one of the most prevalent and effective approaches for deciphering species distribution patterns. By correlating the ecological requirements of a target species derived from its known occurrence records with multi-layered environmental predictor datasets, SDMs enable the projection of the species’ potential distribution across diverse habitats that share analogous environmental characteristics [7,8,9]. In practical applications, an ensemble modeling framework, which integrates multiple individual model algorithms (e.g., random forest (RF, Breiman, [10]) and the maximum entropy model (MaxEnt, Phillips et al. [11])), has garnered growing recognition and extensive adoption [8,12,13,14,15,16]. This ensemble approach offers notable advantages over reliance on a single SDM algorithm. For instance, it enhances the robustness and reliability of predictions while alleviating the impacts of inherent biases associated with individual models [17,18,19].
Butterflies are widely recognized as sensitive bioindicators of environmental change, particularly for alpine ecosystems, which are highly vulnerable to climate warming and harbor many rare, endemic, and evolutionarily invaluable species [20,21,22]. The butterfly genus Parnassius is recognized as a representative group of alpine butterflies, inherently adapted to high-altitude environments [23]. With ongoing climate warming, these butterflies are forced to shift their habitats toward higher elevations, where suitable montane grassland habitats are increasingly scarce. This habitat compression has rendered several Parnassius species highly vulnerable to extinction [4,24]. Parnassius imperator Oberthür, 1883, belongs to the genus Parnassius of the family Papilionidae in the order Lepidoptera. Among Parnassius butterflies, it is a relatively large-sized species and is endemic to China, primarily distributed in Qinghai, Sichuan, Tibet, Yunnan, and Gansu provinces [25,26]. It mainly inhabits alpine meadows, gravel slopes, and valley areas with bare rocks at elevations between 1900 and 3835 m [26,27]. Its larvae feed exclusively on Corydalis adunca (Papaveraceae), an endemic herb, and adults rely on specific nectar plants near rocky habitats [26]. Currently, the species faces multiple threats, including climate warming, extreme weather events, habitat loss caused by overgrazing and mining, and human disturbance, all of which have led to population decline and habitat fragmentation [26]. Along with most of Parnassius species, P. imperator has been listed on the List of Key Protected Wild Animals in China (https://www.forestry.gov.cn/).
In terms of exploring the spatiotemporal dynamics of Parnassius distribution via species distribution models (SDMs), a work by Sbaraglia et al. [4] employed the MaxEnt algorithm to simulate the habitat range fluctuations of Parnassius apollo throughout the Quaternary glacial cycles. Subsequently, Yu et al. [28] utilized the same algorithm to assess the projected changes in species richness of 59 Papilionidae species (including 11 Parnassius taxa) in the Hengduan mountains. More recently, Koo and Park [20] adopted an ensemble modeling approach to evaluate the current and future distribution patterns of Parnassius bremeri and its two host plant species in the Republic of Korea. Despite these advances, research on the SDM-based distribution dynamics of P. imperator remains notably absent.
In the present study, we constructed ensemble species distribution models under diverse climate change scenarios, integrating key environmental variables including climatic factors, elevation, human footprint (HFP), and the normalized difference vegetation index (NDVI). Our main objectives were: (1) to deepen the understanding of the spatiotemporal distribution dynamics of the ecologically valuable P. imperator and the underlying driving factors; (2) to systematically assess the species’ current conservation status and future extinction risk exacerbated by climate change; (3) and ultimately to provide implications for the long-term conservation and sustainable management of P. imperator and ecologically related species.
2. Materials and Methods
2.1. Occurrence Data
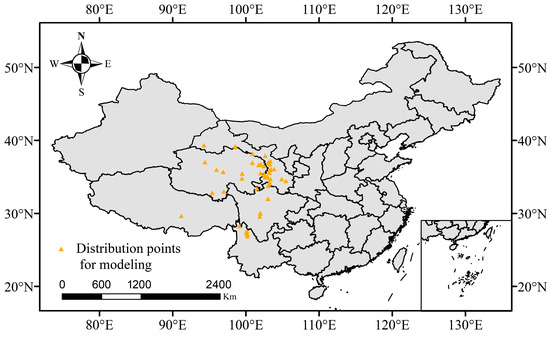
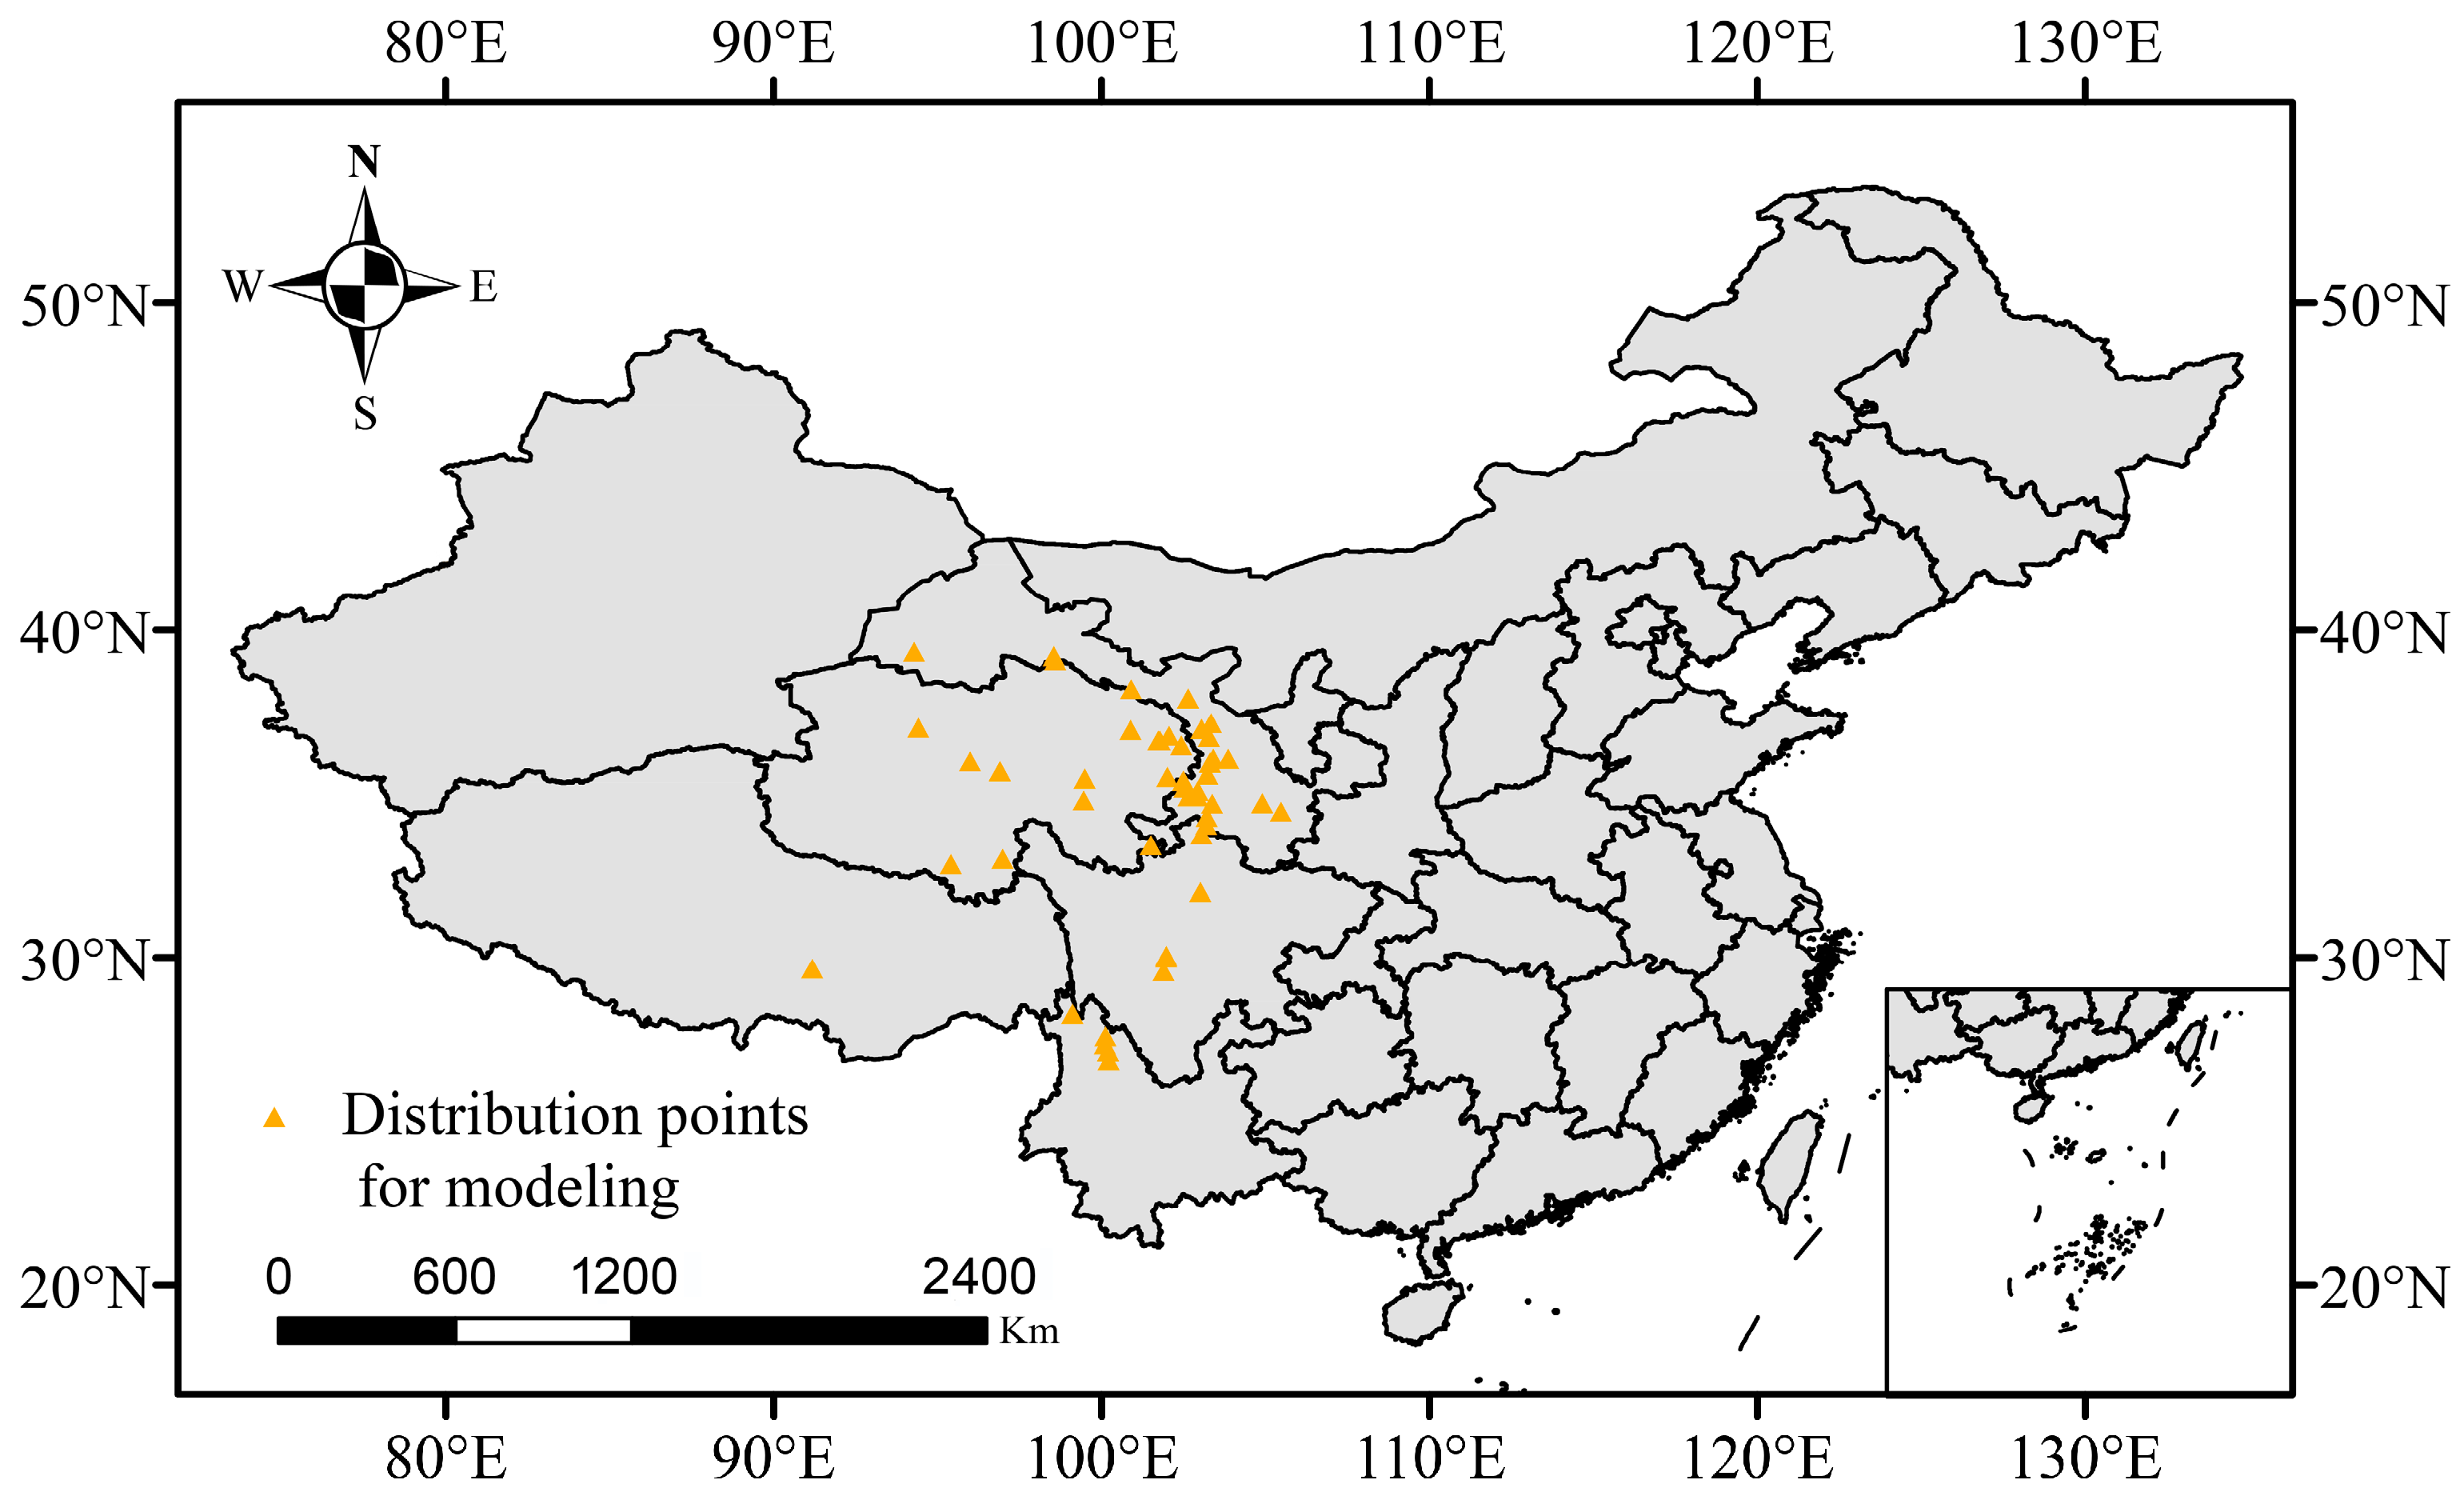
We collected the distribution records of P. imperator mainly from the Global Biodiversity Information website (GBIF, https://www.gbif.org/species/1938659, accessed on 10 March 2024), the published literature searched in the Web of Science (https://www.webofscience.com, accessed 15 March 2024), and the China National Knowledge Infrastructure (https://www.cnki.net, accessed 20 March 2024). The distribution records from the GBIF were acquired using the R package “rgbif” [29] in the form of latitude and longitude coordinates. The distribution information in the literature, which only provided detailed localities such as town names and natural reserve regions, was converted into coordinate forms using the online system (https://api.map.baidu.com/lbsapi/getpoint/, accessed on 10 April 2024). In total, we gathered 63 initial distribution records of P. imperator. Then, we used the clean_coordinates function of the R package “CoordinateCleaner” version 2.0 [30] to delete the probable invalid records assigned to the sea, country capitals, or biodiversity institutions. Moreover, to mitigate spatial data bias arising from uneven clustering of occurrence records, such as overconcentration in the same grid cell or easily accessible areas, the dataset was spatially thinned using the R package “spThin” version 0.2.0 [31]. This step ensured no more than one occurrence record per environmental grid cell (approximately 4.5 km2). After processing, 48 distribution records were finally retained and used in subsequent analyses (Figure 1, Table S1). We bounded the modeling area with the coordinates (73.42° E, 55.68° N; 136.42° E, 55.68° N; 136.42° E, 18.18° N; 73.42° W, 18.18° N), and all distribution records were within this range.
Figure 1.
Occurrence records of Parnassius imperator in China used in the models.
2.2. Variable Selection and Screening
We considered diverse variables associated with climate, topography, normalized difference vegetation index (NDVI), human population density (HPD), and human footprint (HFP) in the modeling to account for the reality that the distribution pattern of one species is jointly determined by various biotic and abiotic factors [32,33]. We obtained 19 bioclimatic variables (BIO1–BIO19) and one topographic variable (elevation) from WorldClim (http://www.worldclim.org/). The climate layers representing the near-current years (1970–2000) and three future periods (2030s: 2021–2040; 2050s: 2041–2060; 2070s: 2061–2080) were downloaded at a 2.5′ spatial resolution. Since different global climate models (GCMs) show different sensitivities to future climate projections, the use of more than one GCM is regarded as improving the reliability of the modeling [5,17]. For each future period, we used three GCMs (BCC-CSM2-MR, IPSL-CM6A-LR, and MRI-ESM2-0) under two shared socioeconomic paths (SSPs: SSP126 and SSP585) in the Coupled Model Intercomparison Project 6 (CMIP6) version [34,35,36,37,38]. Multicollinearity may be present among variables, which can cause model over-fitting. To address this issue, we conducted a Pearson’s correlation analysis among the 19 climatic variables (Figure S1). Then, for the two variables with the correlation coefficient |r| > 0.8 [39,40], the Maximum Entropy (Maxent) algorithm was used to build an initial model to obtain the percentage contribution of each environmental variable, and the one with a lower contribution was removed in subsequent modeling [11,41,42]. Finally, we selected seven bioclimatic variables to predict the potential current and future distribution of P. imperator habitats (Table S2). We downloaded the NDVI layers at a spatial resolution of 0.25 km2. The remote-sensing vegetation layer data from 2023 (https://lpdaac.usgs.gov/products/mod13q1v061/, accessed on 15 March 2024) were downloaded and further processed using MRT 4.1 (NASA, Washington, DC, USA), ENVI 5.3 (Exelis Visual Information Solutions Corporation, Boulder, CO, USA), and ArcGIS 10.4 (Esri, Redlands, CA, USA), with monthly values aggregated into annual means. In addition, we downloaded the layers of HPD (https://sedac.ciesin.columbia.edu, accessed on 20 April 2024) and HFP (https://www.earthdata.nasa.gov/) at a resolution of 0.25 km2. After layer screening, however, we only retained HFP for use in the modeling due to their strong correlation (|r| > 0.8), as also suggested by Li et al. [12]. Finally, all kinds of variable layers were processed with a 2.5′ spatial resolution (with the raster grid about 4.5 km2 in size).
Given that elevation strongly influences the distribution of P. imperator as an alpine butterfly, and no credible, globally consistent future scenarios are available for NDVI and HFP at the appropriate temporal scales, we constructed models based on two sets of variables: one combining bioclimatic variables and elevation (BIOs + elevation), and the other comprising all variables (BIOs + elevation + NDVI + HFP). The BIOs + elevation model was used for both current and future projections to assess the spatiotemporal dynamics of suitable habitats. The full-variable model was applied to evaluate the relative contributions of all predictors in addition to defining the potential suitable range of P. imperator comparable to that under the BIOs + elevation.
2.3. Species Distribution Modeling
In this study, ensemble model simulation was implemented in two main steps: individual model selection and ensemble model construction by integrating multiple single models. Both procedures were performed using the R package “sdm” [43]. The detailed modeling workflow is described as follows:
- (1)
- With the occurrence records and environmental layers (BIOs + elevation or BIOs + elevation + NDVI + HFP) as input files, the performance of each of the twelve commonly used model algorithms implemented in the R package “sdm” version 1.1-8 [43] was evaluated. These models included BIOCLIM [44], classification and regression trees (CART) [45], Domain [46], flexible discriminant analysis (FDA) [47], generalized additive model (GAM) [48], generalized linear model (GLM) [49], Glmnet [50], maximum entropy (MaxEnt) [11], Maxlike [51], multivariate adaptive regression spline (MARS) [52], random forests (RF) [10], and support vector machine (SVM) [53].
- (2)
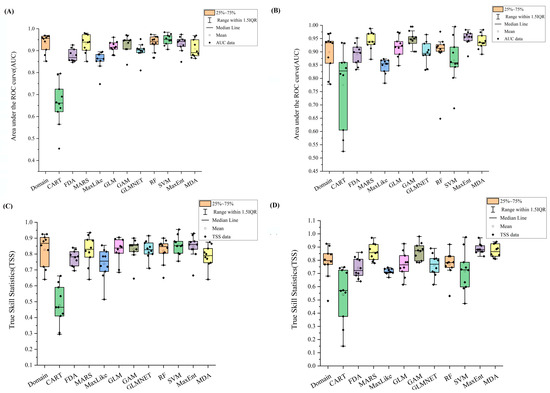
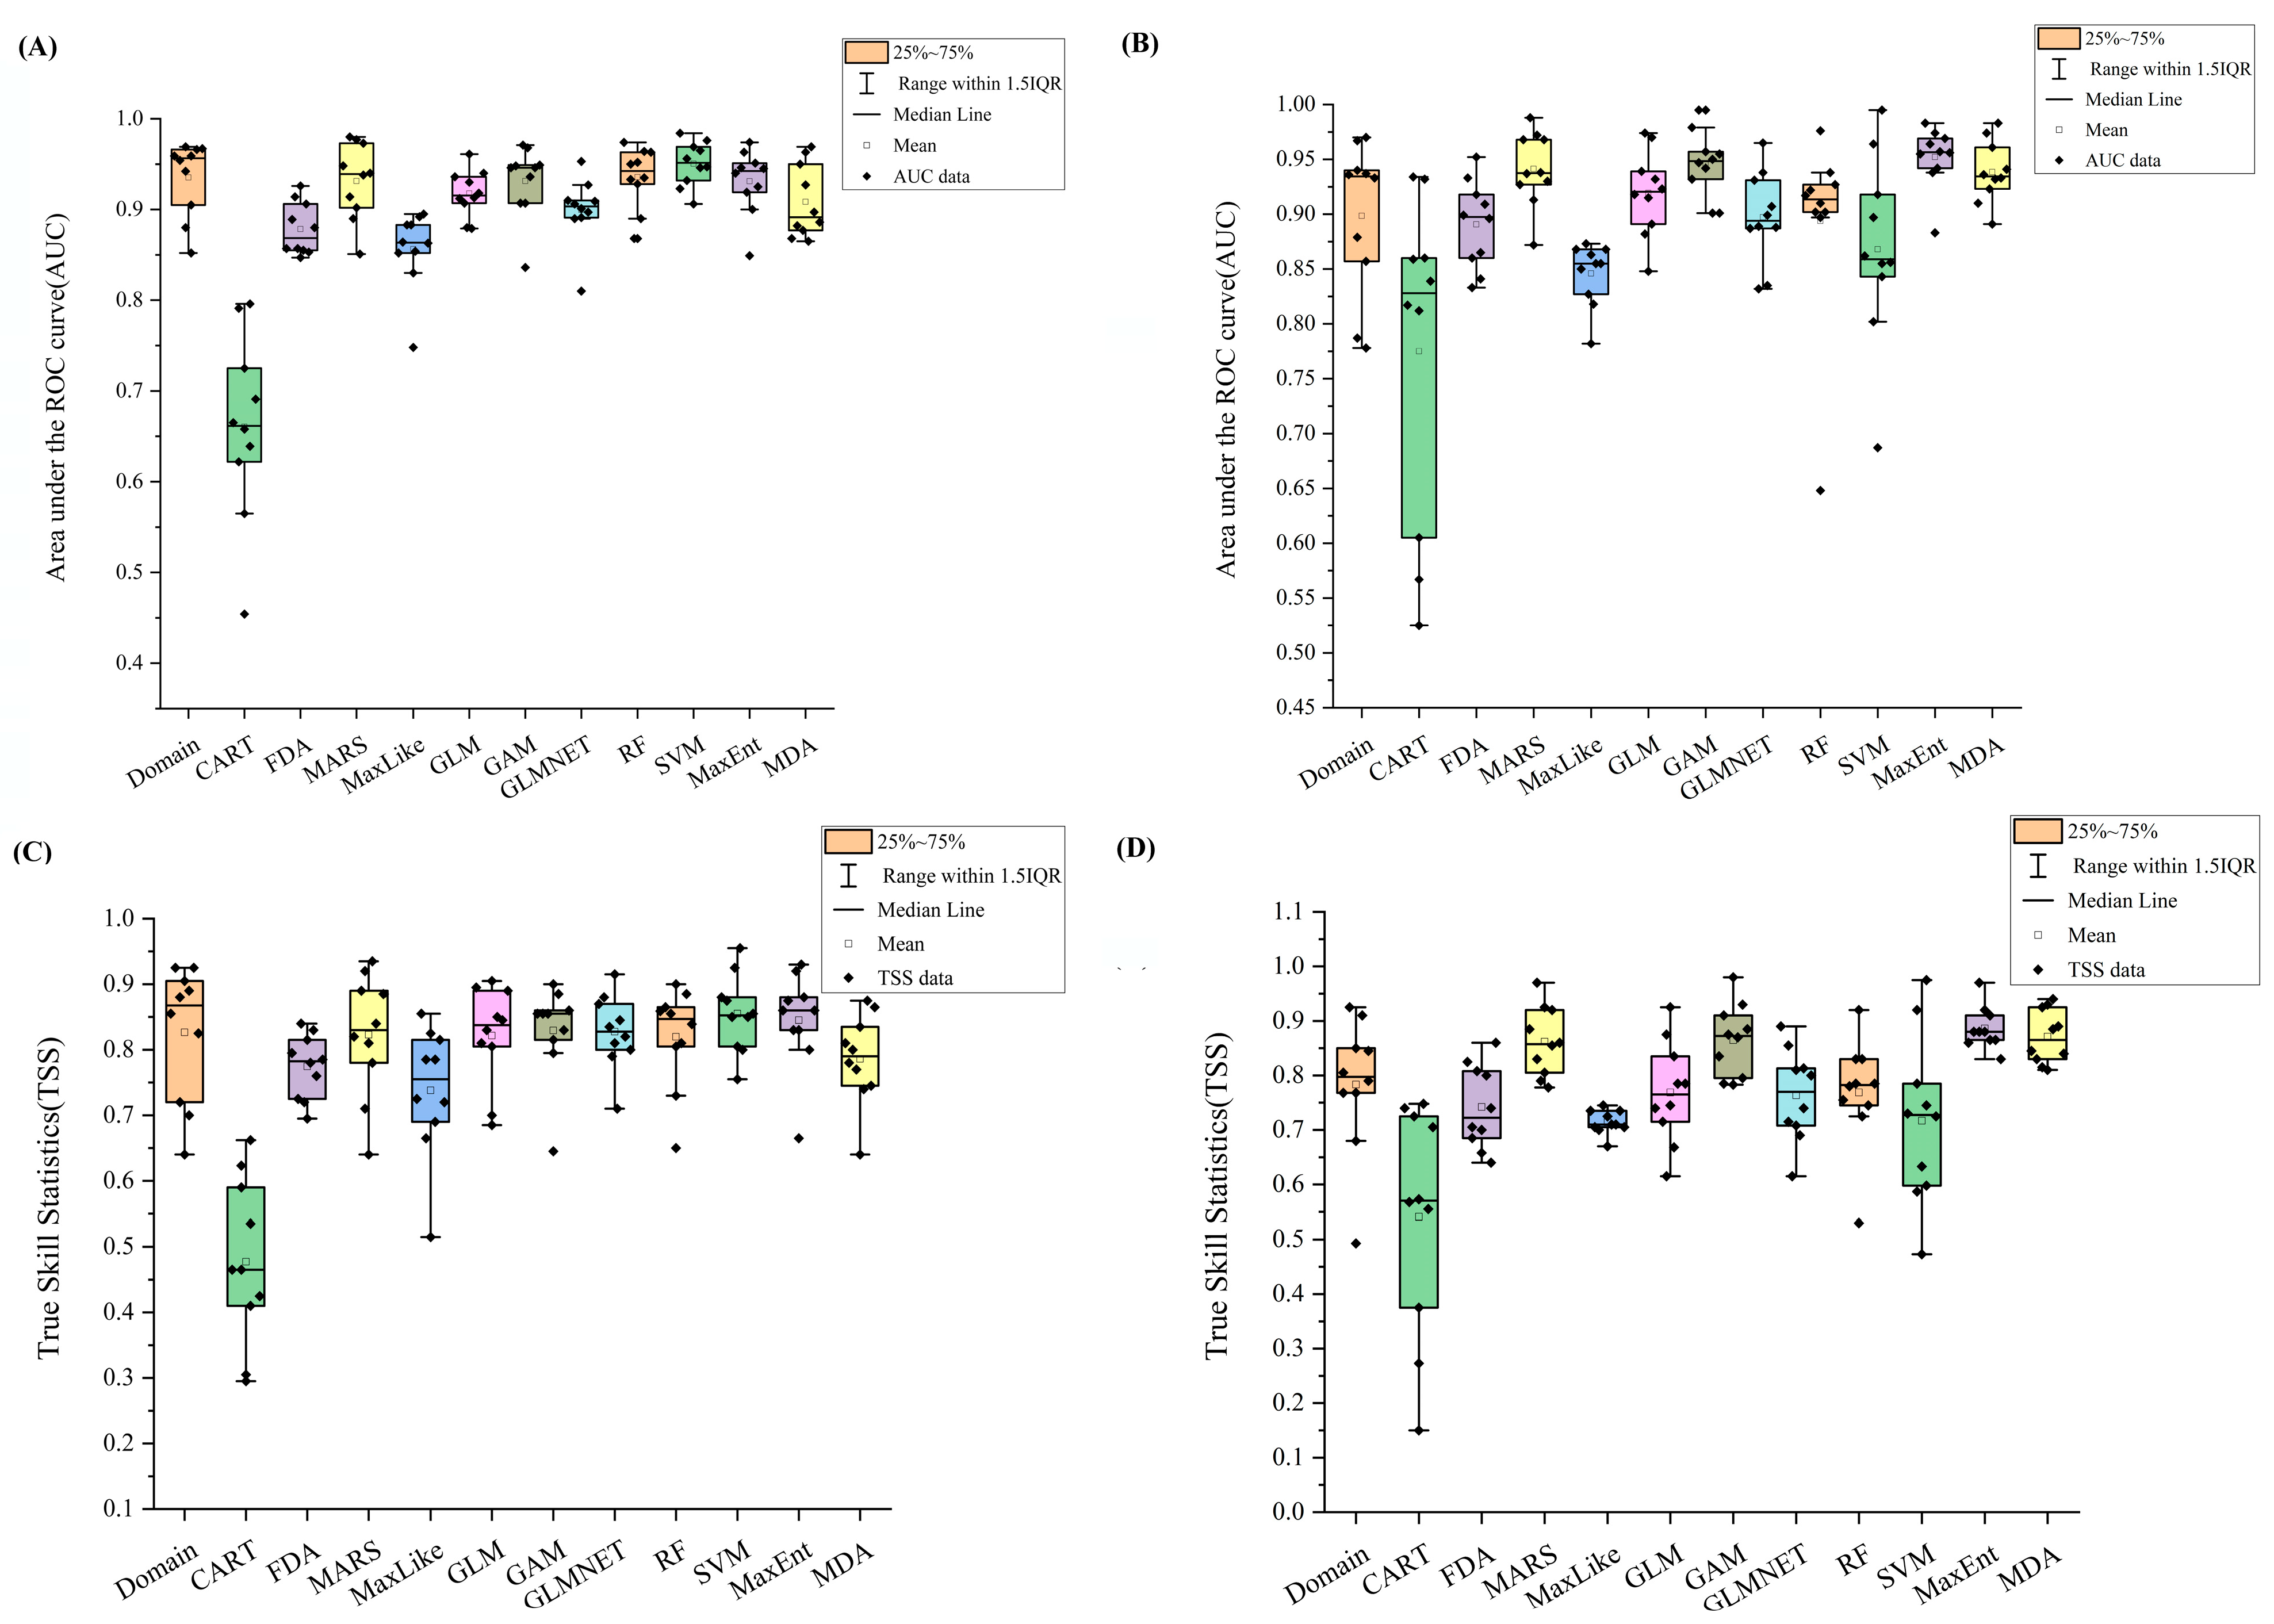
- The main parameters in the evaluation were used as follows. The “gRandom” method of the “sdmData” function was used to randomly generate 1000 pseudo-absences [54]. 75% of the distribution data was set as training data, and the remaining 25% was set as test data. The maximum iterations were set to 5000 [12,55,56]. For each model with a ten-fold cross-validation approach (i.e., 120 single models), the area under a receiver operating characteristic (ROC) curve (AUC) [57] and the true skill statistic (TSS) [58] were calculated. The model with an average AUC ≥ 0.90 and TSS ≥ 0.85 was selected to be used in the following ensemble models (Figure 2).Figure 2. The area under the receiver operating characteristic curve (AUC) and true skill statistics (TSS) values of 12 commonly used species distribution models. (A) AUC values under BIOs + elevation; (B) AUC values under BIOs + elevation + NDVI + HFP; (C) TSS values under BIOs + elevation; (D) TSS values under BIOs + elevation + NDVI + HFP.
- (3)
- According to the AUC value ≥ 0.90 and TSS values ≥ 0.85, the top single models (Maxent and SVM for the BIOs + elevation; GAM, MARS, Maxent, and MDA for the BIOs + elevation + NDVI + HFP) were selected for the establishment of ensemble models developed by the R package “sdm” [43].
- (4)
- To construct an ensemble model, the “ensemble” function was used to combine the output results of the selected individual models with a weighted average approach. Besides, the settings of pseudo-absence, division of training and test data, and maximum iterations were the same as those of the selection of single models.
- (5)
- The “getVarImp” function was used to calculate the variable contribution values. Besides, the “roc” and “rcurve” functions were employed to generate the ROC curves for each model and response curves for each variable, respectively. For future projections, the “ensemble” function with a weighted average approach was used as well.
2.4. Model Evaluation
We further evaluated the projection performances of two ensemble models using both the average AUC and TSS values. From the modeling, the AUC value generally ranges from 0 to 1. An AUC of 0.7–0.8 is considered acceptable, an AUC of 0.8–0.9 is considered great, and an AUC > 0.9 is considered remarkable [59,60]. In contrast, an AUC value < 0.5 indicates that the performance is no better than random. Due to the equal consideration of sensitivity and specificity in the AUC criterion, which may lead to incorrect evaluation results [61], the TSS value, representing an improved verification index derived from the Kappa coefficient, was considered. This value ranges from −1 to +1. A value of +1 indicates perfect projection, while values of zero or less show that the model performance is no better than random [58,62].
2.5. Analyses of Model Results
All predicted habitat suitability values were visualized at the original spatial resolution of 2.5 arc-minutes, consistent with the environmental layers, using ArcGIS 10.4 (Esri, Redlands, CA, USA). Continuous habitat suitability values were derived from individual grid cells (pixels) of the environmental raster datasets. Subsequently, all grid cells were categorized into four suitability ranks, namely, “highly suitable” (0.6–1), “moderately suitable” (0.4–0.6), “lowly suitable” (0.2–0.4), and “unsuitable” (<0.2) [12,16,63]. We used the R package “ggplot2” version 4.0.2 and OriginPro version 2021 (OriginLab Corporation, Northampton, MA, USA) to visualize the response curves showing the effect of each environmental variable on the presence probability of P. imperator habitat and the variable importance in the modeling, respectively. To characterize the distribution dynamics between current and future distributions under environmental change, the suitability map was further converted into a binary grid (suitable vs. unsuitable) using a threshold of 0.2, which dichotomized each grid cell into either suitable (>0.2) or unsuitable habitat (<0.2). Accordingly, the maps showing stable, expansion, and contraction regions were generated by comparing the prediction maps under current conditions and climate-change scenarios, and the corresponding areas were calculated with ArcGIS 10.4 (Esri, Redlands, CA, USA). In addition, centroid shift analyses were conducted using ArcGIS 10.4 (Esri, Redlands, CA, USA) to evaluate the core distributional shifts of P. imperator, which can visualize the magnitude and direction of the distribution dynamics of P. imperator habitat over time.
3. Results
3.1. Model Performances
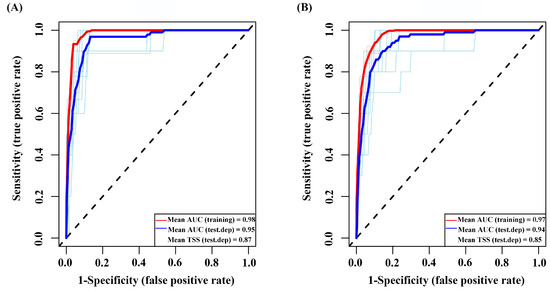
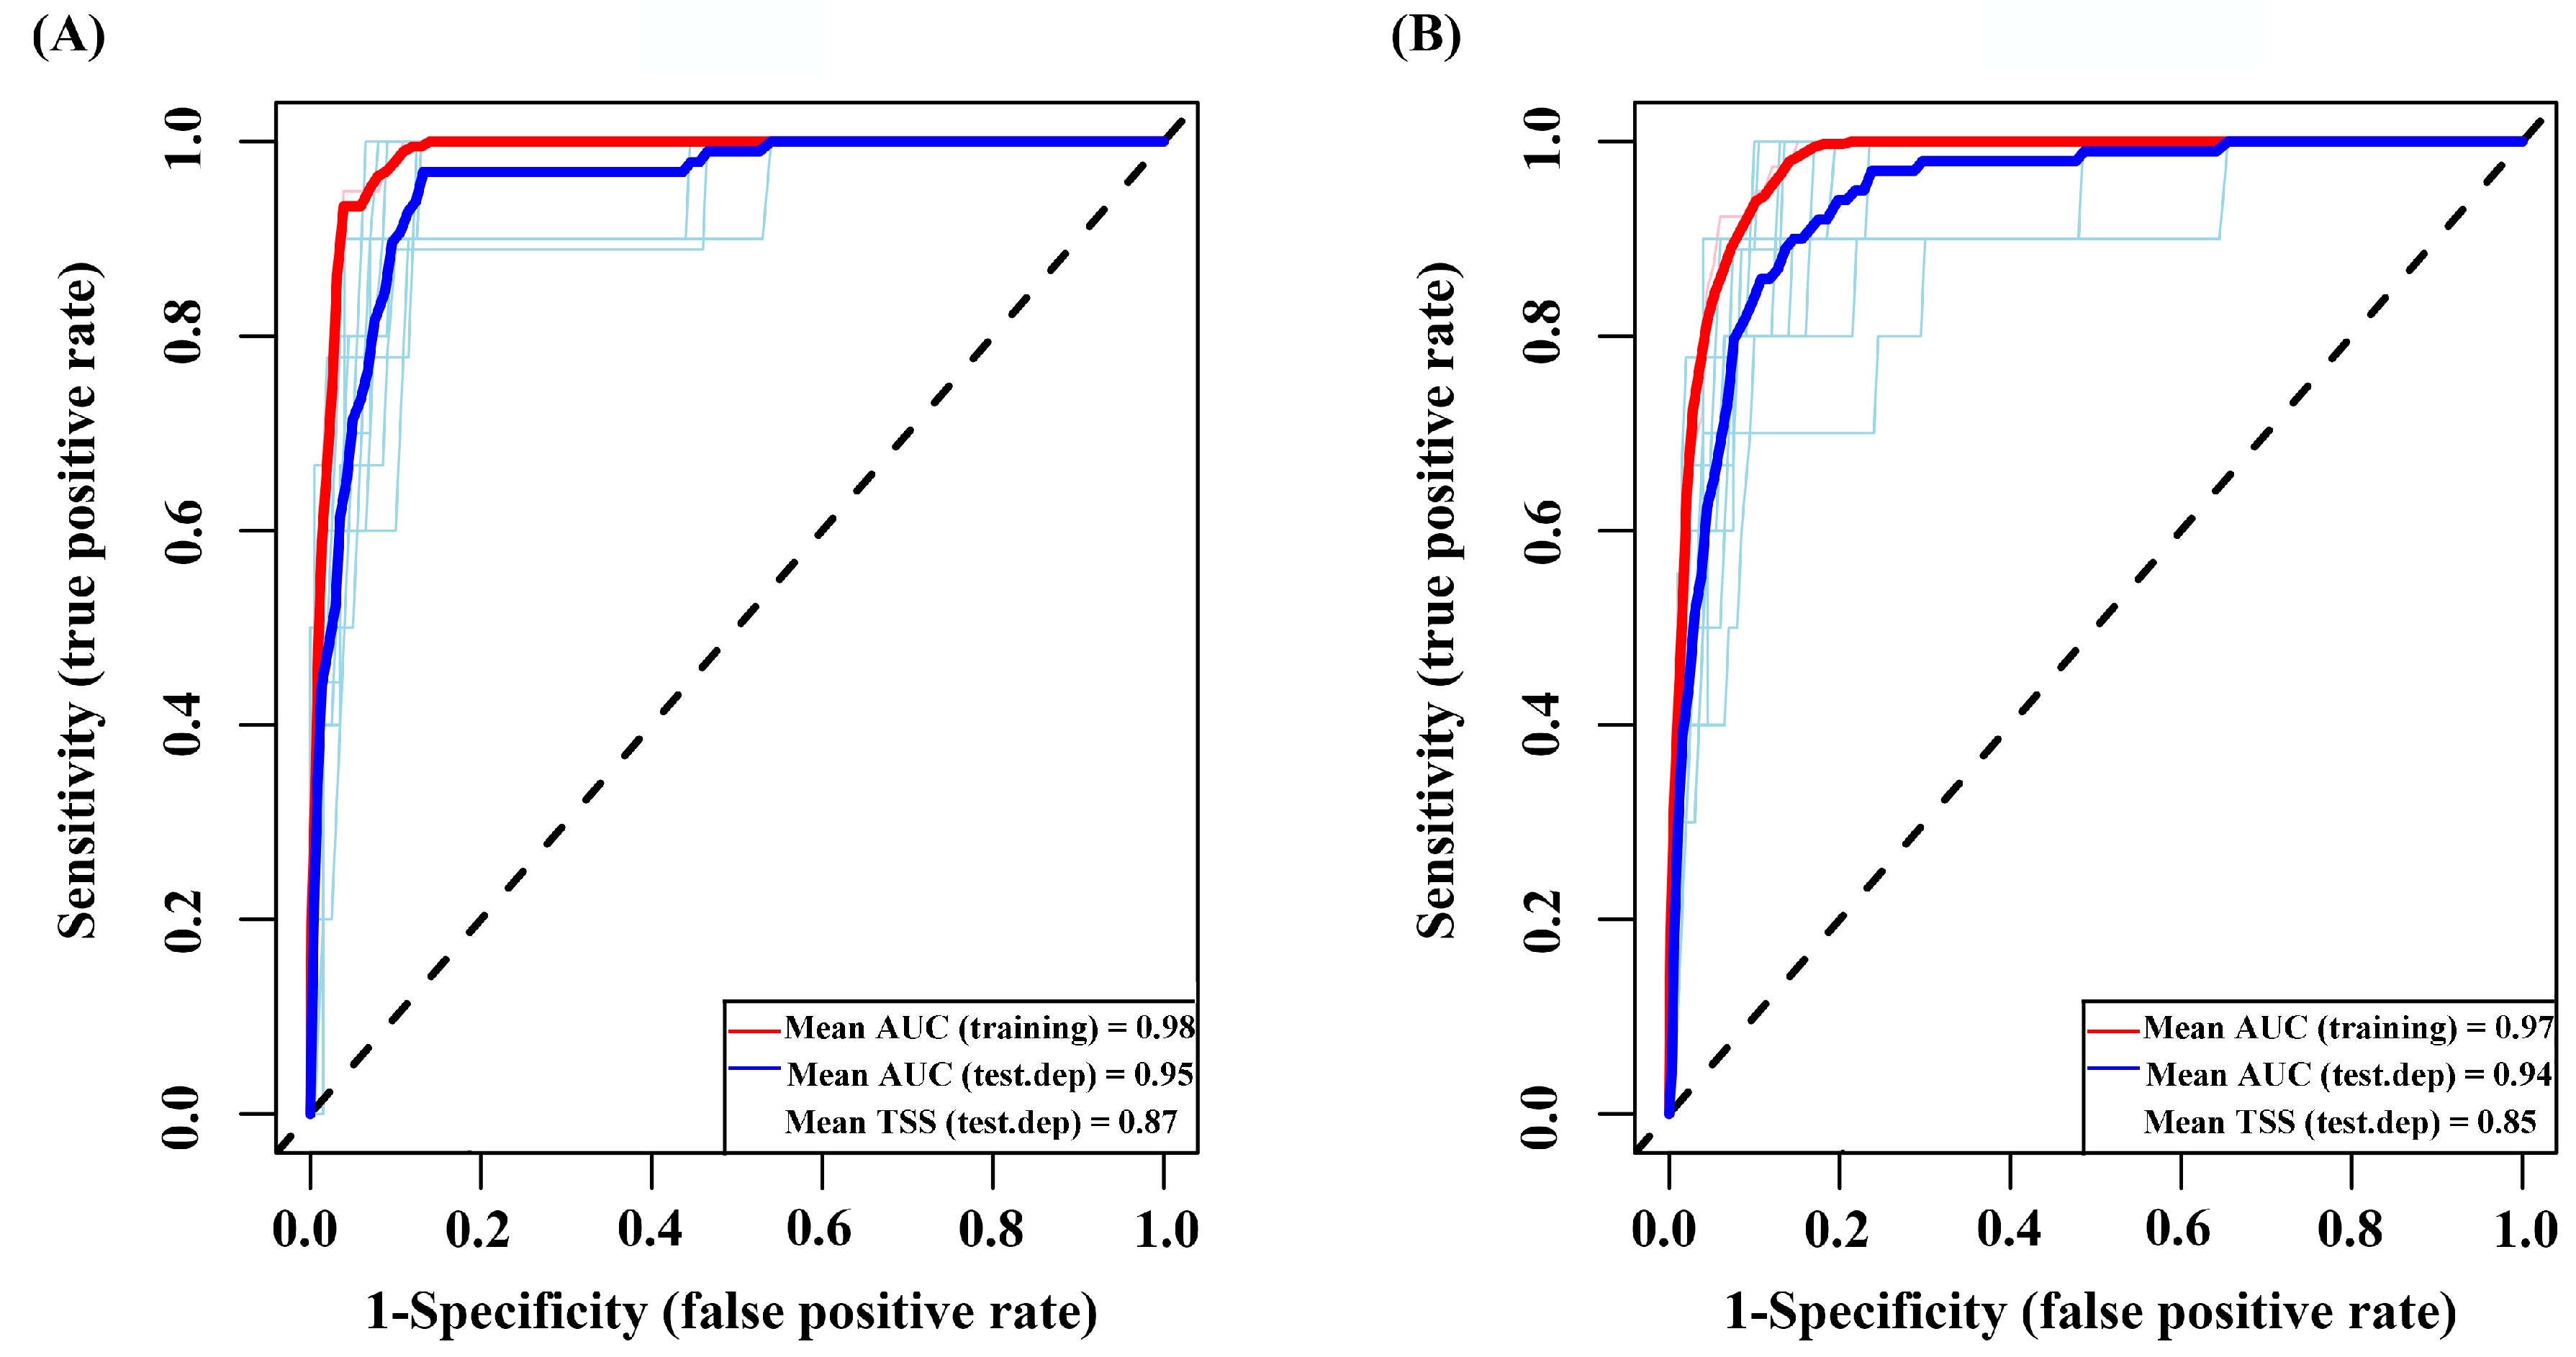
In the ensemble modeling under BIOs + elevation, the mean AUC and TSS values for the two selected models (MaxEnt and SVM) were 0.96 and 0.86, respectively (Figure 3). Under BIOs + elevation + NDVI + HFP, the mean AUC and TSS values for the four selected models (GAM, MARS, MaxEnt, and MDA) were 0.94 and 0.86, respectively (Figure S2). The high AUC and TSS values indicated that the model performances of the two ensemble models were excellent and the predicted habitat suitability was reliable.
Figure 3.
The area under the receiver operating characteristic curve (AUC) and true skill statistics (TSS) values for two used models under BIOs + elevation. (A) SVM; (B) MaxEnt.
3.2. Variable Importance
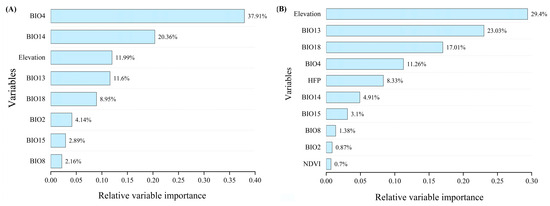
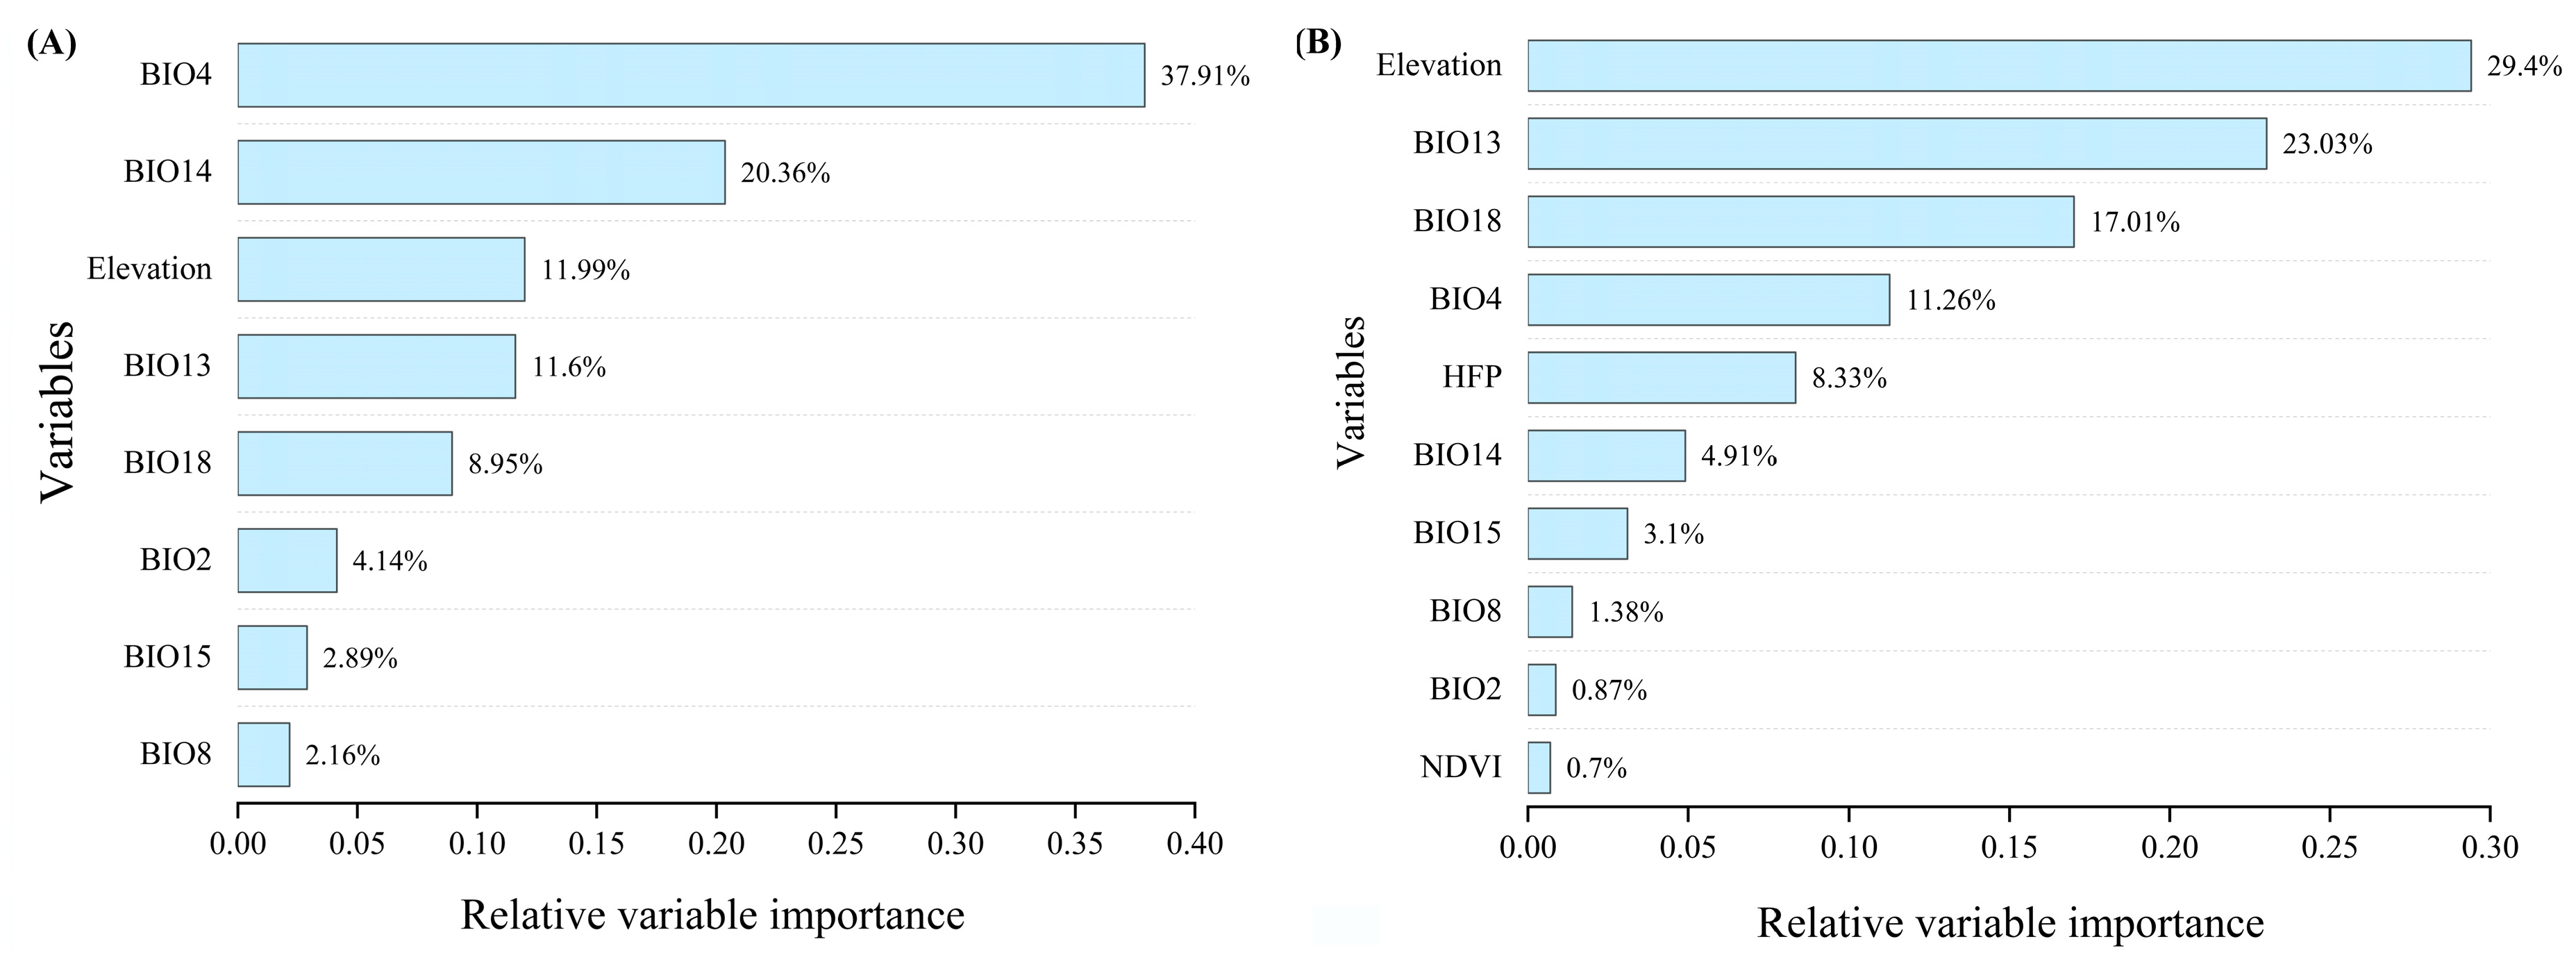
The percentage contributions of each variable to the models are presented in Figure 4. In the model using BIOs + elevation (Figure 4A), BIO4 was the most important predictor (37.91%) for the habitat distribution of P. imperator, followed by BIO14 (20.36%), elevation (11.99%), BIO13 (11.6%), and BIO18 (8.95%), while BIO8 made the lowest contribution (2.16%). In the model incorporating BIOs, elevation, NDVI, and HFP (Figure 4B), elevation emerged as the most influential variable (29.4%), followed by the same top three bioclimatic variables identified in Figure 4A: BIO13 (23.03%), BIO18 (17.01%), and BIO4 (11.26%). HFP contributed 8.33%, whereas NDVI had the lowest contribution rate among all variables, at only 0.7%.
Figure 4.
Percent contribution of environmental variables used in the modeling under two variable combinations. (A) BIOs; (B) BIOs + elevation + NDVI + HFP.
3.3. Response Curves of the Variables on Presence Probability of P. imperator Habitats
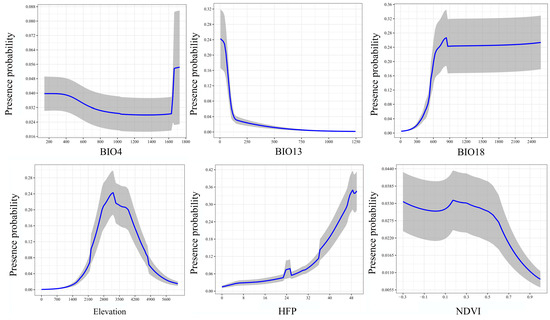
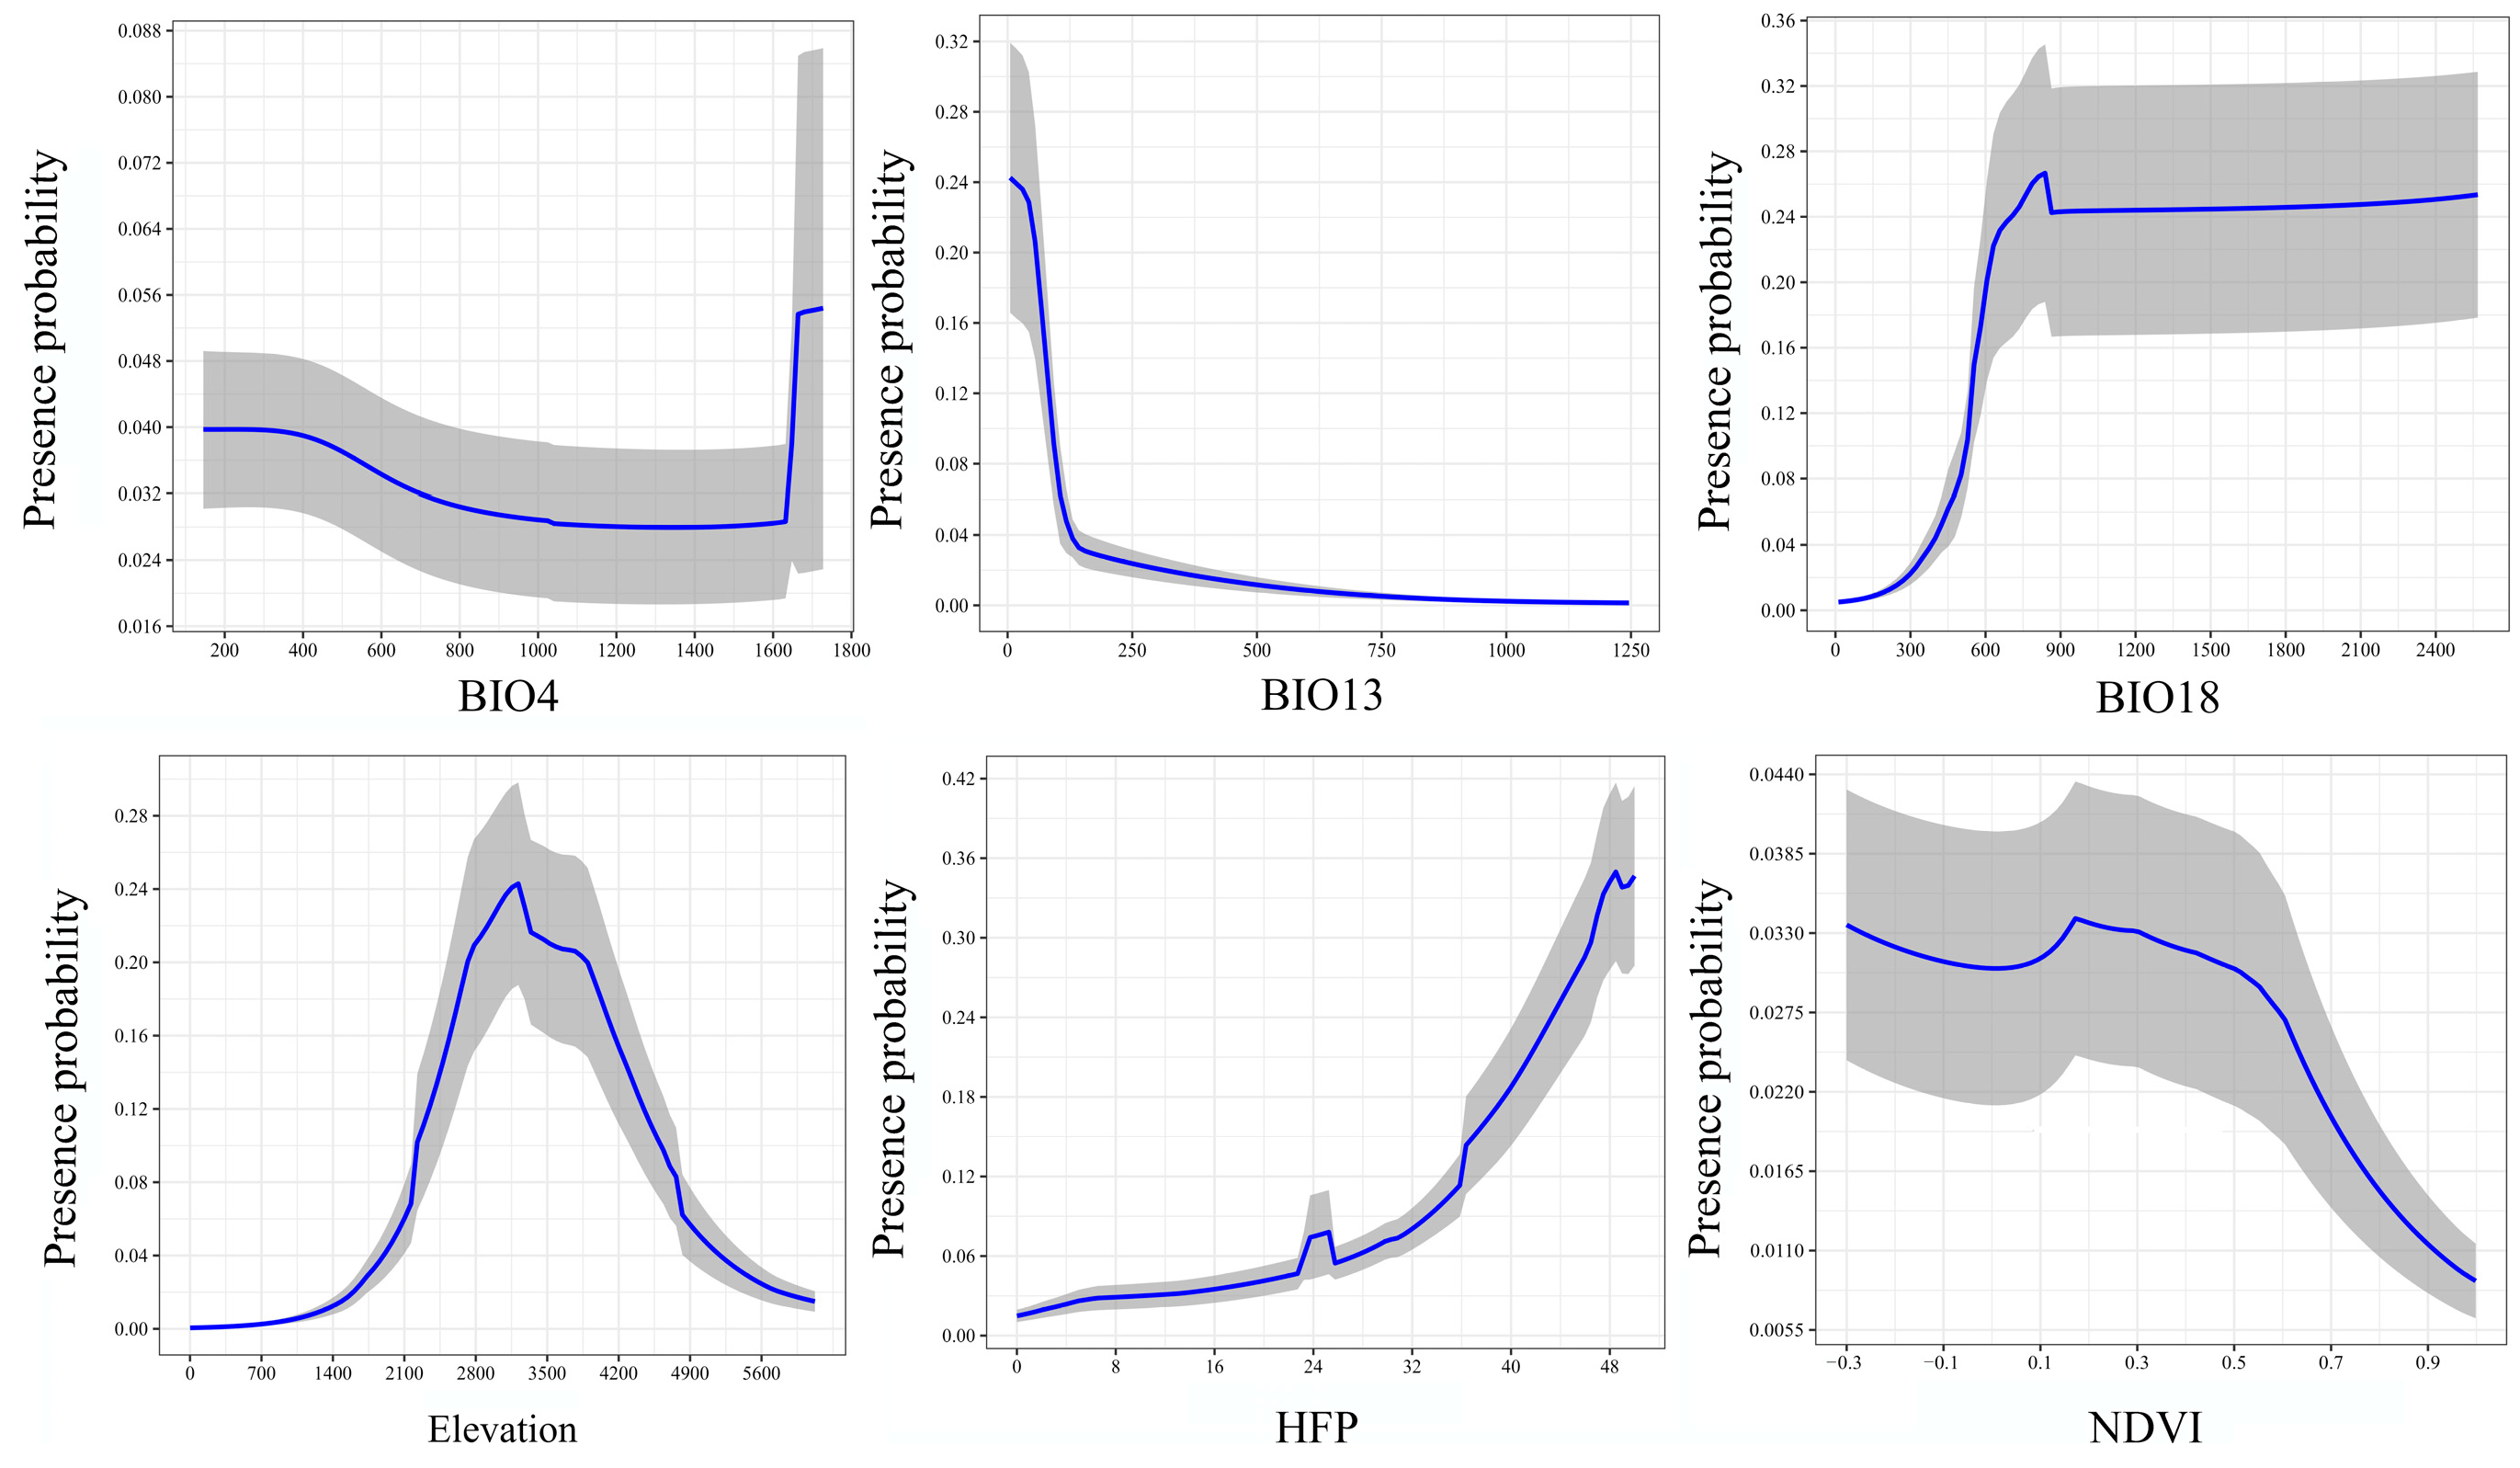
To examine how the probability of P. imperator presence varies with environmental variables, response curves for all variables in the BIOs + elevation + NDVI + HFP model are shown in Figure 5. As temperature seasonality (standard deviation×100; BIO4) increased from 200 to 1600, the occurrence probability of P. imperator remained relatively stable, ranging from 0.028 to 0.039. For BIO13 (precipitation of the wettest month), the probability peaked at 0.24 at 5 mm, then declined sharply and gradually approached 0 as precipitation increased from 130 to 1250 mm. In contrast, for BIO18 (precipitation of the warmest quarter), the probability rose rapidly from 0 to a maximum of 0.26 at 838 mm, then remained around 0.24 as precipitation increased to 2400 mm. As the top contributing variable, elevation strongly influenced habitat suitability: P. imperator favored elevations between 2722 and 3835 m, with occurrence probability >0.2, and the optimal probability (0.243) occurred at 3217 m. Overall, the presence probability increased with HFP values from 0 to 48 but decreased with NDVI values from 0 to 1.
Figure 5.
Response curves of the top three bioclimatic variables and nonbioclimatic variables. The blue line indicates the mean predicted presence probability, and the gray shade indicates the confidence interval derived from repeated model runs (cross-validation replicates).
3.4. The Current Potential Distribution of P. imperator Habitats
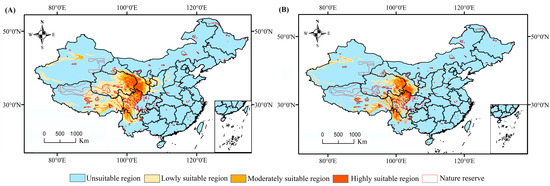
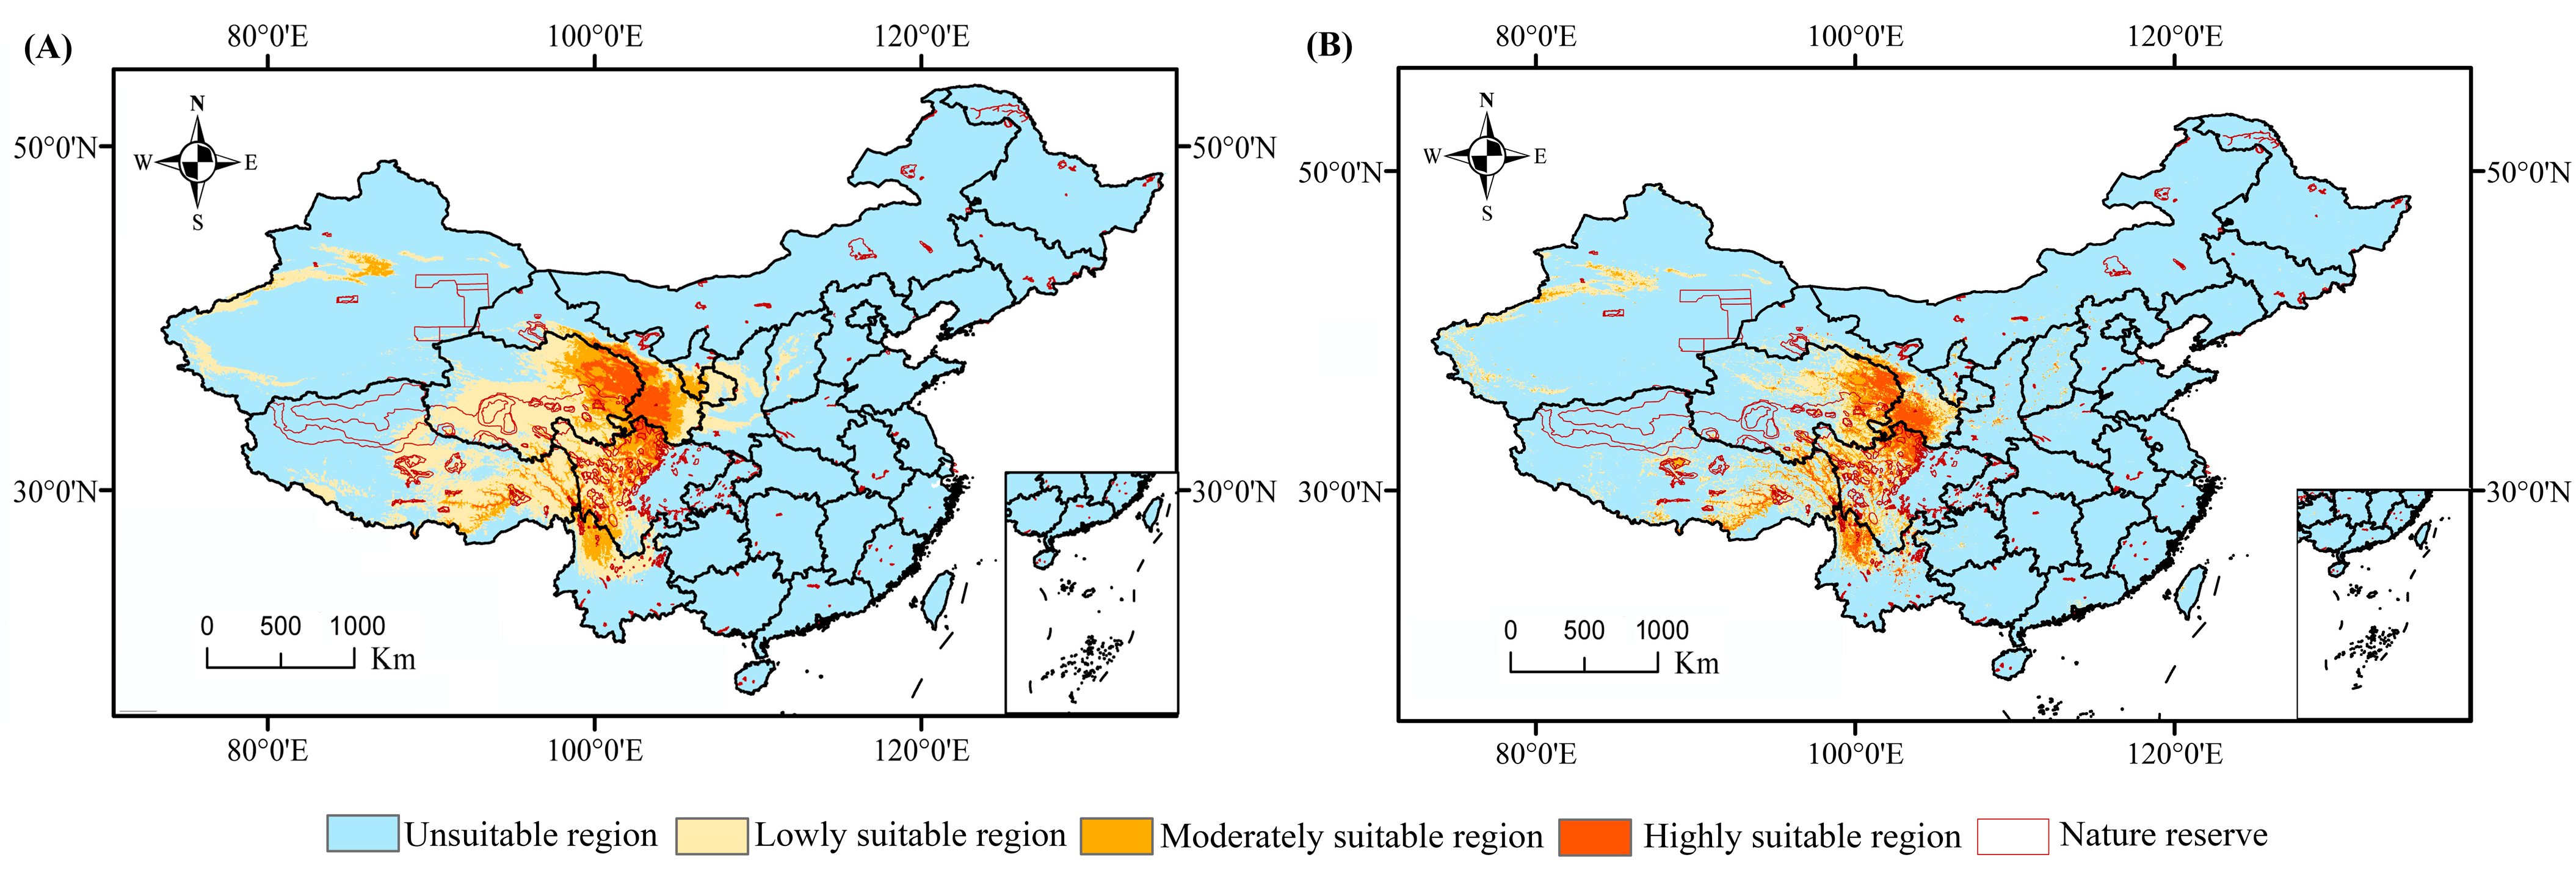
Two projections for the current potential distribution of P. imperator were conducted based on two variable combinations. Under BIOs + elevation, the suitable habitats (Figure 6A) were distributed in western China, mainly including the provinces of Gansu, Qinghai, Sichuan, Ningxia, Tibet, Shaanxi, Xinjiang, and Yunnan. The total area of suitable habitat was 185.87 × 10⁴ km2 (Table S3), with the lowly, moderately, and highly suitable areas being 131.73 × 10⁴ km2, 35.5 × 10⁴ km2, and 18.64 × 10⁴ km2, respectively. The highly suitable regions were primarily distributed in southern Gansu, eastern Qinghai, northwest Sichuan, and southern Ningxia. Under BIOs + elevation + NDVI + HFP, the suitable habitats (Figure 6B) predicted were overall identical to those under BIOs + elevation in distribution patterns of all three levels of suitability. A slight difference was that the suitable regions in Shaanxi, Ningxia, and part of Gansu predicted under BIOs + elevation were evaluated as non-suitable. The current national nature reserves generally cover the core suitable habitats (e.g., northwestern Sichuan, southeastern Qinghai, and northwestern Tibet). However, distinct conservation gaps exist in eastern Tibet, northeastern Qinghai, southern Gansu, and northern Sichuan. The total area of suitable habitats was 118.43 × 10⁴ km2, with the lowly, moderately, and highly suitable areas being 70.14 × 10⁴ km2, 34.54 × 10⁴ km2, and 13.75 × 10⁴ km2, respectively.
Figure 6.
The predicted habitat suitability of Parnassius imperator in China under current environmental conditions of two variable combinations. (A) BIOs + elevation; (B) BIOs + elevation + NDVI + HFP. 0–0.2: unsuitable region, 0.2–0.4: low suitable region, 0.4–0.6: moderately suitable region, 0.6–1: highly suitable region.
3.5. The Future Potential Distribution of P. imperator Habitats
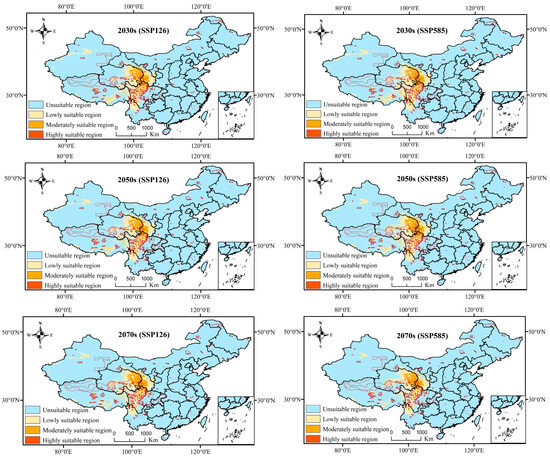
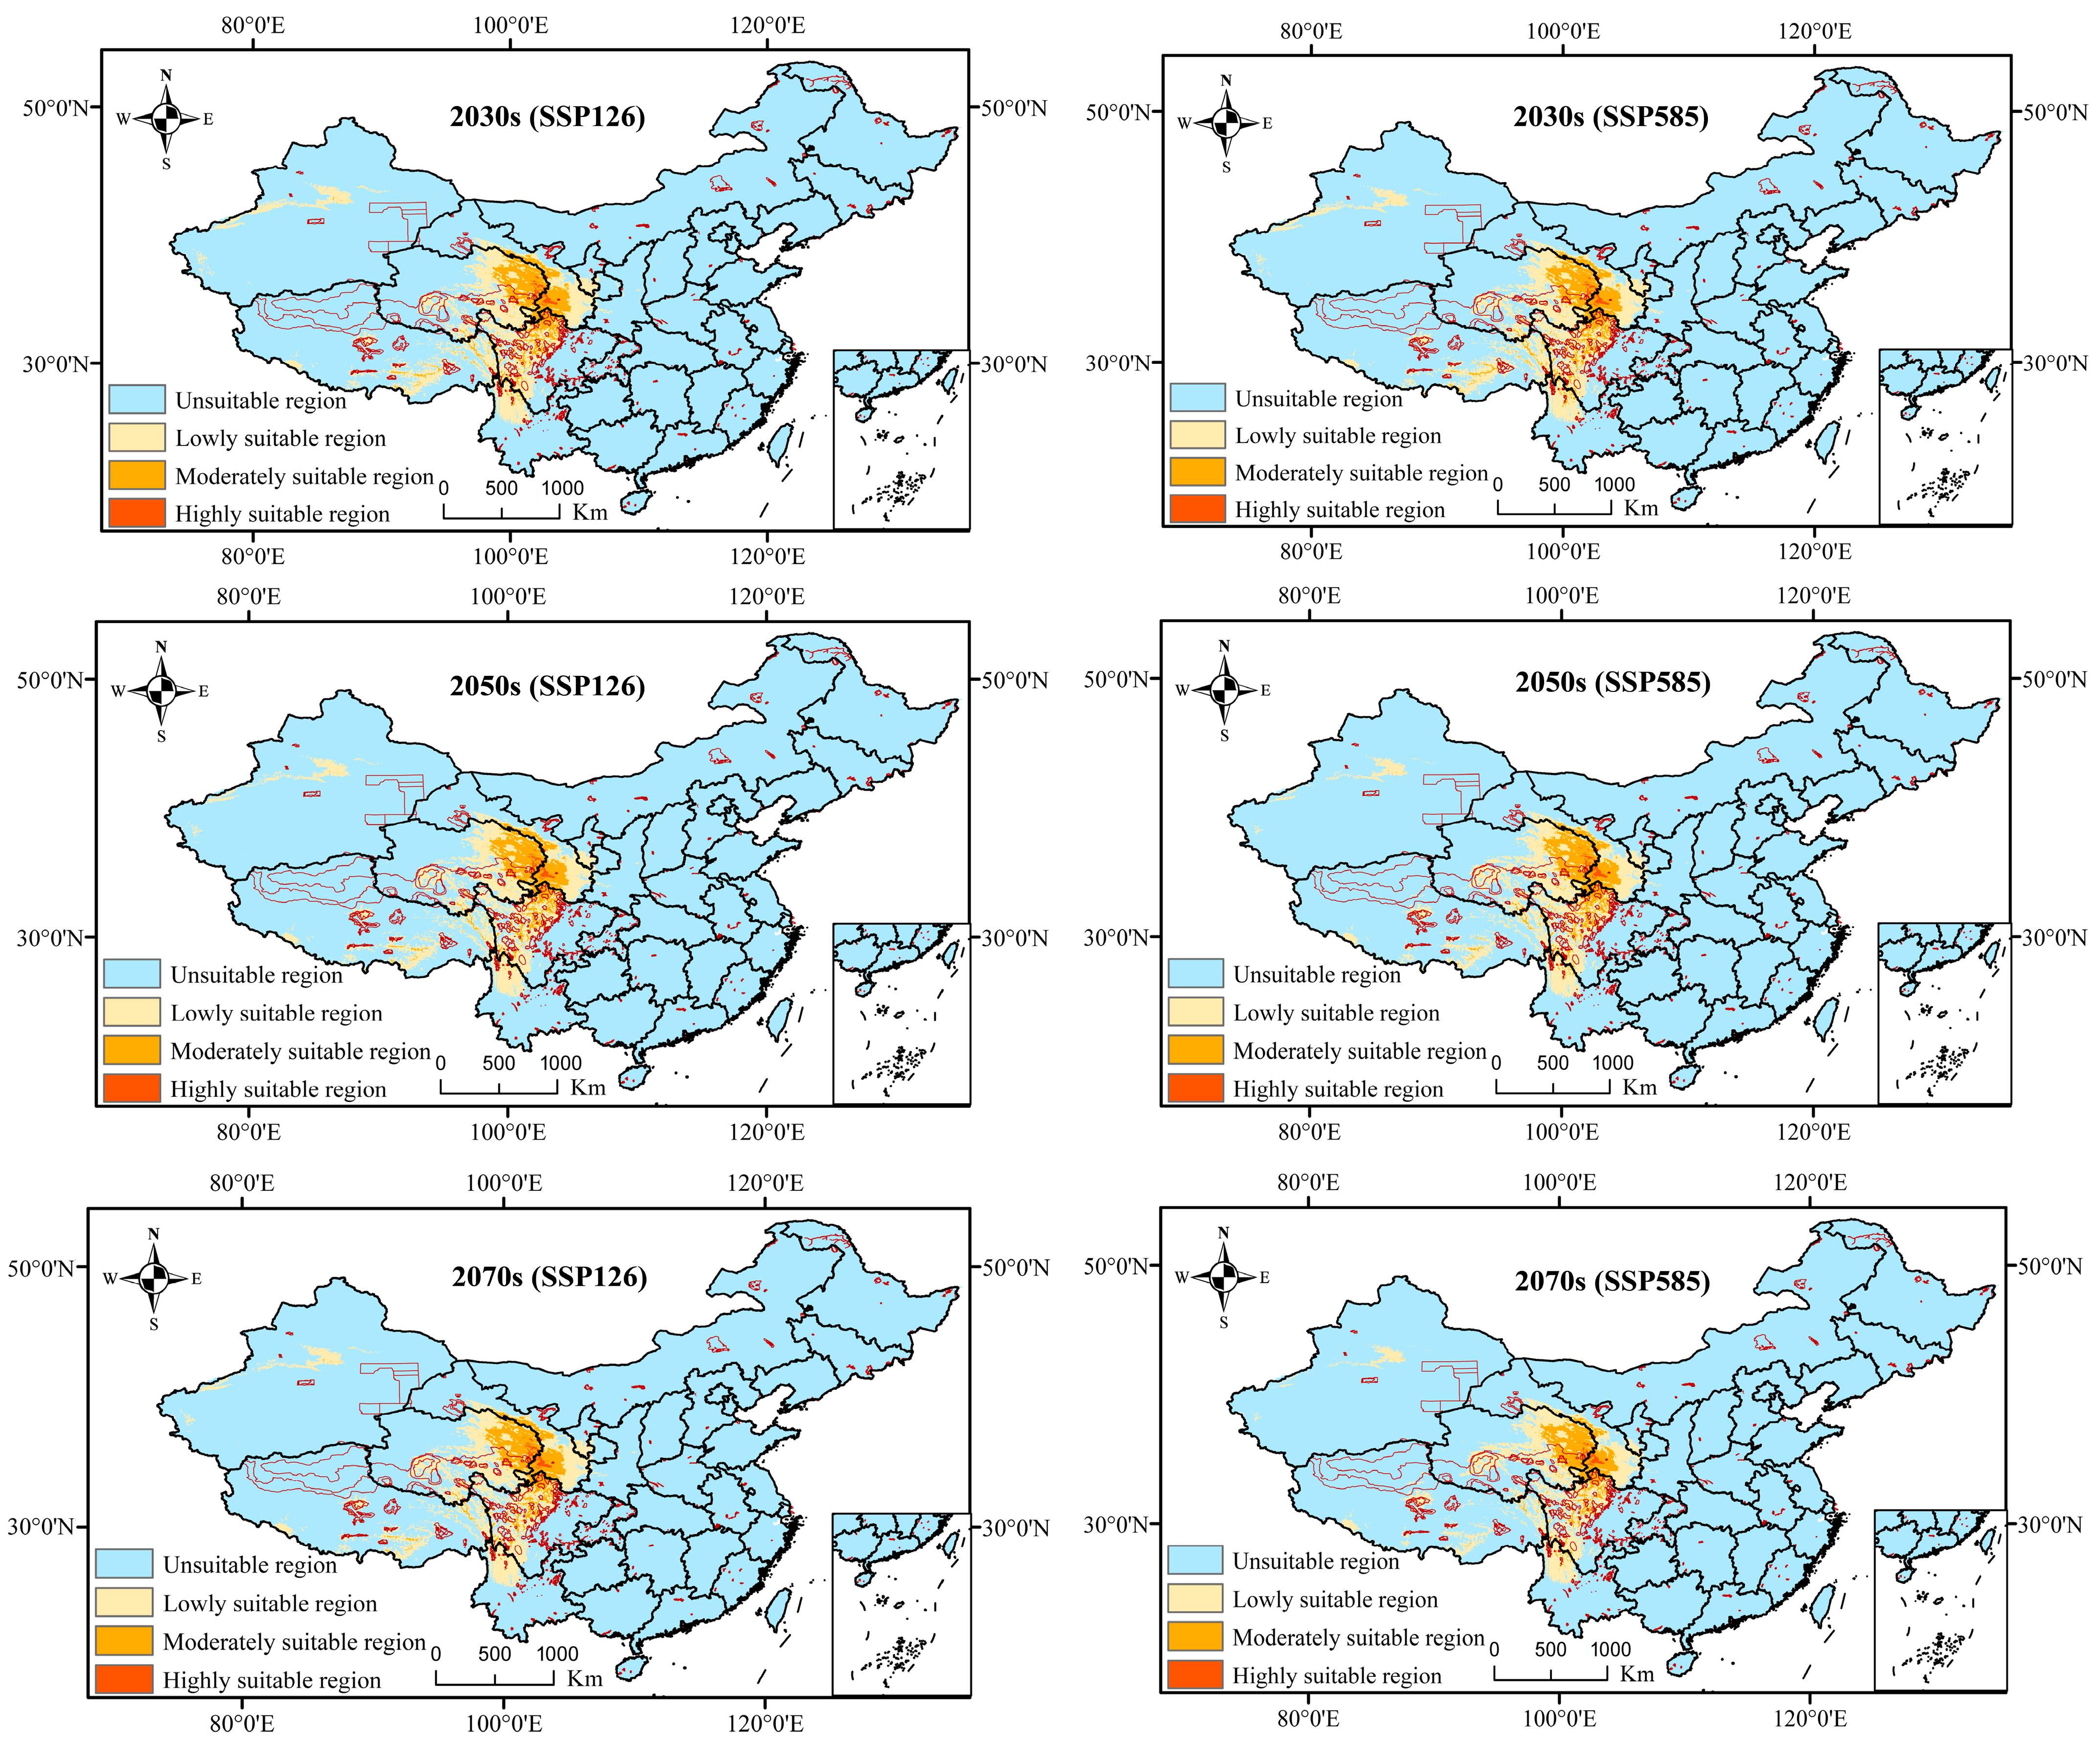
In future projections under BIOs + elevation, six prediction maps (Figure 7) were derived from 18 predictions based on variables representing three periods, two greenhouse gas emission scenarios, and three global circulation models. Compared with current projections, two notable characteristics emerged. First, the currently suitable habitats significantly contracted in all future scenarios, with an average area of 91.29 × 10⁴ km2 (Table S4). The area under SSP585 in the 2070s was even reduced to 82.16 × 10⁴ km2. Most of the current habitats that would become lowly suitable or unsuitable for P. imperator in the future were mainly distributed in southern Gansu, South Qinghai, West Tibet, and northern Yunnan. Second, most of the suitable habitats were low-suitability habitats defined by a threshold value of 0.2, which occupied 76.6% of the total suitable area on average (Table S4). Moreover, almost no highly suitable habitats were projected across all future climate change scenarios (~0.86 × 10⁴ km2). Notably, the current highly suitable habitats in southern Gansu, northeastern Qinghai, and northern Yunnan were projected to disappear entirely. Moreover, these regions lack coverage of national nature reserves.
Figure 7.
The predicted habitat suitability of Parnassius imperator under future scenarios. 0–0.2: unsuitable, 0.2–0.4: low suitable, 0.4–0.6: moderately suitable, 0.6–1: highly suitable. The regions marked with red lines represent national nature reserves.
3.6. Change Dynamics of Distribution and Centroid Shift
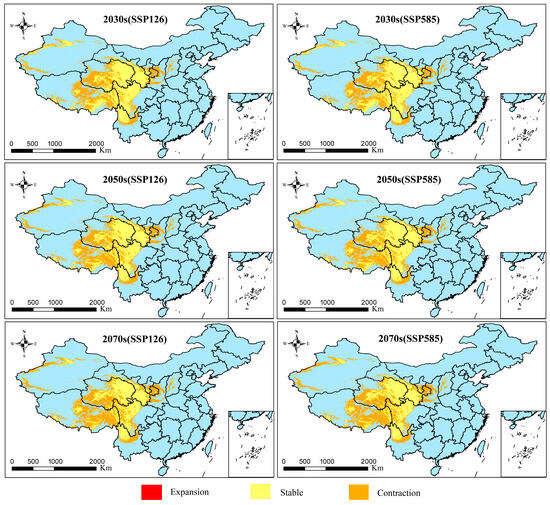
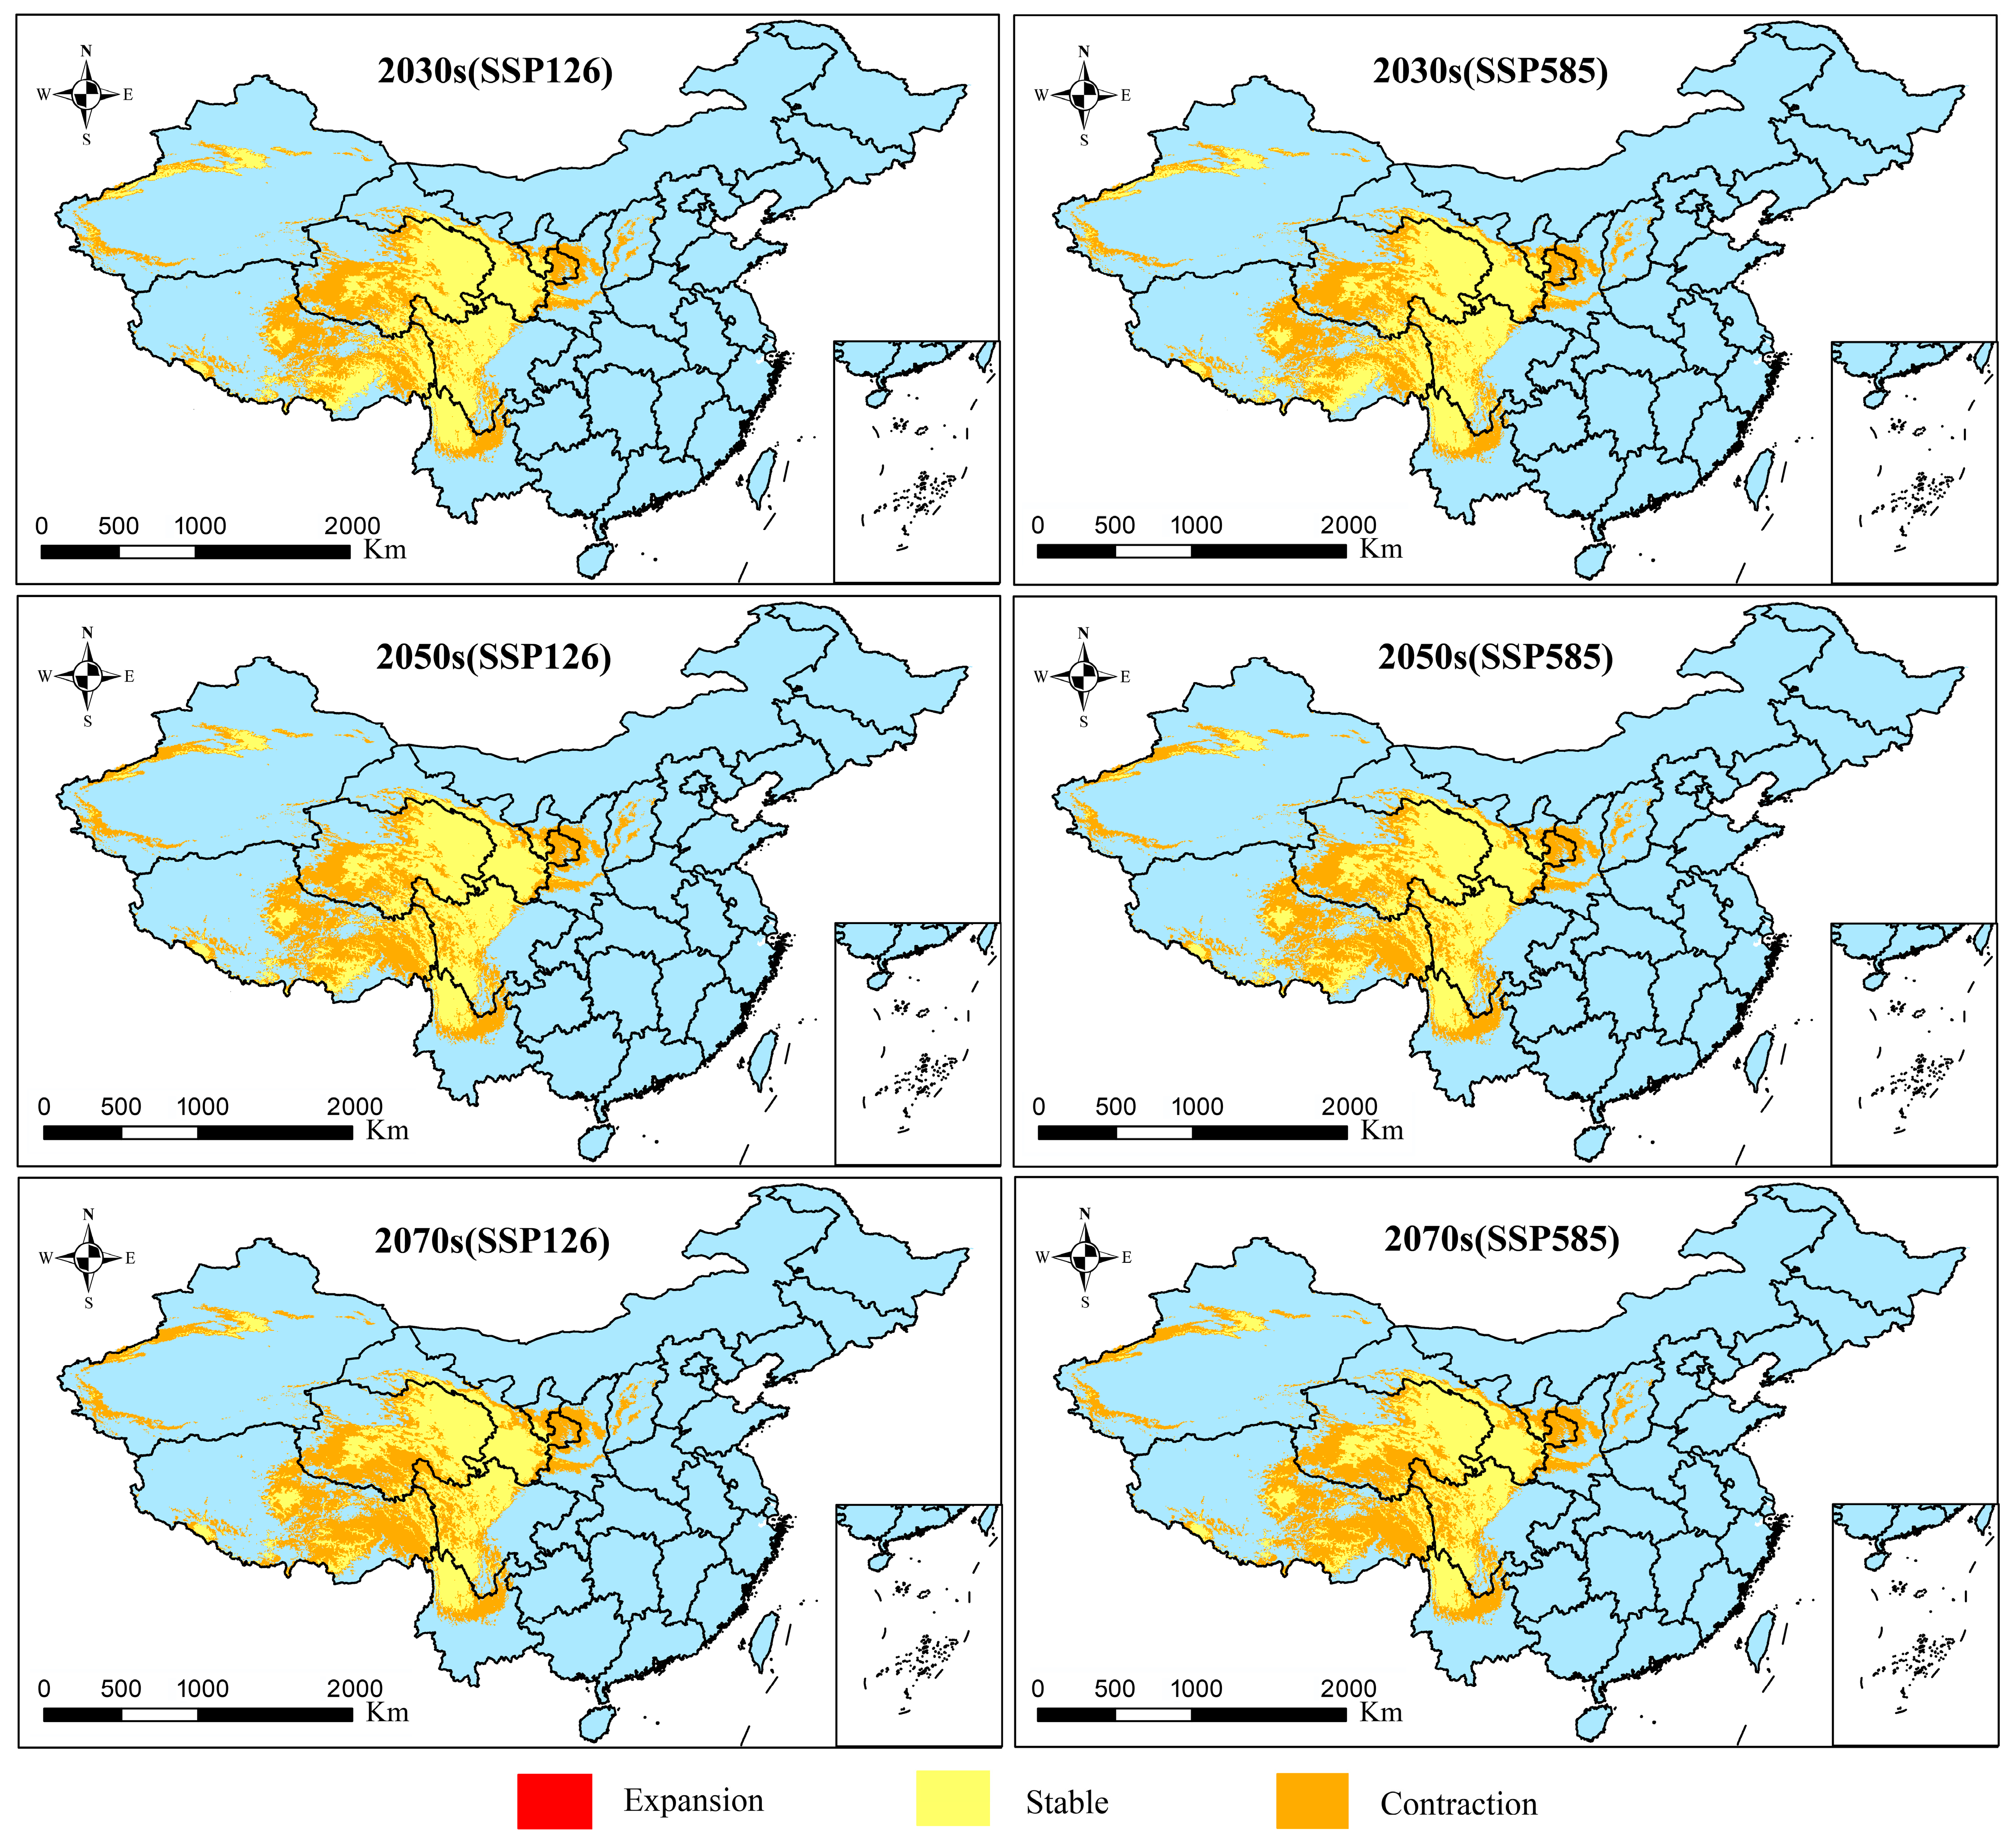
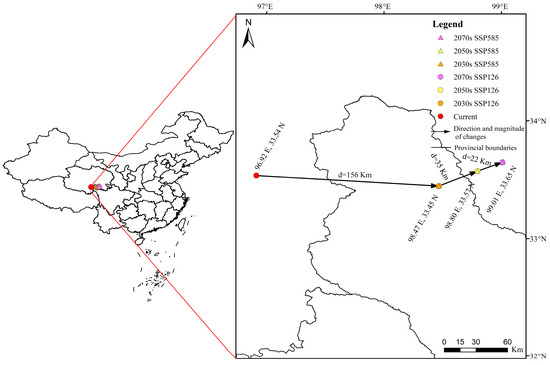
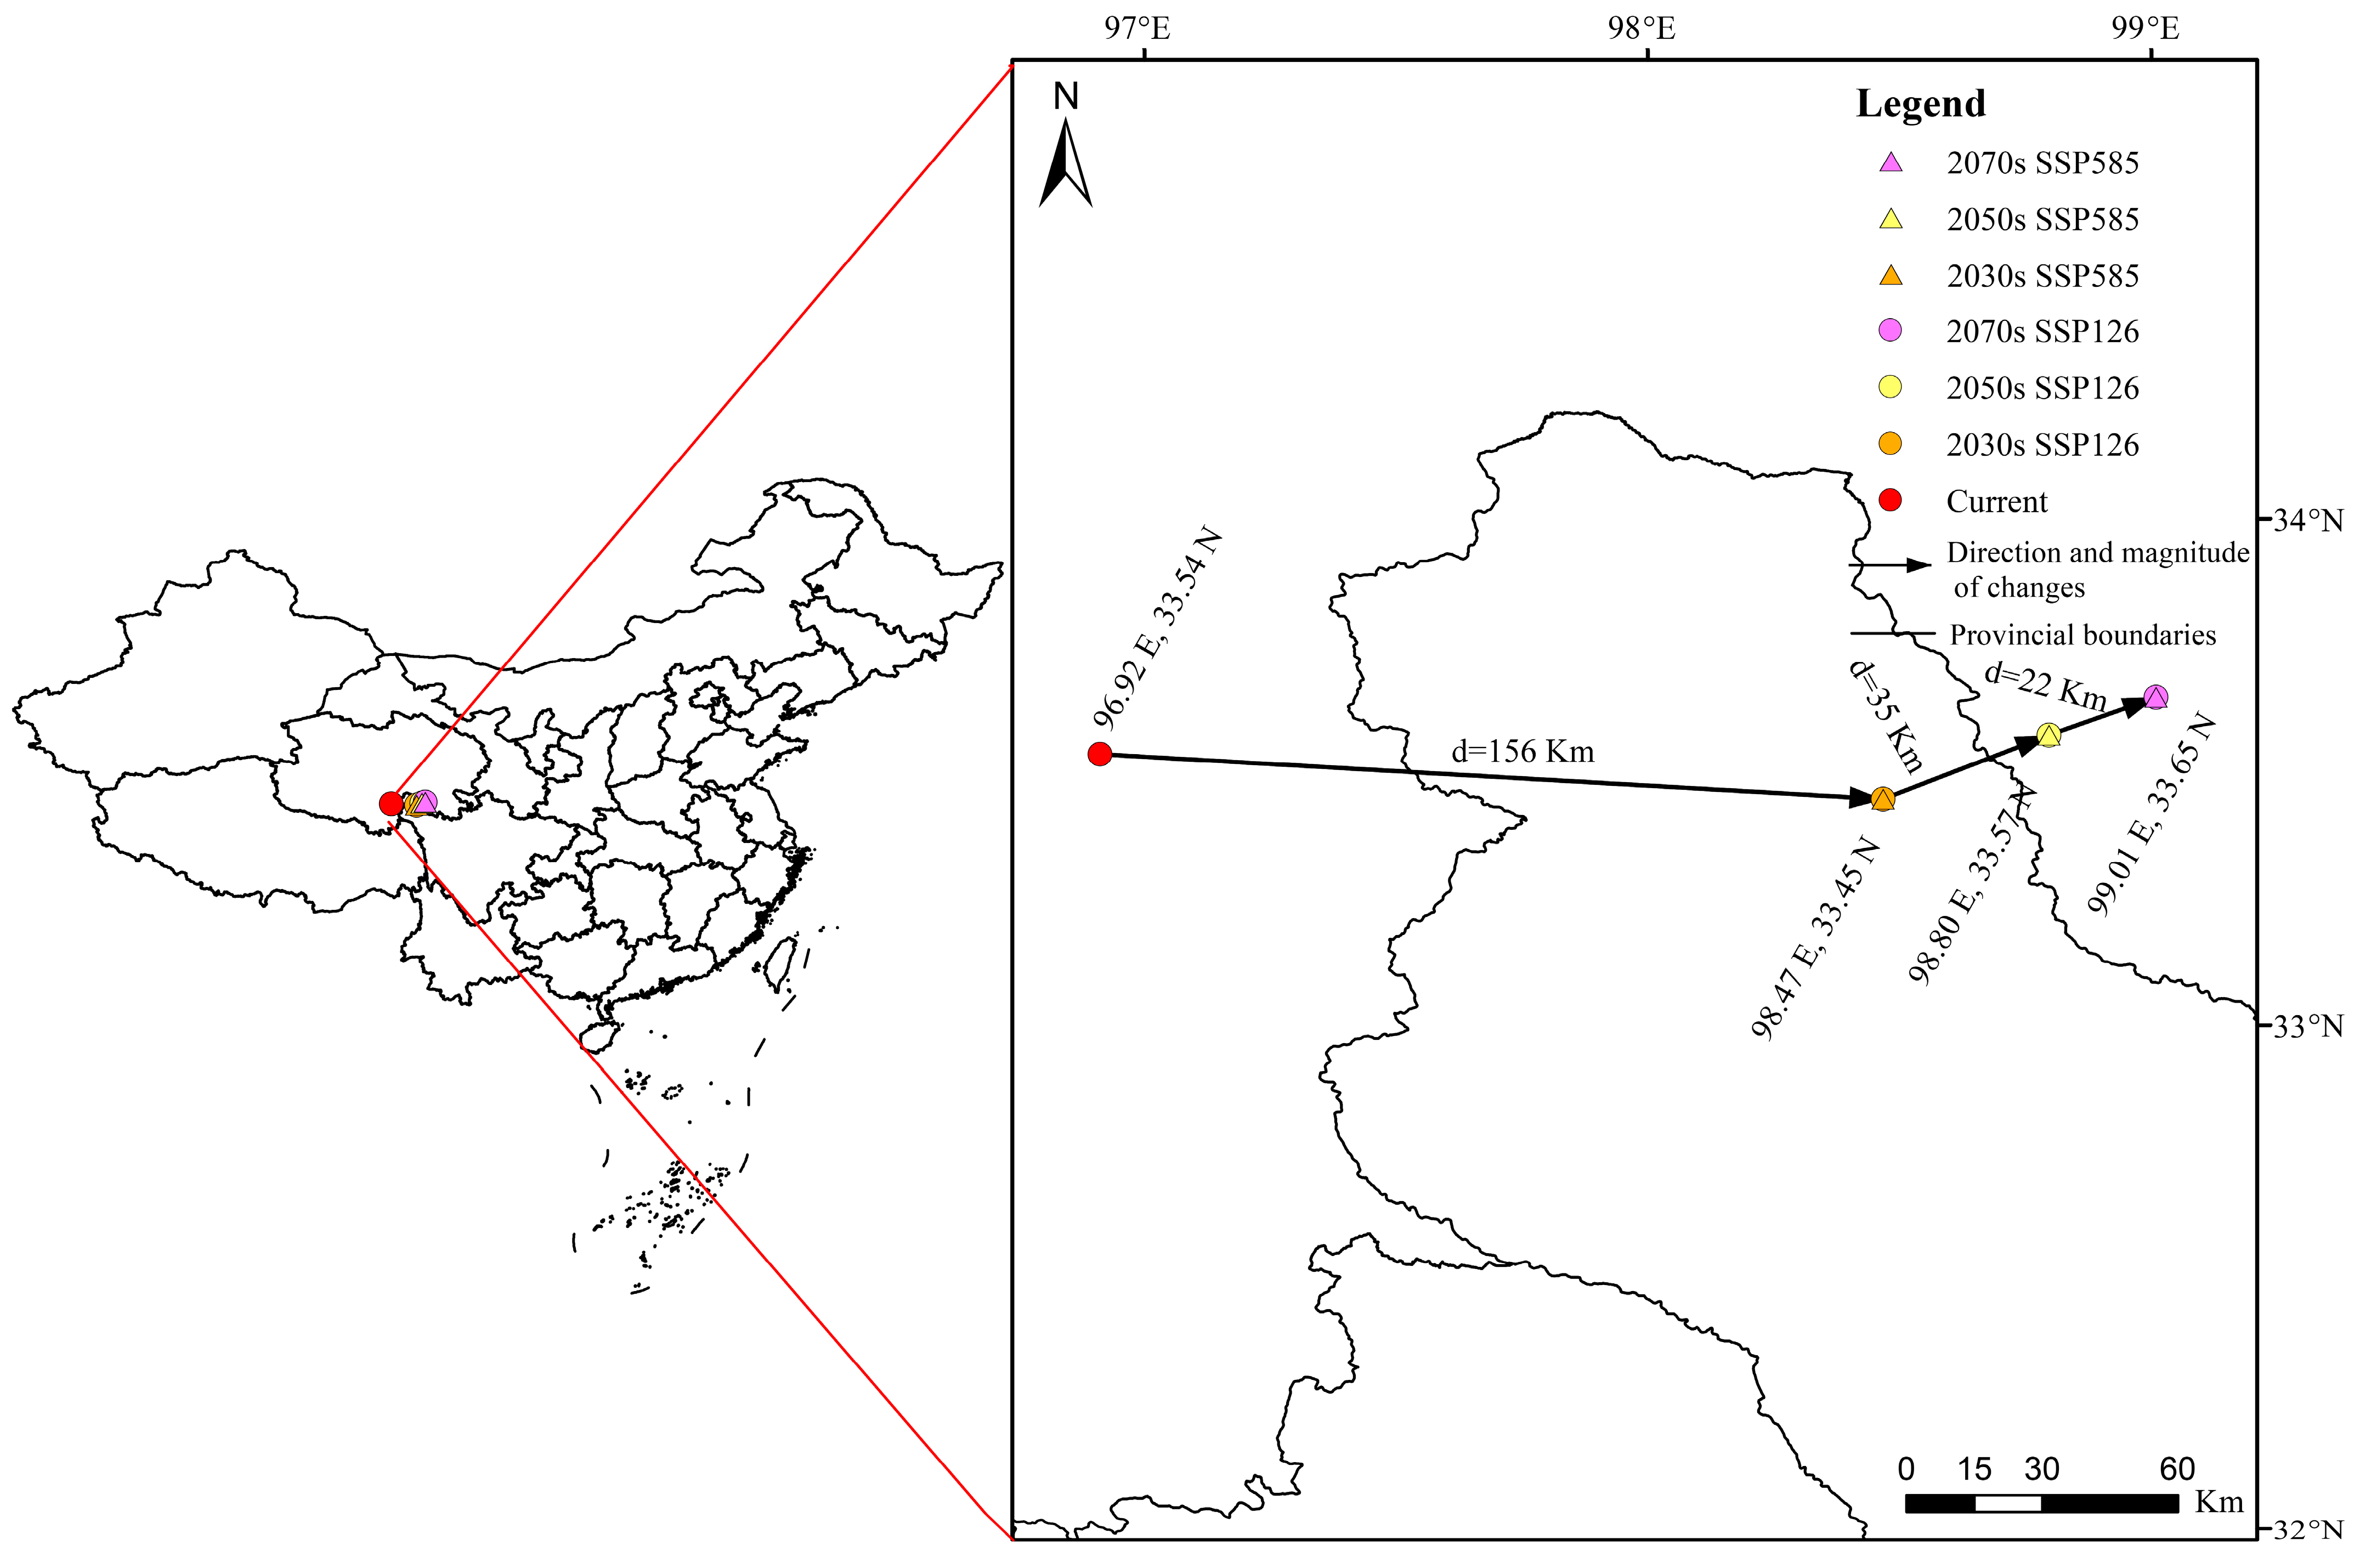
The changes in suitable habitat distributions under the future SSP126 and SSP585 scenarios for the 2030s, 2050s, and 2070s relative to the current condition are presented in Figure 8. All future projections indicate a significant contraction of suitable areas, particularly under SSP585 in the 2070s, with only minor expansions observed. The distribution centroids of suitable habitats were predicted to shift within a relatively narrow range (96.92° E–99.01° E, 33.45° N–33.65° N) at the border of Qinghai and Sichuan in southwestern China (Figure 9). Under the current conditions, the habitat centroid was located in Qinghai (96.92° E, 33.54° N) and shifted eastward in all future scenarios. In the 2030s, 2050s, and 2070s, the corresponding shift distances were 156 km, 35 km, and 22 km, respectively.
Figure 8.
The change dynamics of suitable areas of Parnassius imperator under future scenarios relative to that under current conditions.
Figure 9.
Shifts of distribution cores of Parnassius imperator under different scenarios.
4. Discussion
4.1. Suitable Habitats of P. imperator Under Different Climate Scenarios
Under current conditions, the predicted suitable habitats for P. imperator are mainly concentrated in western China, including Gansu, Qinghai, Sichuan, Tibet, Yunnan, and Ningxia. This spatial pattern is highly consistent with the field-recorded distribution of P. imperator and the biogeographical characteristics of the genus Parnassius, which is centered primarily on the Qinghai-Tibet Plateau (QTP) and its surrounding high-altitude mountain ranges [25,26,64,65]. The high consistency between model predictions and actual distributions confirms the reliability of the habitat suitability simulations in this study, complemented by excellent model performance as validated by AUC and TSS metrics [58,60].
Under climate warming, insects often shift their phenology or disperse to higher elevations and latitudes [16,66,67]. Previous SDM-based studies have shown that in response to climate warming, insect species may expand, contract, or stabilize their ranges, reflecting divergent climate responses shaped by habitat characteristics and species-specific adaptations [16,56,68,69]. Under future climate change scenarios, suitable habitats for P. imperator will contract significantly across all time periods and emissions pathways. The most severe reduction occurs under the high-emission scenario SSP585 in the 2070s, with suitable area declining to 82.16 × 10⁴ km2. Notably, almost no highly suitable habitats are projected under any future scenario, and over 75% of remaining suitable areas are low-suitable habitats, indicating a sharp decline in overall habitat suitability. This pattern aligns with studies of other alpine Parnassius butterflies, which report consistent habitat contraction and upward range shifts under warming [4,20,28]. Given the endangered status of P. imperator, the substantial contraction of its suitable habitats—especially highly suitable areas—suggests that this butterfly faces elevated risks of local extirpation and potential global extinction. This threat is intensified by increasingly fragmented alpine vegetation and the limited dispersal ability, which impairs its capacity to track suitable environmental conditions [4,24,70].
4.2. The Crucial Factors Influencing the Habitat Distribution of P. imperator
Compared with the simulation using climate + elevation variables, the total suitable habitat area predicted by the full-variable model (climate + elevation + NDVI + HFP) is slightly reduced. This indicates that NDVI + HFP also play a vital role in constraining the actual available habitat range of P. imperator, alongside climatic drivers. These results are consistent with habitat limitation patterns reported for other alpine Parnassius butterflies [4,20].
Among the factors, climate-related temperature and precipitation are widely recognized as pivotal determinants governing species’ geographic ranges [66,69,71]. This linkage arises mainly from their close association with energy and water availability for organisms [72,73]. In our analyses, seven bioclimatic variables were selected: three related to temperature and four to precipitation. Variable importance analyses (Figure 4) revealed that temperature seasonality (BIO4) acted as a dominant climatic driver in the climate + elevation model. For univoltine Parnassius species with obligate larval diapause, stable seasonal temperature fluctuations are crucial for synchronizing life cycles with host-plant phenology [23,26,74]. Excessive temperature variability disrupts developmental rates, impairs diapause success, and desynchronizes larvae from their host plants, thereby reducing survival and reproduction. This explains why temperature seasonality strongly constrains the suitable range of P. imperator. Precipitation variables, including precipitation of the wettest month (BIO13), precipitation of the driest month (BIO14), and precipitation of the warmest quarter (BIO18), jointly regulated habitat suitability by controlling soil moisture, vegetation productivity, and resource availability in arid alpine ecosystems. Adequate summer moisture supports the growth of Corydalis host plants (Papaveraceae), which are essential for larval development, as well as nectar resources for adult butterflies [26,28]. Conversely, excessive rainfall increases infection risk from fungal pathogens and restricts adult flight activity, consistent with physiological limitations in Parnassius [20,74].
Elevation is among the most critical environmental drivers, particularly in alpine ecosystems, as it directly shapes both macro- and micro-environmental conditions experienced by species [75,76,77]. In SDM research, elevation has been widely adopted as a key predictor alongside standard bioclimatic covariates [78]. In our modeling, elevation was identified as the primary contributing variable, accounting for 29.4% of the total contribution. This finding indicates that elevation carries greater explanatory power for characterizing the ecological niche of the alpine species P. imperator than other environmental variables. This result aligns with the inherent specialization of Parnassius butterflies, which are deeply adapted to cool climates, strong ultraviolet radiation, and narrow thermal niches in mountain ecosystems [23,26,28]. Furthermore, the response curves further revealed that P. imperator favors habitats at elevations ranging from 2722 to 3835 m, which is highly consistent with field surveys showing that this species mainly inhabits alpine meadows, gravel slopes, and rocky valleys [26]. Such a narrow elevational niche reflects limited dispersal ability and physiological constraints typical of alpine butterflies, which rarely migrate across steep environmental gradients [20,24,70].
In SDM studies, Human population density (HPD) and Human footprint (HFP) have been widely applied as predictors to evaluate the impacts of anthropogenic activities on species distribution or biodiversity [79,80]. For the HPD, most studies assume that rising HPD exacerbates threats to biodiversity [79,81]. However, Luck’s [79] review noted that at broad scales, HPD can be positively correlated with species richness in many spatially congruent taxonomic groups, potentially driven by energy availability. This situation indicates that HPD can exert complex effects on biodiversity [79]. Given the strong correlation between HPD and HFP, we selected HFP as one non-climatic predictor. Our results show that the presence probability increased with HFP values to some extent. Though this trend is unexpected, it aligns with findings from previous insect-related research (e.g., [26,80]). In the study of Li et al. [80], the distribution probabilities of the four grasshoppers increased significantly as the intensity of the human footprint increased. Likewise, abundant flowering plants in areas with human activities can result in higher butterfly diversity [26]. However, we think that this positive correlation observed in our model is limited. Parnassius imperator is an endemic alpine butterfly that inhabits high-altitude regions (2722–3835 m, as shown in our response curves; Figure 5). These areas are relatively remote and sparsely populated, resulting in low overall HFP values across the species’ distribution range. In such low-disturbance alpine environments, a positive correlation between HFP and species presence probability may exist to a certain degree.
4.3. Implications for P. imperator Conservation
Parnassius imperator is a rare butterfly endemic to China and a typical alpine species with high sensitivity to climate change [26]. Our ensemble model results indicate that under future climate scenarios, suitable habitats of P. imperator will contract dramatically, almost with a complete loss of highly suitable habitats, suggesting that the species is facing an increasing risk of extinction [24].
Parnassius imperator currently receives partial protection from China’s national nature reserves, with core suitable habitats (e.g., northwestern Sichuan, southeastern Qinghai, and northwestern Tibet) largely covered. However, distinct conservation gaps exist in southern Gansu, northeastern Qinghai, and northern Yunnan because these regions support extensive suitable habitats but lack formal protected area designation. Notably, highly suitable habitats in southern Gansu and northern Yunnan are projected to disappear entirely under future climate change. These gaps, combined with climate-driven habitat loss, increase vulnerability to habitat fragmentation and human disturbance [28]. We therefore recommend establishing new protected areas within conservation hotspots, including eastern Tibet, southern Gansu, and northern Yunnan, while also considering the conservation needs of other co-occurring threatened species. Future climate change scenarios should be integrated into long-term conservation planning. Concurrently, priority should be given to safeguarding stable high-altitude habitats as climate refuges, and ex situ conservation measures such as captive breeding should be developed for populations at high extinction risk [4,7].
A standardized long-term monitoring system should be established to track population abundance, distribution, and habitat dynamics of P. imperator. Monitoring should focus on marginal low-altitude populations and key habitat contraction zones, providing data to support conservation effectiveness evaluation and adaptive strategy adjustment [28,82]. Degraded alpine meadow habitats within core suitable areas should be restored, and host plants of P. imperator should be artificially propagated and protected [20,26]. Finally, it is critical to strengthen law enforcement to suppress illegal collection, and implement public education campaigns to enhance awareness of alpine butterfly conservation and mitigate anthropogenic threats [1,83].
4.4. Limitations and Future Prospects
This study explored the habitat dynamics of P. imperator using ensemble models, yet it has limitations. We only included climate, elevation, HPD, and NDVI, while ignoring soil, host plants, land-use change, and microclimate, which may also shape the niches of P. imperator [4,20]. Furthermore, although we extensively collected the distribution points and the final 48 occurrence records used cover the species’ entire known range, additional field surveys are needed to supplement data from under-sampled regions, which would improve the transferability of future projections [31]. Alternatively, the ensembles of small models can be used to overcome the sampling limitations in modeling rare species [84,85]. In addition, given the high contribution of the elevation factor to the ecological niche of the alpine species P. imperator, it could be solely applied to further evaluate its effects on the ecological demand of P. imperator and to compare it with other factors. Overall, future research should integrate multi-source environmental variables, expand field occurrence records, or improve methodology to potentially enhance model reliability and support targeted conservation. Additionally, long-term field monitoring of representative P. imperator populations should be implemented to validate model projection results, thereby providing robust guidance for the sustainable conservation of P. imperator and other Parnassius species.
5. Conclusions
This study applied ensemble species distribution models to reveal the spatiotemporal dynamics of suitable habitats for P. imperator, an endemic alpine butterfly in China. At present, its suitable habitats are mainly concentrated in western China, primarily shaped by elevation, temperature seasonality, precipitation of the wettest month, precipitation of the warmest quarter, and precipitation of the driest month. Under future climate scenarios, suitable habitats will contract sharply, with almost no highly suitable areas projected to persist. Although existing nature reserves cover core habitats, critical conservation gaps remain in regions such as eastern Tibet and southern Gansu. Our findings highlight the increasing extinction risk faced by this species and support the implementation of integrated conservation strategies, including expanding protected areas, establishing long-term monitoring schemes, restoring habitats, and strengthening law enforcement and public education. These results provide a scientific basis for climate-adapted conservation of P. imperator and other vulnerable alpine insects.
Supplementary Materials
The following supporting information can be downloaded at: https://www.mdpi.com/article/10.3390/insects17060635/s1, Figure S1: Pearson’s correlation analysis among 19 bioclimatic variables; Figure S2: The area under the receiver operating characteristic curve (AUC) and true skill statistics (TSS) values for five used models under BIOs + elevation + NDVI + HFP; Table S1: The occurrence records of Parnassius imperator used in the models; Table S2: The environmental variables considered in this study; Table S3: The suitable areas of Parnassius imperator under current environmental conditions; Table S4: The suitable areas of Parnassius imperator under future scenarios.
Author Contributions
Conceptualization, S.S. and M.Y.; data curation, K.M., Y.W., W.D. and Y.M.; formal analysis, K.M., Y.W., W.D., Y.M., X.T., J.H., J.L., X.L., S.S. and M.Y.; funding acquisition, M.Y.; methodology, K.M., Y.W., W.D. and M.Y.; project administration, M.Y.; software, K.M., Y.W., W.D., Y.M., X.T. and J.H.; supervision, S.S. and M.Y.; validation, K.M., Y.W., J.L., X.L. and M.Y.; visualization, X.T., J.H., J.L., X.L. and M.Y.; writing—original draft preparation, K.M., Y.W., W.D., Y.M., X.T., J.H., J.L. and X.L.; writing—review and editing, S.S. and M.Y. All authors have read and agreed to the published version of the manuscript.
Funding
This work was supported by the Natural Science Foundation of China (Grant No. 31702046), the Key Scientific Research Projects of Colleges and Universities in Henan Province (24A180030).
Data Availability Statement
The original contributions presented in this study are included in the article/Supplementary Materials. Further inquiries can be directed to the corresponding authors.
Conflicts of Interest
The authors declare no conflicts of interest.
References
- Butchart, S.H.; Walpole, M.; Collen, B.; van Strien, A.; Scharlemann, J.P.W.; Almond, R.E.A.; Baillie, J.E.M.; Bomhard, B.; Brown, C.; Bruno, J.; et al. Global biodiversity: Indicators of recent declines. Science 2010, 328, 1164–1168. [Google Scholar] [CrossRef] [Scilit] [PubMed]
- Pimm, S.L.; Jenkins, C.N.; Abell, R.; Brooks, T.M.; Gittleman, J.L.; Joppa, L.N.; Raven, P.H.; Roberts, C.M.; Sexton, J.O. The biodiversity of species and their rates of extinction, distribution, and protection. Science 2014, 344, 1246752. [Google Scholar] [CrossRef] [Scilit] [PubMed]
- Rands, M.R.; Adams, W.M.; Bennun, L.; Butchart, S.H.M.; Clements, A.; Coomes, D.; Entwistle, A.; Hodge, I.; Kapos, V.; Scharlemann, J.P.W.; et al. Biodiversity conservation: Challenges beyond 2010. Science 2010, 329, 1298–1303. [Google Scholar] [CrossRef] [Scilit] [PubMed]
- Sbaraglia, C.; Samraoui, K.R.; Massolo, A.; Bartoňová, A.S.; Konvička, M.; Fric, Z.F. Back to the future: Climate change effects on habitat suitability of Parnassius apollo throughout the Quaternary glacial cycles. Insect Conserv. Diver. 2023, 16, 231–242. [Google Scholar]
- Guisan, A.; Tingley, R.; Baumgartner, J.B.; Naujokaitis-Lewis, I.; Sutcliffe, P.R.; Tulloch, A.I.T.; Regan, T.J.; Brotons, L.; McDonald-Madden, E.; Mantyka-Pringle, C.; et al. Predicting species distributions for conservation decisions. Ecol. Lett. 2013, 16, 1424–1435. [Google Scholar] [CrossRef] [Scilit] [PubMed]
- Johnson, D.H. The comparison of usage and availability measurements for evaluating resource preference. Ecology 1980, 61, 65–71. [Google Scholar] [CrossRef] [Scilit]
- Neupane, N.; Larsen, E.A.; Ries, L. Ecological forecasts of insect range dynamics: A broad range of taxa include winners and losers under future climate. Curr. Opin. Insect Sci. 2024, 62, 101159. [Google Scholar] [CrossRef] [Scilit] [PubMed]
- Yang, M.; Yu, J.; Wang, Y.; Dewer, Y.; Huo, Y.; Wang, Z.; Zhang, H.; Shao, X.; Ma, F.; Shangguan, X.; et al. Potential global distributions of an important aphid pest, Rhopalosiphum padi: Insights from ensemble models with multiple variables. J. Econ. Entomol. 2025, 118, 576–588. [Google Scholar] [CrossRef] [Scilit] [PubMed]
- Zhu, G.P.; Liu, G.Q.; Bu, W.J.; Gao, Y.B. Ecological niche modelling and its applications in biodiversity conservation. Biodivers. Sci. 2013, 21, 90–98. [Google Scholar] [CrossRef] [Scilit]
- Breiman, L. Random forests. Mach. Learn. 2001, 45, 5–32. [Google Scholar] [CrossRef] [Scilit]
- Phillips, S.J.; Anderson, R.P.; Schapire, R.E. Maximum entropy modeling of species geographical distributions. Ecol. Model. 2006, 190, 231–259. [Google Scholar] [CrossRef] [Scilit]
- Li, W.B.; Teng, Y.; Zhang, M.Y.; Shen, Y.; Liu, J.W.; Qi, J.W.; Wang, X.C.; Wu, R.F.; Li, J.H.; Garber, P.A.; et al. Human activity and climate change accelerate the extinction risk to non-human primates in China. Glob. Change Biol. 2024, 30, e17114. [Google Scholar]
- Duan, M.; Ning, J.; Wang, G.; Xu, Z.; Li, S.; Zhang, Z.; Zhang, L.; Zhao, L. Human activities and climate change accelerate the spread risk of Hyphantria cunea in China. Insects 2026, 17, 154. [Google Scholar] [CrossRef] [Scilit] [PubMed]
- Duffy, G.A.; Coetzee, B.W.; Latombe, G.; Akerman, A.H.; McGeoch, M.A.; Chown, S.L. Barriers to globally invasive species are weakening across the Antarctic. Divers. Distrib. 2017, 23, 982–996. [Google Scholar] [CrossRef] [Scilit]
- Gan, T.; He, Z.; Xu, D.; Chen, J.; Zhang, H.; Wei, X.; Zhuo, Z. Modeling the potential distribution of Hippophae rhamnoides in China under current and future climate scenarios using the biomod2 model. Front. Plant Sci. 2025, 16, 1533251. [Google Scholar] [CrossRef] [Scilit] [PubMed]
- Liu, T.; Liu, H.; Tong, J.; Yang, Y. Habitat suitability of neotenic net-winged beetles (Coleoptera: Lycidae) in China using combined ecological models, with implications for biological conservation. Divers. Distrib. 2022, 28, 2806–2823. [Google Scholar] [CrossRef] [Scilit]
- Araújo, M.B.; New, M. Ensemble forecasting of species distributions. Trends Ecol. Evol. 2007, 22, 42–47. [Google Scholar] [CrossRef] [Scilit] [PubMed]
- Grenouillet, G.; Buisson, L.; Casajus, N.; Lek, S. Ensemble modelling of species distribution: The effects of geographical and environmental ranges. Ecography 2011, 34, 9–17. [Google Scholar] [CrossRef] [Scilit]
- Thuiller, W.; Lafourcade, B.; Engler, R.; Araújo, M.B. BIOMOD–A platform for ensemble forecasting of species distributions. Ecography 2009, 32, 369–373. [Google Scholar] [CrossRef] [Scilit]
- Koo, K.A.; Park, S.U. A dark future of endangered mountain species, Parnassius bremeri, under climate change. Ecol. Evol. 2025, 15, e71178. [Google Scholar] [CrossRef] [Scilit] [PubMed]
- Ghazanfar, M.; Malik, M.F.; Hussain, M.; Iqbal, R.; Younas, M. Butterflies and their contribution in ecosystem: A Review. J. Entomol. Zool. Stud. 2016, 4, 115–118. [Google Scholar]
- Thomas, J.A. Monitoring change in the abundance and distribution of insects using butterflies and other indicator groups. Philos. Trans. R. Soc. B 2005, 360, 339–357. [Google Scholar] [CrossRef] [Scilit] [PubMed]
- Tian, X.; Mo, S.; Liang, D.; Wang, H.; Zhang, P. Amplicon capture phylogenomics provides new insights into the phylogeny and evolution of alpine Parnassius butterflies (Lepidoptera: Papilionidae). Syst. Entomol. 2023, 48, 571–584. [Google Scholar] [CrossRef] [Scilit]
- Martín-Vélez, V.; Abellán, P. Effects of climate change on the distribution of threatened invertebrates in a Mediterranean hotspot. Insect Conserv. Divers. 2022, 15, 370–379. [Google Scholar] [CrossRef] [Scilit]
- Chou, I. Monographia Rhopalocerorum Sinensium, revised ed.; Henan Scientific and Technological Publishing House: Zhengzhou, China, 1999. [Google Scholar]
- Fang, J.H.; Luo, Y.Q.; Niu, B.; Tu, A.; Zhao, L. Biological characteristics and habitat requirements of Parnassius imperator (Lepidoptera: Parnassiidae). Acta Ecol. Sin. 2012, 32, 361–370. [Google Scholar] [CrossRef] [Scilit]
- Da, X.W.; Zhang, R.; Chen, G.L.; Ren, Q.M.; Lin, Y.F.; Du, B. Why do males of Parnassius imperator fight for bare rocks but not the nectar flower during mate selection? Ethology 2016, 122, 552–560. [Google Scholar] [CrossRef] [Scilit]
- Yu, X.T.; Yang, F.L.; Da, W.; Li, Y.C.; Xi, H.M.; Cotton, A.M.; Zhang, H.H.; Duan, K.; Xu, Z.B.; Gong, Z.X.; et al. Species richness of Papilionidae butterflies (Lepidoptera: Papilionoidea) in the Hengduan Mountains and its future shifts under climate change. Insects 2023, 14, 259. [Google Scholar] [CrossRef] [Scilit] [PubMed]
- Chamberlain, S.; Ram, K.; Barve, V.; Mcglinn, D. rgbif: Interface to the Global Biodiversity Information Facility, R Package Version; CRAN: Vienna, Austria, 2017. [Google Scholar]
- Zizka, A.; Silvestro, D.; Andermann, T.; Azevedo, J.; Ritter, C.D.; Edler, D.; Farooq, H.; Herdean, A.; Ariza, M.; Scharn, R.; et al. Coordinatecleaner: Standardized cleaning of occurrence records from biological collection databases. Methods Ecol. Evol. 2019, 10, 744–751. [Google Scholar] [CrossRef] [Scilit]
- Aiello-Lammens, M.E.; Boria, R.A.; Radosavljevic, A.; Vilela, B.; Anderson, R.P. spThin: An R package for spatial thinning of species occurrence records for use in ecological niche models. Ecography 2015, 38, 541–545. [Google Scholar] [CrossRef] [Scilit]
- Aidoo, O.F.; Souza, P.G.C.; Silva, R.S.; Júnior, P.A.S.; Picanço, M.C.; Heve, W.K.; Duker, R.Q.; Ablormeti, F.K.; Sétamou, M.; Borgemeister, C. Modeling climate change impacts on potential global distribution of Tamarixia radiata Waterston (Hymenoptera: Eulophidae). Sci. Total Environ. 2023, 864, 160962. [Google Scholar] [CrossRef] [Scilit] [PubMed]
- Lantschner, M.V.; de la Vega, G.; Corley, J.C. Predicting the distribution of harmful species and their natural enemies in agricultural, livestock and forestry systems: An overview. Int. J. Pest Manag. 2019, 65, 190–206. [Google Scholar] [CrossRef] [Scilit]
- Boucher, O.; Servonnat, J.; Albright, A.L.; Aumont, O.; Balkanski, Y.; Bastrikov, V.; Bekki, S.; Bonnet, R.; Bony, S.; Bopp, L.; et al. Presentation and evaluation of the IPSL-CM6A-LR climate model. J. Adv. Model. Earth Syst. 2020, 12, e2019MS001929. [Google Scholar] [CrossRef] [Scilit]
- Eyring, V.; Bony, S.; Meehl, G.A.; Senior, C.A.; Stevens, B.; Stouffer, R.J.; Taylor, K.E. Overview of the coupled model intercomparison project phase 6 (CMIP6) experimental design and organization. Geosci. Model Dev. 2016, 9, 1937–1958. [Google Scholar] [CrossRef] [Scilit]
- O’Neill, B.C.; Kriegler, E.; Riahi, K.; Ebi, K.L.; Hallegatte, S.; Carter, T.R.; Mathur, R.; van Vuuren, D.P. A new scenario framework for climate change research: The concept of shared socioeconomic pathways (SSPs). Clim. Change 2014, 122, 387–400. [Google Scholar]
- Xin, X.; Zhang, J.; Zhang, F.; Wu, T.; Shi, X.; Li, J.; Chu, M.; Liu, Q.; Yan, J.; Ma, Q.; et al. BCC BCC-CSM2MR Model Output Prepared for CMIP6 CMIP. World Data Center for Climate (WDCC) at DKRZ. 2023. Available online: https://www.wdc-climate.de/ui/entry?acronym=C6_4101192 (accessed on 10 April 2024).
- Yukimoto, S.; Kawai, H.; Koshiro, T.; Oshima, N.; Yoshida, K.; Urakawa, S.; Tsujino, H.; Deushi, M.; Tanaka, T.; Hosaka, M.; et al. The Meteorological Research Institute Earth System Model version 2.0, MRI-ESM2. 0: Description and basic evaluation of the physical component. J. Meteorol. Soc. Jpn. Ser. II 2019, 97, 931–965. [Google Scholar] [CrossRef] [Scilit]
- Dormann, C.F.; Elith, J.; Bacher, S.; Buchmann, C.; Carl, G.; Carré, G.; Jaime, R.; Marquéz, G.; Gruber, B.; Lafourcade, B.; et al. Correlation and process in species distribution models: Bridging a dichotomy. J. Biogeogr. 2012, 39, 2119–2131. [Google Scholar] [CrossRef] [Scilit]
- Sillero, N.; Arenas-Castro, S.; Enriquez-Urzelai, U.; Vale, C.G.; Sousa-Guedes, D.; Martínez-Freiría, F.; Real, R.; Barbosa, A.M. Want to model a species niche? A step-by-step guideline on correlative ecological niche modelling. Ecol. Model. 2021, 456, 109671. [Google Scholar] [CrossRef] [Scilit]
- Guo, X.; Bai, W.; Wang, Y.; Hao, S.; Zhao, L.; Li, X.; Guo, Z.; Li, X. Predicting habitat suitability for an endangered medicinal plant, Saussurea medusa: Insights from ensemble species distribution models. Front. Plant Sci. 2025, 16, 1590206. [Google Scholar] [CrossRef] [Scilit] [PubMed]
- Ran, W.; Chen, J.; Zhao, Y.; Zhang, N.; Luo, G.; Zhao, Z.; Song, Y. Global climate change-driven impacts on the Asian distribution of Limassolla leafhoppers, with implications for biological and environmental conservation. Ecol. Evol. 2024, 14, e70003. [Google Scholar] [CrossRef] [Scilit] [PubMed]
- Naimi, B.; Araujo, M.B. sdm: A reproducible and extensible R platform for species distribution modelling. Ecography 2016, 39, 368–375. [Google Scholar] [CrossRef] [Scilit]
- Busby, J.R. BIOCLIM—A bioclimate analysis and prediction system. Plant Prot. Q. 1991, 6, 8–9. [Google Scholar]
- Loh, W.Y. Classification and regression trees. WIREs Data Min. Knowl. Discov. 2011, 1, 14–23. [Google Scholar] [CrossRef] [Scilit]
- Reinhartz-Berger, I. Towards automatization of domain modelling. Data Knowl. Eng. 2010, 69, 491–515. [Google Scholar] [CrossRef] [Scilit]
- Hastie, T.; Tibshirani, R.; Buja, A. Flexible discriminant analysis by optimal scoring. J. Am. Stat. Assoc. 1994, 89, 1255–1270. [Google Scholar] [CrossRef]
- Hastie, T.; Tibshirani, R. Generalized additive models: Some applications. J. Am. Stat. Assoc. 1987, 82, 371–378. [Google Scholar] [CrossRef]
- Nelder, J.A.; Wedderburn, R.W. Generalized linear models. J. R. Stat. Soc. A 1972, 135, 370–384. [Google Scholar] [CrossRef] [Scilit]
- Engebretsen, S.; Bohlin, J. Statistical predictions with glmnet. Clin. Epigenet. 2019, 11, 123. [Google Scholar] [CrossRef] [Scilit] [PubMed]
- Royle, J.A.; Chandler, R.B.; Yackulic, C.; Nichols, J.D. Likelihood analysis of species occurrence probability from presence-only data for modelling species distributions. Methods Ecol. Evol. 2012, 3, 545–554. [Google Scholar] [CrossRef] [Scilit]
- Friedman, J.H. Multivariate adaptive regression splines. Ann. Stat. 1991, 19, 1–67. [Google Scholar] [CrossRef] [Scilit]
- Hearst, M.A.; Osuna, S.T.; Platt, J.; Scholkopf, B. Support vector machines. IEEE Intell. Syst. Appl. 1998, 13, 18–28. [Google Scholar] [CrossRef] [Scilit]
- Barbet-Massin, M.; Jiguet, F.; Albert, C.H.; Thuiller, W. Selecting pseudo-absences for species distribution models: How, where and how many? Methods Ecol. Evol. 2012, 3, 327–338. [Google Scholar] [CrossRef] [Scilit]
- Peng, D.; Sun, L.; Pritchard, H.W.; Yang, J.; Sun, H.; Li, Z. Species distribution modelling and seed germination of four threatened snow lotus (Saussurea), and their implication for conservation. Glob. Ecol. Conserv. 2019, 17, e00565. [Google Scholar] [CrossRef] [Scilit]
- Zhang, H.; Wang, Y.; Wang, Z.; Ding, W.; Xu, K.; Li, L.; Wang, Y.; Li, J.; Yang, M.; Liu, X.; et al. Modelling the current and future potential distribution of the bean bug Riptortus pedestris with increasingly serious damage to soybean. Pest Manag. Sci. 2022, 78, 4340–4352. [Google Scholar] [CrossRef] [Scilit] [PubMed]
- Lobo, J.M.; Jiménez-Valverde, A.; Real, R. AUC: A misleading measure of the performance of predictive distribution models. Glob. Ecol. Biogeogr. 2008, 17, 145–151. [Google Scholar]
- Allouche, O.; Tsoar, A.; Kadmon, R. Assessing the accuracy of species distribution models: Prevalence, kappa and the true skill statistic (TSS). J. Appl. Ecol. 2006, 43, 1223–1232. [Google Scholar] [CrossRef] [Scilit]
- Hand, D.J.; Anagnostopoulos, C. When is the area under the receiver operating characteristic curve an appropriate measure of classifier performance? Pattern Recognit. Lett. 2013, 34, 492–495. [Google Scholar] [CrossRef] [Scilit]
- Peterson, A.T.; Papes, M.; Soberon, J. Rethinking receiver operating characteristic analysis applications in ecological niche modeling. Ecol. Model. 2008, 213, 63–72. [Google Scholar] [CrossRef] [Scilit]
- Zhu, G.P.; Fan, J.Y.; Wang, M.L.; Chen, M.; Qiao, H. The importance of the shape of receiver operating characteristic (ROC) curve in ecological niche model evaluation—Case study of Hlyphantria cunea. J. Biosaf. 2017, 26, 184–190. [Google Scholar]
- Pearce, J.; Ferrier, S. An evaluation of alternative algorithms for fitting species distribution models using logistic regression. Ecol. Model. 2000, 128, 127–147. [Google Scholar] [CrossRef] [Scilit]
- Zhang, K.; Yao, L.; Meng, J.; Tao, J. Maxent modelling for predicting the potential geographical distribution of two peony species under climate change. Sci. Total Environ. 2018, 634, 1326–1334. [Google Scholar] [CrossRef] [Scilit] [PubMed]
- Katoh, T.; Chichvarkhin, A.; Yagi, T.; Omoto, K. Phylogeny and evolution of butterflies of the genus Parnassius: Inferences from mitochondrial 16S and ND1 sequences. Zool. Sci. 2005, 22, 343–351. [Google Scholar] [CrossRef] [Scilit] [PubMed]
- Zhao, Y.; He, B.; Tao, R.; Su, C.; Ma, J.; Hao, J.; Yang, Q. Phylogeny and biogeographic history of Parnassius butterflies (Papilionidae: Parnassiinae) reveal their origin and deep diversification in West China. Insects 2022, 13, 406. [Google Scholar] [CrossRef] [Scilit] [PubMed]
- Rossi, J.P.; Rasplus, J.Y. Climate change and the potential distribution of the glassy-winged sharpshooter Homalodisca vitripennis, an insect vector of Xylella fastidiosa. Sci. Total Environ. 2023, 860, 160375. [Google Scholar] [CrossRef] [Scilit] [PubMed]
- Macfadyen, S.; McDonald, G.; Hill, M.P. From species distributions to climate change adaptation: Knowledge gaps in managing invertebrate pests in broad-acre grain crops. Agric. Ecosyst. Environ. 2018, 253, 208–219. [Google Scholar] [CrossRef] [Scilit]
- Heikkinen, R.K.; Luoto, M.; Leikola, N.; Pöyry, J.; Settele, J.; Kudrna, O.; Marmion, M.; Fronzek, S.; Thuiller, W. Assessing the vulnerability of European butterflies to climate change using multiple criteria. Biodivers. Conserv. 2010, 19, 695–723. [Google Scholar]
- Santana, P.A., Jr.; Kumar, L.; Da Silva, R.S.; Pereira, J.L.; Picanço, M.C. Assessing the impact of climate change on the worldwide distribution of Dalbulus maidis DeLong using MaxEnt. Pest Manag. Sci. 2019, 75, 2706–2715. [Google Scholar] [CrossRef] [Scilit] [PubMed]
- He, B. Phylogenomics and Population Genetics of Representative Parnassius species (Papilionidae: Parnassinae). Doctor’s Dissertation, Anhui Normal University, Wuhu, China, 2025. [Google Scholar]
- Trisos, C.H.; Merow, C.; Pigot, A.L. The projected timing of abrupt ecological disruption from climate change. Nature 2020, 580, 496–501. [Google Scholar] [CrossRef] [Scilit] [PubMed]
- Barbet-Massin, M.; Jetz, W. A 40-year, continent-wide, multispecies assessment of relevant climate predictors for species distribution modelling. Divers. Distrib. 2014, 20, 1285–1295. [Google Scholar] [CrossRef] [Scilit]
- Bell, D.M.; Bradford, J.B.; Lauenroth, W.K. Early indicators of change: Divergent climate envelopes between tree life stages imply range shifts in the western United States. Glob. Ecol. Biogeogr. 2014, 23, 168–180. [Google Scholar]
- Hill, G.M.; Kawahara, A.Y.; Daniels, J.C.; Bateman, C.C.; Scheffers, B.R. Climate change effects on animal ecology: Butterflies and moths as a case study. Biol. Rev. 2021, 96, 2113–2126. [Google Scholar] [CrossRef] [Scilit] [PubMed]
- Azrag, A.G.A.; Pirk, C.W.W.; Yusuf, A.A.; Pinard, F.; Niassy, S.; Mosomtai, G.; Babin, R. Prediction of insect pest distribution as influenced by elevation: Combining field observations and temperature-dependent development models for the coffee stink bug, Antestiopsis thunbergii (Gmelin). PLoS ONE 2018, 13, e0199569. [Google Scholar] [CrossRef] [Scilit] [PubMed]
- Chardon, N.I.; Cornwell, W.K.; Flint, L.E.; Flint, A.L.; Ackerly, D.D. Topographic, latitudinal and climatic distribution of Pinus coulteri: Geographic range limits are not at the edge of the climate envelope. Ecography 2015, 38, 590–601. [Google Scholar]
- Zhao, R.; Wang, S.; Chen, S. Predicting the potential habitat suitability of Saussurea species in China under future climate scenarios using the optimized maximum entropy maxent model. J. Clean. Prod. 2024, 474, 143552. [Google Scholar] [CrossRef] [Scilit]
- Hof, A.R.; Jansson, R.; Nilsson, C. The usefulness of elevation as a predictor variable in species distribution modelling. Ecol. Model. 2012, 246, 86–90. [Google Scholar] [CrossRef] [Scilit]
- Luck, G.W. A review of the relationships between human population density and biodiversity. Biol. Rev. 2007, 82, 607–645. [Google Scholar] [CrossRef] [Scilit] [PubMed]
- Li, D.; Gan, H.; Li, X.; Zhou, H.; Zhang, H.; Liu, Y.; Dong, R.; Hua, L.; Hu, G. Changes in the range of four advantageous grasshopper habitats in the Hexi Corridor under future climate conditions. Insects 2024, 15, 243. [Google Scholar] [CrossRef] [Scilit] [PubMed]
- Paradis, E. Nonlinear relationship between biodiversity and human population density: Evidence from Southeast Asia. Biodivers. Conserv. 2018, 27, 2699–2712. [Google Scholar] [CrossRef] [Scilit]
- Haddad, N.M.; Hudgens, B.; Damiani, C.; Gross, K.; Kuefler, D.; Pollock, K. Determining optimal population monitoring for rare butterflies. Conserv. Biol. 2008, 22, 929–940. [Google Scholar] [CrossRef] [Scilit] [PubMed]
- Yang, X.; Gu, T.; Wang, S. Effectiveness of nature reserves in China: Human footprint and ecosystem services perspective. Appl. Geogr. 2024, 171, 103359. [Google Scholar] [CrossRef] [Scilit]
- Breiner, F.T.; Guisan, A.; Bergamini, A.; Nobis, M.P. Overcoming limitations of modelling rare species by using ensembles of small models. Methods Ecol. Evol. 2015, 6, 1210–1218. [Google Scholar] [CrossRef] [Scilit]
- Stefanidis, A.; Kougioumoutzis, K.; Zografou, K.; Fotiadis, G.; Tzortzakaki, O.; Willemse, L.; Kati, V. Mitigating the extinction risk of globally threatened and endemic mountainous Orthoptera species: Parnassiana parnassica and Oropodisma parnassica. Insect Conserv. Divers. 2025, 18, 54–68. [Google Scholar]
Disclaimer/Publisher’s Note: The statements, opinions and data contained in all publications are solely those of the individual author(s) and contributor(s) and not of MDPI and/or the editor(s). MDPI and/or the editor(s) disclaim responsibility for any injury to people or property resulting from any ideas, methods, instructions or products referred to in the content. |
© 2026 by the authors. Licensee MDPI, Basel, Switzerland. This article is an open access article distributed under the terms and conditions of the Creative Commons Attribution (CC BY) license.