


Simple Summary
Saudi Arabia supports diverse beekeeping systems that differ in hive type, apiary size, productivity and health-management conditions. We surveyed 98 apiaries purposively selected across five important beekeeping regions to characterize these differences and identify factors associated with honey productivity. Modern frame hives produced more honey per colony than traditional hives in apiaries where both systems were present. Productivity also varied among regions, although the highly unequal regional sample sizes mean that the findings should not be interpreted as national prevalence estimates. Varroa occurrence varied among apiaries but was not independently associated with annual honey yield after adjustment for hive composition, apiary size and region. Multivariate analysis identified distinct apiary profiles, showing that production scale alone did not determine performance. Beekeepers most frequently reported concerns related to imported bees and biosecurity, predators and honey marketing. The findings support targeted extension, biosecurity and productivity improvement while emphasizing the need for representative longitudinal studies and standardized disease diagnostics.
Abstract
Saudi Arabia’s beekeeping sector comprises traditional and modern frame-hive systems operating under diverse environmental and management conditions. This cross-sectional study characterized 98 purposively selected apiaries participating in the Sustainable Rural Agricultural Development (SRAD) Programme, jointly implemented by the Saudi Ministry of Environment, Water and Agriculture and the Food and Agriculture Organization of the United Nations, across Makkah (n = 42), Jazan (n = 34), Asir (n = 16), Al-Baha (n = 4), and Al-Madinah (n = 2). Data included hive structure, honey production, Varroa occurrence, and beekeeper-reported constraints. Given the purposive and regionally unbalanced sampling, inference was restricted to the surveyed apiaries. Among 54 apiaries maintaining both hive systems, median annual yield was higher in modern than traditional hives (2.67 vs. 1.10 kg/colony; paired Wilcoxon p < 0.001). Yield also differed among regions (Kruskal–Wallis H = 19.07, p < 0.001). In the adjusted model, the proportion of modern hives was positively associated with productivity (β = 0.019; p = 0.001), whereas Varroa percentage was not (p = 0.2644). PCA explained 68.1% of variation in the first two components and supported three exploratory apiary clusters. Among 62 apiaries reporting constraints, imports/biosecurity (25.8%), predators (22.6%), and marketing/value-chain issues (19.4%) predominated. The findings demonstrate substantial heterogeneity among surveyed apiaries and support targeted extension and biosecurity interventions, while representative longitudinal studies and standardized disease diagnostics are needed for national-level inference.
1. Introduction
Honeybees provide pollination services that support agricultural production and biodiversity while managed apiculture contributes honey and other products to rural livelihoods and local economies [1,2,3,4,5,6]. Honeybee populations are nevertheless exposed to interacting pressures from parasites, pathogens, nutrition, environmental conditions and management [7,8,9,10,11]. These interactions are particularly relevant in arid and semi-arid environments, where forage availability, high temperatures and seasonal mobility can influence colony management and production.
Beekeeping in Saudi Arabia occurs across contrasting agro-ecological zones and includes both traditional hives and modern frame hives. The country also supports indigenous Apis mellifera jemenitica populations that are adapted to hot and dry conditions [12,13,14]. Conservation of these genetic resources is important, but hive design is not equivalent to bee genetic origin. A modern frame hive may contain local or imported bees, and a traditional hive does not by itself establish indigenous genetic identity. The present study therefore uses “traditional hive” and “modern frame hive” strictly as production-system descriptors.
Honeybee health is another important production concern. Varroa destructor is one of the most consequential parasites of managed western honeybees and interacts with viral infections and colony condition [9,15,16,17]. Reliable assessment of parasite and disease occurrence, however, requires standardized sampling and diagnostic procedures. In particular, clinical signs alone are insufficient to confirm Nosema infection; laboratory-based microscopy or molecular diagnosis is required for defensible prevalence estimates [18,19].
Although Saudi apiculture has expanded, integrated field evidence describing apiary structure, hive systems, productivity, health indicators and beekeeper constraints remains limited [12,13,14]. A clearer description of production-system heterogeneity can help identify practical extension, biosecurity and productivity priorities without assuming that a purposive field sample represents the entire national sector. Accordingly, this study aimed to (i) characterize surveyed apiaries across five important beekeeping regions; (ii) compare productivity between traditional and modern hive systems; (iii) examine associations of region, apiary size, hive composition and Varroa occurrence with annual yield; (iv) explore production-system typologies using non-redundant multivariate indicators; and (v) summarize beekeeper-reported constraints.
2. Materials and Methods
2.1. Study Design, Area and Sampling
A cross-sectional field survey was conducted from February to April 2026 in collaboration with the regional offices of the Ministry of Environment, Water and Agriculture (MEWA) across five major beekeeping regions of Saudi Arabia: Makkah, Jazan, Asir, Al-Baha, and Al-Madinah. These regions encompass diverse agroecological conditions and beekeeping environments, ranging from the southwestern highlands to arid and semi-arid production areas. Beekeeping is commonly migratory, with colonies moved seasonally according to flowering resources and production opportunities.
The survey primarily targeted beekeepers who were beneficiaries of the Sustainable Rural Agricultural Development (SRAD) Programme. The sampling frame therefore consisted of SRAD-supported beekeepers accessible through the respective MEWA regional offices. A purposive, non-probability sampling approach was adopted to include participating apiaries representing variation in apiary size, hive composition, production practices, and management conditions. Accordingly, the sample size was determined by the number of eligible and accessible SRAD beneficiaries participating in the survey rather than through a statistical calculation intended to estimate nationally representative parameters.
Beekeepers were eligible for inclusion if they were SRAD beneficiaries engaged in active beekeeping during the survey period, maintained an operational apiary within one of the five study regions, and were willing to participate and provide the information required by the structured questionnaire. One apiary represented one unique beekeeper, thereby avoiding repeated observations from the same respondent.
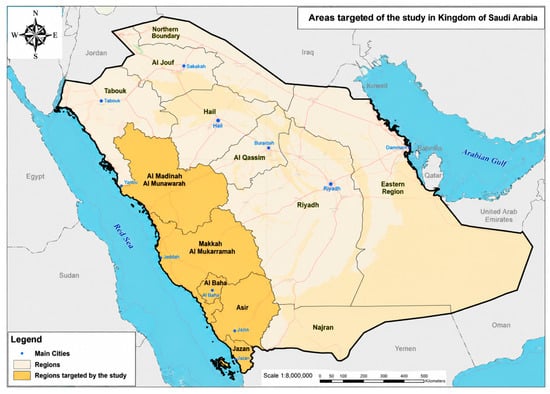
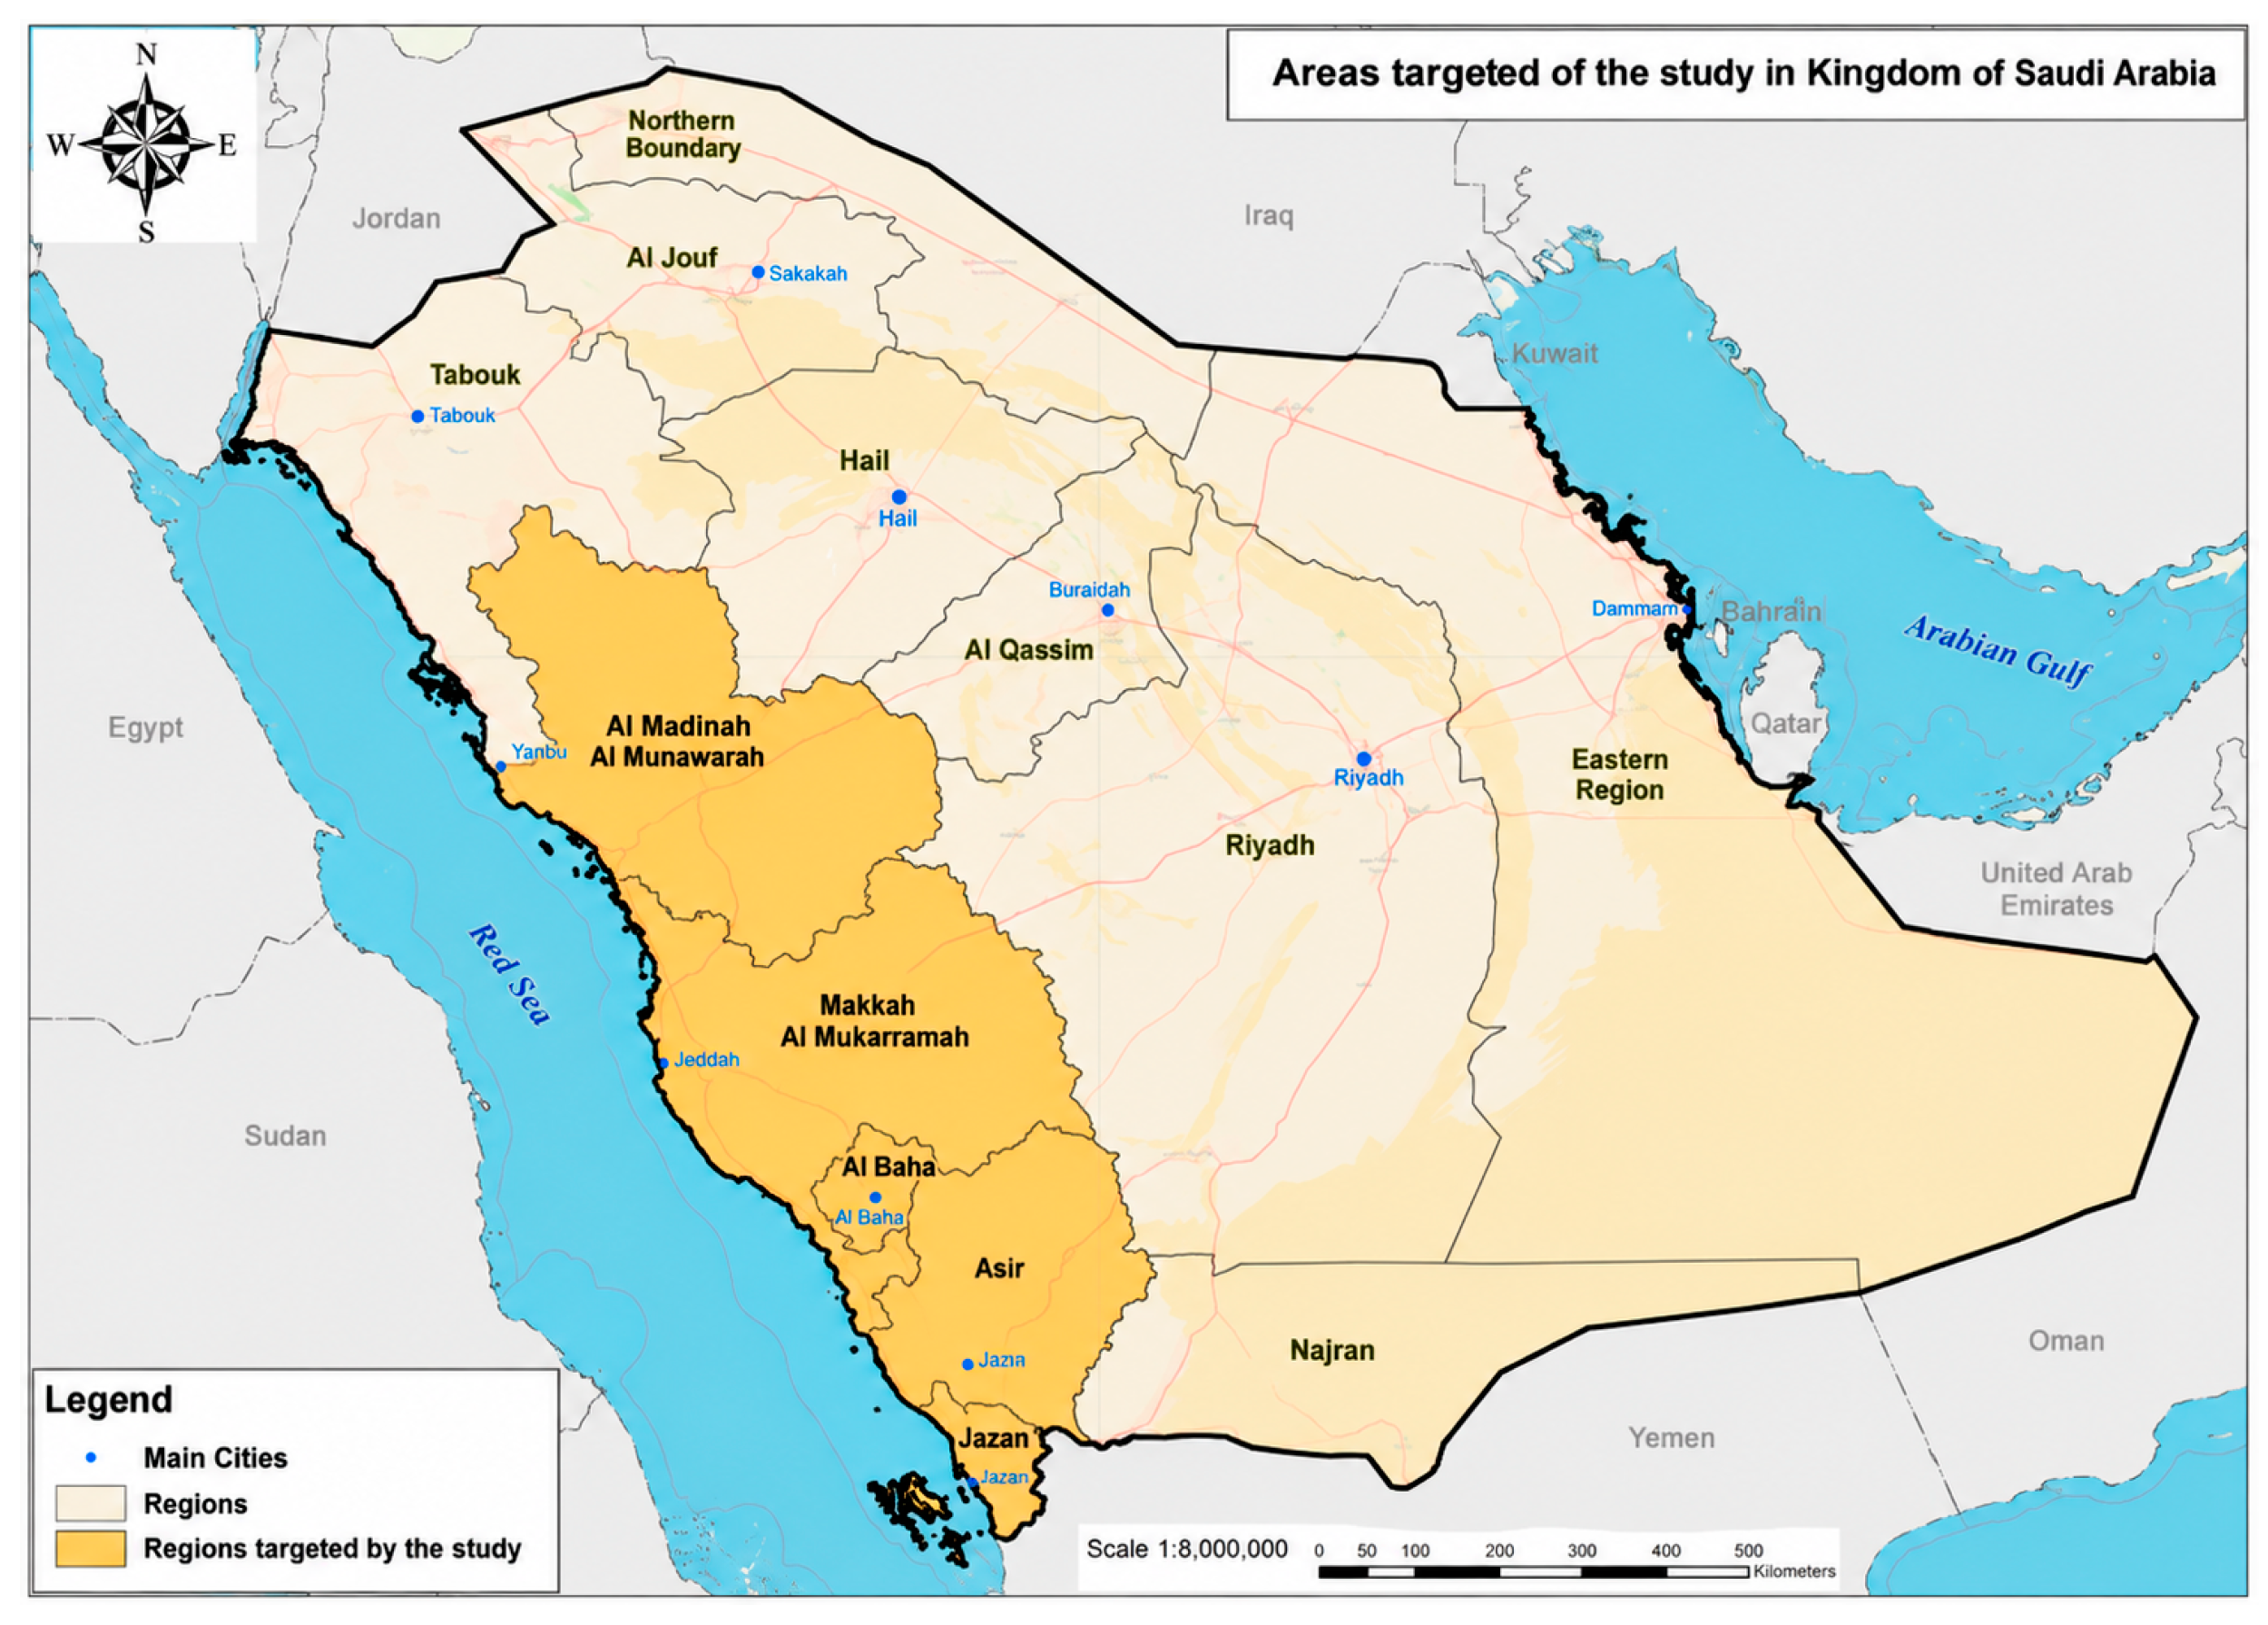
A total of 100 apiaries were initially surveyed. Two records were excluded following data-quality assessment because they did not contain sufficiently reliable information for analysis, resulting in a final analytical sample of 98 apiaries, (Figure 1: Makkah (n = 42), Jazan (n = 34), Asir (n = 16), Al-Baha (n = 4), and Al-Madinah (n = 2). Beekeepers were interviewed using a structured questionnaire (refer to the attached questionnaire in Supplementary Material), supplemented by field observations to verify key apiary characteristics. Participation was voluntary.
Figure 1.
Distribution of surveyed apiaries across the five major beekeeping regions of Saudi Arabia (Jazan, Makkah, Asir, Al-Baha, and Al-Madinah), where beekeeping is predominantly concentrated.
Because the sampling frame was restricted primarily to SRAD beneficiaries, selection was purposive, and the regional sample sizes were highly unequal, the study was designed to characterize the surveyed apiaries rather than provide nationally representative estimates of Saudi Arabia’s beekeeping sector. Regional comparisons, particularly those involving Al-Baha and Al-Madinah, were therefore interpreted cautiously.
2.2. Data Collection and Variables
Data was collected using a structured questionnaire supplemented by field observations. The questionnaire was developed with input from apiculture specialists and extension personnel and was pre-tested before field administration. Information was collected on apiary location, colony structure, honey production, major pests and health problems, and beekeeper-reported production constraints.
Apiary structure was characterized by the numbers of traditional and modern frame (Langstroth) colonies, the total colony number, and the proportional composition of the two hive systems. The terms traditional and modern refer exclusively to hive and management systems and were not used as proxies for honeybee genetic origin. The revised dataset was checked for arithmetic consistency, and traditional plus modern colony numbers corresponded to the reported total colony number for all 98 apiaries.
Honey production was recorded for three harvest periods and summarized as annual production and yield per colony. Both total production and colony-level productivity were considered; however, yield per colony was preferred for productivity comparisons because total honey production is strongly influenced by apiary size. Honey-production information was obtained from beekeeper-reported production records and expressed in kilograms.
Honeybee health assessment focused primarily on Varroa destructor. Ten colonies from each surveyed apiary were observed for disease occurrence. For Varroa assessment, colonies were examined using the powdered-sugar shake method, and infestation was expressed as the percentage of colonies infested relative to the number of colonies examined.
The original questionnaire also recorded clinical signs considered compatible with Nosema infection, including abnormal mortality, crawling bees, and observations of brood combs. However, because microscopic spore examination or molecular confirmation was not undertaken, these non-specific clinical observations were not considered diagnostic evidence of Nosema. Consequently, Nosema was excluded from any inferential statistical analyses.
Beekeeper-reported constraints were recorded through the questionnaire and subsequently consolidated into broader, non-overlapping categories to avoid duplication among similar responses. These included imports and biosecurity, disease management and treatment services, predators, marketing and value-chain constraints, governance and apiary management, transport and logistics, environmental and forage limitations, and beekeeper management practices. The number of valid responses and the corresponding denominator were explicitly reported because not all surveyed beekeepers provided a specific constraint.
2.3. Statistical Analysis
The apiary was the primary observational unit. Continuous variables were summarized using means and standard deviations and, where distributions were skewed, medians and interquartile ranges. Categorical variables were summarized as counts and percentages. Missingness was evaluated before analysis. Because regional sample sizes were highly unequal and two regions had very small samples, unadjusted regional comparisons of continuous outcomes used Kruskal–Wallis tests with multiplicity-adjusted Dunn comparisons where appropriate.
Traditional- and modern-hive yield per colony was compared within apiaries containing both systems using the paired Wilcoxon signed-rank test; the paired t-test was retained only as a sensitivity analysis. Harvest-level data were reshaped to long format and analysed as repeated observations using a mixed-effects model with hive type, harvest and their interaction as fixed effects and apiary as a random intercept. Estimated marginal means and multiplicity-adjusted contrasts were used to interpret the fitted model. A log1p-transformed model was used as a sensitivity analysis if residual assumptions were unsatisfactory.
Hive composition was represented by a single proportion (percentage modern hives) to avoid the mathematical redundancy between percentages of traditional and modern hives. Where count-based composition was analysed, modern and traditional colony counts were modelled jointly using a beta-binomial framework. Annual productivity was examined with a parsimonious linear regression including region, log-transformed apiary size, percentage modern hives and Varroa percentage. Heteroscedasticity-consistent HC3 standard errors were used, and multicollinearity, residual patterns and influential observations were examined. Heteroskedasticity-consistent type 3 (HC3) robust standard errors were applied in the multivariable regression analysis of the 98 apiaries to account for potential differences in residual variance associated with variation in apiary size, modern hive composition, and honey productivity. The surveyed apiaries exhibited considerable heterogeneity in colony numbers (60–1250 colonies), modern hive proportions (0–100%), and annual honey yield (mean ± SD: 2.43 ± 2.44 kg/colony). Given this variability and the modest sample size, HC3 robust standard errors were used to improve the reliability of coefficient-level statistical inference and reduce sensitivity to high-leverage observations. The estimated regression coefficients remained unchanged, while statistical significance was assessed using HC3-adjusted standard errors. A sensitivity analysis excluded regions with fewer than five observations.
Spearman correlations were restricted to non-redundant variables. PCA was conducted on standardized values of four conceptually distinct indicators: log total colony number, percentage modern hives, annual yield per colony and Varroa percentage. PCA therefore excluded mathematically dependent colony counts/percentages and the unconfirmed Nosema variable. The first two components were used for interpretation; descriptive PCA quadrants were not treated as statistically defined production classes. Cluster analysis followed PCA and used retained PC scores. Candidate solutions from k = 2 to 6 were compared using mean silhouette width, and the best-supported solution was used for exploratory typology. All analyses were conducted in R Version 4.6.1 [20]. Statistical significance was evaluated at p < 0.05, while emphasis was placed on effect sizes, confidence intervals and the exploratory nature of analyses affected by sparse regional data.
3. Results
3.1. Characteristics of the Surveyed Apiaries
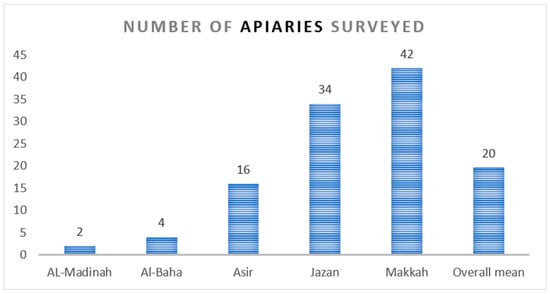
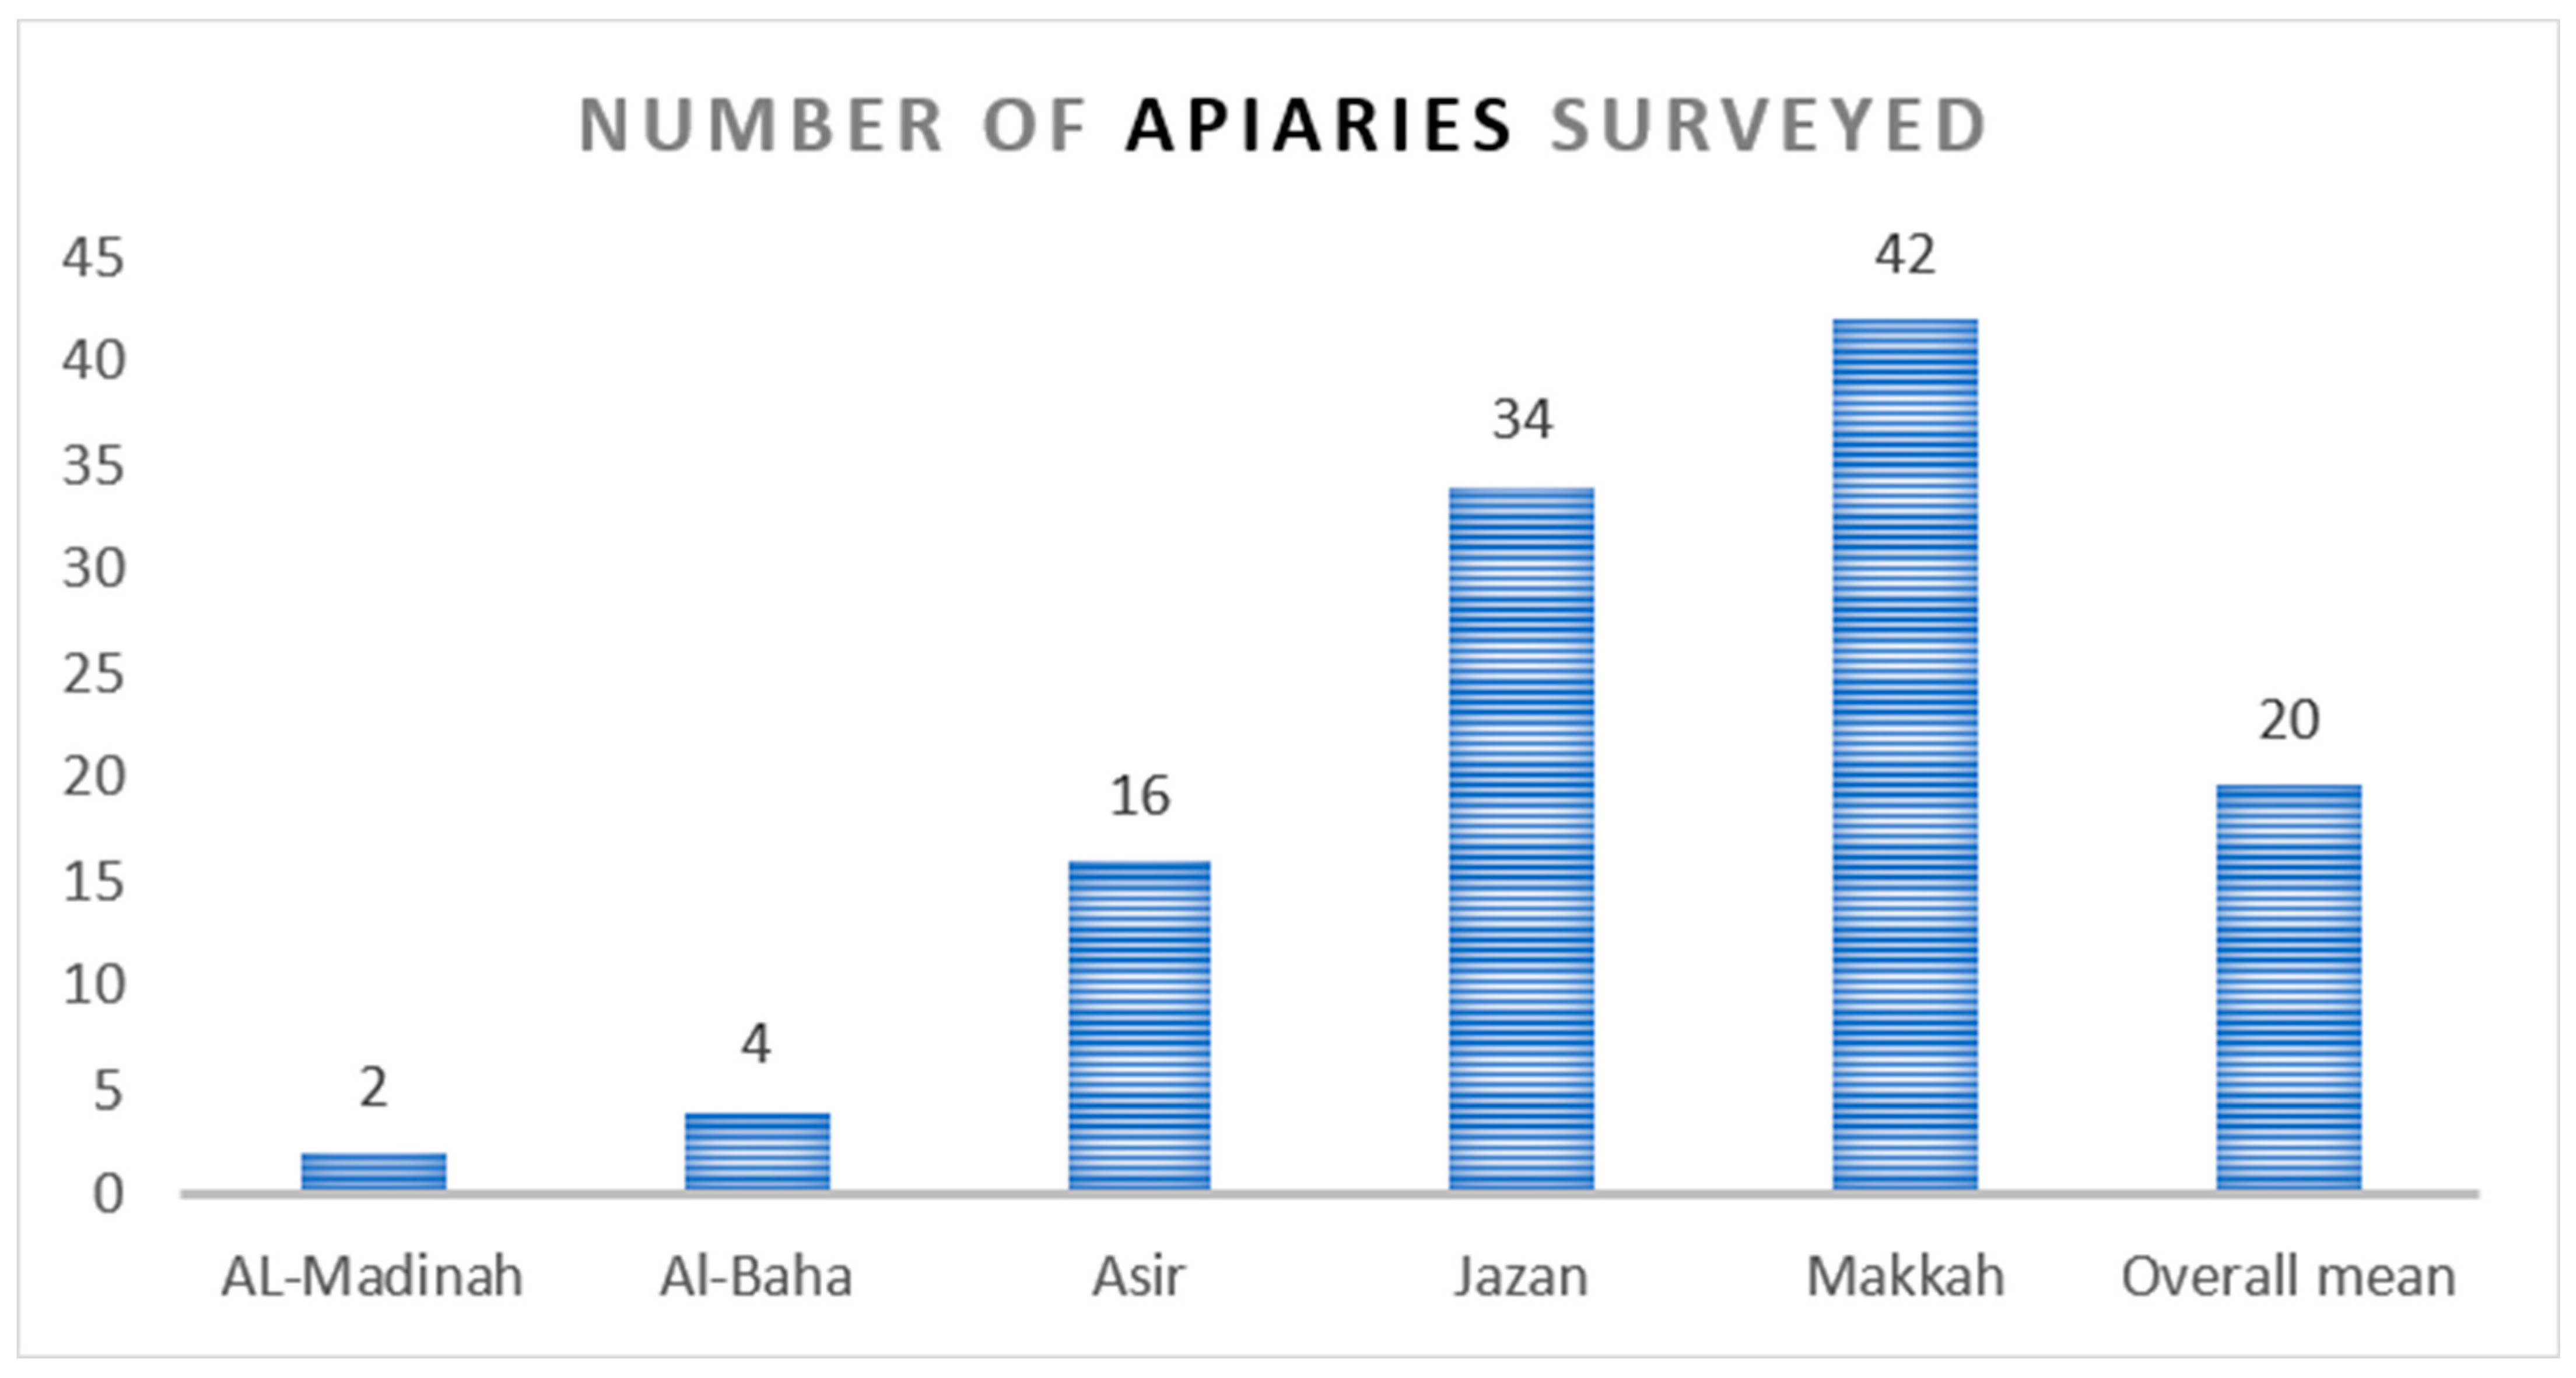
The final dataset comprised 98 apiaries across five major beekeeping regions of Saudi Arabia. As depicted in Figure 2, Makkah accounted for the largest proportion of surveyed apiaries (n = 42; 42.9%), followed by Jazan (n = 34; 34.7%), Asir (n = 16; 16.3%), Al-Baha (n = 4; 4.1%), and Al-Madinah (n = 2; 2.0%). Total colony numbers ranged from 60 to 1250 per apiary (mean 275.4, SD 193.7; median 207.5). The regional distribution was therefore markedly unbalanced, and results for Al-Baha and Al-Madinah should be interpreted cautiously because of their small sample sizes.
Figure 2.
Distribution of surveyed apiaries across five regions of Saudi Arabia, reflecting purposive sampling of beekeepers participating in the Sustainable Rural Agricultural Development (SRAD) Programme.
Considerable variation was observed in apiary size and the relative use of traditional and modern frame hives. Across the surveyed apiaries, the mean apiary size was approximately 275 colonies. Both traditional and modern frame-hive systems were represented, although their relative contribution varied substantially among apiaries and regions. Asir and Jazan generally had greater representation of traditional colonies, whereas modern frame hives were more prominent in Makkah. These findings indicate substantial heterogeneity in hive composition and production systems among the surveyed apiaries.
Given the purposive sampling design and unequal regional representation, these patterns should be interpreted as descriptive characteristics of the surveyed apiaries rather than estimates of regional or national beekeeping structure.
3.2. Regional Distribution of Traditional and Modern Colonies
Table 1 illustrates substantial regional variation in apiary size and hive-system composition among the 98 surveyed apiaries. The highest mean number of colonies per apiary was recorded in Asir (327.9), followed by Jazan (301.5) and Makkah (256.8), while Al-Baha recorded the lowest (110). Traditional hives were more prominent in Asir and Jazan, whereas modern hives predominated in Makkah and Al-Madinah. Overall, apiaries maintained an average of 275.4 colonies (median 207.5), with considerable variation in flock size (60–1250 colonies). The mean apiary-level proportions of traditional and modern hives were 50.5% and 49.5%, respectively, indicating a relatively balanced representation of the two hive systems across the surveyed apiaries.
Table 1.
Region-wise descriptive statistics of traditional and modern hive numbers and their proportional composition in surveyed apiaries.
3.2.1. Regional Variation in Apiary Size and Hive Composition
Apiary size and hive-system composition varied considerably across the five surveyed regions. Asir recorded the highest mean total colony number (327.9), followed by Jazan (301.5) and Makkah (256.8). Traditional hives were more prominent in Jazan (71.3%) and Asir (62.6%), whereas modern frame hives predominated in Al-Madinah (95.5%), Makkah (67.4%), and Al-Baha (63.9%). Across all surveyed apiaries, the mean proportions of traditional and modern hives were 50.5% and 49.5%, respectively.
3.2.2. Regional Differences in the Proportions of Traditional and Modern Hives
Significant regional differences were observed in the proportions of traditional and modern frame-hive colonies (Kruskal–Wallis H = 22.11, p < 0.001). Traditional colonies predominated in Jazan (71.3%) and Asir (62.6%), whereas modern colonies accounted for higher proportions in Al-Madinah (95.5%), Makkah (67.4%), and Al-Baha (63.9%). Across the 98 surveyed apiaries, the mean proportions of traditional and modern colonies were 50.5% and 49.5%, respectively. Regional estimates for Al-Madinah and Al-Baha should be interpreted cautiously because of their small sample sizes. It should be noted that these percentages are averages of individual apiary proportions, not proportions calculated from pooled colony totals. The Kruskal–Wallis test establishes an overall regional difference; it does not establish which individual pairs of regions differ significantly.
3.3. Honey Production and Productivity
As illustrated in Table 2, annual honey production averaged 564.7 kg per apiary (SD 489.9; median 372.5; interquartile range 270.0–701.5 kg). Annual yield per colony averaged 2.43 kg (SD 2.44; median 1.80). Among apiaries with system-specific observations, traditional hives averaged 1.38 kg/colony (n = 78) and modern hives averaged 3.73 kg/colony (n = 73). In the 54 apiaries with paired observations, median annual yield was 1.10 kg/colony for traditional hives and 2.67 kg/colony for modern hives (paired Wilcoxon V = 1485, p = 1.67 × 10⁻¹⁰; estimated paired shift 1.825 kg/colony, 95% CI 1.375–2.615). Annual yield per colony differed across regions (Kruskal–Wallis H = 19.07, df = 4, p = 0.00076).
Table 2.
Annual honey production, colony-level productivity and production by harvest.
3.3.1. Annual Honey Production
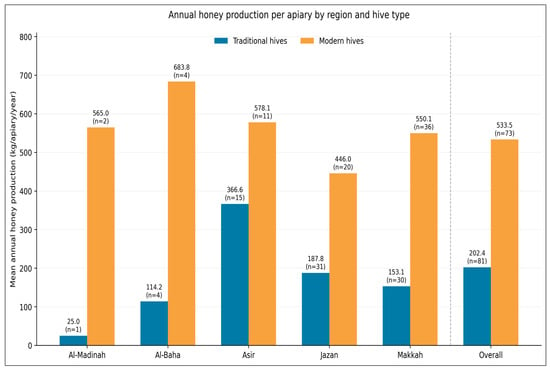
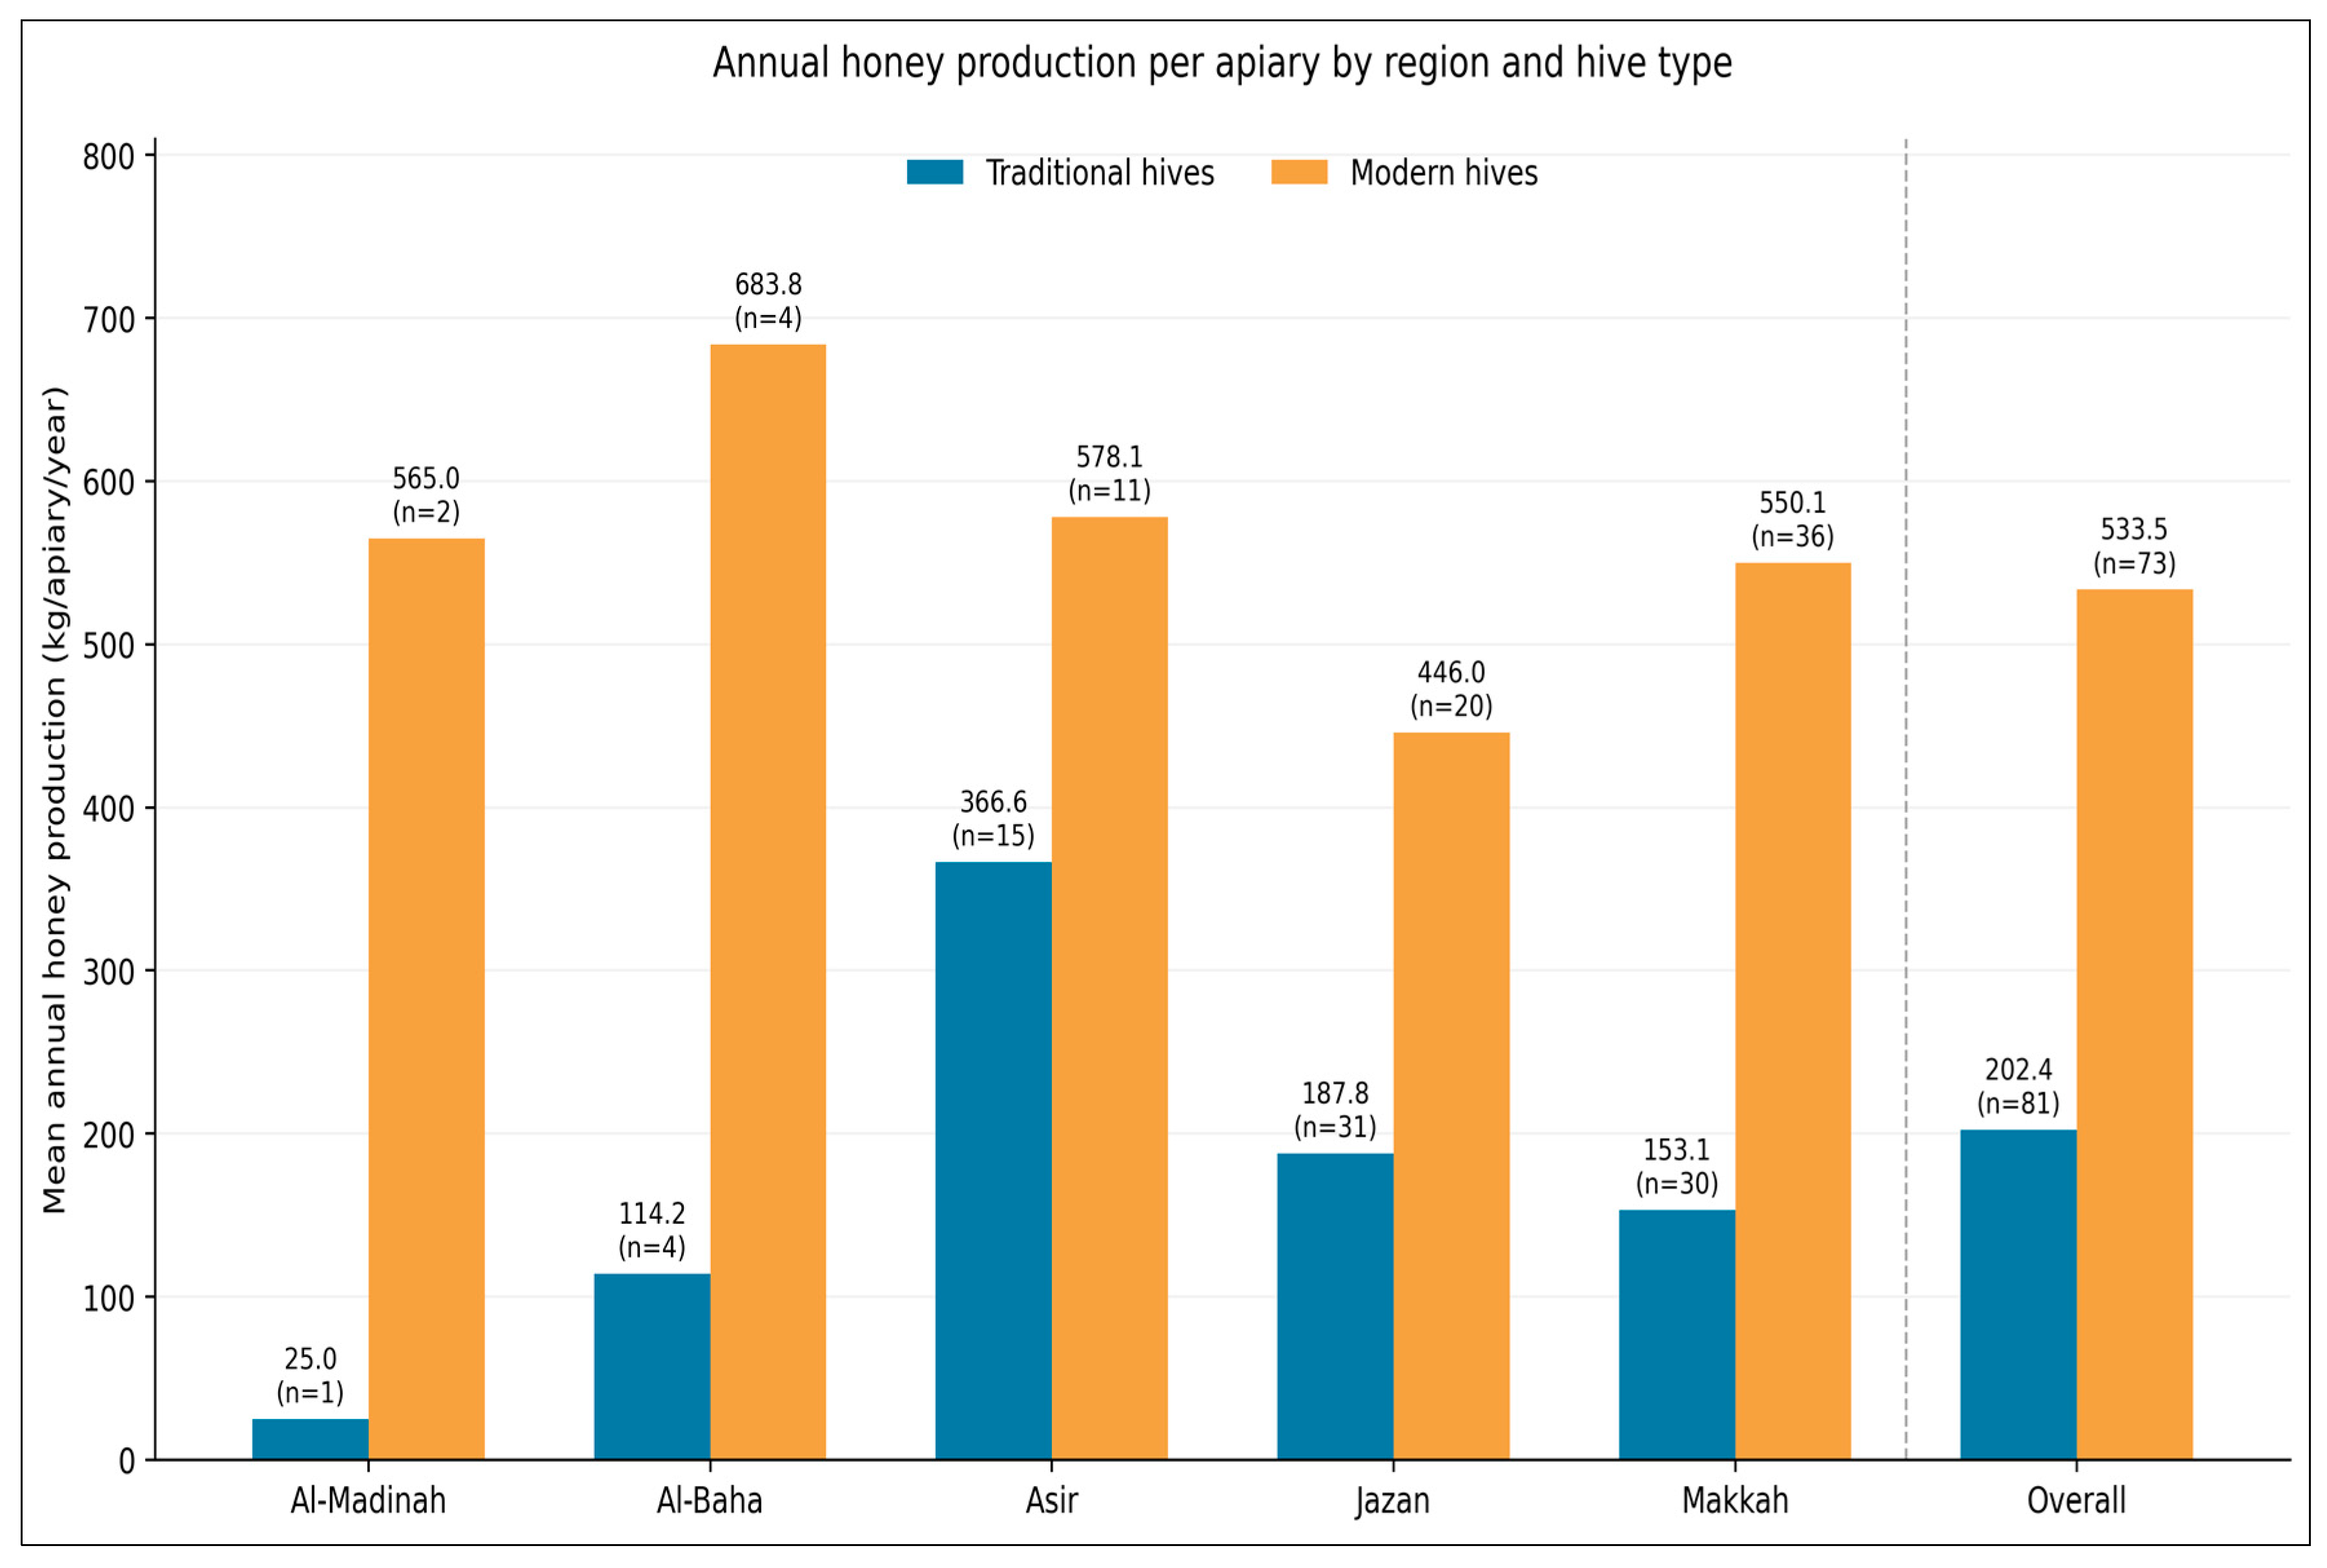
Mean annual honey production per apiary was higher in modern than traditional hive systems across all five surveyed regions (Figure 3). Overall, modern hives produced an average of 533.5 kg/apiary/year (n = 73), compared with 202.4 kg/apiary/year (n = 81) from traditional hives. Modern hive production ranged from 446.0 kg/apiary in Jazan to 683.8 kg/apiary in Al-Baha, whereas traditional hive production ranged from 25.0 kg/apiary in Al-Madinah to 366.6 kg/apiary in Asir. Modern colonies consistently produced substantially higher annual honey yields than traditional colonies. The paired t-test demonstrated that annual honey production from modern colonies was significantly greater than that from traditional colonies (t= −5.77, p < 0.001). However, the regional differences were not statistically significant for traditional (Kruskal–Wallis H = 8.35, df = 4, p = 0.080) or modern hive systems (H = 4.73, df = 4, p = 0.316).
Figure 3.
Regional and overall mean annual honey production (kg/apiary/year) from traditional and modern hive systems across five surveyed regions of Saudi Arabia. Data labels indicate mean production and the number of apiaries contributing to each estimate. Overall means were calculated across all apiaries reporting the respective hive type, rather than as unweighted averages of regional means.
Among apiaries maintaining both hive systems (n = 54), annual honey production differed significantly between traditional and modern hives (paired Wilcoxon signed-rank test: V = 1350, p = 1.99 × 10⁻⁷). Modern hives recorded higher median annual production (537.39 kg/apiary/year) than traditional hives (169.89 kg/apiary/year), with an estimated paired production shift of 369.5 kg (95% CI: 201.2–384.5).
3.3.2. Repeated-Harvest Analysis
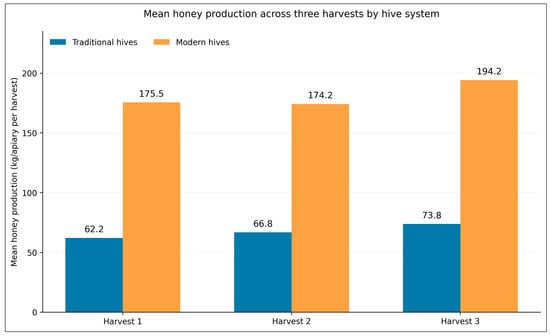
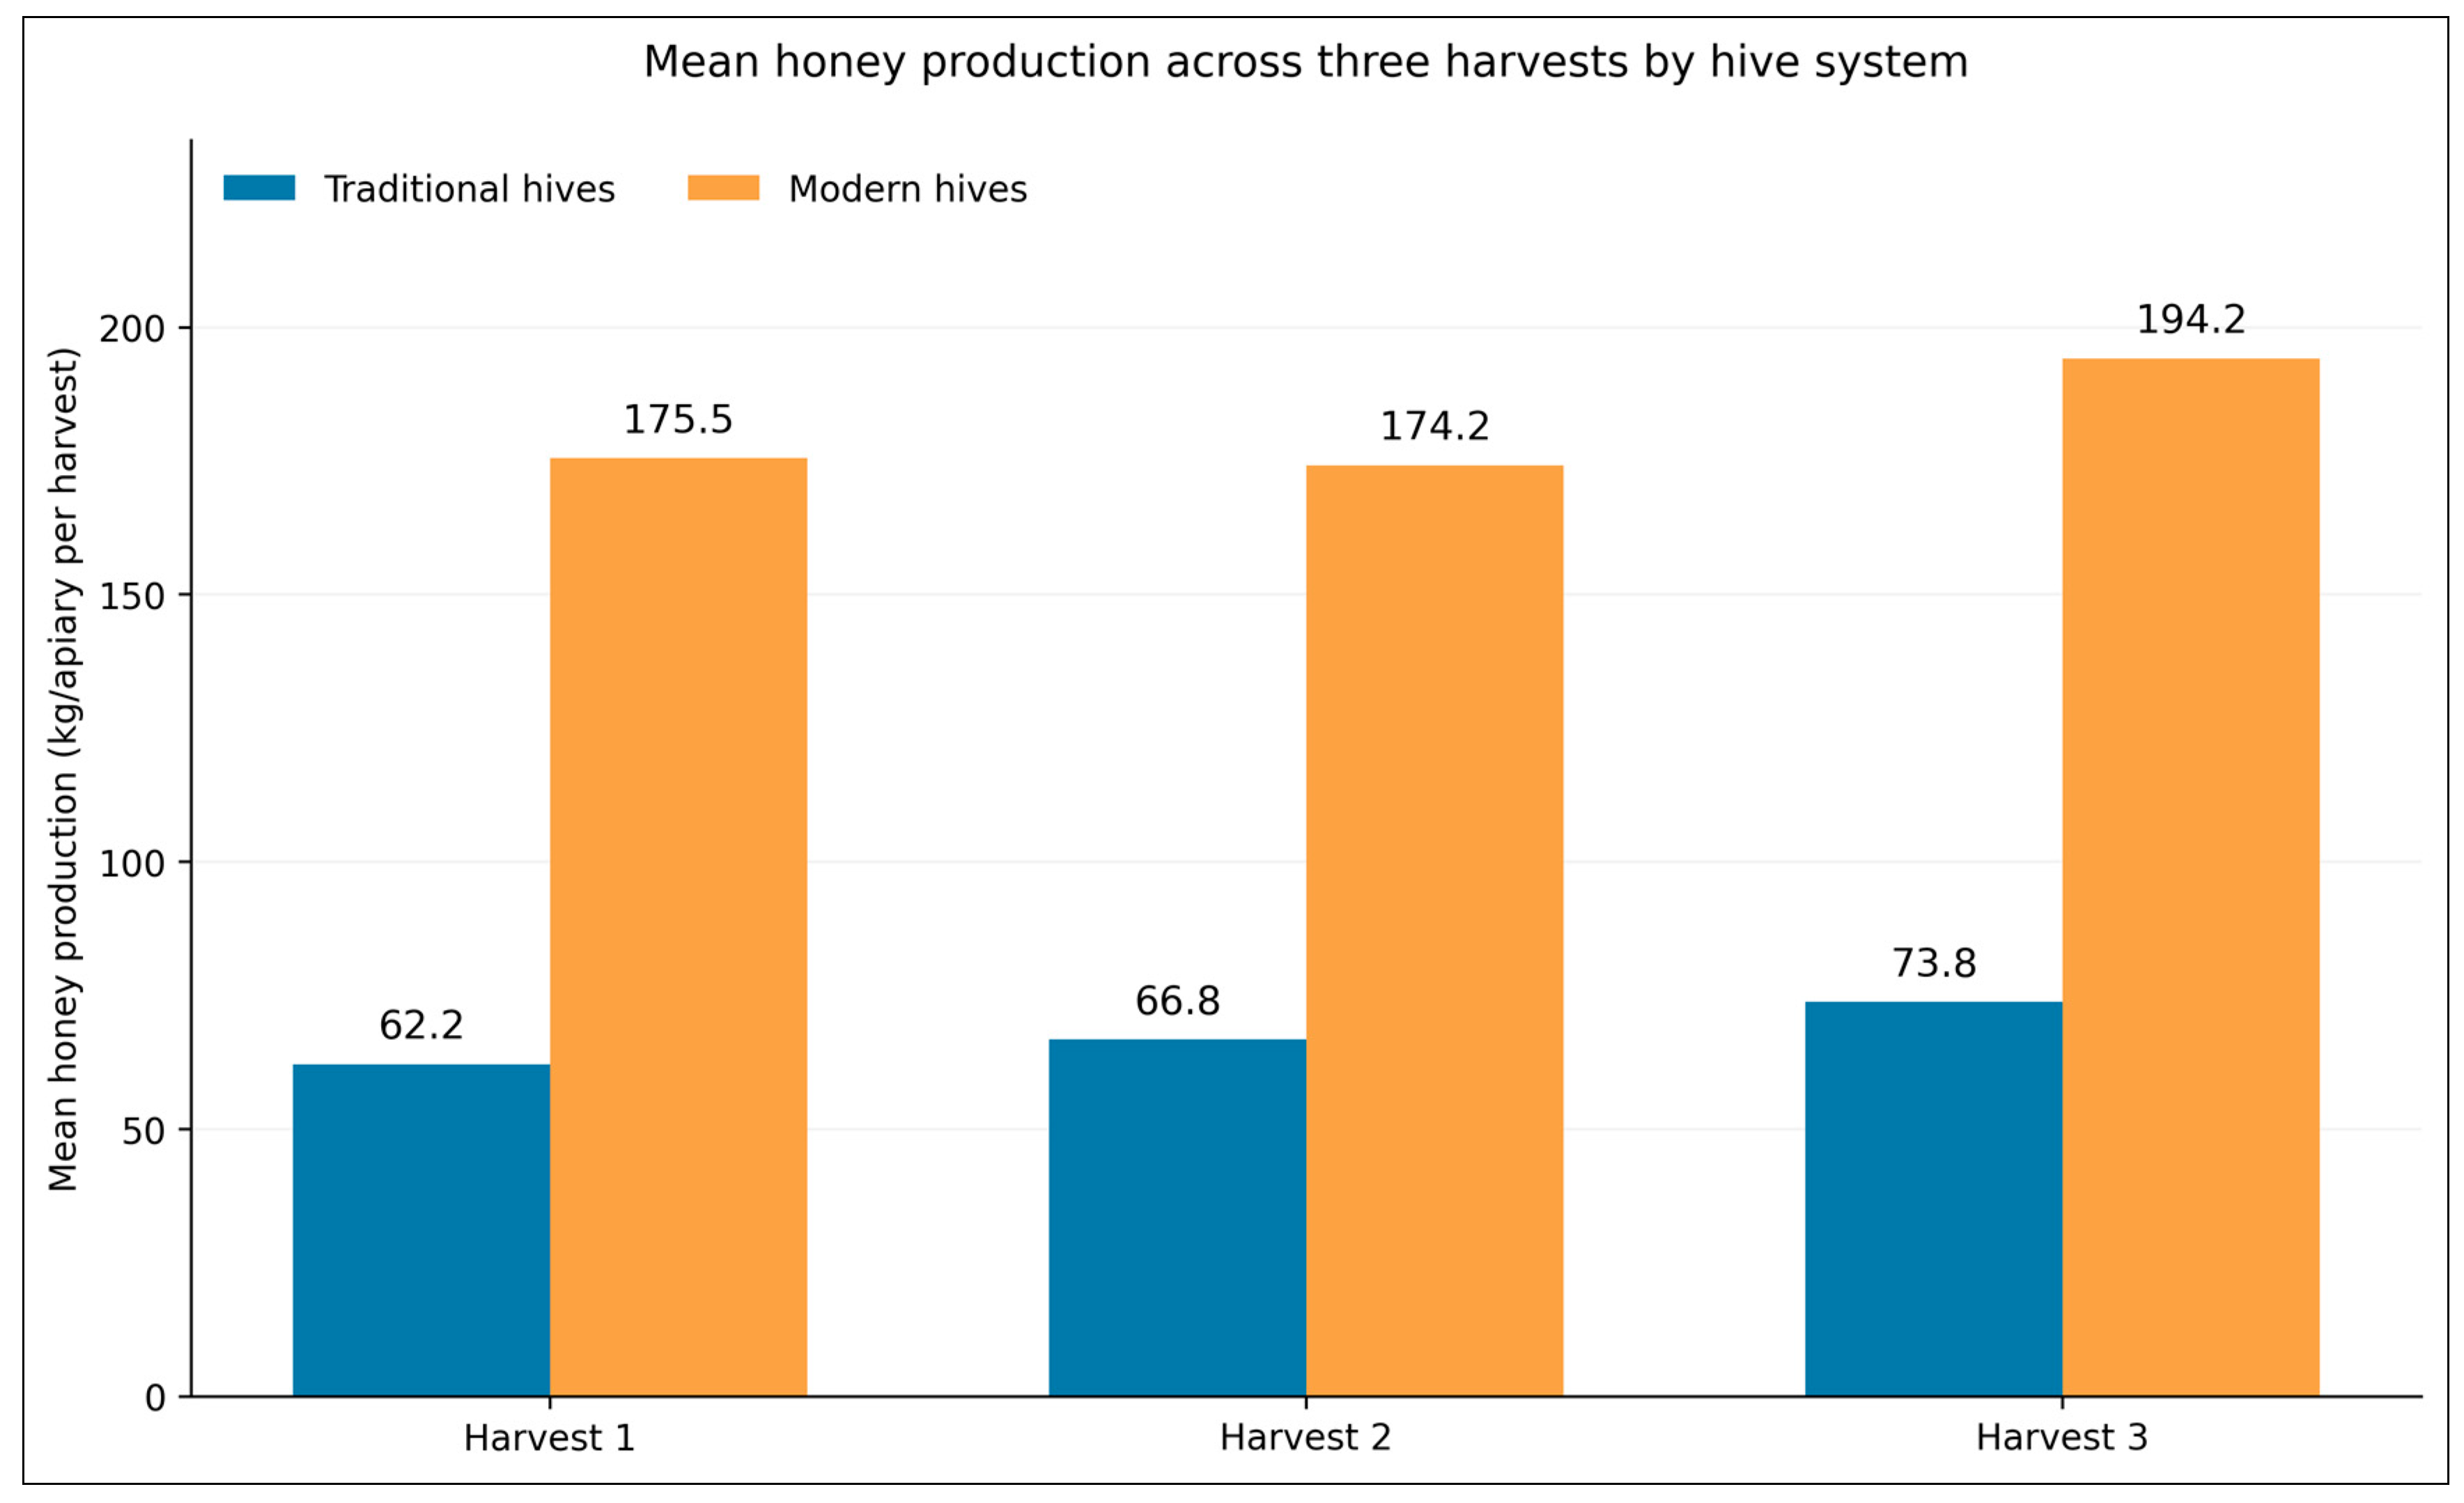
Modern hives consistently recorded higher mean honey production than traditional hives across all three harvests, ranging from 174.2–194.2 kg/apiary compared with 62.2–73.8 kg/apiary for traditional hives (Figure 4). Honey production was highest during the third harvest for both systems, with modern hives producing approximately 2.6 times more honey than traditional hives. A harvest-level model fitted to log-transformed yield, with hive type, harvest, region and hive-type × harvest terms, used apiary-clustered standard errors. Relative to modern hives in the first harvest, the traditional-hive coefficient was −0.4269 (cluster-robust SE 0.0395, t = −10.81, p < 0.001). Joint tests did not detect an overall harvest effect (F[2,450] = 0.487, p = 0.615) or a statistically significant hive-type × harvest interaction (F[2,450] = 2.497, p = 0.0835). The individual traditional-hive × second-harvest term was positive (β = 0.0754, SE = 0.0353, p = 0.0333), but the joint interaction test was not significant.
Figure 4.
Mean honey production (kg/apiary) across three harvests for traditional and modern hive systems in surveyed Saudi Arabian apiaries. Numerical labels indicate mean production per harvest. Sample sizes were 81 traditional-hive apiaries for each harvest and 71–73 modern-hive apiaries, depending on harvest.
3.3.3. Annual Honey Yield per Colony by Region and Hive System
Annual honey yield per colony varied across the five surveyed regions and between traditional and modern hive systems (Table 3). Across all 98 apiaries, mean annual yield was 2.43 ± 2.44 kg/colony, with a median of 1.80 kg/colony. The highest overall regional mean was recorded in Al-Baha (7.30 kg/colony), followed by Al-Madinah (4.90 kg/colony), Makkah (2.74 kg/colony), Asir (2.10 kg/colony), and Jazan (1.50 kg/colony). The overall regional variation was statistically significant (Kruskal–Wallis H = 19.07, df = 4, p < 0.001).
Table 3.
Regional annual honey yield per colony by hive system.
Modern hives recorded a higher mean annual yield (3.73 ± 3.22 kg/colony; n = 73) than traditional hives (1.38 ± 0.87 kg/colony; n = 78). The highest mean yield for both hive systems occurred in Al-Baha, reaching 10.23 kg/colony in modern hives and 2.98 kg/colony in traditional hives. Jazan recorded the lowest mean traditional-hive yield (1.08 kg/colony), while Makkah recorded the lowest mean modern-hive yield (3.21 kg/colony). Regional differences were statistically significant for traditional-hive yield (Kruskal–Wallis H = 12.08, df = 4, p = 0.017), but not for modern-hive yield (H = 5.71, df = 4, p = 0.222).
3.3.4. Factors Associated with Annual Honey Yield per Colony
Multivariable linear regression was used to evaluate associations between annual honey yield per colony and region, apiary size, modern hive proportion, and field-recorded Varroa indicators (Table 4). Heteroskedasticity-consistent type 3 (HC3) robust standard errors were applied to account for potential unequal residual variance and reduce sensitivity of statistical inference to high-leverage observations. The model explained 36.9% of the variation in annual honey yield was statistically significant overall (F(7, 90) = 7.53, p < 0.001).
Table 4.
Multivariable model of annual honey yield per colony.
The proportion of modern hives was the only statistically significant predictor in the model (β = 0.0190, HC3 robust SE = 0.0055, p < 0.001). Each 10-percentage-point increase in the proportion of modern hives was associated with an estimated increase of 0.19 kg in annual honey yield per colony, after adjusting for the other predictors. Apiary size, expressed as log(1 + total colonies), showed a negative but non-significant association with yield (β = −0.8771, p = 0.077). Similarly, the Varroa indicator percentage was not significantly associated with yield (β = −0.0061, p = 0.264). None of the regional coefficients differed significantly from the reference region, Al-Baha (all p > 0.05). These findings indicate that modern hive composition was positively associated with annual honey productivity, whereas independent associations with apiary size, regional location, and the Varroa indicator were not statistically established in the adjusted model.
3.4. Prevalence of Major Honeybee Diseases—Based on Field Recorded/Farmer Recorded Disease Indicators
Varroa Occurrence Among the Surveyed Farms
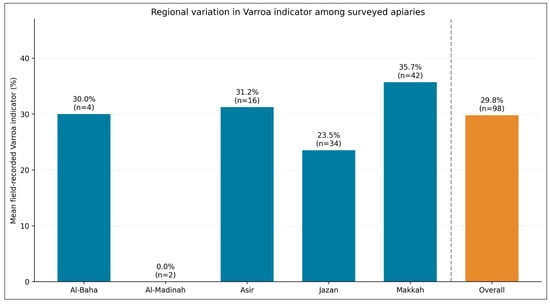
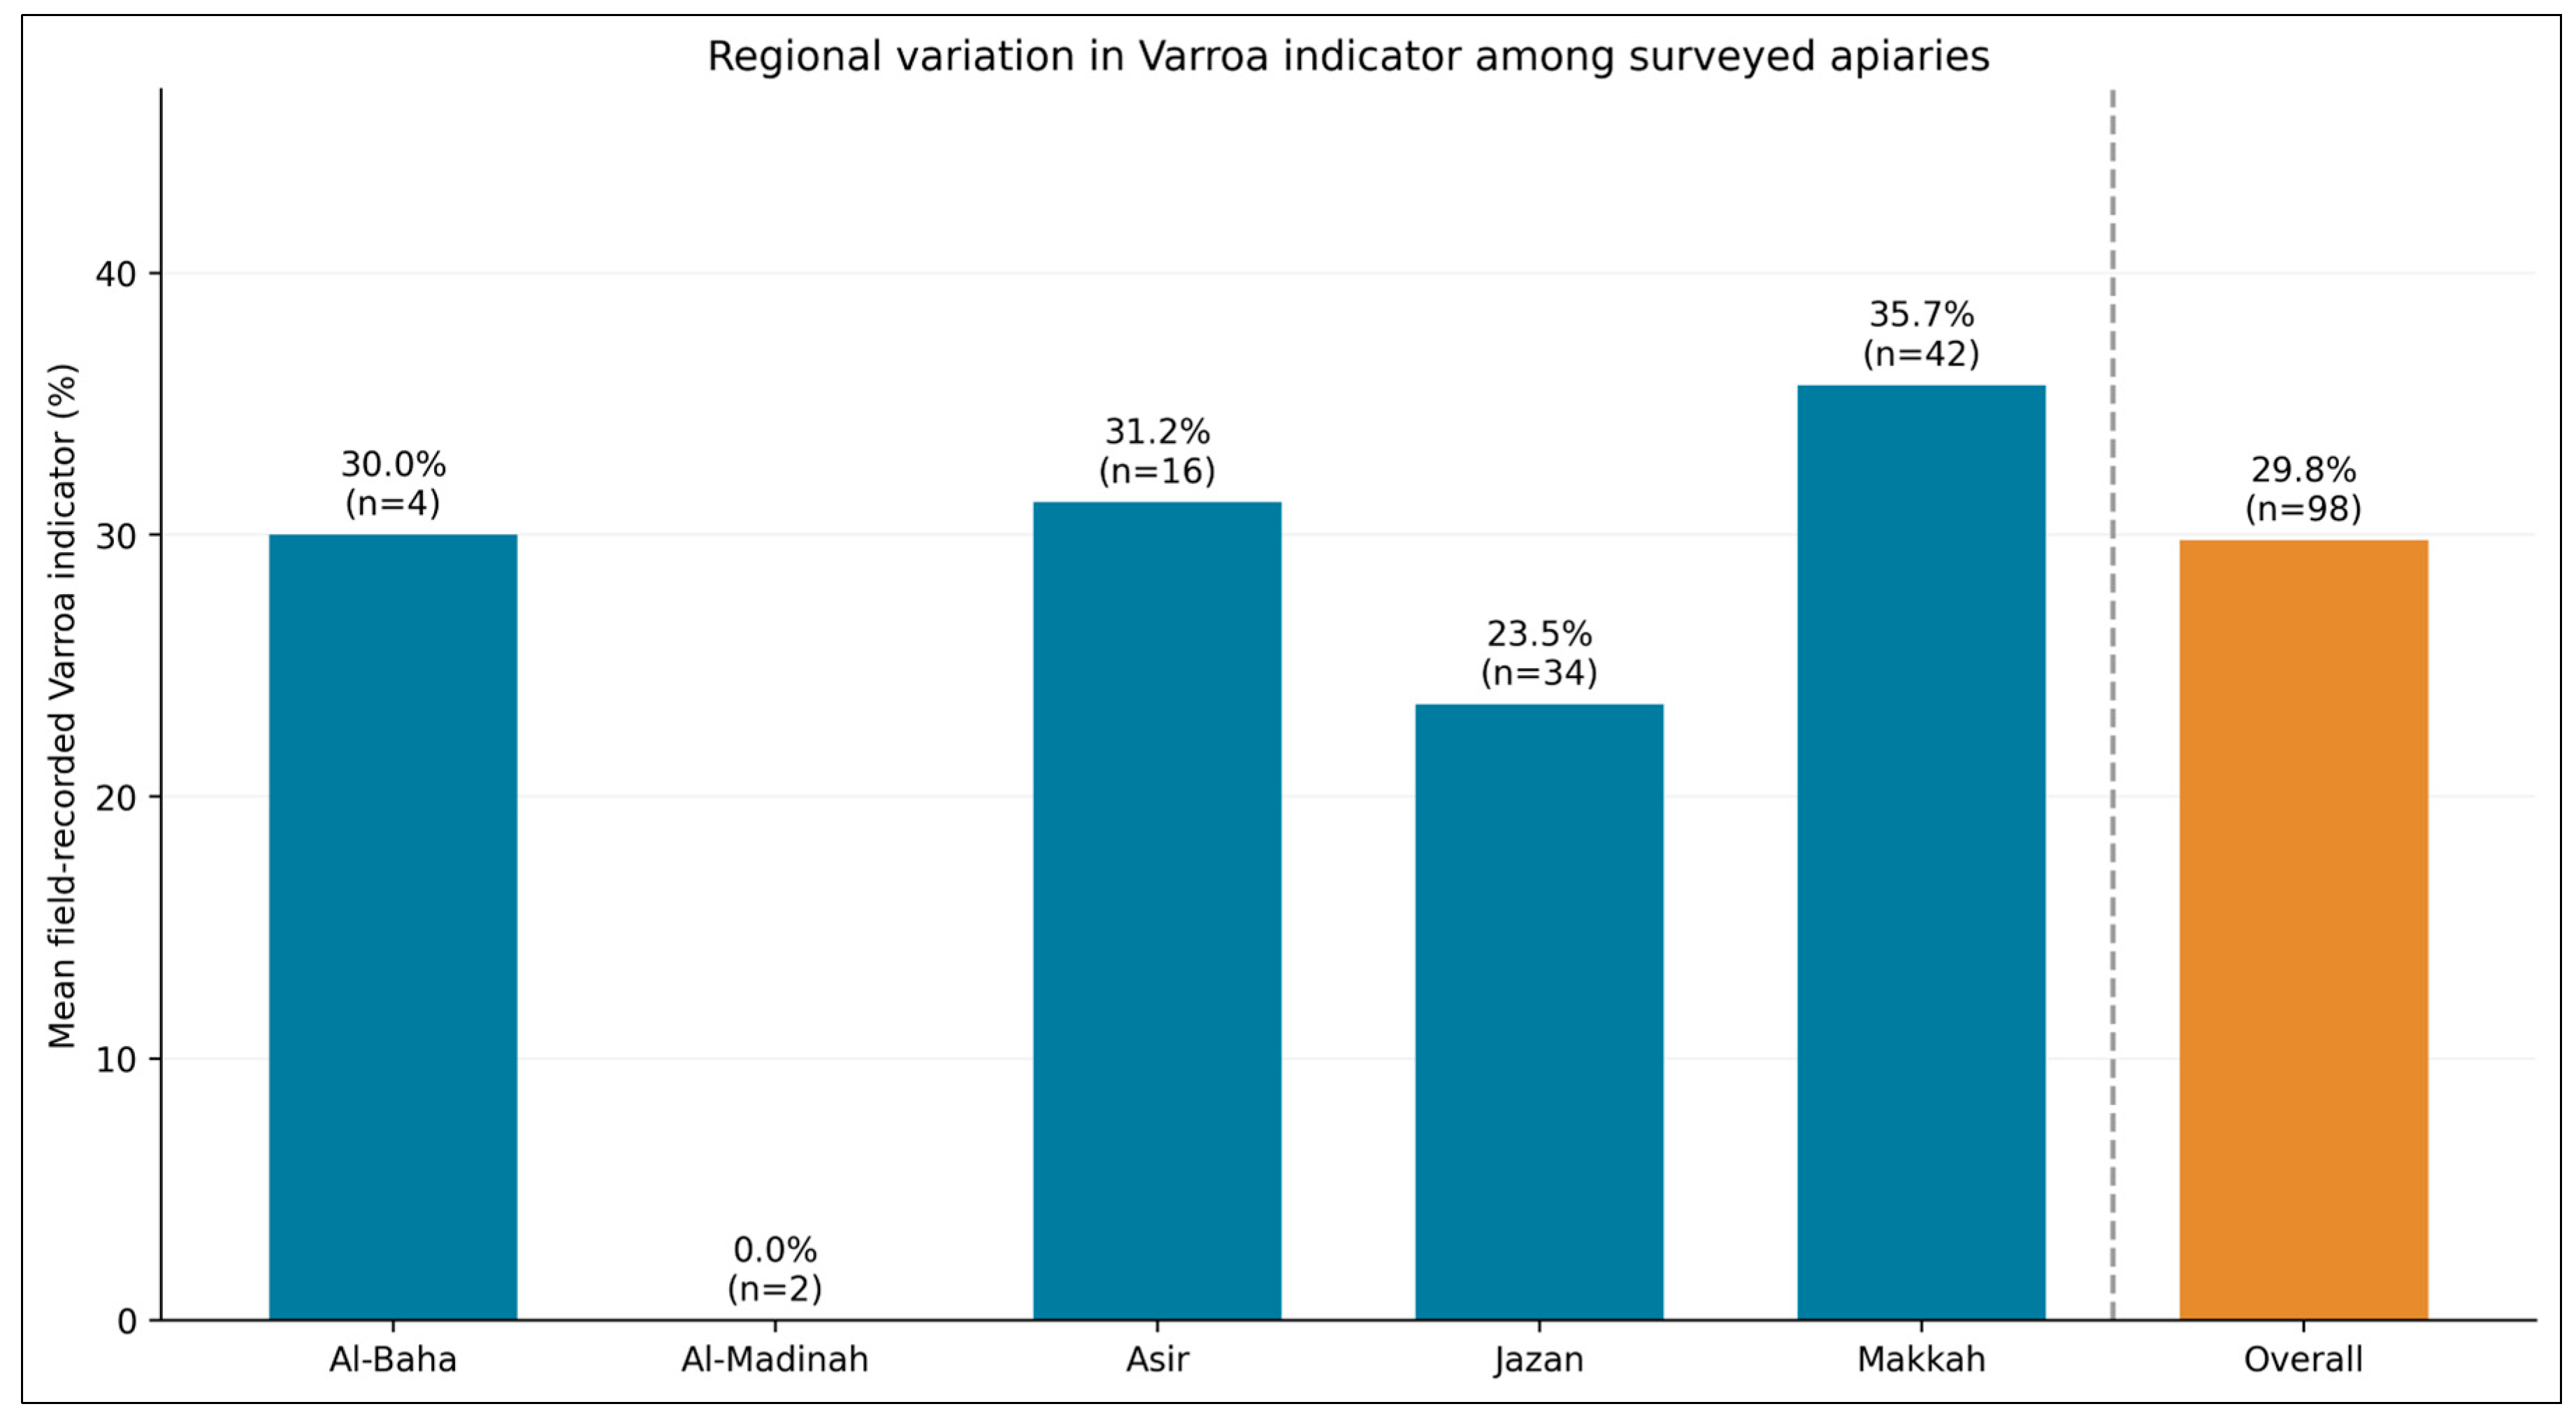
The mean field-recorded Varroa indicator across 98 apiaries was 29.8%, with regional values ranging from 0% in Al-Madinah to 35.7% in Makkah (Figure 5). The highest mean was recorded in Makkah (35.7%), followed by Asir (31.3%), Al-Baha (30.0%), and Jazan (23.5%). No Varroa indicators were recorded in the two surveyed apiaries in Al-Madinah. Regional differences were statistically significant (Kruskal–Wallis H = 12.97, df = 4, p = 0.011), although the small sample sizes in Al-Madinah and Al-Baha warrant caution. The indicator represents field-recorded Varroa observations and should not be interpreted as laboratory-confirmed infestation prevalence without validation of the assessment protocol.
Figure 5.
Regional variation in the mean field-recorded Varroa indicator (%) across five surveyed regions of Saudi Arabia, including the overall mean for 98 apiaries. Data labels indicate mean percentages and regional sample sizes. The overall mean was calculated by weighting regional means according to the number of surveyed apiaries.
3.5. Major Constraints Reported by Beekeepers
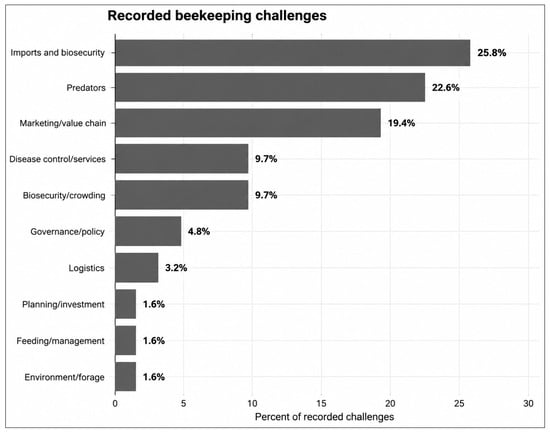
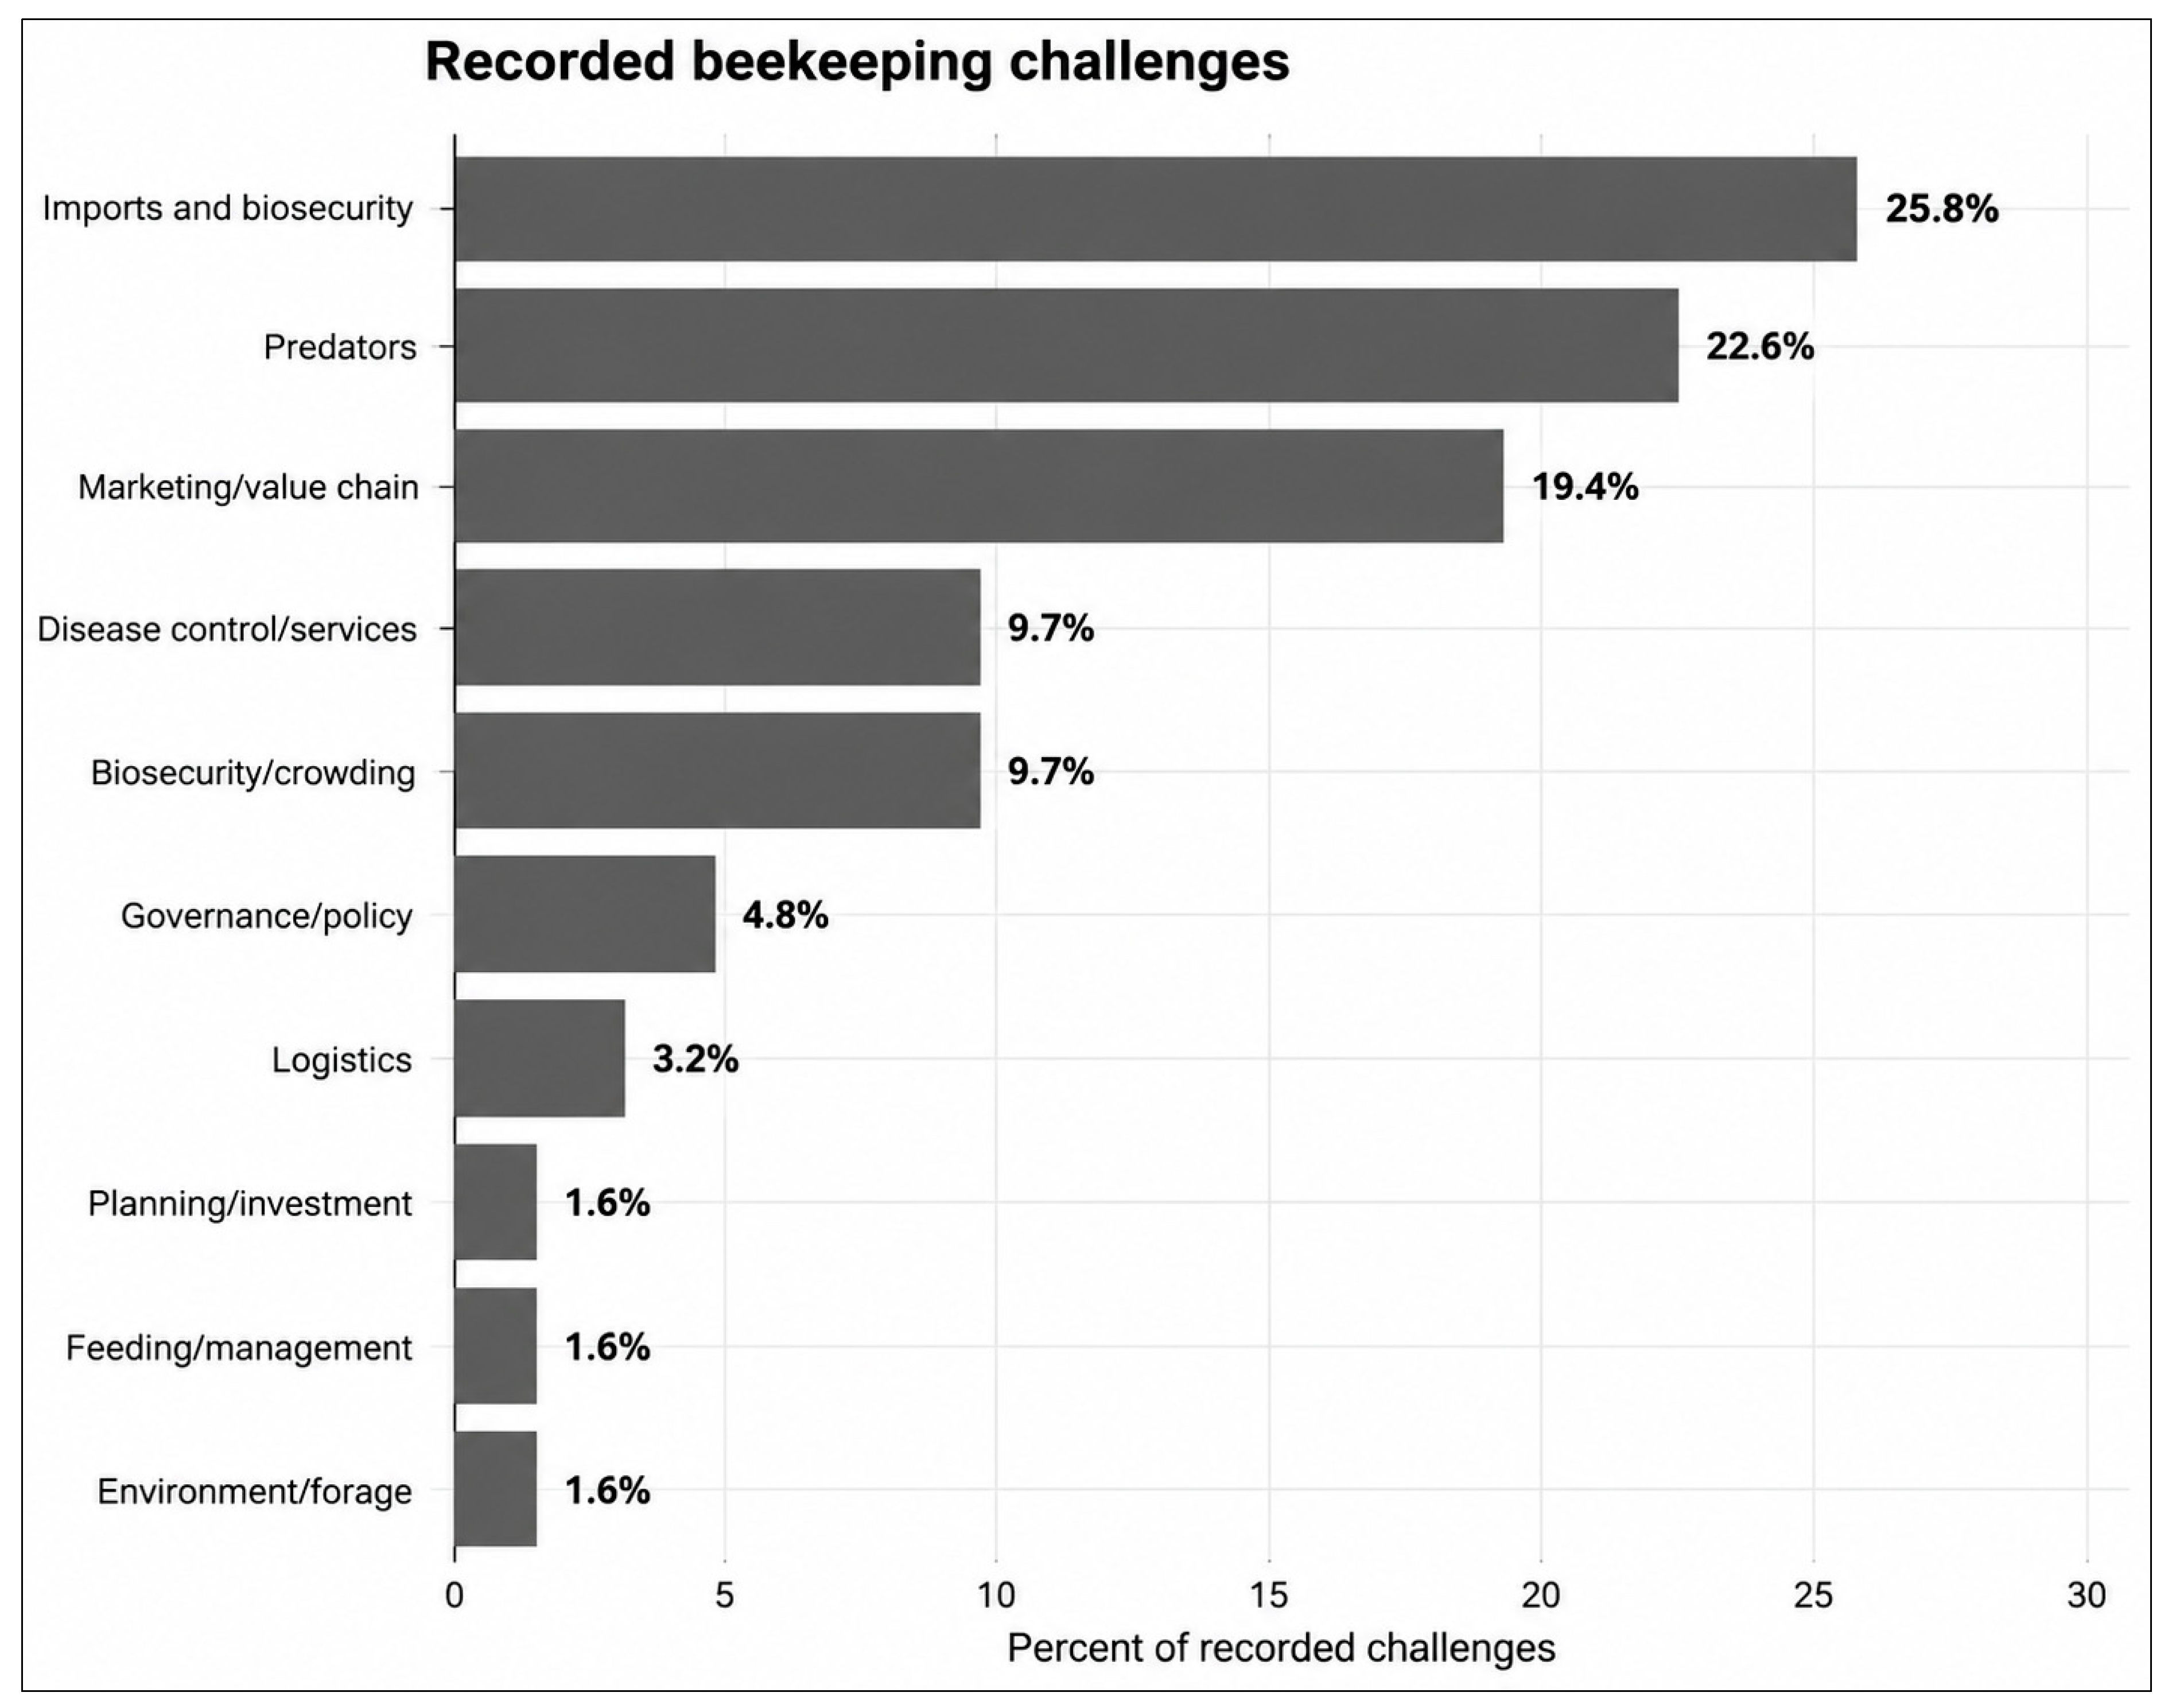
Beekeepers identified a wide range of biological, management, and market-related constraints affecting the apiculture sector. Among the recorded beekeeping challenges, as explained in Figure 6, imports and biosecurity concerns were the most frequently reported (25.8%), followed by predators (22.6%) and marketing and value-chain constraints (19.4%). Disease control and veterinary service limitations and biosecurity issues associated with overcrowding each accounted for 9.7% of recorded challenges. Governance and policy constraints represented 4.8%, while logistical difficulties accounted for 3.2%. Planning and investment, feeding and management, and environmental and forage-related constraints were less frequently reported, each representing approximately 1.6%. Overall, the findings indicate that concerns related to imports, biosecurity, predators, and market access dominated the reported challenges among surveyed beekeepers.
Figure 6.
Distribution of recorded beekeeping challenges among surveyed apiaries (n = 62) in Saudi Arabia. Percentages represent the relative frequency of each challenge category among recorded responses, rather than the proportion of all 98 surveyed apiaries.
3.6. Production System Typologies
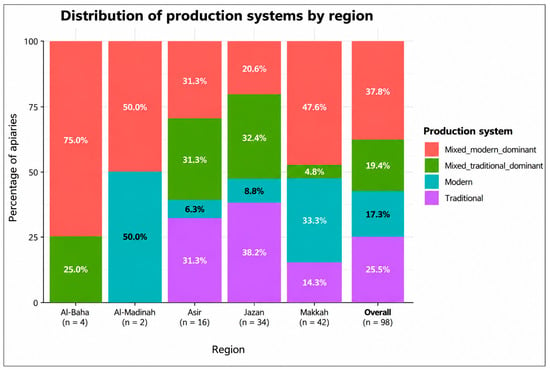
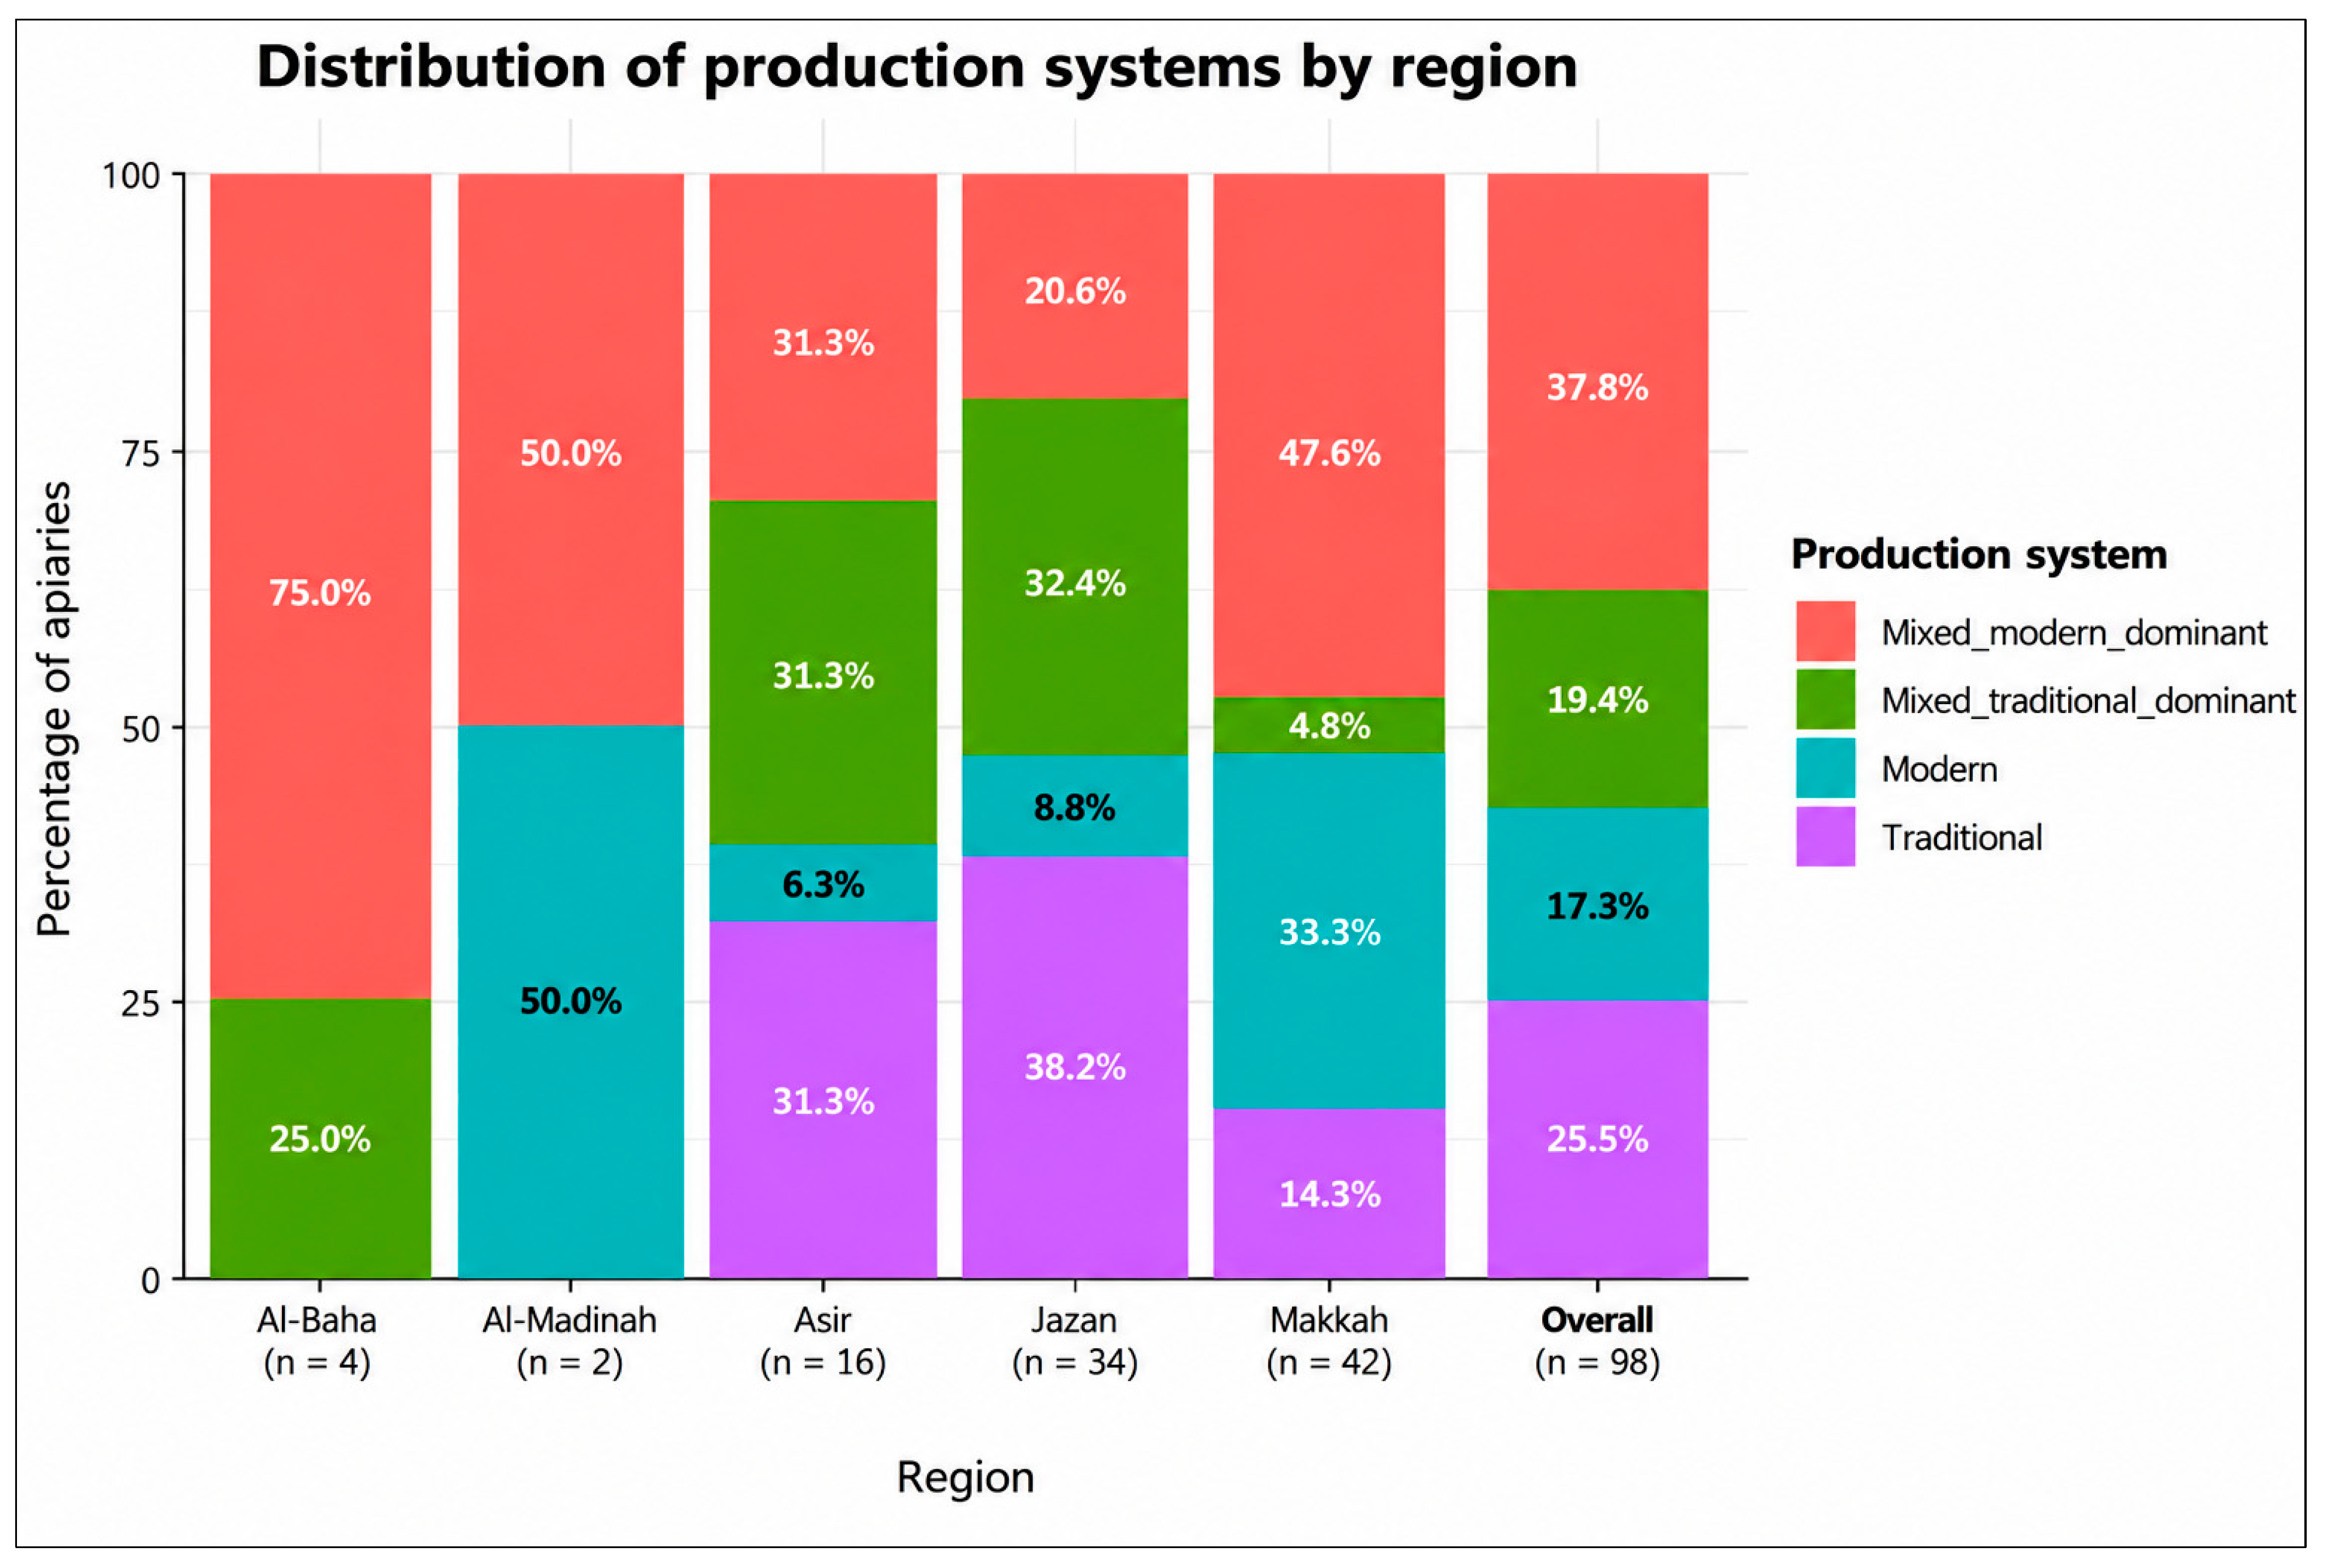
The 98 surveyed apiaries were classified into four production-system categories based on their use of traditional and modern hives. Mixed modern-dominant systems were the most prevalent (37 apiaries; 37.8%), followed by traditional-only systems (25; 25.5%), mixed traditional-dominant systems (19; 19.4%), and modern-only systems (17; 17.3%). Overall, 56 apiaries (57.1%) operated mixed systems, indicating that combining traditional and modern hives was more common than exclusive use of either system.
The distribution varied across regions (Figure 7). Al-Baha was predominantly mixed modern-dominant (75.0%), whereas Al-Madinah was evenly divided between modern-only and mixed modern-dominant systems (50.0% each). Traditional-only systems accounted for the largest share in Jazan (41.2%), followed by Asir (31.3%). In Makkah, mixed modern-dominant systems were the most common (52.4%), followed by modern-only systems (28.6%). These findings demonstrate regional differences in hive-system composition, although interpretation for Al-Baha (n = 4) and Al-Madinah (n = 2) is limited by their small sample sizes.
Figure 7.
Regional distribution of beekeeping production-system typologies across 98 surveyed apiaries in Saudi Arabia. Stacked bars represent the percentage of apiaries classified as traditional-only, modern-only, mixed traditional-dominant, or mixed modern-dominant. The overall bar summarizes all surveyed apiaries. Regional sample sizes are indicated below the bars. The typology describes hive-system composition, not honeybee genetic origin.
3.7. Principal Component Analysis of Beekeeping Production Systems and Apiary Characteristics
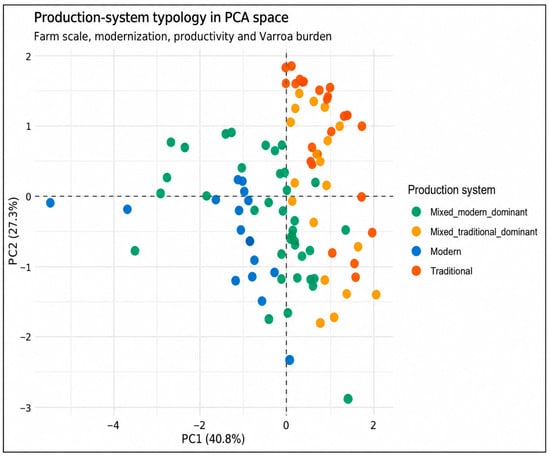
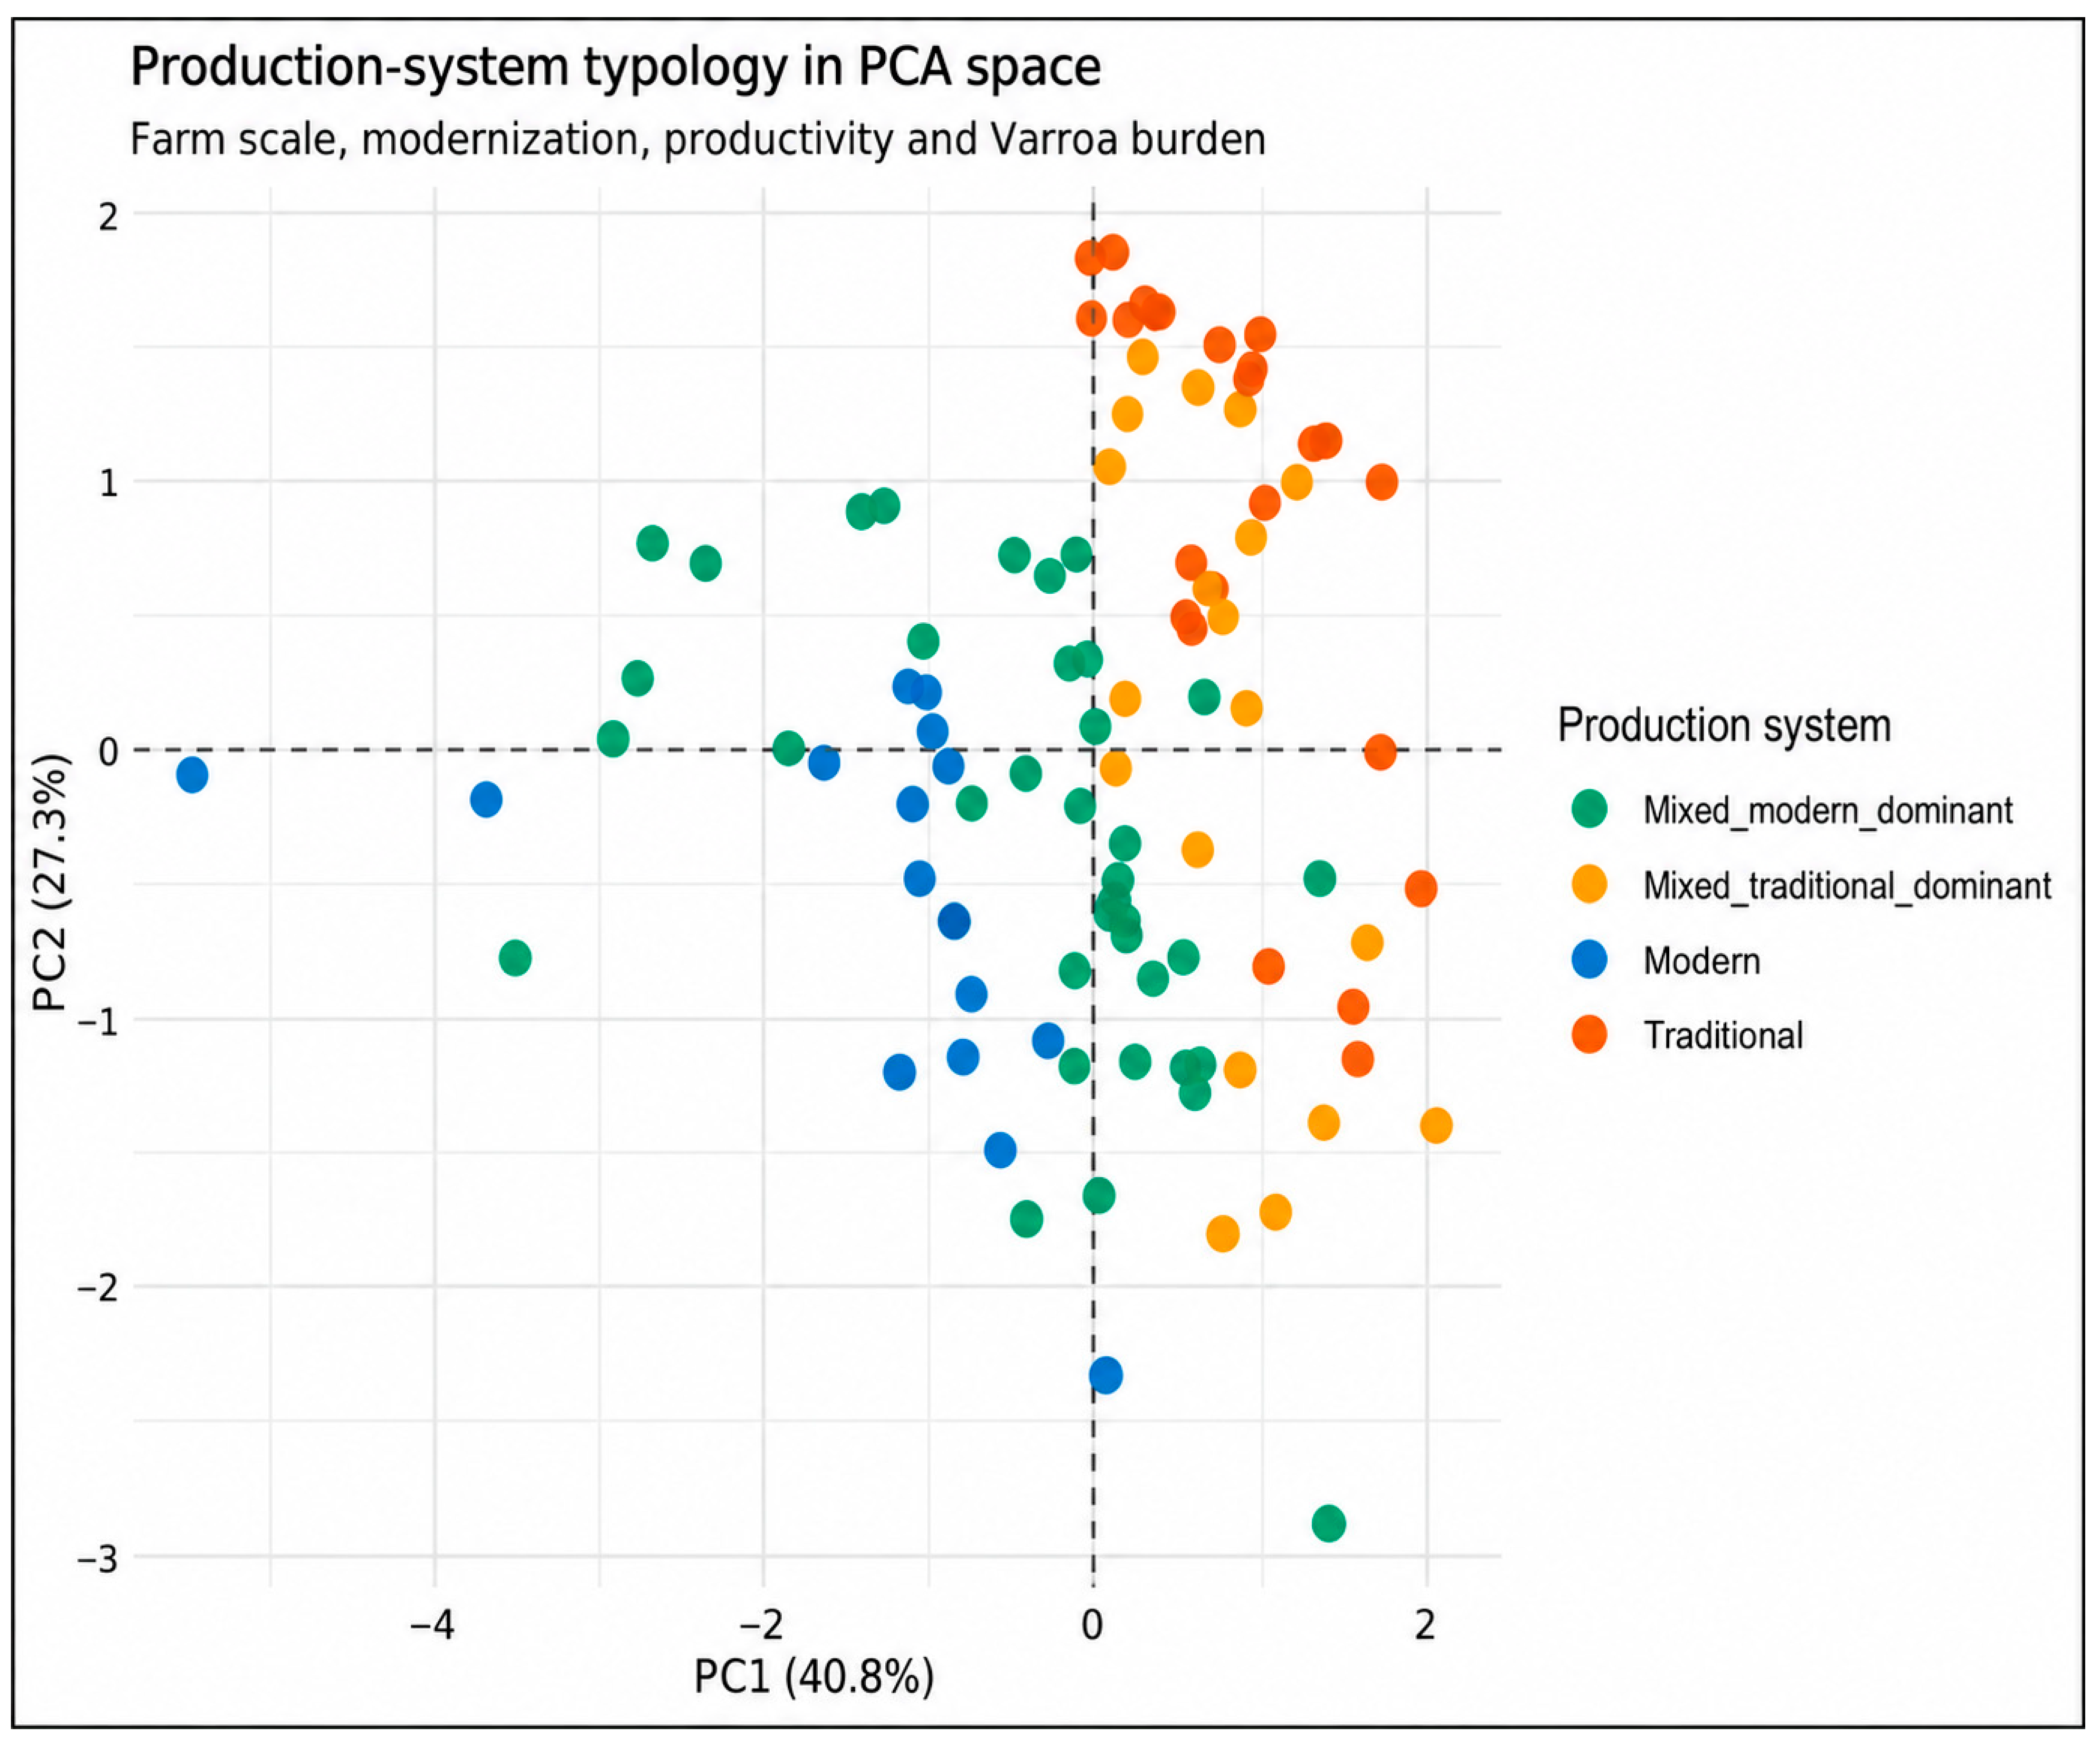
Principal component analysis (PCA) was performed to characterize variation among the 98 surveyed apiaries based on four standardized variables: apiary size (number of colonies), proportion of modern hives, annual honey productivity (kg/colony/year), and field-recorded Varroa indicator (%). The first two principal components explained 68.1% of the total variation, with PC1 accounting for 40.8% and PC2 for 27.3%. The PCA score plot showed differences in the distribution of traditional-only, modern-only, and mixed production systems, although substantial overlap was observed, particularly among apiaries operating mixed hive systems (Figure 8).
Figure 8.
Production-system typology of surveyed apiaries in principal component analysis (PCA) space. Distribution of 98 apiaries according to traditional-only, modern-only, mixed traditional-dominant, and mixed modern-dominant production systems. PCA incorporated four standardized variables: apiary size, proportion of modern hives, annual honey productivity, and field-recorded Varroa indicator. Dashed lines indicate zero scores on each principal component and divide the plot into four descriptive quadrants.
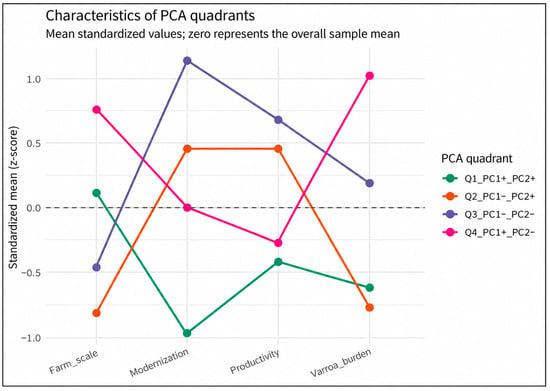
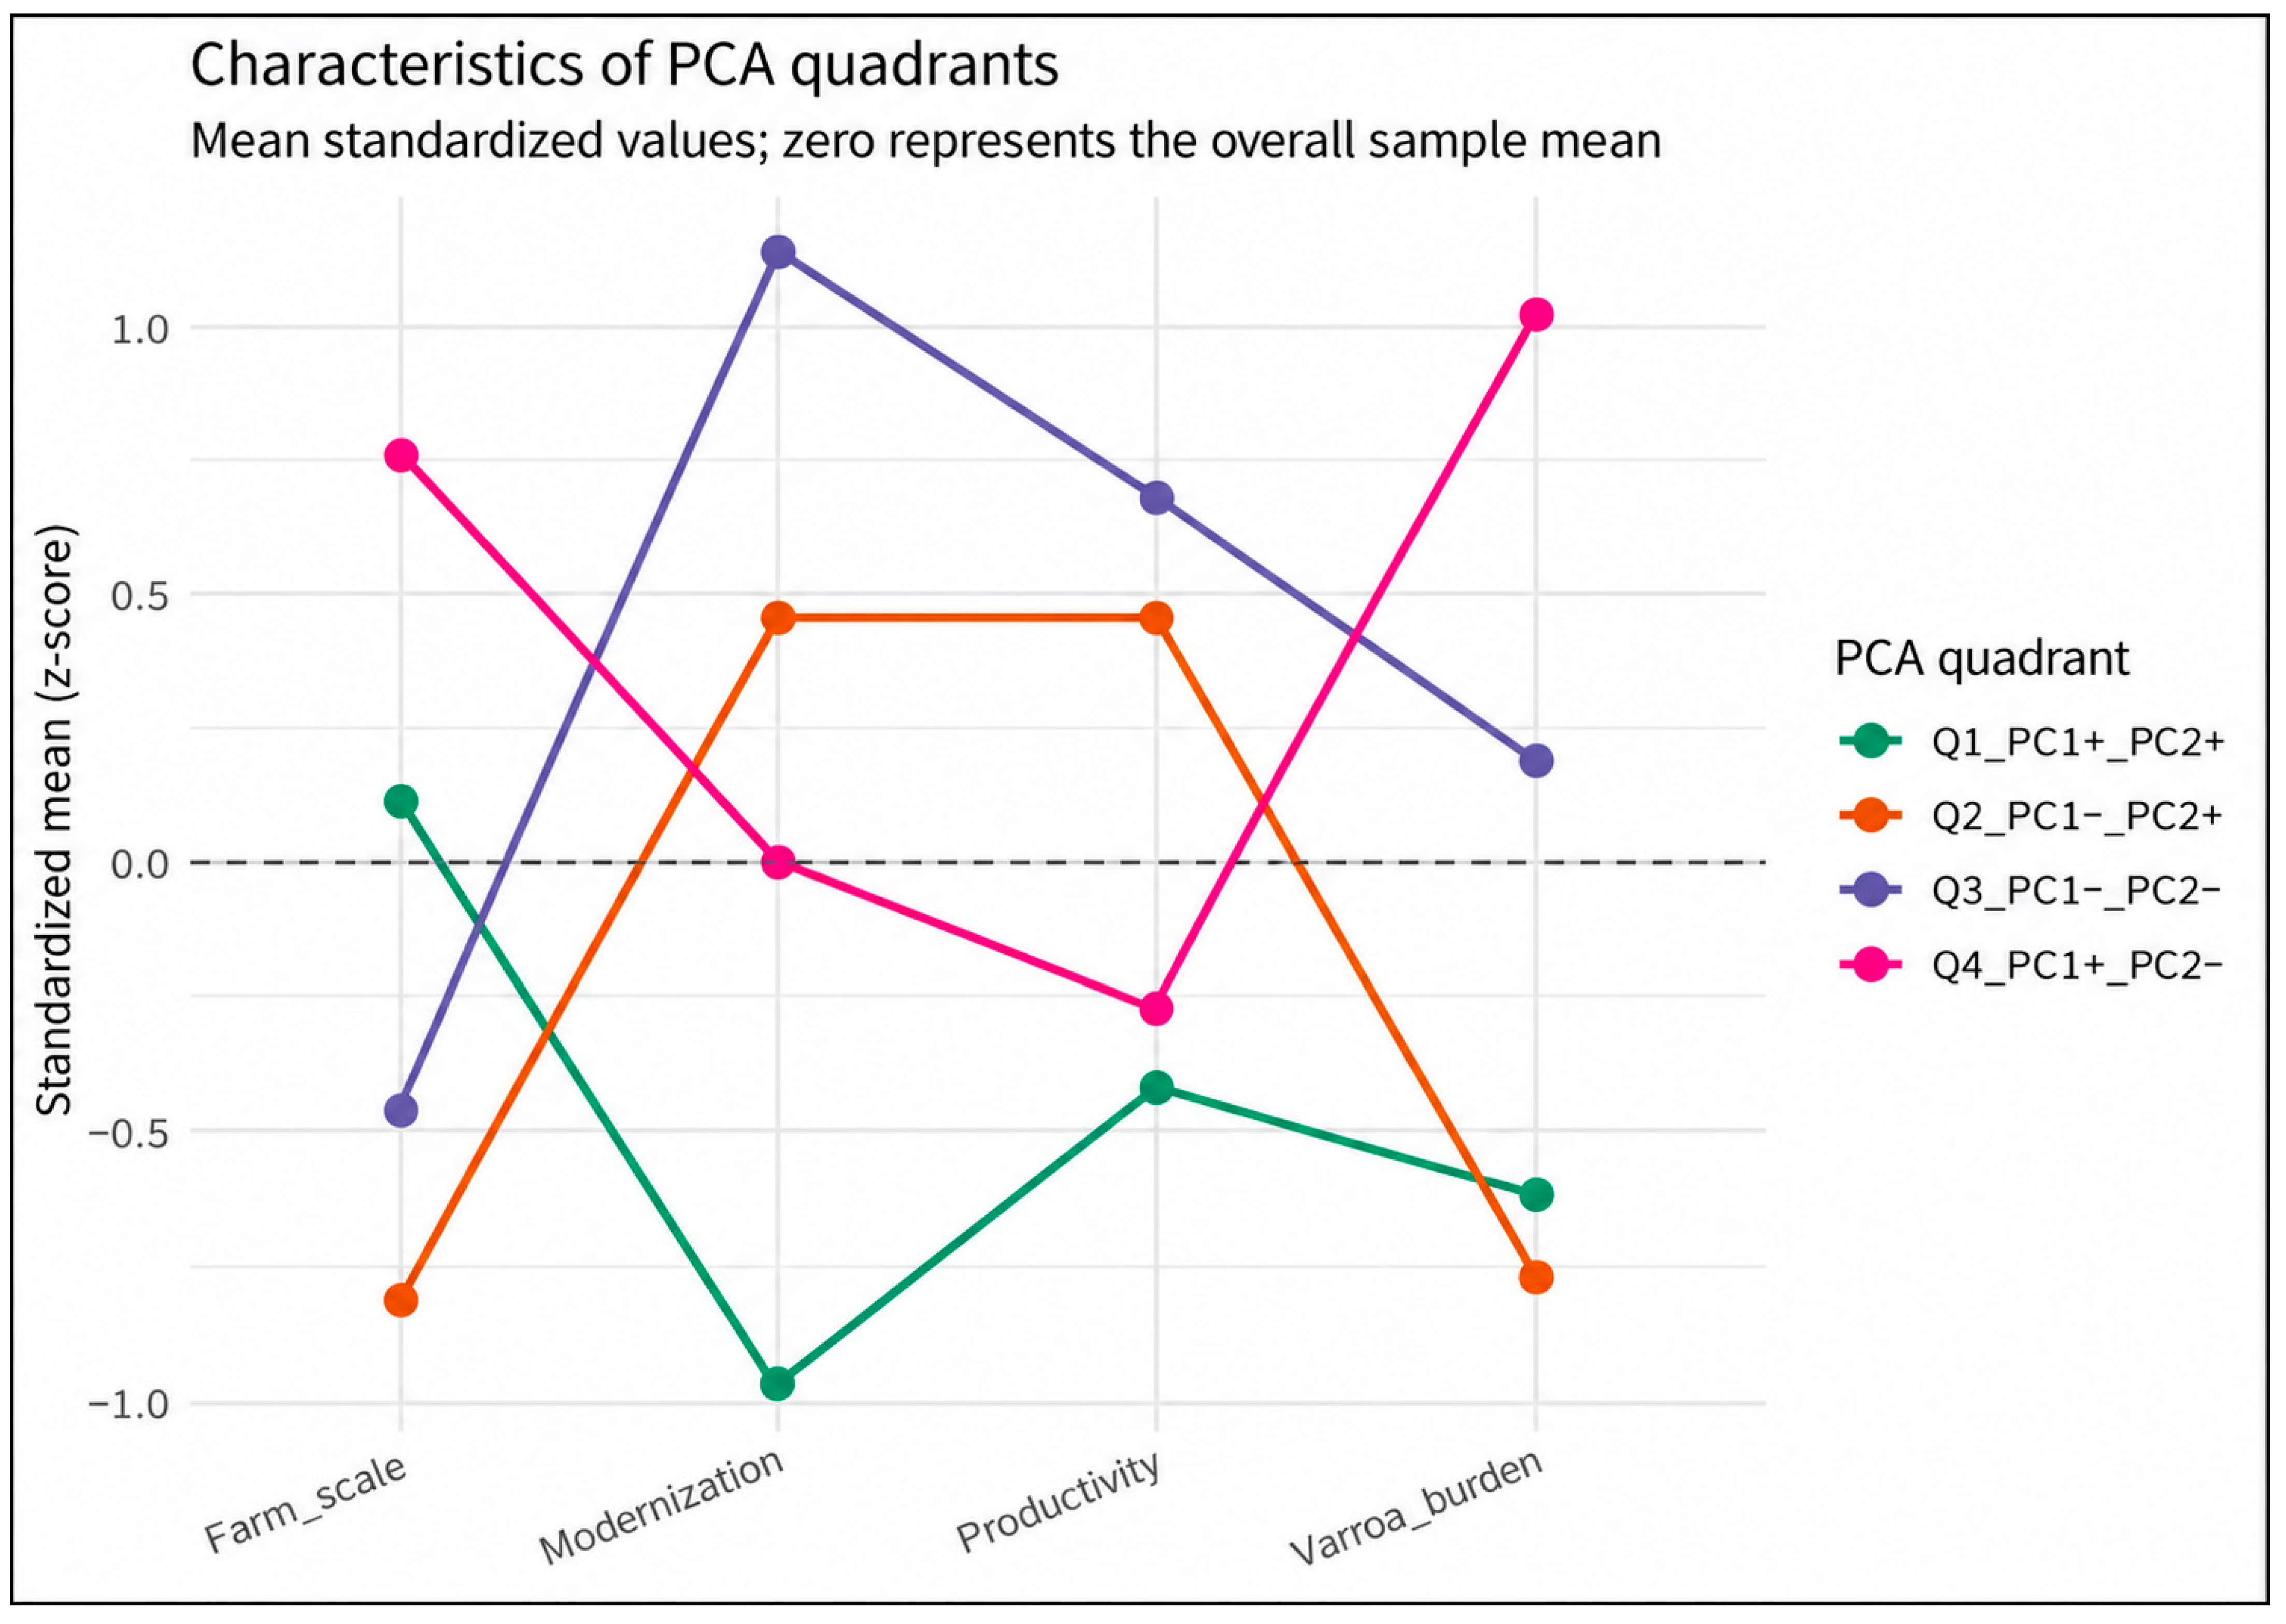
To facilitate interpretation, apiaries were assigned to four descriptive quadrants based on the positive or negative values of their PC1 and PC2 scores. The quadrant profiles revealed differences in farm scale, hive modernization, honey productivity, and Varroa indicators (Figure 9; Table 5).
Figure 9.
Comparative characteristics of apiaries across four PCA quadrants. Mean standardized values (z-scores) of apiary size, hive modernization, annual honey productivity, and field-recorded Varroa indicator for apiaries classified into four PCA quadrants: Q1 (n = 31), Q2 (n = 18), Q3 (n = 20), and Q4 (n = 29). Positive and negative values indicate measurements above and below the overall sample mean, respectively. Quadrant profiles illustrate differences in production characteristics and Varroa indicators; they represent descriptive groupings rather than statistically validated clusters.
Table 5.
Characteristics and interpretation of PCA quadrants among surveyed apiaries.
Quadrant 1 (PC1+, PC2+) comprised 31 apiaries (31.6%) and was characterized by medium-sized, predominantly traditional-oriented production systems, with lower honey productivity and relatively low Varroa indicators. Quadrant 2 (PC1−, PC2+) included 18 apiaries (18.4%), representing smaller apiaries with a greater proportion of modern hives, higher honey productivity, and lower Varroa indicators. Similarly, Quadrant 3 (PC1−, PC2−), comprising 20 apiaries (20.4%), was characterized by relatively small, modern-oriented apiaries with higher honey productivity, although Varroa indicators were closer to the overall sample mean. Quadrant 4 (PC1+, PC2−) included 29 apiaries (29.6%) and represented a contrasting profile characterized by larger apiaries, a more balanced combination of traditional and modern hives, lower honey productivity, and substantially higher Varroa indicators.
Collectively, Quadrants 2 and 3 accounted for 38 apiaries (38.8%) and exhibited comparatively higher productivity and greater adoption of modern hives. In contrast, Quadrants 1 and 4 comprised 60 apiaries (61.2%) and were associated with lower productivity, but differed in farm scale, hive composition, and Varroa indicators. These findings suggest that the surveyed apiaries exhibited distinct combinations of production-system characteristics rather than a simple division between traditional and modern beekeeping. The descriptive profiles also highlight variation in Varroa indicators among apiaries with different production characteristics.
4. Discussion
4.1. Diversity of Apiary Structure and Hive Systems
The survey identified substantial heterogeneity in colony numbers, hive composition and honey productivity across 98 apiaries in five Saudi Arabian regions. The coexistence of traditional and modern frame hives within 56 apiaries (57.1%) is particularly important: modernization in this sample was often partial rather than a complete replacement of traditional equipment. Such diversity is consistent with descriptions of Saudi beekeeping systems and the environmental conditions under which they operate [12,13,14,21]. Regional differences in hive composition were evident, with greater traditional-hive representation in Jazan and Asir and greater modern-hive representation in Makkah. Nevertheless, the purposive sample and its strong concentration in Makkah and Jazan mean that these differences describe participating apiaries, not the population distribution of beekeeping systems in the Kingdom.
The production system categories provide a practical management description, but they should not be confused with bee genetic identity. Indigenous Apis mellifera jemenitica and imported or other honeybee populations may be maintained in different hive designs. Earlier Saudi studies have documented the distinct biological and management relevance of indigenous honeybees and compared the performance of indigenous and exotic populations [12,13,14]. Accordingly, this study cannot attribute differences between hive systems to genetic origin, thermal adaptation or breeding value; those questions require independent recording and verification of bee ancestry [22].
4.2. Hive Modernization and Honey Productivity
The most consistent result was the higher annual honey yield per colony associated with modern frame hives. Within the 54 apiaries for which both hive systems had valid yield records, median annual yield was 2.67 kg per modern colony compared with 1.10 kg per traditional colony (paired Wilcoxon p < 0.001). The within-apiary comparison is valuable because it partly reduces confounding by broad location and beekeeper-level circumstances shared by the two systems. It does not, however, remove differences in colony strength, bee origin, forage access, management intensity, hive age or selective placement of stronger colonies into modern hives.
The adjusted model reinforced this association: a 10-percentage-point increase in modern-hive share was associated with an estimated 0.19 kg/colony/year greater overall yield (β = 0.0190 per percentage point; HC3 robust p < 0.001), conditional on region, apiary size and the Varroa indicator. The model explained 36.9% of observed yield variation, leaving substantial variability unaccounted for. Modern frame hives can plausibly facilitate inspection, comb handling, harvest management and timely husbandry, consistent with practical good-beekeeping guidance [23]. These mechanisms were not measured directly, however, and the coefficient must be interpreted as an association rather than the causal effect of converting a hive.
The repeated-harvest model also showed a marked hive-system contrast (traditional-hive coefficient −0.4269 on the fitted log scale, p < 0.001), whereas neither the joint harvest effect (p = 0.615) nor the joint hive-system-by-harvest interaction (p = 0.0835) was statistically established. Thus, the data supports a broadly persistent difference between hive systems across the three observed harvests, but not a robust claim that one system responds differently to harvest sequence. Harvest-level totals per apiary must also be distinguished from yield per colony because colony numbers differ between systems.
4.3. Regional Productivity and the Role of Production Environment
Overall annual honey yield per colony differed across the five surveyed regions (Kruskal–Wallis p < 0.001), and traditional-hive yield showed a regional difference (p = 0.017), whereas modern-hive yield did not (p = 0.222). These patterns may reflect interacting variation in flowering resources, climate, colony movement, bee populations and management practices, all of which are relevant to bee nutrition and health [9,10,11]. However, the survey did not quantify forage availability, seasonal movement, temperature exposure or harvest-specific nectar flows. The regional contrasts observed therefore cannot be assigned to particular ecological drivers.
Although Al-Baha and Al-Madinah had high descriptive mean yields, they contributed only four and two apiaries, respectively. Their estimates are consequently unstable and should not be used to rank regional productivity or extrapolate to the wider sector. In the adjusted regression, none of the regional coefficients differed significantly from Al-Baha, the reference category, but this result is also constrained by the very small reference group. A larger, stratified and seasonally repeated survey is needed to evaluate regional effects with adequate precision.
4.4. Varroa Indicators and Interpretation of Colony Health
The field-recorded Varroa indicator averaged 29.8% and varied among surveyed regions. Varroa destructor is a well-established threat to managed western honeybees through parasitism and interactions with viruses and colony health [15,16,17,24]. Nevertheless, the indicator was not independently associated with annual honey yield in the present adjusted model (β = −0.0061; HC3 robust p = 0.264). This non-significant association should not be interpreted as evidence that Varroa is biologically unimportant. A single cross-sectional field measure may not represent infestation intensity over the production season, and treatment timing, colony survival, management response and measurement error can obscure relationships with annual yield.
For epidemiological interpretation, future work should preserve the number of sampled colonies, sampling units, mite counts, the number of bees examined, and the timing of sampling relative to treatment, alongside standardized assessment protocols [15,23]. The present indicator should not be treated as a nationally representative infestation-prevalence estimate. Clinical manifestations are insufficiently specific for diagnosis, and microscopy or molecular testing is needed before reporting pathogen prevalence or evaluating species-specific effects [18,19].
4.5. Beekeeper-Reported Constraints and Practical Priorities
Among the 62 apiaries with recorded constraint information, imports and biosecurity (25.8%), predators (22.6%) and marketing/value-chain difficulties (19.4%) were the most frequent categories. Concerns about disease-control services and crowding-related biosecurity were also recorded. These responses point to priorities that extend beyond hive technology: movement and sourcing of colonies, practical health-management support, protection against predators and access to reliable honey markets. Good-beekeeping guidance emphasizes integrated disease prevention, hygiene and husbandry, which are pertinent to these reported concerns [23].
These percentages describe the distribution of coded responses with available information, not the prevalence of each challenge among all 98 apiaries or Saudi beekeepers nationally. The categories also reflect the questionnaire and coding approach; they do not measure the economic severity of each problem. Follow-up studies should quantify costs, production losses and the feasibility of specific interventions before establishing an investment ranking.
4.6. Production-System Typology and PCA Profiles
The four hive-composition typologies and the exploratory PCA provided complementary descriptions of production-system heterogeneity. Mixed modern-dominant apiaries were the largest category (37.8%), while 25.5% were traditional-only, 19.4% mixed traditional-dominant and 17.3% modern-only. The PCA, based on apiary size, modern-hive proportion, annual yield per colony and the Varroa indicator, explained 68.1% of total variation in its first two components. This parsimonious variable set reduced the risk of giving excessive weight to mathematically redundant hive counts and proportions.
The four PCA quadrants differentiated descriptive profiles: a traditional-oriented, lower-productivity group (Q1; n = 31); two smaller, more modern-oriented and higher-productivity groups (Q2, n = 18; Q3, n = 20); and a larger-apiary, lower-productivity group with higher Varroa indicators (Q4; n = 29). The distinction between Q2 and Q3 was primarily the relative Varroa indicator, while Q1 and Q4 differed in farm scale and health-indicator profile despite both having lower productivity. These patterns suggest that farm size alone is insufficient to characterize performance and that interventions may need to be differentiated by production profile.
Importantly, PCA quadrants are defined by the signs of component scores and are not independently validated statistical clusters. The apparent profiles partly reflect the variables used to construct the PCA; they cannot serve as independent evidence that hive modernization or Varroa status caused productivity differences. Farm typologies can assist in organizing diverse agricultural systems, but robust operational classification requires transparent definitions and external validation [25]. The present profiles should therefore be regarded as hypotheses for targeted field assessment rather than definitive categories for allocating services.
4.7. Implications for Extension and Future Research
These findings support differentiated extension rather than a single standardized package for all apiaries. For traditional-oriented apiaries, practical demonstrations of frame-hive management, colony inspection and hygienic harvesting may be relevant, provided that adoption costs, labour requirements and local bee adaptation are considered. For modern-oriented apiaries, attention may shift toward productivity recording, colony-strength management and quality assurance. For larger apiaries with elevated Varroa indicators, standardized monitoring and timely health-management support merit evaluation. Any intervention should be tested prospectively rather than assumed effective from the observed cross-sectional associations [23].
Future research should separately record hive design and bee genetic origin, objectively measure honey harvested per colony and season, document colony movement and forage conditions, and apply standardized Varroa and Nosema diagnostics. A representative longitudinal design would permit stronger examination of temporal relationships, regional environmental variation, productivity responses and the costs and benefits of hive-system transitions.
4.8. Strengths and Limitations
A strength of this study is its joint examination of hive composition, within-apiary productivity contrasts, repeated harvest observations, field health indicators and exploratory multivariate profiles. The paired comparison is more informative than an unpaired comparison alone, and HC3 robust standard errors reduce reliance on constant residual variance for coefficient-level inference. Nevertheless, the observational, cross-sectional design prevents causal attribution. The sample was purposive and strongly unbalanced among regions; the Al-Baha and Al-Madinah subsamples were particularly small. Production data may be influenced by recording or recall error, and bee genetic origin, colony strength, forage availability, treatment history and other potential confounders were not independently controlled.
The Varroa field percentage requires a fully documented measurement denominator and protocol for stronger epidemiological interpretation, while Nosema-compatible signs lack laboratory confirmation. Constraint data were available for only 62 apiaries, and PCA quadrants are descriptive rather than validated clusters. These limitations restrict the generalizability of numerical estimates and the strength of mechanistic or policy conclusions.
5. Conclusions
This study provides an integrated assessment of beekeeping production systems, honey productivity, colony-health indicators, and production constraints among 98 surveyed apiaries across five regions of Saudi Arabia. The findings demonstrate substantial heterogeneity in apiary size, hive composition, productivity, and management characteristics, highlighting the diversity of beekeeping practices within the surveyed population.
Modern frame-hive systems were associated with significantly higher annual honey productivity than traditional hive systems. Among apiaries maintaining both systems, the median annual honey yield was 2.67 kg/colony in modern hives compared with 1.10 kg/colony in traditional hives. Multivariable regression further demonstrated a positive association between the proportion of modern hives and annual honey yield after adjusting for apiary size, region, and field-recorded Varroa indicators. These findings suggest that modern hive management may offer opportunities for improving honey productivity. However, the observed differences cannot be attributed exclusively to hive technology, as bee genetic origin, management practices, forage availability, and other potential confounding factors were not independently evaluated.
Regional differences in honey productivity and hive-system composition were evident, reflecting the diversity of production environments and management practices. Field-recorded Varroa indicators also varied among regions but were not significantly associated with annual honey yield in the adjusted regression model. This finding should not be interpreted as evidence of limited biological importance, particularly given the cross-sectional study design and limitations of the available health measurements. Similarly, observations of Nosema-compatible clinical signs require laboratory confirmation before conclusions regarding infection occurrence can be established.
Production-system classification and principal component analysis revealed distinct combinations of apiary scale, hive modernization, productivity, and Varroa indicators. These exploratory profiles demonstrate that beekeeping performance cannot be adequately characterized by hive type or farm size alone. Beekeepers also identified imports and biosecurity, predators, and marketing and value-chain limitations as prominent production constraints.
Overall, the findings indicate opportunities to improve honey productivity through production-system-specific extension, improved colony management, strengthened biosecurity, and better market integration. Nevertheless, the purposive sampling approach and unequal regional representation limit generalization to the wider Saudi beekeeping sector. The study therefore provides an exploratory evidence base for developing targeted interventions and designing more representative investigations.
6. Recommendations
The findings highlight the need for targeted interventions to improve honey productivity and sustainability across diverse beekeeping systems in Saudi Arabia. Priority should be given to promoting improved hive management and appropriate modernization through practical training and extension services, strengthening standardized colony-health surveillance and biosecurity, and improving apiary-level production records and productivity monitoring. Interventions should be tailored to production-system characteristics, while addressing key constraints related to bee imports, predators, and honey marketing through improved technical services and value-chain development. Future research should employ representative, longitudinal study designs to assess the effects of hive technology, bee genetic origin, management practices, environmental conditions, and disease burden on honey productivity. Collaboration among government institutions, research organizations, beekeeper associations, and private-sector stakeholders will be essential for validating and scaling economically viable, evidence-based interventions.
Supplementary Materials
The following supporting information can be downloaded at: https://www.mdpi.com/article/10.3390/insects17111107/s1.
Author Contributions
Conceptualization, R.A., M.S., G.K. and N.H.; methodology, R.A. and M.S.; software, M.S.; validation G.K., N.H., A.A.-S., M.A. and A.A.; formal analysis, M.S. and R.A.; resources, A.A.-S. and N.H.; data curation, M.S.; writing, review and editing, M.S. and R.A.; visualization, M.S.; supervision, G.K. and N.H.; project administration, N.H.; funding acquisition, N.H. All authors have read and agreed to the published version of the manuscript.
Funding
This research was conducted under the Sustainable Rural Agricultural Development Program (SRAD), funded by the Kingdom of Saudi Arabia via a trust fund (UTF/SAU/051/SAU). The FAO implemented the project in collaboration with the Ministry of Environment, Water, and Agriculture, Kingdom of Saudi Arabia (MEWA).
Institutional Review Board Statement
Not applicable.
Informed Consent Statement
Informed verbal consent was obtained from all the farmers involved in the study.
Data Availability Statement
Due to privacy agreements with participating farmers, the data are not publicly available.
Acknowledgments
The authors gratefully acknowledge the participation and cooperation of all the farmers, the dedication of the Field Technicians (Mushabab Alquhtani, Aali Alqarni), former FAO Technical Advisor Nuru Mohammed, and the support from the regional staff of the MEWA and the FAO-Saudi Arabia team.
Conflicts of Interest
The authors declare no conflicts of interest.
References
- Klein, A.-M.; Vaissière, B.E.; Cane, J.H.; Steffan-Dewenter, I.; Cunningham, S.A.; Kremen, C.; Tscharntke, T. Importance of pollinators in changing landscapes for world crops. Proc. R. Soc. B 2007, 274, 303–313. [Google Scholar] [CrossRef] [Scilit] [PubMed]
- Potts, S.G.; Imperatriz-Fonseca, V.; Ngo, H.T.; Aizen, M.A.; Biesmeijer, J.C.; Breeze, T.D.; Dicks, L.V.; Garibaldi, L.A.; Hill, R.; Settele, J.; et al. Safeguarding pollinators and their values to human well-being. Nature 2016, 540, 220–229. [Google Scholar] [CrossRef] [Scilit] [PubMed]
- Garibaldi, L.A.; Steffan-Dewenter, I.; Winfree, R.; Aizen, M.A.; Bommarco, R.; Cunningham, S.A.; Kremen, C.; Carvalheiro, L.G.; Harder, L.D.; Afik, O.; et al. Wild pollinators enhance fruit set of crops regardless of honey bee abundance. Science 2013, 339, 1608–1611. [Google Scholar] [CrossRef] [Scilit] [PubMed]
- Ollerton, J.; Winfree, R.; Tarrant, S. How many flowering plants are pollinated by animals? Oikos 2011, 120, 321–326. [Google Scholar] [CrossRef] [Scilit]
- Gallai, N.; Salles, J.-M.; Settele, J.; Vaissière, B.E. Economic valuation of the vulnerability of world agriculture confronted with pollinator decline. Ecol. Econ. 2009, 68, 810–821. [Google Scholar] [CrossRef] [Scilit]
- Bradbear, N. Bees and Their Role in Forest Livelihoods; Non-Wood Forest Products No. 19; Food and Agriculture Organization of the United Nations: Rome, Italy, 2009. [Google Scholar]
- Goulson, D.; Nicholls, E.; Botías, C.; Rotheray, E.L. Bee declines driven by combined stress from parasites, pesticides and lack of flowers. Science 2015, 347, 1255957. [Google Scholar] [CrossRef] [Scilit] [PubMed]
- Vanbergen, A.J. The Insect Pollinators Initiative. Threats to an ecosystem service: Pressures on pollinators. Front. Ecol. Environ. 2013, 11, 251–259. [Google Scholar] [CrossRef] [Scilit]
- Le Conte, Y.; Navajas, M. Climate change: Impact on honey bee populations and diseases. Rev. Sci. Tech. 2008, 27, 499–510. [Google Scholar]
- Dolezal, A.G.; Toth, A.L. Feedbacks between nutrition and disease in honey bee health. Curr. Opin. Insect Sci. 2018, 26, 114–119. [Google Scholar] [CrossRef] [Scilit] [PubMed]
- Brodschneider, R.; Crailsheim, K. Nutrition and health in honey bees. Apidologie 2010, 41, 278–294. [Google Scholar] [CrossRef] [Scilit]
- Alqarni, A.S.; Hannan, M.A.; Owayss, A.A.; Engel, M.S. The indigenous honey bees of Saudi Arabia (Hymenoptera, Apidae, Apis mellifera jemenitica Ruttner): Their natural history and role in beekeeping. ZooKeys 2011, 134, 83–98. [Google Scholar] [CrossRef] [Scilit] [PubMed]
- Alqarni, A.S.; Balhareth, H.M.; Owayss, A.A. Performance evaluation of indigenous and exotic honey bee (Apis mellifera L.) races in Assir region, southwestern Saudi Arabia. Saudi J. Biol. Sci. 2014, 21, 256–264. [Google Scholar] [CrossRef] [Scilit] [PubMed]
- Al-Ghamdi, A.A.; Nuru, A.; Khanbash, M.S.; Smith, D.R. Geographical distribution and population variation of indigenous honey bees in Saudi Arabia. Saudi J. Biol. Sci. 2017, 24, 1030–1038. [Google Scholar] [CrossRef] [Scilit] [PubMed]
- Rosenkranz, P.; Aumeier, P.; Ziegelmann, B. Biology and control of Varroa destructor. J. Invertebr. Pathol. 2010, 103, S96–S119. [Google Scholar] [CrossRef] [Scilit] [PubMed]
- Nazzi, F.; Le Conte, Y. Ecology of Varroa destructor, the major ectoparasite of the western honey bee. Annu. Rev. Entomol. 2016, 61, 417–432. [Google Scholar] [CrossRef] [Scilit] [PubMed]
- Traynor, K.S.; Mondet, F.; de Miranda, J.R.; Techer, M.; Kowallik, V.; Oddie, M.A.; Chantawannakul, P.; McAfee, A. Varroa destructor: A complex parasite, crippling honey bees worldwide. Trends Parasitol. 2020, 36, 592–606. [Google Scholar] [CrossRef] [Scilit] [PubMed]
- Fries, I. Nosema ceranae in European honey bees (Apis mellifera). J. Invertebr. Pathol. 2010, 103, S73–S79. [Google Scholar] [CrossRef] [Scilit] [PubMed]
- Higes, M.; Martín-Hernández, R.; Meana, A. Nosema ceranae in Europe: An emergent type C nosemosis. Apidologie 2010, 41, 375–392. [Google Scholar] [CrossRef] [Scilit]
- R Core Team. R Version 4.6.1: A Language and Environment for Statistical Computing; R Foundation for Statistical Computing: Vienna, Austria, 2026. [Google Scholar]
- Albarrak, A.; Gray, A. An overview of beekeeping in the Kingdom of Saudi Arabia. J. Apic. Res. 2023, 62, 11–22. [Google Scholar] [CrossRef] [Scilit]
- Meixner, M.D.; Pinto, M.A.; Bouga, M.; Kryger, P.; Ivanova, E.; Fuchs, S. Standard methods for characterising subspecies and ecotypes of Apis mellifera. J. Apic. Res. 2013, 52, 1–28. [Google Scholar] [CrossRef] [Scilit]
- Food and Agriculture Organization of the United Nations. Good Beekeeping Practices: Practical Manual on How to Identify and Control the Main Diseases of the Honeybee (Apis mellifera); Animal Production and Health Guidelines No. 25; FAO: Rome, Italy, 2021. [Google Scholar]
- Ramsey, S.D.; Ochoa, R.; Bauchan, G.; Gulbronson, C.; Mowery, J.D.; Cohen, A.; Lim, D.; Joklik, J.; Cicero, J.M.; Ellis, J.D.; et al. Varroa destructor feeds primarily on honey bee fat body tissue and not hemolymph. Proc. Natl. Acad. Sci. USA 2019, 116, 1792–1801. [Google Scholar] [CrossRef] [Scilit] [PubMed]
- Alvarez, S.; Paas, W.; Descheemaeker, K.; Tittonell, P.; Groot, J.C.J. Constructing Typologies, a Way to Deal with Farm Diversity: General Guidelines for the Humidtropics; Report for the CGIAR ResearchProgram on Integrated Systems for the Humid Tropics; Plant Sciences Group, Wageningen University: Wageningen, The Netherlands, 2014. [Google Scholar]

Disclaimer/Publisher’s Note: The statements, opinions and data contained in all publications are solely those of the individual author(s) and contributor(s) and not of MDPI and/or the editor(s). MDPI and/or the editor(s) disclaim responsibility for any injury to people or property resulting from any ideas, methods, instructions or products referred to in the content. |
© 2026 by the authors. Licensee MDPI, Basel, Switzerland. This article is an open access article distributed under the terms and conditions of the Creative Commons Attribution (CC BY) license.