


Abstract
To elucidate the contact performance and friction force variation characteristics of VL seals for aviation actuators under high-pressure conditions, this study adopted a fluid–structure interaction (FSI)-coupled finite element model to analyze the maximum contact pressure and contact width and their respective variation trends across varying oil pressures and reciprocating velocities. Subsequently, friction force tests of the seals were conducted under matching operating parameters, and the friction coefficients of polytetrafluoroethylene (PTFE) were measured and compared under different normal pressures. The results demonstrate that the friction force of the seals during both extending and retracting strokes increases with rising oil pressure, which is highly correlated with the theoretically predicted conclusion that the seal contact width expands as oil pressure increases. Further analysis confirms that reciprocating velocity exerts no significant influence on the aforementioned variation trends. This study provides a critical basis for the selection and optimal design of VL seals used in high-pressure aviation hydraulic actuators.
1. Introduction
VL seals are widely used in aviation actuators due to their advantages, such as compact structure, excellent sealing performance, and adaptability to high-pressure environments. The VL seal consists of three integral components: a V-ring, O-ring, and backup ring. The V-ring is made from polytetrafluoroethylene (PTFE), which has excellent tribological properties essential for aerospace applications. The O-ring provides necessary pre-compression force and allows for contact pressure compensation in response to changes in hydraulic fluid pressure. The backup ring serves both as structural support and as a protective element, preventing external contaminants from entering the sealing interface [1].
During the reciprocating movement of the actuator, the reciprocating dynamic seal undergoes significant nonlinear deformation due to the coupled effects of fluid extrusion and friction at the contact interface [2]. The size and shape of the seal pair’s contact gap both vary in this process; meanwhile, high friction leads to obvious tangential deformation of the elastomeric seal’s contact surface, altering the fluid pressure in the seal gap accordingly [3]. Therefore, the frictional performance of reciprocating dynamic seals largely depends on the interaction between the seal’s structural deformation and elastohydrodynamic lubrication [4]. This fluid–structure interaction greatly complicates the frictional characteristics of hydraulic reciprocating dynamic seals.
Currently, a considerable number of studies have been dedicated to establishing analytical models for the frictional characteristics and contact performance of hydraulic reciprocating seals; for instance, Salant established a dual-mechanism friction force model that accounts for asperity contact and liquid film shear [5]. Peng et al. [1] developed a 3D simulation model for the VL seal, analyzed its frictional and leakage behaviors during extension and retraction strokes, and explored how different operating speeds affect its sealing performance. Xia et al. adopted the pressure penetration method for fluid pressure loading to study the contact pressure distribution of Y-type seals under different fluid pressures and contact friction coefficients.
To address the fluid–structure interaction problem inherent to hydraulic reciprocating seals, Wu DF et al. developed a novel mixed lubrication model via EHL theory, introduced an elastic deformation method to update film thickness rapidly, and studied the sealing and friction performance of reciprocating seals under full ocean depth pressures [6]. Li JW et al. comprehensively considered the effects of hysteresis heat generation, frictional heat generation, and thermal effects on the constitutive model of sealing materials, and established a structurally thermal coupled soft elastohydrodynamic lubrication model for reciprocating seals. They analyzed the sealing characteristics of Y-rings under different environmental conditions, which were verified using a reciprocating seal test rig [7]. Wang BQ et al. proposed a sealing structure optimization scheme to investigate the influence of structural parameters on sealing performance. The results indicate that an increase in environmental and working pressures intensifies stress concentration and increases interface contact pressure, which renders the lip region of the sliding ring highly susceptible to failure; a rise in piston rod speed and environmental pressure synchronously elevates the sealing leakage rate; and an increase in working pressure leads to a corresponding growth in friction force [8].
Regarding the inevitable wear problem occurring in hydraulic reciprocating seals during actual operation, Wang et al. proposed an analysis method for sealing performance degradation of reciprocating seals under mixed lubrication conditions based on the modified Archard model. This method enables the analysis of sealing, lubrication and wear characteristics of reciprocating seals at any service time, and obtains the variation trends of key sealing performance parameters (including contact pressure, friction force and net leakage) with service time under specific operating conditions [9]. Yang XL et al. developed a wear life prediction approach for V-type combination seals by integrating Rhee’s wear theory with the mixed lubrication model. This approach allows for the accurate prediction and systematic analysis of the evolutionary law of seal lip profiles as a function of service time, and its effectiveness was further verified through experiments conducted on a specialized V-type composite seal test setup. The obtained results reveal the following trends: as lip wear intensifies, contact pressure declines, contact width expands, lip wear reaches its maximum value, seal friction decreases gradually, leakage rate rises steadily, and the total leakage volume satisfies the specified operational requirements [10].
Regarding the influence of ambient parameter variations during operation on the performance of hydraulic reciprocating seals, Kim BJ et al. investigated the influence of operating parameters such as ambient temperature and sealing pressure on the sealing performance of a typical U-cup seal. They proposed a model that can simultaneously consider the surface temperature rise effect caused by frictional heat generation between the two contact surfaces. Integrating operating parameters including sealed pressure, rod velocity and ambient temperature, the model explores the variation laws of oil film distribution, working fluid leakage and friction force in the sealing area. The simulation results show that the effects of fluid viscosity (varying with ambient temperature) on oil film formation, surface temperature rise, and surface roughness at extremely small film thicknesses are all significant [11].
These studies indicate that seal contact characteristics (e.g., contact pressure, contact width) are core factors governing seal frictional behavior variations. Changes in fluid pressure alter the seal lip’s geometry and affect oil film thickness and pressure distribution in the contact area. Furthermore, related experimental investigations demonstrate that different sealing configurations—including O-ring [12], rectangular ring [13], and combined seal designs—exhibit distinct frictional responses under varying operational conditions. Zhang MT et al. took the Stern seal of aircraft actuators as an example, used the IHL method to solve the Reynolds equation, and built a multi-field coupled mixed lubrication model for reciprocating seals. The reverse pumping rate (leakage) and frictional force of the reciprocating seal were calculated at different temperatures, and the validity of the theoretical model was verified via reciprocating seal bench tests [14]. Peng et al. focused on the VL seal and proposed a modeling method with the introduction of additional push rod displacement to investigate the macroscopic and microscopic properties of the sealing region. They integrated the material’s plastic effect into reciprocating seal modeling and systematically analyzed sealing performance under various interference fits. Results show that tensile deformation mainly impacts cavity-side contact pressure; additional stretching increases leakage but decreases friction compared to standard-dimension seals [15]. Zhao Y et al. investigated the effects of the reciprocating speed, root mean square roughness, fluid medium pressure, and seal pre-compression on seal friction force and leakage. The results show that the heat generated in the sealing area accumulates at the bottom of the V-ring. Under the same conditions, the temperature rise during the outward stroke is greater than that during the inward stroke. Additionally, the piston rod speed and the initial compression of the seal ring exert more significant influences on the overall seal friction and leakage. At low seal pre-compression levels, RMS roughness has a substantial impact on leakage and friction during the outward stroke, whereas its impact on the inward stroke is limited [16].
In recent years, research indicates that hydraulic systems designed to operate at 8000 psi exhibit a 30% reduction in weight and a 40% decrease in volume compared to conventional 3000 psi systems [17], which is of great significance for aerospace actuators. Consequently, high-pressure design has emerged as a prominent development trend in the field of hydraulic systems in recent years. In high-pressure operating environments, both the contact pressure and contact width of the seal ring can dynamically change with fluctuations in fluid pressure. Notably, the maximum contact pressure increases proportionally to the system pressure, significantly increasing the risk of seal degradation or catastrophic failure [18]. Therefore, analyzing the characteristics of reciprocating seals under high-pressure conditions has become a research priority in relevant studies.
A review of existing studies reveals that seal contact characteristics (e.g., contact pressure and contact width) are the core factors governing variations in seal frictional behavior. Variations in fluid pressure induce changes in the geometry of the seal lip, as well as the oil film thickness and pressure distribution within the contact region. Owing to the multi-field coupling effects of reciprocating seal systems and the distinct physical, chemical, and mechanical properties of rubber and plastic materials, the operating mechanism of reciprocating seal rings is inherently complex and highly dependent on service conditions.
In relevant studies addressing the behavioral modeling of sealing materials and dynamic contact simulation, Persson and his collaborators proposed a comprehensive theory of rubber contact mechanics and dry friction [19]. Kaiser F et al. implemented and extended this model, specifically by incorporating a static friction module based on the bonded continuum model proposed by Juvekar’s research team. Validation experiments were carried out using a tribometer, covering a wide range of material types, temperature intervals and motion velocities. Kaiser F. et al. pointed out that understanding the tribological behavior of elastomers under dry conditions is crucial for sealing applications, because even under lubricated working conditions, liquid film rupture in local areas may induce dry contact phenomena. The friction model they developed can predict the static and dynamic dry friction characteristics of various commercial rubber materials based on different matrix polymers (FKM, EPDM and NBR), with an average prediction accuracy of up to 10% [20]. Wang Y et al. proposed a novel modeling method for reconstructing three-dimensional (3D) surface topographies. The coordinate point cloud of the surface was generated based on the random distribution of asperity heights determined by the initial roughness parameters. A metal–rubber assembly model with rough 3D surface topographies was established [21]. Particularly under high-pressure operating conditions (≥21 MPa), the variation laws of the aforementioned parameters remain to be further investigated in depth. In addition, the friction coefficient of PTFE is affected by many factors, such as the external load, sliding velocity, and operating temperature. When PTFE is operated under variable loading, the higher dynamic load may result in heat build-up, thus affecting the friction coefficient of PTFE [22]. Therefore, it is crucial to investigate how contact pressure distribution evolves in VL seals under high-pressure conditions and how this affects frictional characteristics. Doing so is essential for the optimal design, selection, and performance validation of VL seal assemblies for aerospace actuators, ultimately ensuring sealing integrity and system reliability.
This study focuses on the VL seal employed in aerospace actuators and adopts a hybrid approach combining finite element analysis (FEA) with experimental validation to conduct the following research: (1) quantify the influence of hydraulic oil pressure and reciprocating speed on the contact pressure and contact width of VL seal assemblies; (2) elucidate the variation characteristics of contact pressure and contact width at the primary sealing interface of VL seals under different operating parameters. Furthermore, a fluid–structure interaction (FSI) model is utilized to analyze the variation laws of the frictional force of VL seals under variable operating conditions, with rigorous cross-validation performed between the analytical data and experimental results. Ultimately, this study establishes an integrated theoretical and experimental research framework, which aims to provide scientific guidance for the optimal design and selection of VL seal assemblies under high-pressure operating conditions.
2. Theoretical Analysis
2.1. Analysis of Static Contact Performance of VL Seal
Static contact performance is critical to the sealing reliability of VL seals. In this section, the simulation software ABAQUS is used to analyze the influence of oil pressure and reciprocating speed on the magnitude and distribution of contact pressure of the VL seal, and to conduct a comparative analysis of changes in static contact performance under different operating conditions.
The simulation model is established to analyze the contact pressure distribution and contact width between the seal ring, sealing groove, and piston rod, and provide a basis for subsequent dynamic performance analysis.
2.1.1. Finite Element Simulation Based on ABAQUS
- (1)
- Mod el Establishment and Material Property Setting
The hydraulic reciprocating sealing structure presents high symmetry in the circumferential direction. Its geometric shape, material distribution and applied loads (e.g., oil pressure) all show regular circumferential distribution, and the physical quantities involved (displacement, stress and strain) are only dependent on the radial and axial directions, independent of the circumferential angle. The 2D axisymmetric modeling method in finite element simulation can accurately capture key characteristics such as seal deformation and contact pressure distribution, and substantially improve the simulation efficiency [23]. Guo F et al. proposed a novel method for the dimensional reduction of solid mechanics, contact mechanics, and fluid mechanics analysis. The performance of the sealing system was calculated and analyzed under static eccentricity (which does not change with piston rod motion) and dynamic eccentricity (which changes with piston rod motion) using the aforementioned models. The results indicate that the sealing performance calculated by both models is highly consistent, demonstrating that, within the permissible engineering limits, the two-dimensional FSI model can replace the three-dimensional model, thereby reducing computational costs and improving convergence [24]. Therefore, the 2D axisymmetric modeling method is adopted to ensure analysis accuracy in this study.
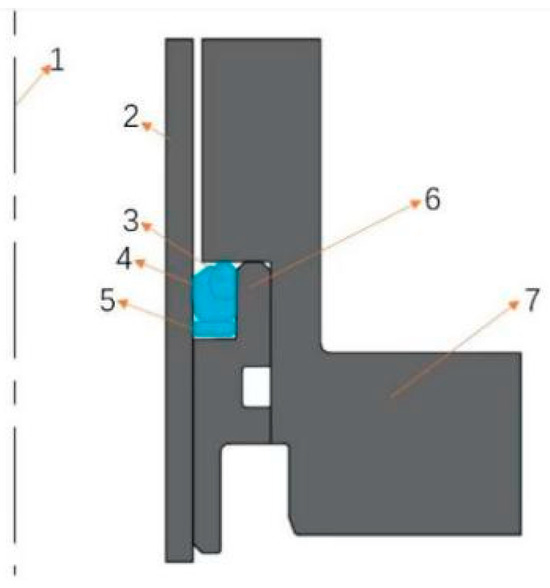
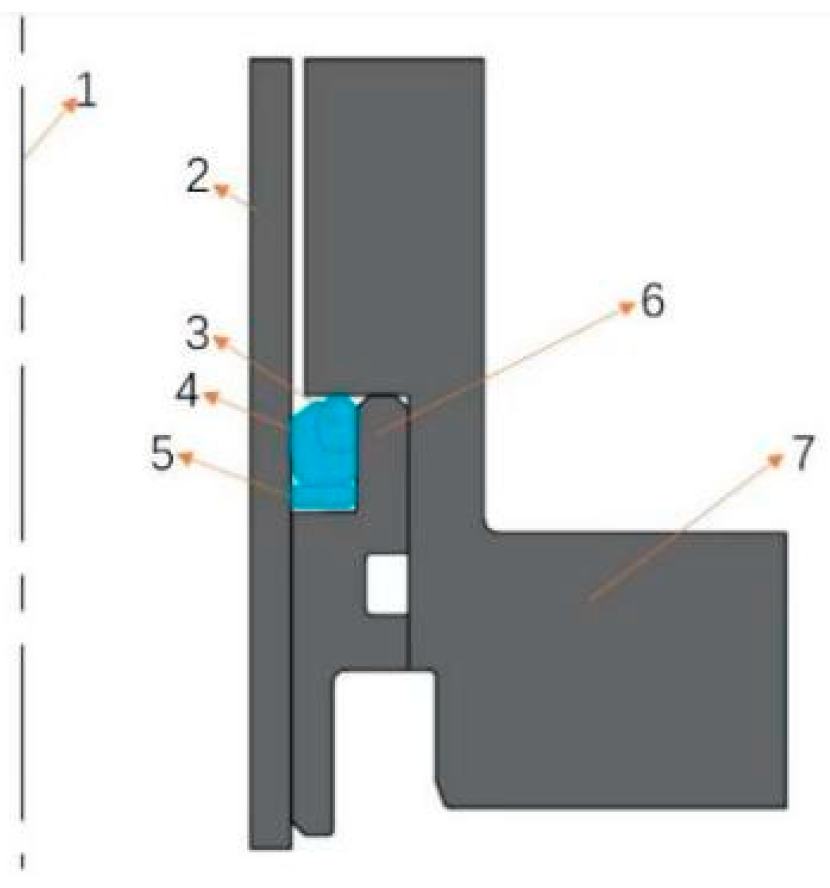
As shown in Figure 1, the simulation model consists of seven components, where 1 is the axis of symmetry of the finite element simulation model, 2 is the hollow piston rod, 3 is the O-ring, 4 is the V-ring, 5 is the backup ring, 6 is the sealing ring, and 7 is the cylinder. The material properties are set as follows:
Figure 1.
Finite element 2D axisymmetric model. 1. Symmetry axis, 2. Piston rod outer wall, 3. O-ring, 4. V-ring, 5. Retaining ring, 6. Test ring, 7. Cylinder barrel.
(a) Both the V-ring and the backup ring are made of polytetrafluoroethylene (PTFE), and a linear elastic model is adopted for modeling, with an elastic modulus of 532 MPa and a Poisson’s ratio of 0.46.
(b) The O-ring is made of nitrile butadiene rubber (NBR), and the Ogden hyperelastic constitutive model (N = 2) is used to fit the experimental data. Its functional expression is:
According to the constitutive relation (stress–strain relation) of rubber, which is described by a strain energy function, the parameter values obtained through fitting are presented in Table 1.
Table 1.
The fitting-obtained parameters of the constitutive model.
(c) Cylinder block, seal ring—The material used is aluminum bronze QAl10-3-1.5-R, with an elastic modulus of 120 GPa and a Poisson’s ratio of 0.33.
(d) Hydraulic rod—The material used is high-performance alloy 30CrMnSiNiA, with an elastic modulus of 200 GPa and a Poisson’s ratio of 0.28.
- (2)
- Solution of the Finite Element Model
The VL seal consists of a PTFE-based sealing lip and an elastomeric support ring, which exhibit distinct mechanical behaviors. The CAX4RH element was adopted for PTFE and NBR, while the CAX4R element was assigned to rigid bodies and the piston rod. The details of other settings are specified as follows:
① Mesh Geometry: Quadrilateral elements were predominant.
② Analysis Type: Static analysis.
③ Discretization Level: The total number of elements was 131,627 and the total number of nodes was 132,896.
④ Solver Settings: The Abaqus/Standard solver was employed. The contact algorithm was set to the Penalty Function Method, and the convergence criteria were specified as a force convergence tolerance of 10−5 and a displacement convergence tolerance of 10−6.
- (3)
- Grid Convergence Study and Grid Remeshing
As shown in Table 2, a mesh convergence verification was conducted on the finite element analysis model to avoid simulation errors caused by mesh generation. When the mesh size was refined from 0.01 mm to 0.005 mm, the calculated maximum contact pressure tended to stabilize (with an error of less than 2%). However, the computation time increased from 2.1 h to 6.5 h, while the error was only reduced by 1.1% and the computation time was extended by 4.4 h. Considering the balance between computational accuracy and efficiency, 0.01 mm was finally selected as the optimal mesh size.
Table 2.
Comparison of calculation results under different mesh sizes.
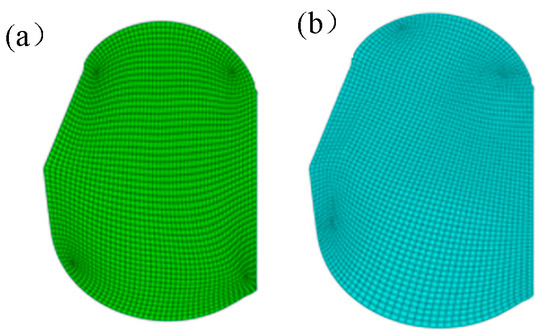
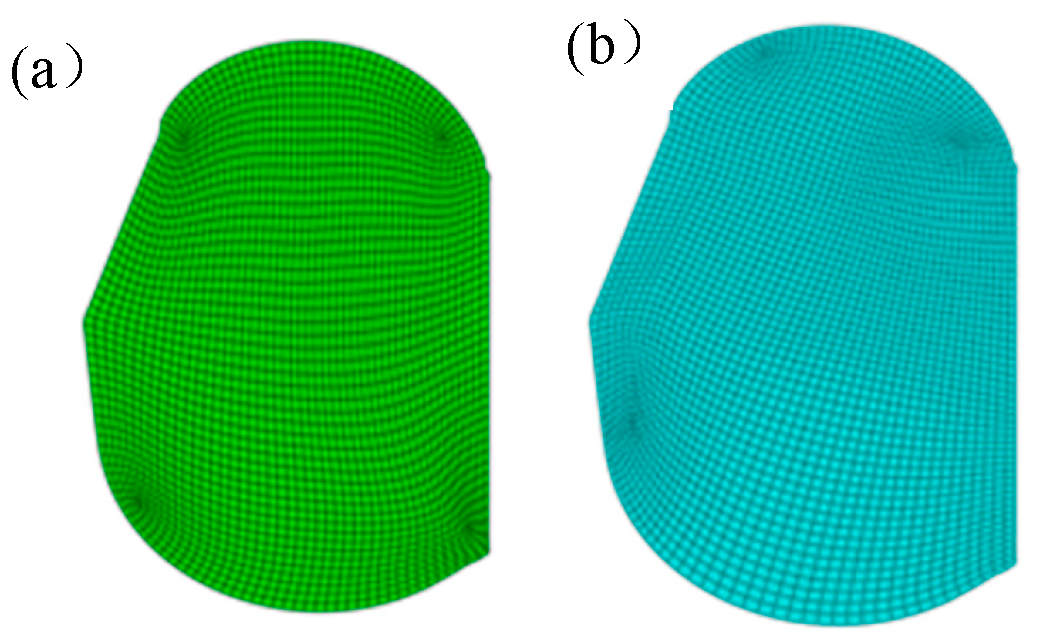
In nonlinear finite element analysis, due to their inherent material properties, rubber-like hyperelastic materials are prone to large-scale deformation during simulation, which often leads to severe mesh distortion. In the finite element simulation presented in this paper, the rubber structure undergoes significant deformation during both pre-compression of the sealing structure and oil pressure loading. Therefore, it is necessary to add mesh remeshing steps to these analysis steps to reduce calculation errors and prevent non-convergence; a comparison of the mesh before and after remeshing is shown in Figure 2.
Figure 2.
Comparison of meshes: (a) before mesh generation; (b) after mesh remeshing.
Compared with the mesh before remeshing, the severely distorted areas in the remeshed mesh have been significantly improved, and the overall quality of the mesh has been enhanced, which can ensure the accuracy and reliability of the simulation results.
- (4)
- Friction Property Settings
The friction coefficient between PTFE and NBR was set to 0.08. The friction coefficient between PTFE and either aluminum bronze QAL10-3-1.5-R or the high-performance alloy 30CrMnSiNiA was set to 0.05, and that between NBR and either aluminum bronze QAL10-3-1.5-R or the high-performance alloy 30CrMnSiNiA was also set to 0.05. The friction coefficient between PTFE and NBR was obtained via experimental testing, and details are presented in Section 3.1.2.
- (5)
- Assembly and Simulation Process of VL seal
The application of fluid pressure is simulated using the pressure penetration method. Since the oil side is in the opening direction of the V-ring, the movement of the hydraulic rod toward the oil pressure side is defined as the retraction stroke, and the movement toward the air side is defined as the extension stroke.
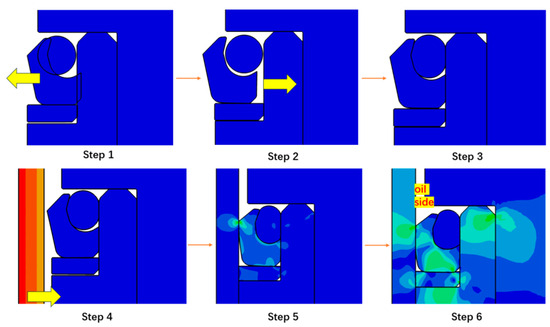
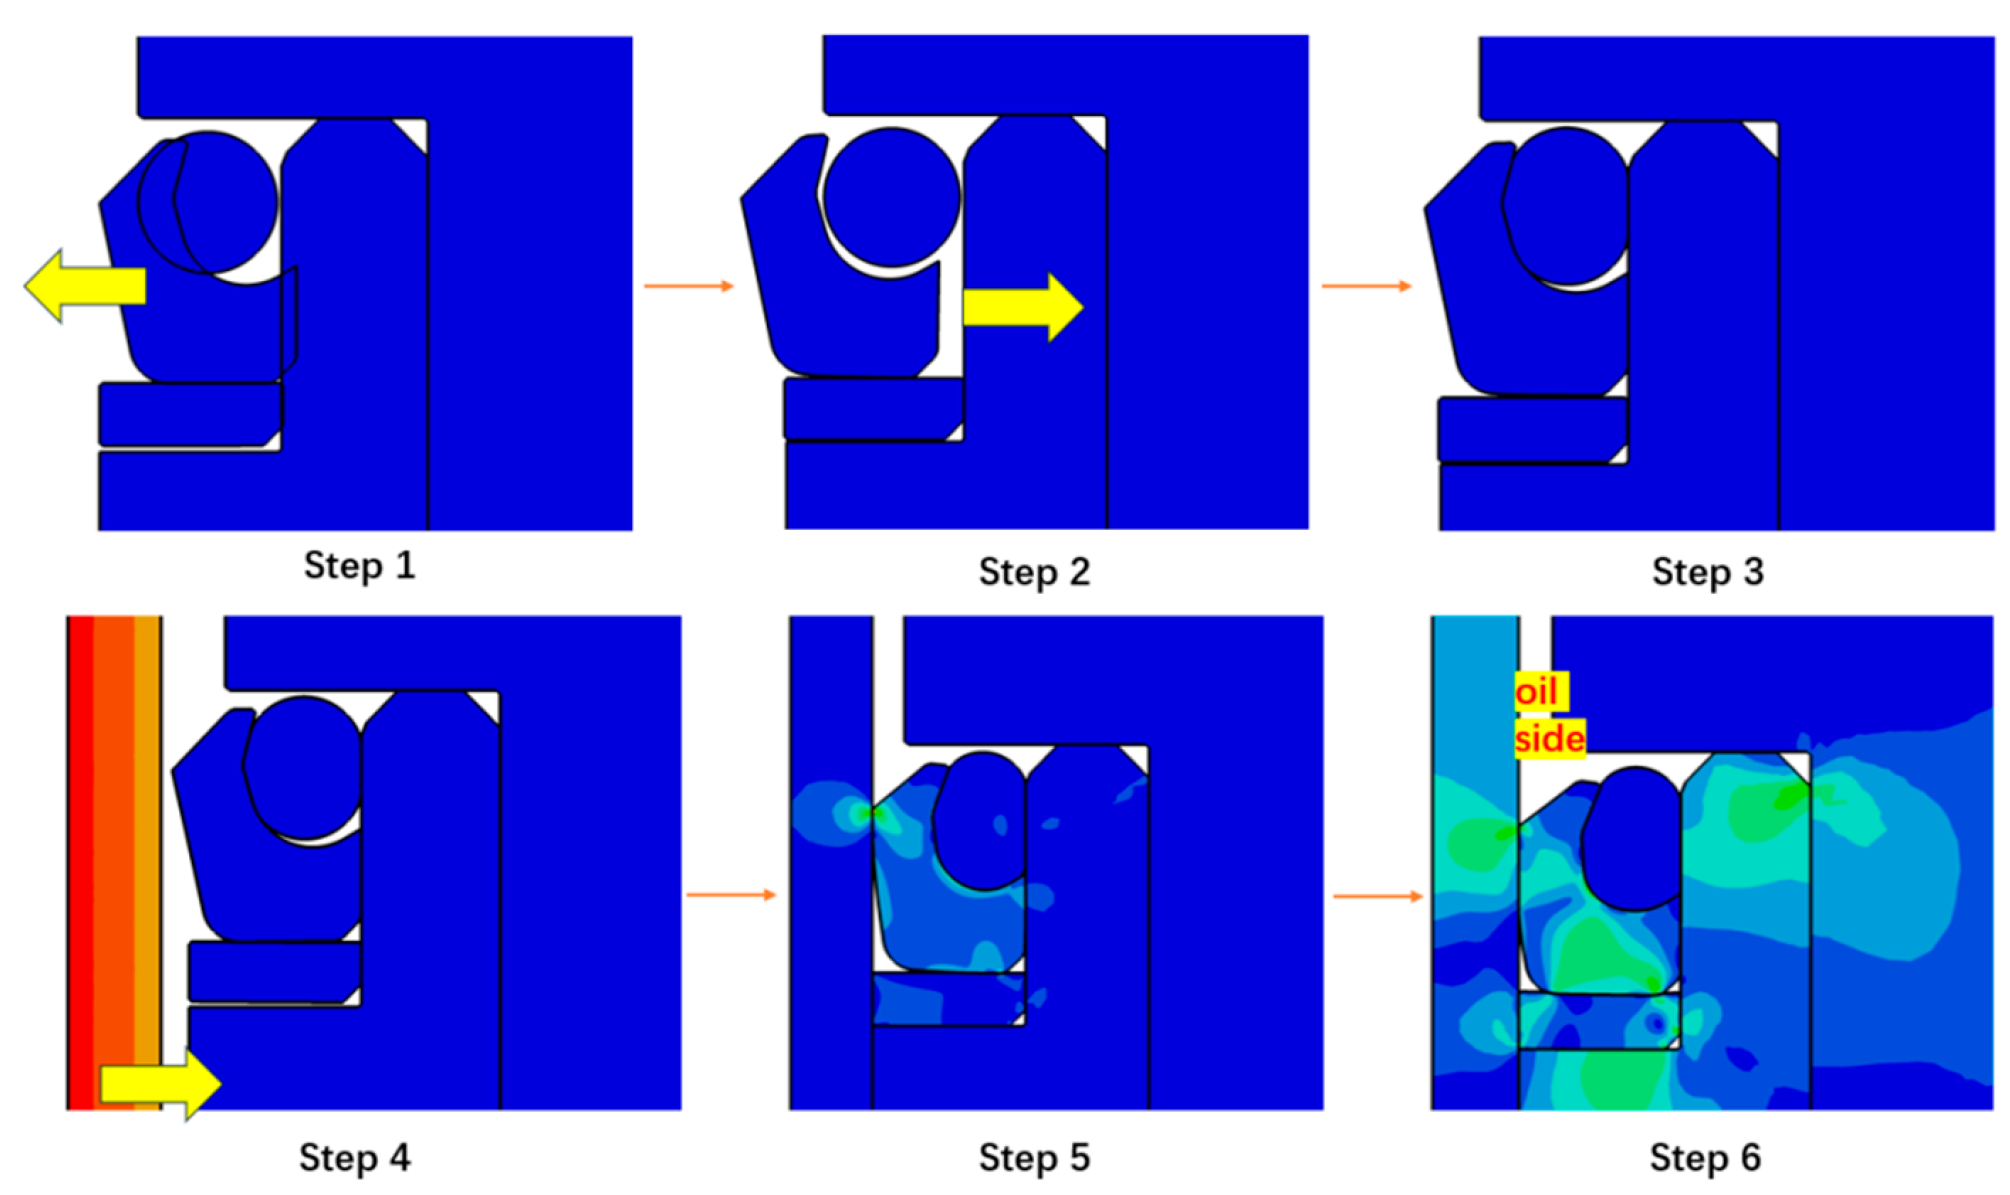
To ensure that the assembly process is consistent with the actual working conditions, the interference-fit method was used for the assembly of the VL seal; the specific process is shown in Figure 3.
Figure 3.
Assembly process of VL seal.
Step 1: Initially, the contact relationship between the O-ring and the V-ring is neglected; then, a virtual force is applied to the V-ring to separate it from the O-ring.
Step 2: The contact relationship between the O-ring and the V-ring is reactivated, and the virtual force acting on the V-ring is removed; this operation simulates the actual installation process of the sealing ring, corresponding to Steps 2 and 3 in the figure.
During Steps 4–5, the piston rod moves toward the V-ring and completes preloading, marking the end of the assembly process.
In Step 6, a fluid load is applied while the piston rod is controlled to perform reciprocating motion.
- (6)
- Boundary Condition Settings
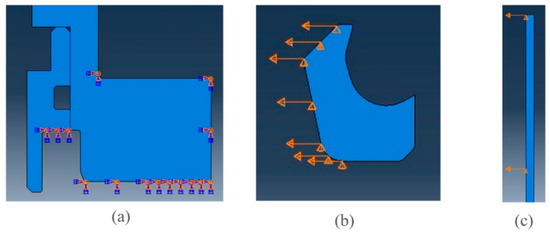
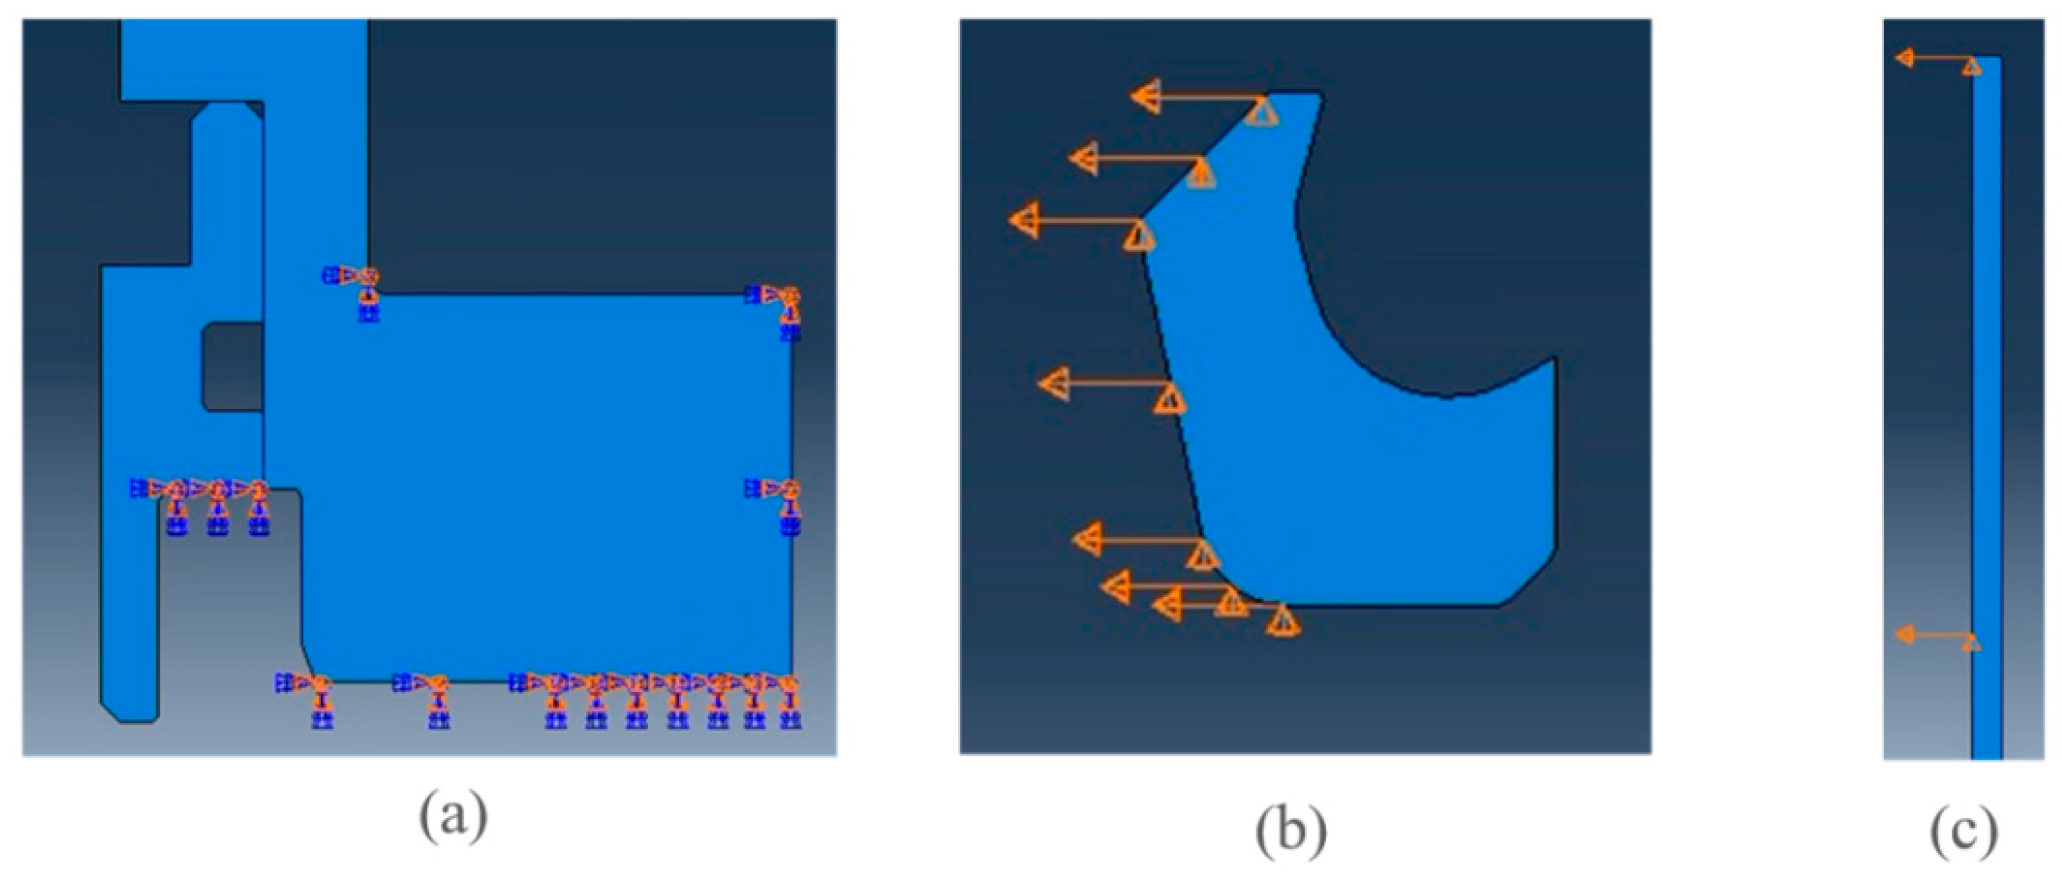
Three main categories of boundary conditions were configured. First, fixed supports were applied to the cylinder block and sealing rings, as shown in Figure 4a. Second, displacements were assigned to the V-shaped sealing rings to simulate the assembly and pre-compression processes of the seals, as shown in Figure 4b. Third, displacements were defined for the hollow piston rod to model its assembly process and reciprocating motion cycles, as shown in Figure 4c.
Figure 4.
Boundary condition settings. (a) is a schematic diagram of the constraints on the test ring and cylinder; (b) is a schematic diagram of the constraints on the V-ring; (c) is a schematic diagram of the constraints on the piston rod.
In this study, the approach to accounting for the pre-stress induced during the installation of the seal is implemented as follows: in the axisymmetric analysis, the position of the axis of symmetry remains unchanged, and a displacement is applied along the axis of symmetry to achieve pre-compression.
The VL seal for aviation actuators has a rotationally symmetric structure, with its geometric configuration, load conditions, and constraint conditions uniformly distributed along the circumferential direction of the piston rod. The 2D axisymmetric model can significantly simplify the nonlinear calculations under high-pressure aviation operating conditions while ensuring the accuracy of core sealing performance parameters such as lip contact pressure and stress distribution. As a mainstream and well-established method for finite element analysis (FEA) in this field, its methodological validity has been fully verified through 2D/3D model comparisons and relevant studies on similar aviation seals. Wu et al. established a 2D axisymmetric finite element model for the VL seal ring of aviation actuators using ABAQUS, simulating fluid pressure penetration and lip contact pressure distribution under a high pressure of 35 MPa. They accurately obtained stress–strain nephograms and contact width data. The results provide core parameters for the engineering application of high-pressure VL seals in aviation, directly verifying the suitability of the axisymmetric model for VL seals.
In order to evaluate the sealing performance of VL seals for aviation actuators, Peng et al. conducted a comparative analysis of the 2D and 3D models from four aspects: peak contact pressure, contact pressure distribution and effective sealing contact width, seal stress distribution characteristics, and computational efficiency. The results demonstrate that the 2D axisymmetric model is capable of yielding results that are highly consistent with those obtained from the 3D model [25].
2.1.2. Analysis of Static Contact Performance of VL Seal Based on Experiment
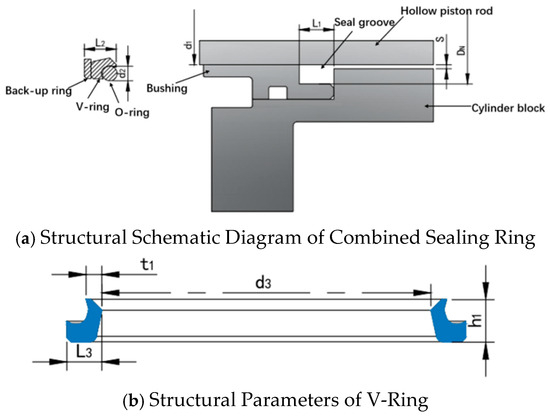
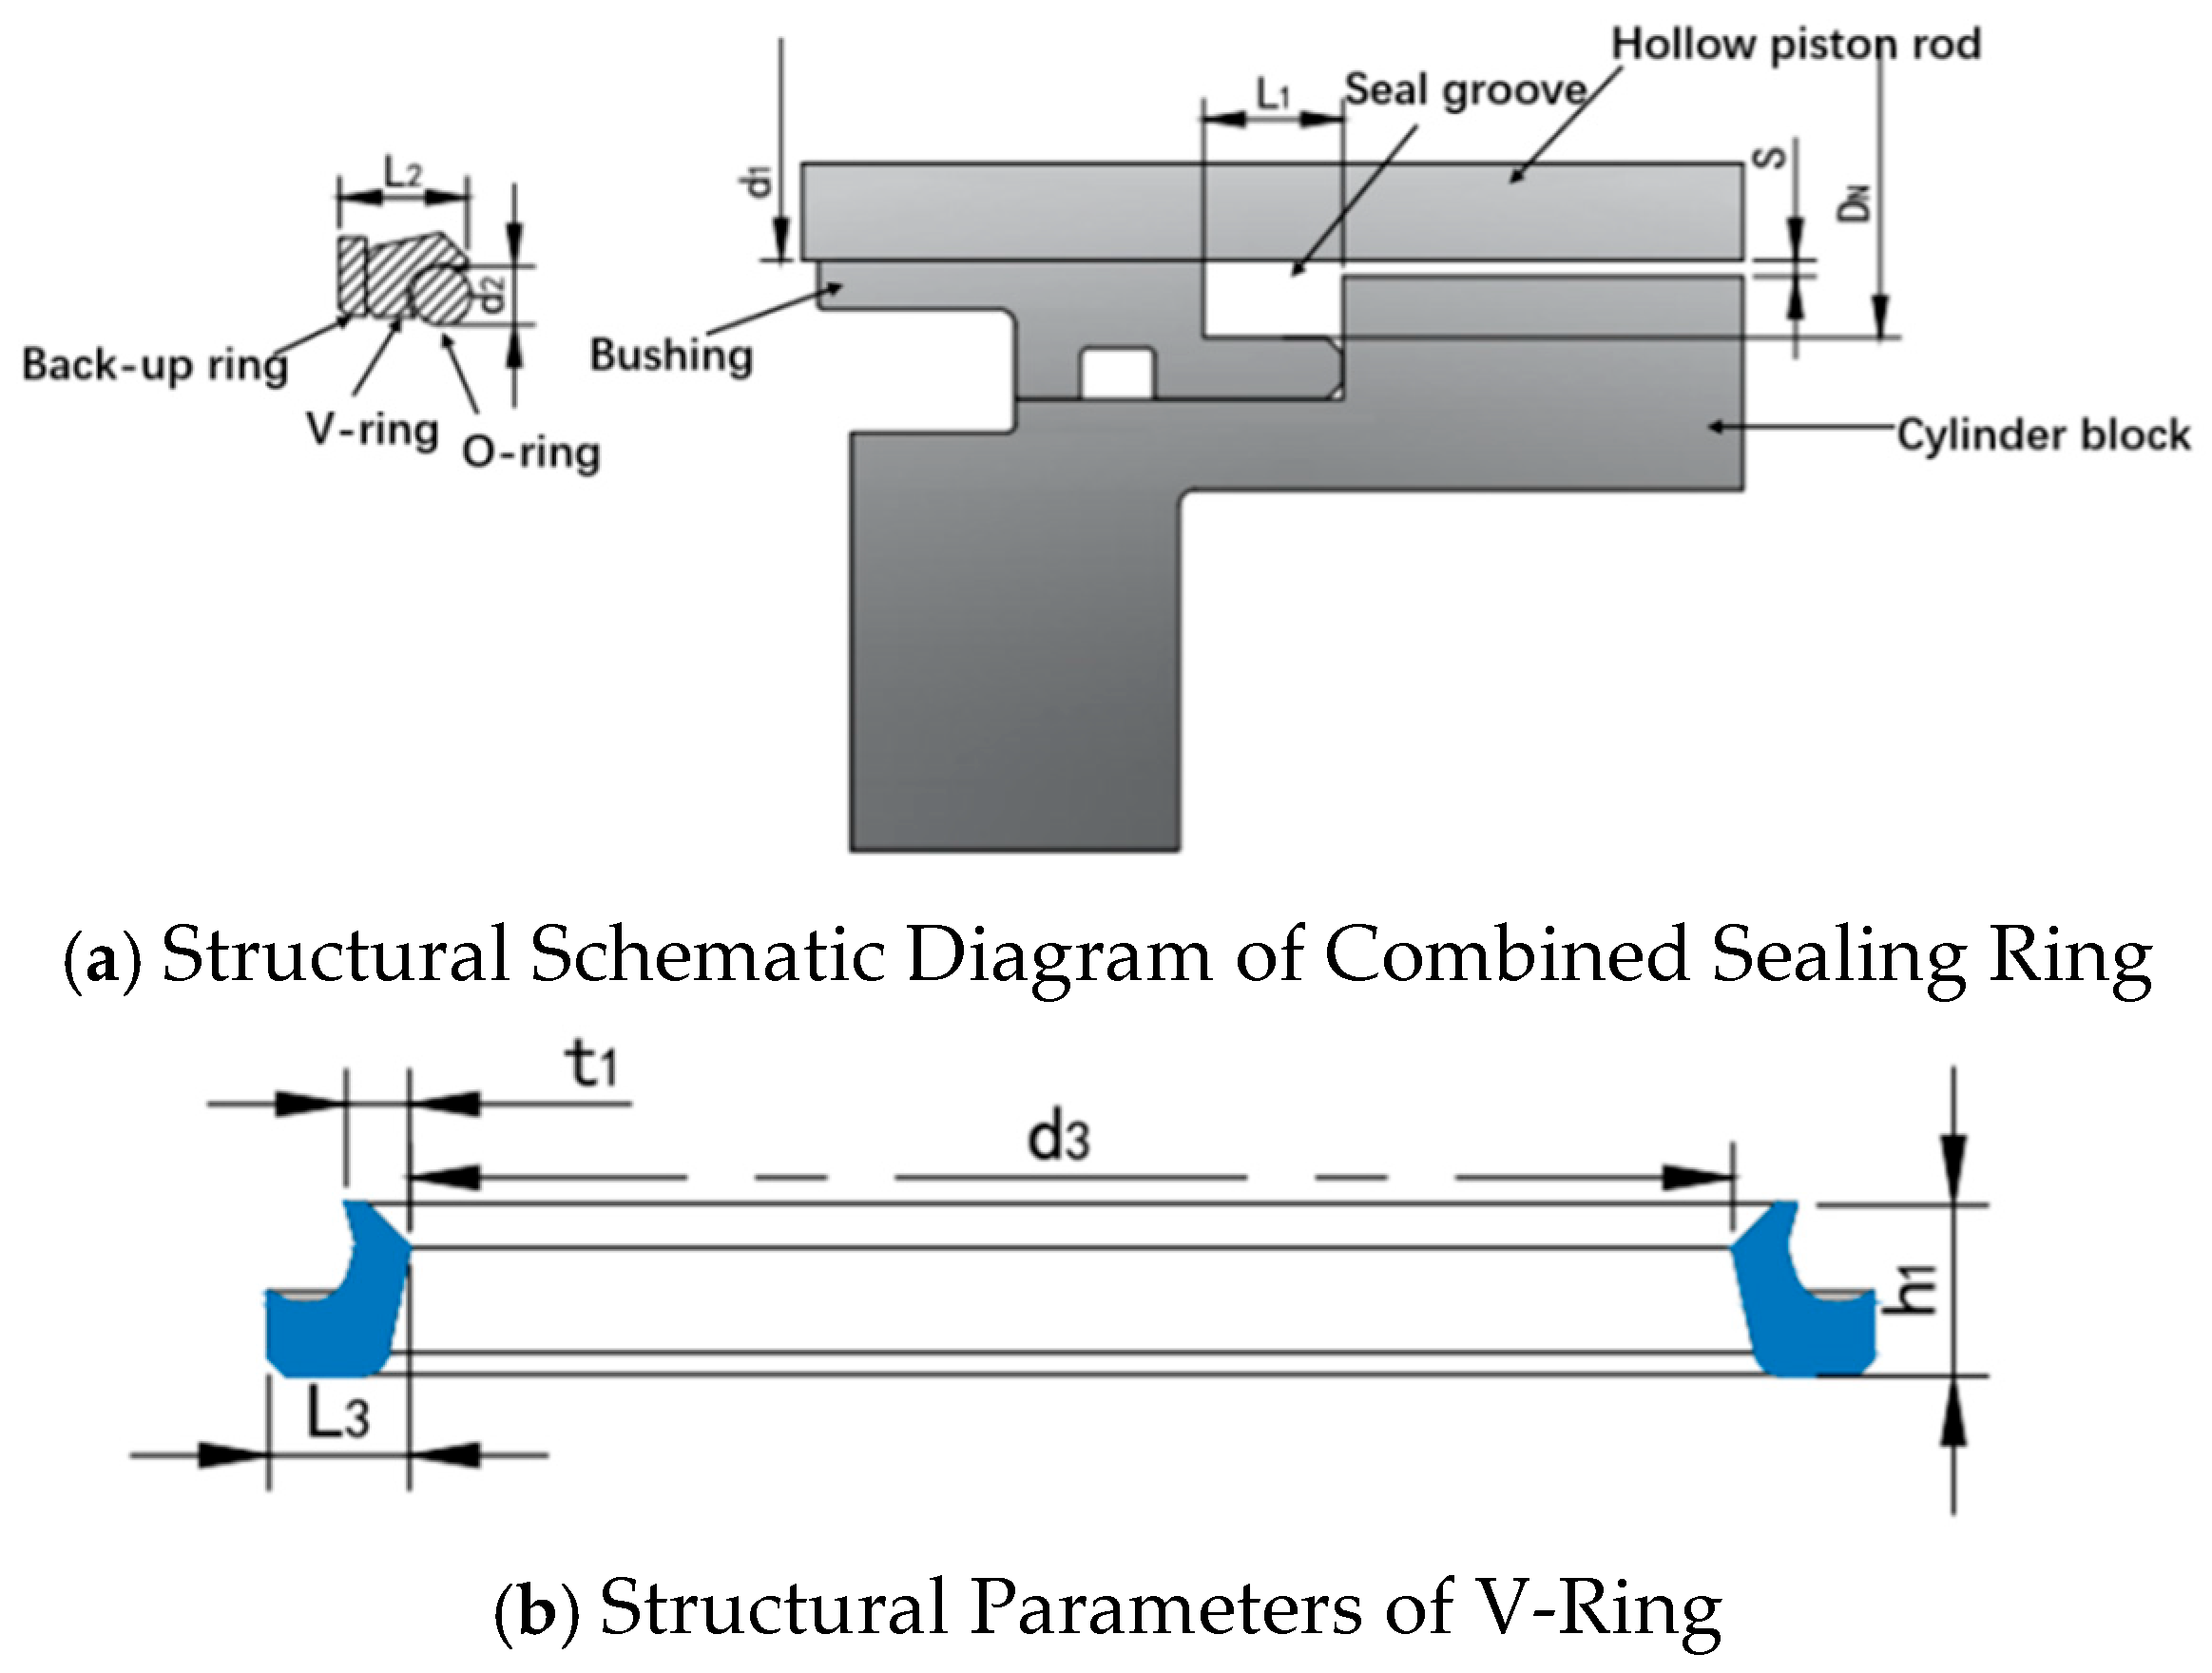
As shown in Figure 5, the main structural parameters of the VL seal are presented herein. In this study, t1 is 2.3 mm, the installation dimension of the sealing groove DN − d1 = 5.1 mm, the cross-sectional diameter of the O-ring d2 = 3.6 mm, the distance from the axis of symmetry to the outer wall of the piston rod d1 = 24 mm, the distance from the axis of symmetry to the bottom of the sealing groove DN = 28.7 mm, the width of the sealing groove L1 = 8.5 mm, the initial width of the combined sealing ring L2 = 8.1 mm, the inner diameter of the V-ring d3 = 48 mm, the width of the V-ring L3 = 5.1 mm, and the height of the V-ring h1 = 6.2 mm.
Figure 5.
Structural schematic diagram of the VL seal.
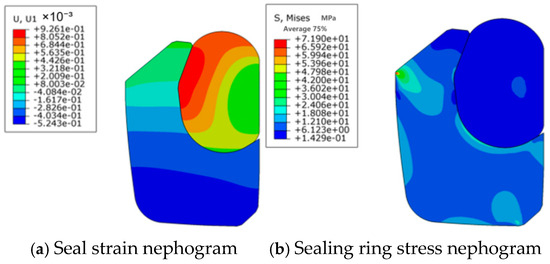
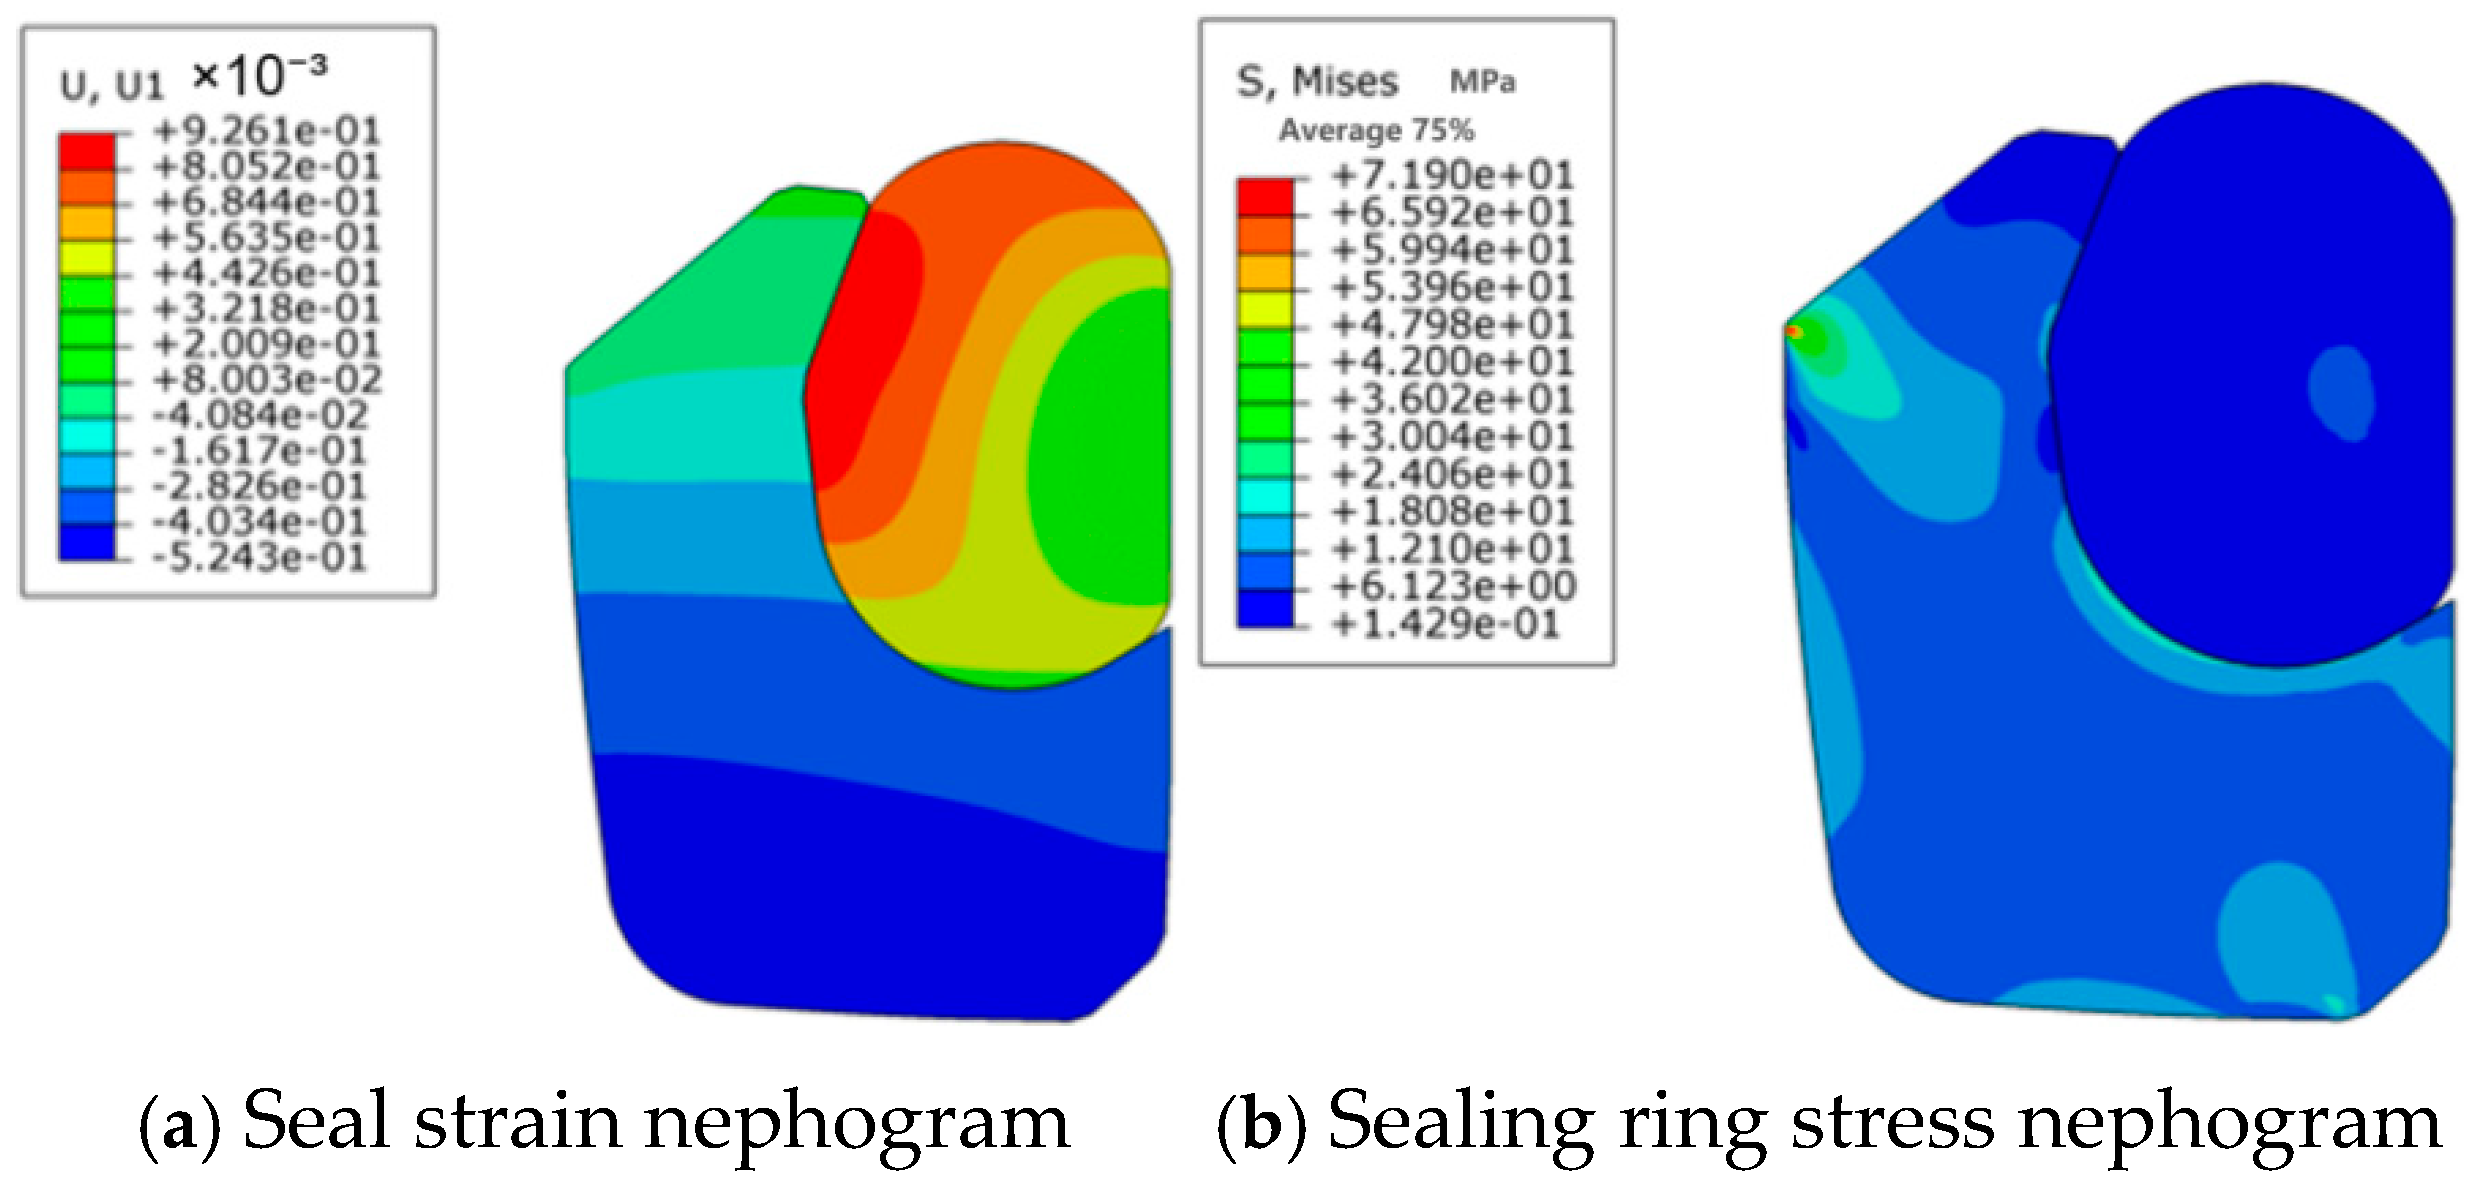
Under the conditions of a reciprocating velocity of 10 mm/s and an oil pressure of 2 MPa, the strain nephogram of the VL seal during the extension stroke obtained via ABAQUS finite element simulation analysis is shown in Figure 2, Figure 3, Figure 4, Figure 5 and Figure 6a, and the internal stress distribution of the VL seal is shown in Figure 2, Figure 3, Figure 4, Figure 5 and Figure 6b.
Figure 6.
Strain nephogram of the VL seal.
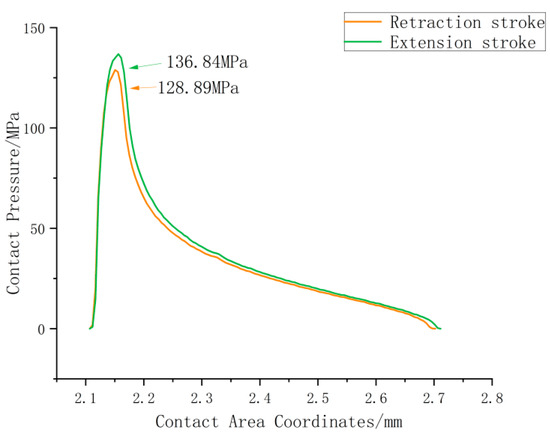
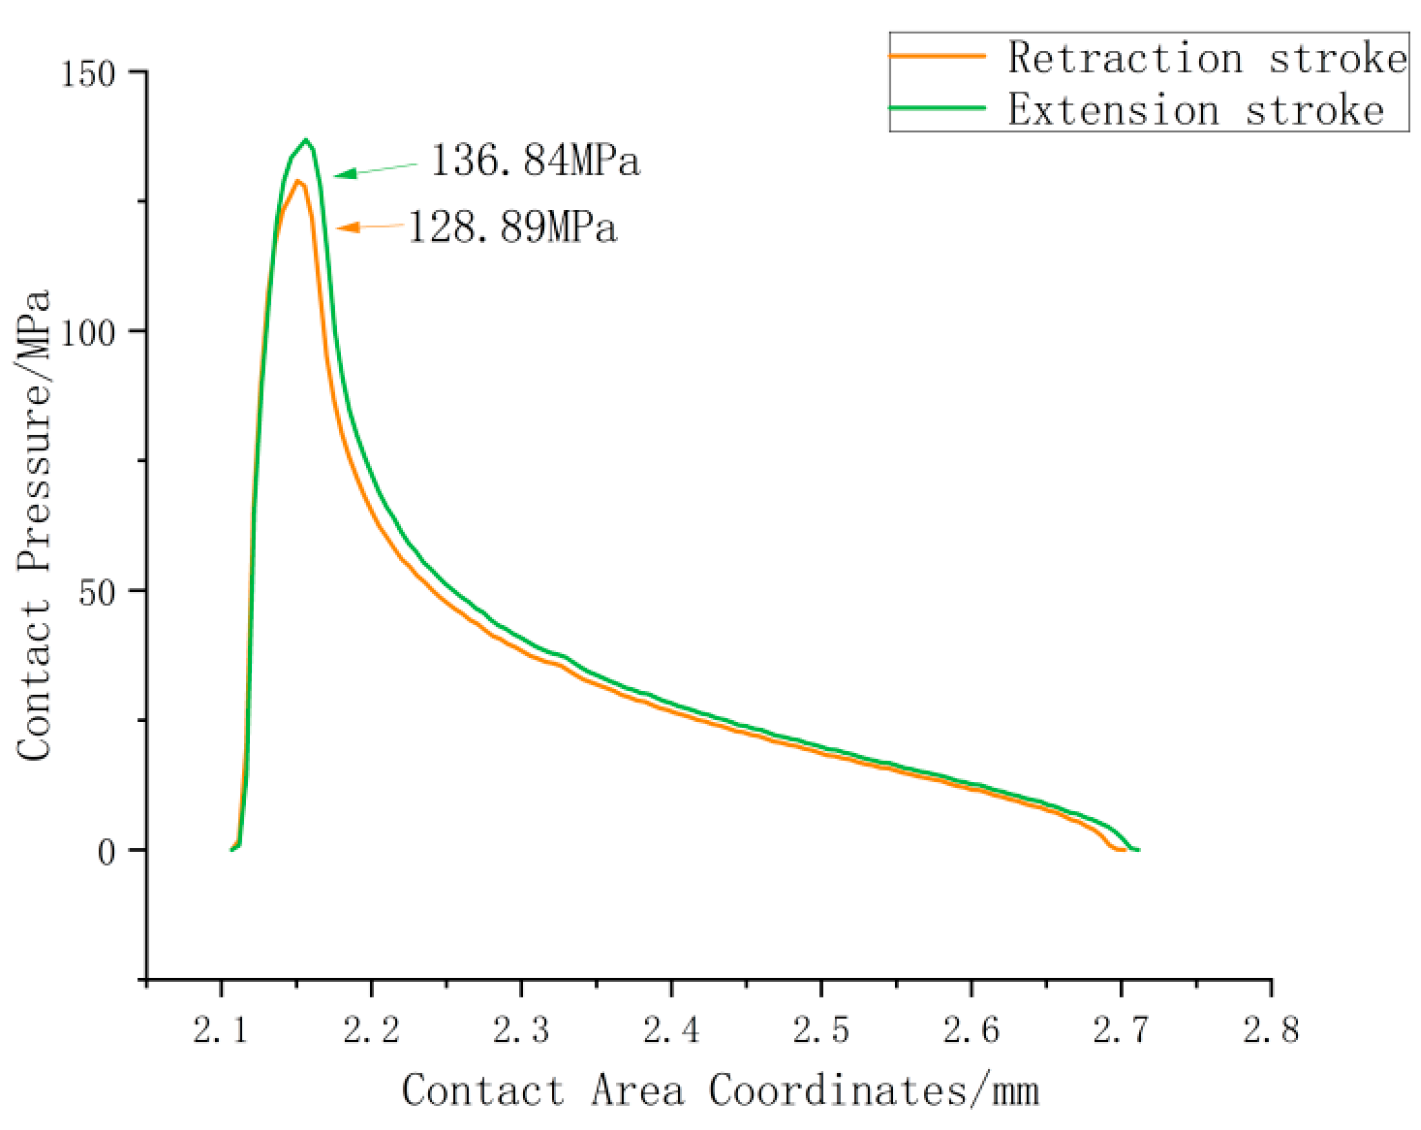
The contact pressure and its distribution in the VL seal structure are shown in Figure 7. The maximum contact pressure occurs at the lip of the V-ring, with the maximum contact pressure being 136.84 MPa during the extension stroke and 128.89 MPa during the retraction stroke.
Figure 7.
Contact pressure distribution of the VL seal.
This result essentially reflects the differences in the stress state, contact morphology, and medium interaction mode of the VL seal in the aviation actuator during the extension stroke and retraction stroke. These differences are related to the structural characteristics of the VL seal, the force transmission logic induced by the movement direction, and the working condition adaptability. A brief explanation is given as follows:
First, the structural design of the VL seal features the property of unidirectional stress reinforcement. In the VL seal, the V-ring serves as the primary sealing element, and the wedge-shaped structure of its cross-section has a self-tightening effect: when the seal is subjected to medium pressure or axial force generated by movement, the wedge-shaped surface will fit closely with the sealing contact surface, and the higher the pressure, the tighter the fit. During the extension stroke, the actuator piston rod extends outward, and the direction of relative movement between the seal and the piston rod is exactly consistent with the stress direction of the self-tightening wedge-shaped surface of the V-ring: the axial tensile force generated by the movement will further squeeze the V-ring, making its wedge-shaped surface press more tightly against the sealing mating surfaces (the outer surface of the piston rod and the inner wall of the seal chamber), thus significantly increasing the contact pressure. In contrast, during the retraction stroke, the piston rod retracts inward, and the movement direction is opposite to the stress direction of the self-tightening wedge-shaped surface of the V-ring. The squeezing effect of the axial thrust on the V-ring is weak, and it may even slightly reduce the degree of fit, resulting in a peak contact pressure lower than that during the extension stroke.
Second, there is a directional difference in the medium pressure superposition effect during reciprocating movement. When the aviation actuator operates, the interior of the seal chamber is usually filled with media such as hydraulic oil or compressed gas, and the medium pressure acts on the seal to assist in enhancing the sealing effect. During the extension stroke, the working chamber of the actuator (the chamber that pushes the piston rod to extend) is in a pressurized state, and the medium pressure directly acts on the opening side of the V-ring of the VL seal, forming a superposition with the axial force induced by movement. Together, they push the V-ring to press against the sealing surface, further amplifying the peak contact pressure. On the contrary, during the retraction stroke, the pressurized chamber switches to the other side, and the direction of the medium pressure acting on the V-ring changes. At this time, the medium pressure tends to expand rather than compress the V-ring, and can only exert pressure on the sealing surface through indirect transmission, without forming an effective superposition with the movement force. Therefore, the peak contact pressure is lower.
2.1.3. Analysis of the Influence of Oil Pressure on the Static Contact Performance of the VL Seal
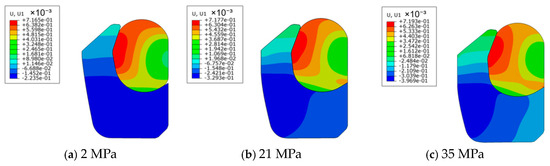
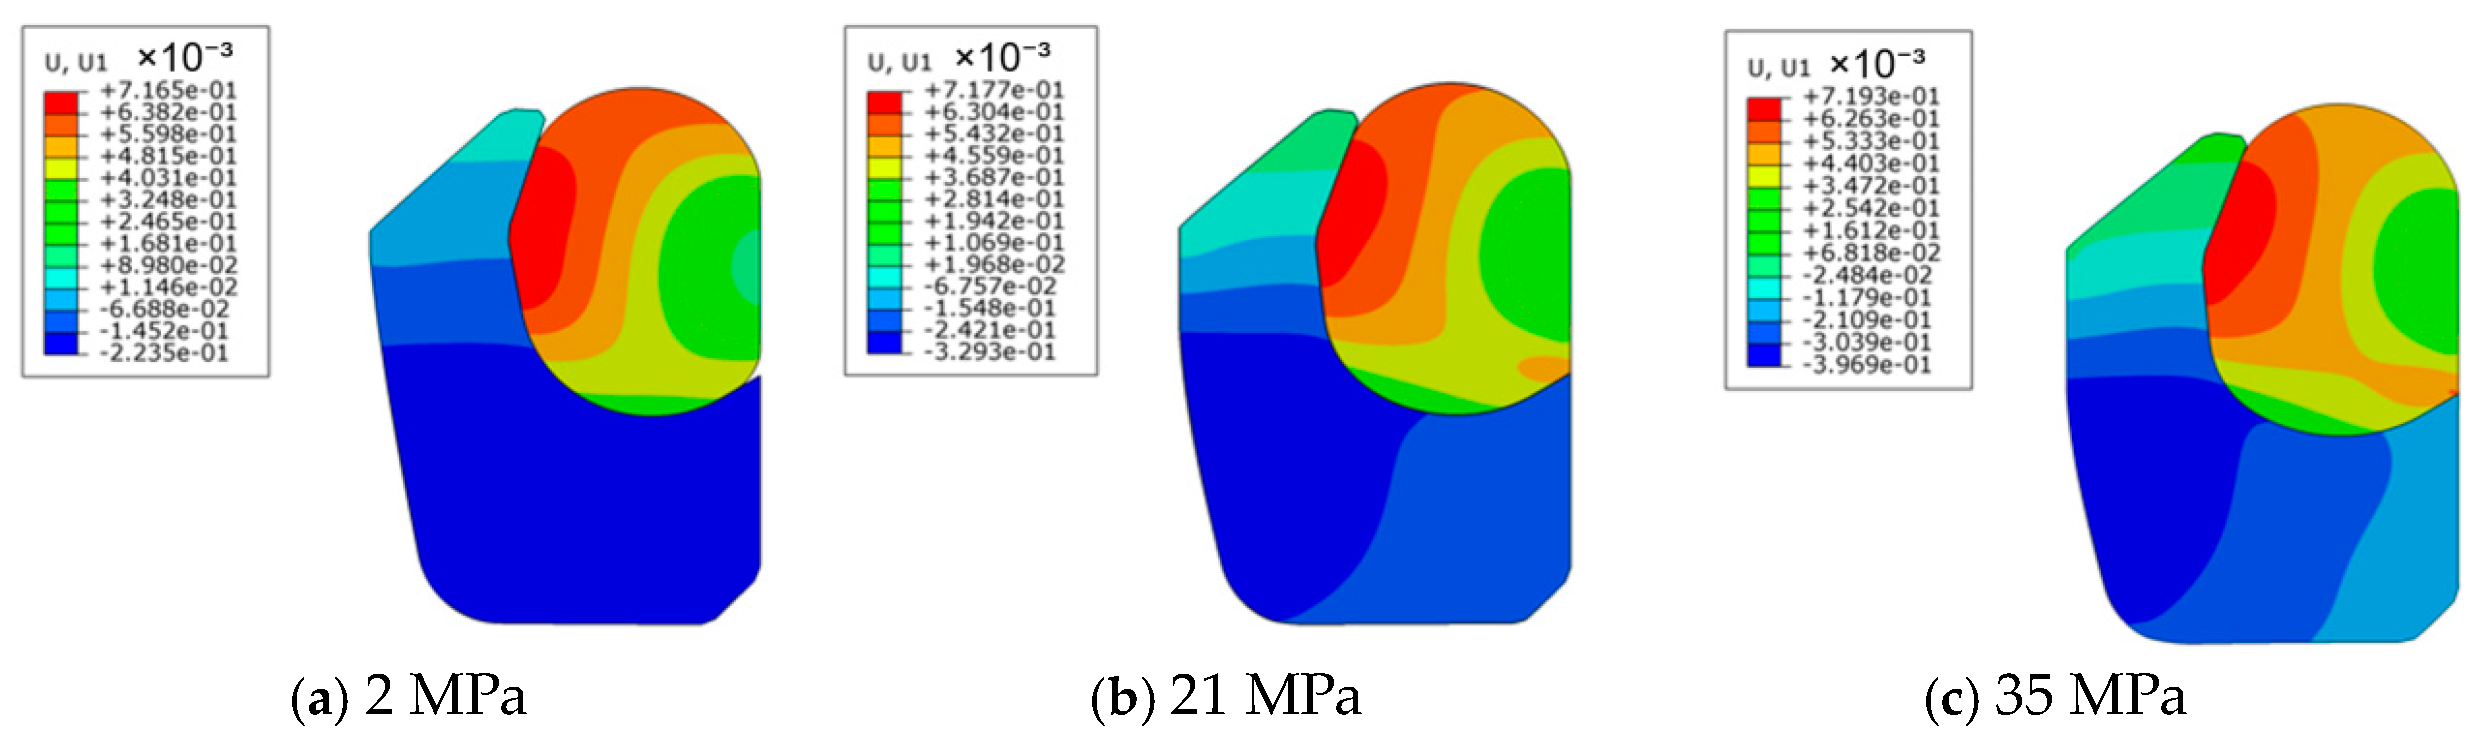
Under a velocity of 10 mm/s, the changes in the contact state of the VL seal were analyzed under fluid pressures of 2 MPa, 21 MPa, and 35 MPa, respectively, and the results are shown in Figure 8.
Figure 8.
Strain nephograms of the VL seal under three different oil pressures.
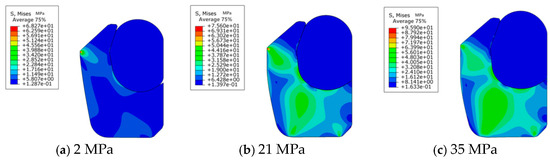
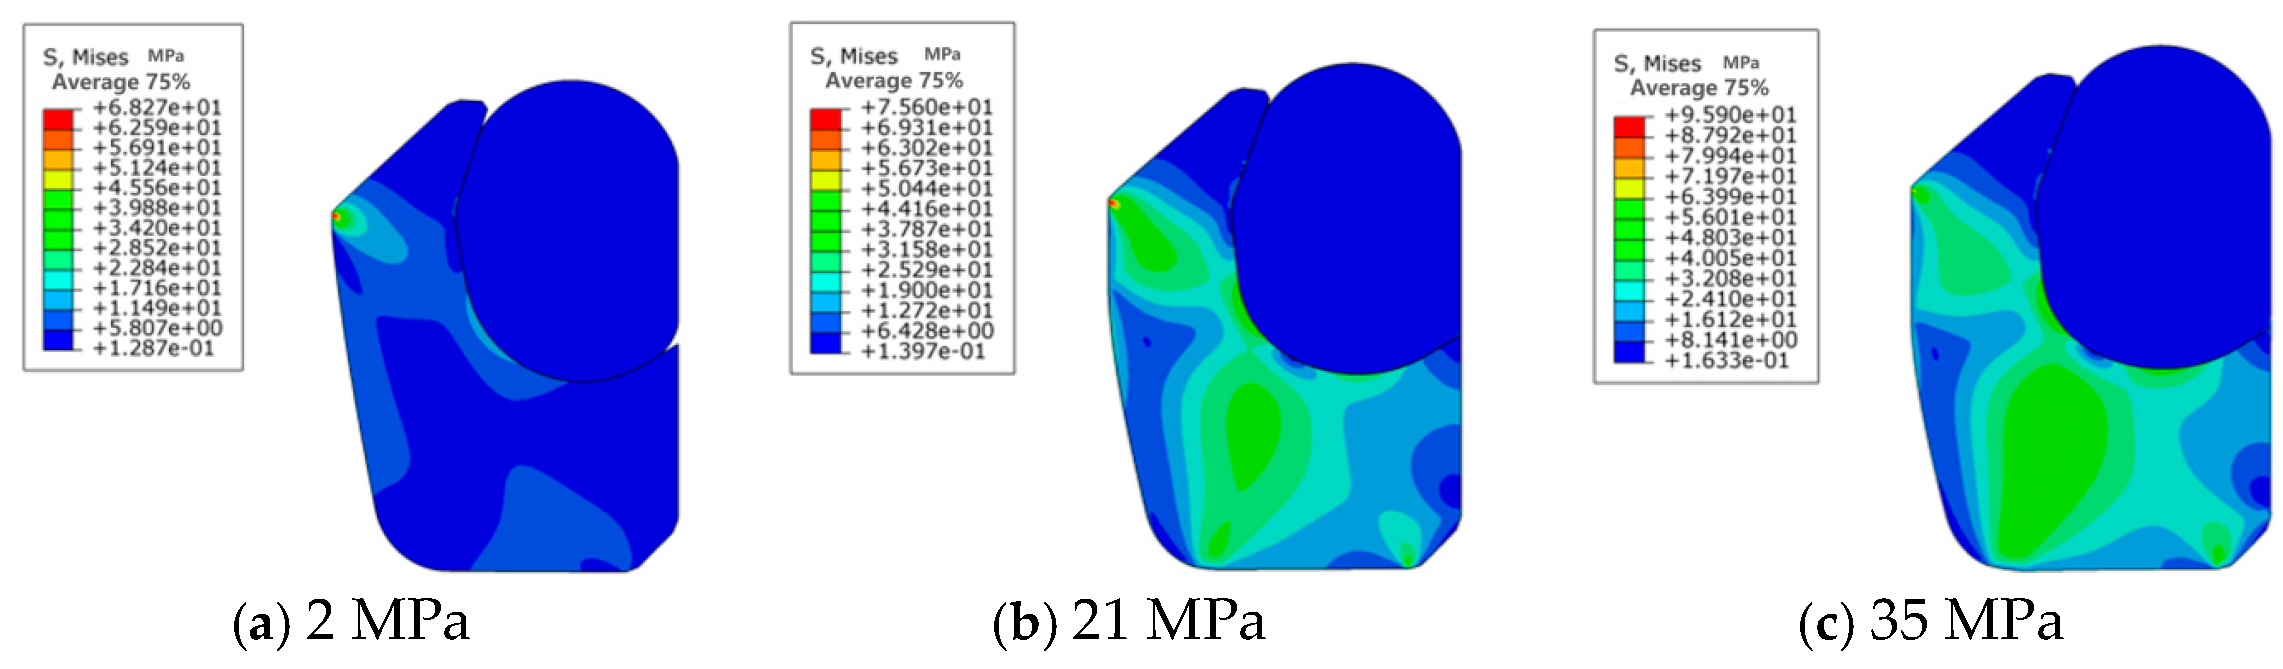
As shown in Figure 8, as oil pressure increases, the O-ring transmits the applied oil pressure to the lip of the V-ring, thereby subjecting the V-ring to a greater radial force and providing a higher overall contact pressure for the sealing structure. Under the action of different oil pressures, the sealing structure undergoes deformations of varying degrees, among which the deformation of the V-ring in the axial direction is relatively apparent. This is because the V-ring is compressed axially, significantly increasing its contact width with the main sealing surface. The deformation of the V-ring lip also causes the O-ring to be compressed to different extents. Under higher oil pressure, the O-ring deformation is greater, providing a better pressure-compensation effect. As shown in Figure 9, oil pressure has a relatively significant impact on the V-ring contact pressure. With increasing oil pressure, the distribution range of contact pressure inside the V-ring gradually extends from the lip to the secondary sealing surface at the bottom of the V-ring and to the contact interface with the O-ring, and the stress distribution becomes uniform accordingly. Combined with the geometric characteristics and load distribution, the causes of local maximum values observed in the aforementioned analysis results are elaborated as follows: the local maximum values occur at the chamfered transition regions on the seal edges, which can be primarily attributed to stress concentration induced by geometric discontinuities and the relatively high contact pressure acting on these regions. Therefore, it is essential to refine the mesh density in such areas to enhance calculation accuracy, thus enabling a more distinct visualization of local stress peaks.
Figure 9.
Von Mises stress distribution of the VL seal under three different oil pressures.
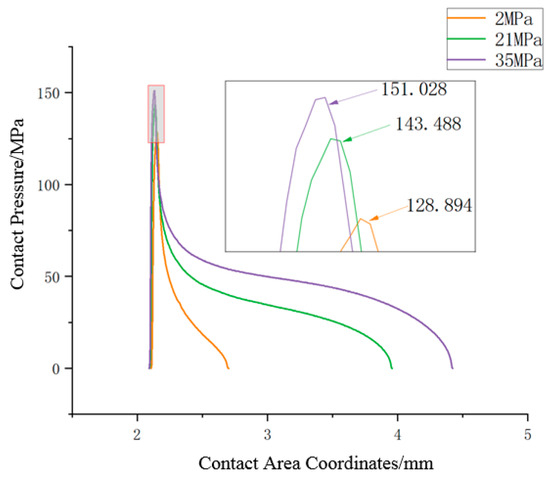
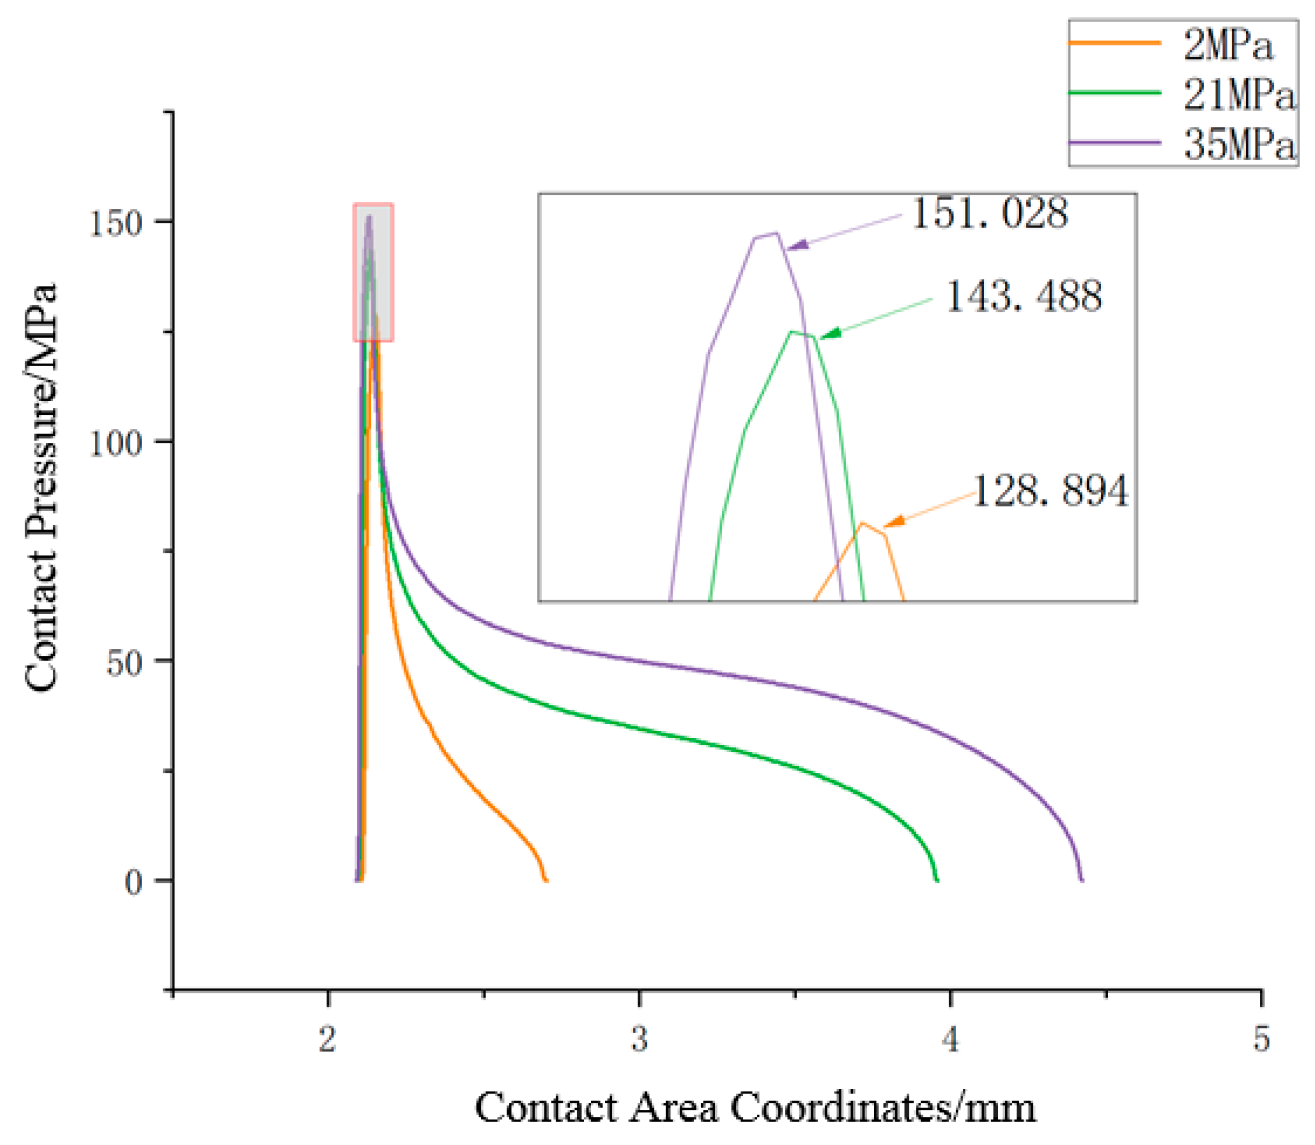
As shown in Figure 10, when oil pressure varies, there are significant differences in the contact area between the V-ring and the piston rod and in the maximum contact pressure. With increasing oil pressure, the sealing contact pressure increases. This indicates that the fluid pressure makes the contact between the sealing ring and the sealing interface tighter, and the load distribution area wider.
Figure 10.
Comparison of contact pressure distributions under three different oil pressures.
2.1.4. Analysis of the Influence of Reciprocating Stroke and Velocity on the Static Contact Performance of the VL Seal
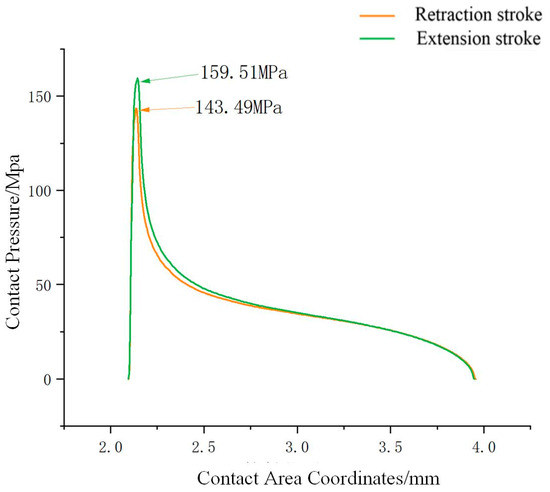
Under a reciprocating velocity of 10 mm/s and an oil pressure of 21 MPa, the contact pressure distributions of the extension stroke and retraction stroke were compared, and the results are shown in Figure 11.
Figure 11.
Comparison of contact pressure distributions under a pressure of 21 MPa.
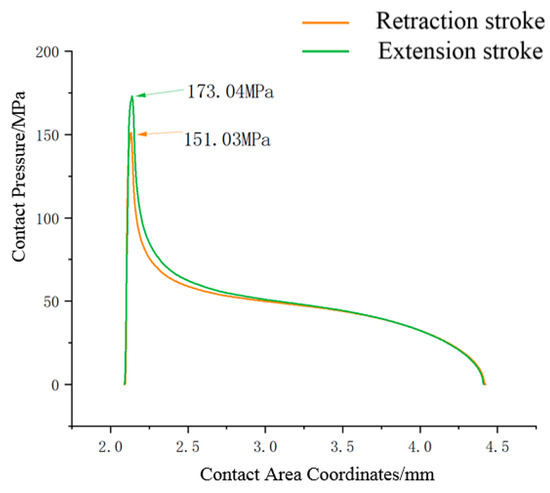
Under a reciprocating velocity of 10 mm/s and an oil pressure of 35 MPa, the contact pressure distributions of the extension stroke and retraction stroke were compared, and the results are shown in Figure 12.
Figure 12.
Comparison of contact pressure distributions under 35 MPa.
From Figure 11 and Figure 12, it is evident that there are significant differences in contact pressure magnitude and contact width between the extension and retraction strokes. These differences will lead to variations in oil film thickness during extension and retraction strokes, which, in turn, affect the dynamic contact performance of the entire sealing system.
The analysis results for the maximum contact pressure and contact width of the seal obtained at three different velocities (10 mm/s, 200 mm/s, and 500 mm/s) are shown in Table 3.
Table 3.
Analysis results for maximum contact pressure and contact width at different velocities.
From Table 3, it can be observed that the fluctuations in the maximum contact pressure and contact width of the VL seal at different velocities are less than 1%. Therefore, velocity is not the main factor affecting the static contact performance of the VL seal.
2.2. Analysis of the Dynamic Contact Performance of the VL Seal
During the reciprocating motion of the VL seal in an aerospace actuator, a complete hydrodynamic oil film cannot be formed. The sealing interface exhibits coexistence of fluid lubrication and direct contact between solid asperities, thus operating under a mixed lubrication regime. The primary influencing factors for this phenomenon are summarized as follows: (1) Dynamic variations in operating conditions: The aerospace actuator operates under airborne conditions characterized by high pressure, a wide temperature range, and fluctuating reciprocating velocities. During the low-speed start-up stage, the hydrodynamic effect is weak, making it difficult to form a continuous oil film. At high reciprocating speeds, the oil film thickness increases, but elevated temperatures reduce the viscosity of hydraulic oil, leading to decreased load-carrying capacity of the oil film. This prevents complete isolation of the sealing surfaces, ultimately resulting in a mixed state where oil film lubrication and solid contact coexist. (2) Microscopic roughness characteristics of the sealing interface: Both the lip of the VL seal and the surface of the piston rod possess microscopic roughness. Only 1%~10% of the apparent contact area corresponds to the actual contact between solid asperities. Even when a micron-scale lubricating oil film is present, direct contact between asperities still occurs. The oil film fills the valleys between asperities, forming a mixed lubrication structure consisting of fluid lubrication and dry friction/boundary lubrication. (3) Structural and mechanical properties of the VL seal: The VL seal adopts a lip seal structure, which achieves sealing via contact pressure generated by pre-compression. The elastic contact between the seal lip and the piston rod can cause local rupture of the oil film. Meanwhile, the viscous wedge effect induced by reciprocating motion only forms a thin oil film locally, failing to cover the entire sealing interface, which further intensifies the characteristics of mixed lubrication. (4) Effects of thermal factors and medium properties: Heat generated by reciprocating friction alters the viscosity of hydraulic oil and accelerates oil film cavitation. Additionally, the rheological properties of aerospace hydraulic media are highly sensitive to pressure and temperature changes, which impairs the stability of the oil film required for pure hydrodynamic lubrication. This ultimately manifests as a mixed lubrication operating condition [17].
The G-W model is a classic model for describing the micro-contact of rough surfaces and is widely applied in the mixed lubrication analysis of VL seals. Its core applicability stems from the high degree of matching between the model characteristics and the operating conditions as well as interface features of VL seal mixed lubrication [11].
In the theoretical analysis of mixed lubrication for reciprocating dynamic sealing systems, three key mechanical parameters need to be considered comprehensively: the static contact pressure caused by the macroscopic deformation of the sealing ring, the fluid film pressure generated by the hydrodynamic pressure effect, and the asperity contact pressure induced by the action of micro-surface topography. When the system is in a mixed lubrication state, its dynamic equilibrium condition must satisfy the following mechanical relationship:
2.2.1. Analysis Process of Dynamic Contact Performance of Sealing Rings Based on Fluid–Structure Interaction
The static contact pressure distribution curve obtained from FEA is used as input to the hydrodynamic analysis for subsequent calculations.
- (1)
- Fluid–Structure Interaction Analysis
Fluid mechanics is used to analyze the oil film thickness in the sealing contact area and, based on this, calculate the leakage rate to determine whether the sealing ring meets the sealing requirements. In this paper, the one-dimensional Reynolds equation is used to describe the film thickness and pressure distribution at the planar sealing interface:
where h is the oil film thickness on the sealing contact surface, u is the reciprocating speed of the piston rod during reciprocating motion, μ is the viscosity of the oil, and p is the initial pressure distribution on the sealing contact surface, which is obtained through finite element simulation analysis. Equation (3) can be transformed into
where ho is the oil film thickness at the position where , which is the position where the pressure is the greatest. Substituting Equation (4) into Equation (3):
The film thickness at the inflection point I can be calculated from
By substituting Equation (6) into Equation (4), the relationship between ho and hI can be obtained.
Using Equation (4) with nondimensional variables λ and H(x), the equation to calculate the distribution of the oil film can be obtained:
As shown in Equation (9), the Reynolds equation was developed as a cubic algebraic equation for film thickness. The imaginary root must be correctly identified and solved when calculating the root of a cubic polynomial. Otherwise, convergence to the correct solution may not be possible owing to numerical instability. The type set of roots of the cubic polynomial is governed by A in Equation (8); i.e., it depends on the value of the pressure gradient at a specific position x. The solution to the above cubic equation can yield either three real roots or one real root plus two complex conjugate roots. Since the oil film thickness cannot be negative, only positive real roots are physically acceptable. Therefore, negative values are neglected in the solution process, and the distribution curves of the two positive roots are plotted [26].
- (2)
- Contact Mechanics Analysis
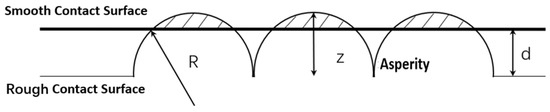
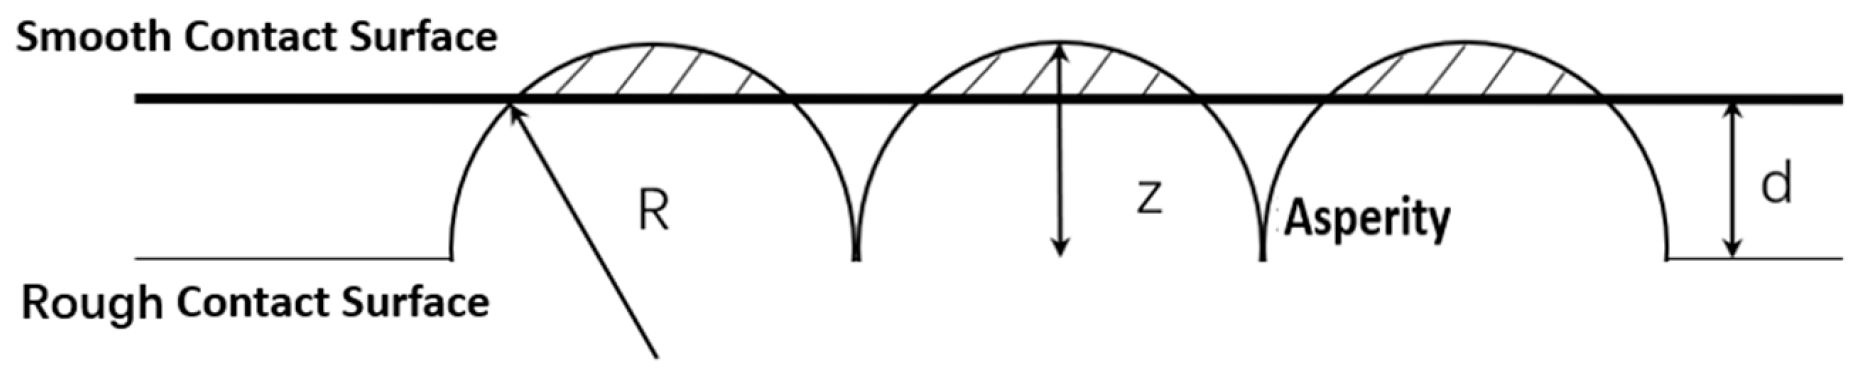
According to the asperity theory, when two solid surfaces come into contact with each other, real mechanical contact occurs only at the tops of discrete micro-protrusions in the apparent contact area due to the influence of surface roughness [27], as shown in Figure 13.
Figure 13.
Analysis of rough contact in the sealing contact area.
Contact mechanics analysis is performed using the Greenwood–Williamson (G-W) model. The calculation formula for the contact pressure Pcon is as follows: z denotes the height of a single asperity, d represents the gap width of the sealing contact surface, σ is the root mean square (RMS) of surface roughness, η stands for the asperity density, R is the radius of the asperities, E and v are the elastic modulus and Poisson’s ratio of the stretchy material, respectively, and ϕ(z) is the height value of each asperity [28].
Let the empirical friction coefficient be f; the asperity shear stress per unit area τf can be expressed as
- (3)
- Fluid–Structure Interaction Analysis and Friction Force Calculation
The total friction force F is composed of the oil film friction force Ff on the surface of the piston rod and the friction force Fc generated by asperity contact:
According to Newton’s Law of Viscosity, the calculation formula for the magnitude of the viscous friction force on the surface of the piston rod is as follows:
In Formula (8), b represents the effective contact area.
Based on the asperity shear stress formula obtained from Equation (6), and by combining it with Equations (7) and (8), the formula for the total friction force F is as follows:
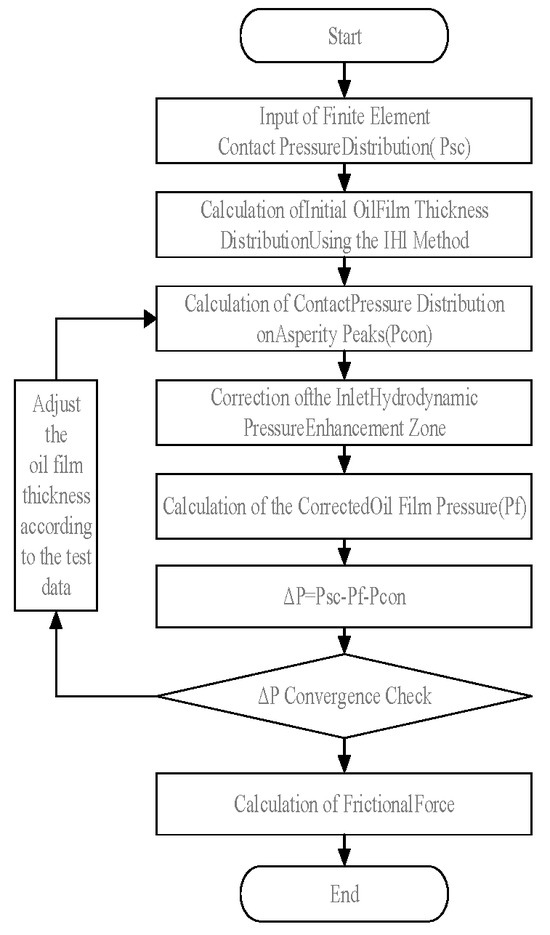
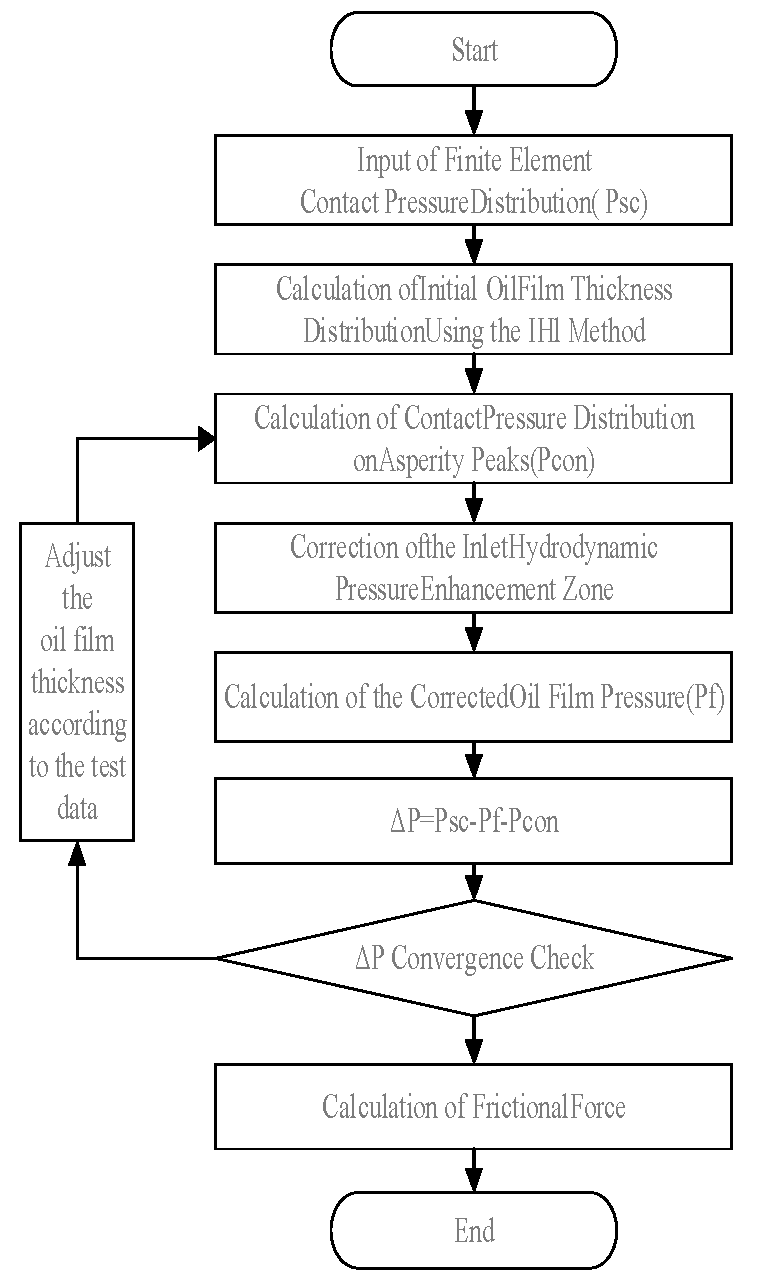
As shown in Figure 14, the friction force calculation process is based on the fluid–structure interaction model.
Figure 14.
Friction force calculation process.
By inputting the contact pressure distribution obtained from FEA into the analysis above, the analysis can calculate parameters such as oil film thickness, friction force, and leakage rate under different working conditions. Furthermore, the dynamic contact performance of the VL seal can be analyzed using these parameters.
2.2.2. Analysis of Dynamic Contact Performance of the VL Seal Based on Experiment
- (1)
- Analysis of the Influence of Oil Pressure on the Dynamic Contact Performance of the VL seal
As shown in Table 4, this section presents a comparative analysis of the friction force of the VL seal during the retracting and extending strokes within the sealing contact area under different oil pressures at a speed of 10 mm/s.
Table 4.
Calculation results for friction force under different pressures (10 mm/s).
As shown in Table 4, when the reciprocating velocity is held constant, the sealing friction force increases sharply with increasing oil pressure. This is mainly because both the maximum sealing contact pressure and the contact width increase significantly with the oil pressure. In the comparison of different stages of the reciprocating stroke, the friction force during the extending stroke is greater than that during the retracting stroke under various pressures, which indicates that the resistance generated by the internal shear flow of the oil is greater during the extending stroke.
- (2)
- Analysis of the Influence of Reciprocating Velocity on the Dynamic Contact Performance of the VL seal
As shown in Table 5, this section presents a comparative analysis of the VL seal’s friction force during retracting and extending strokes within the sealing area at different velocities at an oil pressure of 2 MPa.
Table 5.
Friction force under different reciprocating speeds.
As seen in Table 4, as the reciprocating velocity increases, the friction force in both the extending and retracting strokes decreases; the higher the velocity, the smaller the friction force. This indicates that the fluid lubrication effect in the sealing contact area is significantly improved with increasing reciprocating velocity.
3. Experimental Research
Experimental verification is the key to connecting simulation analysis and engineering applications. Its core goals are to reproduce real service scenarios through physical experiments, verify the validity of simulation results, conduct quantitative analysis on the variation law of friction force of the VL seal under different pressure working conditions, and provide a theoretical basis for the optimization of aircraft landing gear seals.
3.1. Experimental Method
The test rig was built according to typical landing gear working conditions (reciprocating speeds of 10 mm/s, 200 mm/s, and 500 mm/s; oil pressures of 2 MPa, 21 MPa, and 35 MPa) and compared with theoretical analysis results.
3.1.1. Friction Force Test
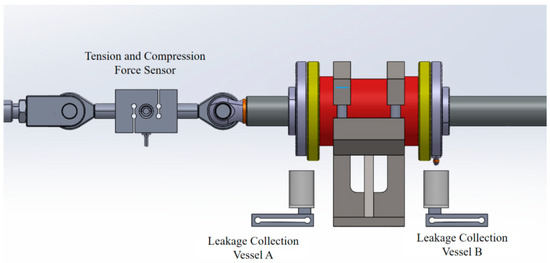
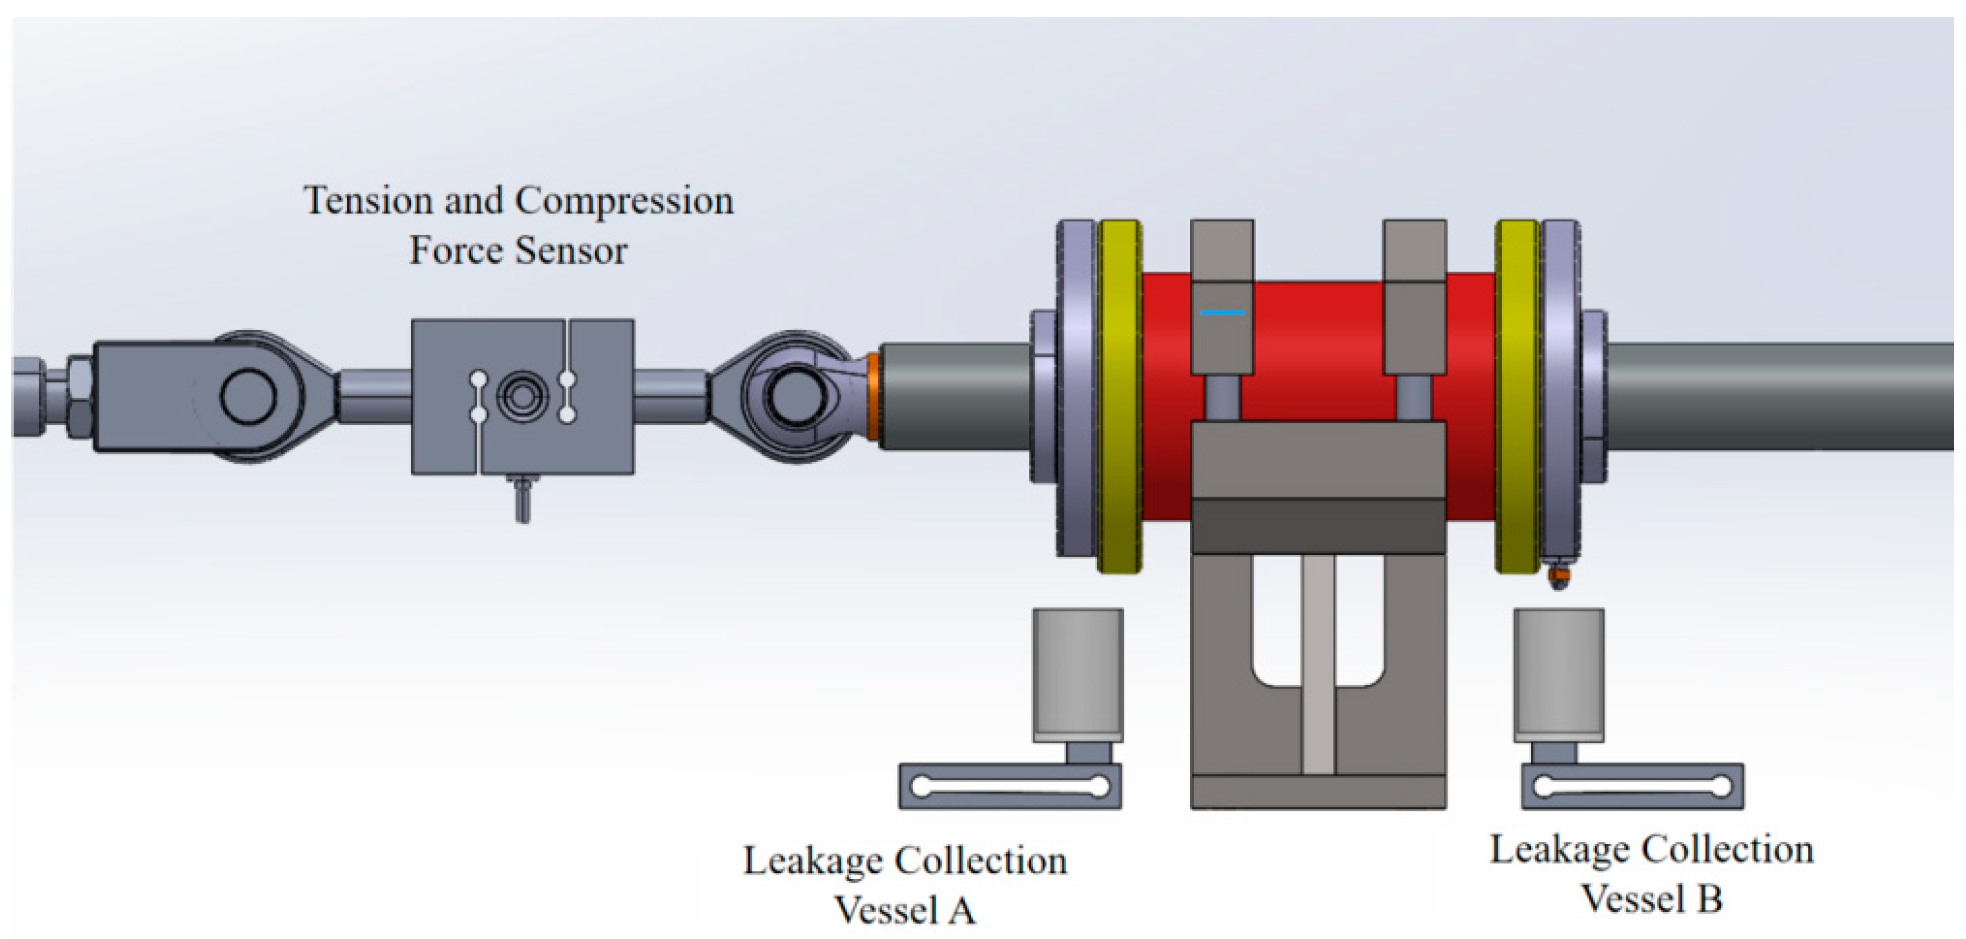
As shown in Figure 15, the friction force test device is mainly composed of the following parts:
Figure 15.
The test device.
- (1)
- Reciprocating motion drive system: A reciprocating motion platform driven by a servo motor is adopted (DORNA, 220V, 2000W), which can realize the reciprocating motion of the piston rod. The motion speed can be adjusted to 10 mm/s, 200 mm/s, or 500 mm/s, and stroke accuracy is controlled to ±0.01 mm to simulate working conditions with different reciprocating speeds.
- (2)
- Pressure loading system: A manual pressure pump is used (Enerpac P2282), which can apply fluid pressure within the range of 0–50 MPa.
- (3)
- The cylinder barrel is made of aluminum bronze (QAL10-3-1.5-R), and the piston rod is made of high-performance alloy 30CrMnSiNiA. A detachable sealing groove is installed in the cavity for fixing the VL seal.
- (4)
- A tension and compression force sensor (NS-WL1 Shanghai Tianmu Co., Shanghai, China) collects the friction force data of the VL seal. The sensor has a measuring range of 20 kN, accuracy class of 0.02, and sampling frequency of 2.3 kHz.
- (5)
- The oil temperature is monitored by a fiber Bragg grating (FBG) sensor (Shangong Co., Ningbo, China) embedded inside the piston rod. The leakage is collected by vessel and then measured using an analytical balance with a precision of 0.1 mg (one ten-thousandth of a gram).
After installing the VL seal, perform zero-point calibration on the tension sensor. Adjust the motor speed and oil pressure to the corresponding working conditions, then conduct the friction force test: under the conditions of normal temperature, 15# aviation hydraulic oil as the sealing medium, reciprocating speeds of 10 mm/s, 200 mm/s, and 500 mm/s, and reciprocating strokes of 50 mm and 200 mm, the VL seal is subjected to reciprocating tests for 10 strokes under oil pressures of 2 MPa, 21 MPa, and 35 MPa, respectively. Collect the friction force values and calculate the average. For each working condition, repeat the friction force test three times and take the average value.
3.1.2. Friction Coefficient Test of PTFE/Stainless Steel
To clarify the frictional properties of PTFE seals, this study fabricated PTFE specimens in accordance with the material formulation of VL seals, and subsequently conducted friction coefficient measurement tests on the PTFE specimens using a reciprocating friction and wear testing machine.
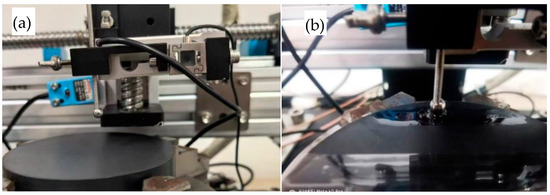
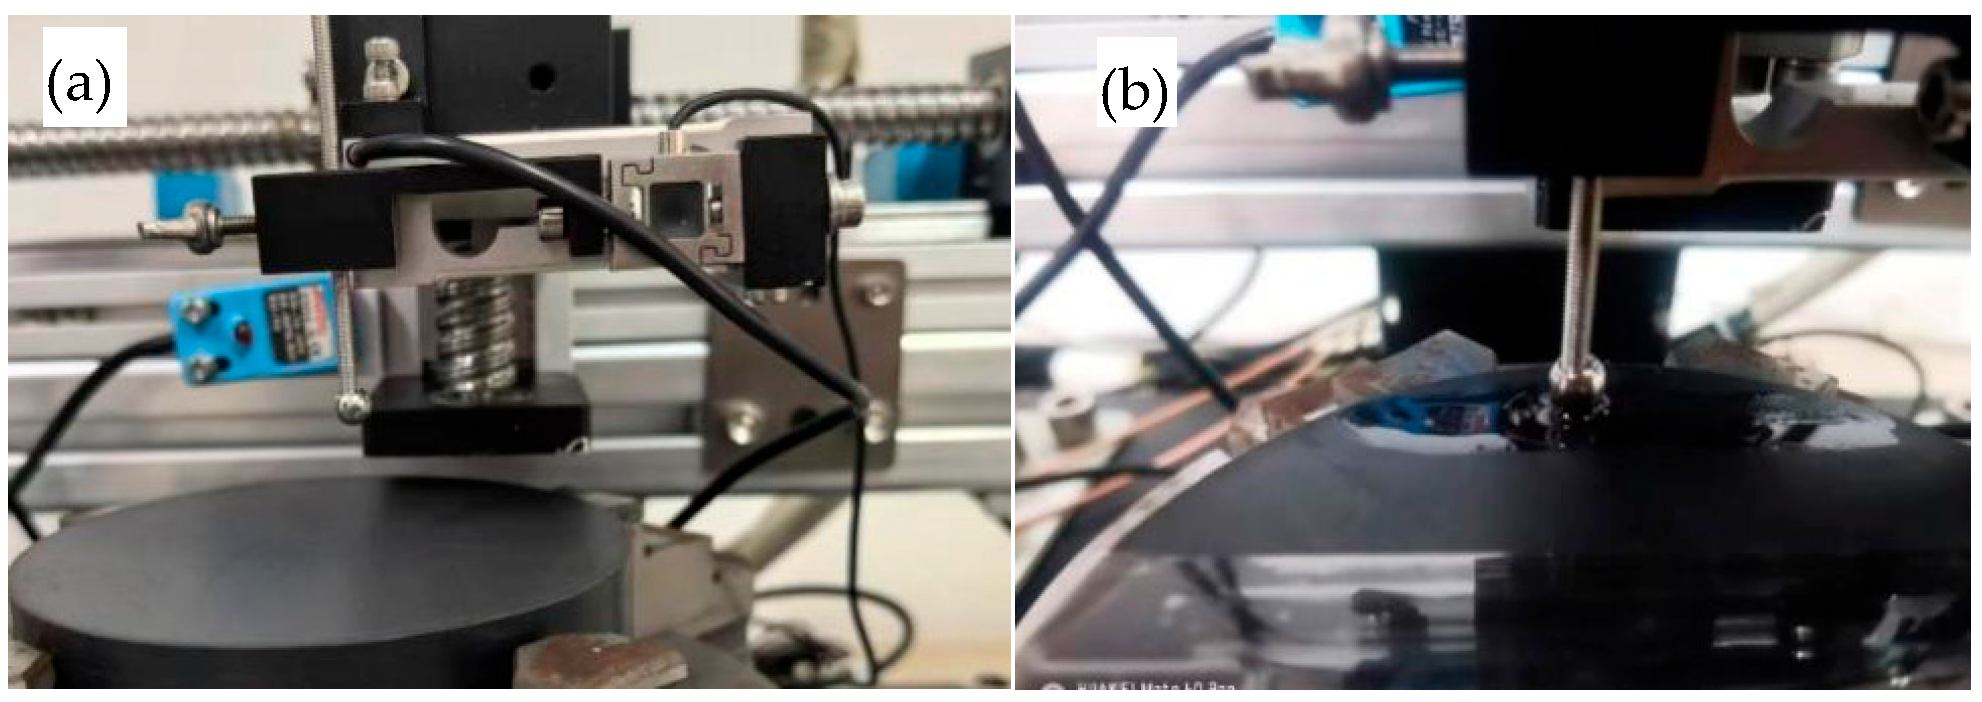
As shown in Figure 16, normal loads of 10 N, 20 N, and 30 N were applied between the PTFE specimen and the stainless steel ball, respectively, with a reciprocating speed of 10 mm/s, a reciprocating stroke of 50 mm, and a test duration of 15 min. The test results under dry friction conditions and with the addition of No. 15 Aviation Hydraulic Oil are presented in Table 6.
Figure 16.
Reciprocating friction coefficient test between PTFE specimens and stainless steel balls: (a) dry friction; (b) lubrication with No. 15 Aviation Hydraulic Oil.
Table 6.
Test results of PTFE friction coefficient.
The experimental results in Table 6 demonstrate that, for the PTFE/stainless steel friction pair lubricated with No. 15 Aviation Hydraulic Oil, the friction coefficients corresponding to various load conditions all fall within the range of 0.0424–0.0466. These values are significantly lower than that of the PTFE/stainless steel friction pair under dry friction conditions (0.0704), which proves that No. 15 Aviation Hydraulic Oil can form an effective lubricating film between the contact surfaces of the friction pair and greatly reduce the frictional resistance at the contact interfaces, and thus exhibits excellent lubrication compatibility.
The intrinsic mechanism by which the friction coefficient of PTFE increases with the rise in normal load can be analyzed by combining the elastohydrodynamic lubrication (EHL) theory, contact mechanics, and the material properties of PTFE. As the normal load increases, the extrusion effect between the contact surfaces is significantly enhanced, and the thickness of the lubricating film formed by No. 15 Aviation Hydraulic Oil decreases continuously. This leads to a substantial increase in the contact probability and contact strength of the asperities on the PTFE and stainless steel surfaces, which were originally effectively separated by the lubricating film, thus causing the proportion of boundary lubrication in the total frictional resistance to rise gradually. In the process of boundary lubrication, the frictional resistance between contact surfaces is mainly derived from strong interactions such as van der Waals forces and chemical bonding between surface atoms/molecules, whose resistance magnitude is much higher than the viscous shear resistance of fluid lubrication. Therefore, with the increase in the proportion of boundary lubrication, the overall friction coefficient shows an increasing trend.
3.2. Test Results
3.2.1. Test Results Analysis
Friction tests of the VL seal were conducted at different speeds under oil pressures of 2 MPa, 21 MPa, and 35 MPa. The results are presented in Table 7.
Table 7.
Friction test results of the VL seal.
A comparison with the simulated friction analysis results for the VL seal in the aforementioned Table 4 reveals that the friction force during the extension stroke is greater than that during the retraction stroke, whereas the empirical friction test data presented in Table 7 demonstrate the contrary trend: the friction force during the extension stroke is lower than that during the retraction stroke. This discrepancy arises from the gap between the idealized assumptions of the simulation model and the complex influencing factors of actual operating conditions: specifically, the simulation relies on a constant friction coefficient and idealized contact conditions, where friction is dominated by sealing contact pressure, whereas in practical tests, motion direction modulates lubricating film thickness, altering the friction coefficient, and this effect is compounded by factors like material viscoelasticity and assembly misalignment, ultimately making lubrication state the dominant factor for friction. The phenomenon also suggests that finite element simulations of VL seals should incorporate the dynamic friction coefficient of mixed lubrication models and the viscoelastic constitutive equations of materials to improve prediction accuracy under real-world conditions.
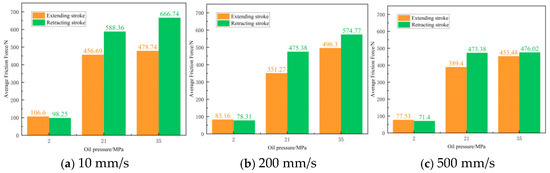
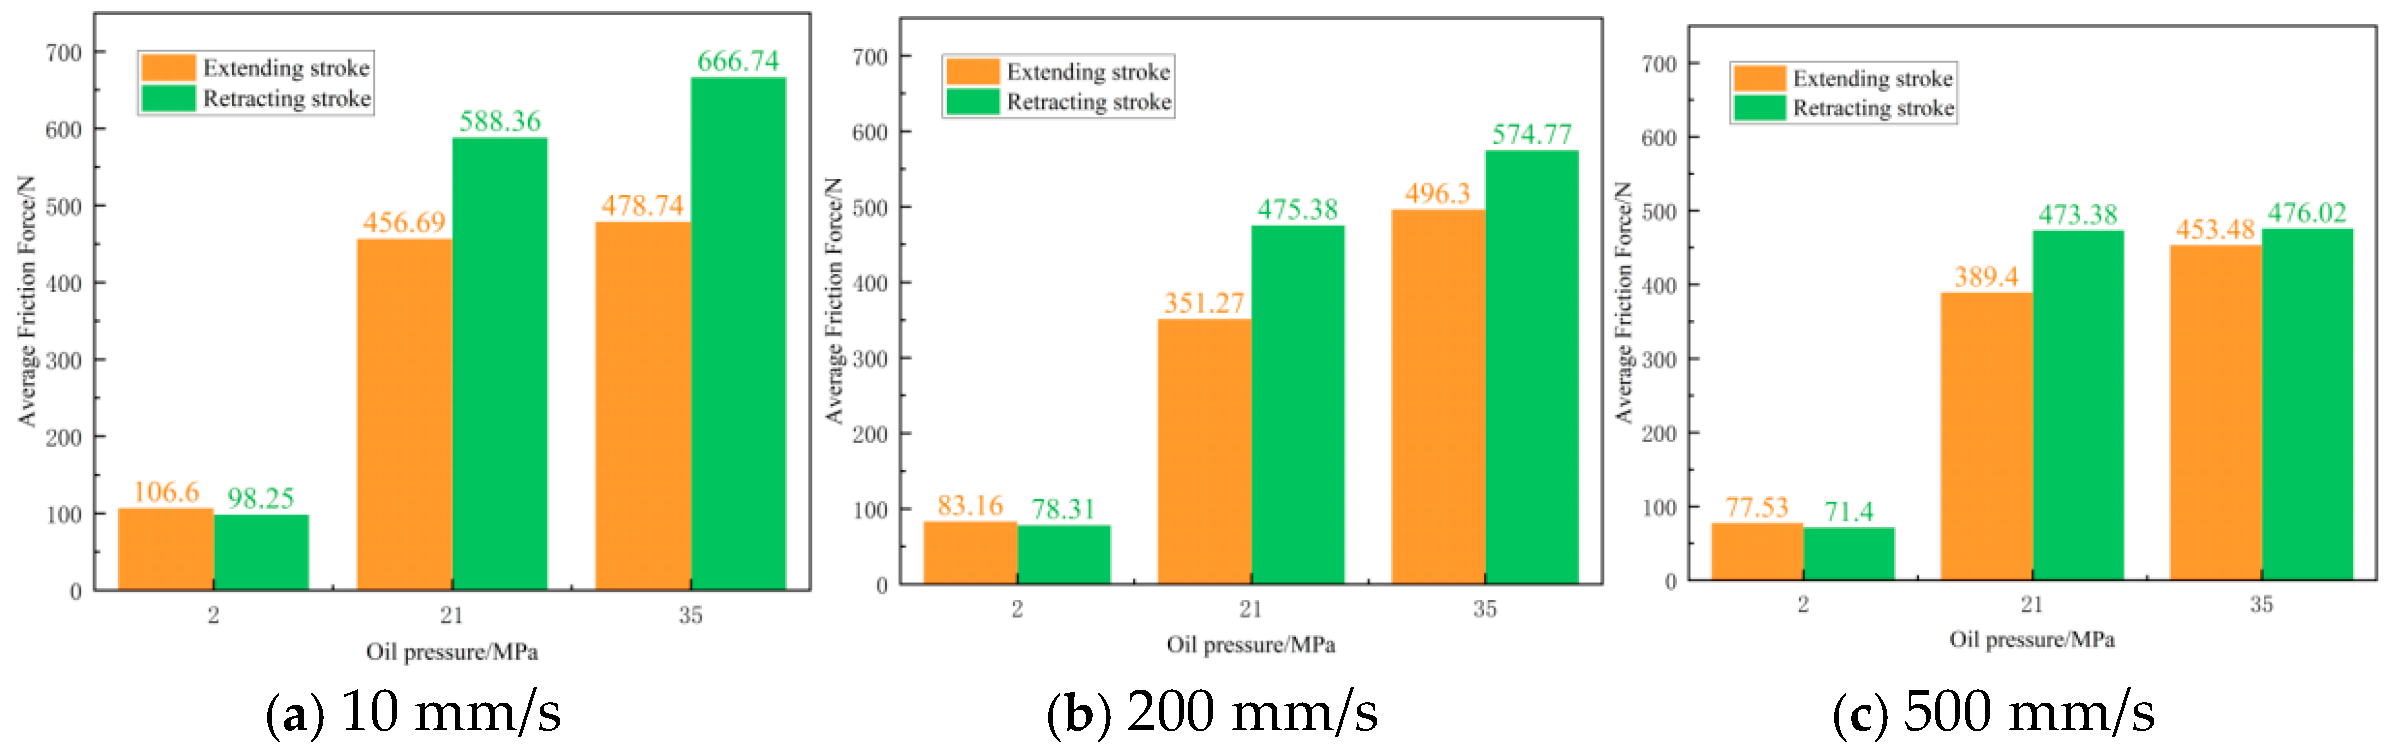
As shown in Figure 17, under the three velocities of 10 mm/s, 200 mm/s, and 500 mm/s, the variation trends of the average friction force of the VL seal in the extending stroke and retracting stroke are relatively similar: (1) at 2 MPa, the average friction force in the extending stroke is slightly greater than that in the retracting stroke; (2) at 21 MPa, the average friction force increases rapidly; (3) within the range of 21 MPa to 35 MPa, the increasing trend of the average friction force in both the extending stroke and retracting stroke slows down relatively, and the average friction force in the retracting stroke is greater than that in the extending stroke.
Figure 17.
Analysis of friction force variation under different velocities.
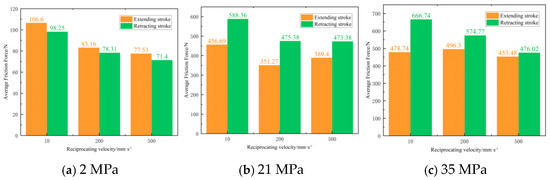
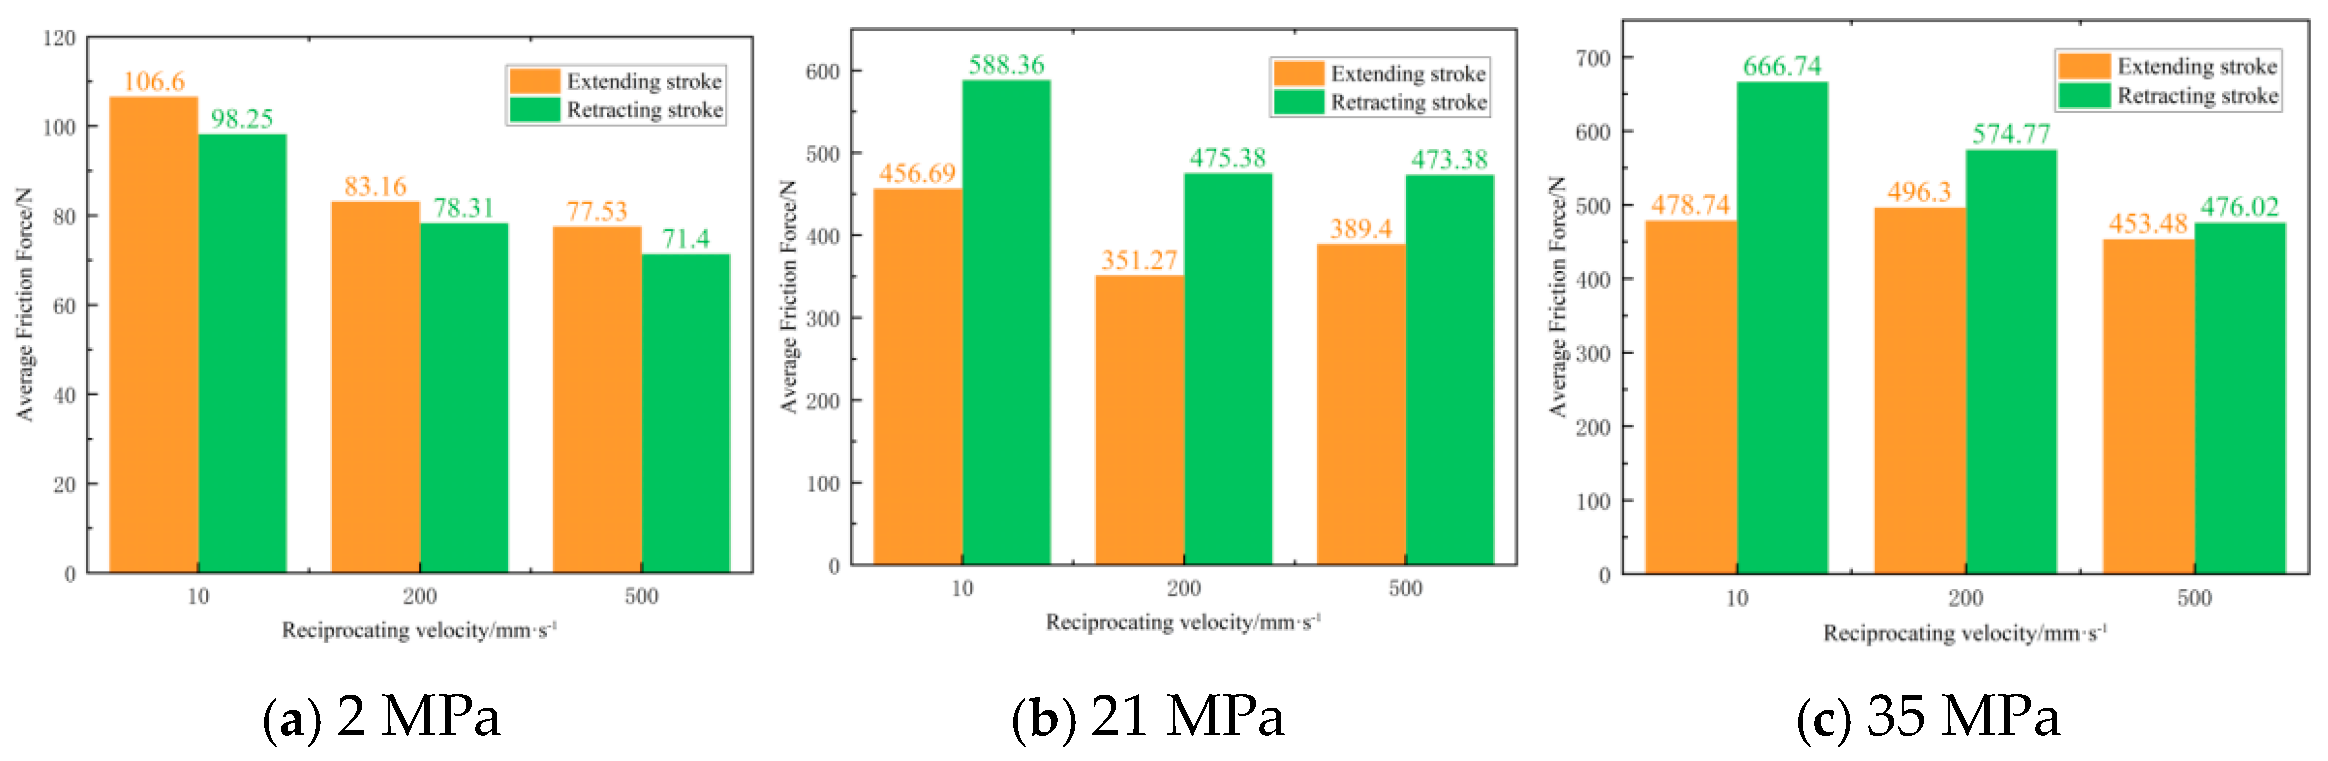
As shown in Figure 18, this is the trend in the average friction force during the extending and retracting strokes at three velocities under three pressure conditions. Specifically, under a pressure of 2 MPa, the average friction force in both the extending stroke and retracting stroke decreases as the velocity increases; however, under pressures of 21 MPa and 35 MPa, the variation in the average friction force in the extending stroke with velocity is not entirely consistent, while the average friction force in the retracting stroke decreases with the increase in velocity in both cases.
Figure 18.
Analysis of friction force variation with velocity under different pressures.
3.2.2. Test Results Discussion
Pearson correlation coefficient analysis was conducted on the simulated and experimental data presented in Table 8. The results show that the correlation coefficient r values under all operating conditions listed in the table are greater than 0.95, with the maximum value reaching 0.9847, indicating a significant linear correlation between the simulated and experimental data. The coefficient of determination R2 values are higher than 0.91, which demonstrates that the simulation model can explain at least 91% of the variation (fluctuation) in the experimental data, verifying the model’s excellent explanatory power. The simulated and experimental data in Table 8 were normalized using logarithmic standardization. The consistency index d values corresponding to the extension stroke and retraction stroke are 0.9871 and 0.9923, respectively, with the detailed data shown in Table 9 and Table 10.
Table 8.
Comparison between theoretical friction force and testing friction force.
Table 9.
Statistical analysis of theoretical friction force and testing friction force (10 mm/s).
Table 10.
Statistical analysis of theoretical friction force and testing friction force (2 MPa).
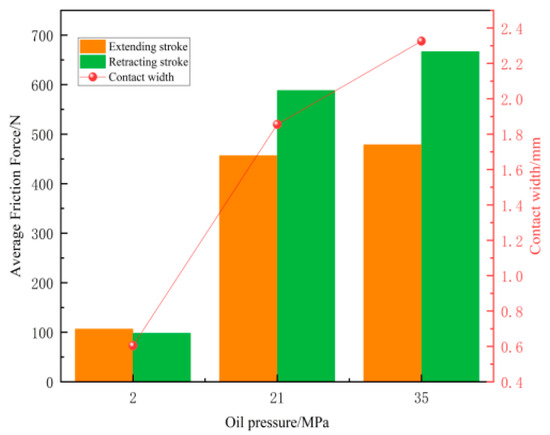
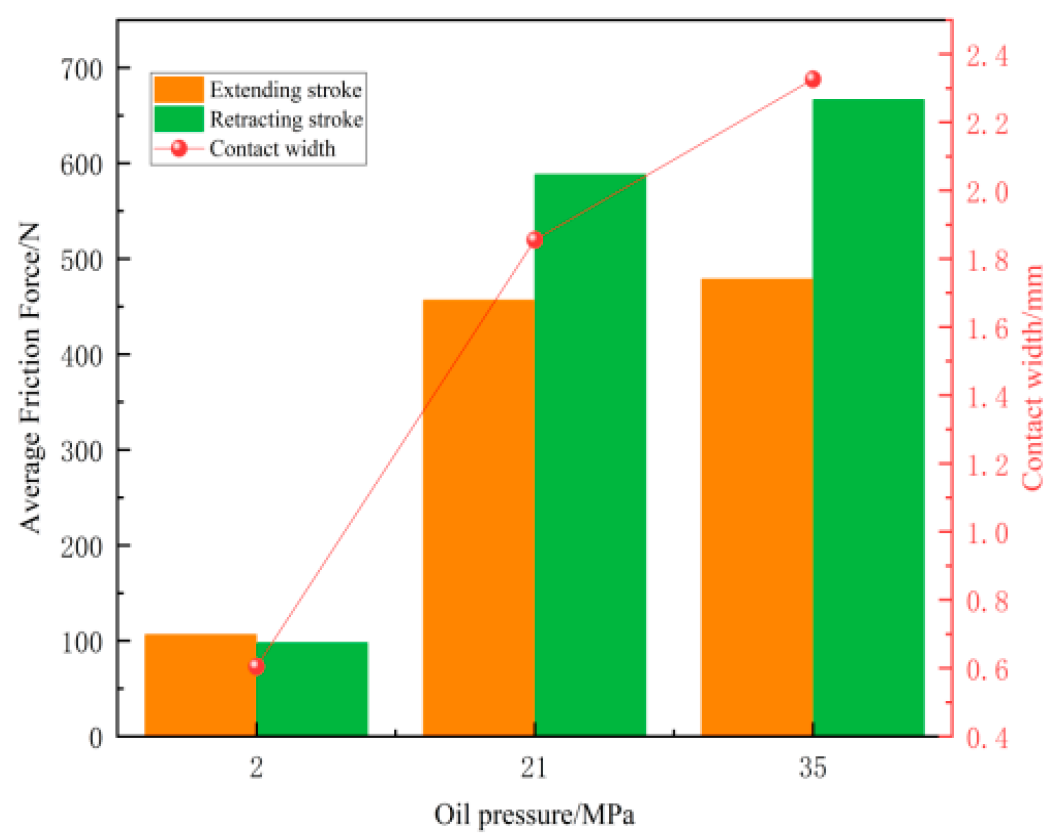
As shown in Figure 19, a quantitative comparative analysis was carried out on the theoretically calculated seal contact widths and experimentally measured friction force data under different pressure conditions. It can be seen that, under different oil pressures, the variation trend of the average friction force of the VL seal is consistent with that of the sealing contact width. Pearson correlation analysis was conducted on the comparative results, and the results show that the Pearson correlation coefficient (r) between the friction force during the extension stroke and the contact width is 0.977 (R2 = 0.955), and the correlation coefficient (r) between the friction force during the retraction stroke and the contact width is 0.990 (R2 = 0.980). The coefficient of determination indicates that the contact width can explain 95.5% and 98.0% of the fluctuation changes in the friction force during the extension stroke and retraction stroke, respectively. This result quantitatively confirms a strong positive linear correlation between the average friction force of the VL seal ring and the sealing contact width; i.e., the sealing contact width is a key factor affecting the friction force.
Figure 19.
Comparative analysis of variations in sealing contact width and average friction force.
The intrinsic mechanism underlying the aforementioned variation trend is analyzed from the perspectives of contact mechanics and the principles of tribology, mainly including two aspects: First, during the oil pressure loading process, the oil pressure is transmitted to the sealing lip through the sealing cavity, increasing the contact pressure between the lip and the sealing surface. According to the elastic contact theory, the increase in contact pressure promotes elastic deformation of the sealing lip, thereby expanding the sealing contact width. Second, the enlargement of the contact width leads to an increase in the effective contact area, resulting in a significant rise in the total frictional resistance between the sealing surfaces.
4. Conclusions
In this study, a hybrid approach integrating finite element simulation and experimental research was adopted to investigate the variations in contact pressure, contact width, and friction force of the VL seal for aviation actuators under high pressure (>21 MPa). The main conclusions are summarized as follows:
- (1)
- The effect of oil pressure on the contact performance of the VL seal is primarily characterized by three trends: The maximum contact pressure increases with rising oil pressure, increasing from 136.84 MPa at 2 MPa to 173.22 MPa at 35 MPa. The contact width expands significantly as oil pressure increases. Under high pressure, the contact area becomes wider, and the load distribution range at the sealing interface is extended—with the contact width increasing from 0.6045 mm at 2 MPa to 2.3261 mm at 35 MPa. The location of the maximum contact pressure shifts toward the lip as oil pressure rises, and the peak position lies closer to the lip side under high-pressure conditions.
- (2)
- The influence of oil pressure on the friction force of the VL seal is mainly observed in the following: The average friction force in both the extending and retracting strokes increases with higher oil pressure. Specifically, the average friction force rises rapidly within the range of 2 MPa to 21 MPa, while the increasing trend slows down relatively between 21 MPa and 35 MPa.
- (3)
- Reciprocating velocity exerts no significant effect on the maximum contact pressure of the VL seal. Friction test results indicate that the average friction force of the VL seal decreases gradually as velocity increases.
- (4)
- The variation in the average friction force of the VL seal, measured via friction tests, is consistent with the variation pattern observed in the analysis of its contact width under different oil pressures.
Compared with related studies, this work’s innovations lie in three aspects: (1) it separately investigates how two key variables—oil pressure and reciprocating speed—affect three core indicators, namely the seal’s maximum contact pressure, contact width and friction force; (2) it clearly distinguishes the seal’s two motion stages (extension and retraction), and reveals the differential characteristics of friction force varying with oil pressure across stages—a stage-specific analysis rarely reported in similar studies and highly consistent with the actual operating mode of aerospace actuators; (3) it precisely matches the PTFE friction coefficient test with the seal’s real working parameters (i.e., normal pressure corresponding to oil pressure), and establishes a quantitative correlation chain of “oil pressure-contact width-friction force-friction coefficient” by comparing friction coefficients under different normal pressures. The data generated herein offer more direct guidance for the material selection and structural optimization of VL seals. In the present study, the research primarily focuses on the transient mechanical behaviors of VL-type sealing rings, including the static sealing contact pressure distribution and the stress transfer mechanism during the assembly process. Therefore, the viscous creep effect of polytetrafluoroethylene (PTFE) is temporarily neglected, and an elastic model is adopted to simulate the transient mechanical behaviors. Further research will be carried out subsequently on inelastic responses such as long-term creep deformation and plastic yielding, as well as mechanical behaviors under long-term service conditions.
Author Contributions
Y.W.: Responsible for the conception and design of the research, the analysis and interpretation of data, the drafting and revision of the paper, and approving the submitted version. W.Y.: Participated in the research design, data collection and collation, assisted in data analysis, and conducted critical revisions on the academic content of the paper. J.A.: Participated in the analysis and interpretation of data, assisted in drafting the content of some chapters, revised the paper, and provided technical support and resource coordination during the research process. X.T.: Responsible for technical support and resource coordination during the research process, participated in the revision of the paper, and approved the submission of the final manuscript. Q.G.: Participated in the analysis and interpretation of data, assisted in the revision of the paper. D.W.: Assisted in drafting the content of some chapters, participated in the revision of the paper, and approved the submission of the final manuscript. X.Z.: Responsible for the conception and design of the research, the analysis and interpretation of data, leading the drafting and revision of the paper, and submitting the final version. J.S.: Approved the submission of the final manuscript. All authors have read and agreed to the published version of the manuscript.
Funding
This research received no external funding.
Data Availability Statement
The raw data supporting the conclusions of this article will be made available by the authors on request.
Conflicts of Interest
Authors Yanan Wang, Wenjun Yu, Jianping Ai, Xihui Tao, Qingyun Guo, Dongye Wang, Junying Suo were employed by the company Chengdu Aircraft Industry (Group) Co., Ltd. The remaining author declares that the research was conducted in the absence of any commercial or financial relationships that could be construed as a potential conflict of interest.
References
- Peng, C.; Ouyang, X.; Schmitz, K.; Wang, W.; Guo, S.; Yang, H. Investigation of the tribological performance of reciprocating seals in a wide temperature range. Proc. Inst. Mech. Eng. Part J J. Eng. Tribol. 2021, 235, 2396–2414. [Google Scholar] [CrossRef] [Scilit]
- Stupkiewicz, S.; Marciniszyn, A. Elastohydrodynamic lubrication and finite configuration changes in reciprocating elastomeric seals. Tribol. Int. 2008, 42, 615–627. [Google Scholar] [CrossRef] [Scilit]
- Yang, B.; Salant, F.R. Soft EHL Simulations of U-Cup and Step Hydraulic Rod Seals. J. Tribol. 2009, 131, 021501. [Google Scholar] [CrossRef] [Scilit]
- Crudu, M.; Fatu, A.; Cananau, S.; Hajjam, M.; Pascu, A.; Cristescu, C. A numerical and experimental friction analysis of reciprocating hydraulic ‘U’ rod seals. Proc. Inst. Mech. Eng. Part J J. Eng. Tribol. 2012, 226, 785–794. [Google Scholar] [CrossRef] [Scilit]
- Salant, R.F. Analytical Model of Friction in Reciprocating Hydraulic Seals. Tribol. Trans. 2018, 61, 514–525. [Google Scholar] [CrossRef] [Scilit]
- Wu, D.F.; Ma, Y.X.; Wang, Z.Y.; Min, H.; Deng, Y.P.; Liu, Y.S. Numerical and Experimental Study of Reciprocating Seals in Seawater Hydraulic Variable Ballast Components for 11,000-m Operation. Tribol. Trans. 2023, 66, 92–103. [Google Scholar] [CrossRef] [Scilit]
- Li, J.; Chen, G. Modeling and experimental study of reciprocating seal Soft elastohydrodynamic lubrication considering structural thermal coupling. Int. J. Heat Mass Transf. 2025, 239, 126564. [Google Scholar] [CrossRef] [Scilit]
- Wang, B.; Yang, X.; Hou, B.; Li, Y.; Chen, Y.; Peng, X. Performance analysis and structural optimization of VL-type hydraulic reciprocating seal in a deep-sea hydraulic system. Ocean. Eng. 2025, 328, 121048. [Google Scholar] [CrossRef] [Scilit]
- Wang, J.H.; Li, J.; Ma, C. A performance degradation analysis method for a reciprocating rod seal in the wear process under mixed lubrication conditions. Proc. Inst. Mech. Eng. Part J J. Eng. Tribol. 2023, 237, 681–697. [Google Scholar] [CrossRef] [Scilit]
- Yang, X.; Xiao, H.; Wang, Y.; Yao, Z.; Guo, F. Study on the wear performance of V-combined tandem seals. Proc. Inst. Mech. Eng. Part J J. Eng. Tribol. 2025, 239, 163–172. [Google Scholar] [CrossRef] [Scilit]
- Kim, B.; Suh, J.; Lee, B.; Chun, Y.; Hong, G.; Park, J.; Yu, Y. Numerical Analysis via Mixed Inverse Hydrodynamic Lubrication Theory of Reciprocating Rubber Seal Considering the Friction Thermal Effect. Appl. Sci. 2023, 13, 153. [Google Scholar] [CrossRef] [Scilit]
- Han, Q.; Chen, H.; Yang, W.; Zhang, Y.; Yang, J.; Chen, Y. Analysis of reciprocating O-ring seal in the pressure-balanced oil-filled wet-mate electrical connectors for underwater applications. Lubr. Sci. 2019, 31, 335–345. [Google Scholar] [CrossRef] [Scilit]
- Nikas, G.K. Fast performance-analysis of rectangular-rounded hydraulic reciprocating seals: Mathematical model and experimental validation at temperatures between −54 °C and +135 °C. Tribol. Int. 2018, 128, 34–51. [Google Scholar] [CrossRef] [Scilit]
- Zhang, M.; Feng, Y. Numerical Model of Mixed Lubrication and Experimental Study of Reciprocating Seal Based on Inverse Lubrication Theory. Lubricants 2022, 10, 153. [Google Scholar] [CrossRef] [Scilit]
- Peng, C.; Ouyang, X.; Schmitz, K.; Guo, S.; Yang, H. Numerical and Experimental Study on Combined Seals With the Consideration of Stretching Effects. ASME J. Tribol. 2021, 143, 062301. [Google Scholar] [CrossRef] [Scilit]
- Zhao, Y.; Cai, Z.; Feng, Z.; Chen, W.; Yuan, H. Multi-Physical Field, Coupled, Mixed Lubrication Analysis of Hydraulic Reciprocating Vacuum Lip Seal. Machines 2024, 12, 686. [Google Scholar] [CrossRef] [Scilit]
- Ouyang, X.-P.; Xue, Z.-Q.; Peng, C.; Zhou, Q.-H.; Yang, H.-Y. Analysis of VL seal characteristics for aviation actuators. J. Zhejiang Univ. 2015, 49, 1755–1761. [Google Scholar] [CrossRef]
- Zhang, Y.; Zhang, N.; Cui, B.; Guo, Q. Failure analysis and structural improvement of helicopter landing gear seals based on experiments and three-dimensional numerical simulation. Eng. Fail. Anal. 2024, 163, 108596. [Google Scholar] [CrossRef] [Scilit]
- Persson, B.N.J. Theory of powdery rubber wear. J. Phys. Condens. Matter 2009, 21, 485001. [Google Scholar] [CrossRef] [Scilit]
- Kaiser, F.; Savio, D.; Bactavatchalou, R. Modelling of Static and Dynamic Elastomer Friction in Dry Conditions. Lubricants 2024, 12, 250. [Google Scholar] [CrossRef] [Scilit]
- Wang YZou, L.Q.; Fu, H.L.; Huang, C.C.; Liu, J.Q. Simulation on metal-rubber contact behavior based on a reconstructed 3D topography of rough surfaces. Proc. Inst. Mech. Eng. Part C J. Mech. Eng. Sci. 2024, 238, 9235–9247. [Google Scholar] [CrossRef] [Scilit]
- Hao, X.H.; Pan, D.; Zhang, Z.Y.; Wang, S.Q.; Gao, Y.J.; Gu, D.P. Influence of external load on friction coefficient of Fe–polytetrafluoroethylene. Chin. Phys. B 2020, 29, 046802. [Google Scholar] [CrossRef] [Scilit]
- Zienkiewicz, O.C.; Taylor, R.L. The Finite Element Method for Solid and Structural Mechanics; Elsevier: Amsterdam, The Netherlands, 2009. [Google Scholar]
- Guo, F.; Tang, C.; Shan, L.; Huang, L.; Xiang, C. Simulation study on the effect of eccentricity on the performance of a reciprocating seal. Proc. Inst. Mech. Eng. Part J J. Eng. Tribol. 2024, 238, 1550–1569. [Google Scholar] [CrossRef] [Scilit]
- Li, M.; Zhao, Y. Investigation Into the Performance of the VL Seal Based on 2D Axisymmetric and 3D Model. ASME Fluid Power Motion Control. Conf. 2017, 58332, V001T01A017. [Google Scholar] [CrossRef] [Scilit]
- Prati, E.; Strozzi, A. A study of the elastohydrodynamic problem in rectangular elastomeric seals. ASME J. Tribol. 1984, 106, 505–512. [Google Scholar] [CrossRef] [Scilit]
- Greenwood, J.A.; Williamson, J.B.P. Contact of nominally flat surfaces. Proc. R. Soc. Lond. 1966, 295, 300–319. [Google Scholar] [CrossRef] [Scilit]
- Salant, R.F.; Maser, N.; Yang, B.R.F. Numerical model of a reciprocating hydraulic rod seal. J. Tribol. 2007, 129, 91–97. [Google Scholar] [CrossRef] [Scilit]

Disclaimer/Publisher’s Note: The statements, opinions and data contained in all publications are solely those of the individual author(s) and contributor(s) and not of MDPI and/or the editor(s). MDPI and/or the editor(s) disclaim responsibility for any injury to people or property resulting from any ideas, methods, instructions or products referred to in the content. |
© 2026 by the authors. Licensee MDPI, Basel, Switzerland. This article is an open access article distributed under the terms and conditions of the Creative Commons Attribution (CC BY) license.