


Abstract
In recent years, copper-based conductive and thermal management components have required fine structures for miniaturization and enhanced functionality. Micro-forming is an excellent processing method characterized by high productivity and suitability for mass production. Since micro-forming is highly influenced by tribological conditions, proper setting of die surface conditions is essential. In micro-extrusion, surface coatings such as diamond-like carbon (DLC) have been explored to optimize tribological conditions. However, the effects of die surface properties on the internal deformation state (evolution of the work-hardened microstructure and the resulting plastic-flow) during forming have not been quantitatively characterized. In this study, micro-extrusion tests of pure copper were conducted using two types of dies: one with a DLC coating and one without any coating. Changes in the internal deformation with stroke progression were analyzed using kernel average misorientation (KAM) maps and geometrically necessary dislocation (GND) density. Measurement of GND density enabled quantitative evaluation of the internal deformation state within the material. Consequently, changes in GND density with stroke progression closely corresponded to the force behavior, suggesting that die surface conditions significantly affect not only the frictional state at the material surface but also the internal deformation.
1. Introduction
Copper and copper alloys are widely used in electrical and thermal management components because of their excellent electrical and thermal conductivity. In recent years, growing demand for electric vehicles (EVs) and data centers for artificial intelligence (AI) applications has increased the need for these components [1,2,3]. Furthermore, increasingly fine-scale structures are required to achieve component miniaturization and enhanced functionality. Consequently, it is necessary to establish microfabrication technologies capable of producing copper and copper alloy components with high productivity. Copper and copper alloys can be processed by various manufacturing methods, including metal forming, machining, and additive manufacturing. Metal forming shapes a workpiece through plastic deformation imposed by dies or other tools. Once the required tooling has been prepared, the process enables high-volume production with short cycle times and limited material loss, making it particularly suitable for mass production. In addition, work hardening induced during forming can be utilized to increase the strength of the resulting components. Establishing technologies for the microscale forming (micro-forming) of copper and copper alloys is therefore important [4,5,6]. Compared with macro-scale forming, micro-forming is more strongly affected by microstructural factors, such as grain size and crystallographic orientation, and by tribological conditions at the material–die interface, including friction and lubrication. This phenomenon is referred to as the size effect. Consequently, many challenges remain in micro-forming, including ensuring formability and reproducibility, reducing forming force, and extending die life [7,8,9]. To address these challenges, it is essential to accurately understand how each factor affects deformation behavior in micro-forming and to appropriately control these factors for each intended forming process.
In micro-extrusion, surface coatings on dies have been explored to reduce forming forces and extend die life. Funazuka et al. reported that diamond-like carbon (DLC) coatings effectively reduce friction between the die and aluminum alloy workpieces during micro-extrusion, demonstrating notable lubrication effects [10]. Even for copper materials, DLC coatings have been reported to provide effective lubrication in micro-extrusion, thereby reducing the extrusion force [8]. The extrusion force is influenced not only by the frictional conditions at the workpiece–die interface but also by the internal deformation state of the workpiece. In this study, the internal deformation state refers to the evolution of the work-hardened microstructure and the associated plastic flow. Therefore, elucidating the mechanism by which coatings such as DLC reduce the extrusion force requires clarifying how the die surface condition affects the internal deformation state. However, reductions in extrusion force associated with die coatings have generally been explained primarily in terms of changes in friction at the tool–workpiece interface. Although several studies have related the force response to the internal deformation state in micro-forming processes [11,12,13], many have focused on numerical analyses or post-forming microstructural observations. Consequently, the relationship between the evolution of deformation structures during processing and the force history remains insufficiently understood. In our previous study [14], we investigated non-steady-state deformation during the micro-extrusion of pure copper using specimens interrupted at multiple strokes. By focusing on characteristic deformation structures formed near the die–workpiece interface, we demonstrated that their evolution corresponded to changes in the force response. However, that study did not examine the effect of die surface condition on the internal deformation state, and the evaluation of that state remained partly qualitative. Therefore, elucidating how die coatings reduce the extrusion force requires establishing a quantitative method for evaluating the internal deformation state and applying it to assess how die surface condition affects its evolution.
In this study, we investigated a method for quantitatively evaluating the internal deformation state during the cold micro-extrusion of pure copper, based on crystallographic information obtained by EBSD analysis. Interrupted-stroke tests were conducted using two dies with different surface conditions, and the specimens collected at each stroke were analyzed using this method. We then examined the effect of die surface condition on the evolution of the internal deformation state and the relationship between this evolution and the extrusion-force response.
2. Materials and Methods
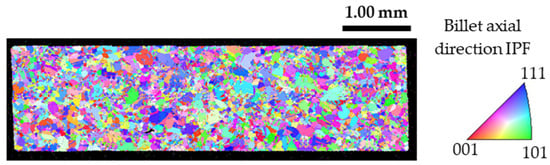
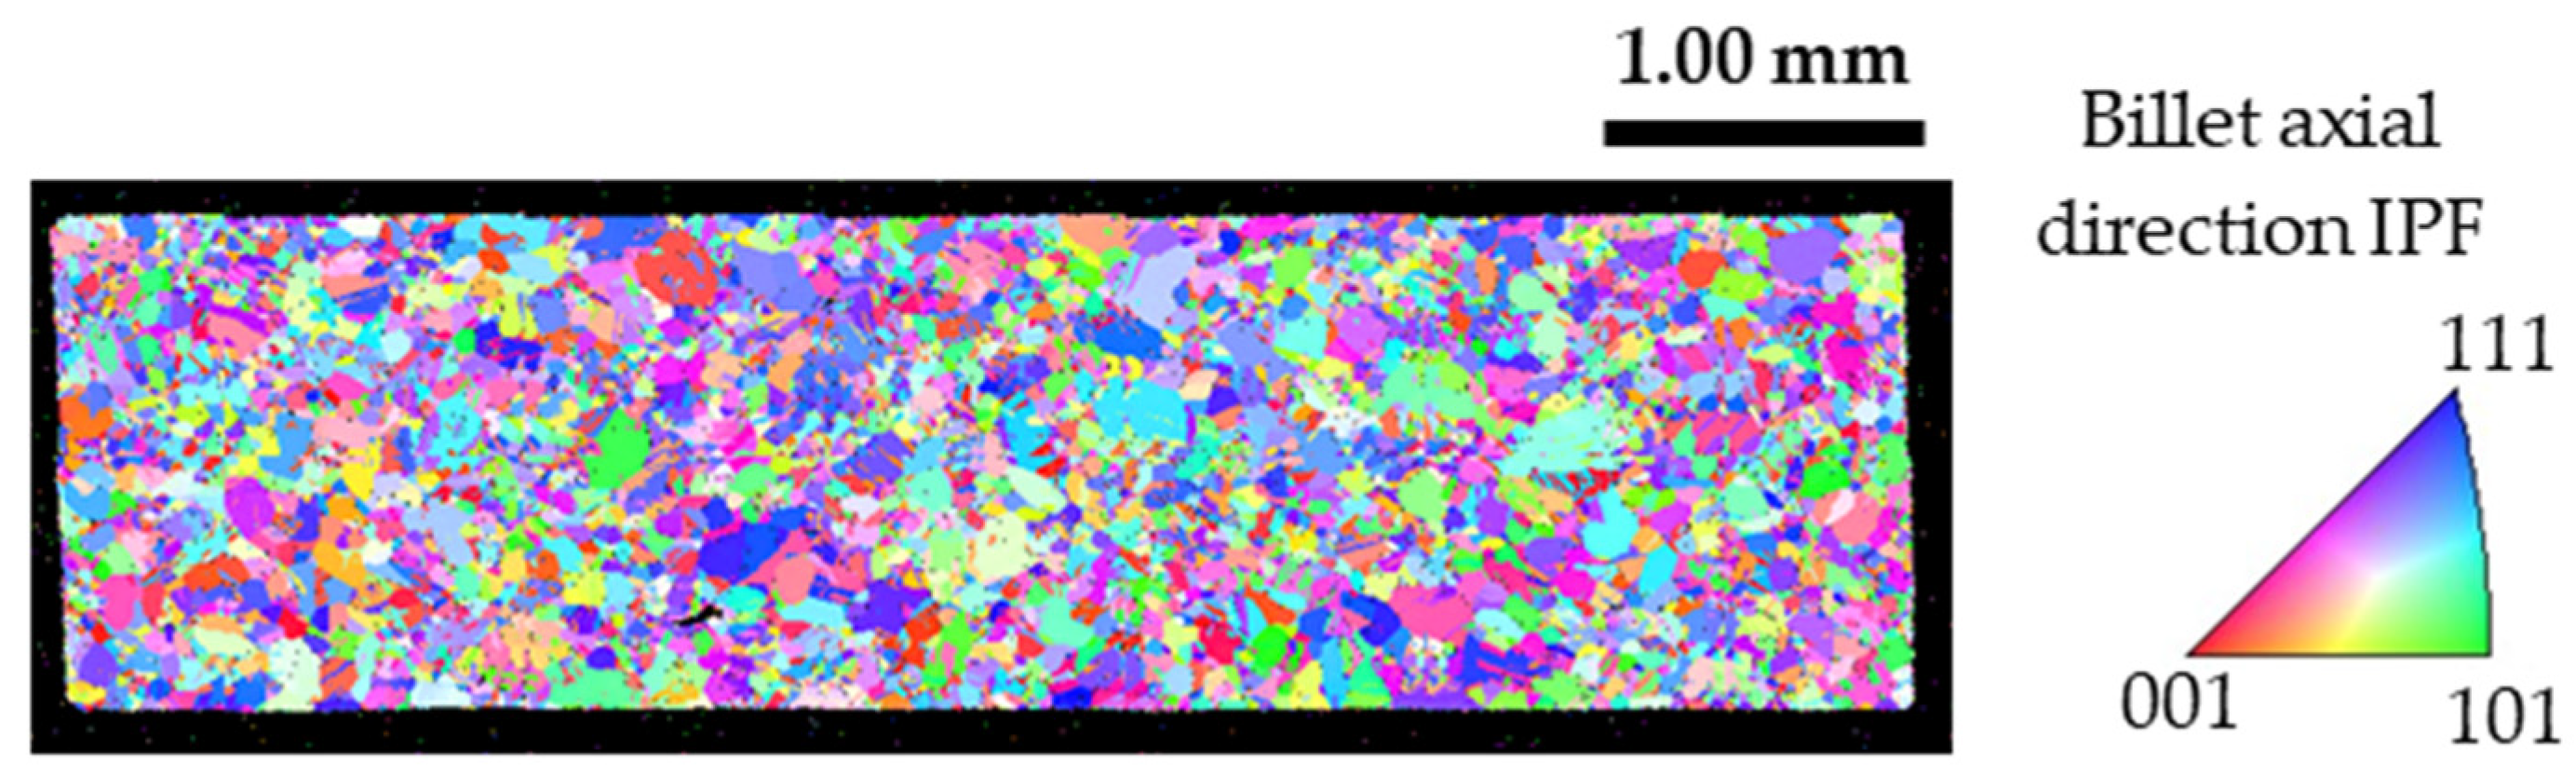
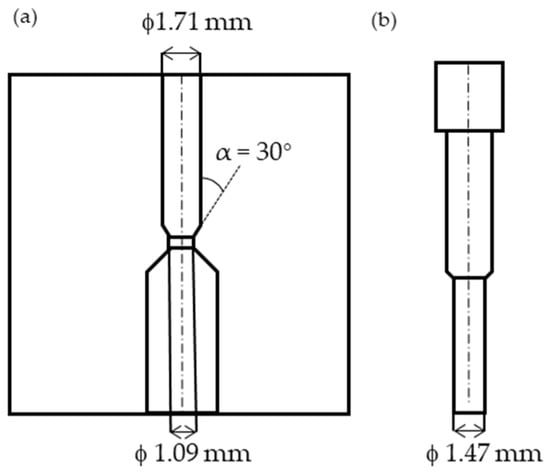
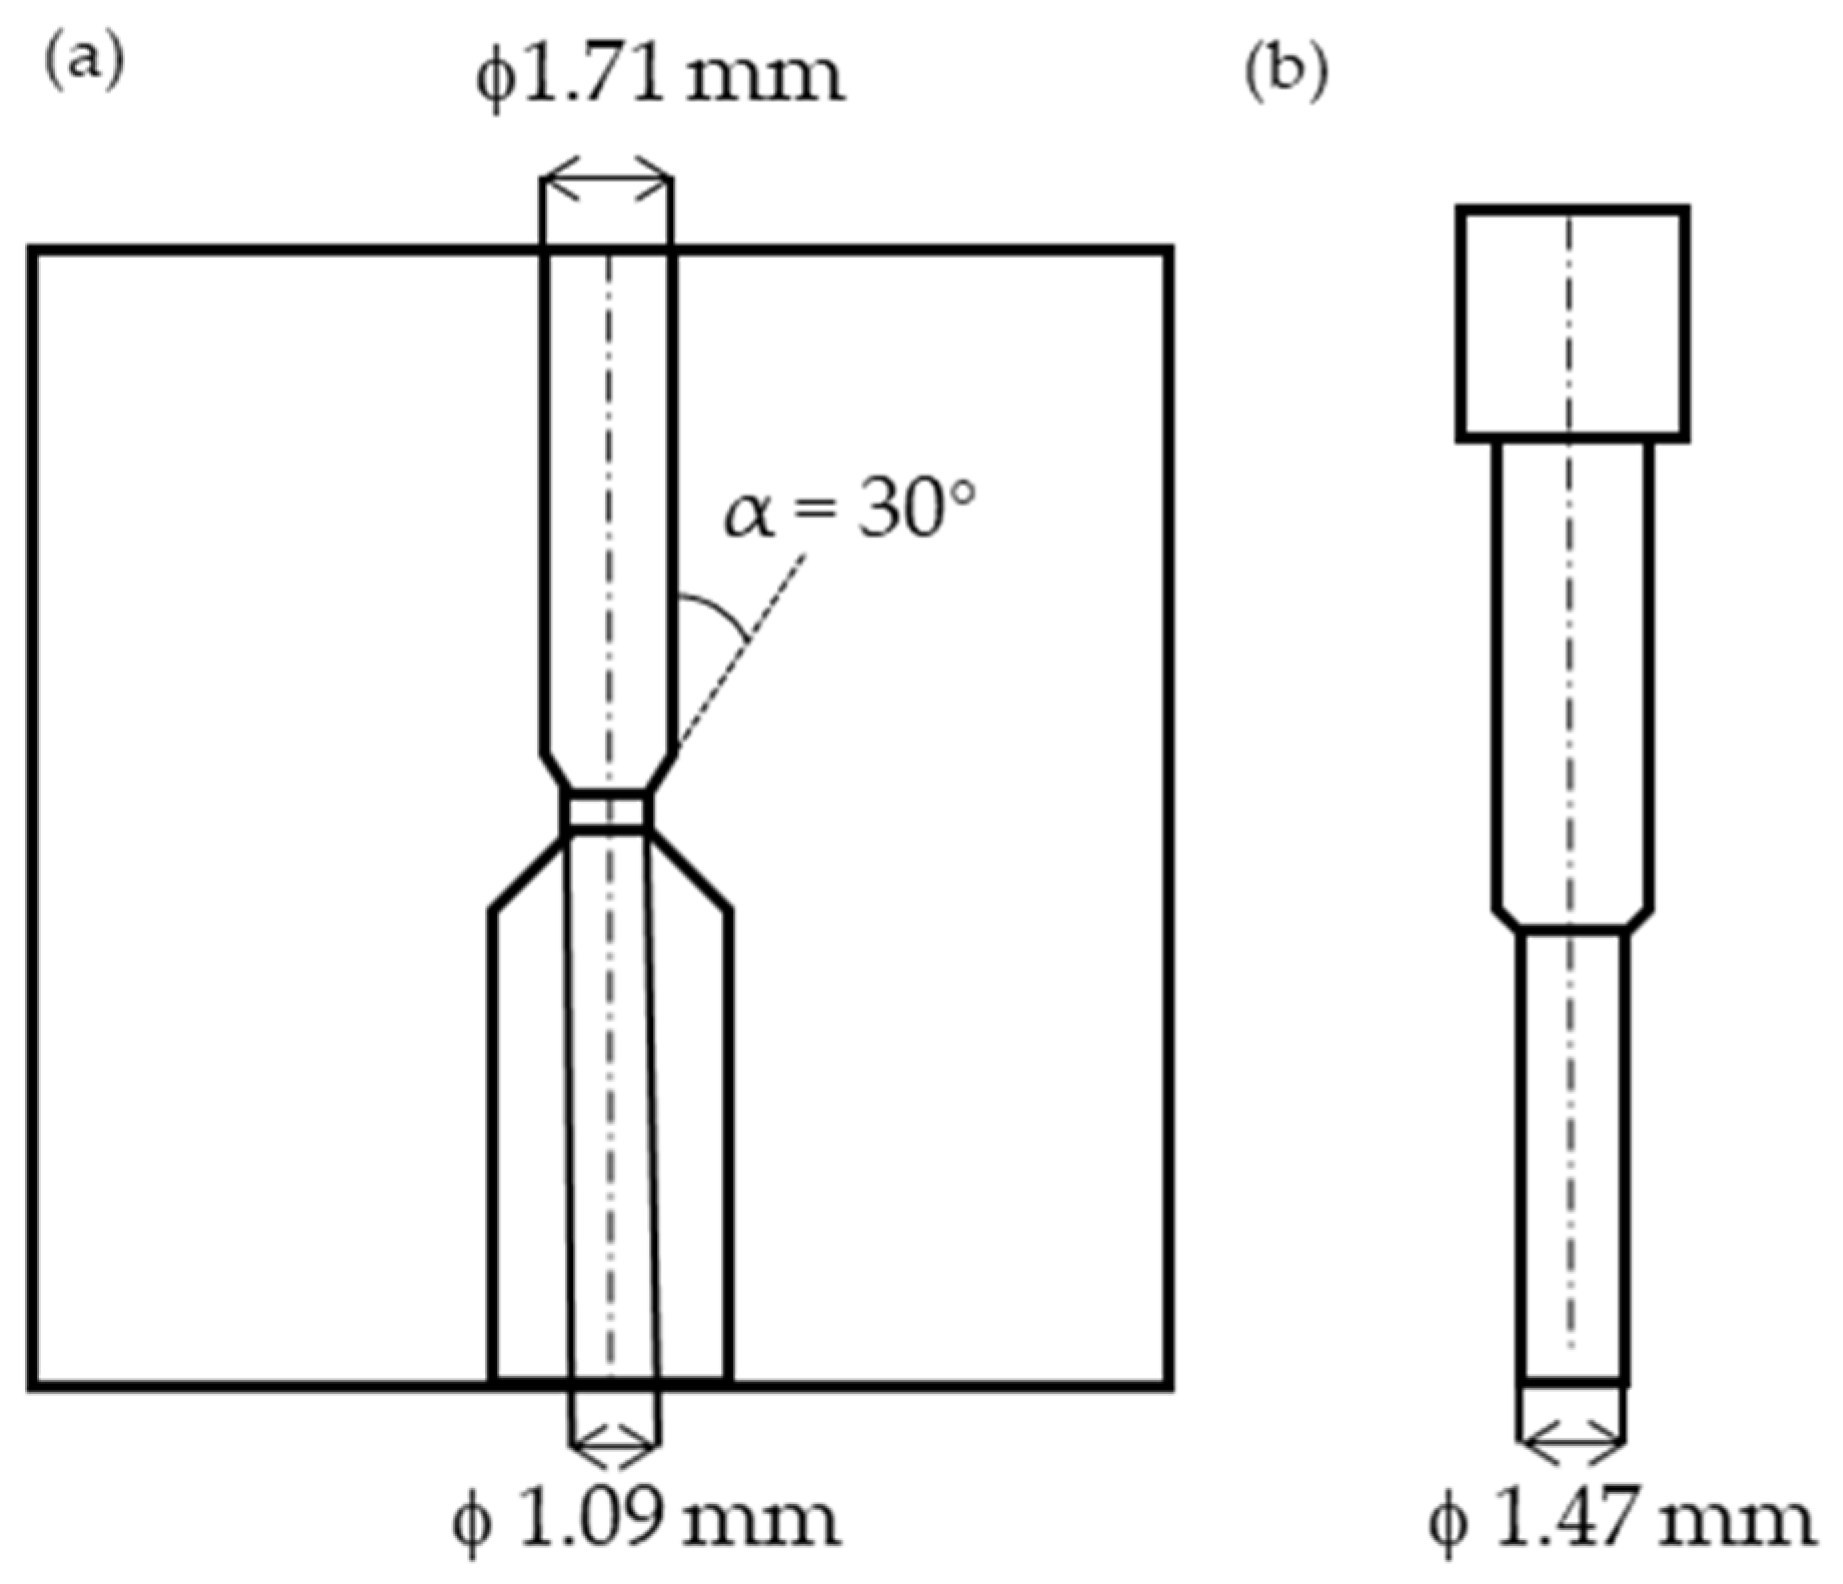
The extrusion test conditions were set to be equivalent to those used in the authors’ previous studies [14]. The material used in this study was pure copper with a purity of 99.96 mass% or higher. After processing and heat treatment, it was machined into cylindrical billets 1.7 mm in diameter and 6.0 mm in height. The initial microstructure of the billets exhibited a random distribution of crystallographic orientations with respect to the extrusion direction (Figure 1). For the micro-extrusion process, forward and backward extrusion was used. Figure 2 shows a schematic diagram of the die and punch. The die, which has a split structure to facilitate billet removal after extrusion, consists of three sections: a container section, a tapered section, and a bearing section. The inside diameter of the container is 1.71 mm, the inside diameter of the bearing is 1.09 mm, and the angle (die semi-angle) α between the die face of the tapered section and the extrusion axis direction is 30°. In the experiment, two types of dies were used: one with a polished surface (mirror surface die) and one coated with diamond-like carbon (DLC die). The DLC coating had a thickness of less than 10 μm and an sp3 fraction of 50–90%. The arithmetic mean surface roughness (Sa) was 0.36 μm for the mirror surface die and 0.24 μm for the DLC die. The punch tip diameter was 1.47 mm, and the cross-sectional area reduction rate was set to 59.4% for forward extrusion and 73.9% for backward extrusion. For both dies, a mirror-finished punch was used. Micro-extrusion was performed at room temperature under the following conditions: ram stroke velocity 0.10 mm/s, maximum ram stroke 2.00 mm, hold time 1.0 s, and polyalphaolefin (PAO) lubricant with a kinematic viscosity of 429 mm2/s. The lubricant was applied by dropping it onto the inner surface of the die before inserting the billet, using the same procedure for both dies. To observe microstructure changes with the progression of stroke, interrupted tests were conducted by stopping the ram at predefined stroke positions less than 2.00 mm.
Figure 1.
Inverse pole figure (IPF) map of the billet cross-section along the billet axis.
Figure 2.
Key dimensions of the (a) die and (b) punch [14].
After the micro-extrusion tests, the samples were sectioned parallel to the extrusion direction. The cross-sections were observed using optical microscopy to examine their shapes. Electron backscatter diffraction (EBSD) analysis was performed to obtain IPF and kernel average misorientation (KAM) maps for evaluating crystallographic orientations and local misorientations, respectively. The maximum misorientation threshold for KAM calculation was set to 5°. To further assess the effect of die surface conditions on the internal deformation state within the sample, an analysis focusing on dislocation density was conducted. There are two types of dislocations: geometrically necessary dislocations (GND) and statistically stored dislocations (SSD). GND represent additional dislocation storage required to accommodate lattice curvature arising from heterogeneous plastic deformation [15,16]. The GND density is known to correlate with KAM values, which quantify orientation differences between adjacent pixels obtained from crystallographic orientation analysis [17,18,19]. In this study, GND density was calculated from KAM maps derived from crystallographic orientation analysis to quantitatively evaluate changes in the internal deformation state with the progression of stroke. Using this method, the effects of differences in die surface conditions on the changes in the internal deformation state within the sample were investigated. The GND density can be estimated using the following equation [19,20]:
where b is the magnitude of the Burgers vector (0.256 nm for pure copper), s is the step size, θave is the average KAM value, and a is a coefficient dependent on the character of low-angle boundaries. To derive the GND density, it is necessary to obtain the variation in the average KAM value with respect to step size () from EBSD observations. However, acquiring multiple EBSD maps with varying step sizes for each sample and field of view would be impractically time-consuming. Therefore, the method proposed by Daigo et al. [21] was employed, in which is determined from the average KAM values obtained by varying the kernel radius from 1 to 5. The coefficient a takes values of 2 for tilt boundaries composed of edge dislocations and 4 for twist boundaries composed of screw dislocations, with their relative proportions depending on the deformation mode. Although an appropriate value of a is important when comparing GND densities across different deformation processes, the present study primarily focuses on relative comparisons under the same micro-extrusion process. Therefore, an intermediate value of a = 3 was adopted for all measurements.
3. Results
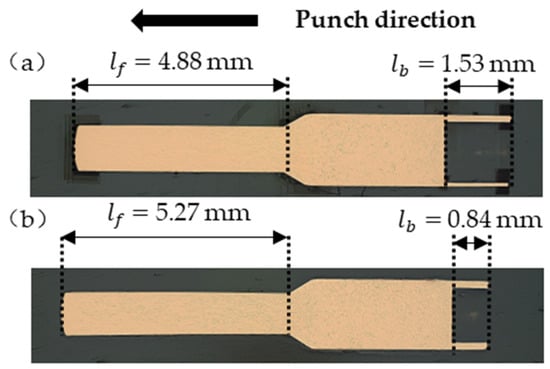
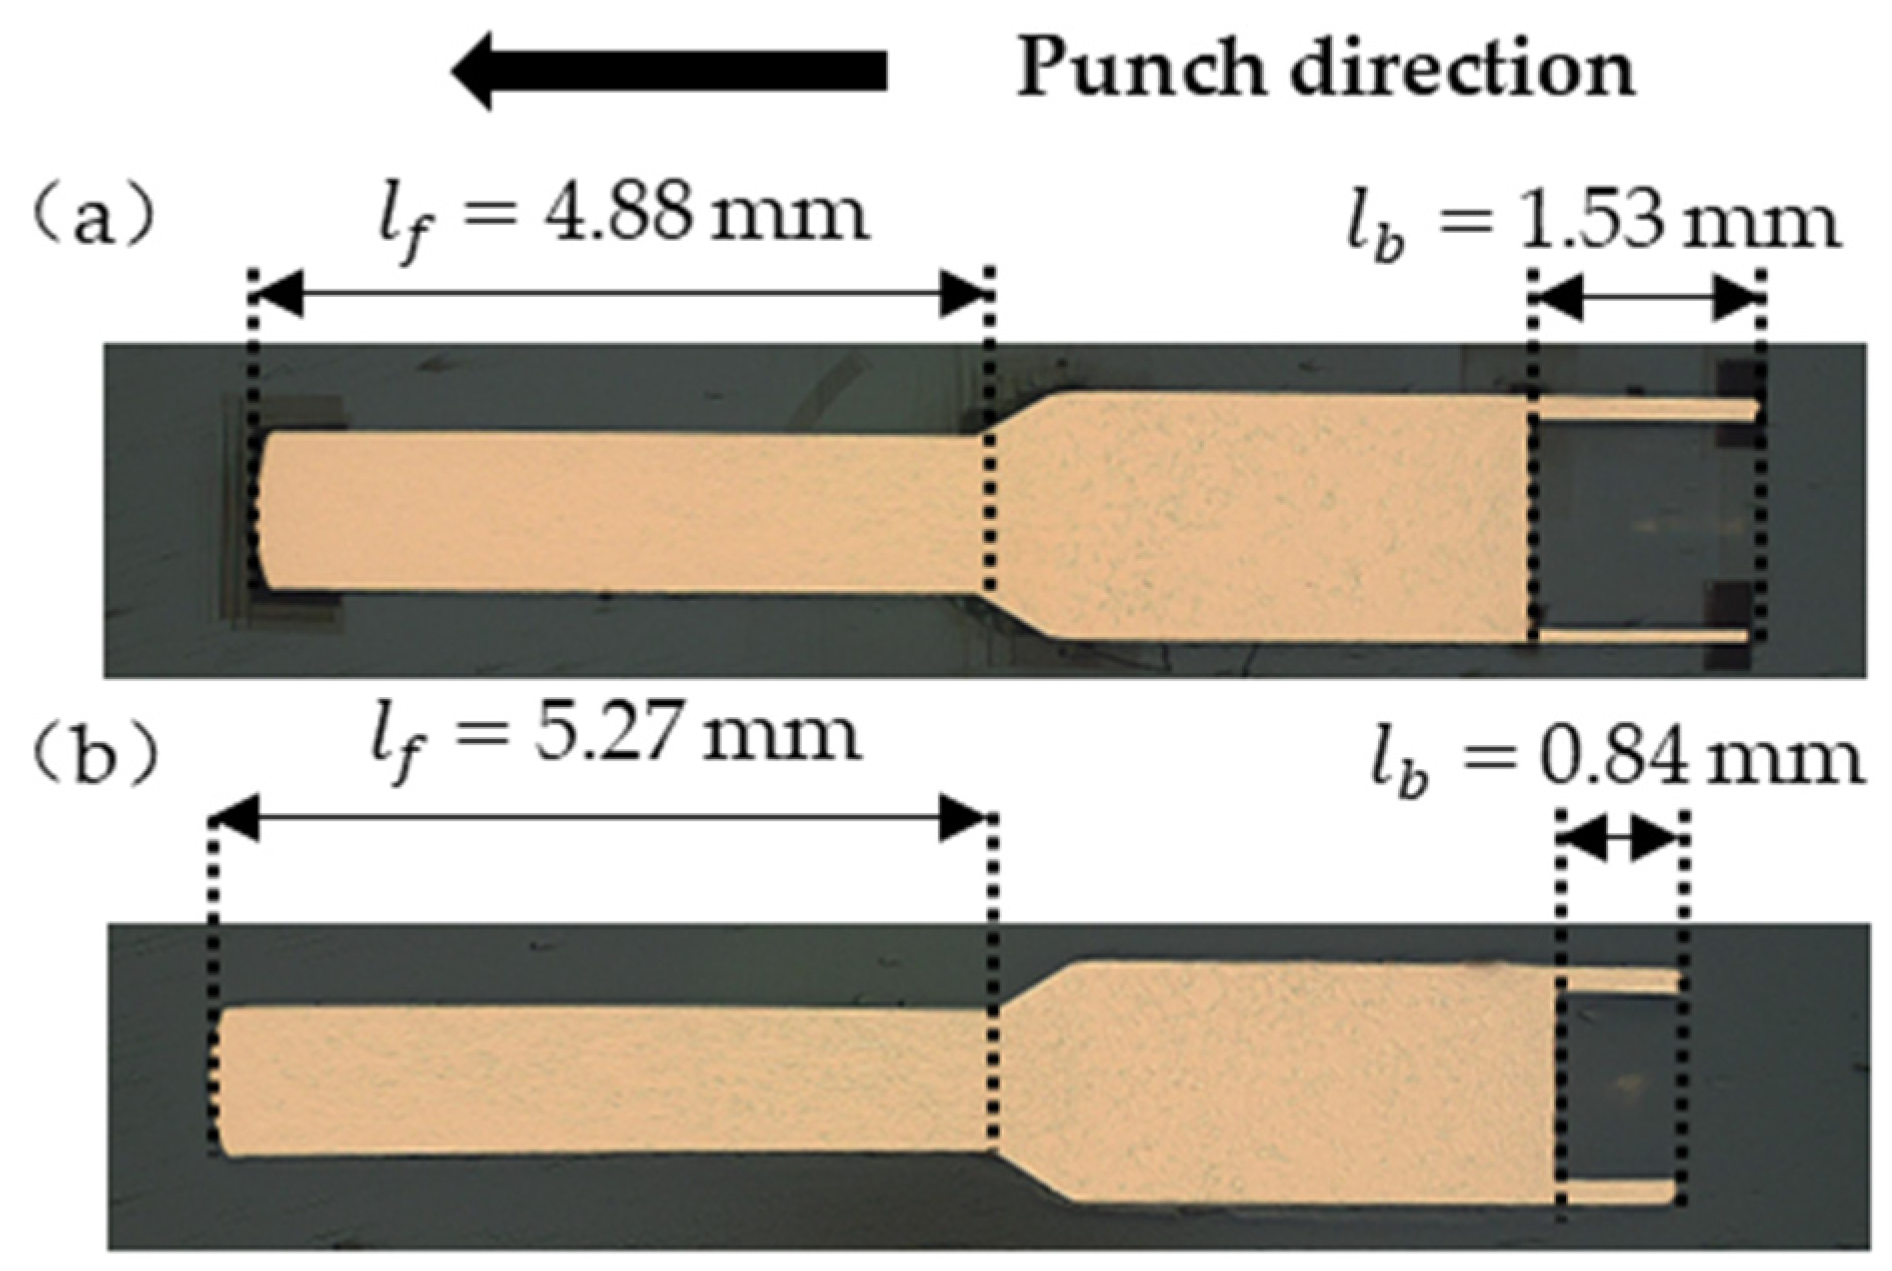
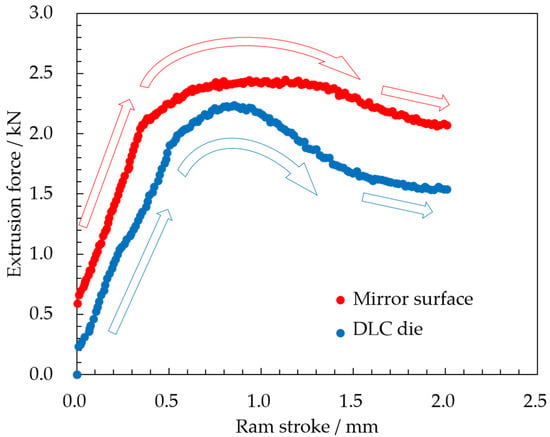
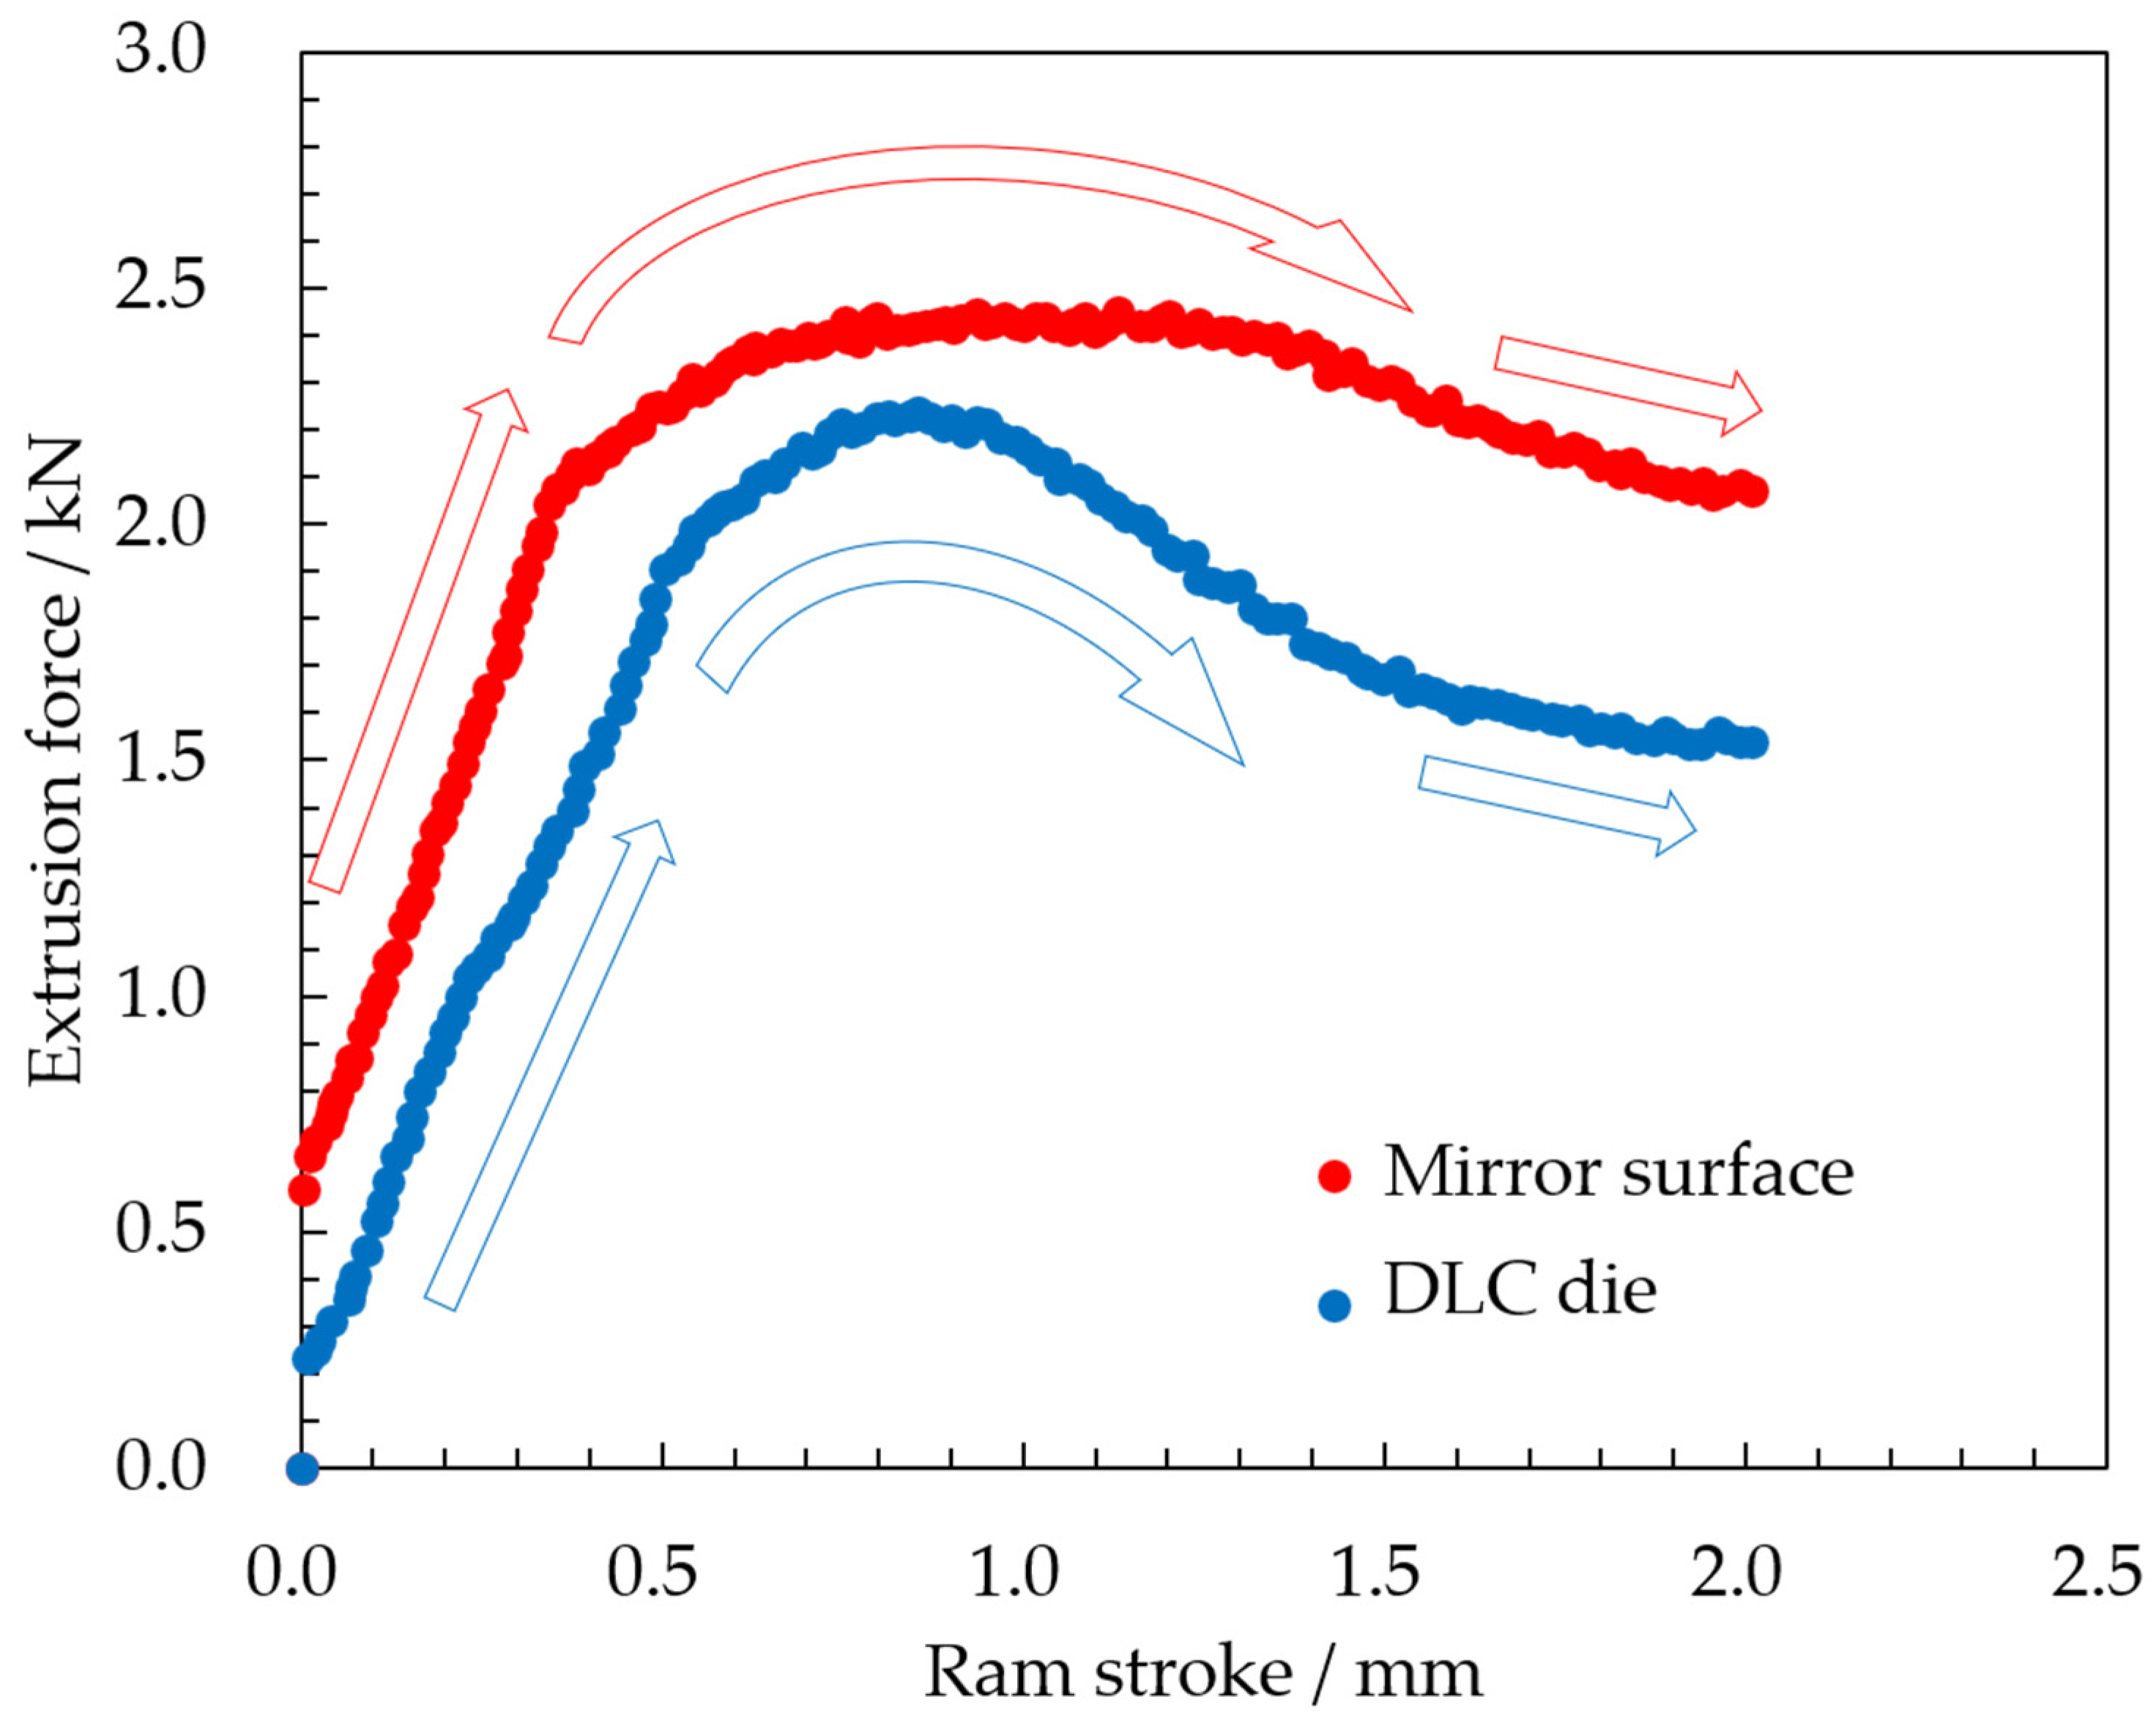
Figure 3 shows the product shapes extruded using (a) the mirror surface die and (b) the DLC die with a stroke of 2.00 mm. This figure includes the forward extrusion length (lf) and backward extrusion length (lb). Compared to the mirror surface die, the DLC die exhibits a shorter lb and a longer lf. Comparing the maximum forces in the force-stroke curves (Figure 4), the DLC coating reduced the maximum force by 0.21 kN (8.6%). The force–stroke curves shown in Figure 4 were selected as representative results from more than five tests conducted under identical conditions for each die. Although slight variations in force behavior were observed among the tests, the maximum force was consistently lower for the DLC die than for the mirror surface die, confirming the reproducibility of the force reduction achieved by DLC coating. The maximum extrusion force is determined by the forces required to extrude the sample forward and backward, and the ratio of lb to lf is governed by the balance between these forces. These results suggest that DLC coating on the die reduces the force in micro-extrusion of pure copper, with a greater force reduction effect in the forward extrusion region than in the backward extrusion region. Consequently, material is considered to flow more readily in the forward extrusion direction with the DLC die than with the mirror surface die, resulting in a greater lf. Focusing on the force behavior, as indicated by the arrows in Figure 4, both dies exhibit three sequential behaviors from the start of the test: (1) a linear increase, (2) a peak, and (3) a gradual decrease. The initial linear increase in force during the early stage of the extrusion test corresponds to the increase in the deformed volume at the forward and backward ends of the sample. The gradual decrease in force observed in the later stage corresponds to the reduction in friction force due to the decrease in contact area between the sample and the container section of the die. In this stage showing a gradual decrease in force, the gradient of the force is approximately constant, indicating that deformation has already stabilized. However, the peak of the force–stroke curve cannot be explained by such simple reasons. In our previous study [14], we demonstrated two key findings regarding the force peak during micro-extrusion of pure copper. First, a dead-metal-like zone (DMLZ) forms at the billet tip adjacent to the tapered section immediately after the onset of extrusion owing to localized work hardening. Second, the formation of the DMLZ induces changes in plastic flow during non-steady-state deformation, resulting in the force peak. In the present study, a force peak was observed for both dies, suggesting that similar DMLZ formation and subsequent evolution of plastic flow occurred irrespective of die surface condition. This result suggests that a DMLZ formed regardless of the die surface condition and that the associated evolution of plastic flow occurred. However, the peak profiles differed substantially between the dies, with a more pronounced peak observed for the DLC die than for the mirror surface die. This difference suggests that the die surface condition affects the evolution of the internal deformation state with stroke progression during non-steady-state deformation.
Figure 3.
Product shapes extruded using (a) the mirror surface die and (b) the DLC die.
Figure 4.
Extrusion force—ram stroke curve of the mirror surface and the DLC dies. The arrows indicate the three force behaviors observed from the start of extrusion to a stroke of 2.00 mm: (1) a linear increase, (2) a peak, and (3) a gradual decrease.
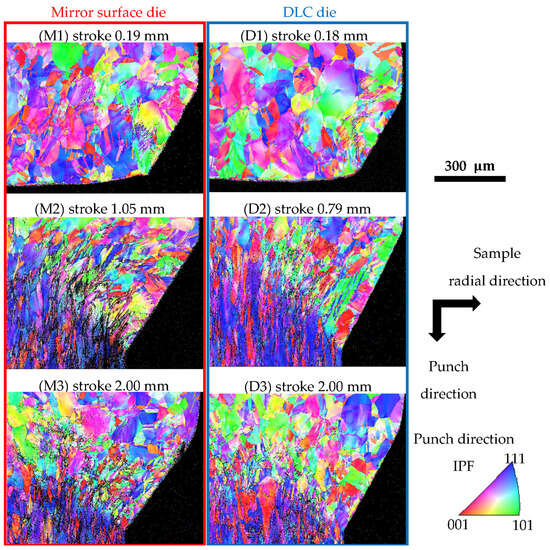
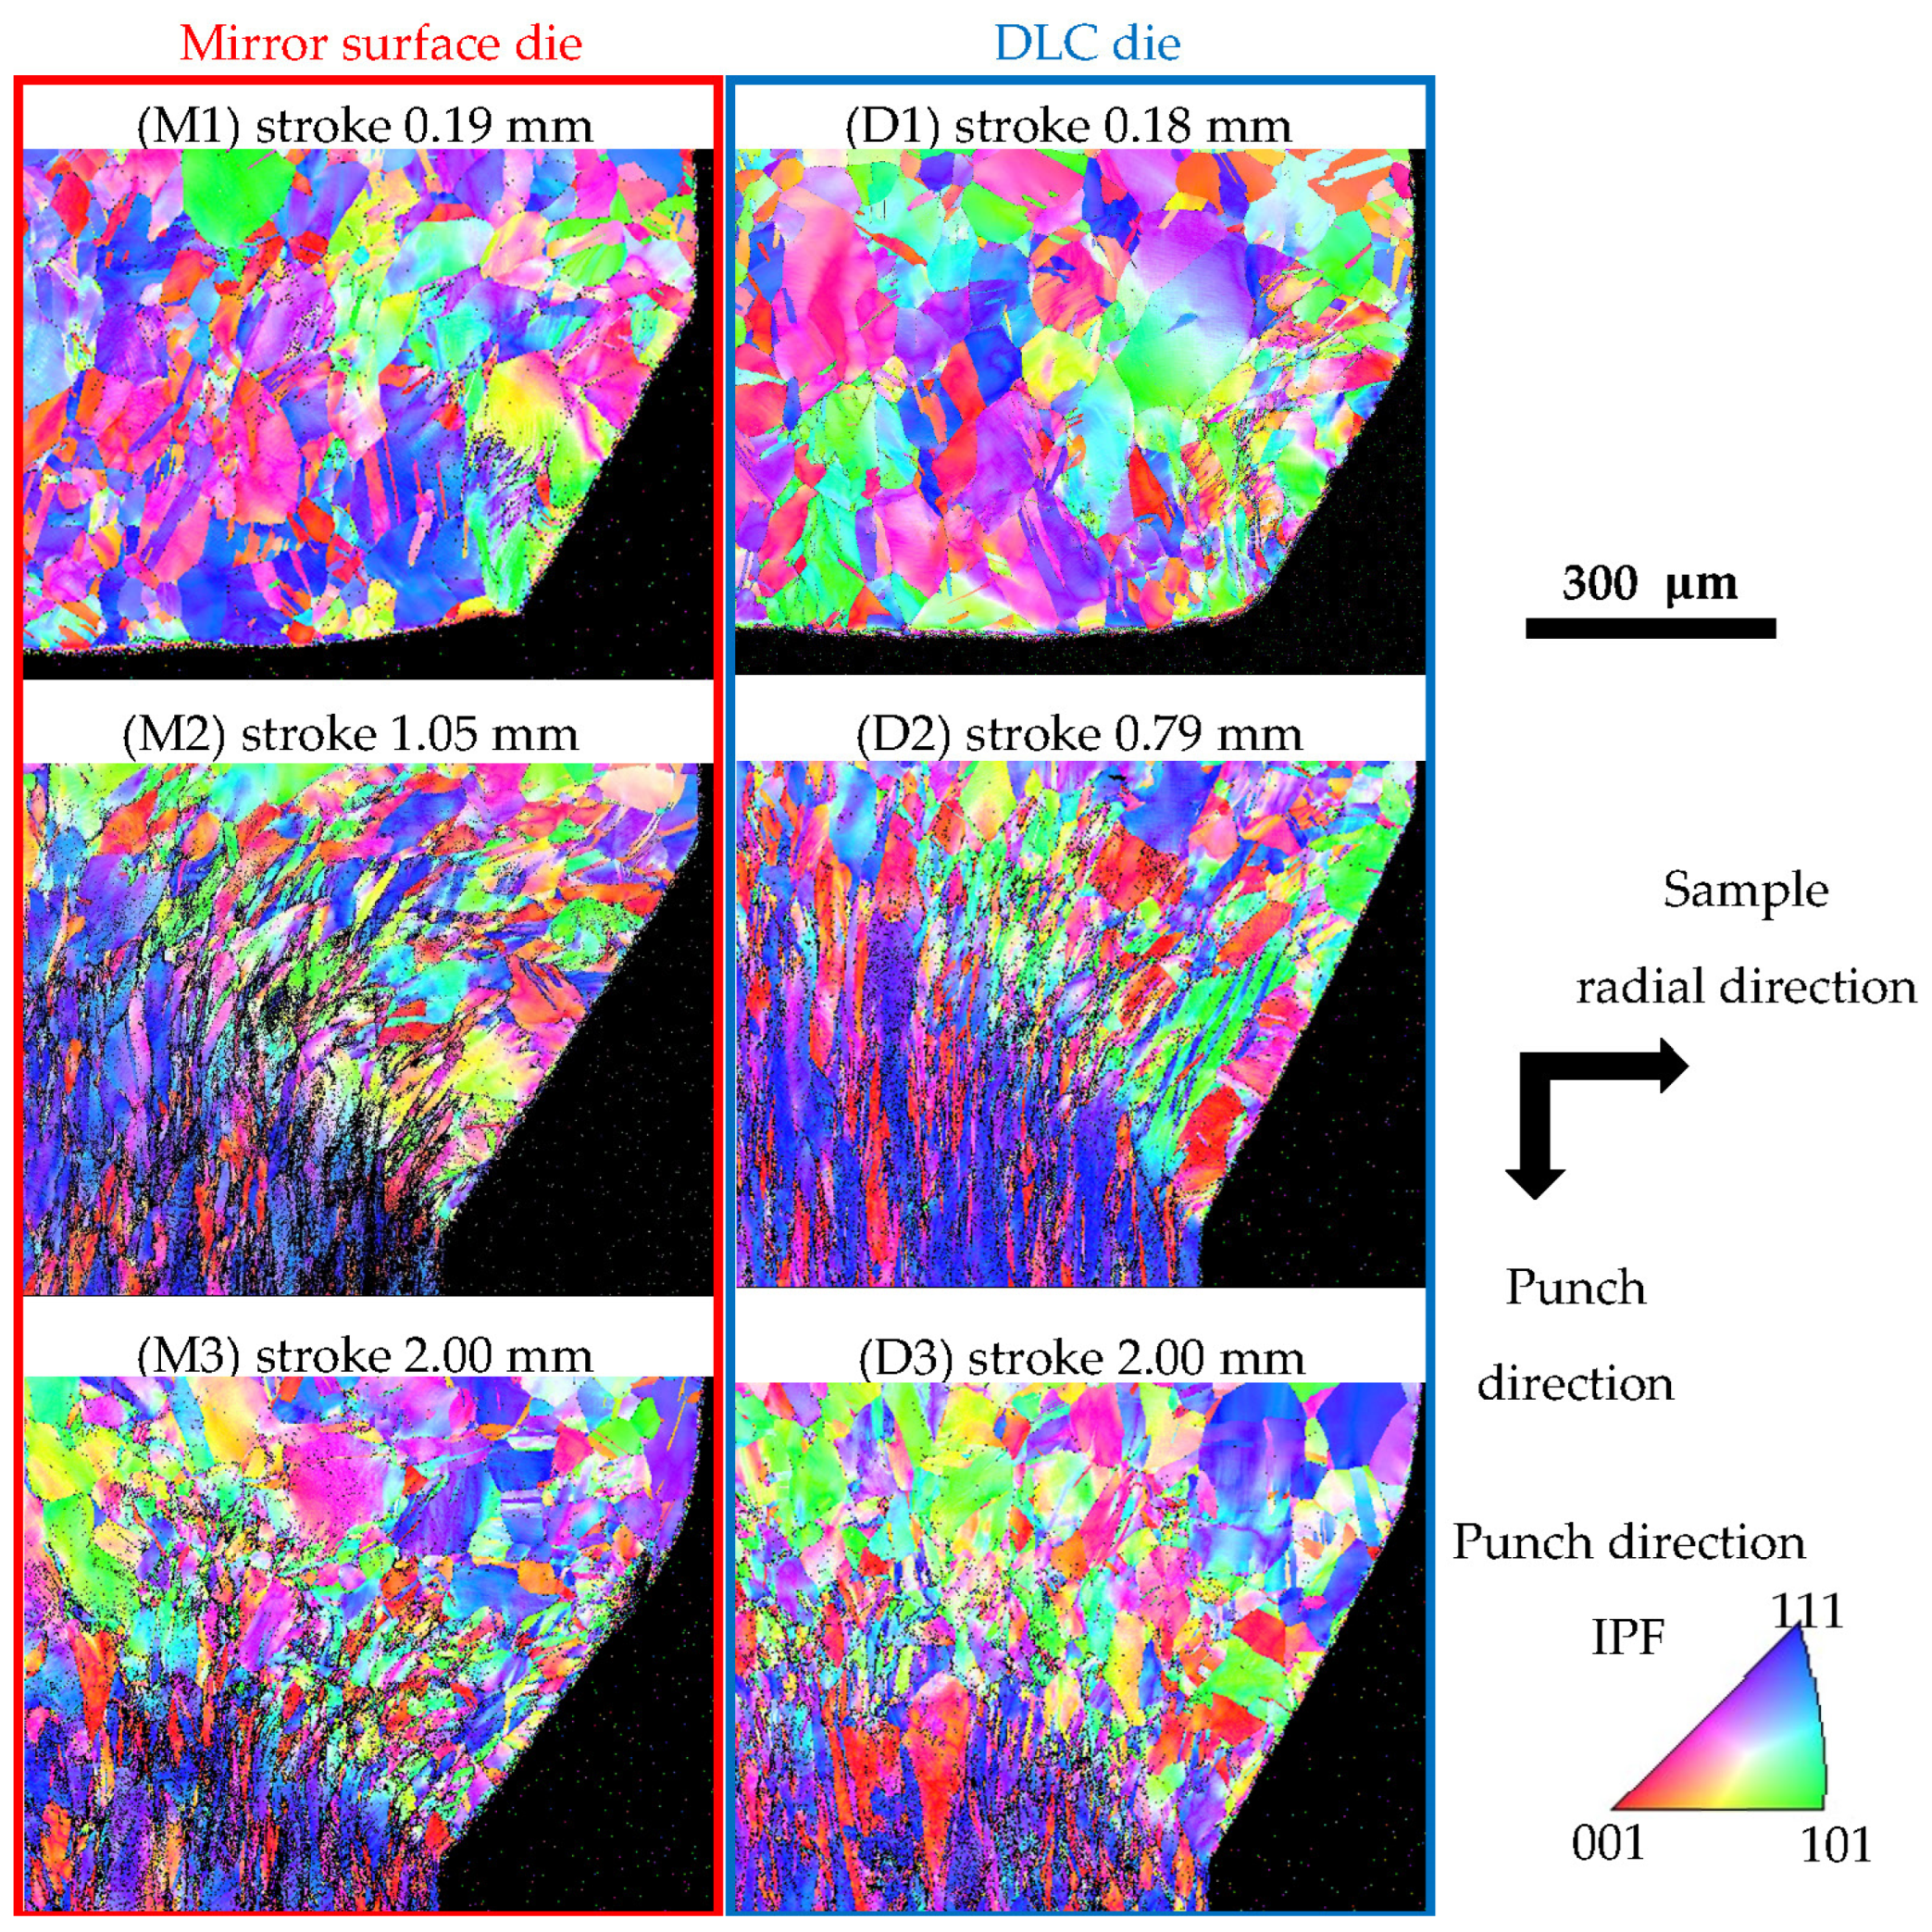
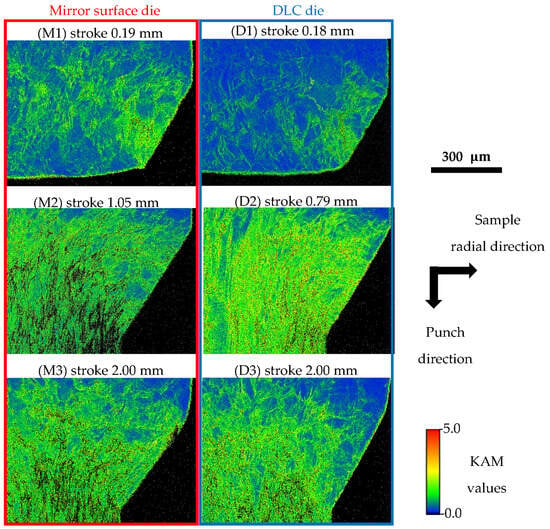
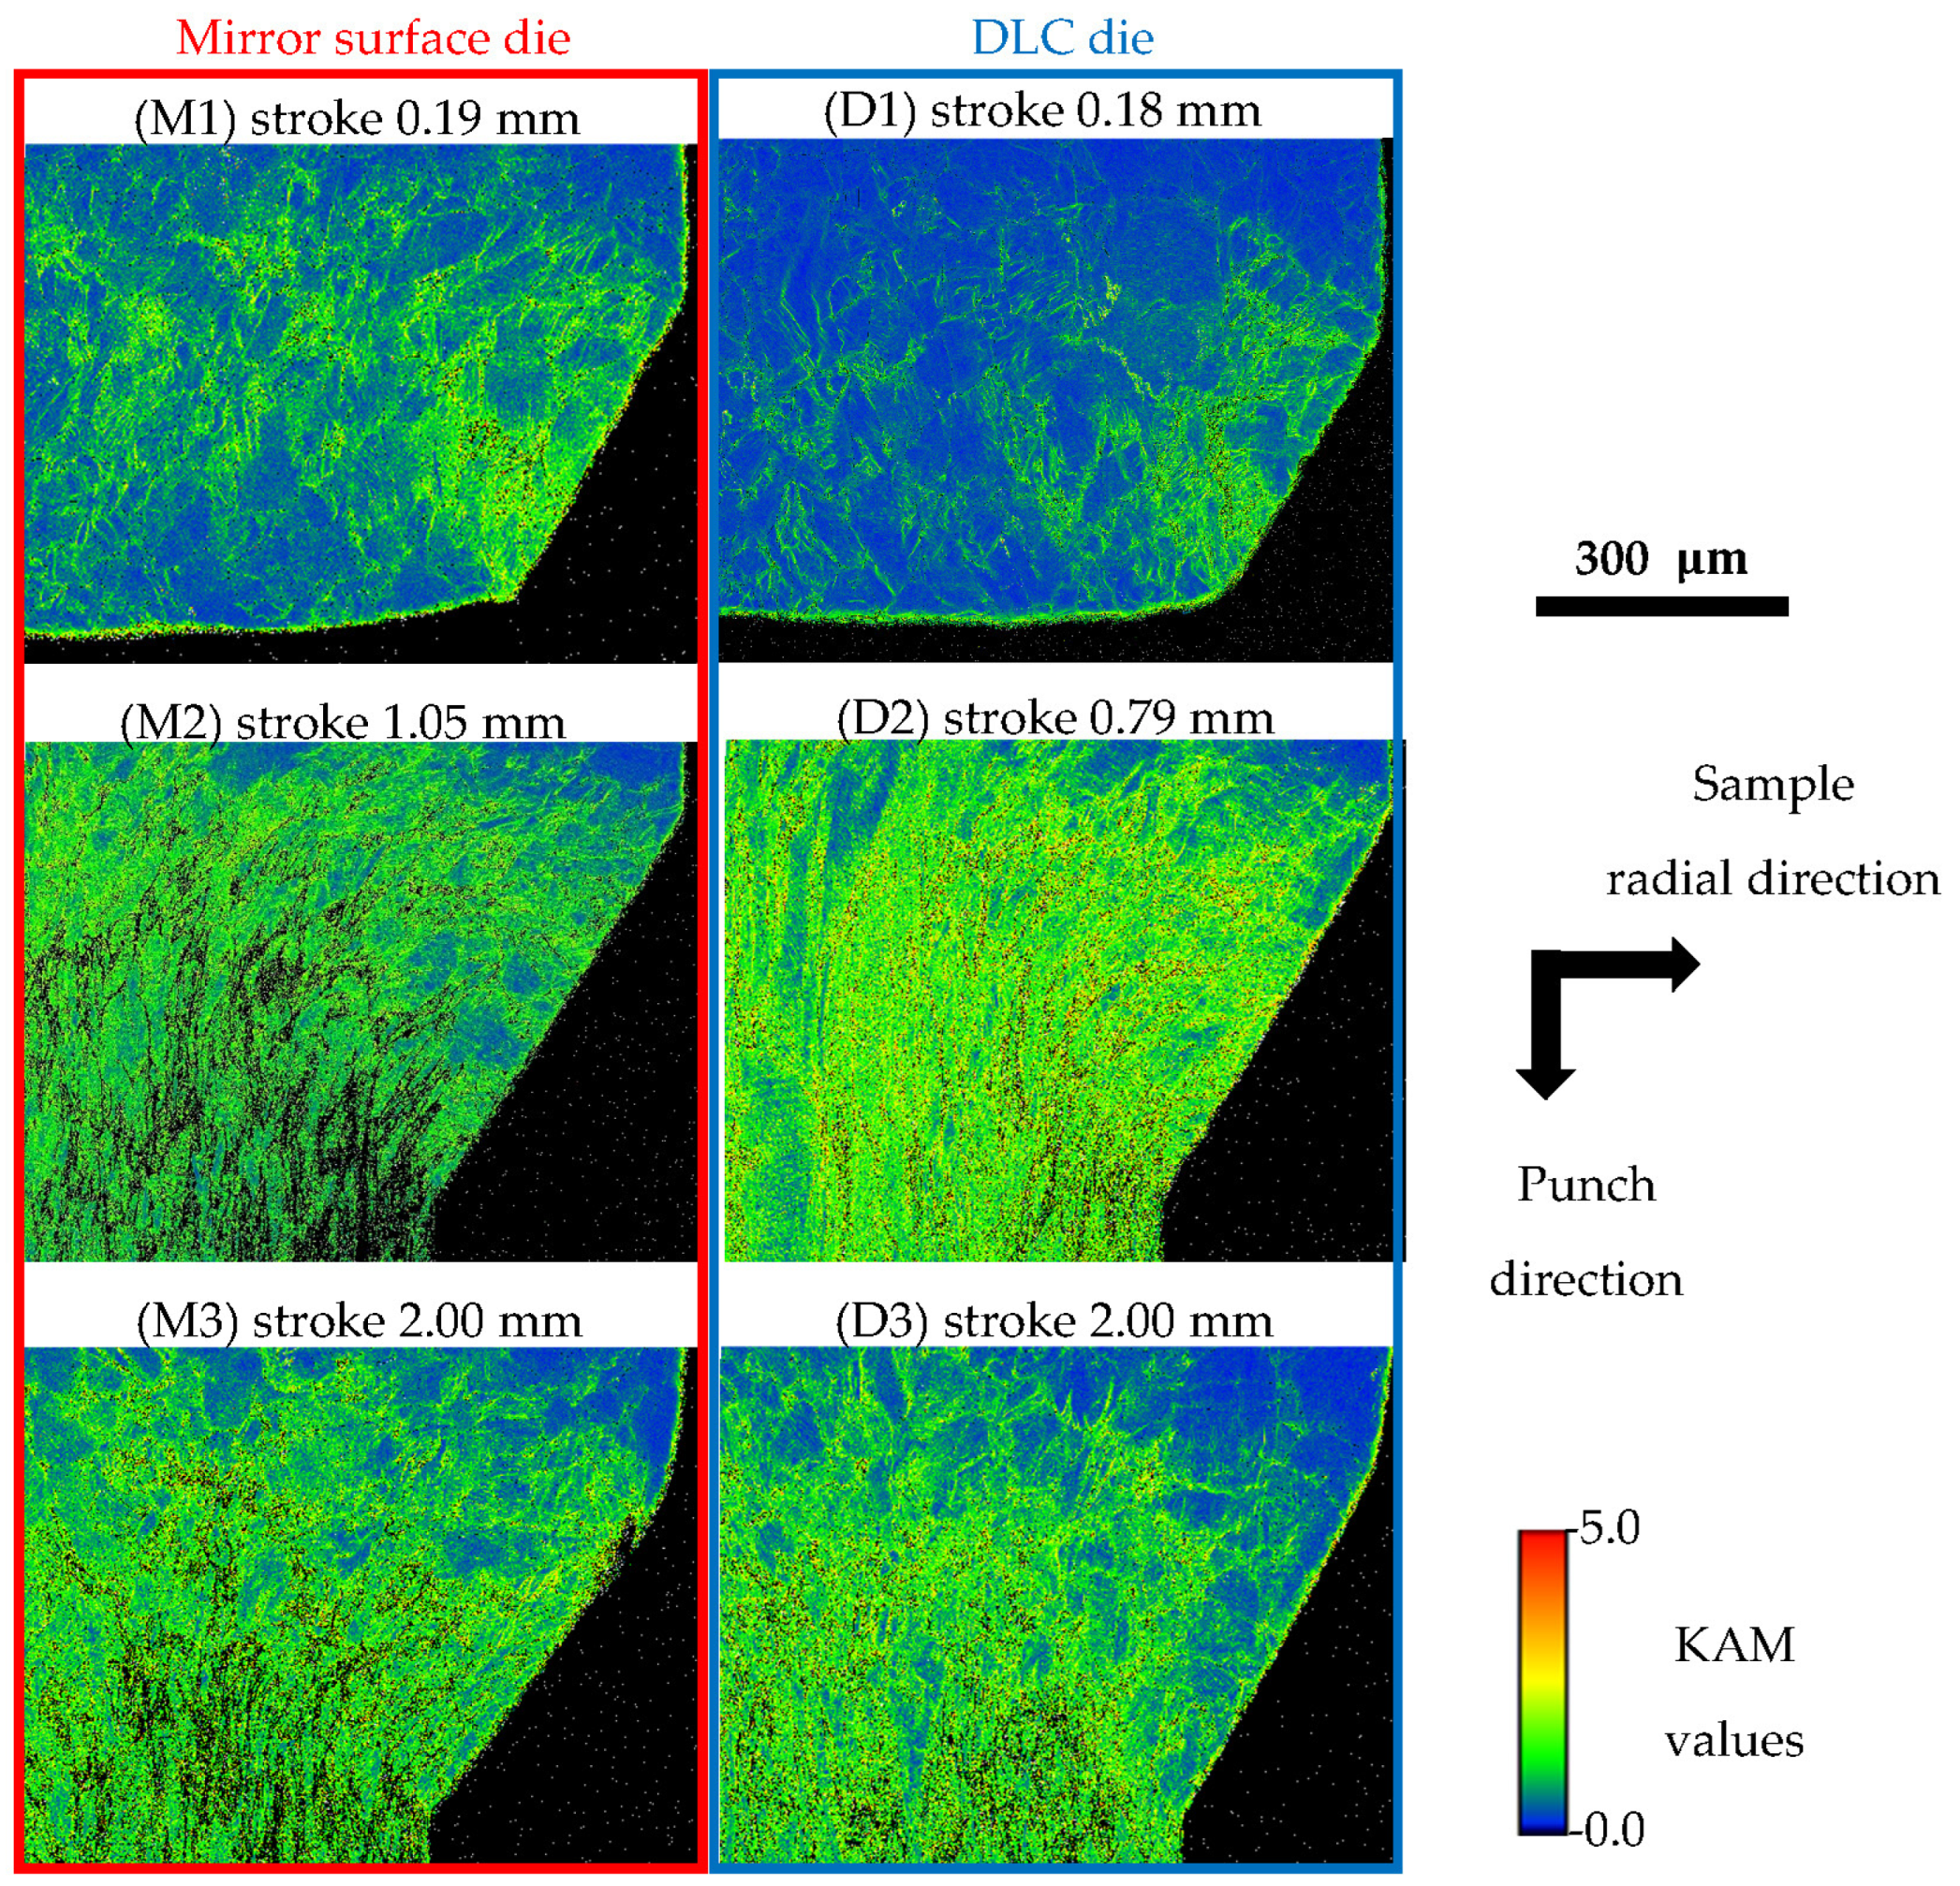
Figure 5 shows the evolution of the IPF maps with stroke progression for the mirror surface die and DLC die. Our previous study [14] demonstrated that microstructural evolution corresponds to the force response during micro-extrusion. Therefore, comparing the microstructures near the maximum force is important for understanding the reduction in maximum force achieved by DLC coating. Since the maximum force occurs at different strokes for the two dies, different stroke positions were selected for M2 and D2. Immediately after the start of the test (M1 and D1), a microstructure with nearly random crystallographic orientations, similar to the initial microstructure, flows into the tapered section for both dies. Around the maximum force in each force–stroke curve (M2 and D2), fiber textures develop, with ⟨111⟩ and ⟨001⟩ orientations preferentially aligned with the extrusion direction. After the force peak (M3 and D3), the region exhibiting the fiber textures decreases and is observed only near the bearing section. This microstructural evolution indicates that the internal deformation state in the tapered section changes substantially with stroke progression. However, no clear difference is observed between the mirror surface die and DLC die. Therefore, it is difficult to evaluate the effect of the die surface condition on the internal deformation state solely by comparing the IPF maps. Figure 6 shows the KAM maps of the tapered section for both the mirror surface die and DLC die, obtained from the same fields of view as those in Figure 5. In M1 and D1, heterogeneous distributions of KAM values are observed, with deformation concentrated near the die–billet contact interface. This result suggests that localized work hardening near the interface induces a radial hardness gradient within the billet. In M2 and D2, the green region expands inward toward the billet center, indicating the introduction of large strains over a wide area of the tapered section. This suggests that, as deformation progresses, the heavily work-hardened microstructure extends beyond the vicinity of the die–billet interface and eventually occupies most of the tapered section. In contrast, in M3 and D3, the green region in the tapered section decreases slightly, while the blue region with low KAM values expands near the container section. This suggests that, once deformation has progressed to a certain extent, the work-hardened microstructure occupying the tapered section is pushed forward. These changes in the KAM maps are consistent with the evolution of the deformation state previously reported by the authors to produce the peak in the force response [14]. Thus, the KAM maps effectively reflect changes in the internal deformation state of the billet. Detailed analysis of these maps may enable quantitative characterization of the internal deformation state at each stroke and evaluation of the effect of the die surface condition on its evolution.
Figure 5.
Evolution of the IPF maps in the tapered section with stroke progression.
Figure 6.
Evolution of the KAM maps in the tapered section with stroke progression.
4. Discussion
As shown in Section 3, the KAM maps reflect changes in the internal deformation state with stroke progression. However, their interpretation remains qualitative. GND density reflects lattice curvature associated with nonuniform plastic deformation, allowing quantitative evaluation of where such deformation develops and how it evolves during processing. Furthermore, because GND density can be estimated from EBSD orientation data, its evolution can be related to the development of deformation microstructures. Therefore, in this study, we examined whether GND density estimated from the KAM maps could be used to quantitatively evaluate the evolution of the internal deformation state.
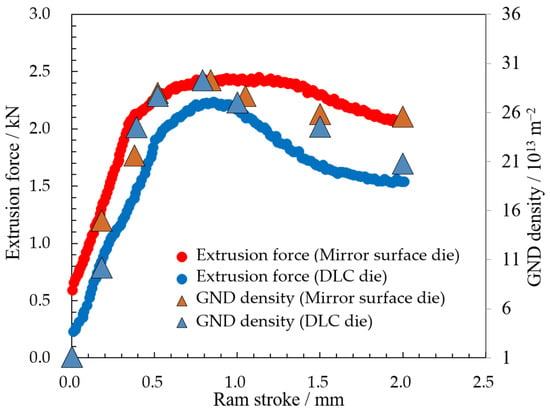
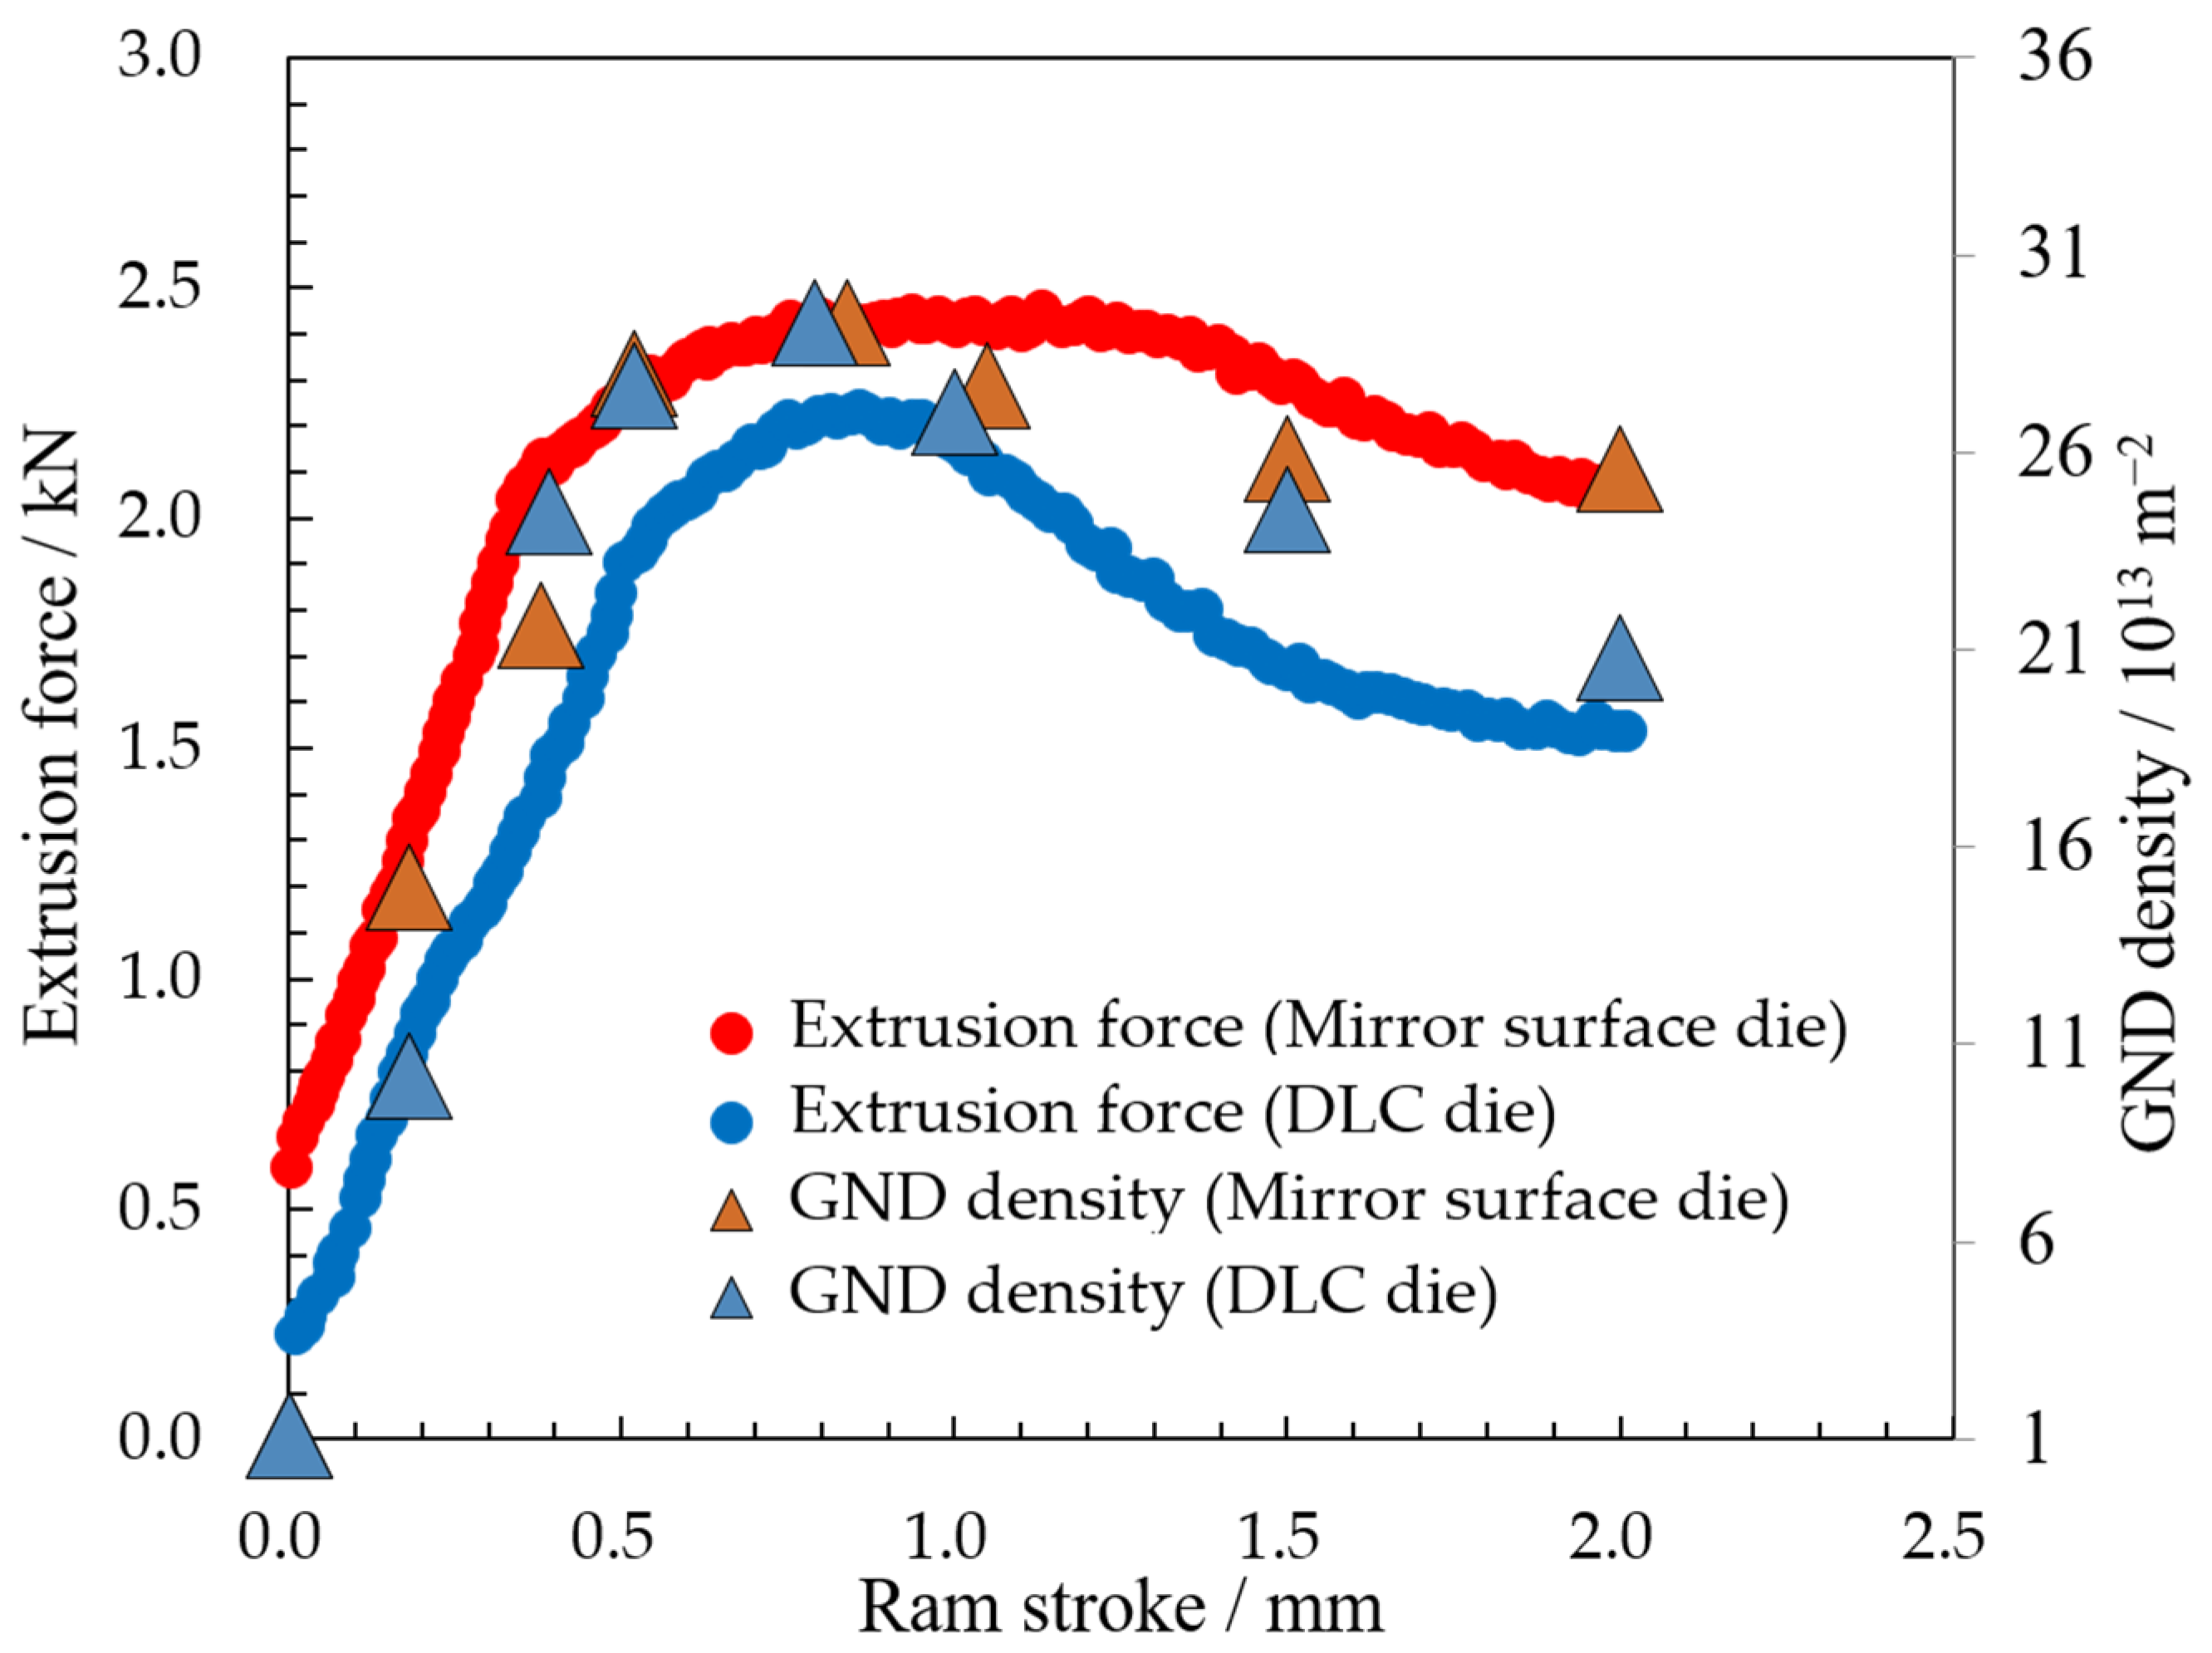
Figure 7 shows the GND density in the tapered section at each stroke, superimposed on the force–stroke curves. The GND density was calculated over the entire tapered section, as shown in Figure 6, using an EBSD step size of 0.5 μm. For both dies, the GND density increases after the start of the test, reaches its maximum near the maximum force, and subsequently decreases. This evolution of the GND density captures changes in the internal deformation state associated with the development and subsequent release of the work-hardened deformation structure in the tapered section, as observed in the KAM maps (Figure 6). These results suggest that changes in GND density can be used to quantitatively evaluate the evolution of the internal deformation state. For both dies, changes in GND density correspond closely to changes in the extrusion force. This correspondence suggests that the force response during non-steady-state deformation is influenced by the internal deformation state and that changes in this state give rise to the force peak. Since the maximum extrusion force is reached at this peak, controlling the internal deformation state is considered important for reducing the maximum extrusion force. The post-peak behaviors of the extrusion force and GND density are compared between the mirror surface and DLC dies. From their respective maximum values to a stroke of 2.00 mm, the force decreases by 15.5% for the mirror surface die and 31.3% for the DLC die, indicating a more pronounced force peak for the DLC die. Similarly, the GND density decreases by 12.6% and 29.0% for the mirror surface and DLC dies, respectively. These results demonstrate a close correspondence between the force response and the evolution of GND density. Considering the plastic flow behavior reported in our previous study [14], the larger reductions observed for the DLC die suggest that the work-hardened deformation structure accumulated in the tapered section is transported forward more readily than with the mirror surface die. Consequently, deformation reached a steady state over a shorter stroke interval, resulting in the sharper force peak observed for the DLC die. These results suggest that the die surface condition influences the sequence of changes in the internal deformation state during non-steady-state deformation—including the formation of the DMLZ, the accumulation of the work-hardened deformation structure, and its subsequent forward displacement—and thereby alters the force response.
Figure 7.
Comparison between changes in GND density with stroke progression and force behavior.
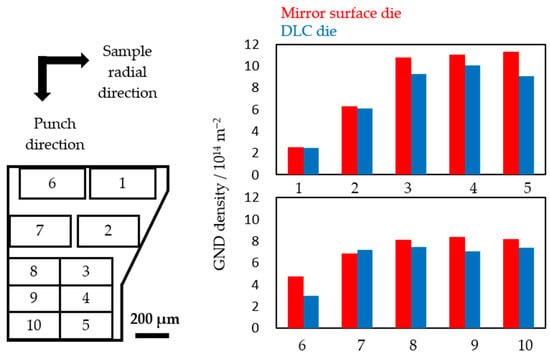
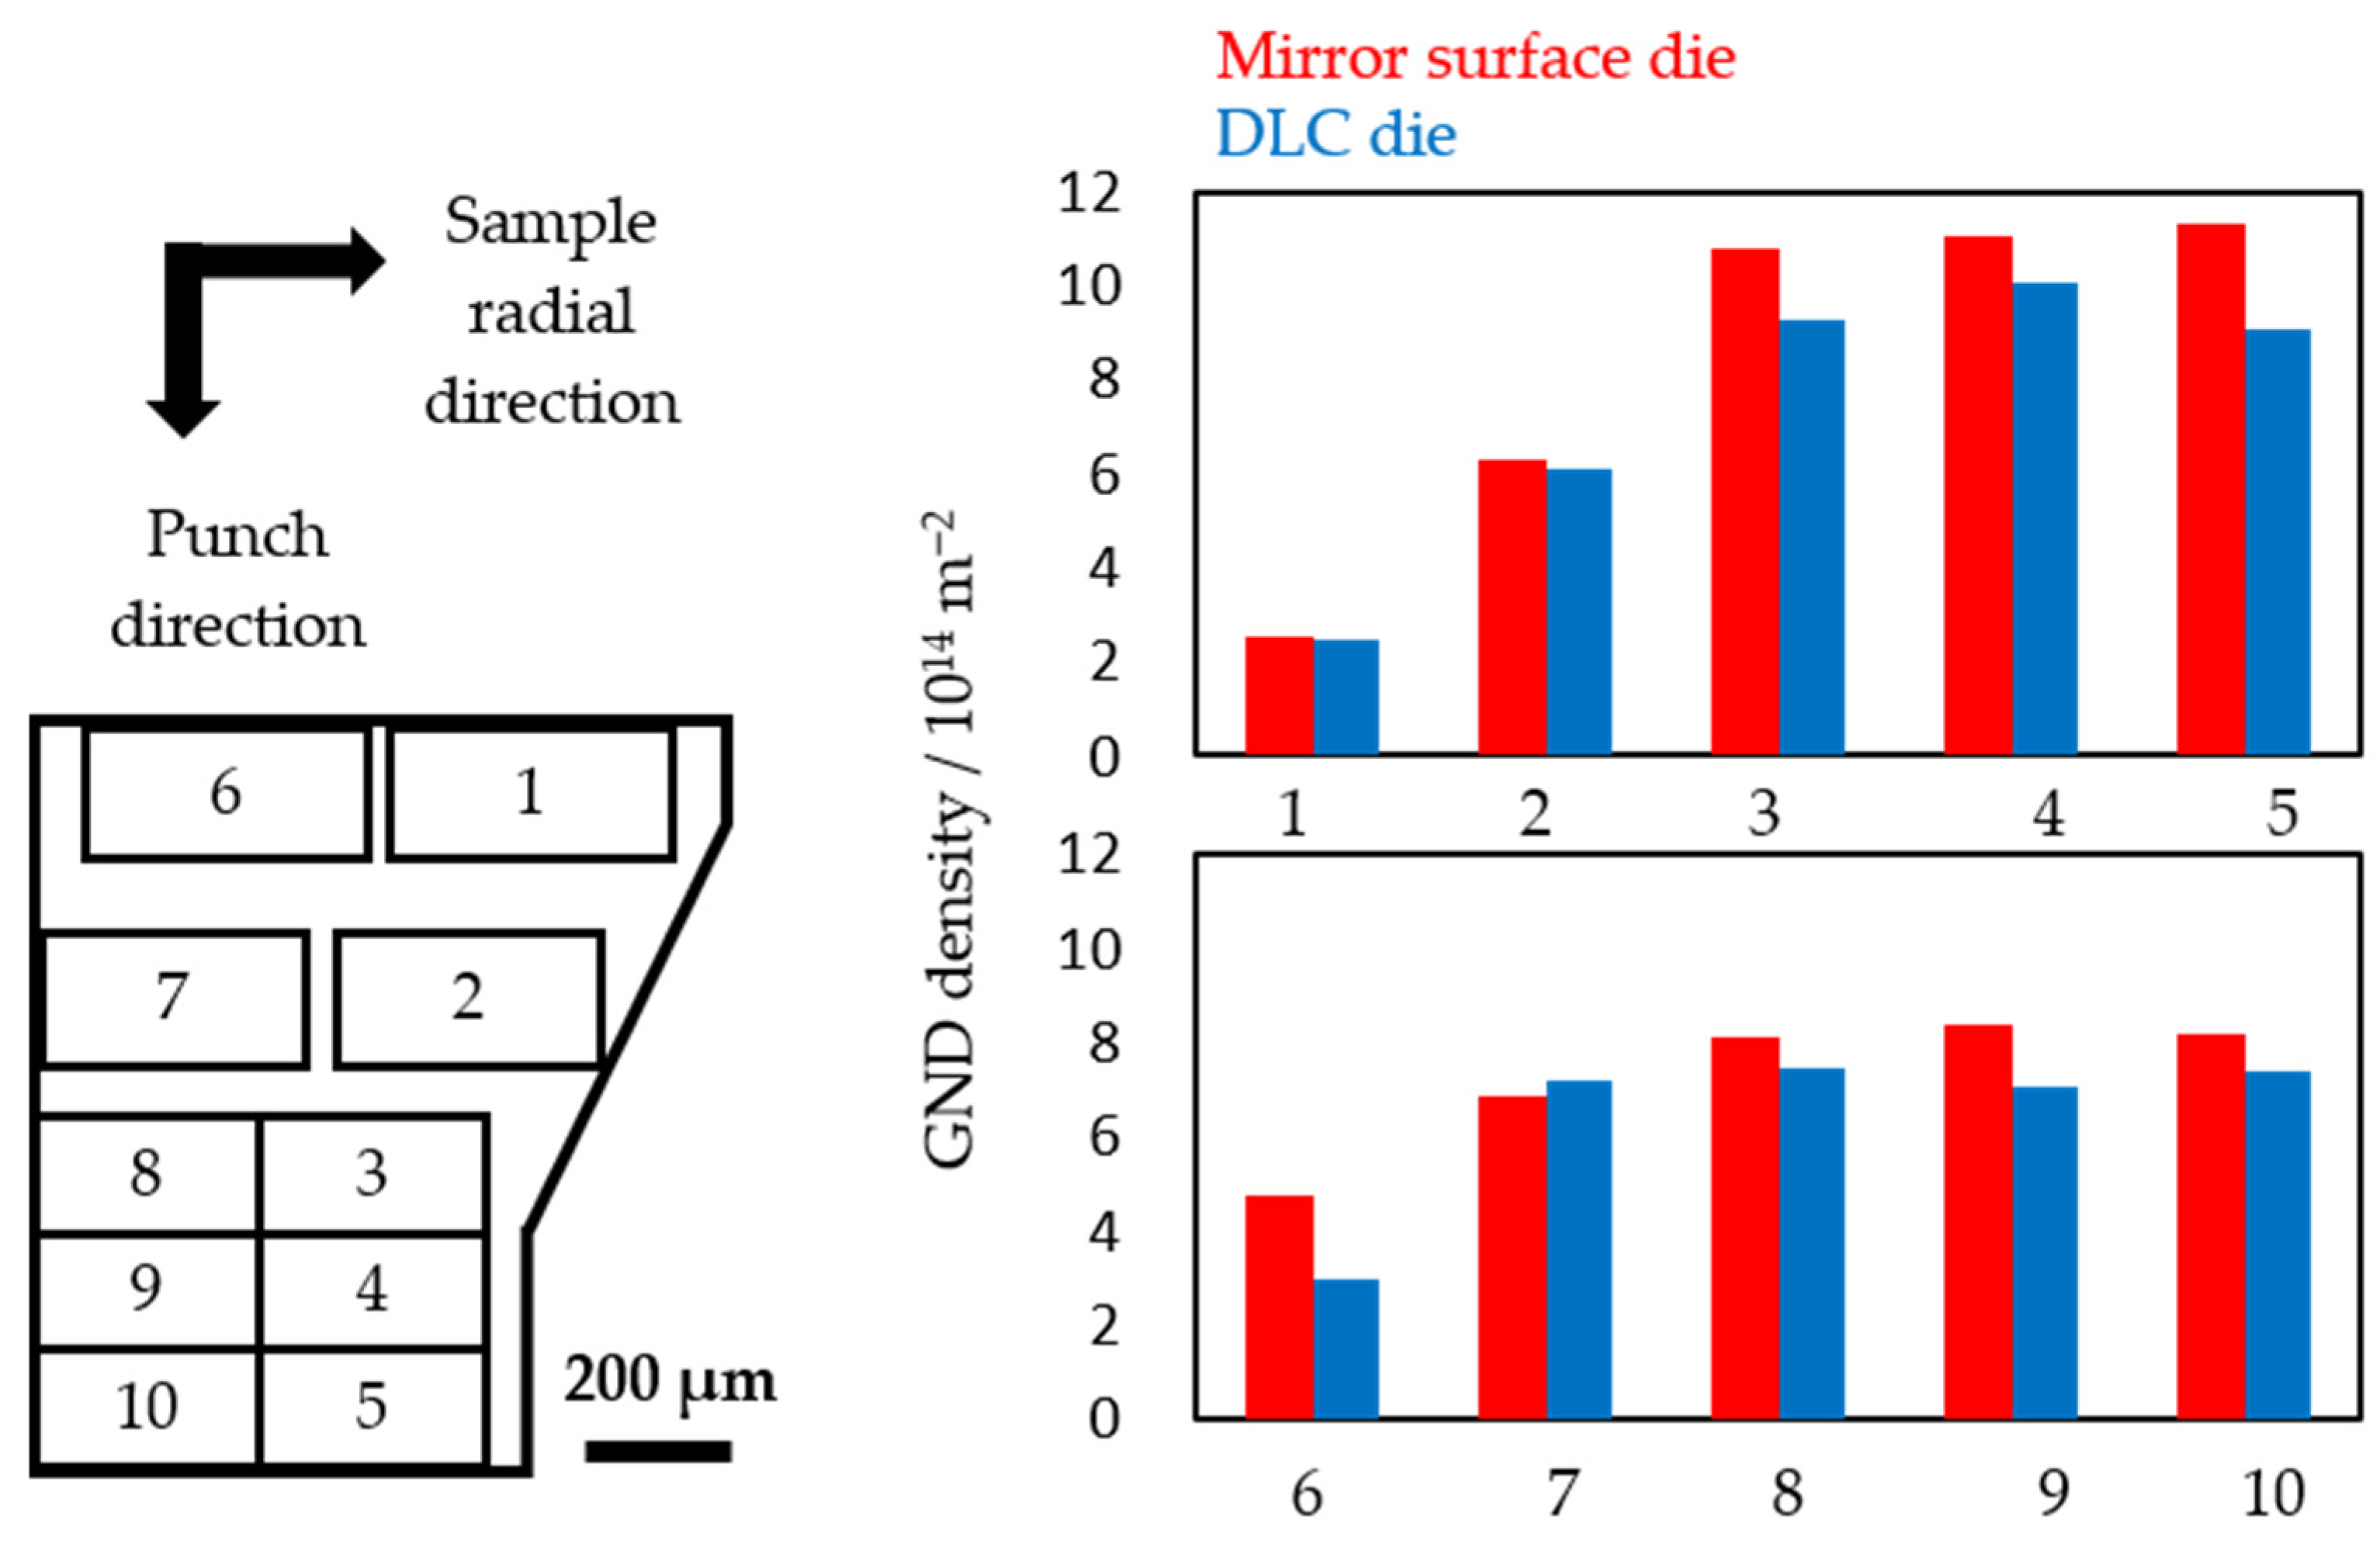
Calculating the GND density over a wide field of view, as shown in Figure 7, is useful for identifying the overall trend in GND density variation. However, as evident from the IPF maps in Figure 5, the material undergoes progressively greater deformation toward the bearing section, accompanied by grain refinement. Such spatial variations in grain size may affect GND analysis. Therefore, to improve the accuracy of the GND density measurements, the tapered section was divided into multiple observation areas, and the step size and field of view were adjusted according to the local grain size. Specifically, the field of view was selected to include approximately 100 grains in each observation area, while the EBSD step size was set to approximately one-tenth or less of the local grain size. These conditions were chosen to balance the number of grains analyzed and the spatial resolution required to evaluate local misorientations. Figure 8 shows (a) the observation areas and (b) the GND densities measured near the maximum force for each die. Although the GND density was measured only once in each observation area for each die, the results show a heterogeneous distribution of GND density near the maximum force. First, focusing on areas 1–5 near the die–billet interface, the GND density increases markedly from area 1 to area 3 and changes only slightly from area 3 to area 5. This trend is observed for both the mirror surface and DLC dies, indicating that deformation is concentrated in the tapered section irrespective of the die surface condition. However, the GND density is lower for the DLC die in all five areas. In particular, comparison of area 5 near the exit of the tapered section shows that the GND density for the DLC die is 14% lower than that for the mirror surface die. This result suggests that the DLC coating alters plastic flow near the die–billet interface, suppressing localized deformation and thereby promoting smoother material flow as the billet is formed into the target shape. Next, focusing on areas 6–10 near the billet axis, the GND density is generally lower than that in the corresponding areas near the die–billet interface. In particular, the GND density in area 8 is lower than that in area 3 by 25% for the mirror surface die and 20% for the DLC die. This difference is considered to reflect the weaker influence of die–billet interfacial friction farther from the interface. Even in these regions, however, the GND density remains lower for the DLC die than for the mirror surface die in most observation areas. In particular, near the exit of the tapered section (area 8), it is 8% lower for the DLC die than for the mirror surface die. Comparable reductions are also observed in areas 9 and 10, indicating a consistent difference between the two dies across these observation areas. These results suggest that, although the suppressive effect of the DLC coating is less pronounced near the billet axis, it still contributes to reducing localized plastic flow in this region. The smoother plastic flow over a wide region promoted by the DLC coating is considered to reduce the extrusion force. This interpretation is consistent with the result shown in Figure 4, where the maximum extrusion force for the DLC die is 8.6% lower than that for the mirror surface die. As mentioned above, dislocations are classified into GND and SSD, and GND density represents only a component of the total dislocation density. However, previous studies have reported a correlation between GND density and total dislocation density [20,21]. Therefore, the differences in GND density observed between the two dies raise the possibility that controlling die surface condition may influence dislocation-density-dependent properties of the processed product. Further investigation is required to verify this possibility.
Figure 8.
(a) Schematic diagram of the observation areas, (b) GND density in each obser-vation area.
5. Conclusions
To investigate the effect of die surface conditions on microstructural changes and force behavior in micro-extrusion of pure copper, micro-extrusion tests were conducted using two types of dies with different surface finishes. Using KAM maps and GND density, the changes in the internal deformation state inside the sample with stroke progression and the influence of die surface conditions on these changes were analyzed, resulting in the following findings.
- For both the mirror surface die and the DLC die, the GND density in the tapered section increased with stroke progression, reached its maximum near the maximum extrusion force, and subsequently decreased. This evolution quantitatively captured the accumulation and subsequent forward displacement of the work-hardened deformation structure. The close correspondence between the GND density and force response indicates that the force peak is strongly governed by the evolution of the internal deformation state.
- From their respective maximum values to a stroke of 2.00 mm, the extrusion force decreases by 15.5% for the mirror-surface die and 31.3% for the DLC die. Correspondingly, the GND density decreases by 12.6% and 29.0%, respectively, demonstrating a close correspondence between the force response and the evolution of GND density for both dies. These findings suggest that the work-hardened deformation structure accumulated in the tapered section is transported forward more readily with the DLC die, allowing deformation to reach a steady state over a shorter stroke interval and contributing to the observed difference in force behavior. Thus, the die surface condition affects the evolution of the internal deformation state during non-steady-state deformation and consequently alters the force response.
- Near the maximum force, the GND density was generally lower for the DLC die over a wide region extending from the die–billet interface toward the billet axis. This result suggests that the DLC coating promotes smoother plastic flow throughout the tapered section, not just near the die–billet interface, consistent with the 8.6% reduction in the maximum extrusion force. These findings raise the possibility of improving dislocation-density-dependent properties of the extruded product through the control of die surface conditions.
Author Contributions
Conceptualization, K.S., M.I., T.F. and T.S.; Methodology, K.S., M.I., T.F. and T.S.; Formal analysis, K.S. and M.I.; Investigation, K.S.; Resources, K.S.; Data curation, K.S.; Writing—original draft, K.S.; Writing—review & editing, M.I., T.F. and T.S.; Visualization, K.S.; Supervision, M.I., T.F. and T.S.; Project administration, M.I., T.F. and T.S. All authors have read and agreed to the published version of the manuscript.
Funding
This research received no external funding.
Data Availability Statement
The original contributions presented in this study are included in the article. Further inquiries can be directed to the corresponding author.
Conflicts of Interest
Authors Keisuke Sugiyama and Masato Ito were employed by the company Mitsubishi Materials Corporation. The remaining authors declare that this research was conducted in the absence of any commercial or financial relationships that could be construed as a potential conflict of interest.
References
- Podobińska-Staniec, M.; Wiktor-Sułkowska, A.; Kustra, A.; Lorenc-Szot, S. Copper as a Critical Resource in the Energy Transition. Energies 2025, 18, 969. [Google Scholar] [CrossRef] [Scilit]
- Fernanda Soares, A.; Giovinazzo Spers, R.; de Oliveira Santos Jhunior, R. Projection of Global Copper Demand in the Context of Energy Transition. Resour. Policy 2025, 103, 105567. [Google Scholar] [CrossRef] [Scilit]
- Copper in the Age of AI. Available online: https://www.spglobal.com/en/research-insights/special-reports/copper-in-the-age-of-ai (accessed on 23 February 2026).
- Jeswiet, J.; Geiger, M.; Engel, U.; Kleiner, M.; Schikorra, M.; Duflou, J.; Neugebauer, R.; Bariani, P.; Bruschi, S. Metal Forming Progress since 2000. CIRP J. Manuf. Sci. Technol. 2008, 1, 2–17. [Google Scholar] [CrossRef] [Scilit]
- Dohda, K.; Makino, T. Tribology in Micro/Meso-Scale Forming. J. Jpn. Soc. Technol. Plast. 2008, 49, 638–642. [Google Scholar] [CrossRef] [Scilit]
- Engel, U.; Eckstein, R. Microforming—From Basic Research to Its Realization. J. Mater. Process. Technol. 2002, 125–126, 35–44. [Google Scholar] [CrossRef] [Scilit]
- Parasız, S.A.; Kinsey, B.L.; Mahayatsanun, N.; Cao, J. Effect of Specimen Size and Grain Size on Deformation in Microextrusion. J. Manuf. Processes 2011, 13, 153–159. [Google Scholar] [CrossRef] [Scilit]
- Krishnan, N.; Cao, J.; Dohda, K. Study of the Size Effect on Friction Conditions in Microextrusion—Part I: Microextrusion Experiments and Analysis. J. Manuf. Sci. Eng. 2006, 129, 669–676. [Google Scholar] [CrossRef] [Scilit]
- Gong, F.; Guo, B.; Wang, C.; Shan, D. Micro Deep Drawing of Micro Cups by Using DLC Film Coated Blank Holders and Dies. Diam. Relat. Mater. 2011, 20, 196–200. [Google Scholar] [CrossRef] [Scilit]
- Funazuka, T.; Takatsuji, N.; Dohda, K.; Mahayotsanun, N. Effect of Die Angle and Friction Condition on Formability in Micro Extrusion: Research on Forward-Backward Micro Extrusion of Aluminum Alloy 2nd Report. J. JSTP 2018, 59, 101–106. [Google Scholar] [CrossRef] [Scilit]
- Funazuka, T.; Horiuchi, S.; Dohda, K.; Shiratori, T. Effect of CoCrMo Die and Tool Surface Nano-Texture on Micro Backward Extrusion Formability of AA6063-T6. J. Micro-Nano-Manuf. 2023, 11, 021001. [Google Scholar] [CrossRef] [Scilit]
- Chan, W.L.; Fu, M.W.; Yang, B. Study of Size Effect in Micro-Extrusion Process of Pure Copper. Mater. Des. 2011, 32, 3772–3782. [Google Scholar] [CrossRef] [Scilit]
- Chan, W.L.; Fu, M.W.; Liu, J. Modeling of Grain Size Effect on Micro Deformation Behavior in Micro-Forming of Pure Copper. Mater. Sci. Eng. A 2010, 527, 6638–6648. [Google Scholar] [CrossRef] [Scilit]
- Sugiyama, K.; Ito, M.; Yaguchi, K.; Funazuka, T.; Shiratori, T. Effect of Changes in Plastic Flow During Non-Steady State Deformation on Force Behavior in Micro-Extrusion of Pure Copper. Materials 2026, 19, 1374. [Google Scholar] [CrossRef] [Scilit] [PubMed]
- Nye, J.F. Some Geometrical Relations in Dislocated Crystals. Acta Metall. 1953, 1, 153–162. [Google Scholar] [CrossRef] [Scilit]
- Ashby, M.F. The Deformation of Plastically Non-Homogeneous Materials. Philos. Mag. J. Theor. Exp. Appl. Phys. 1970, 21, 399–424. [Google Scholar] [CrossRef] [Scilit]
- Umezaki, S.; Murata, Y.; Nomura, K.; Kubushiro, K. Quantitative Analysis of Dislocation Density in an Austenitic Steel after Plastic Deformation. J. Jpn. Inst. Met. Mater. 2014, 78, 218–224. [Google Scholar] [CrossRef] [Scilit]
- Moussa, C.; Bernacki, M.; Besnard, R.; Bozzolo, N. Statistical Analysis of Dislocations and Dislocation Boundaries from EBSD Data. Ultramicroscopy 2017, 179, 63–72. [Google Scholar] [CrossRef] [Scilit] [PubMed]
- Hayashi, M.; Ito, Y.; Takano, K.; Mori, H.; Matsunaga, H.; Onuki, Y.; Suzuki, S.; Sato, S. Effect of Kinds of Alloying Elements in Solid–Solution Copper Alloys on Dislocation Evolution. J. Jpn. Inst. Copp. 2020, 59, 70–75. [Google Scholar] [CrossRef] [PubMed]
- Kamaya, M. Assessment of Local Deformation Using EBSD: Quantification of Accuracy of Measurement and Definition of Local Gradient. Ultramicroscopy 2011, 111, 1189–1199. [Google Scholar] [CrossRef] [Scilit] [PubMed]
- Daigo, N.; Hayashi, M.; Iihara, T.; Takano, K.; Ito, Y.; Matsunoshita, H.; Maki, K.; Mori, H.; Suzuki, S.; Sato, S. Effects of Deformation Modes on GN/SS Dislocation Multiplication in Highly Deformed Copper Alloys. Adv. X-Ray Chem. Anal. Jpn. 2024, 55, 243–250. [Google Scholar] [CrossRef] [PubMed]
Disclaimer/Publisher’s Note: The statements, opinions and data contained in all publications are solely those of the individual author(s) and contributor(s) and not of MDPI and/or the editor(s). MDPI and/or the editor(s) disclaim responsibility for any injury to people or property resulting from any ideas, methods, instructions or products referred to in the content. |
© 2026 by the authors. Licensee MDPI, Basel, Switzerland. This article is an open access article distributed under the terms and conditions of the Creative Commons Attribution (CC BY) license.