


Abstract
Rubber tracks are widely used on agricultural tractors, harvesters and lightweight field platforms due to their low ground-contact pressure, adaptability to uneven terrain and effective vibration attenuation. Under complex agricultural operating conditions with alternating soft/wet soil, straw cover, hard field ridges and gravel, tracks are subjected to combined tensioning, drive engagement, road-wheel compression, steering shear and cyclic bending, in which abrasive wear, fatigue cracking and rubber–reinforcement debonding usually develop together, critically affecting service life and reliability. Following the evidence chain of “operating condition–load–damage–life”, this review systematically summarizes the research progress on the failure mechanisms and durability of rubber tracks under complex agricultural operating conditions. It first summarizes typical service conditions and the spatial–temporal non-uniformity of track loads and the main failure modes and clarifies the many-to-many relationships between operating conditions and failures. It then analyzes damage evolution from four aspects: frictional wear and surface damage, fatigue crack initiation and propagation, rubber–reinforcement interface and composite failure, and coupling of multiple failure modes, highlighting geometric thinning, temperature rise and stiffness degradation as key feedback pathways accelerating late-stage damage. Furthermore, it reviews the scope and limitations of durability testing and damage characterization, numerical simulation (finite element, multibody dynamics and discrete element methods), fatigue and wear life prediction, and data-driven remaining useful life prediction. Finally, influencing factors are summarized from material, structural, operational and environmental aspects, together with multi-objective optimization design strategies. The analysis shows that although mature methodological systems exist in tire wear and rubber fatigue research, agricultural rubber tracks still lack a complete evidence chain connecting field load spectra, local damage and whole-track life, with distorted accelerated tests, poor cross-condition generalization and scarce field damage data as the main bottlenecks. Future research should prioritize reproducible field load spectra and unified test protocols, hierarchical accelerated testing that preserves failure mechanisms, and mechanism-constrained data-driven life prediction models, so as to support rubber track design that balances durability and soil protection across agricultural scenarios.
1. Introduction
Rubber tracks combine low ground-contact pressure, adaptability to uneven terrain, and effective vibration attenuation and are widely used on agricultural tractors, harvesters, and lightweight field platforms. Unlike road tires, they operate for long periods across alternating soft soil, straw cover, hard field ridges, and gravel while undergoing tensioning, drive engagement, road-wheel compression, steering shear, and cyclic bending. Large deformation and viscoelasticity couple mechanical loads, heat generation, and damage; surface wear, fatigue cracking, and debonding between rubber and reinforcement therefore often develop together. Reviews of tire wear identify viscoelastic deformation, interfacial friction, temperature, and material fatigue as interacting factors, while noting the lack of a unified empirical, analytical, numerical, and data-driven framework transferable across materials and operating conditions [1]. Rubber fatigue studies generally distinguish crack initiation from crack growth, with the two approaches depending differently on specimen defects, loading paths, and material parameters [2]. These insights provide a foundation for agricultural rubber-track research, but they cannot replace track-scale load reconstruction and failure validation [3,4].
This review examines the failure mechanisms and durability of rubber tracks under complex agricultural operating conditions. It first summarizes the load characteristics and typical failure modes arising from soil conditions, vehicle parameters, and track motion. It then explains damage evolution through wear, fatigue, interfacial damage, and thermomechanical coupling. Next, it compares the scope of experimental characterization, finite element analysis, multibody dynamics, mechanistic life models, and data-driven methods. Finally, it discusses the effects of materials, structure, operation, and the environment, and identifies directions for design optimization in agriculture. The review emphasizes links among evidence at different scales: field conditions determine time-varying track loads; local stress and temperature govern crack growth and interfacial damage; and experiments and models are credible only when they reproduce this transfer of loads and damage.
An agricultural rubber track is more than a flexible belt under tension. It is a cyclic load-bearing system comprising ground-contact rubber, reinforcement layers, drive lugs, and locally applied rubber. During each revolution, a material element passes through drive engagement, free-span tension, bending around wheels, road-wheel compression, and soil shear. Load direction, magnitude, and duration change with position. Agricultural operation adds low-speed heavy loading, prolonged continuous use, and frequent changes in the contact medium. Early local damage may cause little immediate loss of performance, but stiffness changes and load redistribution can amplify it over subsequent cycles. Durability research must therefore explain how small, dispersed, and difficult-to-observe defects develop into structural failures that compromise traction, guidance, and safety.
Relevant findings are dispersed across rubber fatigue, tire wear, steel-cord composites, tracked-vehicle dynamics, and agricultural soil mechanics. These fields study different objects and outcomes: materials research often describes life using cycle count, crack length, or tearing energy; tire research focuses on contact stress and high-speed durability; and agricultural-vehicle research emphasizes slip, tractive efficiency, vibration, and soil compaction. Combining their conclusions without regard to scale can conflate different physical quantities that share the same name. This review therefore follows a chain of questions rather than disciplinary boundaries. It treats vehicle operating conditions as inputs, local stress, temperature, and interface state as intermediate variables, and wear, cracking, and debonding as observable outcomes. This structure clarifies what each method can establish and where evidence is missing. The central gap is often the reliable mapping from field loads to fatigue and damage parameters, rather than another parameter in isolation.
Here, durability has three dimensions: structural life, retention of performance, and maintainability. Structural life concerns cracking, debonding, and fracture. Performance retention asks whether traction, guidance, and vibration attenuation still meet operational requirements after wear. Maintainability concerns whether damage can be detected and replacement scheduled before failure. Although these dimensions use different endpoints, all are governed by the same operating conditions and damage processes. A common framework prevents the high-cycle life of a material specimen from being mistaken for the service life of a complete track and explains why a track may need replacement before it breaks.
Figure 1 illustrates the organizational framework of this review, which follows the evidence chain of “operating condition → load → damage → life.” The review is structured into seven interconnected modules: (1) characterization of complex agricultural operating conditions and typical failure modes, establishing the many-to-many mapping between field conditions and damage patterns; (2) analysis of damage evolution mechanisms from four perspectives—frictional wear, fatigue cracking, rubber–reinforcement interface failure, and multi-mode coupling—with geometric thinning, temperature rise, and stiffness degradation identified as the key feedback loops accelerating late-stage damage; (3) review of durability testing methods and damage characterization techniques, including their scope and limitations; (4) discussion of numerical simulation approaches (finite element, multibody dynamics, and discrete element methods) and their coupling; (5) summary of fatigue and wear life prediction models and data-driven remaining useful life estimation; (6) systematic optimization strategies spanning material formulation, structural parameters, operating conditions, environmental factors, and integrated design methodology; and (7) identification of existing problems and future development trends, including load spectrum standardization, multi-failure coupling modeling, accelerated testing validation, condition monitoring, and scenario-based high-durability design. Arrows in the flowchart indicate both the forward evidence-propagation direction and the reverse feedback loops through which accumulated damage alters subsequent load distributions and boundary conditions.
Figure 1.
Schematic flowchart of the review framework following the “operating condition–load–damage–life” evidence chain. Seven modules are interconnected through forward evidence propagation and reverse feedback loops.
2. Complex Agricultural Operating Conditions and Typical Failure Characteristics of Rubber Tracks
Before examining specific failure mechanisms, it is essential to clarify why research on rubber tracks under relevant conditions—such as construction machinery, military vehicles, or automotive tires—cannot fully guide the study of agricultural rubber tracks. Four distinguishing characteristics define the agricultural context. First, the ground medium is not a uniform road or construction site but a biologically active soil whose moisture content, shear strength, particle size distribution, and organic matter content vary spatially within a single field and temporally across seasons; a tracked tractor may transition from dry loamy soil to saturated clay within meters, causing abrupt changes in contact pressure distribution and slip rate. Second, agricultural operations are highly seasonal and task-specific: tillage imposes low-speed high-traction loads with sustained high slip; harvesting combines heavy vertical loads with wet straw and mud accumulation; and road transport between fields introduces high-frequency cyclic bending and centrifugal effects absent during field work. Third, agricultural tracks must simultaneously satisfy agronomic constraints—minimizing soil compaction, maintaining traction efficiency, and avoiding crop damage—that directly conflict with pure durability optimization; for example, reducing tread height to decrease bending stress may degrade soil-shedding performance and increase slip. Fourth, agricultural machinery typically experiences long idle periods between seasons, during which ozone, UV, and thermal-oxidative aging continue to degrade rubber properties even without mechanical loading, so calendar aging and cyclic fatigue must be evaluated as sequential rather than independent processes. These four characteristics mean that fatigue parameters calibrated for tires operating on paved roads, or ground-mechanics models developed for military tracks on uniform terrain, require explicit re-validation before application to agricultural scenarios. The transferable physical quantities include fundamental rubber viscoelasticity, cord–rubber interface chemistry, and fracture mechanics principles; the non-transferable boundaries include load spectra, contact medium interactions, environmental exposure sequences, and the multi-objective constraints linking durability to agronomic performance.
From an engineering perspective, a rubber track assembly comprises several interacting components whose configuration directly governs failure initiation sites. The track belt itself consists of a ground-contacting tread layer, a tensile carcass layer reinforced by steel cords or aramid fibers, an inner friction layer contacting the wheels, and intermediate rubber layers bonding these constituents. The running gear includes a drive sprocket that engages drive lugs on the inner track surface to transmit torque, an idler wheel that maintains track tension and guides the belt, two or more road wheels that transfer vehicle weight to the ground-contact zone, and optionally carrier rollers supporting the upper track span. A tensioning mechanism—typically a spring-loaded or hydraulic idler adjuster—sets the initial static tension, which must be maintained within a narrow range: excessive tension increases average carcass cord stress and bearing loads, while insufficient tension causes tooth jumping, impact loading at the drive sprocket, and derailment risk during steering or ridge crossing.
Rubber track structures differ significantly across agricultural machine types, and these differences produce distinct dominant failure modes. For high-power tractors (typically 100–300 kW), tracks are wide (400–760 mm) with thick tread blocks (30–50 mm) and multiple carcass plies (4–6 layers) to withstand sustained high traction loads; the dominant failures are tread block chipping under high slip in abrasive soil and cord-end delamination at the idler wrap zone due to combined tension and bending. For combine harvesters (typically 150–400 kW with grain tank loads), tracks must support high and variable vertical loads while operating in wet, muddy conditions with straw accumulation; tread patterns prioritize mud-shedding with wider lug spacing, and the dominant failures include interface debonding caused by water and mud infiltration, accelerated wear from abrasive soil particles trapped between the track and road wheels, and fatigue cracking at the tread root due to repeated wrapping under high vertical loads. For lightweight field platforms and robotic chassis (typically below 50 kW), tracks are narrower (150–300 mm) with thinner rubber sections and fewer reinforcement plies (2–3 layers); their lower load capacity means that obstacle impact and track derailment during steering dominate over gradual wear, and the thinner rubber sections are more susceptible to puncture by crop residues or field debris. These structural differences mean that a durability optimization validated on one machine type cannot be directly transferred to another; the relative importance of wear, fatigue, and interface failure shifts with track width, tread geometry, reinforcement configuration, and the characteristic load spectrum of each application.
The service boundary of agricultural rubber tracks is influenced by vehicles, soil, tools, and driving methods. The overall weight and center of mass determine the basis of static loads; the arrangement of support wheels and tension alter the discrete distribution of loads along the length of grounding, and soil moisture, strength, and straw cover reshape slip and shear responses. Therefore, typical failure characteristics can only be explained in combination with specific working conditions; discussing cracks or wear without considering the load source can easily misinterpret the combined effects as a single material defect [5].
From a research perspective, existing evidence can be divided into three layers. The first layer covers speed, traction, attitude, and vibration at the whole-machine level, which can answer what external excitation the track experiences. The second layer is pressure, shear stress, slip, and soil deformation at the contact plane, which explains how loads are distributed at the grounding zone. The third layer covers strain, temperature, cracks, and interfacial conditions at the material and structural levels, determining whether damage accumulates. If the data from these three layers are obtained under different working conditions, different machines, or different time baselines, the correlation may be overestimated. Therefore, this chapter discusses “observable failure” and “reconfigurable load” side by side, with special distinctions between average and peak values, steady-state quantities and transient quantities. For agricultural machinery, short-term ridge-crossing impacts may determine the crack initiation point, while long-term high slip may control temperature rise and wear. The contribution of both to lifespan cannot be ranked solely by their frequency.
Another challenge in complex agricultural conditions is that their randomness follows certain statistical patterns. Sowing, tillage, transportation, and harvesting have relatively stable operating rhythms, but field head turning, machinery entering soil, rut overlap, and ridge crossing can also produce a small number of high-amplitude events. Regarding lifespan, sustained low-amplitude cycles and occasional impacts may control material self-heating and crack initiation, respectively; simple use of average traction or root mean square vibration can erase these differences. Therefore, before discussing typical failures, this chapter first distinguishes the source, transmission path, and temporal structure of the load, then links the damage location to specific motion stages. Only by clearly identifying when and where the track is subjected to what load can the failure pattern be diagnostic.
From the perspective of failure diagnosis, operating condition types themselves cannot directly serve as input for life prediction; it is the local mechanical and thermal histories formed through load transmission that are the direct factors driving damage evolution. The same wetland operation conditions may result in significantly different wear behaviors due to differences in implement load and slip control methods; likewise, the same embankment-crossing condition can change the impact location depending on the wheel assembly structure, tension state, and travel speed. Therefore, research design should first clarify the failure mode intended to be explained and, based on this, reverse-determine the operating condition variables and local responses that need to be recorded, to avoid a lack of clear correspondence between whole-machine data and local damage such as cracks or delamination.
2.1. Typical Service Conditions of Agricultural Rubber Tracks
Agricultural tracks frequently switch between straight field driving, traction, turning, embankment crossing, and road transfer, and the contact medium can quickly change from high-moisture clay to dry sand, straw cover, or hard pavement. Differences in operating conditions not only alter traction efficiency but also change the slip speed, contact pressure, and shear direction on the track surface. Therefore, operating condition characterization should at least simultaneously record whole-machine weight and power, implement traction load, vehicle speed, slip rate, soil moisture content, and number of repeated passes, while distinguishing between steady-state operations and obstacle impacts [6,7,8].
Servadio applied the WES empirical method to farmland in central Italy, integrating soil cone index, wheel or track load, structural parameters, and repeated passes to predict vehicle passability, indicating that track performance cannot be summarized by average ground pressure alone [9]. Regression studies of agricultural tractor technical parameters further show that there are linear relationships among weight, rated power, lift capacity, and price that can be used for preliminary machine selection; for durability research, such models can provide a statistical basis for target load levels and grouping of test prototypes [10]. Du Plessis and Yu conducted prototype track traction tests on sandy loam with different moisture contents and hard pavement, simultaneously measuring single track pad contact pressure, tangential forces, and input torque, confirming that soil–rubber friction and soil adhesion together determine traction response [11]. These studies collectively suggest that agricultural operating condition databases should synchronize whole-machine parameters, soil state, and local track loads [12].
Straight-line traction in the field is the most common working condition for tracks, but it does not mean the load remains stable. As the soil gradually compacts or undergoes shear failure, the normal pressure and tangential force at the front and rear of the contact area continuously adjust; fluctuations in the implement’s penetration depth can also transmit pitch excitation to the running system through the traction point. Under the condition of the same average traction force, lower speeds and higher slip rates will increase the load duration of individual track units in the contact area and increase the friction work per unit distance; higher speeds, on the other hand, will shorten the contact time while increasing wheel frequency and impact rate. If a durability test only reproduces the peak traction force without considering speed, slip rate, and contact time, the resulting damage mechanism may not match the actual field conditions [13,14,15].
Steering and turning at headlands should be regarded as independent operating conditions. Tracked vehicles steer by speed difference or brake difference between the left and right sides, causing the inner and outer tracks to carry different longitudinal driving forces, while the contact rubber also experiences lateral shear and tread block twisting. Soft soil can release part of the lateral force through plastic flow, whereas hard soil, dry crusted surfaces, or roads limit this release, causing greater local deformations at the edges and the driving tooth roots of the track. In field surveys, if cracks are concentrated at the track edges and show a stable angle with the traveling direction, they cannot be explained solely by straight-line traction loads. Operational records should include turning radius, left and right drive torques, and steering duration so that damage caused by turning can be included in the load spectrum [16,17,18].
Road transfer, climbing embankments, and crossing ditches represent another category of boundary conditions. In these cases, soil adhesion is no longer the sole controlling factor; the drop of the support wheels, track tension, and obstacle geometry together determine transient impacts. If the track is too loose, the contact profile and engagement phase fluctuate easily; if too tight, the average tensile stress in the skeletal layer increases. Agricultural machinery often switches between field work and road driving, entering a new load phase before the temperature has recovered, and the self-heating accumulated in the previous phase alters the modulus and friction in the subsequent phase. Therefore, a representative task spectrum should be organized according to the actual work sequence, rather than merely testing each condition separately and combining them according to time proportion [19,20,21].
A common limitation of existing working condition studies is that experimental conditions are often set according to the equipment’s capabilities rather than the damage issues. Soil type, moisture content, and vehicle speed are changed individually, while operating machinery, steering behavior, and thermal history are rarely controlled synchronously, resulting in findings that are more suitable for explaining traction performance and inadequate for directly forming a durability load spectrum. Subsequent research should select working condition combinations based on on-site failures: surface wear issues require increasing slip distance, particle and temperature information; fatigue of the subgrade layer requires recording tension and wheel rotation counts; edge cracking requires improving the representativeness of steering conditions. Working condition variables are only meaningful for lifespan data collection when linked to specific damage pathways.
2.2. Load Characteristics of Rubber Tracks Under Complex Working Conditions
Track loads exhibit obvious spatial non-uniformity and temporal periodicity. When track segments enter the contact area, pass sequentially through the road wheels, and bypass the drive and idler wheels, they experience continuous transitions of compression, shear, tension, and bending; soil unevenness and obstacles further superimpose impacts on this basis. When evaluating loads, attention should be paid not only to the pressure peaks on the ground-contact surface but also to the principal strain near the cords, interlayer shear stress, and cyclic bending amplitude, as the latter are more directly related to the driving forces for cracking and debonding [17,22].
Keller and Arvidsson established contact stress models using the number and diameter of front and rear wheels and support wheels, track width, and axle spacing, describing longitudinal pressure as harmonics and lateral pressure as linear functions, obtaining a more realistic track and soil interface stress distribution that is more realistic than the uniform distribution hypothesis [23]. Finite element and field tests by Guan et al. showed that the structure and arrangement of support wheels form discrete pressure peaks and significantly alter vertical soil surface stress [24]. Half-track tractor tests also show that seat vibration at typical farm road speeds can exceed 0.5 m/s2, and some conditions exceed 1.0 m/s2; the comprehensive vibration performance of the six-track wheeler scheme is better than that of the five-wheeler scheme, but wheel number and seat suspension effects are not yet completely separated [25]. Therefore, the average pressure is suitable for preliminary comparison but insufficient to replace peak values, spectrum, and phase information. Among the measured objects in reference [26], the large crawler tractor has a total weight of about 185 kN, track grounding dimensions of 3.1 m × 0.7 m, and an average soil surface stress of about 43 kPa; a four-track medium-sized tractor has a rear axle load of about 47 kN, track size of 1.9 m × 0.6 m, and an average stress of about 21 kPa. The model further indicates that the peak real contact stress can reach about 2~3 times the uniformly distributed average value. Drum track tests also observed that the vertical stress directly below contact exceeds twice the average value of the entire track, and the peak value drops from 69.3 kPa to 62.4 kPa when densely arranged on both sides [24]. To provide a quantitative perspective on the load characteristics discussed above, Table 1 summarizes representative measurement and simulation results for agricultural track loads and dynamic responses reported in the literature, covering whole-machine and track-level quantities such as average soil surface stress, peak vertical stress beneath the contact, vibration acceleration, slip-rate limits, and track tension. As these data were obtained from different machines, soil conditions, and boundary conditions, they are intended for order-of-magnitude comparison and to illustrate the spatial–temporal non-uniformity of track loads, rather than for direct numerical comparison between studies.
Table 1.
Representative quantitative results of agricultural track loads and dynamic responses.
Quick transfers and obstacle crossing will further amplify dynamic effects. Steel cord–rubber composites exhibit significant rate sensitivity within a strain rate range of approximately 3.3 × 10⁻³ to 131 s−1, and the cord direction alters interfacial debonding and final fracture modes [28]. Rabbani et al. developed a three-dimensional half-track tractor model considering bounce, pitch, and roll and validated its vibration response through asphalt pavement driving tests [29]; studies on the dynamic load of support rollers combining strain gauge measurements with a nonlinear Voigt contact model show that the nonlinear stiffness of the rubber track–support roller system and the wheel arrangement are key factors in predicting wheel load fluctuations [30]. These results support the construction of an agricultural track composite load spectrum in the form of “quasi-static traction load + periodic meshing load + random road impact.” Further high-strain-rate tests were conducted at four strain rates: 3.3 × 10⁻³, 1.2, 26, and 131 s−1; the tensile strength and fracture energy of 45° samples increased with rate, while the fracture strain and fracture energy of 90° samples decreased [28]. Multi-body simulation of agricultural tracks shows that the upper limits of slip ratio without traction are about 9%, 8%, and 6% in dry sand, sandy loam, and clay, respectively; when applying a 13 kN traction load and operating on a 20° slope, the slip ratio can increase to about 20%, and the track tension near the drive wheel rises from about 7.5 kN without traction to about 12 kN [27].
From a spatial distribution perspective, the peak ground pressure is usually associated with the position of the support roller, but the peak does not necessarily correspond to a unique danger point. The ground-contact rubber surface is more influenced by the combined control of pressure, slip, and particle intrusion, while the carcass layer is more sensitive to curvature changes and interlayer shear. When a track unit enters the ground-contact segment, it quickly flattens from a curved state, and after leaving the ground-contact segment, it wraps around the wheel again; this repeated curvature change produces alternating stress at the ends of the reinforcing layer. Using only the ground-measured pressure as a fatigue indicator may underestimate the contribution of wheel wrapping to the internal cords. Conversely, analyzing only tension and bending without considering the pressure–shear coupling near the support roller also cannot explain why ground-contact rubber and interface damage often concentrate near specific wheel positions [31].
From the perspective of time structure, track loads contain both deterministic cycles and random disturbances. The engagement of drive teeth, track pitch, and wheel rotation form predictable fundamental frequencies and harmonics; variations in soil elevation, stones, and straw bundles bring non-stationary broadband impacts. When these two are superimposed, certain frequencies may approach the natural frequencies of the running gear or the vehicle body, causing local wheel loads to temporarily amplify. Frequency domain analysis helps identify this resonance risk, but fatigue accumulation still needs to return to the time domain to preserve the load sequence, because stress softening, temperature rise, and crack opening after high-amplitude impacts will affect subsequent low-amplitude cycles. Engineering load spectra should provide both cycle counts and event sequences, rather than only power spectral density.
Track load measurement is also limited by sensor accessibility. Measuring points for the bogie axle forces and drive torque are relatively easy to arrange, but they can only indirectly characterize internal strain in the track; embedding strain or temperature sensors in the rubber layer may alter local stiffness and introduce additional defects. A more reliable approach is to fuse multi-source information: use wheel axle forces and torque to determine external boundaries, reconstruct track curvature with high-speed imaging or displacement measurements, characterize thermal state with infrared thermography or thin temperature sensors, and then infer cord and interface loads through finite element models validated by local tests. The value of multi-source data does not depend on the number of measurement points, but on whether different measurements can cross-verify each other and form a local load estimation with uncertainty.
Based on this, a layered load description can be formed. At the vehicle level, record mass, traction resistance, speed, and posture; at the wheel-set level, record bogie forces, drive torque, and tension; at the track level, focus on curvature, local strain, slip, and temperature. After aligning the three layers to a unified time basis, it is possible to determine whether a local peak comes from vehicle load, ground impact, or engagement cycles. Many current studies verify vehicle vibrations or contact pressures separately but lack cross-layer synchronous evidence, which is an important reason why different models give inconsistent assessments of hazardous zones. Future load databases should retain the original time series and transfer relationships, rather than only publishing some statistical averages. As illustrated in Figure 2, the operating state reshapes track tension, internal stress, and whole-vehicle vibration across the load-transfer chain.
Figure 2.
Operating-condition-induced loading and dynamic responses of rubber-tracked systems [25,32]. (a) Z-axis weighted vibration (awz) of tractors A–C with different seat suspension settings, uphill/downhill, vs. Italian Decree 81/2008 limits (action: 0.5 m/s2; limit: 1.0 m/s2). RMS, root mean square. (b) Z-axis weighted vibration (awz) of tractors D(1)–D(2) travelling downhill, vs. Italian Decree 81/2008 limits (action: 0.5 m/s2; limit: 1.0 m/s2). (c) Rubber track tension before and during operation. (d) Tensile and shear stress distribution on the rubber track. (e) Stress distribution of measure points 1 (black) and 2 (red) at the ground part.
2.3. Main Failure Modes of Rubber Tracks
Rubber track failure usually develops from locally visible damage to a loss of structural function. Early manifestations include flattened tread blocks or contact rubber, cuts, grooves, pitting, and microcracks; subsequently, cracks may propagate through the thickness, cord ends may delaminate, interlayer separation may occur, and steel cords may be exposed or broken, eventually leading to track belt breakage, chunk loss, or inability to maintain tension. When determining on-site, the damage location, direction, and surrounding wear marks should be recorded simultaneously, as this information can differentiate between abrasive cutting, repeated bending, abnormal tension, and manufacturing defects. Dynamic wear failure analysis of textile rubber conveyor belts can provide a reference for cross-sectional diagnosis of composite belt bodies [33].
The failure analysis of excavator track pin rubber belts provides on-site evidence that can be referenced: all four types of samples failed to pass the 1000 km test, with failures occurring between 250 and 800 km; improper formulation and manufacturing were identified as the main causes. Failure surfaces showed Schallamach waves, deep grooves, pitting, microcracks, and scratches, with significant differences in tensile strength and elongation at break among the different samples [34]. Research on transport tracks combines vertical, tensile, bending, and centrifugal stresses into equivalent stress. After experimental verification, the Miner method predicts about 34.59 million cycles, which corresponds to approximately 750 days assuming 8 h per day, and identifies the danger zones in sections where the track bends noticeably around the wheels [32]. Both studies indicate that on-site morphology can point to damage paths, but only when combined with material testing and load calculations can the ‘failure phenomena’ be translated into a verifiable determination of cause. Among them, RB1 and RB4 have hardness values of 66 ± 3.3 and 74 ± 3.7 Shore A, and tensile strengths of 17.3 ± 0.9 and 19.3 ± 1.0 MPa; RB2 and RB3 are only 4.0 ± 0.2 and 7.3 ± 0.4 MPa, with elongations at break of 251 ± 12.6% and 230 ± 11.5%, corresponding to the shorter failure distances of 250 km and 400 km [34]. This set of data indicates that on-site failure distance is clearly related to the mechanical performance dispersion caused by rubber formulation and manufacturing quality, but cannot be used to extrapolate a single strength threshold to all track products. To move from on-site failure morphology to quantitative understanding, Table 2 compiles representative failure and durability cases of engineering tracks and rubber components reported in the literature, covering failure mileage, predicted cycle life, changes in wheel load and acceleration after wear, and obstacle-crossing energy consumption. Since these cases were obtained from different equipment types and test systems with different failure endpoints, they are intended to identify the key factors driving premature failure and to provide order-of-magnitude references, rather than to support direct numerical comparison between different products.
Table 2.
Quantitative cases of failure and durability of engineering tracks and rubber components across literature.
There is considerable uncertainty in mechanism determination based on the appearance of surface wear. Uniform smoothing may result from long-term low-amplitude slippage or be the outcome of repeated formation and detachment of many small fatigue cracks; directional grooves are often related to hard particle cutting, but their depth is also influenced by rubber temperature and normal pressure. During observation, tread height, mass loss, surface roughness, and wear debris morphology should be recorded at fixed mileage or operating hours, and the longitudinal position of the track and left/right edges should be marked. Evaluating wear resistance solely by final weight loss can omit the process information of damage spreading from local to overall areas and makes it difficult to determine whether material improvements reduced crack formation or changed the wear debris detachment mode.
Crack-type failures should be subdivided according to initiation points and propagation paths. Diagonal cracks on the contact surface of rubber usually relate to frictional stretching and particle action; cracks at the drive tooth root, tread root, and geometric transition zones reflect local strain concentration; internal cracks in the wheel loop area may first appear at cord ends or interlayer interfaces. Once cracks approach the reinforcement layer, the propagation direction will be influenced by modulus differences and adhesion state and may extend along the interface or pass through adjacent rubber layers. Both paths may appear as bulges or spalling on the surface but correspond to different material and structural countermeasures. The former requires improvement in interface and end design, while the latter relies more on rubber tear resistance and local strain control [37].
Functional failure often occurs earlier than complete rupture. After wear reduces tread height, the track may still be able to operate, but its mud-shedding ability and traction efficiency have already deteriorated; when local debonding has not yet spread to the surface, tension fluctuations and meshing abnormalities may also occur due to decreased longitudinal stiffness. Therefore, durability evaluations should not use “whether the track ruptures” as the sole endpoint, but should also set performance thresholds such as traction reduction, increased slip, deterioration of tension stability, or abnormal temperature rise. Including both structural integrity and operational function in the definition of failure can better reflect the actual maintenance decisions of agricultural users and also avoid over-sensitivity of lifespan predictions to the choice of endpoint [38].
Typical failure classifications should also consider observable levels. Visual inspection can identify wear, cuts, bulges, and exposed steel cords; disassembly and cross-sectional analysis can determine whether cracks are in the substrate, the interface, or within the cord bundle; material and chemical testing is used to trace formulations, vulcanization, or environmental aging. These three types of evidence should converge layer by layer and should not rely on a single final-state image to directly infer the root cause. For early anomalies, establishing a unified damage map and position coding is particularly important, as it can turn maintenance records into statistical data and verify whether a certain failure truly concentrates at specific wheel positions, structural transitions, or operational tasks. Figure 3 links track construction and stress concentration to measured damage and progressive ply separation in reinforced rubber structures.
Figure 3.
Structural stress concentrations and progressive failure of reinforced rubber tracks [32,39]. (a) Holistic and separated rubber track structures. (b) Tensile and shear stresses of the element from the bottom of the rubber track. (c) Possible crack tips at the edge of the belt in pneumatic tyres. (d) Measured (black) and simulated (red) stress distributions at measure point 1. (e) The process of carcass ply separation of radial tyre. (f) Comparison of failure modes between proposed FE models and test results.
2.4. Relationship Between Operating Conditions and Failure Modes
The relationship between operating conditions and failure modes is often many-to-many. High slip increases both surface friction work and internal hysteretic heating; impact on support wheels may cause local indentations and also accelerate end-of-cord fatigue; a decrease in soil moisture reduces the strength of particle embedding while also potentially changing adhesion and cooling conditions. Therefore, correlation analysis should not directly assign a single operating variable to a unique failure, but should trace the causal chain along the path of “external operating conditions—local loads—temperature and material state—damage mode.”
Rybak et al.’s track mechanism model shows that after rubber track plates and road wheel rubber rings wear down, their elastic-damping characteristics attenuate and increase the dynamic load on the traveling mechanism, indicating that wear is both a result and can conversely change subsequent loads [35]. European soil compaction comparative tests found that tracks increase contact area and reduce some contact stress, but deep soil risks are still mainly controlled by total load, so it cannot be simply concluded that “tracks are necessarily safe” [40]. For rubber tracks, this conclusion is equally important: larger contact areas can reduce average pressure, but may create new local hazard zones due to discrete peaks of the support wheels, lateral shear of direction, and tension changes. Therefore, the condition-failure correlation model requires retaining both whole-machine and material-scale variables [41].
To establish a relationship between operating conditions and failure, it is first necessary to rule out pseudo-correlations caused by common causes. For example, high slip often occurs simultaneously with large traction loads; if only slip rate and wear are compared, it is difficult to determine whether the damage comes from relative surface motion, internal tension, or the combined effect of both. Similarly, high temperature may be environmental input or the result of hysteresis dissipation; directly treating temperature as an independent variable regression to lifetime obscures its coupling with load amplitude, frequency, and heat dissipation conditions. A more reasonable analysis should first construct variable hierarchies according to mechanical paths, then use controlled tests or models to separate the contributions of each path [42].
Failure locations can constrain causal determination. If damage occurs along the spacing period of the support wheel, it indicates discrete wheel loading and repeated compression cannot be ignored; if damage near the drive teeth corresponds to high traction phases, meshing force and skeleton tension should be examined; if the track edges crack first after frequent turning, lateral shear is more likely to be the dominant factor. Location evidence also has limitations, as damage expansion alters load distribution, and the final failure zone may not retain the original crack initiation point. On-site diagnosis should be carried out as early as possible, combined with regular imagery, temperature, and stiffness records to reconstruct the evolutionary sequence.
From a life management perspective, the same failure mode may also be achieved by different combinations of working conditions. Short-term high-amplitude impacts can rapidly produce initial cracks, followed by low-amplitude bending to stabilize their cracks; sustained high temperatures and high slip may first reduce the properties of the compound and interface, then make ordinary wheel loading effective damage. Both may manifest as interlayer separation in their final state, but have different preventive priorities. Classification of working conditions should not be limited to broad labels like “heavy load” or “poor soil,” but should describe load amplitude, frequency, sequence, temperature, and medium state that can enter the model [43].
Therefore, the operational condition–failure correlation should be characterized using directed causal paths rather than a simple correlation matrix. The first layer of the path consists of controllable or recordable scenario variables, the second layer includes physical responses such as wheel load, tension, slip, and temperature, the third layer involves cracks, wear, and interface damage, and only the fourth layer represents functional consequences like traction loss or band breakage. If the model skips the intermediate layers, it may predict failures for existing samples but will struggle to determine whether the relationships still hold after structural modifications. Retaining intermediate physical quantities also supports counterfactual analysis, such as distinguishing which type of damage would be reduced by lowering slip versus lowering tension, providing differentiated guidance for operational control and design improvement.
3. Main Failure Mechanisms of Rubber Tracks
The macroscopic failure of rubber tracks mainly includes surface material removal, fatigue cracking of the rubber matrix, and reinforcement interface damage. These failure modes are all driven by a combination of contact stress, cyclic deformation, and temperature rise. Mechanism analysis should focus on identifying the initiation locations of the damage, propagation paths, and the evolution of material and structural states under cyclic loading, avoiding static classification based solely on the final fracture surface.
When determining the mechanisms, three easily confused concepts need to be separated. First, the damage initiation point is not necessarily the most prominent location on the final fracture surface, as load redistribution occurs after crack propagation. Second, the direct cause of material removal may be abrasive cutting or the coalescence of surface fatigue cracks; macroscopically, both can produce similar wear marks. Third, cracks near the interface do not mean that the adhesive layer failed first; cracks can also propagate within adjacent low-strength rubber. Reliable mechanistic evidence should be corroborated by the load history, in situ or staged damage observations, fracture morphology, and numerical high-risk zones. For tracks, which are multilayer composite structures, it is also necessary to track changes in local stiffness and contact conditions after damage occurs, as these determine whether cracks propagate stably, divert to the interface, or rapidly induce overload on neighboring cords.
The value of mechanism research lies in transforming visible damage into controllable variables. Although wear, fatigue, and interface failure use different terms, all involve the distribution of energy among contact, viscoelastic deformation, and crack surface formation. Placing these three issues within the same energy and state evolution framework helps explain why some improvements may have opposite consequences; for instance, increasing rubber hardness may reduce surface cutting but alter contact pressure and crack tip constraint. Therefore, this chapter discusses both the independent characteristics of each mechanism and their shared stress, temperature, and geometric feedback.
The boundaries between the mechanisms in this chapter should be understood as analytical tools rather than processes that are actually isolated in the track. Studying wear, fatigue, and interfacial damage separately is useful for identifying control parameters; when returning to product life, it is necessary to check whether these parameters fail due to changes in geometry, temperature, or stiffness. The complexity of the mechanistic model should be determined by observable evidence: when surface morphology and temperature can be used for verification, it is unnecessary to introduce microstructural variables that cannot be calibrated; only when the hazardous zone shifts or damage accelerates suddenly without explanation should interface or thermal feedback be added. Such incremental modeling is more likely to yield reliable parameters than establishing a fully coupled model all at once.
3.1. Frictional Wear and Surface Damage Mechanisms
The wear of track ground rubber results from adhesion, hysteresis, abrasive cutting, and fatigue spalling. Rough soil particles or micro-asperities on hard road surfaces cause repeated adhesion–slip on the rubber surface, with viscoelastic hysteresis converting part of the mechanical work into heat; when local tensile stress and strain energy exceed the crack initiation condition, microcracks propagate along the surface layer and generate wear debris. Soil particle size, normal pressure, sliding speed, and rubber temperature alter the proportion of each mechanism, so the steady-state wear rate is only the combined result of a multi-scale damage process.
Fukahori and others found through blade wear tests and finite element analysis that initial cracks first appear at the locations of maximum tensile stress, forming an expansion angle of about 30–50° with the surface, with larger normal loads producing larger angles; as the crack continues to propagate, the angle gradually decreases and approaches the steady-state wear direction. Stick–slip induced by micro-vibrations is considered the crack origin [44]. Mokhtari and Schipper demonstrated using atomic force microscope nanoindentation that inside wear scars of silica- or carbon black-reinforced SBR, there exists a friction-modified layer with a modulus lower than that of the matrix, and that increased pressure and sliding speed exacerbate surface mechanical property loss [45]. This indicates that track wear models need to describe the evolution of surface layer properties rather than using the initial material parameters over the long term.
Rubber friction also significantly deviates from the classical Amontons and Coulomb assumptions. Studies based on adhesion and hysteresis friction on rough surfaces indicate that the friction coefficient varies with load and speed, and the deformation dissipation of tread blocks can also change the overall traction–slip curve [46]. The latest wear reviews link Archard-type empirical models, elastic contact, and models based on fatigue crack propagation in micro-asperity regions, emphasizing that oxidation, lubrication, and multi-scale roughness can cause wear coefficients to vary by orders of magnitude [47]. For agricultural tracks, a reasonable approach is to transform the soil particle spectrum and moisture content into contact roughness, adhesion, and abrasive penetration parameters, and then drive material removal using local friction work or tearing energy [48]. Figure 4 connects rough-contact excitation and frictional energy dissipation with the wear mechanisms and test responses observed under abrasive soil exposure.
Figure 4.
Multiscale friction and wear mechanisms from contact excitation to surface damage [1,49]. (a) Multiscale nature of wear phenomena. (b) Classification of the main wear mechanisms. (c) Schematic illustration of rubber road friction mechanisms. (d) Conceptual comparison between wear model categories. (e) The “spinning bowl”-type laboratory wear testing stand. (f) Wear intensity of the tested materials in specific soils.
Adhesion and hysteresis are the two fundamental sources of rubber friction. The real contact area on the surface forms, stretches, and breaks under shear, producing the adhesion component; rubber undergoes cyclic deformation as it crosses rough peaks, and viscoelastic losses form the hysteresis component. Agricultural soil introduces mobile particles, which may roll, slide, or embed into the rubber surface, causing the contact pattern to change over time. Wet conditions usually reduce some interfacial shear but may also cause fine particles to adhere to tread grooves, changing mud evacuation and heat dissipation. Thus, a single constant friction coefficient can neither describe traction nor reliably predict wear. Models need to consider at least the dependencies on pressure, slip speed, temperature, and surface state [50].
Abrasive action depends on particle hardness, size, edge sharpness, and embedding depth. Sharp particles under high normal pressure can cause plowing and cutting, while rounded blunt particles are more likely to cause repeated indentation and surface fatigue. Track tread blocks tilt under shear, causing the soil-facing and soil-breaking sides to experience different tensile and compressive states, with cracks typically initiating on the tensile side and then propagating along a path at a certain angle to the surface. When crack propagation depth reaches a critical value, the surface material spalls off in sheets or curled debris. Therefore, the wear rate and crack growth pattern are not two unrelated descriptions; the latter can provide more stable material-scale parameters for the former.
The presence of a friction-modified layer implies that the material surface will develop a mechanical state different from that of the bulk during service. Continuous sliding may cause chain scission, filler network damage, oxidation, or local thermal softening, altering the surface modulus and dissipation capacity. Although this thin layer is very small in scale, it directly determines the real contact and crack initiation. If wear tests only use fresh samples for short-term measurements, the resulting friction and wear parameters are difficult to represent the stable service stage. More informative tests should distinguish the running-in, steady wear, and accelerated damage stages and measure surface morphology, temperature, and local modulus at each stage to determine whether the wear-resistant modification actually delays surface degradation or merely alters the initial running-in [51].
For agricultural rubber tracks, it is urgent to extend wear description from fixed empirical coefficients to a state-dependent evolution process. Particle size distribution and soil moisture content determine the type of contact, while pressure and slip control the input of mechanical energy, and the rubber temperature and surface degradation state determine the proportion of energy converted to crack formation and debris detachment. This framework helps compare different test results under a unified variable system and explains the causes of differences in wear ranking of the same material on hard pavement versus wet soil. Its main difficulty lies in the challenge of measuring surface parameters in situ, so it is necessary to combine staged downtime inspections with parameter inversion, avoiding the approach of calibrating once and keeping it constant throughout the entire service life [52]. Figure 5 compares the initial track surfaces with the distinct wear morphologies produced by loose and compacted abrasive soils.
Figure 5.
Abrasive soil effects on rubber surface morphology and wear intensity [1,49]. (a) Surface view of the tested elastomers before the wear test. (b) Condition of the friction surface and profile after wear in the light soil of a tractor track 2000×. (c) Condition of the friction surface and profile after wear in the light soil of a mini-excavator track 2000×. (d) Condition of the friction surface and profile after wear in the heavy soil of a tractor track 700×. (e) Normalized wear ratio as a function of sliding distance. (f) Wear statistics from Persson’s model.
3.2. Fatigue Crack Initiation and Fracture Mechanism
Cyclic large deformation can cause previously existing defects, filler agglomeration zones, and geometric stress concentration sites within the rubber to gradually develop into observable cracks. The initiation stage is controlled by the maximum principal strain, strain energy density, crack energy density, and critical plane direction; the propagation stage is more appropriately described using the relationship between tear energy and crack growth rate. Bending, tension, and shear in agricultural tracks often occur out of phase, and uniaxial S-N curves can only provide a material baseline and cannot directly represent structural life [53].
Schubel et al. conducted 10 Hz tensile–tensile fatigue tests on tire rubber with edge pre-cracking, obtained the power law relationship between crack propagation rate and tear energy, and estimated fatigue life using critical tear energy integration [54]. Saintier et al. conducted non-proportional multi-axis tests on natural rubber using tensile compression, torsional, and superimposed static torsion, comparing the stress invariant criterion with the high-strain critical plane criterion; results show that the critical plane method based on microscopic initiation mechanisms has higher prediction accuracy in terms of life, crack direction, and internal cracking location [55]. The above studies indicate that track crack prediction should first be determined by structural analysis to determine the actual hazard plane, then select material fatigue curves matching the energy or strain state of that plane. The test conditions were maximum strain 8%, minimum strain 0.8%, stress ratio R = 0.1, frequency 10 Hz, and room temperature; the critical tear energy is 34.8 N/mm, and the fatigue life estimated by crack growth integral is approximately 8.1 × 106 times [54].
The inception lifetime of rubber fatigue is highly sensitive to defect definitions. In actual rubber materials, packing agglomeration, bubbles, interfacial micropores, and processing marks are present; so-called “notchless” samples still contain natural defects of varying scales. After changes in material formulation or process, the increase in lifespan may come from intrinsic crack resistance or from narrowing defect size distribution. Reporting only median lifetime is insufficient to distinguish between the two; analysis should be combined with fracture origin, defect size, and life dispersion. For tracks, sudden changes in molded joints, cord ends, and rubber layer thickness provide stronger geometric drives than internal defects; specimen design requires retaining these structural features or establishing clear scale transitions [56].
The key to multiaxial loading lies not only in the simultaneous presence of tensile and shear components, but also in the phase relationship between different components, which can cause the principal strain direction to rotate over time. If the crack surface repeatedly undergoes opening, closing, and shearing within a single cycle, indicators based on a single maximum value may have difficulty explaining the crack direction. The critical plane method, by comparing the energy or strain history on candidate planes, is more suitable for determining the crack initiation direction; however, its predictive accuracy still depends on whether the material parameters are obtained under similar load ratios, temperatures, and strain rate conditions. For agricultural rubber track models, it is not advisable to first compress all load information into equivalent stress and then analyze the crack direction, because the equivalence process may lead to the loss of directional evolution information [57]. Figure 6 summarizes how nucleation metrics, energy-based predictors, and crack-growth formulations represent fatigue damage from initiation to propagation.
Figure 6.
Fatigue damage criteria and crack-propagation representations for rubber structures [39,58]. (a) Existing fatigue criteria in the literature. (b) A comparison between strain and cracking energy densities for a particular failure plane. (c) Fatigue life prediction for CPA algorithm. (d) Traction–separation law of CZM. (e) From left to right: schematic crack propagation diagram of VCCT showing the crack initiation, crack propagation, and closure of the crack. (f) First principal stress direction rotation observed during pure torsion testing of AN2 specimens (unit: degree).
The crack propagation stage is also influenced by load pauses, load sequences, and strain-induced crystallization. The crack tip state formed under higher amplitude cycles affects the effective driving force of subsequent lower amplitude cycles, while strain-induced crystallization in some natural rubbers under tension can temporarily suppress crack growth. Linear damage accumulation treats each cycle as independent, which is convenient for engineering applications, but cannot naturally express these historical effects. For a track load spectrum that includes cross-country impacts and long-term steady-state traction, linear accumulation can be used as a baseline, and block load tests can then determine whether sequence effects are significant; if the measured system life deviates, state variables such as crack length, temperature, or residual deformation should be introduced rather than merely refitting an empirical coefficient [59].
Fatigue studies also need to address scale differences. In small specimens, the strain field is relatively uniform and crack initiation is easy to observe; the critical regions of the entire track are affected by manufacturing deviations, residual stresses, and contact boundaries, resulting in significantly scattered local lifetimes. When applying material curves to structures, this variation should be expressed through statistical defects or safety factors and verified at multiple locations or across several tracks. If the model can only predict average lifetime but cannot explain early failures, its design value is limited. Probabilistic methods are not meant to replace mechanisms with statistics, but to acknowledge that initial defects and operational conditions have inherent unavoidable variability and to propagate this variability into inspection and replacement decisions [60].
3.3. Rubber–Reinforcement Interface and Composite Structure Failure Mechanisms
Agricultural rubber tracks rely on steel cords, fabric layers, and the rubber matrix to jointly bear loads. The reinforcement improves longitudinal stiffness and tensile strength, but also introduces modulus variations at the ends of the cords, the cross layers, and bending zones. Under cyclic loads, rubber microcracks can deflect along the interface, and interface debonding transfers the load to adjacent cords, forming a progressive process of increased crack numbers, interlaminar crack propagation, and local steel cord overload [61].
Steel cord–rubber single-layer belt fatigue tests identified five stages: microcrack initiation, microcrack propagation, macroscopic crack formation, stable extension, and rapid fracture; cord angles of 22°, 72°, and 90° produced different failure paths, and increasing the strain amplitude localized the damage more [62]. Tian et al. studied ±20° laminated materials and found that the maximum cyclic strain exhibited three stages of variation. Macroscopic cracks initiated in a columnar form from the ends of the cords, followed by interface debonding and interlayer crack propagation, and a linear cumulative damage model was established based on dynamic creep [63]. These phenomena indicate that the service life of the track reinforcement layer cannot be replaced by homogeneous rubber parameters; cord angle, end geometry, and interlayer shear must be explicitly modeled. Under conditions of a maximum strain amplitude of 8.3%, R = 0.1, and 10 Hz, for the 22° specimen, microcrack initiation, macroscopic crack formation, and final fracture occurred at 0.5949 × 10⁶, 1.40 × 10⁶, and 2.67 × 10⁶ cycles, respectively; for the 90° specimen, the corresponding cycles were 0.439 × 10⁶, 0.909 × 10⁶, and 1.32 × 10⁶; for the 72° specimen, they were 0.78 × 10⁶, 2.64 × 10⁶, and 4.01 × 10⁶ [64]. To compare how load level, frequency, and structural direction jointly govern the fatigue and dynamic damage of steel cord–rubber composites, Table 3 compiles representative quantitative results from cross-literature studies, covering cord angle effects on crack initiation and final fracture, dynamic creep under two-stage loading, post-fatigue pull-out force, pulley-bending delamination life, and high-strain-rate tensile behavior. Since the endpoints of these studies—overall fracture, dynamic creep, pull-out force change, delamination, or high-speed tensile failure—are defined differently, the table is intended to compare load variables and damage mechanisms rather than to convert these results into a unified lifespan.
Table 3.
Cross-literature comparison of fatigue and dynamic damage of steel cord–rubber composite structures.
Bonneric et al. established a finite element model of a steel cable–rubber composite under bending, directly analyzing the effects of single wire contact and rubber penetration on the stress distribution of the steel cords, indicating that the microscopic filling state can change the distribution of bending loads among the strands of steel cord [67]. Therefore, during manufacturing, the penetration of rubber into the wire bundle, the surface treatment of the cords, and the quality of end coating should be considered together with the macroscopic lamination angle in interface quality evaluation. Using only static tensile strength for acceptance may overlook micro-movements, debonding, and localized stresses on the steel cords that gradually accumulate under repeated bending.
Interface strength is not a fixed value independent of load. The steel cord surface coating, vulcanization reactions, rubber penetration, and residual stresses together form the actual transition zone, and the static pull-out test measures the combined carrying capacity under specific geometry and rate. During cyclic bending, the steel cords inside the cord bundle undergo slight relative movements, and areas with insufficient rubber fill are more prone to local contact stress; temperature rise and moisture can also alter chemical adhesion and the strength of the rubber phase. Therefore, static adhesion is suitable for process screening but cannot be used alone as a parameter for interface fatigue life [68,69].
Cord angle determines the decomposition of longitudinal tension among the reinforcing layers and also dictates the deflection conditions for cracks encountering the interface. Smaller angles are favorable for bearing longitudinal tension of the belt but may generate stronger shear at the ends; cross-laying can improve transverse stability but increases interlayer deformation mismatch. When a crack initiates from the cord ends, if the interface toughness is low, it is easy to form long-distance debonding along the interface; if the interface is strong, the crack may enter the adjacent rubber phase and form a more tortuous path. When evaluating a ‘strong interface,’ one should not only judge based on whether failure occurs in the rubber phase but also whether this transfer leads to faster matrix tearing and greater localized heating [70].
Composite structural damage exhibits obvious load redistribution characteristics. After a small number of filaments delaminate or break, the overall stiffness may not decrease significantly, but the tension carried by adjacent filaments increases, and the interlaminar shear near the crack tip also changes accordingly. This forms a staged process from scattered micro-damage to localized macroscopic cracks. If the model uses homogeneous anisotropic materials, it can only describe the average stiffness and cannot capture the local concentration after the failure of a single filament; fully resolving each steel cord would bring excessively high computational costs. In engineering practice, an equivalent reinforced layer can be used in the global model to locate the dangerous zones, and then detailed sub-models can be established for end regions and areas around pulleys, with interface cyclic tests used to calibrate damage evolution [71].
The focus of interface studies should shift from “the magnitude of adhesion” to “the state evolution of the interface under cycling.” Systems with similar initial pull-out forces may exhibit completely different long-term degradation due to differences in rubber phase fatigue, coating reactions, or hydrothermal stability. Evaluation can combine static pull-out, cyclic loading, pull-out after bending, and residual glue ratio, while taking temperature and frequency as necessary conditions. For modeling, the interface parameters should also include three stages: initial, propagation, and residual load-bearing. This is the only way to describe how the load transfers after a small amount of delamination, rather than suddenly deleting the interface upon reaching a single threshold. Taking dynamic pull-out tests as an example, after 200,000 cycles, the average pull-out forces at 3, 5, and 7 Hz were 1118, 1020, and 939 N respectively, with change rates relative to the static pre-fatigue value of 952 N of +12.9%, +7.1%, and −1.4%; at 5 Hz and 200,000 cycles, the average pull-out forces from 0 to 80 °C were 1036–1124–1098 N, reaching a maximum at 60 °C [65]. Therefore, frequency increase and high-temperature exposure are not simply monotonous degradation processes. Temperature acts on rubber fatigue and interface performance through multiple, often non-monotonic pathways. To illustrate this coupling across both experimental and numerical evidence, Table 4 compiles representative quantitative results on the temperature and thermo-mechanical dependence of rubber fatigue and interface performance, covering temperature-dependent dynamic pull-out force, cord–rubber bonding ratios under elevated-temperature H-pull tests, the directional effect of near-surface temperature gradients on maximum principal stress, and the combined influence of compression ratio and temperature on seal fatigue life. Because these rows belong to different hierarchical metrics—interface test data versus theoretical or numerical predictions—they should be interpreted together with their respective boundary conditions rather than directly compared.
Table 4.
Cross-literature evidence of temperature and thermo-mechanical coupling on rubber fatigue and interface performance.
3.4. Coupled Effects of Multiple Failure Modes
Actual track damage usually manifests as a mutual promotion of wear, fatigue, interface effects, and thermal effects. Wear thins the tread rubber and exposes internal defects; cracks increase local flexibility and frictional slip; interface debonding changes the load path; and the temperature rise caused by viscoelastic dissipation reduces modulus and alters crack growth rates. Therefore, coupling mechanisms should not be linearly superimposed only after several independent model outputs, but rather should update geometry, temperature, and material state so that subsequent cycles account for existing damage [75].
A systematic review by Tee et al. of rubber fatigue studies from 2002 to 2017 shows that multiaxial loads, temperature, aging, strain crystallization, fillers, and notches collectively affect initiation and propagation, and the effectiveness of different fatigue indicators depends on the load ratio and material system [76]. Studies on temperature gradients in tire rubber further indicate that the softer modulus gradient in the surface layer may either decrease or increase tensile stress in the contact area, depending on the gradient distribution; therefore, correcting life using a single average temperature is insufficient [73]. Thermomechanical research on reciprocating rubber seals also shows that increased compression ratio leads to nonlinear life reduction: at 15.40% compression ratio near 75 °C, a life peak of about 2.58 × 10⁵ cycles occurs, whereas at 21.10% compression ratio, life stabilizes around 9.3 × 10⁴ cycles [74]. Although the objects are not tracks, these results clearly demonstrate the non-monotonic coupling between geometric constraints, temperature, and strain energy.
The coupling between wear and fatigue initially occurs through geometric changes. As the tread rubber gradually thins, the bending stiffness of tread blocks decreases, the protective thickness of the reinforcement layer from the surface is reduced, and local stresses caused by particles are more easily transmitted inward. At the same time, contact area and pressure distribution change, and original critical zones may shift. Calculating full-life stress based on initial geometry and multiplying by a fixed wear coefficient cannot represent this migration. A more feasible approach is to divide the life into several state intervals, update geometry according to measured or predicted wear in each interval, and recalculate local energy [52].
Thermal effects permeate multiple damage pathways. Viscoelastic dissipation and interfacial micro-slip generate heat, and the resulting temperature rise can change the modulus, loss factor, friction, and crack growth rate; a decrease in modulus may further enlarge deformation and increase dissipation, forming a positive feedback loop. On the other hand, a softer surface layer may also alleviate certain contact tensile stresses, so the influence of temperature does not accelerate monotonically at all locations. Thermomechanical analysis requires solving for the location of heat sources, heat dissipation boundaries, and the temperature-dependent material parameters and should be validated through internal temperatures rather than just surface infrared results. Conditions of mud and water coverage, evaporation, convection, and particle accumulation all alter the boundary conditions and should be recorded separately in experiments [77]. Figure 7 demonstrates how sliding pressure, friction, viscosity grading, and loading wavelength jointly govern thermally modified tensile stresses in rubber.
Figure 7.
Thermo-mechanical coupling between sliding contact viscosity gradients and tensile stress [73]. (a) Periodic sliding pressure acting upon the surface of the viscoelastic half-plane. (b) WLF viscosity and its linear approximation vs. depth (temperature gradient a/k = ±2.6 °C). (c) Maximum principal stress as a function of the friction coefficient for different Poisson’s ratios and the case of no mean pressure, all with no grading. (d) Maximum tensile stress vs. external load wavelength at different sliding velocities (α ≈ 2871/m, G2/G1 = 1000, η/G2 = 10−4s, μ = 0.5, ν = 0.5). (e) Normalized maximum principal stress vs. grading coefficient , with , , μ varying (black: reference; dotted: no-grading level). (unit: degree).
There is also a less discussed indirect relationship between interfacial damage and wear. Debonding weakens local skeletal support, causing the ground-contacting rubber to experience greater cyclic deformation under wheel pressure, resulting in increased surface slip and temperature rise; after external wear or notches reach the reinforcement layer, water and fine particles can more easily penetrate the cracks, promoting interfacial degradation. This coupling often accelerates in the later stages of service, and early linear extrapolation can overestimate residual life. If condition monitoring can simultaneously track tread height, internal temperature, and local stiffness, it has the potential to identify this acceleration turning point, rather than waiting to determine failure only after steel cords are exposed [78].
The core issue of multi-failure coupling is determining when the dominant mechanism transitions. In the early stage, tracks may primarily undergo surface polishing and stable self-heating; the middle stage sees dispersed microcracks and local debonding; and in the later stage, due to geometric thinning and stiffness reduction, accelerated propagation occurs [19,20,21,22,79]. The transition points may manifest as changes in the temperature rise slope, dynamic stiffness, wear rate, or acoustic signals. If these transitions can be reliably identified in tests and in the field, life models can use staged parameters and provide a basis for condition monitoring warning. Compared to using a single damage rate for the entire lifespan, staged descriptions better reflect reality and make it easier to explain why the condition changes after maintenance.
4. Evaluation of Rubber Track Durability and Life Prediction Methods
Durability evaluation requires connecting material specimens, structural components, and complete machine tests. Material tests provide parameters for crack initiation or propagation; structural analysis converts field loads into local histories; and life models accumulate damage and predict locations and cycles. If any link is inconsistent with the actual failure mode of the track, the final lifespan, even if numerically close, may merely result from parameter compensation [80,81,82,83,84].
Methods applicable to engineering design decisions should meet at least four requirements. First, the model should be able to identify critical areas under operating conditions not involved in calibration; second, the predicted crack directions or delamination regions should be consistent with experimental observations; third, life prediction errors should be within an engineering acceptable range, providing information on variability and confidence intervals; and fourth, input parameters should be obtainable through standardized or repeatable tests. Using a single S-N curve to describe all rubber materials, temperatures, and load ratios easily implies parameter dependencies within empirical coefficients; overly detailed 3D multi-scale models, if lacking reliable interface parameters and field boundary conditions, are equally difficult to improve predictive confidence [85,86,87]. Therefore, the focus of evaluation should shift from model complexity to the integrity of the evidence chain and select methods with different precision and costs for scheme screening, detailed design, and in-service prediction.
The methodological system needs to be layered around design problems. Material selection focuses on the relative durability of different rubbers and interface solutions; structural design requires locating critical areas and comparing parameter variations; in-service management needs to update the remaining life based on individual loads and damage. These three tasks have different requirements for model accuracy, computational speed, and data volume. Using the same complex model for all stages is both uneconomical and likely to cause parameter unidentifiability. Based on this, this chapter evaluates the sources of evidence from four routes—experiments, simulations, mechanistic life models, and data-driven methods—and emphasizes that model outputs must correspond to specific decisions.
Evaluation methods have complementary evidence functions. Experiments provide material and damage facts; numerical models explain loads in the track that are difficult to measure directly; life criteria convert local histories into cycles or mileage; and data methods handle individual differences and continuous updating [4,88,89]. Any method alone is prone to blind spots: experiments lack extrapolation beyond test conditions, simulations are limited by parameters and boundaries, and data models are constrained by sample distributions. Reliable prediction should allow the four types of evidence to constrain each other and identify the causes when models and experiments are inconsistent.
4.1. Durability Testing and Damage Characterization Methods
Experimental design should select loads, clamping methods, and monitored variables based on the target failure mode. The wear of grounding rubber requires control of roughness, particles, moisture content, speed, and temperature; rubber fatigue needs to distinguish between notch-free initiation and pre-crack propagation; for cord composites, one must avoid non-target interfacial damage caused by the fixture. Apart from the final number of cycles, surface morphology, temperature fields, stiffness decay, dynamic creep, and crack paths can provide the process information required for model calibration [90].
Riehm and others proposed a method to invert the rubber friction characteristics on wet surfaces based on Grosch wheel rolling measurements. Compared with conventional slider tests, this method has a contact state closer to rolling tires and achieves better results in longitudinal characteristic models [23]. Tao and colleagues found that conventional wedge fixtures generate shear stress concentration in the clamping region, causing single carbon cord reinforced HNBR specimens to fail prematurely due to non-target interfacial debonding; their study redesigned the experimental method by combining thermal imaging, scanning electron microscopy, and finite element analysis, thereby reducing the underestimation of fatigue life [91]. Automated energy methods aimed at a wide range of tear energies can obtain crack propagation data from the fatigue threshold to the critical tear energy within hours and are consistent with classical results [92]. These studies indicate that track test platforms should meet both operating condition similarity and failure mode similarity.
The primary task of material-level testing is to obtain transferable parameters rather than replicate the entire track. Notch-free tensile or dumbbell specimens are suitable for comparing crack initiation tendencies, pre-cracked specimens are used to establish the relationship between crack growth rate and tear energy, and wear tests can control particles, pressure, and slip. The problem is that the stress states of these specimens are generally simpler than those of tracks. To improve parameter usability, connections between uniaxial, multiaxial, and temperature-dependent tests should be established on the same batch of rubber, and load ratios, waveforms, frequencies, self-heating, and failure definitions should be reported. Without this information, even if the life curve fits well, it is difficult to judge whether it can be used for structural prediction.
Segment tests of structures serve the function of scale bridging. Representative units that include tread blocks, cord ends, or drive teeth can be extracted from the track and loaded under the combined action of wheel pressure, tension, and bending, so that the hazardous zones are consistent with the full track. Segment test rigs are more convenient than full-track tests for using digital image correlation, thermography, acoustic emission, and microscopic observation and can also be stopped at several cycle nodes for inspection. When designing such tests, finite element analysis should first be used to eliminate non-target damage caused by fixtures and cutting boundaries, and full-size tests should be used to confirm the location and direction of cracks in the segment. Segment lifespan cannot be directly equated to full-track lifespan, but it can be used to verify local mechanisms and compare structural schemes [93].
Full vehicle field tests ultimately verify the similarity of operating conditions. In addition to recording failure mileage or operating time, soil conditions, task type, load, and temperature should be collected simultaneously and driving operations described in a reproducible manner. Agricultural seasons and weather make fully repeatable tests very costly, so key observables and shutdown nodes should be predefined to avoid having only final-state photos without evolution data. If the number of samples is limited, repeated units from different positions of the same track can form hierarchical data, but statistical analysis should consider that the positions are not completely independent. Test results are best presented with typical values, variation ranges, and the proportion of failure modes, providing a basis for probabilistic life models [94].
The comparability of test results is also worth attention. Different studies often use different waveforms, frequencies, temperature controls, and crack criteria; even if all report fatigue life, it may not correspond to the same physical stage. It is recommended that when publishing life data, the original force–displacement or stress–strain histories, self-heating stabilization time, failure location, and image evidence be provided, as well as clarification whether the specimens come from finished tracks. For wear tests, the counter materials, particle renewal method, and slip distance should also be described. Standardizing this information will not eliminate material differences but can reduce apparent contradictions caused by test definitions. Figure 8 illustrates the specimen geometries and proportional or variable-amplitude loading paths used to reproduce multiaxial rubber fatigue under controlled conditions.
Figure 8.
Specimen geometries and loading paths for multiaxial rubber fatigue testing [58,95]. (a) Rubber fatigue specimens. (b) Two-dimensional dumbbell specimen suggested by standard. (c) Uniaxial loading paths (δ = displacement; θ = twist angle). From left to right: fully relaxing loads; nonrelaxing loads (Rδ > 0); compression loads (Rδ < 0). (d) Evolution of variable amplitude fatigue loads (δ = displacement; θ = twist). (e) Typical specimens of SAB type. (f) Typical specimens of HAB type.
4.2. Numerical Simulation and Damage Analysis Methods of Rubber Tracks
Track numerical analysis involves large material deformations, anisotropy of cords, contact friction, soil plasticity, and the motion of the entire machine, making it difficult for a single model to cover all scales. Finite element analysis is suitable for analyzing local stresses, energy, and interface states; multi-body dynamics is suitable for obtaining the posture and load on the support wheels of the whole machine; and discrete element methods can describe the rearrangement of soil particles and crop straw. A more feasible engineering approach is hierarchical modeling, with forces, displacements, slip rates, and pressure distributions measured and passed between layers for validation [96].
A review of tire fatigue numerical studies suggests that crack energy density is suitable for evaluating multiaxial crack initiation, while the propagation phase can choose propagation finite element methods, cohesive zones, J-integral, or virtual crack closure techniques; the choice of model should follow the crack phase and computational cost [39]. Xie et al. established a DEM-MBD coupled model for the straw–sandy ginger black soil–track mechanism, aiming to reproduce driving force and operational stability in soil containing flexible straw [97]. Coneo et al.’s multi-body model of agricultural rubber tracks showed maximum slip rates of about 9%, 8%, and 6% in dry sand, sandy loam, and clay respectively and could compare the vertical load on support wheels, track tension, and motion resistance under slope and traction load conditions [27]. These results indicate that the boundary conditions for local fatigue finite element models should come from whole-machine–soil models validated with field data [79].
Multi-body dynamics models are suitable for answering where the whole-machine loads come from. They can include body bouncing and pitching, suspension, support wheels, drive wheels, and tensioning devices and calculate traction and resistance using empirical or semi-empirical soil models. Their limitation is that tracks are usually simplified as discrete rigid bodies or equivalent flexible bodies, and internal rubber layers and cord stresses cannot be directly obtained. Model validation should not only compare vehicle speed and traction but also check the dynamic load of the support wheels, track tension, and slip variation over time, as these quantities will serve as boundaries for local finite element analysis [98].
Finite element models can resolve large deformations of grounding rubber, anisotropy of reinforcement layers, and complex contact, but material selection significantly affects the results. Hyperelastic models describe quasi-static stress–strain relationships, viscoelastic or hysteresis models are used for cyclic dissipation, and damage and crack models require additional parameters. If material parameters are fitted only from uniaxial tensile tests at a single strain rate, correct displacements but incorrect energies may occur under temperature changes and multiaxial cycling. Parameter calibration should simultaneously constrain force–displacement, unloading hysteresis, temperature rise, or phase difference and check the model’s stability outside the calibration range. For cord-reinforced composite layers, longitudinal and transverse stiffness as well as interlaminar shear should also be verified, rather than merely fitting overall tension [71].
The coupling of discrete element method with finite element and multibody dynamics provides a more detailed representation of soil and straw interactions. Discrete elements can describe particle rearrangement, shear bands, and stubble entanglement, but particle parameters are often inferred from pile angles or shear tests, which may result in multiple parameter sets producing similar macroscopic results. Coupled computations also face differences in scale and time steps, and a more detailed model does not automatically mean more accurate track damage prediction. Soil resolution should be selected based on target outputs: if overall traction and wheel loads are the focus, a macroscopic soil model may suffice; if sharp particle cutting and local wear are studied, a more detailed contact description is needed, validated by particle penetration depth or surface damage [99].
The credibility of numerical models should be evaluated based on the degree of independent validation of key outputs, rather than the mesh size or the number of coupled software packages. Full-vehicle models should at least reproduce traction, slip ratio, and carrier wheel loads; local models should at least reproduce force–displacement relations, strain, or temperature responses; and damage models should also be consistent with crack initiation locations and propagation paths. If the same set of validation data is used for both material parameter inversion and result evaluation, it cannot constitute independent validation. Studies should clearly differentiate measured parameters, calibrated parameters, and assumed parameters and conduct sensitivity analyses to identify the main sources of uncertainty in life prediction. Transparent reporting of this information is the basis for ensuring model reproducibility and engineering applicability. Figure 9 presents a field-to-signal validation chain that combines vehicle testing, strain instrumentation, measurement-point definition, and simulation comparison.
Figure 9.
Experimental measurement chain for track stress and vibration model validation [25,32]. (a) Strain rosettes. (b) Diagram of measure points. (c) Signal system for the test. (d) Time history of the vibration measurements on tractor D(1), equipped with 5-roller track support, traveling uphill and downhill, with the maximum stiff setting of the mechanical suspension of the seat. RMS, root mean square.
4.3. Fatigue Life and Wear Life Prediction Methods
Life prediction methods can be classified according to damage variables into strain- or energy-based initiation models, fracture mechanics propagation models, interface S-N models, and empirical wear models. Initiation methods are convenient for handling complex components without significant initial cracks, propagation methods can describe defect size and path, interface models are suitable for cord debonding, and wear models need to handle continuously changing contact geometry. Track design should select models according to the dominant failure stage and simultaneously validate the location, path, and life using the same test.
Mars and Fatemi compared the two frameworks of rubber crack initiation and crack propagation, pointing out that the former relies on local strain, stress, or energy parameters, while the latter requires initial defects and the tear energy–growth rate relationship; the two are suitable for different design stages [2]. Chen et al. demonstrated that the classical energy release rate formula for pure shear specimens only applies when the crack does not deflect and used the J-integral along the actual crack path to calculate the energy release rate; considering deflection leads to fatigue parameters that more accurately predict tensile fatigue life [100]. Luo et al. observed in the bending fatigue of pultruded cord–rubber laminates on pulleys that using only rubber crack growth characteristics would overestimate life due to neglecting the degradation of interface adhesion; the S-N method based on specialized interface fatigue tests and global–local analysis is closer to structural tests [66]. Luo et al. conducted pulley bending tests on pultruded cord–rubber laminates using a 1 kN static load, 180 r/min (about 3 Hz), and pulley diameters of 12.5–40 mm; the initial interlayer delamination strength was 11.60–13.37 kN/m. When the pulley diameter was 12.5 mm, significant deformation/delamination appeared after about 2 × 10⁴ cycles; at 106 cycles, a 40 mm pulley still showed no obvious damage (delamination strength 8.54 kN/m), but noticeable deformation appeared after 1.5 × 10⁶ cycles (4.14 kN/m) [66].
The main difficulty in predicting wear life is the continuous variation in friction, temperature, and material state. A review of tire wear models categorizes existing methods into five types: empirical, semi-empirical, analytical, numerical, and data-driven. It points out that many models are only valid for specific rubber compounds or contact conditions, and transient dynamics and thermo-mechanical feedback remain bottlenecks for generalization [1]. In terms of structural durability, Kim et al. used steady-state rolling finite element analysis to obtain the strain energy density amplitude at the steel belt edge and combined it with the rubber fatigue curve to predict high-speed durability tests. The average prediction accuracy for eight tires was about 92%, but individual samples were only about 76.5%, showing that differences in local parameters and failure modes can still cause significant deviations [101]. Agricultural tracks can refer to this process, but soil slip, particle wear, and variable amplitude bending must be incorporated into the load history. Kim et al.’s predictions for 8 tire samples ranged from 76.5% to 99.7%, with an average accuracy of 92.0%, and the correlation fit R2 for test-predicted travel distance was 0.952 [101]. These results can serve as an engineering reference for the local strain energy density–fatigue curve method, but the samples with the lowest accuracy still show significant uncertainties caused by differences in failure modes and local parameters [102]. To evaluate the credibility and transferability of different life prediction approaches, Table 5 compares representative quantitative validation results and applicable boundaries of four typical methods—equivalent-stress-based Miner accumulation for transport tracks, tire rubber crack growth, laminated pulley bending combined with crack energy density, and steady-state rolling finite element analysis with ΔSED-based fatigue curves. Because each row corresponds to a different material, structure, and load system, the predicted cycles or lifetimes should not be directly compared across rows; the table is intended to highlight the input–output relationships and validation schemes of each method, as well as the conditions under which they remain applicable.
Table 5.
Quantitative validation results and applicable boundaries of different life prediction methods.
Fatigue life prediction can be carried out through two paths: crack initiation and crack propagation. The initiation method establishes the relationship between strain, strain energy density, or crack energy density with cycle life, suitable for structural screening where macroscopic cracks are not yet present; the expansion method starts from the initial defect, accumulates the growth rate of splitting traces up to the critical size, and better describes the remaining life after repairing visible cracks. The boundary between the two is not fixed, as test resolution determines when cracks are considered to have emerged. Engineering applications should clearly define initial defects and termination conditions and avoid directly equating the “cracking cycle” of material samples with the moment visible cracks appear in the track [62].
Wear life models usually focus on material removal per unit distance or unit friction effort. Empirical models have fewer parameters and are easier to calibrate, but are sensitive to changes in pressure, velocity, temperature, and medium; contact and crack-based models are more explanatory but require roughness, friction, and fatigue parameters. Wear in agricultural tracks also alters traction performance, so the endpoints can be tread height, mass loss, or performance thresholds. Different endpoints correspond to different lifespans, so models must be consistent when comparing. If the goal is maintenance decisions, using traction efficiency or slip resistance as the minimum allowable value as the endpoint is usually more practical than complete wear [103].
Variant load accumulation is a common challenge in both types of life prediction. Rainfall counting and the Miner method can compress long-term loads into several cycle intervals, making calculations simple but ignoring load sequence, self-heating, and material state changes. For tracks, blocks can be divided by operation stage, with cycle counting performed within each block, followed by correction of damage rates based on temperature, wear depth, and stiffness state. This preserves engineering operability while allowing differences in different operation sequences. Prediction results should provide hazard locations, dominant working conditions, and life intervals; providing only a single total cycle count cannot support structural improvement and masks uncertainty in material parameters and load measurements [104].
Different lifetime models do not need to pursue uniform formality, but input and endpoint should be unified before comparison [14,15,18,19]. For the same track hazard zone, maximum principal strain, energy density, critical plane, and crack propagation methods can be used separately to check whether their judgments on location, condition ordering, and lifespan are consistent. If life values differ but hazard locations align with design trends, the model can still be used for scheme selection; if refitting yields near-lifetime results but the direction of structural change is opposite, more mechanistic experiments are needed. Model value should be measured by whether it supports new scheme decisions, not solely by fitting errors on existing samples.
4.4. Data-Driven Remaining Life Prediction Methods
Data-driven methods are suitable for handling nonlinear relationships that are difficult to describe explicitly. However, the number of agricultural track failure samples is limited and their operating condition distribution is uneven. Black-box models lacking physical constraints often have insufficient generalization capability under new soil conditions or new structures. A more reliable approach is to use physical models to generate data or impose constraints and to correct model biases through limited bench and field observations while quantifying predictive uncertainty. Input variables should also include temperature, vibration, tension, slip rate, and stiffness indicators that reflect damage evolution, rather than only using cumulative mileage [80,81,105].
Zarrin-Ghalami et al. combined a stable cyclic constitutive model, quasi-static finite element analysis, critical-plane crack energy density, rainflow counting, and the Miner cumulative rule for automotive subframe rubber bushings; the model accurately identified crack initiation locations in axial, in-phase, and out-of-phase torsional composite amplitude tests and provided reasonably estimated initiation life [106]. A data assimilation study further generated dense life data using an incremental crack propagation model and then used three-dimensional variational assimilation to integrate sparse experimental information into a neural network, balancing the physical constraints of crack evolution with prediction efficiency under multiple load conditions [107]. A recent rubber fatigue review incorporated machine learning, digital image monitoring, self-healing materials, and thermo-oxidative aging into new developments, while also noting data heterogeneity caused by different materials, temperatures, and load ratios [58]. These methods provide a pathway for predicting track remaining life, but the prerequisite is establishing traceable failure samples and cross-condition validation sets.
The advantage of data-driven methods lies in handling multi-source, nonlinear, and time-updated information, but their effectiveness is constrained by data distribution. Real failure samples of agricultural tracks are scarce, and there are significant differences in machine type, soil, and tasks. Directly training end-to-end life models can easily misinterpret machine type or seasonal characteristics as degradation patterns. Data should be divided according to track unit, machine type, or operational area, rather than randomly splitting adjacent periods of the same track into training and testing sets, as this would severely overestimate testing accuracy. Evaluation metrics should consider not only mean error, but also early warning capability and confidence interval coverage. Research on rotating machinery health indicators and remaining life prediction provides methods for cross-object reference [82,83,84,85,108].
The integration of mechanistic models and data better aligns with current data conditions. Multi-body and finite element models can generate load and damage trends under different operating conditions, while measured data are used to correct parameter deviations; when sensors detect temperature, vibration, or tension anomalies, Bayesian updating, state-space models, or data assimilation can adjust individual damage states. The mechanistic models here do not need to be extremely complex, but they should retain the main causal relationships and avoid networks making extrapolations based solely on correlations. The fusion model can also incorporate constraints such as conservation, monotonicity, or fatigue thresholds, ensuring that predictions remain reasonable when samples are sparse [109]. Figure 10 outlines the progression from mechanistic wear laws and structural finite element models to experimentally validated and hybrid data-driven durability prediction.
Figure 10.
Integrated mechanistic numerical and hybrid data-driven durability modeling [1,39]. (a) Simulated and experimental tread wear comparison. (b) Structural and contact model of the PaRRT tire. (c) Hybrid physical–statistical approach to tire wear. (d) FE modelling strategies employed by Jeong et al. showing areas with different mesh sizes (refined and coarse).
Whether a remaining useful life (RUL) system can be deployed also depends on signal stability and maintenance processes. Soil adhesion, sensor drift, and structural replacements can change the data baseline, and models need to distinguish sensor failures from real degradation. In practical applications, a tiered strategy can be adopted: low-cost vibration, temperature, and drive information are used for continuous screening, and when anomalies occur, damage is verified through imaging, ultrasound, or local stiffness detection; maintenance results are then fed back into the model. Prediction outputs should be expressed as risk intervals and recommended inspection windows, rather than apparent precise single RUL values, which better reflects the inherent discreteness of material life and also facilitates integration with operational planning.
Data governance will determine whether RUL research can accumulate effectively. Each track link needs a unique identifier and should be associated with material batches, structural versions, installation dates, vehicle models, missions, soil types, maintenance, and failure records; sensor data need to be standardized in time, units, and missing data markers. Without this metadata, even large-scale data across seasons and vehicle models cannot easily explain the physical meaning of patterns identified by models. Considering corporate data sensitivity, de-identified features, load segments, and standardized benchmark tasks can be prioritized for sharing, and a public training–testing split can be established for comparing different algorithms under the same extrapolation conditions.
5. Factors Affecting Rubber Track Durability and Improvement Strategies
Track durability is determined by materials, structure, operation, and environment, and there are practical constraints between optimization objectives. For example, increasing hardness may reduce wear but increase lag heating or interfacial stress; increasing tension can suppress derailment but increase average cord tension stress and wheel bending load. Improvement strategies should use dominant failure modes and target agricultural conditions as boundaries, seeking manufacturable and verifiable trade-offs through multi-objective optimization.
Influencing factor analysis should be especially cautious about single-factor optimality. Increasing packing content under laboratory conditions may improve wear resistance, but compound loss, flexural fatigue performance, and interface infiltration may also change; increasing track width can reduce nominal ground pressure but may raise steering resistance and expand lateral shear area; lowering vehicle speed can reduce impact frequency, but if the driver maintains traction by increasing slip rate, friction work per unit distance may not decrease. Therefore, improvement strategies require clear evaluation benchmarks, such as comparison based on number of cycles, travel distance, operating time, or completion of equivalent agronomic tasks. More reasonable indicators should correlate failure risk with effective work volume while constraining soil compaction, traction efficiency, and energy consumption. The resulting design conclusions can reduce dependence on specific test boundaries.
Durability improvement is not a matter of three independent optimization issues: materials, structure, and working conditions. Material changes affect contact and temperature rise; structural adjustments redistribute loads on the material; operational strategies determine how often these loads occur. When evaluating solutions, always ask which damage path improvements work on, whether risks are shifted elsewhere, and whether they remain effective under the same agricultural tasks. This chapter thus transitions from factor analysis to joint design, avoiding improving the durability of alternative systems based on single performance.
Influencing factors can be further divided into variables determined during design and states that change during use. Compound, cord layout, and gear train geometry belong to the former, while temperature, wear, tension, and interface integrity belong to the latter; working speed and slip are both operational variables and drive state evolution. If only design variables are addressed, the track is assumed to maintain its initial state throughout its entire life. More meaningful solutions should examine whether the design is sensitive to state changes and reserve space for tension adjustment, temperature control, and preventive maintenance, so that durability comes from the combined effect of structure and management.
To clarify how the foregoing factors jointly govern track durability rather than acting independently, Figure 11 summarizes the interrelationships among material, structural, operational, and environmental factors. The four factor groups do not operate in isolation; they converge through three coupling pathways—thermo-mechanical, chemical–mechanical, and aqueous–mechanical—to drive surface wear, fatigue cracking, and interface debonding. These three failure modes further accelerate one another through geometric thinning, temperature rise, and stiffness degradation in the late service stage. The closed-loop optimization design on the right indicates that durability improvement should follow an iterative chain from field load spectra through multi-body and finite-element modeling to multi-objective optimization and graded validation, rather than optimizing any single factor in isolation.
Figure 11.
Framework of influencing factors, coupling pathways, and closed-loop optimization for rubber track durability.
5.1. The Impact of Material Performance on Durability
Key variables at the material level include the type of rubber matrix, crosslink density, type and dispersion of fillers, hardness, loss factor, tear strength, crack growth threshold, and adhesion performance with steel cords or fabrics. The functions of the tread rubber and inner layer rubber are different; the former focuses more on wear resistance, cut resistance, and thermal stability, while the latter also needs to consider cord adhesion, low hysteresis, and flex fatigue life. Therefore, material optimization should be divided by layers rather than ranked by a single hardness or tensile strength. Strain-induced crystallization of natural rubber is also a process that needs to be considered in material performance characterization [110].
Studies on aluminum oxide-filled NBR show that aluminum oxide can improve hardness, tensile, and tear strength; when 5 g is added, wear resistance is optimal, and the improvement is more significant under high load and high speed, with wear dominated by fatigue and adhesion mechanisms [111]. Reviews of rubber composites indicate that carbon black, silica, glass fiber, carbon fiber, aramid, metal cords, and natural fibers can all serve as reinforcing phases, but their fatigue effects depend on crack path, interface quality, cyclic hysteresis, and continuity of the reinforcement; static reinforcement does not necessarily indicate a simultaneous increase in fatigue life [112]. Comparative trials in abrasive soil further found that the wear resistance of two types of elastic track materials and Hadfield steel is controlled by soil particle size and material chemical composition, with polymer rubber coatings showing the highest wear index in both light and heavy soils [49]. Therefore, the selection of agricultural track rubber compounds should link the target soil particle spectrum with fatigue and heat rise tests. Quantitative results indicate that when aluminum oxide increases from 0 to 5 g/100 g NBR, tensile strength rises from 10.63 MPa to 15.43 MPa (an increase of 45.16%) and Shore A hardness increases from 72.5 to about 80; under 300 r/min and 8 N, wear mass decreases from 40.7 mg to 31.1 mg, and under 500 r/min with the same load, from 89.1 mg to 65.5 mg [111]. These results pertain to NBR experimental formulations and should not be directly equated to the field wear rate of an entire agricultural track. Material formulation and reinforcement configuration affect track durability through multiple, interacting pathways, and their ranking often depends on the contact medium and test severity. To support layer-by-layer material selection, Table 6 compiles representative comparisons of rubber compounds and reinforced composites with respect to surface-layer durability across the literature, covering alumina-filled NBR, field-failed track pin rubber belts, steel cord–rubber composites, BR/S-SBR filler systems, and track overlay materials. Since strength, strain, wear mass, surface modulus, and wear index Kb are not directly convertible, the table is intended to identify how material composition, reinforcement configuration, and contact medium control the dominant durability pathways rather than to rank materials by a single indicator.
Table 6.
Comparison of rubber and reinforced composite performance with surface layer durability across the literature.
The track rubber formulation needs to balance cut resistance, fatigue resistance, low heat build-up, and wet friction performance. Increasing hardness or filler content generally helps suppress particle indentation but may reduce large deformation capacity and increase crack tip stress; reducing loss can lower self-heating while also changing hysteresis friction and traction performance on rough surfaces. Material selection should not only compare room-temperature tensile strength and wear volume but also test crack propagation, dynamic modulus, loss factor, and wear morphology under representative temperature, frequency, and medium conditions. If the low wear of a certain formulation mainly comes from a reduced friction coefficient, it is also necessary to verify whether it would weaken field traction performance [113].
Quantitatively, these trade-offs can be illustrated by representative literature values: alumina-filled NBR composites showed a 45.16% increase in tensile strength (from 10.63 to 15.43 MPa) with 5 g Al2O3 per 100 g NBR, while wear mass decreased from 40.7 to 31.1 mg under 300 r/min and 8 N loading [111]; field-failed track pin rubber belts exhibited tensile strength ranging from 4.0 to 19.3 MPa and elongation at break from 230% to 771%, with failure mileage varying from 250 to 800 km across different formulations and manufacturing sources [34]; steel cord–rubber composites with 9/18 cord configuration at 18–20% volume fraction achieved estimated longitudinal strengths of 343–420 MPa but failure strains of only 2.0–2.1% [28]; and abrasive wear indices (Kb) for track overlay materials varied from 0.0047 to 2.4476 depending on soil type, demonstrating that a single standard wear value cannot represent field wear resistance [49]. These quantitative ranges underscore that material optimization must report the full dispersion of performance metrics rather than relying on average values.
The goals of the inner rubber layer and the interface rubber differ from those of the grounding rubber. They need to maintain adhesion to steel cords or fabric under repeated bending and mitigate the strain differences between the reinforcement layers. A higher modulus is beneficial for load transfer but may cause shear concentration at the ends; softer rubber layers can buffer deformation, but excessive viscoelastic loss will accumulate heat. During design, sudden changes can be reduced through gradient modulus, transition rubber, or end coverings, but any new layer increases the opportunity for manufacturing interfaces and defects. Evaluation of a material system should cover curing compatibility, rubber penetration, thermal aging, and cyclic adhesion after exposure to aqueous media, rather than merely verifying the initial static strength [69].
Fillers and reinforcements also affect the life scatter. Unevenly dispersed filler agglomerates and insufficiently impregnated cord bundles can become random defects, causing large variations in the life of samples with the same nominal formulation. Improving average performance while leaving the lower percentile life unchanged provides little value for safety and maintenance. Therefore, material optimization should report the mean, range of dispersion, and fracture origins, and include mixing, calendering, molding, and curing process parameters in quality control. For large composite products such as agricultural tracks, manufacturing consistency may determine early failure more than minor performance improvements on small laboratory samples. Studies on fatigue crack growth in carbon black-reinforced natural rubber indicate that filler systems need assessment using cyclic damage metrics as well [114].
The material scheme ultimately also needs to accommodate processing constraints at the finished product scale. A laboratory formulation performing well does not necessarily mean the same curing state can be achieved in thick-walled, multi-layer tracks; flow, venting, and cord impregnation change with product size. Material research should consider manufacturability as an early constraint and record mixing dispersion, Mooney viscosity, curing window, and interlayer co-curing matching. If there are performance differences between finished product samples and laboratory specimens, the source should be investigated in processing first rather than attributing all differences to field randomness. The low percentile life determined jointly by materials, processes, and structure is the real baseline for durability. Figure 12 shows how filler networks, hybrid reinforcement, and fiber-interface treatments alter fatigue resistance across rubber composite systems.
Figure 12.
Reinforcement architectures and their effects on rubber fatigue life [95,112]. (a) Four main interactions within rubber-based nanocomposites. (b) Diagram of measure points. (c) The fatigue life of NR filled with CB or CNT at different concentrations, at a strain amplitude of 20%. (d) Fatigue life NR filled with CNT and GO. (e). The fatigue life of SBR reinforced with short aramid fibers with different fiber coatings (f) The fatigue life of CB-filled SBR reinforced with short aramid fibers with different fiber coatings.
5.2. Influence of Structural Parameters on Durability
The track plate thickness, tread geometry, number and angle of carcass plies, pitch, road wheel diameter and spacing, drive wheel and idler dimensions, and initial tension collectively determine local deformation. Structural optimization must not only reduce ground peak pressures and end stresses on the carcass plies but also maintain traction, mud-shedding, and anti-derailment capabilities. Parameter effects usually exhibit opposing dual effects, and they must be evaluated jointly on both the full-machine motion and local damage scales [115,116].
Sheludchenko and others used Cassini curves to describe the contact area deformation of agricultural tires, optimizing geometry and operational parameters through a graphic-analytical approach to reduce soil loads; although the subject was tires, the “contact profile–pressure distribution–soil load” relationship can also be applied to track tread and cross-sectional design [117]. Szpaczynska and colleagues used ADAMS and the Wong soil model to compare four types of light track chassis, two tension conditions, five types of obstacles, and three soil types, with results showing that the walking mechanism configuration and tension conditions can significantly alter obstacle-crossing efficiency, driving force, and posture stability [36]. For agricultural rubber tracks, structural parameters should not be screened only on flat hard ground, but should at minimum cover four representative working conditions: straight traction, slopes, steering, and crossing ridges, while taking maximum local energy and derailment margin as parallel constraints [118].
Tread geometry directly affects soil shear, mud-shedding, and local bending of the ground-contact rubber. Taller, narrower treads can dig into soft soil, but generate greater root strain on hard ground; increasing root fillets can reduce stress concentration but changes effective contact and mud-shedding space. Tread pitch, together with road wheel and drive engagement cycles, also determines excitation frequency. Optimization should be evaluated across various soil and road conditions, rather than pursuing maximum driving force in a single traction test. Changes in tread height after wear should also be considered, because the initial optimal geometry may not maintain its advantage in mid-to-late service life [119].
The reinforced layer structure primarily controls longitudinal stiffness, bending compliance, and crack deflection. Increasing the number or cross-sectional area of plies can reduce the load on each individual ply, but increases overall bending stiffness, causing the rubber layer to bear higher shear when wrapping around small-diameter wheels; adjusting lay-up angles can improve lateral stability but may increase interlayer coupling. Ply end staggering, local reinforcement, and gradual transitions help reduce stress concentration but increase manufacturing complexity. Structural schemes should compare ply maximum strain, interlayer energy, and post-failure load redistribution via global–local models and be validated with segmental bending fatigue tests [120].
The wheel system and tension parameters determine how the track uses its own material properties. Increasing the diameter of the support wheel usually reduces local curvature and contact peaks, but it is limited by the overall machine space and weight; adjusting the wheelbase can make the pressure distribution more uniform but may affect obstacle clearance and ground-contact length. If the tension force is too low, it will cause tooth jumping, banging, and derailment, while too-high tension increases the average force on the carcass layers, bearing loads, and bending stress. The ideal tension value is not a fixed constant but should remain within the allowable range depending on wear, temperature, and operating conditions. If a controllable tension device can use track vibration and engagement status as feedback, it may balance stability and fatigue load [121].
Structural optimization should also consider dimensional tolerances and robustness after wear. Some parameter combinations can significantly reduce peaks at nominal dimensions but are very sensitive to cord misalignment, rubber layer thickness, or tension errors, and may not be stable after mass production. In optimization, major manufacturing deviations can be treated as random variables, allowing comparison of life distributions rather than a single optimal value. For treads and the wheel system, the contact and bending conditions during mid-life wear should also be checked. If a solution performs well only at the new track stage but quickly loses advantage as the tread wears down, its overall life benefits may be less than those of a more robust suboptimal design.
The applicability and limitations of structural optimization methods must be explicitly stated to avoid overgeneralization. Parametric optimization based on response surfaces or surrogate models is effective when the design space is continuous and the objective function is smooth—for example, optimizing road wheel diameter, track width, or initial tension within their physically admissible ranges—but it cannot handle discrete design decisions such as the number of carcass plies, tread pattern type, or the choice between steel cord and aramid reinforcement, which require mixed-integer or genetic algorithm approaches. Topology optimization of the tread cross-section can identify non-intuitive material distributions that reduce stress concentration, but its results are often difficult to manufacture through conventional rubber calendaring and molding processes, and the optimized geometry may exhibit poor mud-shedding or traction performance that was not included in the objective function. Global–local finite element optimization is powerful for capturing the interaction between whole-machine load distribution and local cord-end stress, but it requires careful calibration of the coupling boundary conditions; errors in the global model’s contact pressure distribution propagate directly into the local fatigue calculation, and the computational cost of iterating between global and local models limits the number of design candidates that can be evaluated. Multi-body dynamics optimization of the wheel arrangement and suspension parameters is well-suited for reducing peak impact loads during obstacle crossing, but it typically treats the track as a uniform flexible belt and cannot capture local cord–rubber interface failure or tread block fatigue; therefore, its results must be validated against local finite element analysis before being adopted. Finally, all structural optimization methods share a common limitation: they are calibrated against material parameters measured at specific temperatures, frequencies, and environmental conditions, and their predictions become unreliable when the optimized structure operates outside the validated parameter range. Optimization reports should therefore specify the validated operating envelope, identify which failure modes were included in the objective function, and disclose which modes were treated as constraints rather than optimization objectives.
5.3. The Impact of Operating Conditions on Durability
Operating speed, traction load, slip rate, turning radius, repeated passes, and obstacle impact determine the damage input per unit time. At low speeds with high traction, track-soil shear and average cord tension dominate; during high-speed road transfer, pulley frequency, centrifugal force, viscoelastic heating, and impact are more prominent; small-radius turning generates significant lateral shear and tread block torsion. Durability management should accumulate damage segmented by task type, rather than simply using engine hours or mileage to represent usage intensity [122,123].
Prototype track traction tests show that the pressure and tangential force distributions for the same structure differ significantly on hard surfaces and sandy loam soil with different moisture contents, and the contributions of soil adhesion and rubber friction to traction vary with moisture content [11]. Multibody dynamics results for agricultural tracks also indicate that slip rate and motion resistance differ on dry sand, sandy loam, and clay and that traction loads from slopes and seeders can alter front and rear support wheel loads and track tension [27]. Therefore, operational strategy optimization can start by limiting sustained high slip, reducing ineffective sharp turns, reasonably selecting road transfer speed, and matching implement traction resistance, and measured load spectra can be used to evaluate whether these measures truly reduce cyclic energy in dangerous zones [124].
Slip rate is a key operational parameter connecting traction performance and durability. Moderate slip helps form a shear zone in the soil and generate traction, whereas continuously high slip converts more input energy into soil destruction, surface friction, and heat. Control strategies should not simply aim to minimize slip, because excessively low slip may indicate insufficient traction or unreasonable engine operating conditions. The economic slip range should be determined based on soil strength and implement load and evaluated using the accumulated friction work and fatigue damage per unit of work area. This way, one can avoid merely reducing instantaneous slip but failing to decrease total damage due to prolonged operation time [125,126].
Speed management also needs to differentiate between field and road conditions. During low-speed field operations, speed variations affect soil shear rate and unit contact time; high-speed road transfer increases track cycle frequency, self-heating, and centrifugal load. If the track immediately drives at high speed after high-load operation, internal temperature may continue to rise. The control system can restrict continuous high-speed time based on load, temperature, and road conditions, instead of using a uniform speed limit. For ridges and uneven terrain, the main value of reducing speed is to mitigate wheel load impact and track tension fluctuations, and effectiveness should be verified through peak loads rather than average vibrations. High-speed friction studies between aircraft tire treads and pavement can provide a reference for speed effects, but their speed ranges cannot be directly equated with field operations [127,128,129].
Driver and maintenance behavior also constitutes part of the operating condition [130,131,132,133]. Frequent zero-radius turns, sudden acceleration, and asymmetric braking increase edge shear and drive sprocket impact; insufficient tension, uneven wheel wear, and untimely clearing of mud and debris convert normal loads into abnormal local loads. These factors are difficult to reflect in material tests but may explain the long-tailed distribution of field life. Durability management can incorporate operational events, tension adjustments, and wheelset maintenance into the track history, allowing life models to distinguish between design capability and usage deviation. Driver-facing prompts should be based on clear, actionable metrics, such as prolonged high slip or temperature exceedance, rather than general instructions to reduce harsh operation [134,135,136,137,138].
Operational optimization should be evaluated simultaneously with work efficiency. Reducing speed, traction load, or steering intensity usually reduces instantaneous damage, but it may also extend operation time or increase the number of passes. A more reasonable benchmark is the track life consumed per unit area, per unit of traction work, or for equivalent agronomic quality. Control systems can select speed and torque based on soil and implement conditions to balance damage rate and productivity. With temperature and high-slip event records, real-time driving-oriented recommendations can also be generated, providing a quantifiable explanation for lifespan differences caused by different operators [7,8,12].
5.4. Environmental Factors Affecting Durability
Temperature, humidity, ozone, mud and water, salts, and UV aging can alter rubber modulus, viscoelastic loss, interface chemical stability, and crack propagation rate. The internal temperature of agricultural tracks is not the same as the ambient temperature: ground slip, repeated compression of idler wheels, and cord bending continuously generate heat, while mud and water can alter heat dissipation and lubrication conditions. Therefore, environmental evaluation should distinguish between external exposure and self-generated temperature rise, and focus on the combined effects of temperature, frequency, and cycle number on interface adhesion performance [86,87,139].
Shi and others designed a rubber–steel cord dynamic fatigue test and found that the dynamic pull-out force decreases with increased fatigue frequency and first increases then decreases with increased temperature and cycle number; failure mainly occurs in the rubber phase rather than at the ideal interface, and outer-wound steel cords have higher static adhesion but do not necessarily maintain an advantage after fatigue [65]. A review of rubber fatigue progression lists temperature, humidity, and ozone as important environmental factors, with temperature usually being the most sensitive, and notes that different rubber and filler bonding states lead to differences in environmental sensitivity [95]. Jamshidi and colleagues studied the cord–rubber system at high temperature using the H-pull method, confirming that operating temperature rise can alter adhesion energy and that vulcanization temperature and the interaction between stable and unstable interface phases jointly affect pull-out strength [72]. Accordingly, track material and interface tests need to use combined conditions that match actual frequency, temperature rise, and moist media.
Temperature influence involves at least three pathways: changing the rubber’s instantaneous modulus and hysteresis, altering crack growth and interfacial chemical processes, and reshaping local stresses through thermal expansion and structural constraints. Low external temperatures harden the compound, making brittle cuts more likely when crossing obstacles; prolonged high loads can cause internal temperature rises that may soften the rubber layer and accelerate fatigue. Surface temperature does not fully represent the state near the cord; there may be significant gradients within the thick rubber layer. Durability tests should be compared after thermal steady state is reached, or the heating process should be explicitly recorded, avoiding mixing thermal transition stages with material differences [71,105,140].
Moisture has a dual effect on the track. Sludge water can reduce friction and surface temperature at certain contact interfaces, but it also carries fine particles into the cut and interface, causing abrasive pump and adhesion degradation. Moisture content also alters soil cohesion and load-bearing capacity, causing different slip and pressure distributions for the same vehicle parameters. Therefore, so-called wet life cannot be simplified to a single test after sample immersion, but should also consider soil mechanical changes and material water absorption and interfacial stability. Salt, fertilizer, and pesticide residues may further affect rubber and metal surfaces, requiring media aging tailored to specific regions and crop regimes [141].
Ozone, UV, and thermal oxygen aging mostly alter materials over longer time scales, but these can promote mechanical cracks. Microcracks formed in surface tensile areas provide channels for oxygen and water, and hardening caused by aging makes crack tips harder to pass. Although there is no cyclic load during the parking phase, environmental degradation may continue, and the initial material state in the next operating season will already be different. Life evaluation should separate usage time from calendar time, and the storage temperature, humidity, and exposure conditions for seasonal equipment should be recorded. The sequence of accelerated aging and mechanical fatigue should also match actual conditions; otherwise, it is difficult to reproduce differences such as aging first followed by loading, or aging under load [142].
Environmental testing needs to evolve from single constant temperature to combined exposure, but combining does not mean combining all factors at once. Typical pathways can be established based on region and operating season, such as entering wet soil operations after low-temperature storage, or undergoing slurry cooling after high temperatures and high loads, and then comparing their differences with constant conditions. Material aging and mechanical damage may have sequential effects, so the combined paths should retain the actual sequence. Meanwhile, environmental variable measurements should be close to the track body; weather station temperature or air humidity can only describe the external environment and cannot replace the internal temperature of the rubber layer or the state of contact media.
A deeper understanding of failure in thermal and aqueous environments requires explicit treatment of chemical–mechanical coupling, rather than treating environmental degradation as a simple pre-conditioning step that reduces initial strength. At least three coupling pathways operate simultaneously in agricultural tracks. The first is thermo-mechanical coupling through hysteretic self-heating: repeated cyclic deformation converts mechanical energy into heat through viscoelastic loss, raising the internal temperature of the rubber layer by 20–60 °C above ambient under sustained high-load operation; this temperature rise reduces rubber modulus and loss tangent, which in turn alters the stress distribution at the cord–rubber interface and accelerates fatigue crack growth, creating a positive feedback loop where mechanical damage generates heat and heat accelerates mechanical damage. The second pathway is chemical–mechanical coupling through oxidative aging: elevated temperatures accelerate thermo-oxidative chain scission and crosslink modification in the rubber matrix, reducing elongation at break and increasing hardness; these chemical changes shift the local strain energy density distribution and lower the fatigue crack initiation threshold, so that a load amplitude that was safely below the threshold in the unaged material may exceed it after seasonal aging. The third pathway is aqueous–mechanical coupling through interface degradation: water and aqueous solutions containing fertilizers, pesticides, or salts diffuse through the rubber matrix and along the cord–rubber interface, hydrolyzing the brass–rubber adhesion layer and corroding the steel cord surface; the resulting loss of interfacial shear strength causes load redistribution among adjacent cords, increasing the stress concentration on remaining bonded regions and accelerating cord rupture. Crucially, mechanical loading itself accelerates these chemical processes: cyclic strain opens microcracks that provide pathways for oxygen and water penetration deep into the rubber layer and to the cord interface, while frictional heating at contact surfaces increases the local chemical reaction rates. Therefore, durability evaluation must adopt coupled test protocols that apply mechanical loading simultaneously with thermal and aqueous exposure, rather than performing sequential aging-then-fatigue tests that may miss the synergistic acceleration observed in service. The coupled approach should also measure intermediate state variables—internal temperature profile, crosslink density, interfacial residual strength, and water uptake—at multiple cycle intervals to quantify the rate at which chemical degradation alters mechanical performance and vice versa.
5.5. Durability Optimization Design Method for Rubber Tracks
Durability optimization should organize working condition statistics, material parameters, structural simulation, and experimental verification into a closed loop. Step one: obtain representative load spectra from field tasks; step two: use multi-body soil models to determine boundary loads, then use local finite elements to calculate fatigue indicators for grounding rubber, cord ends, and winding zones; step three: multi-objective optimization of rubber material, cord layout, gear train, and tension; and finally, confirm the failure location, mode, and lifespan through graded tests, rather than just comparing maximum stress. Joint finite element and experimental optimization research for rubber bearings provides cross-component references for such closed-loop design [143].
The numerical fatigue review points out that different damage tools should be used during the crack initiation and propagation stages, and methods such as CED, X-FEM, CZM, and J integral should be selected according to the calculation scale [39]. Supports wheels—tracks—soil finite element studies show that changing single-wheel structure and multi-wheel arrangement can reshape vertical stress peaks on soil surfaces, providing direct indicators for optimizing wheel diameter, track width, and contact length [24]. In high-speed durability prediction, combining steel belt edge ΔSED with material fatigue curves yields higher accuracy for most tires, but low-precision samples remind designers to verify whether the predicted failure mode matches actual conditions [101]. For agricultural tracks, the worn geometry and stiffness model can be further rewritten to repeatedly calculate load allocation throughout the life cycle.
The first step in optimization is to clarify the scenario and failure targets. If the main issue is pattern chipping in dry hard soil, the objective function should highlight surface cracks and wear; if life is controlled by desticking in the winding wheel zone, priority should be given to reducing the energy and temperature rise at the cord ends. Combining all possible indicators with equal weights can easily yield compromises lacking physical meaning. You can first use on-site failure and sensitivity analysis to identify one or two dominant modes, then set traction and derailment, soil compaction, energy consumption, and manufacturing constraints. As the design iterates, check whether risks have shifted to other modes.
Multi-level models can reduce optimization costs. The whole-machine model screens for the arrangement of the support wheels, wheel diameter, and tension range and locally compares patterns and rubber layers with ply line parameters, and the surrogate model or response surface is used to search for combinations. The proxy-model must cover the real manufacturable region and return high-fidelity model verification for high-risk candidate points. There is often interaction between parameters; for example, when wheel diameter changes curvature, the optimal cord angle and rubber layer thickness also change; single-factor optimization cannot detect this relationship. Optimization results should be presented at the Pareto front, allowing designers to see the actual costs of life, traction, and soil protection.
Validation should be returned along the same chain of evidence as the design. Material improvement is first confirmed through standardized testing; structural units are checked for hazardous positions and crack paths under combined loads; load transfer is verified with a full belt bench; and finally performance retention is confirmed during representative field tasks. If the test failure location differs from the model, mechanisms and boundaries should be prioritized for correction rather than just adjusting the life coefficient. During production, key design quantities should also be converted into measurable quality features, such as cord position, rubber penetration, vulcanization uniformity, and initial tension. Only when design, validation, and manufacturing control use the same set of key variables can the durability brought by optimization be reliably delivered to the product.
For engineering implementation, the optimization process also needs to set stopping conditions. If the slight performance differences provided by the model are less than material discretization, manufacturing errors, or measurement uncertainties, they should not be interpreted as clear superiority or inferiority. Candidate solutions can first be screened based on sensitivity and effect size and only proceed to expensive full-scale trials when expected benefits exceed uncertainty. Design reports should retain the eliminated scheme and its failure modes to avoid repeated trial and error by subsequent teams on the same path. Through this evidence-based decision-making, durability optimization no longer relies on a single optimal result but instead forms engineering knowledge that can be continuously updated with new operating conditions and new materials.
The integrated durability optimization design method described above has several scope limitations that should be acknowledged. First, the closed-loop design process assumes that representative field load spectra are available; in regions or crop systems where long-term field measurement data are scarce, the optimization must rely on synthetic or borrowed spectra, and the resulting design may be non-conservative for unmeasured extreme conditions. Second, the multi-level modeling approach (whole machine → local finite element → material test) introduces cumulative uncertainty at each coupling interface; while each level may be independently validated, the propagated uncertainty in the final life prediction can be substantial, and optimization based on such predictions should treat the predicted life as a distribution rather than a point estimate. Third, the Pareto-front multi-objective optimization framework assumes that all relevant objectives and constraints can be quantified; in practice, factors such as manufacturing feasibility, maintainability in field conditions, and farmer acceptance are difficult to encode as quantitative objectives and are often handled as post-optimization screening criteria, which may eliminate mathematically optimal but practically infeasible solutions. Fourth, the graded validation strategy (material test → segment test → full-track bench → field trial) is resource-intensive and may not be feasible for small manufacturers or early-stage design concepts; in such cases, the method should be applied with reduced validation levels, and the corresponding reduction in confidence should be explicitly stated. Finally, the optimization method is most effective for incremental improvements to existing track platforms; for radically new concepts such as actively controlled variable-tension tracks, shape-memory tread elements, or self-healing rubber systems, the material models and failure criteria embedded in the optimization framework may not yet be sufficiently mature, and foundational research on the new material or mechanism must precede formal optimization.
6. Existing Problems and Development Trends
Existing research has formed relatively mature theoretical and methodological systems in areas such as material fatigue, tire durability, and track ground mechanics, but the field of agricultural rubber tracks still lacks a complete evidence chain covering field loads, local damage, and overall machine lifespan. Future research should focus on establishing reusable load spectra, unified test protocols, updatable coupling models, and datasets that can be validated across soil conditions and machine types, thereby enhancing the comparability and engineering transferability of research results.
There is also a significant problem of object migration in this field. Many fatigue parameters come from tires, isolators, or seals, and many ground mechanics models treat tracks as uniform flexible belts; the former lack agricultural soil contact and discrete loads on the support wheels, while the latter struggles to describe cords, interfaces, and cracks. It is necessary to borrow these results, but it is necessary to specify the transferable physical quantities and immovable boundaries. Future research should standardize the definitions of sample batches, temperatures, and loading, disclose the original loads and failure sites, and conduct external validation on at least two types of soil, two types of work tasks, or two types of structures. Only in this way can improvements in model accuracy be distinguished as true generalization capability, rather than refitting a single machine.
Future research should shift from improving the accuracy of individual models to systematically constructing the chain of evidence. Currently, the agricultural tracked vehicle field is not lacking models capable of fitting specific experimental data; the main constraint on engineering applications lies in the fact that loads, material parameters, damage observations, and lifetime endpoints often come from different study subjects, making mutual verification difficult. Open data, unified definitions, and cross-model validation, although fundamental research prerequisites, directly determine the comparability and reusability of new models. Subsequent research should ensure that the key states in the model have observable bases and that laboratory conclusions are subject to independent verification under field conditions.
The priority of these problems is not the same. Without reliable field load spectra, coupled models lack inputs; without accelerated tests that maintain mechanisms, model parameters and lifetimes cannot be verified; without unified damage records, in-service predictions lack the basis for updates. Therefore, in the near term, reproducible measurement and experimental foundations should be established first, and then the coupling of models and the complexity of algorithms should gradually be improved. Research outcomes should also shift from “the prediction accuracy obtained on a specific machine” to “under which boundaries it can be transferred,” treating applicability as equally important a result as accuracy.
6.1. Characterization of Load Spectra Under Complex Agricultural Conditions
The load spectrum is the entry point for durability research and currently the weakest link. Agricultural operations have seasonality, regionality, and task diversity, and a single road or field test cannot cover the joint distribution of moisture content, soil strength, implement load, steering, and obstacle negotiation. In the future, time synchronization should be established among drive wheel torque, track tension, support wheel load, vehicle body vibration, slip rate, and temperature, and long-term data should be compressed using a small number of interpretable operating condition clusters [144].
The latest review on soil compaction regards axle load, tire inflation pressure, contact geometry, passage frequency, and soil physical state as core variables of stress propagation and proposes using sensors and predictive models to connect contact mechanics with soil bearing capacity [145]. Track contact stress models can already generate non-uniform pressure distributions using wheelset geometry and loads [26], and the straw–soil–track DEM-MBD model has also begun to account for the influence of flexible stubble on driving force [97]. The next step should be to combine these two types of models with field synchronous measurements to form standardized spectra that include normal operations, steering, turning, negotiating ridges, and road transfer and report peak values, root mean square, frequency band energy, cycle counts, and the proportion of operating conditions [146].
The standard load spectrum should not be understood as a fixed curve applicable to all regions. A more reasonable approach is to establish a parameterized family of spectra, describing tasks using soil type and moisture content, implement load, vehicle speed, slip, steering ratio, and obstacle level. Researchers can combine spectrum blocks according to the proportion of working conditions in the target area while retaining a small number of extreme events. This not only facilitates laboratory reproduction but also allows comparison of the contributions of different scenarios to damage. The released spectrum should also include sensor positions, sampling frequency, filtering, and coordinate definitions to avoid the same load having different meanings in different studies [147].
Long-term field data require automatic segmentation and quality control. Straight-line traction, steering, idle running, and obstacle traversal can be identified using torque, speed, steering signals, and implement status, and then wheel load and tension can be statistically analyzed within each type of working condition. Outliers should not be deleted indiscriminately since the impacts that actually cause failure may be statistical outliers; video, positioning, or multi-sensor consistency should be used to determine whether they are physical events or measurement errors. Load compression should be conducted while maintaining peak values, cycle distribution, and temperature accumulation, and equivalent short-term damage tests can be used to verify whether the compressed spectrum preserves the same crack locations and growth rates [148].
The load spectrum should also include uncertainties. Spatial variations in soil, driving operation, and track wear can cause variations in the load distribution for the same task; a single deterministic spectrum cannot reflect field discreteness. Quantiles or probability models can be used to describe working condition parameters, and then random simulations can obtain the load ranges in hazardous areas. The resulting life is not an isolated value but a range that changes with scenarios and confidence levels. For design verification, combinations that cover high quantiles but still have realistic occurrence probabilities can be selected, avoiding overly mild average spectra while also avoiding unrepresentative extreme overloads [149].
Load spectrum research should ultimately answer two verification questions: whether the compressed spectrum maintains the damage ranking of the original task and whether it can still be used with minor parameter adjustments in other regions or for other models. The former can be checked by comparing the original and compressed spectra of the same specimen, examining temperature rise, crack location, and life; the latter requires cross-scenario data validation. If all parameters need to be refitted every time soil is changed, the so-called standard spectrum is still just a single test record. Establishing a parameterized, transferable family of spectra is the foundational work connecting field data with laboratory accelerated verification [150].
6.2. Wear–Fatigue–Interface Multi-Failure Coupling Mechanism
Research on multiple failure couplings needs to go beyond the approach of “calculating wear life and fatigue life separately and taking the smaller value.” Wear changes tread height, contact area, and thermal boundaries; fatigue cracks change local stiffness; and interface debonding causes a redistribution of load on the cords. These state changes, in turn, alter the damage rate in the next stage. A feasible framework is to update geometry, temperature, modulus, friction coefficient, and interface stiffness per cycle block, while limiting parameter drift based on experimental observations.
Reviews of rubber wear have pointed out that models based on fatigue crack growth in micro-asperity contact regions can link energy dissipation with material removal, but environment and multi-scale roughness still introduce considerable uncertainty [47]. Rubber fatigue reviews indicate that multiaxial loads, aging, fillers, and strain crystallization can change crack thresholds and growth regions [76]. Non-monotonic temperature effects observed in thermo-mechanical seal models further demonstrate that temperature should not be treated solely as an empirical acceleration factor, but should be solved together with compression and local strain energy [74]. Agricultural track studies can build coupled models around observable state variables, for example, using wear depth to update contact, using temperature and stiffness decay to update fatigue parameters, and using interface acoustic or resistance signals to validate the debonded area.
Coupled models first need to choose a finite and measurable set of state variables. If a large number of difficult-to-calibrate damage parameters are introduced simultaneously, the model may appear formally complete but will be difficult to validate effectively. For tracks, priority can be given to wear depth, internal temperature, local stiffness or interface integrity, and representative crack length. Wear depth updates geometry and contact, temperature updates material viscoelastic parameters, stiffness or interface state reflects load redistribution, and crack length controls extension rate. The interactions among these variables are determined through staged experiments, checking for any obvious thresholds or turning points [151].
Experimental design should allow for mechanism separation and recombination. For example, first study the interaction between abrasives and fatigue under controlled temperature, then introduce self-heating; first compare surface deformation of intact interfaces and pre-made debonded interfaces, then examine changes after particles enter cracks. Such experiments do not aim to fully simulate field conditions in one pass, but rather to identify causality under controllable conditions. Finally, combined loading and full-track tests are used to check whether these relationships can collectively explain the accelerated stages. If a model can only fit individual experiments separately but cannot predict combined tests, its coupling terms still lack physical basis.
Numerical implementation can be carried out using loop blocks or event-driven updates to avoid unacceptable computational loads caused by solving each loop sequentially. Within each loop block, it is assumed that the state changes are limited; after calculating local energy and heat, wear, cracks, and interface parameters are updated. When obstacle impacts or damage thresholds occur, the step size is shortened. The model should retain energy or mass balance to prevent multiple types of damage from repeatedly accounting for the same dissipation. Evaluation of the coupling framework should not be based solely on total lifespan, but should also compare temperature rise curves, wear profiles, crack paths, and stiffness changes. Only when these intermediate states are consistent can the lifespan prediction be considered interpretable.
Coupling studies also require simplification. Not every track is equally governed by three mechanisms at all stages; field morphology and sensitivity analysis can help determine the main and secondary mechanisms. For conditions dominated by abrasive cutting, the interface can initially be treated as a later-stage boundary; for structures dominated by wheel peeling, surface wear only needs to be accounted for through thickness and temperature corrections. Selecting the minimally sufficient model according to the scenario is beneficial for parameter identification and engineering calculations. Only when the simplified model cannot explain turning points or failure migration should new coupling terms be added, to avoid the model complexity exceeding the evidential capability.
6.3. Accelerated Durability Testing and Model Validation
Accelerated tests must maintain failure mechanisms while shortening the testing time. Simply increasing load, frequency, or temperature may alter rubber self-heating, strain crystallization, and interface failure locations, causing the acceleration factors obtained from the test to be non-extrapolatable to field conditions. A tiered approach is recommended: first, determine a safe acceleration window through material and interface tests; then reproduce contact and bending at the track segment or wheel system bench scale; and finally, use a limited number of full-scale field tests to confirm load spectra and failure ordering [152,153].
New cord composite fatigue methods can identify and eliminate shear stress concentrations from wedge-shaped fixtures through finite element analysis, indicating that the clamping boundary itself can change the dominant failure mode [91]. Energy-based crack characterization can cover fatigue thresholds to critical tear energy in a relatively short time, providing a material baseline for multilevel load tests [92]. Cord laminate studies show that crack growth models that ignore interface degradation systematically overestimate pulley bending life, whereas specific interface S-N curves can improve prediction [66]. Therefore, model validation should simultaneously check crack initiation location, crack paths, temperature rise, stiffness degradation, and lifespan errors; consistency in lifespan numbers alone, without matching failure modes, should not be considered a pass [137,153].
Determining a safe acceleration window requires establishing a failure mechanism map. Using load amplitude, frequency, and temperature as coordinates, record the crack positions, fracture morphology, interface damage ratios, and self-heating states in different regions. If raising the frequency causes a significant temperature rise and shifts the damage from the rubber body to the interface, it indicates that the mechanism boundary has been crossed, and simple time-scaling extrapolation should not be used. The acceleration factor should be calibrated within the same mechanism region and verified at least at one intermediate point close to service conditions. For natural rubber, attention should also be paid to whether crystallization under high strain causes nonlinear amplitude acceleration [154].
The spatial similarity of rig loads is as important as temporal similarity. Applying average tension on tracks with a tensile machine alone cannot reproduce wheel curvature bending and bogie wheel compression-shear; using only drum cycling may also lack soil shearing and particle effects. A modular rig can separately control tension, bending, wheel pressure, slip, and temperature, which can then be combined according to the real phase. The stiffness of the loading device itself, wheel diameter, and surface material must be incorporated into the model to avoid fixture-dominated damage. During testing, force, displacement, and temperature should be monitored continuously so that the changes in load after specimen softening can be identified.
The validation strategy should include a calibration set, an internal validation set, and an external validation set. Calibration is used to identify material and interface parameters, internal validation checks the model under other conditions of the same machine type, and external validation replaces the soil, structure, or material batch to test transferability. If all data are used for parameter calibration, the resulting fitting error is not sufficient to prove the model’s predictive capability. Life errors should also be evaluated together with hazardous locations, crack orientations, and failure modes; even if the model predicts a similar number of cycles, it cannot guide optimization if it predicts surface cracking while interlayer debonding occurs in tests.
The results of accelerated tests should be traceable back to field time scales. In addition to reporting the acceleration factor, it should also specify which type of operating conditions, temperature ranges, and failure modes it is valid for, as well as the damage rules used in conversion. If the track mission consists of multiple spectrum blocks, the acceleration relationship of each block can be calibrated separately and then combined in actual sequence for verification. Although this is more complex than a single high-load test, it can identify which segment of the mission contributes most and avoid a single overall acceleration factor masking different mechanisms. For designers, this type of information is also more valuable because it can indicate specific structural or operational improvements.
6.4. Condition Monitoring and Remaining Life Prediction
The key to predicting the remaining life of tracks is to convert internal damage, which cannot be directly observed, into stable and deployable signals. Temperature and vibration are easy to collect but are greatly influenced by the environment and operating conditions; tension force, drive torque, and slip rate are more closely related to load sources; changes in stiffness, acoustic emission, or conductive wire resistance may be more sensitive to cracks and delamination. Future systems should first perform operating condition identification and then assess damage within the same type of operating conditions, avoiding misjudging normal soil variations as degradation. Acoustic emission and physically constrained networks have been used for bearing remaining life prediction, providing a methodological reference for selecting track monitoring signals [155,156].
The combination of assimilation learning and incremental crack propagation models shows that mechanistic models can generate high-density samples, while sparse experimental data are used to correct neural network bias [107]. Recent reviews on rubber fatigue summarize areas such as thermo-oxidative aging, temperature correction, machine learning, and self-healing materials, but they also reveal the problem that different samples, indicators, and data formats are difficult to merge [58]. The use of critical planes, rainflow counting, and Miner cumulative process in subframe rubber bushing studies provides an engineering example of converting multiaxial variable amplitude loads into component life [106]. Track monitoring can introduce Bayesian or assimilation updates based on this, so that each maintenance record and crack observation can adjust the remaining life and confidence interval of individual components [157,158].
Condition monitoring should select signals based on the failure chain. Drive torque and carrier roller load reflect external input, internal temperature reflects dissipation and heat transfer, track tension and vibration reflect stiffness and meshing state, while images or ultrasonic signals are closer to actual damage. A single signal rarely has both sensitivity and resistance to operating condition interference; the premise of multi-sensor fusion is knowing which part of the physical process each signal corresponds to. If the temperature is abnormal but the load has not changed, it may indicate friction or interfacial micro-slip; if vibration changes are synchronized with soil shifts, degradation should not be immediately inferred [158].
Individual baselines are more suitable for track monitoring than uniform thresholds. After new tracks are installed, temperature, vibration, and tension characteristics can be established under several standard operating conditions and then compared with long-term drift under similar conditions. Replacing carrier rollers, adjusting tension, or repairing the rubber surface will change the baseline, so the system needs to record maintenance events and recalibrate. Monitoring models should also output interpretable clues about the source of anomalies, such as which wheel position, which frequency band, or which type of operating condition contributes the most, helping maintenance personnel choose inspection locations. Providing only a health score, while convenient for display, is difficult to validate and act upon [159].
Updating remaining life requires combining new observations with the prior life distribution. Material and structural models provide the initial range of damage evolution, field loads are used to calculate individual consumption, and periodically detected cracks or stiffness changes adjust the state. Prediction intervals should narrow as effective observations increase and should proactively widen or reject predictions when operating conditions exceed the training range. Deployment assessment should not rely solely on offline playback of historical data, but also consider warning lead time, false alarm rate, missed alarm rate, and the impact on maintenance decisions. The ultimate goal is to plan reasonable inspection and replacement windows, rather than simply pursuing numerically high accuracy. Research on bearing vibration degradation features for remaining life prediction can provide a methodological reference for distinguishing track condition drift from operational fluctuations [160].
In-service prediction also needs to form a closed loop with manual inspections. After the algorithm detects an anomaly, it should suggest inspection locations and evidence, and images, crack dimensions, or disassembly results from maintenance personnel are then fed back as labels. If only whether a replacement occurred is recorded without noting the actual damage, the model will conflate preventive replacement with real failure. Inspection protocols should standardize scale, lighting, position, and defect grading, so records from different personnel are comparable. As data accumulates, the system can gradually transition from fixed thresholds to individualized risk prediction, but in stages with insufficient evidence, conservative manual review should be retained.
6.5. High-Durability Track Design for Agricultural Scenarios
High-durability rubber track design should determine goals based on specific crops, soil conditions, and operational regimes, avoiding the use of a single life indicator detached from the application scenario. For wet clay conditions, focus should be on mud-shedding performance, slip control, and interface water resistance; for dry, abrasive soil conditions, emphasis should be on cut resistance and wear resistance; for slopes and embankment-crossing scenarios, tension stability and anti-derailment capability should also be ensured. Design evaluation should comprehensively consider track life, soil compaction, traction efficiency, energy consumption, maintainability, and material sustainability [161,162].
A review of rubber composites shows that continuous cords, particulate fillers, and natural fibers provide multiple options for functional layering and sustainable reinforcement, but fatigue pathways and interface quality must be verified through cyclic testing [112]. European comparative studies indicate that tracks can reduce certain contact stresses but cannot eliminate the risk to deep soil caused by high total loads [40]; obstacle-crossing simulations also show that different chassis configurations and tension conditions perform differently under combined soil and obstacle conditions [36]. Therefore, future products should adopt scenario-based modular design: using replaceable wear layers for high-abrasion areas, optimizing cord ends and small-curvature roller zones to reduce fatigue, balancing derailment risk and peak stresses with controllable tension and wheel load distribution, and performing multi-objective verification under field task cycles [163].
Scenario-based design can start with task profiling. Tillage operations focus on low-speed high traction and high slip risk; seeding and plant protection emphasize low soil disturbance and smooth operation; the harvest season may face high loads and wet clay; road transfer highlights cycle frequency and temperature rise. Dominant damage locations and acceptable maintenance windows differ for each task. A product platform can share the skeleton and interfaces and then achieve adaptation through track compound formulation, tread pattern, local reinforcement layer design, and tension control, rather than covering all scenarios with a single structure [164,165,166].
Durability and soil protection need to be discussed within the same evaluation framework. Increasing contact area can reduce average pressure, but total load and the peak of support wheels can still cause deep compaction; stronger tread traction may increase surface shear disturbance. Design objectives should include contact pressure distribution, slip, energy consumption per unit work, and track damage, not just optimizing track lifespan. Field tests should also compare conditions completing the same agronomic task, avoiding situations where a solution superficially shows low damage by reducing operational capacity [167,168,169].
Maintainability and sustainability will affect the practical value of high-durability designs. If easily worn ground-contact layers can be replaced, the main reinforcement structure can continue to be used, but module connections must withstand repeated bending and mud and water infiltration; using natural fibers or recyclable materials can reduce environmental impact, but wet-heat and fatigue stability must be verified. Life extension should also be evaluated together with material usage, manufacturing energy consumption, and disposal. For agricultural users, reliable status indicators, available spare parts, and predictable downtime are often as important as absolute maximum lifespan.
The evaluation cycle for high-durability designs should cover an entire operating season or even multiple seasons. Short-term tests can easily highlight initial traction and break-in performance but fail to show the effects of aging, maintenance, and geometric changes after wear. A stepwise elimination approach using digital models, test benches, and limited field prototypes can concentrate long-term field resources on a few candidates. In the final evaluation, in addition to lifespan, fault detectability, maintenance time, and performance degradation curves should also be recorded. For agricultural equipment, whether a track can provide identifiable warnings before critical farming periods can sometimes reduce actual losses more than slightly extending the average lifespan [170,171].
7. Conclusions
The failure of rubber tracks under complex agricultural conditions essentially arises from non-uniform fluctuating loads generated by vehicle–soil interactions, which form multi-scale damage after modulation by the viscoelasticity of rubber, anisotropy of reinforcements, and interface conditions. Existing studies have demonstrated that: the geometry of support wheels and wheel systems determines contact peaks and bending risk zones; slip, roughness, and soil conditions control surface friction and abrasive interactions; multi-axial large deformations and crack energy dominate rubber-body fatigue; and the cord ends, interlayer shear, and temperature–frequency effects determine interface degradation. Wear, fatigue, and delamination also alter subsequent loads through geometric thinning, stiffness decay, and temperature rise and cannot be treated long-term as independent modes.
Methodologically, material tests, interface tests, finite element analysis, multibody dynamics, and data-driven prediction already provide a relatively complete methodological system. However, the application of agricultural tracks is still constrained by insufficient real load spectra, distortion in accelerated tests, poor cross-condition generalization of models, and scarce field damage data. Future research should prioritize building a synchronized field load database, transferring boundary conditions from validated multibody–soil models to local fatigue models; using hierarchical accelerated tests that preserve damage modes to calibrate wear, cracks, and interface parameters; and continuously updating individual remaining life using sensor data and mechanism-constrained learning. Only by integrating condition characterization, coupled mechanisms, structural optimization, and validation can a rubber track design method be developed that addresses different agricultural scenarios while balancing durability and soil protection.
A comprehensive analysis of existing research shows that the durability of agricultural rubber tracks cannot be explained by a single material indicator or single working condition parameter. Field tasks determine the amplitude, frequency, and sequence of loads; gear trains and track structures convert external loads into contact peaks, cyclic curvatures, and interlayer shear; material viscoelasticity and interface states further determine whether energy dissipates in the form of heat, recoverable deformation, or crack propagation. Surface wear, rubber-body fatigue, and reinforcement layer debonding may be relatively independent in the early stages, but in the middle and later stages, they accelerate through geometric thinning, temperature rise, and stiffness decay. Therefore, any service life obtained only under initial structure, constant temperature, or constant amplitude conditions must specify its applicable boundaries.
The most feasible current research approach is to establish a layered evidence chain starting from the task spectrum. Whole-machine and soil models are used to obtain wheel loads, tension, and slip; local finite elements convert these boundaries into the energy history of grounding adhesive and reinforcement layers; material and interface tests provide state-related parameters; segmental and strip tests verify hazardous locations, crack paths, and lifetimes. Data-driven methods are suitable for condition identification, parameter updates, and individual difference correction on this chain, rather than being directly substituted off from the mechanism. The model should report both intermediate states and uncertainties, allowing errors to be traced back to load, material, or damage assumptions.
For product design, durability improvement requires identifying dominant failures based on specific agricultural scenarios and making multi-objective trade-offs. Material selection should balance wear, fatigue, interface, and temperature rise; structural optimization should simultaneously consider grounding pressure, wheel curvature, tension stability, and post-failure load weight distribution; operation management should control sustained high slip, abnormal shocks, and heat accumulation. If a shareable parametric field load spectrum can be established, graded accelerated tests maintaining failure mechanisms, and life models continuously updated from in-service observations, rubber track research will gradually shift post-event explanation failures toward damage control during the design phase, providing reliable inspection and replacement basis during use.
Overall, research on the durability of agricultural rubber tracks urgently needs to establish a scale-consistent analytical framework: operating condition characterization should be able to generate load inputs for structural analysis, load analysis should be able to explain local damage, and local damage should correspond to overall equipment performance degradation and maintenance endpoints. The existing literature has provided corresponding methods for each part, but a stable and coherent validation system has not yet been formed. Future key progress will mainly rely on the unification of data and experimental boundaries, as well as the strict definition of the model’s applicable conditions. Only by closing the above evidence chain can the durability benefits of material improvements, structural optimization, and intelligent operation and maintenance be reliably compared across different agricultural scenarios.
From a methodological perspective, several specific recommendations can guide future research and engineering practice. For load spectrum characterization, researchers should adopt a standardized minimum dataset comprising synchronized measurements of drive wheel torque, track tension, road wheel load, vehicle body vibration, slip rate, and internal rubber temperature, sampled at no less than 1 kHz and reported with complete metadata on soil type, moisture content, implement type, and operation task; this will enable cross-study comparison and the construction of a shared parameterized spectrum family. For damage mechanism research, the community should move beyond single-mode life prediction toward coupled wear–fatigue–interface models that update geometry, temperature, modulus, and interface stiffness at each cycle block, with experimental validation that checks not only total life but also temperature rise curves, wear profiles, crack paths, and stiffness degradation as intermediate state variables. For accelerated durability testing, a failure-mechanism map should be established using load amplitude, frequency, and temperature as coordinates, and acceleration factors should be calibrated only within the same mechanism region, with at least one intermediate verification point close to service conditions. For remaining useful life prediction, models should output both point estimates and confidence intervals, with the intervals proactively widening when operating conditions exceed the training range; deployment evaluation should report warning lead time, false alarm rate, and missed alarm rate alongside prediction accuracy, as these metrics are more directly relevant to maintenance decision-making.
From an engineering design and optimization perspective, the following guidance is offered. Material selection should be scenario-based rather than performance-based: for wet clay conditions, prioritize interfacial water resistance and mud-shedding tread geometry; for dry abrasive soil, emphasize cut resistance and wear-resistant tread compounds; for hilly and mountainous terrain, ensure tension stability and anti-derailment capability. Structural optimization should adopt a multi-objective framework that treats track life, soil compaction, traction efficiency, energy consumption, and maintainability as parallel objectives rather than subordinating all to maximum lifespan; the Pareto front should be presented to allow designers to understand the actual trade-offs. Manufacturing consistency should be treated as a first-order durability design variable: uneven filler dispersion, insufficient cord impregnation, and curing non-uniformity in thick-walled multi-layer tracks can cause the lower-percentile life to be far below the average life measured on laboratory samples, and quality control should record mixing dispersion, Mooney viscosity, curing window, and interlayer co-curing matching as measurable quality features. Operational management should move from generic instructions to quantifiable, condition-based recommendations: control systems should restrict sustained high slip based on real-time soil strength and implement load estimates, limit continuous high-speed road transfer based on track temperature accumulation, and provide driver-facing prompts tied to specific metrics such as temperature exceedance or prolonged high-slip events rather than general advice to “reduce harsh operation.” Finally, the evaluation cycle for new track designs should cover an entire operating season or multiple seasons, recording not only lifespan but also fault detectability, maintenance time, and performance degradation curves; for agricultural users, the ability to receive identifiable warnings before critical farming periods can reduce actual losses more than a modest extension of average lifespan.
It should also be noted that, although this review focuses on agricultural rubber tracks, several methodological findings are transferable to other rubber-composite systems under cyclic loading. The evidence-chain framework of “operating condition → local load → coupled damage → service life,” the identification of wear–fatigue–interface feedback loops, and the hierarchical accelerated testing strategy are not unique to agriculture; they are equally relevant to construction machinery tracks, military tracked vehicles, conveyor belts, seismic isolation bearings, and rubber seals. In particular, the emphasis on state-dependent damage accumulation—updating geometry, temperature, and stiffness per load block—and on validating failure modes alongside life numbers addresses gaps that persist across the broader rubber fatigue and wear research community.
However, direct quantitative transfer of specific parameters—fatigue curves, wear coefficients, or interface S–N data—from agricultural tracks to other fields requires explicit re-validation. The agricultural context differs from paved-road tires or industrial tracks in at least three respects: (i) the contact medium is biologically active soil with spatially and temporally variable moisture, particle size, and straw content, rather than uniform pavement; (ii) the duty cycle is seasonal and task-specific, with long idle periods during which ozone, UV, and thermal-oxidative aging proceed without mechanical loading; and (iii) durability optimization is constrained by agronomic requirements—soil compaction, traction efficiency, and crop protection—that do not apply to construction, mining, or military equipment. Consequently, the life models, accelerated test protocols, and Pareto-optimal design solutions derived here should be treated as a structural template rather than a parameter database: researchers in adjacent fields can adopt the evidence-chain methodology and coupled-damage framework but must recalibrate load spectra, failure-mode weights, and multi-objective constraints against their own operating conditions.
Author Contributions
J.Z. conceived the project, consulted the literature and collected the data, wrote the manuscript, and prepared the figures. J.Z., Z.D., H.Z., G.L., T.J. and Z.T. revised the manuscript. All authors have read and agreed to the published version of the manuscript.
Funding
This research was funded by the Central Zhejiang Science and Technology Innovation Corridor Joint Fund of Zhejiang Provincial Natural Science Foundation of China under Grant (No. LJHSZ26E050001).
Data Availability Statement
No new datasets were generated in this study. All information analyzed in this review was derived from the publicly available literature indexed in the Web of Science Core Collection and CNKI.
Acknowledgments
The authors express their sincere gratitude for the valuable technical support and resources that contributed to this research.
Conflicts of Interest
The authors declare no conflicts of interest.
References
- Maglione, R.; Farroni, F.; Genovese, A.; Dell’Annunziata, G.N.; Timpone, F.; Sakhnevych, A. A comprehensive review on rubber wear modeling with focus on tire applications. iScience 2026, 29, 114755. [Google Scholar] [CrossRef] [Scilit]
- Mars, W.V.; Fatemi, A. A literature survey on fatigue analysis approaches for rubber. Int. J. Fatigue 2002, 24, 949–961. [Google Scholar] [CrossRef] [Scilit]
- Arvidsson, J.; Westlin, H.; Keller, T.; Gilbertsson, M. Rubber track systems for conventional tractors—Effects on soil compaction and traction. Soil Tillage Res. 2011, 117, 103–109. [Google Scholar] [CrossRef] [Scilit]
- Jin, Y.C.; Liu, J.Z.; Xu, Z.J.; Yuan, S.Q.; Li, P.P.; Wang, J.Z. Development status and trend of agricultural robot technology. Int. J. Agric. Biol. Eng. 2021, 14, 1–19. [Google Scholar] [CrossRef] [Scilit]
- Keller, T.; Trautner, A.; Arvidsson, J. Stress distribution and soil displacement under a rubber-tracked and a wheeled tractor during ploughing, both on-land and within furrows. Soil Tillage Res. 2002, 68, 39–47. [Google Scholar] [CrossRef] [Scilit]
- Rasool, S.; Raheman, H. Suitability of rubber track as traction device for power tillers. J. Terramechan. 2016, 66, 41–47. [Google Scholar] [CrossRef] [Scilit]
- Jiang, L.; Xu, B.Y.; Husnain, N.; Wang, Q. Overview of Agricultural Machinery Automation Technology for Sustainable Agriculture. Agronomy 2025, 15, 1471. [Google Scholar] [CrossRef] [Scilit]
- Li, H.B.; Chen, L.W.; Zhang, Z.Y. A Study on the Utilization Rate and Influencing Factors of Small Agricultural Machinery: Evidence from 10 Hilly and Mountainous Provinces in China. Agriculture 2023, 13, 51. [Google Scholar] [CrossRef] [Scilit]
- Servadio, P. Applications of empirical methods in central Italy for predicting field wheeled and tracked vehicle performance. Soil Tillage Res. 2010, 110, 236–242. [Google Scholar] [CrossRef] [Scilit]
- Calcante, A.; Oberti, R.; Tangorra, F.M. Definition of linear regression models to calculate the technical parameters of Italian agricultural tractors. J. Agric. Eng. 2023, 54. [Google Scholar] [CrossRef] [Scilit]
- du Plessis, H.L.M.; Yu, T. Modelling the traction of a prototype track based on soil-rubber friction and adhesion. J. Terramechan. 2006, 43, 487–504. [Google Scholar] [CrossRef] [Scilit]
- Shen, Y.; Yang, F.; Wu, J.B.; Luo, S.; Khan, Z.; Zhang, L.K.; Liu, H. Advances and Future Trends in Electrified Agricultural Machinery for Sustainable Agriculture. Agriculture 2025, 15, 2367. [Google Scholar] [CrossRef] [Scilit]
- Esch, J.H.; Bashford, L.L.; Von Bargen, K.; Ekstrom, R.E. Tractive performance comparisons between a rubber belt track and a four-wheel-drive tractor. Trans. ASAE 1990, 33, 1109–1115. [Google Scholar] [CrossRef] [Scilit]
- Gao, P.; Liu, X.T.; Xu, Z.H.; Wang, S.; Qu, M.Z.; Ma, Y.H. DEM Simulation and Experimental Investigation of Draft-Reducing Performance of Up-Cutting Subsoiling Method Inspired by Animal Digging. Agriculture 2025, 15, 2046. [Google Scholar] [CrossRef] [Scilit]
- Ahmad, F.; Qiu, B.J.; Ding, Q.S.; Ding, W.M.; Khan, Z.M.; Shoaib, M.; Chandio, F.A.; Rehim, A.; Khaliq, A. Discrete element method simulation of disc type furrow openers in paddy soil. Int. J. Agric. Biol. Eng. 2020, 13, 103–110. [Google Scholar] [CrossRef] [Scilit]
- Kar, M.K. Prediction of track forces in skid-steering of military tracked vehicles. J. Terramechan. 1987, 24, 75–84. [Google Scholar] [CrossRef] [Scilit]
- Ma, Z.-D.; Perkins, N.C. A Track-Wheel-Terrain Interaction Model for Dynamic Simulation of Tracked Vehicles. Veh. Syst. Dyn. 2002, 37, 401–421. [Google Scholar] [CrossRef] [Scilit]
- Liu, Y.B.; Li, Y.M.; Ji, K.Z.; Yu, Z.W.; Ma, Z.; Xu, L.Z.; Niu, C.H. Development of a hydraulic variable-diameter threshing drum control system for combine harvester part II: Controller design and field performance. Biosyst. Eng. 2025, 254, 104160. [Google Scholar] [CrossRef] [Scilit]
- Lu, D.P.; Wang, W.; Li, Y.Y.; Ou, M.X.; Ma, J.T.; Bao, E.C.; Meng, H.W. Design and Experiment of Self-Propelled High-Stem Chrysanthemum coronarium Orderly Harvester. Agriculture 2025, 15, 1848. [Google Scholar] [CrossRef] [Scilit]
- Han, J.Y.; Liu, C.H. Research on a Method to Measure and Calculate Tillage Resistance of Tractor Mounted Plough. Ama-Agric. Mech. Asia Afr. Lat. Am. 2018, 49, 67–73. (In Chinese) [Google Scholar]
- Li, H.; Xu, L.Z. Research on Key Technologies of Planting Machinery and Combine Harvester. Agronomy 2022, 12, 3177. [Google Scholar] [CrossRef] [Scilit]
- Li, J.Y.; Wu, Z.Z.; Li, M.Q.; Shang, Z.J. Dynamic Measurement Method for Steering Wheel Angle of Autonomous Agricultural Vehicles. Agriculture 2024, 14, 1602. [Google Scholar] [CrossRef] [Scilit]
- Riehm, P.; Unrau, H.J.; Gauterin, F. A model based method to determine rubber friction data based on rubber sample measurements. Tribol. Int. 2018, 127, 37–46. [Google Scholar] [CrossRef] [Scilit]
- Guan, Z.H.; Li, H.T.; Jiang, T.; Xing, L.C.; Zhang, M.; Jiang, D.; Jin, M. Effect of rubber-tracked chassis roller on soil surface vertical stress distribution based on finite element method. J. Terramechan. 2025, 120, 101080. [Google Scholar] [CrossRef] [Scilit]
- Pessina, D.; Facchinetti, D.; Bonalume, V. Evaluation of the efficiency of systems to reduce vibration on modern tracklaying tractors. J. Agric. Eng. 2012, 43, 43–47. [Google Scholar] [CrossRef] [Scilit][Green Version]
- Keller, T.; Arvidsson, J. A model for prediction of vertical stress distribution near the soil surface below rubber-tracked undercarriage systems fitted on agricultural vehicles. Soil Tillage Res. 2016, 155, 116–123. [Google Scholar] [CrossRef] [Scilit]
- Coneo, R.J.C.; de Araujo, W.L.; Garcia, A.P.; de Paula, M.V.; dos Santos, A.A. Rubber-tracked crawler undercarriage multibody dynamic simulation for agriculture operation. Sci. Rep. 2025, 15, 24829. [Google Scholar] [CrossRef] [Scilit]
- Eiamnipon, N.; Nimdum, P.; Renard, J.; Kolitawong, C. Experimental investigation on high strain rate tensile behaviors of steel cord-rubber composite. Compos. Struct. 2013, 99, 1–7. [Google Scholar] [CrossRef] [Scilit]
- Rabbani, M.A.; Tsujimoto, T.; Mitsuoka, M.; Inoue, E.; Okayasu, T. Prediction of the vibration characteristics of half-track tractor considering a three-dimensional dynamic model. Biosyst. Eng. 2011, 110, 178–188. [Google Scholar] [CrossRef] [Scilit]
- Rabbani, M.A.; Takeoka, S.; Mitsuoka, M.; Inoue, E.; Fukushima, T.; Okayasu, T. Simulation for Vertical Dynamic Loading Forces on Track Rollers of the Half-tracked Tractor Based on Nonlinear Voigt’s Model. Eng. Agric. Environ. Food 2010, 3, 119–126. [Google Scholar] [CrossRef] [Scilit]
- Nabagło, T.; Jurkiewicz, A.; Apostoł, M.; Micek, P. Construction and Simulation of a 2S1 Tracked Vehicle Model and its Verification Using Vertical Forces on the Road Wheels while Overcoming a Single Obstacle. Solid State Phenom. 2011, 177, 168–176. [Google Scholar] [CrossRef] [Scilit]
- Liu, W.W.; Cheng, K.; Wang, J. Failure analysis of the rubber track of a tracked transporter. Adv. Mech. Eng. 2018, 10, 1687814018789526. [Google Scholar] [CrossRef] [Scilit]
- Fedorko, G.; Molnár, V.; Živčák, J.; Dovica, M.; Husáková, N. Failure analysis of textile rubber conveyor belt damaged by dynamic wear. Eng. Fail. Anal. 2013, 28, 103–114. [Google Scholar] [CrossRef] [Scilit]
- Hafeez, M.A.; Farooq, A.; Deen, K.M. Analyzing the Premature Failure of Rubber Bands in Excavator Track Chains. J. Fail. Anal. Prev. 2024, 24, 179–189. [Google Scholar] [CrossRef] [Scilit]
- Rybak, P.; Hryciow, Z.; Michalowski, B.; Wisniewski, A. Assessment of the Impact of Wear and Tear of Rubber Elements in Tracked Mechanism on the Dynamic Loads of High-Speed Tracked Vehicles. Acta Mech. Autom. 2023, 17, 85–94. [Google Scholar] [CrossRef] [Scilit]
- Szpaczynska, D.; Lopatka, M.; Krogul, P. The running gear construction impact on overcoming obstacles by light high-mobility tracked UGV. J. Terramechan. 2024, 112, 1–17. [Google Scholar] [CrossRef] [Scilit]
- Fukahori, Y.; Yamazaki, H. Mechanism of rubber abrasion. Part I: Abrasion pattern formation in natural rubber vulcanizate. Wear 1994, 171, 195–202. [Google Scholar] [CrossRef] [Scilit]
- Fujikawa, T.; Yamazaki, S.; Uchiyama, Y. Tire Wear Caused by Mild Tread Slip. Rubber Chem. Technol. 1997, 70, 572–583. [Google Scholar] [CrossRef] [Scilit]
- Mujdeci, A.; Rodriguez, V.M.; Maqbool, H.; Amadeo, A.; Grasso, M. Advances in numerical modelling of tyre fatigue performance: A review. J. Mater. Sci. Mater. Eng. 2025, 20, 105. [Google Scholar] [CrossRef] [Scilit]
- Lamandé, M.; Greve, M.H.; Schjonning, P. Risk assessment of soil compaction in Europe—Rubber tracks or wheels on machinery. Catena 2018, 167, 353–362. [Google Scholar] [CrossRef] [Scilit]
- Marsili, A.; Servadio, P. Compaction effects of rubber or metal-tracked tractor passes on agricultural soils. Soil Tillage Res. 1996, 37, 37–45. [Google Scholar] [CrossRef] [Scilit]
- Lang, A.; Klüppel, M. Influences of temperature and load on the dry friction behaviour of tire tread compounds in contact with rough granite. Wear 2017, 380–381, 15–25. [Google Scholar] [CrossRef] [Scilit]
- Liu, X.; Shangguan, W.-B.; Zhao, X. Residual fatigue life prediction of natural rubber components under variable amplitude loads. Int. J. Fatigue 2022, 165, 107199. [Google Scholar] [CrossRef] [Scilit]
- Fukahori, Y.; Liang, H.; Busfield, J.J.C. Criteria for crack initiation during rubber abrasion. Wear 2008, 265, 387–395. [Google Scholar] [CrossRef] [Scilit]
- Mokhtari, M.; Schipper, D.J. Existence of a tribo-modified surface layer of BR/S-SBR elastomers reinforced with silica or carbon black. Tribol. Int. 2016, 96, 382–388. [Google Scholar] [CrossRef] [Scilit]
- Heinrich, G.; Klüppel, M. Rubber friction, tread deformation and tire traction. Wear 2008, 265, 1052–1060. [Google Scholar] [CrossRef] [Scilit]
- Xu, R.; Sheng, W.; Zhou, F.; Persson, B.N.J. Rubber Wear: History, Mechanisms, and Perspectives. Tribol. Lett. 2025, 73, 90. [Google Scholar] [CrossRef] [Scilit]
- Pinnington, R.J. Rubber friction on rough and smooth surfaces. Wear 2009, 267, 1653–1664. [Google Scholar] [CrossRef] [Scilit]
- Olejniczak, K.; Napiórkowski, J. Wear Analysis of Materials Used for a Track Steering System in Abrasive Soil Mass. Materials 2021, 14, 6164. [Google Scholar] [CrossRef] [Scilit]
- Roberts, A.D.; Thomas, A.G. The adhesion and friction of smooth rubber surfaces. Wear 1975, 33, 45–64. [Google Scholar] [CrossRef] [Scilit]
- Goda, T.J. Effect of track roughness generated micro-hysteresis on rubber friction in case of (apparently) smooth surfaces. Tribol. Int. 2016, 93, 142–150. [Google Scholar] [CrossRef] [Scilit]
- Li, Z.; Li, Z.; Wang, Y. An Integrated Approach for Friction and Wear Simulation of Tire Tread Rubber. Part I: Friction Test, Characterization, and Modeling. Tire Sci. Technol. 2019, 48, 123–145. [Google Scholar] [CrossRef] [Scilit]
- Mars, W. Multiaxial Fatigue Crack Initiation in Rubber. Tire Sci. Technol. 2001, 29, 171–185. [Google Scholar] [CrossRef] [Scilit]
- Schubel, P.M.; Gdoutos, E.E.; Daniel, I.M. Fatigue characterization of tire rubber. Theor. Appl. Fract. Mech. 2004, 42, 149–154. [Google Scholar] [CrossRef] [Scilit]
- Saintier, N.; Cailletaud, G.; Piques, R. Multiaxial fatigue life prediction for a natural rubber. Int. J. Fatigue 2006, 28, 530–539. [Google Scholar] [CrossRef] [Scilit]
- Saintier, N.; Cailletaud, G.; Piques, R. Crack initiation and propagation under multiaxial fatigue in a natural rubber. Int. J. Fatigue 2006, 28, 61–72. [Google Scholar] [CrossRef] [Scilit]
- Mars, W.; Fatemi, A. The Correlation of Fatigue Crack Growth Rates in Rubber Subjected to Multiaxial Loading Using Continuum Mechanical Parameters. Rubber Chem. Technol. 2007, 80, 169–182. [Google Scholar] [CrossRef] [Scilit]
- Wang, X.; Sedaghati, R.; Rakheja, S.; Shangguan, W. Rubber Fatigue Revisited: A State-of-the-Art Review Expanding on Prior Works by Tee, Mars and Fatemi. Polymers 2025, 17, 918. [Google Scholar] [CrossRef] [Scilit]
- Okui, M.; Kojima, A.; Hisamichi, I.; Kuriyama, S.; Kojima, T.; Tsuji, T.; Nakamura, T. Prolonging rubber fatigue life using hysteresis of strain-induced crystallization of natural rubber. Polym. Test. 2023, 117, 107800. [Google Scholar] [CrossRef] [Scilit]
- Rong, J.; Yang, J.; Huang, Y.; Luo, W.; Hu, X. Characteristic Tearing Energy and Fatigue Crack Propagation of Filled Natural Rubber. Polymers 2021, 13, 3891. [Google Scholar] [CrossRef] [Scilit]
- Pidaparti, R.M.V.; May, A.W. Micromechanical analysis of fatigue cracks in cord–rubber composites. Compos. Struct. 2001, 54, 459–465. [Google Scholar] [CrossRef] [Scilit]
- Stevenson, A. Fatigue Crack Growth in High Load Capacity Rubber Laminates. Rubber Chem. Technol. 1986, 59, 208–222. [Google Scholar] [CrossRef] [Scilit]
- Tian, Z.; Tan, H.F.; Du, X. Fatigue Damage Accumulation of Steel/rubber Composite. J. Mater. Sci. Technol. 2006, 22, 647–650. [Google Scholar]
- Rao, S.; Daniel, I.M.; McFarlane, D. Fatigue and Fracture Behavior of a Steel Cord/Rubber Composite. J. Thermoplast. Compos. Mater. 2001, 14, 213–224. [Google Scholar] [CrossRef] [Scilit]
- Shi, X.; Ma, M.; Lian, C.; Zhu, D. Investigation on effects of dynamic fatigue frequency, temperature and number of cycles on the adhesion of rubber to steel cord by a new testing technique. Polym. Test. 2013, 32, 1145–1153. [Google Scholar] [CrossRef] [Scilit]
- Luo, G.F.; Guo, J.L.; Zhang, C.; Yang, X.N. Life prediction of cord/rubber laminates under multiaxial fatigue. Int. J. Fatigue 2023, 174, 107733. [Google Scholar] [CrossRef] [Scilit]
- Bonneric, M.; Aubin, V.; Durville, D. Finite element simulation of a steel cable-rubber composite under bending loading: Influence of rubber penetration on the stress distribution in wires. Int. J. Solids Struct. 2019, 160, 158–167. [Google Scholar] [CrossRef] [Scilit]
- Langevin, P.P.; Payne, R.J.; Shephard, C.S. A Dynamic Rubber-Cord Composite Adhesion and Fatigue Test. Rubber Chem. Technol. 1974, 47, 171–187. [Google Scholar] [CrossRef] [Scilit]
- Fulton, W.S. Steel Tire Cord-Rubber Adhesion, Including the Contribution of Cobalt. Rubber Chem. Technol. 2005, 78, 426–457. [Google Scholar] [CrossRef] [Scilit]
- Song, J.; Costanzo, F.; Lee, B. Fatigue of Cord-Rubber Composites: V. Cord Reinforcement Effect. Rubber Chem. Technol. 2004, 77, 593–610. [Google Scholar] [CrossRef] [Scilit]
- Jha, N.K.; Nackenhorst, U. Fatigue life prediction of cord–rubber composite structures based on progressive damage analysis. Eng. Comput. 2018, 35, 2215–2233. [Google Scholar] [CrossRef] [Scilit]
- Jamshidi, A.; Afshar, F.; Mohammadi, N.; Pourmahdian, S. Study on cord/rubber interface at elevated temperatures by H-pull test method. Appl. Surf. Sci. 2005, 249, 208–215. [Google Scholar] [CrossRef] [Scilit]
- Leroy, J.E.; Ciavarella, M. Temperature Gradients in Tire Rubber Can Reduce/Increase Tensile Stresses and Hence Wear and Fatigue. Lubricants 2025, 13, 294. [Google Scholar] [CrossRef] [Scilit]
- Xu, J.; Ma, T.Y.; Ding, X.X.; Liu, X.J.; Zhang, Z.B. Thermo-mechanical coupling and strain energy-driven fatigue crack initiation in reciprocating rubber seals. J. Elastomers Plast. 2026. [Google Scholar] [CrossRef] [Scilit]
- Luo, W.; Huang, Y.; Yin, B.; Jiang, X.; Hu, X. Fatigue Life Assessment of Filled Rubber by Hysteresis Induced Self-Heating Temperature. Polymers 2020, 12, 846. [Google Scholar] [CrossRef] [Scilit]
- Tee, Y.L.; Loo, M.S.; Andriyana, A. Recent advances on fatigue of rubber after the literature survey by Mars and Fatemi in 2002 and 2004. Int. J. Fatigue 2018, 110, 115–129. [Google Scholar] [CrossRef] [Scilit]
- Abdelmoniem, M.; Yagimli, B. Self-heating in rubber components: Experimental studies and numerical analysis. J. Rubber Res. 2024, 28, 71–85. [Google Scholar] [CrossRef] [Scilit]
- Gyung Soo, J.; Min Hyeon, H.; Seo, G. Enhancing adhesion properties between rubber compound and brass-plated steel cord by incorporating silica into rubber. J. Adhes. Sci. Technol. 1999, 13, 153–168. [Google Scholar] [CrossRef] [Scilit]
- Zhang, R.X.; Zhu, H.T.; Chang, Q.L.; Mao, Q.R. A Comprehensive Review of Digital Twins Technology in Agriculture. Agriculture 2025, 15, 903. [Google Scholar] [CrossRef] [Scilit]
- Zhao, J.M.Y.; Fan, S.X.; Zhang, B.H.; Wang, A.C.; Zhang, L.Y.; Zhu, Q.Z. Research Status and Development Trends of Deep Reinforcement Learning in the Intelligent Transformation of Agricultural Machinery. Agriculture 2025, 15, 1223. [Google Scholar] [CrossRef] [Scilit]
- Taha, M.F.; Mao, H.P.; Zhang, Z.; Elmasry, G.; Awad, M.A.; Abdalla, A.; Mousa, S.; Elwakeel, A.E.; Elsherbiny, O. Emerging Technologies for Precision Crop Management Towards Agriculture 5.0: A Comprehensive Overview. Agriculture 2025, 15, 582. [Google Scholar] [CrossRef] [Scilit]
- Chen, Z.J.; Yin, J.J.; Farhan, S.M.; Liu, L.; Zhang, D.; Zhou, M.L.; Cheng, J.H. A comprehensive review of obstacle avoidance for autonomous agricultural machinery in multi-ope rational environment. Artif. Intell. Agric. 2026, 16, 139–163. [Google Scholar] [CrossRef] [Scilit]
- Ma, Z.; Wang, X.Z.; Chen, X.G.; Hu, B.; Li, J.B. Advances in Crop Row Detection for Agricultural Robots: Methods, Performance Indicators, and Scene Adaptability. Agriculture 2025, 15, 2151. [Google Scholar] [CrossRef] [Scilit]
- Syed, T.N.; Zhou, J.; Lakhiar, I.A.; Marinello, F.; Gemechu, T.T.; Rottok, L.T.; Jiang, Z.Z. Enhancing Autonomous Orchard Navigation: A Real-Time Convolutional Neural Network-Based Obstacle Classification System for Distinguishing ‘Real’ and ‘Fake’ Obstacles in Agricultural Robotics. Agriculture 2025, 15, 827. [Google Scholar] [CrossRef] [Scilit]
- Wang, J.Z.; Gao, Z.H.; Zhang, Y.; Zhou, J.; Wu, J.Z.; Li, P.P. Real-Time Detection and Location of Potted Flowers Based on a ZED Camera and a YOLO V4-Tiny Deep Learning Algorithm. Horticulturae 2022, 8, 21. [Google Scholar] [CrossRef] [Scilit]
- Zhang, C.; Zhou, J.A.; Yan, H.F.; Akhlaq, M.; Ni, Y.X.; Xue, R.; Li, J. Effects of different irrigation amounts and biochar application on soil physical and mechanical properties in the short term. Irrig. Drain. 2024, 73, 866–881. [Google Scholar] [CrossRef] [Scilit]
- Xin, M.J.; Ding, W.R.; Chen, D.; Zhang, M.; Ao, Y.J.; Chi, B.W.; Jiang, Z.W.; Song, Y.Q.; Guo, Y.L. Design and Experiment of Air-Fertilizer Separator for Pneumatic Deep Fertilization in Paddy Fields. Agriculture 2025, 15, 1991. [Google Scholar] [CrossRef] [Scilit]
- Zhu, Z.; Zeng, L.X.; Chen, L.; Zou, R.; Cai, Y.F. Fuzzy Adaptive Energy Management Strategy for a Hybrid Agricultural Tractor Equipped with HMCVT. Agriculture 2022, 12, 1986. [Google Scholar] [CrossRef] [Scilit]
- Jia, W.D.; Zhang, Z.L.; Dong, X.; Ou, M.X.; Gao, R.H.; Wang, Y.F.; Yang, Q.Z.; Wang, X.W. Quantification and Optimization of Straight-Line Attitude Control for Orchard Weeding Robots Using Adaptive Pure Pursuit. Agriculture 2025, 15, 2085. [Google Scholar] [CrossRef] [Scilit]
- Torggler, J.; Leitner, M.; Buzzi, C.; Faethe, T.; Müller, H.; Machado Charry, E. Fatigue Behavior of Cord-Rubber Composite Materials under Different Loading Conditions. Materials 2024, 17, 4771. [Google Scholar] [CrossRef] [Scilit]
- Tao, Y.; Windslow, R.; Stevens, C.A.; Bilotti, E.; Peijs, T.; Busfield, J.J.C. Development of a novel fatigue test method for cord-rubber composites. Polym. Test. 2018, 71, 238–247. [Google Scholar] [CrossRef] [Scilit]
- Stocek, R.; Stenicka, M.; Zádrapa, P. Future trends in predicting the complex fracture behaviour of rubber materials. Contin. Mech. Thermodyn. 2021, 33, 291–305. [Google Scholar] [CrossRef] [Scilit]
- Ghosh, P.; Mukhopadhyay, R.; Krishna Kumar, R. Influence of Waveforms on Fatigue Crack Growth Characteristics of Tire Tread Rubber using Finite Element Analysis. Tire Sci. Technol. 2020, 49, 206–223. [Google Scholar] [CrossRef] [Scilit]
- Ansorge, D.; Godwin, R.J. The effect of tyres and a rubber track at high axle loads on soil compaction, Part 1: Single axle-studies. Biosyst. Eng. 2007, 98, 115–126. [Google Scholar] [CrossRef] [Scilit]
- Qiu, X.; Yin, H.; Xing, Q. Research Progress on Fatigue Life of Rubber Materials. Polymers 2022, 14, 4592. [Google Scholar] [CrossRef] [Scilit]
- Wu, J.; Shen, Y.; Yang, S.; Feng, Z. Simulation of Track-Soft Soil Interactions Using a Discrete Element Method. Appl. Sci. 2022, 12, 2524. [Google Scholar] [CrossRef] [Scilit]
- Xie, D.B.; He, J.X.; Liu, T.; Liu, C.; Zhao, G.; Chen, L.Q. Establishment and validation the DEM-MBD coupling model of flexible straw-Shajiang black soil-walking mechanism interactions. Comput. Electron. Agric. 2024, 224, 109203. [Google Scholar] [CrossRef] [Scilit]
- Ma, Z.-D.; Perkins, N.C. A Super-Element of Track-Wheel-Terrain Interaction for Dynamic Simulation of Tracked Vehicles. Multibody Syst. Dyn. 2006, 15, 347–368. [Google Scholar] [CrossRef] [Scilit]
- Zhou, L.; Gao, J.; Hu, C.; Li, Q. Numerical simulation and testing verification of the interaction between track and sandy ground based on discrete element method. J. Terramechan. 2021, 95, 73–88. [Google Scholar] [CrossRef] [Scilit]
- Chen, P.S.; Wu, Z.H.; Shi, Z.C.; Li, Z.R.; Wang, Y. A novel method for obtaining fatigue parameters of rubber materials considering the crack path deviation. Eng. Fract. Mech. 2025, 328, 111517. [Google Scholar] [CrossRef] [Scilit]
- Kim, S.; Park, H.; Moon, B.; Sung, K.; Koo, J.M.; Seok, C.S. The prediction methodology for tire’s high speed durability regulation test using a finite element method. Int. J. Fatigue 2019, 118, 77–86. [Google Scholar] [CrossRef] [Scilit]
- Dudley, E.A.; Bauer, R.; Reilly, P.M. Prediction of Tire Tread Wear Rate and Tread Wear Rate Differences. Tire Sci. Technol. 1979, 7, 43–57. [Google Scholar] [CrossRef] [Scilit]
- Knisley, S. A Correlation Between Rolling Tire Contact Friction Energy and Indoor Tread Wear. Tire Sci. Technol. 2002, 30, 83–99. [Google Scholar] [CrossRef] [Scilit]
- Harbour, R.; Fatemi, A.; Mars, W. Fatigue crack growth of filled rubber under constant and variable amplitude loading conditions. Fatigue Fract. Eng. Mater. Struct. 2007, 30, 640–652. [Google Scholar] [CrossRef] [Scilit]
- Liu, Q.; Shi, W.; Chen, Z. Fatigue life prediction for vibration isolation rubber based on parameter-optimized support vector machine model. Fatigue Fract. Eng. Mater. Struct. 2018, 42, 710–718. [Google Scholar] [CrossRef] [Scilit]
- Zarrin-ghalami, T.; Fatemi, A. Fatigue life predictions of rubber components: Applications to an automobile cradle mount. Proc. Inst. Mech. Eng. Part D-J. Automob. Eng. 2013, 227, 691–703. [Google Scholar] [CrossRef] [Scilit]
- Fang, C.Z.; Chen, Y.F.; Yang, Z.H.; Zhang, Y.Y.; He, X.D. Prediction of Rubber Fatigue Life Using an Assimilation-based Learning Approach and Incremental Crack Propagation Model. Fatigue Fract. Eng. Mater. Struct. 2025, 48, 312–323. [Google Scholar] [CrossRef] [Scilit]
- Zhang, G.; Liang, W.; She, B.; Tian, F. Rotating Machinery Remaining Useful Life Prediction Scheme Using Deep-Learning-Based Health Indicator and a New RVM. Shock Vib. 2021, 2021, 8815241. [Google Scholar] [CrossRef] [Scilit]
- Luo, R.K. Shear modulus-based prediction of the fatigue life of antivibration rubber components. Int. J. Fatigue 2022, 162, 107010. [Google Scholar] [CrossRef] [Scilit]
- Albouy, P.-A.; Sotta, P. Strain-Induced Crystallization in Natural Rubber. In Polymer Crystallization II: From Chain Microstructure to Processing; Auriemma, F., Alfonso, G.C., de Rosa, C., Eds.; Springer International Publishing: Cham, Switzerland, 2017; pp. 167–205. [Google Scholar]
- Jia, Y.Y.; Zhao, Y.H.; Yan, C.Q.; Wang, G.F.; Xu, Z.H.; He, Q. Effects of Alumina Doping on Mechanical and Tribological Properties of Nitrile Butadiene Rubber. Fibers Polym. 2021, 22, 3106–3119. [Google Scholar] [CrossRef] [Scilit]
- Głowacka, K.; Klemenc, J.; Nagode, M.; Łagoda, T. Fatigue lifetime of rubber composites—State-of-the-art. Polym. Test. 2025, 143, 108713. [Google Scholar] [CrossRef] [Scilit]
- Sakai, H. Friction and Wear of Tire Tread Rubber. Tire Sci. Technol. 1996, 24, 252–275. [Google Scholar] [CrossRef] [Scilit]
- Tunnicliffe, L. Fatigue crack growth behavor of carbon black–reinforced natural rubber. Rubber Chem. Technol. 2021, 94, 79935. [Google Scholar] [CrossRef] [Scilit]
- Winkler, E.M.; de Jong, M.C. Finite-Element Calculations on the Stress of an Aramid Cord in a Clamped and Elongated Goodrich Block Fatigue Specimen. Rubber Chem. Technol. 1990, 63, 223–233. [Google Scholar] [CrossRef] [Scilit]
- Liu, J.; Xia, C.; Jiang, D.; Sun, Y. Development and testing of the power transmission system of a crawler electric tractor for greenhouses. Appl. Eng. Agric. 2020, 36, 797–805. [Google Scholar] [CrossRef] [Scilit]
- Sheludchenko, B.; Sarauskis, E.; Kukharets, S.; Zabrodskyi, A. Graphic analytical optimization of design and operating parameters of tires for drive wheels of agricultural machinery. Soil Tillage Res. 2022, 215, 105227. [Google Scholar] [CrossRef] [Scilit]
- Chen, Y.X.; Chen, L.; Wang, R.C.; Xu, X.; Shen, Y.J.; Liu, Y.L. Modeling and test on height adjustment system of electrically-controlled air suspension for agricultural vehicles. Int. J. Agric. Biol. Eng. 2016, 9, 40–47. [Google Scholar] [CrossRef]
- Morozov, A.V.; Bukovskiy, P.O. Method of Constructing a 3D Friction Map for a Rubber Tire Tread Sliding Over a Rough Surface. J. Frict. Wear 2018, 39, 129–136. [Google Scholar] [CrossRef] [Scilit]
- Ko, S.; Choi, H.; Son, W.; Kang, S. Studies on Adhesion Properties between Zinc-Coated Steel Cord and Adhesion Promoter-Containing Rubber Compound. Adhes. Interface 2014, 15, 49–56. [Google Scholar] [CrossRef] [Scilit][Green Version]
- Beibei, F.; Naixing, L. Dynamic Simulation Analysis of Track Tension and the Influencing Factors of Deep-Sea Tracked Mining Vehicle. Shock Vib. 2022, 2022, 9930763. [Google Scholar] [CrossRef] [Scilit]
- Benoit, O.; Gotteland, P.; Quibel, A. Prediction of trafficability for tracked vehicle on broken soil: Real size tests. J. Terramechan. 2003, 40, 135–160. [Google Scholar] [CrossRef] [Scilit]
- Wang, A.Z.; Ji, X.; Song, Q.; Wei, X.H.; Chen, W.M.; Wang, K. Path Tracking Controller and System Design for Agricultural Tractors Based on Improved Stanley and Sliding Mode Algorithms Considering Sideslip Compensation. Agronomy 2025, 15, 2329. [Google Scholar] [CrossRef] [Scilit]
- Lu, E.; Xue, J.L.; Chen, T.T.; Jiang, S. Robust Trajectory Tracking Control of an Autonomous Tractor-Trailer Considering Model Parameter Uncertainties and Disturbances. Agriculture 2023, 13, 869. [Google Scholar] [CrossRef] [Scilit]
- Zhou, L.; Gao, J.; Cheng, P.; Hu, C. Study on track–soil traction using discrete element method simulation and soil bin test. AIP Adv. 2020, 10, 75307. [Google Scholar] [CrossRef] [Scilit]
- Sun, J.L.; Wang, Z.; Ding, S.H.; Xia, J.; Xing, G.Y. Adaptive disturbance observer-based fixed time nonsingular terminal sliding mode control for path-tracking of unmanned agricultural tractors. Biosyst. Eng. 2024, 246, 96–109. [Google Scholar] [CrossRef] [Scilit]
- Chen, D.; Wu, J.; Wang, Y.; Su, B.; Liu, Y. High-speed tribology behaviors of aircraft tire tread rubber in contact with pavement. Wear 2021, 486–487, 204071. [Google Scholar] [CrossRef] [Scilit]
- Zhu, L.W.; Sun, W.M.; Zhang, Q.; Lu, E.; Xue, J.L.; Sha, G.H. Tractor Path Tracking Control Method Based on Prescribed Performance and Sliding Mode Control. Agriculture 2025, 15, 1663. [Google Scholar] [CrossRef] [Scilit]
- Li, S.H.; Dai, B.J.; Huang, Z.Z.; Sun, J.L.; Ma, L. Generalized Extended-State Observer-Based Switched Sliding Mode for Path-Tracking Control of Unmanned Agricultural Tractors with Prescribed Performance. Agriculture 2026, 16, 490. [Google Scholar] [CrossRef] [Scilit]
- Jiang, Q.J.; Shen, Y.; Liu, H.; Khan, Z.; Sun, H.; Huang, Y.X. A Hybrid Path Planning Algorithm for Orchard Robots Based on an Improved D* Lite Algorithm. Agriculture 2025, 15, 1698. [Google Scholar] [CrossRef] [Scilit]
- Song, Q.; Shi, J.H.; Li, X.B.; Du, D.D.; Wang, A.Z.; Cui, X.Y.; Wei, X.H. Path Tracking Control of Rice Transplanter Based on Fuzzy Sliding Mode and Extended Line-of-Sight Guidance Method. Agronomy 2026, 16, 215. [Google Scholar] [CrossRef] [Scilit]
- Liu, W.; Zhou, J.H.; Liu, Y.T.; Zhang, T.F.; Yan, M.; Chen, J.; Zhou, C.J.; Hu, J.P.; Chen, X.X. An Ultrasonic Ridge-Tracking Method Based on Limiter Sliding Window Filter and Fuzzy Pure Pursuit Control for Ridge Transplanter. Agriculture 2024, 14, 1713. [Google Scholar] [CrossRef] [Scilit]
- Yu, Y.; Hao, S.H.; Guo, S.B.; Tang, Z.; Chen, S.R. Motor Torque Distribution Strategy for Different Tillage Modes of Agricultural Electric Tractors. Agriculture 2022, 12, 1373. [Google Scholar] [CrossRef] [Scilit]
- Sun, C.H.; Sun, J.L.; Ding, S.H.; Li, Q.S.; Ma, L. Path Tracking Control in Autonomous Agricultural Vehicles: A Systematic Survey of Models, Methods, and Challenges. Agriculture 2025, 15, 2522. [Google Scholar] [CrossRef] [Scilit]
- Wei, J.; Zhao, Z.; Lu, E.; Liu, S.S.; Hu, X.Y.; Zhou, Q.Q.; Xu, C. Adaptive backstepping tracking control for differential drive vehicles under longitudinal slipping conditions. Biosyst. Eng. 2026, 261, 104339. [Google Scholar] [CrossRef] [Scilit]
- Lu, E.; Ma, Z.; Li, Y.M.; Xu, L.Z.; Tang, Z. Adaptive backstepping control of tracked robot running trajectory based on real-time slip parameter estimation. Int. J. Agric. Biol. Eng. 2020, 13, 178–187. [Google Scholar] [CrossRef] [Scilit]
- Zhang, S.C.; Liu, Q.S.; Xu, H.H.; Yang, Z.; Hu, X.Y.; Song, Q.; Wei, X.H. Path Tracking Control of a Large Rear-Wheel-Steered Combine Harvester Using Feedforward PID and Look-Ahead Ackermann Algorithms. Agriculture 2025, 15, 676. [Google Scholar] [CrossRef] [Scilit]
- Shen, Y.Y.; Shen, Y.; Zhang, Y.F.; Huo, C.W.; Shen, Z.F.; Su, W.; Liu, H. Research Progress on Path Planning and Tracking Control Methods for Orchard Mobile Robots in Complex Scenarios. Agriculture 2025, 15, 1917. [Google Scholar] [CrossRef] [Scilit]
- Payungwong, N.; Tuampoemsab, S.; Rojruthai, P.; Sakdapipanich, J. The role of model fatty acid and protein on thermal aging and ozone resistance of peroxide vulcanized natural rubber. J. Rubber Res. 2021, 24, 543–553. [Google Scholar] [CrossRef] [Scilit]
- Han, Y.; Becker, E.; Fahrenthold, E.; Kim, D. Fatigue Life Prediction for Cord-Rubber Composite Tires Using a Global-Local Finite Element Method. Tire Sci. Technol. 2004, 32, 23–40. [Google Scholar] [CrossRef] [Scilit]
- Ishikawa, Y.; Kawakami, S. Effects of Salt Corrosion on the Adhesion of Brass Plated Steel Cord to Rubber. Rubber Chem. Technol. 1986, 59, 1–15. [Google Scholar] [CrossRef] [Scilit]
- Kim, J.; Kim, Y.; Cho, Y. Estimation of Synthetic Rubber Lifespan Based on Ozone Accelerated Aging Tests. Polymers 2025, 17, 819. [Google Scholar] [CrossRef] [Scilit]
- Wang, Z.; Zhou, Y.; Liu, J.; Xu, Z.; Chen, M.; Gao, R.; He, S.; Li, F. Fatigue life investigation of rubber bearing for heavy trucks: Optimal design by using finite element method with experimental verification. Int. J. Fatigue 2024, 180, 108080. [Google Scholar] [CrossRef] [Scilit]
- Trautner, A.; Arvidsson, J. Subsoil compaction caused by machinery traffic on a Swedish Eutric Cambisol at different soil water contents. Soil Tillage Res. 2003, 73, 107–118. [Google Scholar] [CrossRef] [Scilit]
- Mohieddinne, H.; Ugarte, C. Traction machine-induced soil compaction: A review of stress transmission, mitigation, and predictive modelling. J. Terramechan. 2027, 125, 101167. [Google Scholar] [CrossRef] [Scilit]
- Dai, D.; Chen, D.; Wang, S.M.; Li, S.; Mao, X.; Zhang, B.; Wang, Z.Y.; Ma, Z. Compilation and Extrapolation of Load Spectrum of Tractor Ground Vibration Load Based on CEEMDAN-POT Model. Agriculture 2023, 13, 125. [Google Scholar] [CrossRef] [Scilit]
- Zhao, Z.; Li, H.C.; Liu, J.K.; Yang, S.X. Control method of seedbed compactness based on fragment soil compaction dynamic characteristics. Soil Tillage Res. 2020, 198, 104551. [Google Scholar] [CrossRef] [Scilit]
- Yang, Q.Z.; Shi, L.; Shi, A.P.; He, M.S.; Zhao, X.Q.; Zhang, L.; Addy, M. Determination of key soil characteristic parameters using angle of repose and direct shear stress test. Int. J. Agric. Biol. Eng. 2023, 16, 143–150. [Google Scholar] [CrossRef] [Scilit]
- Han, D.L.; Ren, L.Z.; Li, C.W.; Liu, H.R.; Hu, J.R.; Yang, D.Y.; Yang, Q.Z. Mechanical response of wet and soft soil to complex interactions with solid. Soil Tillage Res. 2026, 255, 106834. [Google Scholar] [CrossRef] [Scilit]
- Zhao, Z.; Wei, H.L.; Liu, S.S.; Xue, Z. Estimation of agricultural soil surface roughness based on ultrasonic echo signal characteristics. Soil Tillage Res. 2024, 239, 106038. [Google Scholar] [CrossRef] [Scilit]
- Zhang, B.; Bai, T.C.; Wu, G.; Wang, H.W.; Zhu, Q.Z.; Zhang, G.Q.; Meng, Z.J.; Wen, C.K. Fatigue Analysis of Shovel Body Based on Tractor Subsoiling Operation Measured Data. Agriculture 2024, 14, 1604. [Google Scholar] [CrossRef] [Scilit]
- Duan, X. Experiment and Fatigue Life Prediction of Filled Natural Rubber under Variable Amplitude Loading Conditions. J. Mech. Eng. 2016, 52, 58. [Google Scholar] [CrossRef] [Scilit]
- Gao, Y.Y.; Yang, Y.F.; Fu, S.; Feng, K.Y.; Han, X.; Hu, Y.Y.; Zhu, Q.Z.; Wei, X.H. Analysis of Vibration Characteristics of Tractor-Rotary Cultivator Combination Based on Time Domain and Frequency Domain. Agriculture 2024, 14, 1139. [Google Scholar] [CrossRef] [Scilit]
- Xu, L.Z.; Chai, X.Y.; Gao, Z.P.; Li, Y.M.; Wang, Y.D. Experimental study on driver seat vibration characteristics of crawler-type combine harvester. Int. J. Agric. Biol. Eng. 2019, 12, 90–97. [Google Scholar] [CrossRef] [Scilit]
- Wang, L.; Wang, F.; Yang, Y.; Liao, W.-H. A remaining useful life prediction approach for ball bearing by acoustic emission signal and physics-informed neural network. Struct. Health Monit. 2026, 25, 2878–2895. [Google Scholar] [CrossRef] [Scilit]
- Li, Y.M.; Liu, Y.B.; Ji, K.Z.; Zhu, R.H. A Fault Diagnosis Method for a Differential Inverse Gearbox of a Crawler Combine Harvester Based on Order Analysis. Agriculture 2022, 12, 1300. [Google Scholar] [CrossRef] [Scilit]
- Chen, J.; Lian, Y.; Zou, R.; Zhang, S.; Ning, X.B.; Han, M.N. Real-time grain breakage sensing for rice combine harvesters using machine vision technology. Int. J. Agric. Biol. Eng. 2020, 13, 194–199. [Google Scholar] [CrossRef] [Scilit]
- Yu, Y.; Li, Z.Y.; Dai, B.W.; Pan, J.H.; Xu, L.Z. High-Precision Mapping and Real-Time Localization for Agricultural Machinery Sheds and Farm Access Roads Environments. Agriculture 2025, 15, 2248. [Google Scholar] [CrossRef] [Scilit]
- Guan, X.P.; Ge, H.R.; Nie, S.C.; Ding, Y.H. Research on Agricultural Autonomous Positioning and Navigation System Based on LIO-SAM and Apriltag Fusion. Agronomy 2025, 15, 2731. [Google Scholar] [CrossRef] [Scilit]
- Nguyen, T.A.; Nguyen, D.T.; Kim, J.M. Remaining Useful Life Prediction of Rolling Element Bearings Based on an Advanced Two-Stage Degradation Model. IEEE Access 2025, 13, 211463–211475. [Google Scholar] [CrossRef] [Scilit]
- Reiser, D.; Sharipov, G.M.; Hubel, G.; Nannen, V.; Griepentrog, H.W. Development and Experimental Validation of an Agricultural Robotic Platform with High Traction and Low Compaction. Agriculture 2023, 13, 1510. [Google Scholar] [CrossRef] [Scilit]
- Jiang, Y.Y.; Wang, R.C.; Ding, R.K.; Sun, Z.Y.; Jiang, Y.; Liu, W. Research Review of Agricultural Machinery Power Chassis in Hilly and Mountainous Areas. Agriculture 2025, 15, 1158. [Google Scholar] [CrossRef] [Scilit]
- Fang, H.M.; Li, J.Y.; Zhang, Q.Y.; Cheng, G.S.; Lu, J.L.; Zhang, J. Design and Experiment for a Crawler Self-Propelled Potato Combine Harvester for Hilly and Mountainous Areas. Agriculture 2025, 15, 1748. [Google Scholar] [CrossRef] [Scilit]
- Hu, J.P.; Pan, J.H.; Dai, B.W.; Chai, X.Y.; Sun, Y.X.; Xu, L.Z. Development of an Attitude Adjustment Crawler Chassis for Combine Harvester and Experiment of Adaptive Leveling System. Agronomy 2022, 12, 717. [Google Scholar] [CrossRef] [Scilit]
- Hu, J.P.; Yu, Y.; Ma, T.L.; Liu, P.; Xu, L.Z. Design of attitude-adjustable chassis and dynamic stress analysis of key components for crawler combine harvester. J. Agric. Eng. 2025, 56, 2239–6268. [Google Scholar] [CrossRef] [Scilit]
- Ding, R.K.; Qi, X.Y.; Chen, X.W.; Mei, Y.X.; Li, A.Z.; Wang, R.C.; Guo, Z.Y. Research on the Design of an Omnidirectional Leveling System and Adaptive Sliding Mode Control for Tracked Agricultural Chassis in Hilly and Mountainous Terrain. Agriculture 2025, 15, 1920. [Google Scholar] [CrossRef] [Scilit]
- Ansorge, D.; Godwin, R.J. The effect of tyres and a rubber track at high axle loads on soil compaction: Part 3: Comparison of virgin compression line approaches. Biosyst. Eng. 2009, 104, 278–287. [Google Scholar] [CrossRef] [Scilit]
- Jiang, Y.Y.; Wang, R.C.; Ding, R.K.; Sun, Z.Y.; Liu, W. Research on the Leveling Performance of an Electromechanical Omnidirectional Leveling System for Tracked Mobile Platforms in Hilly and Mountainous Areas. Agriculture 2026, 16, 458. [Google Scholar] [CrossRef] [Scilit]
- Hu, J.P.; Shi, M.L.; Ma, T.L.; Liu, P.; Chai, X.Y.; Cao, G.Q.; Xu, L.Z. Adaptive synchronous sliding mode levelling system for combine harvester considering track circumference: Co-simulation and experimental verification. Biosyst. Eng. 2026, 264, 104396. [Google Scholar] [CrossRef] [Scilit]
- Wang, B.; Du, X.X.; Wang, Y.N.; Mao, H.P. Multi-machine collaboration realization conditions and precise and efficient production mode of intelligent agricultural machinery. Int. J. Agric. Biol. Eng. 2024, 17, 27–36. [Google Scholar] [CrossRef] [Scilit]
- Zhu, S.J.; Wang, B.; Pan, S.Q.; Ye, Y.T.; Wang, E.G.; Mao, H.P. Task Allocation of Multi-Machine Collaborative Operation for Agricultural Machinery Based on the Improved Fireworks Algorithm. Agronomy 2024, 14, 710. [Google Scholar] [CrossRef] [Scilit]
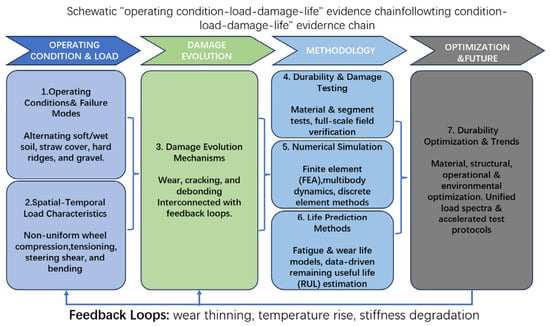
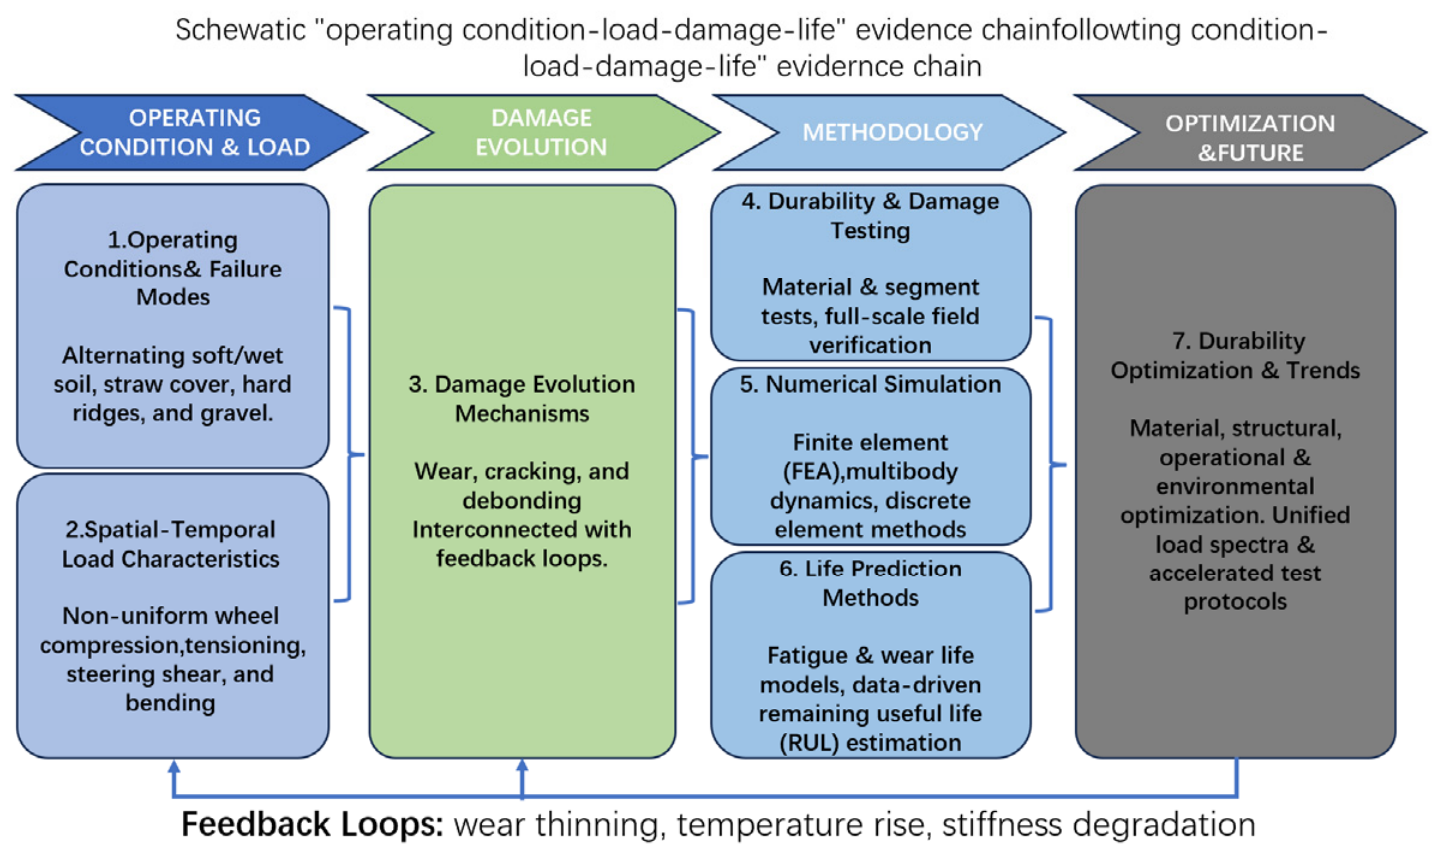
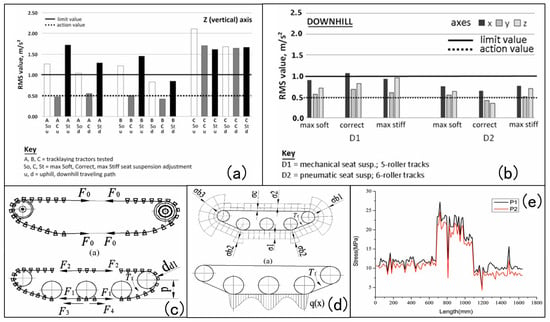
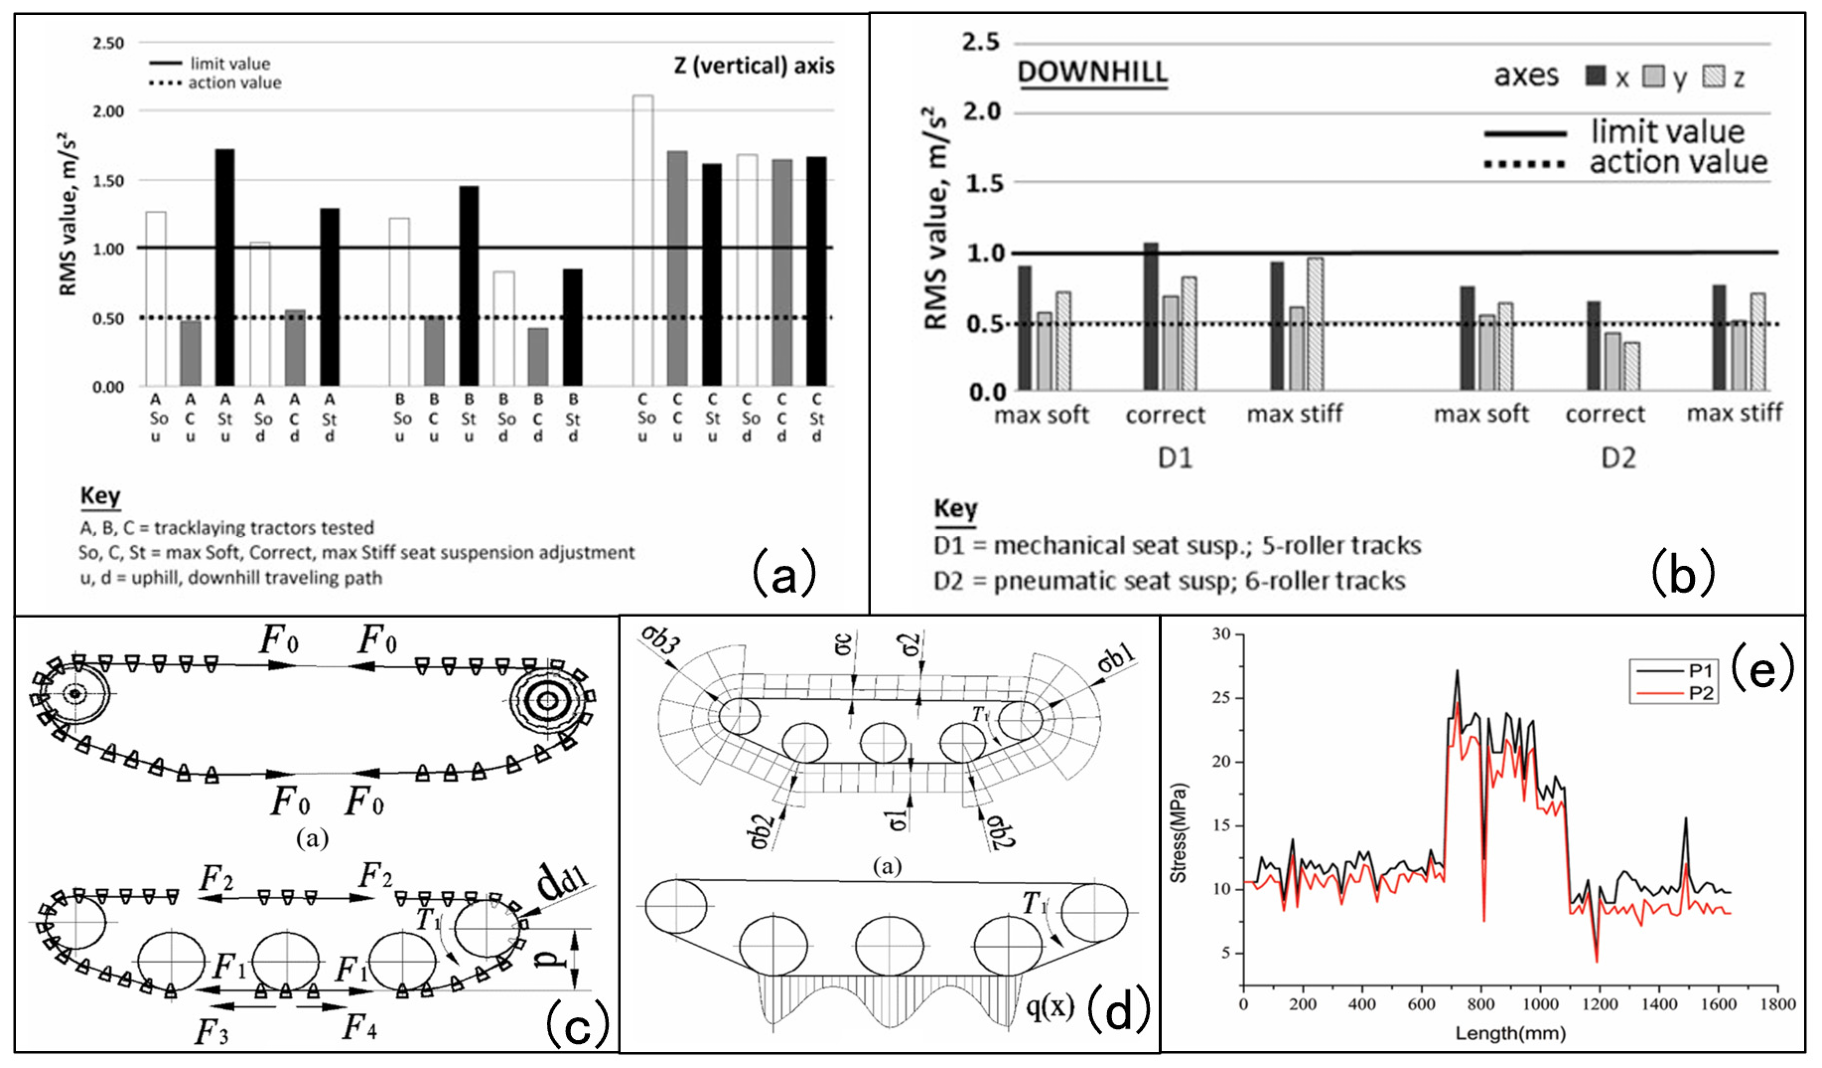
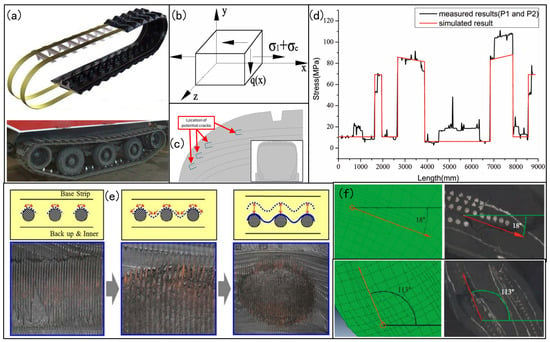
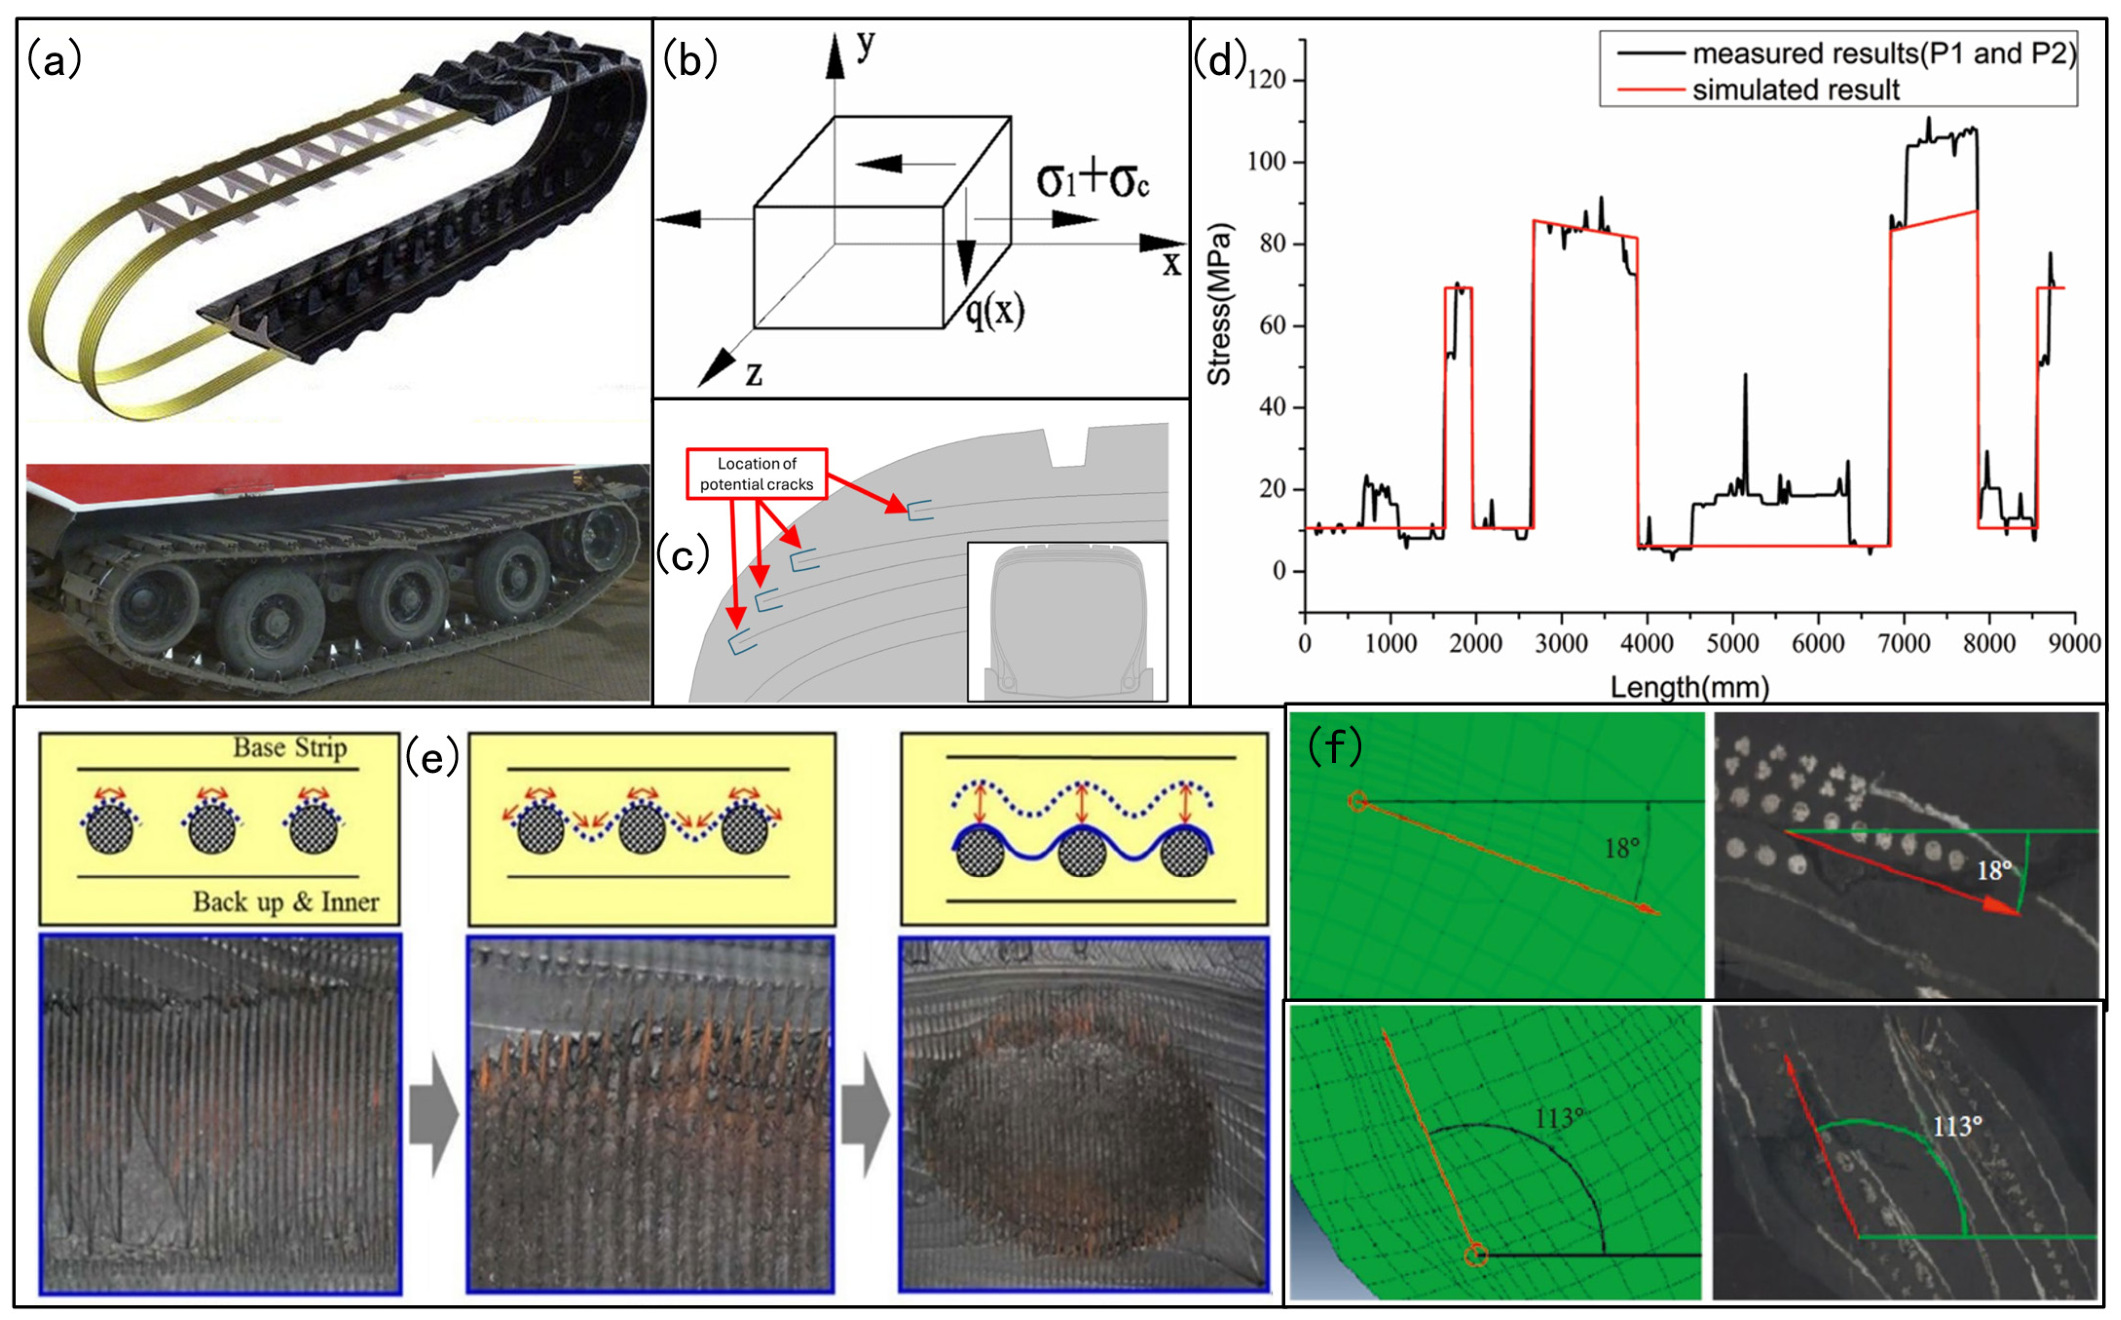
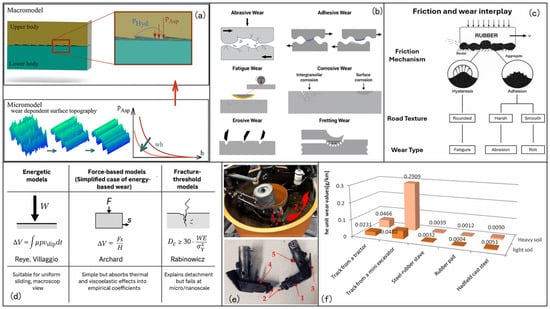
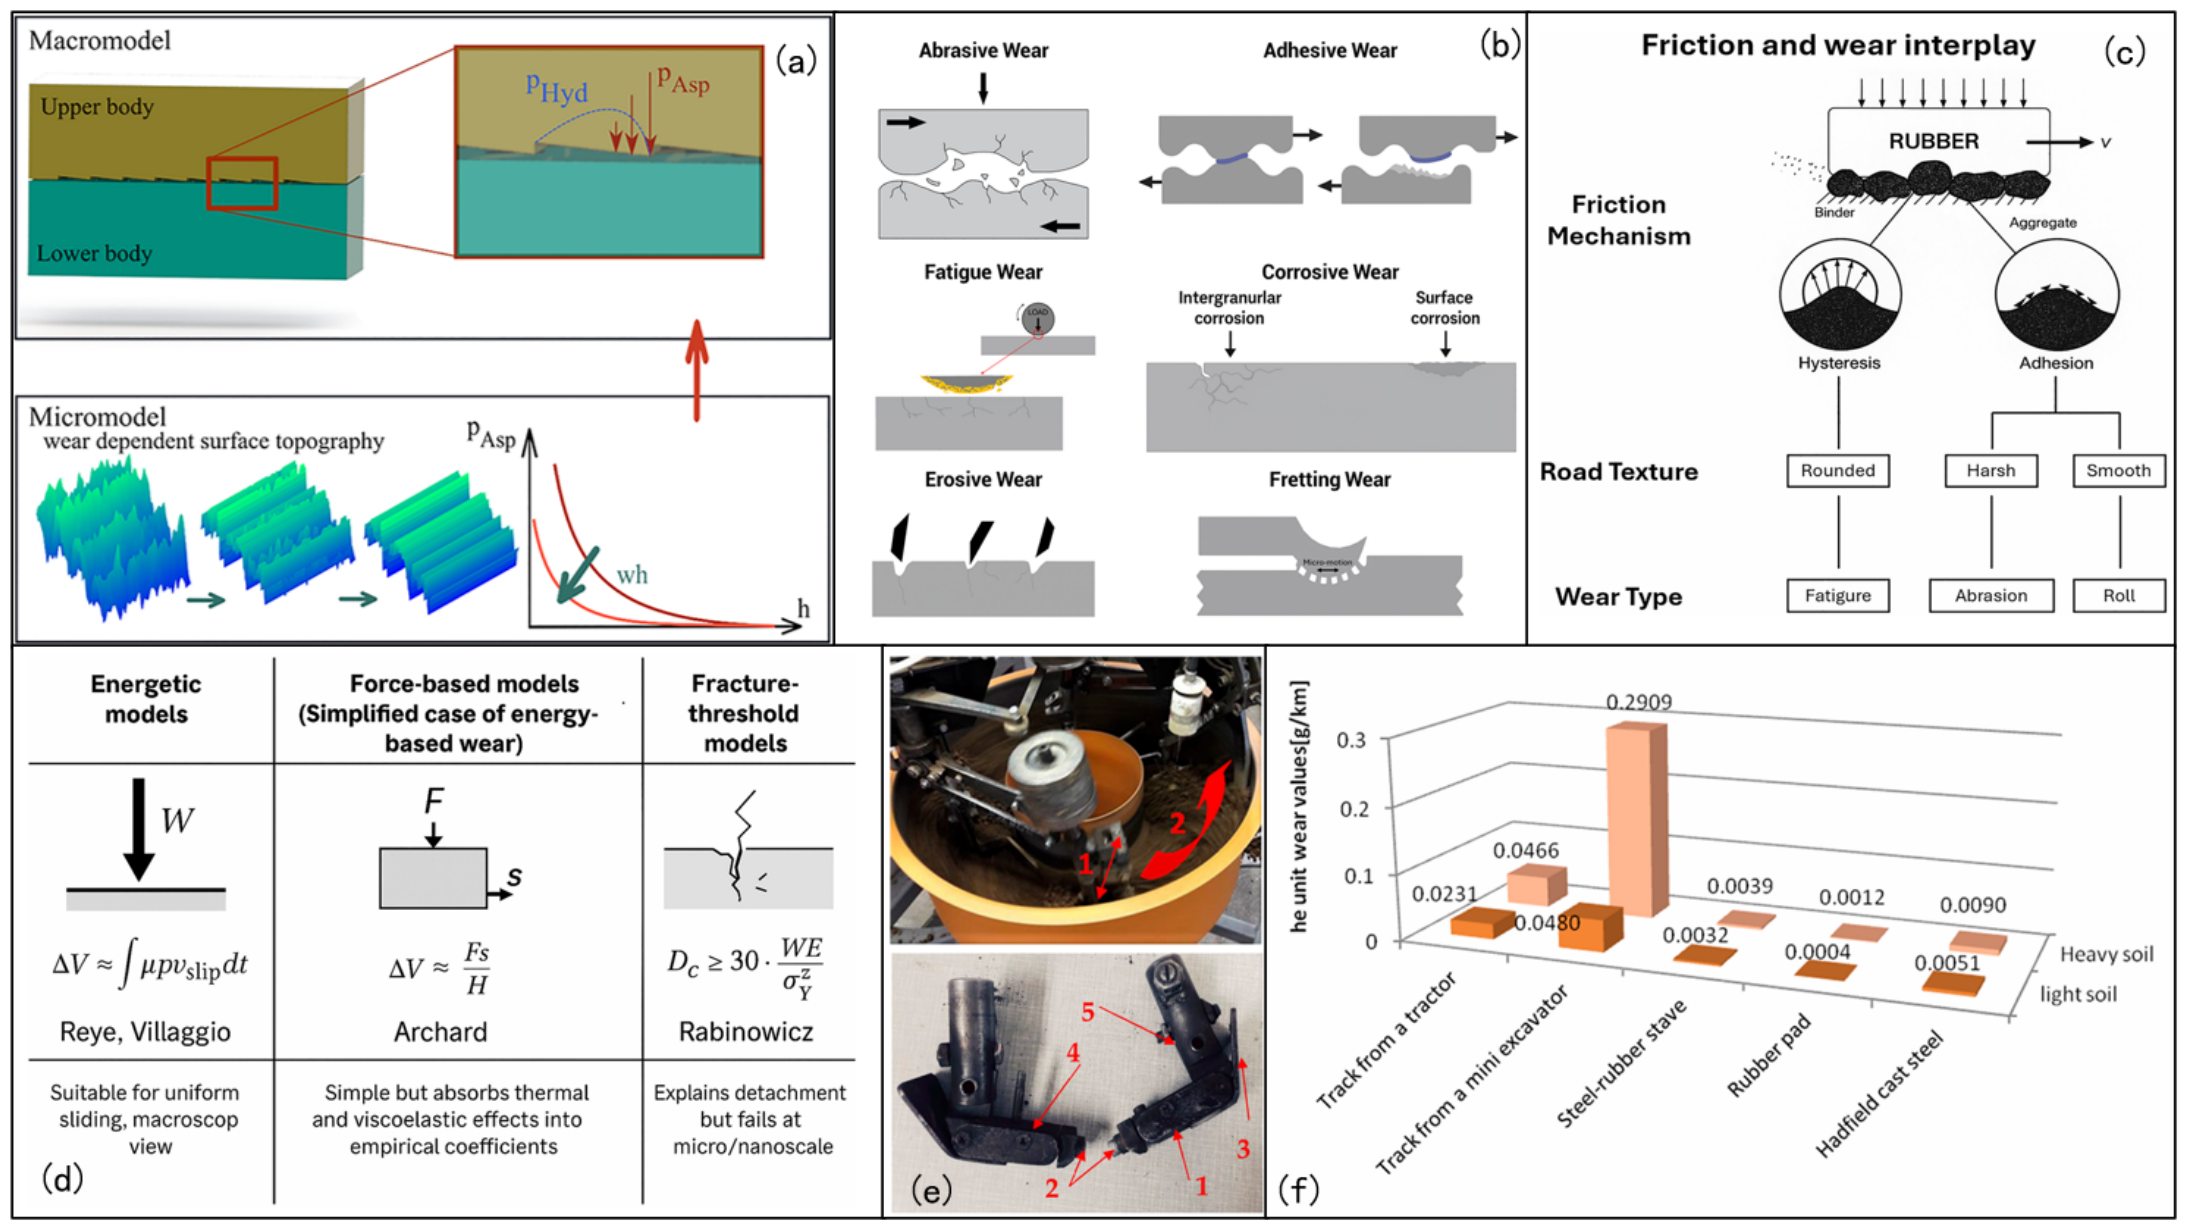
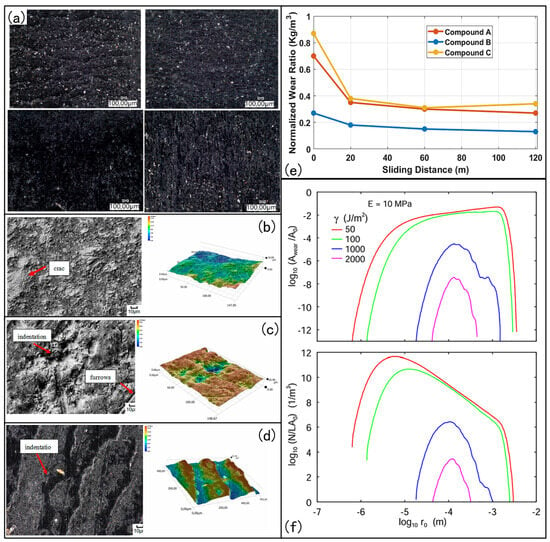
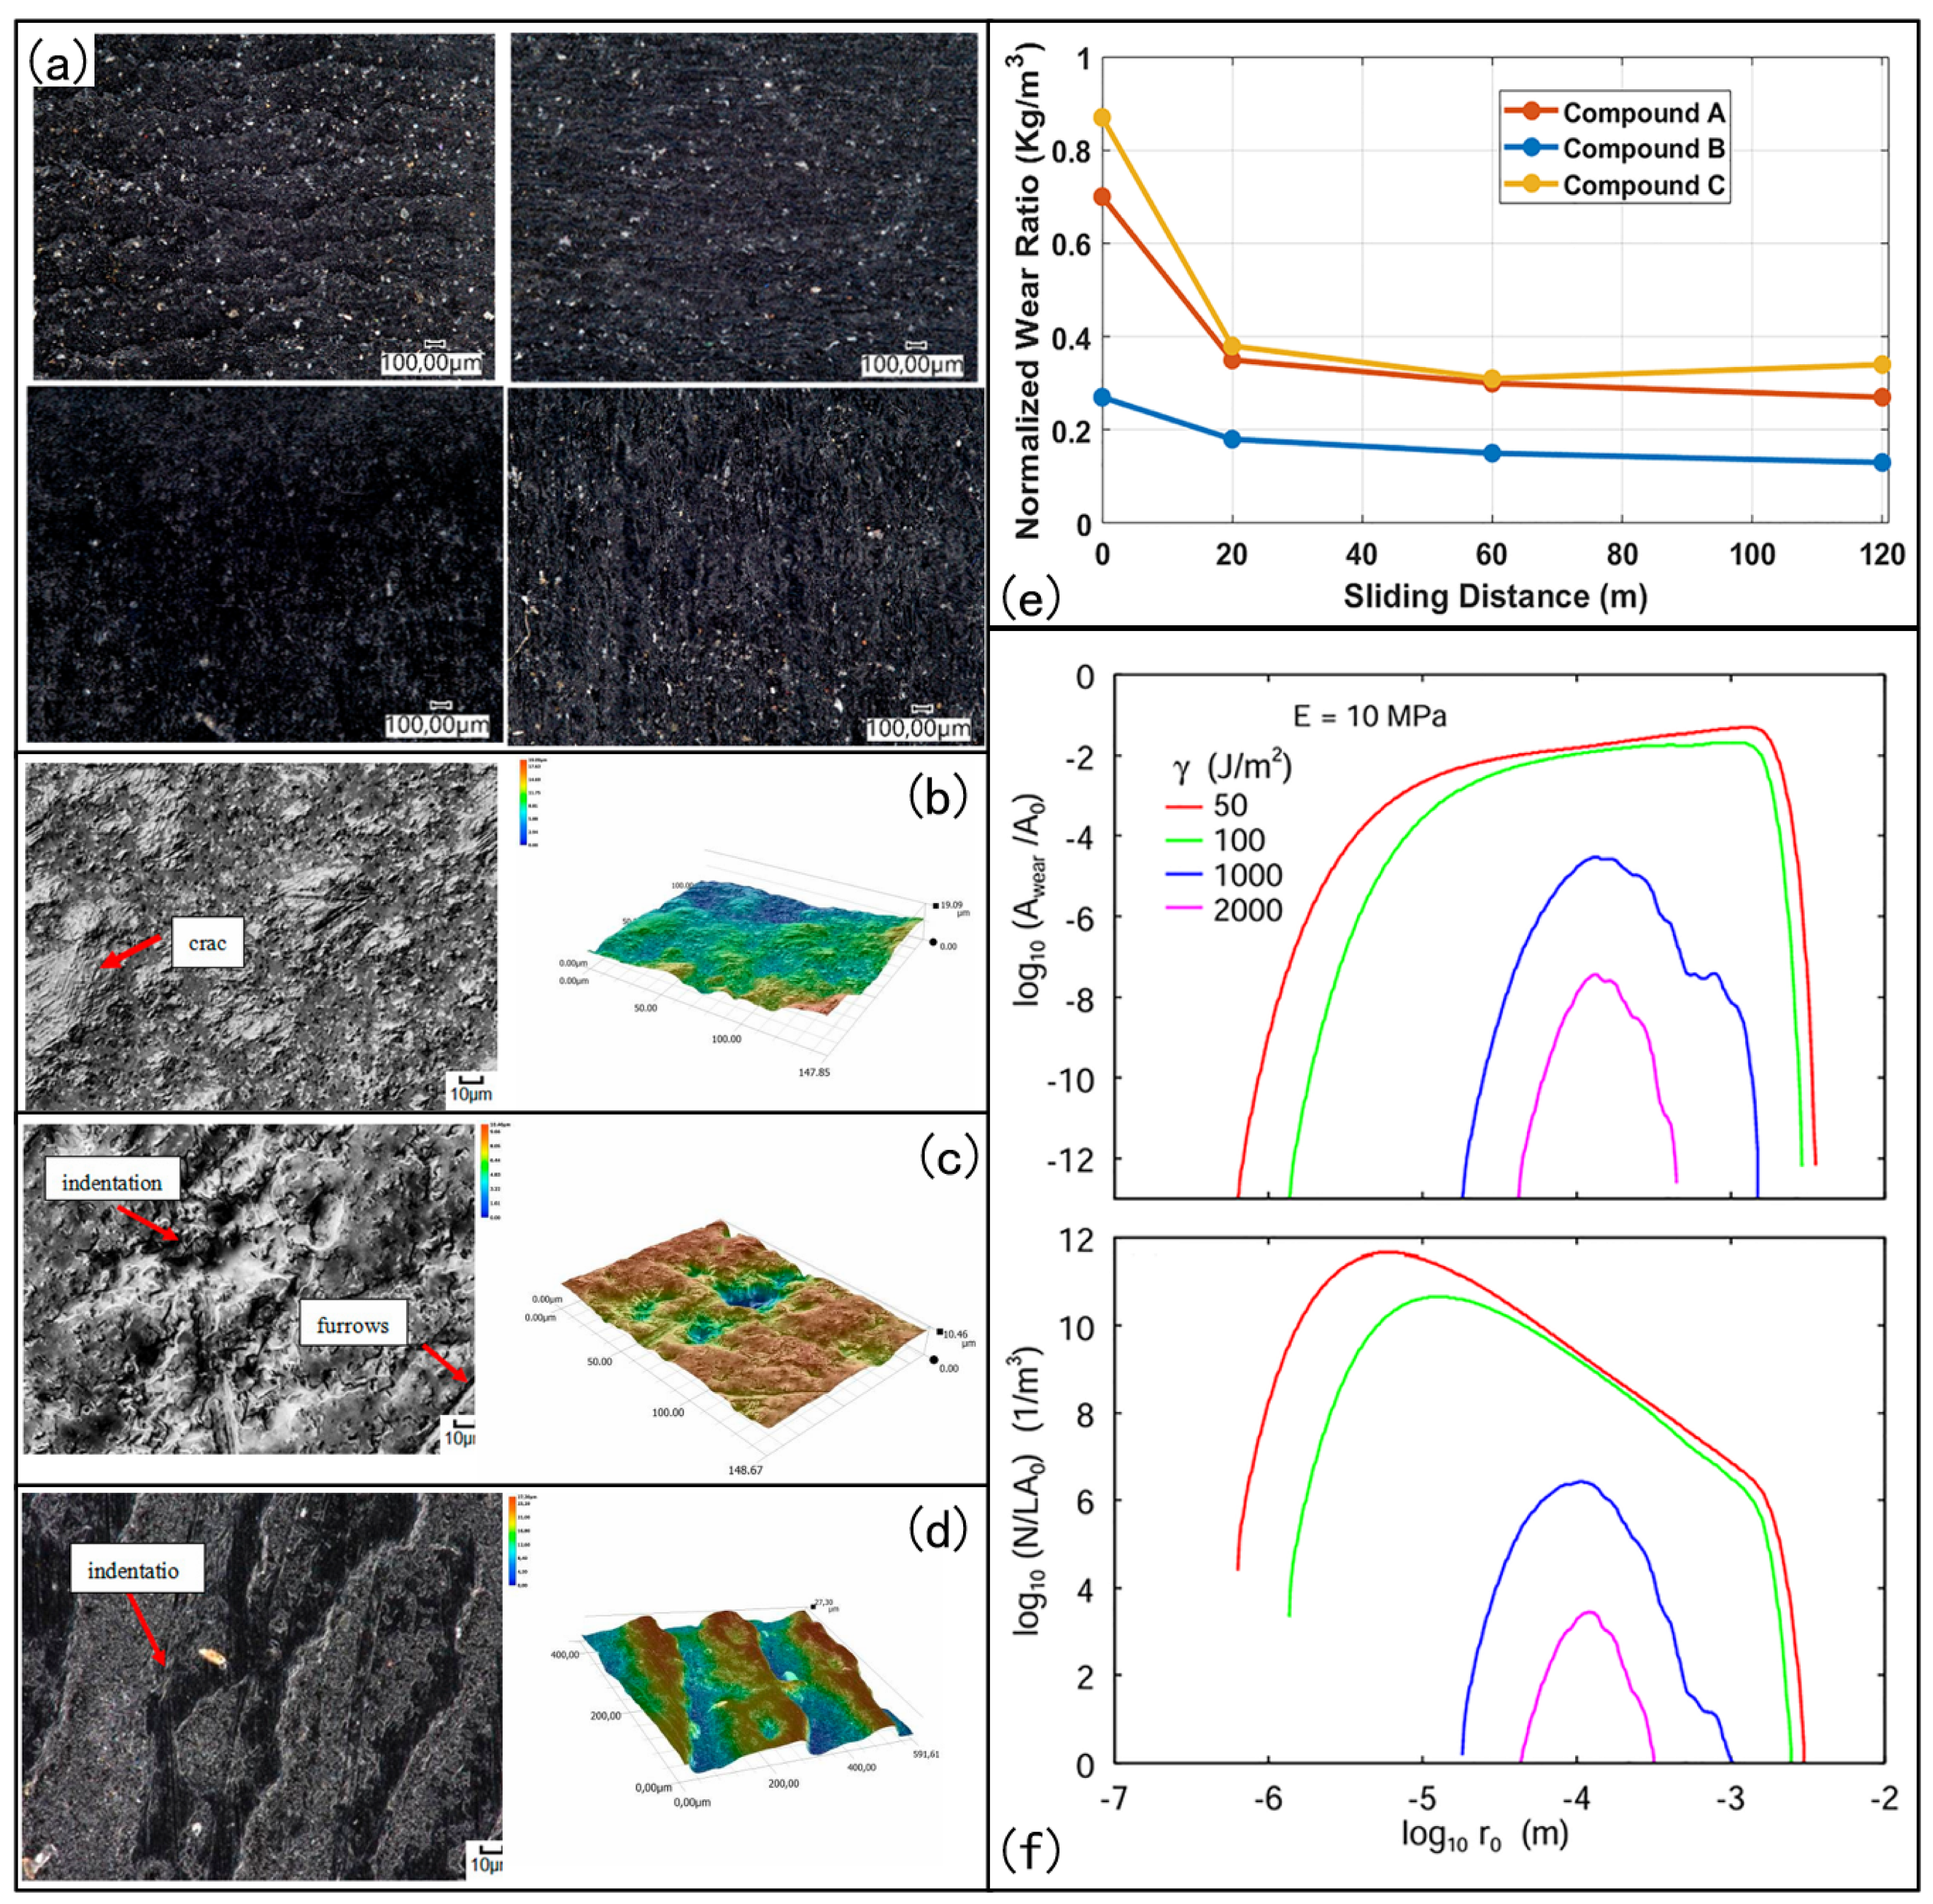
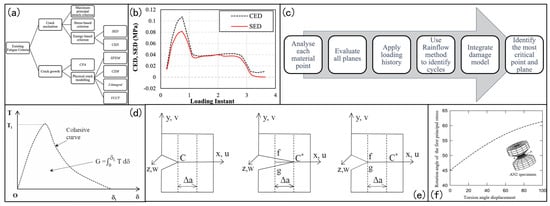
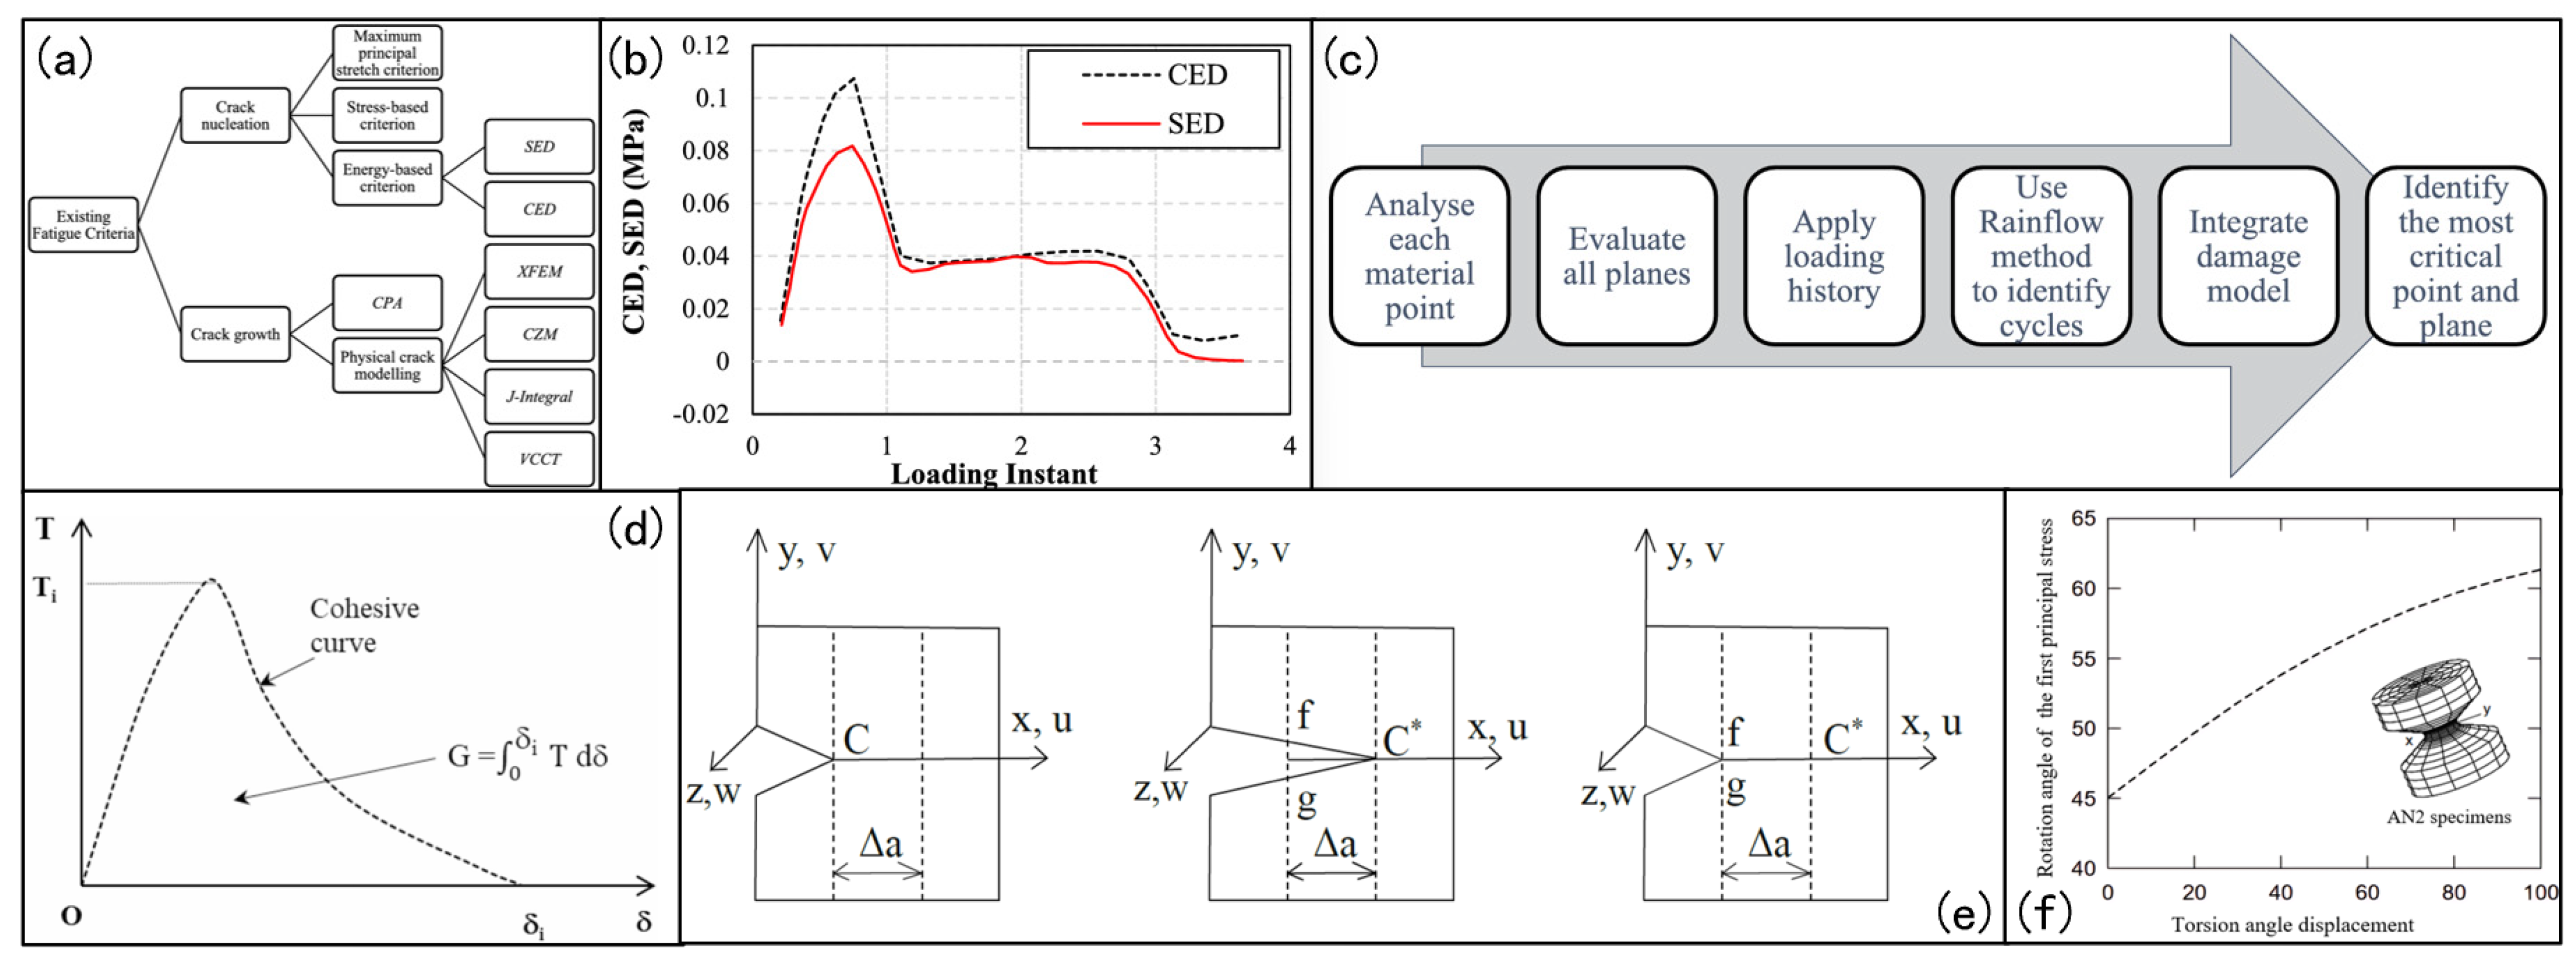
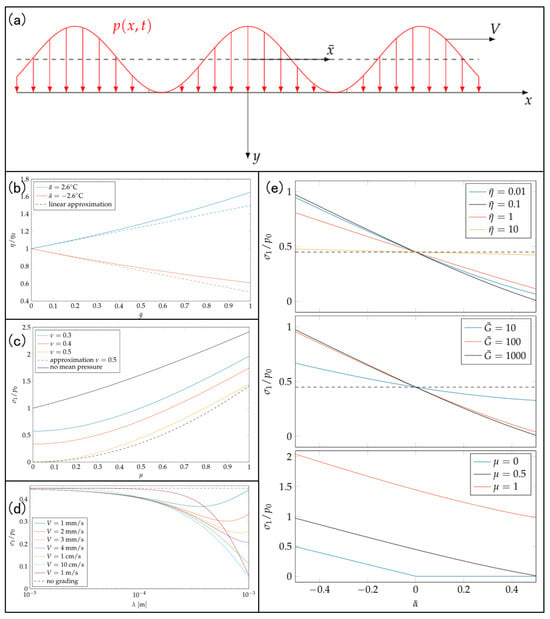
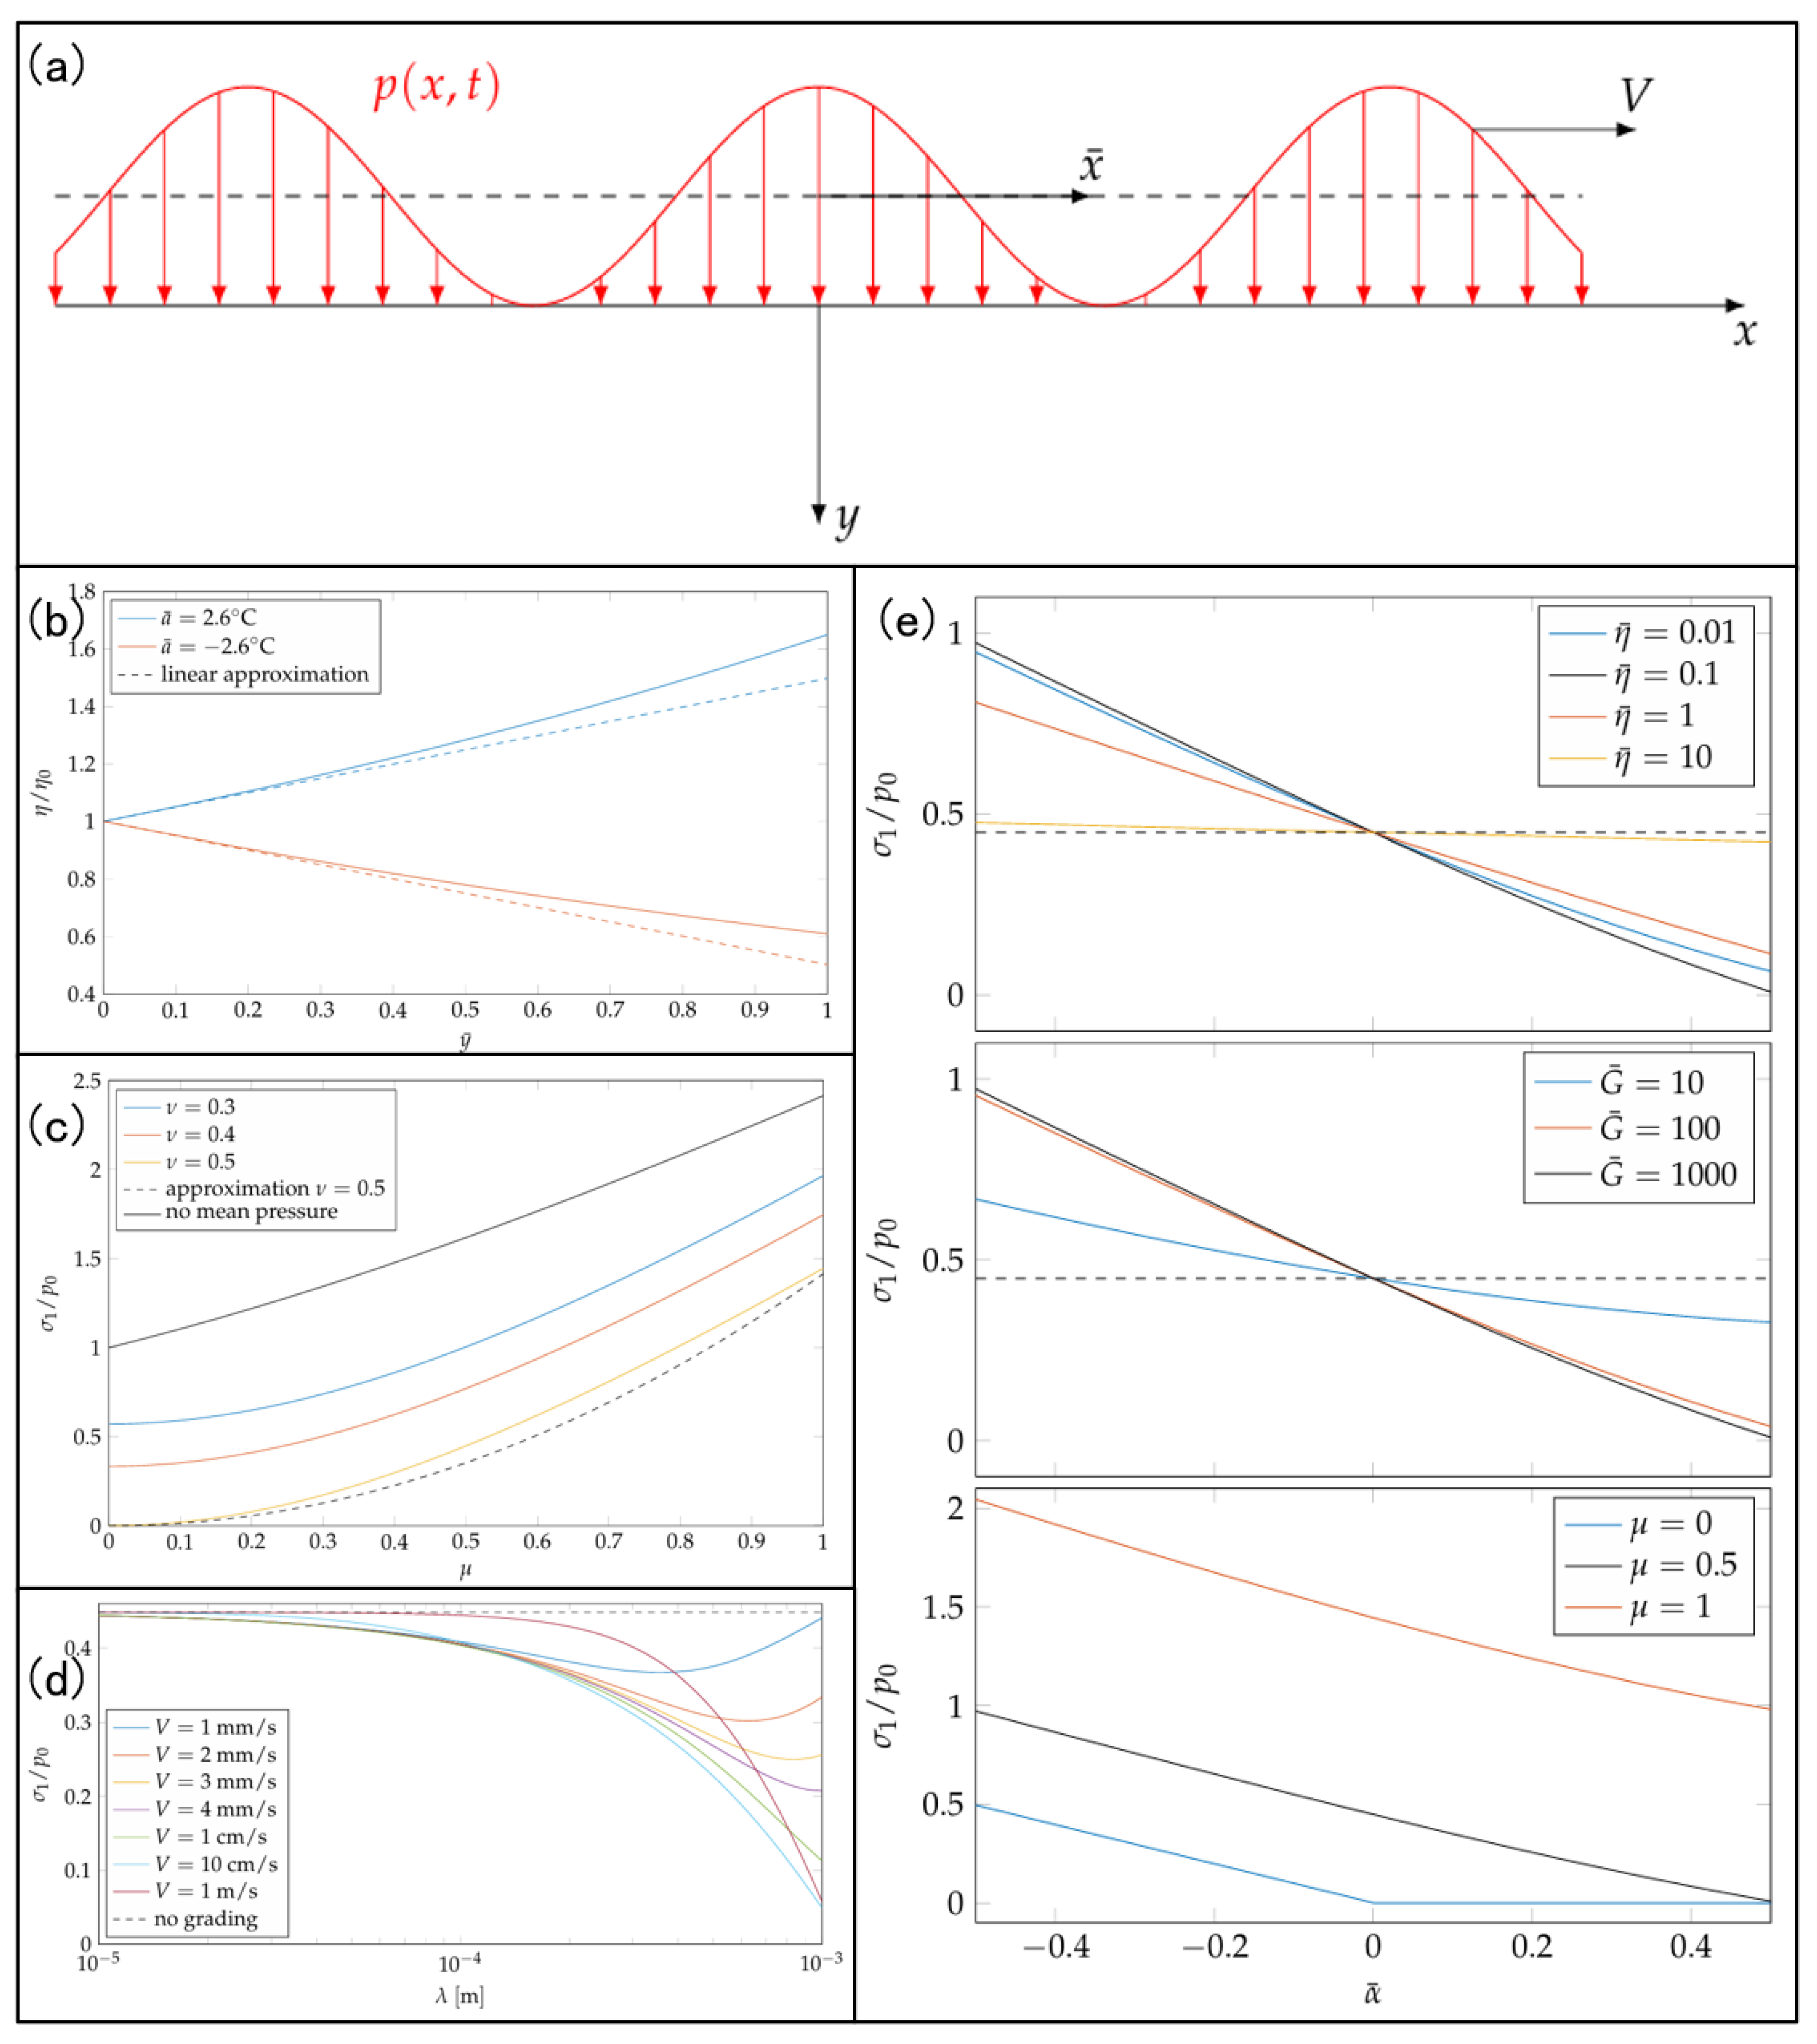
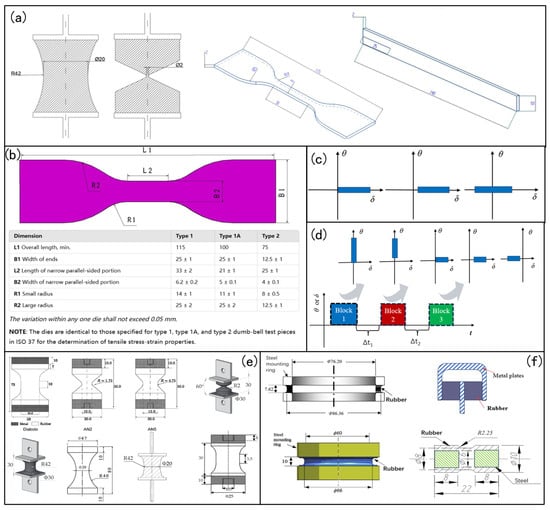
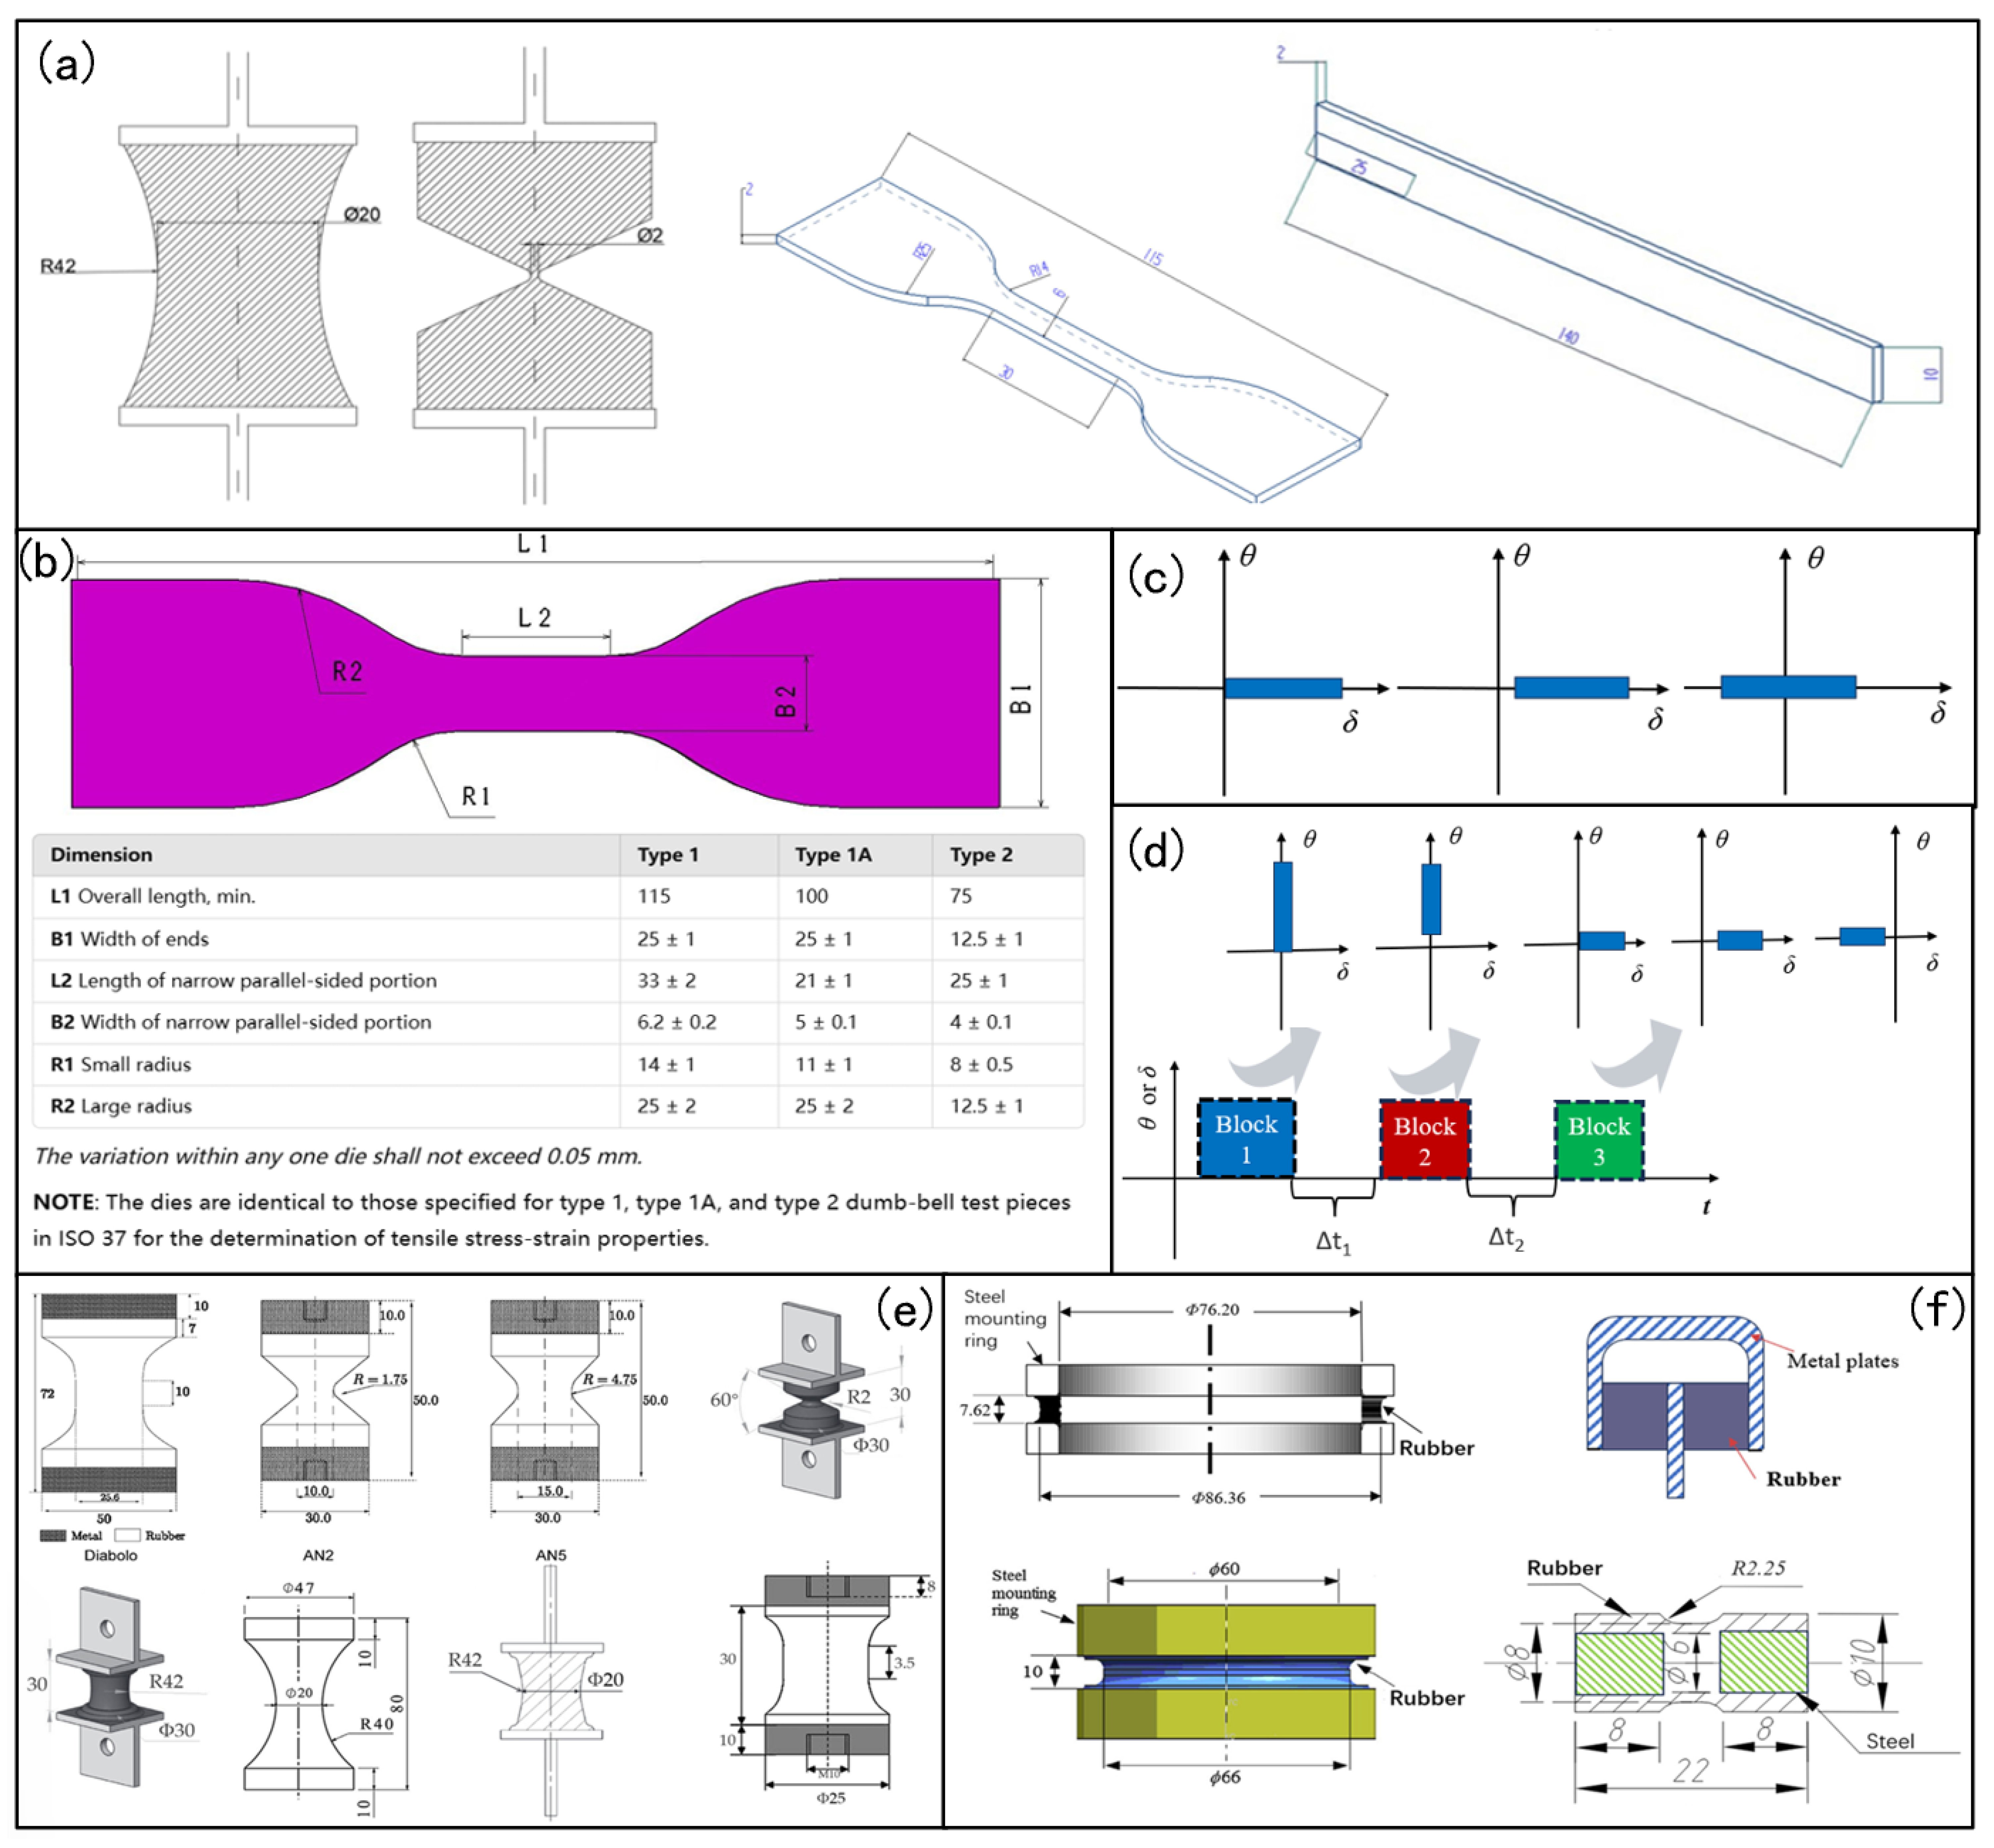
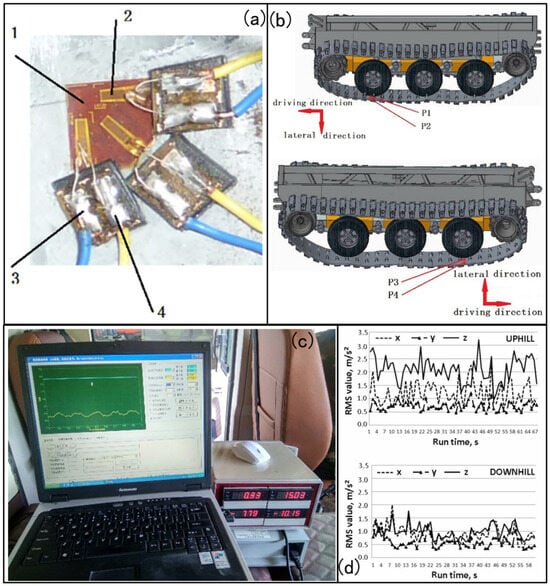
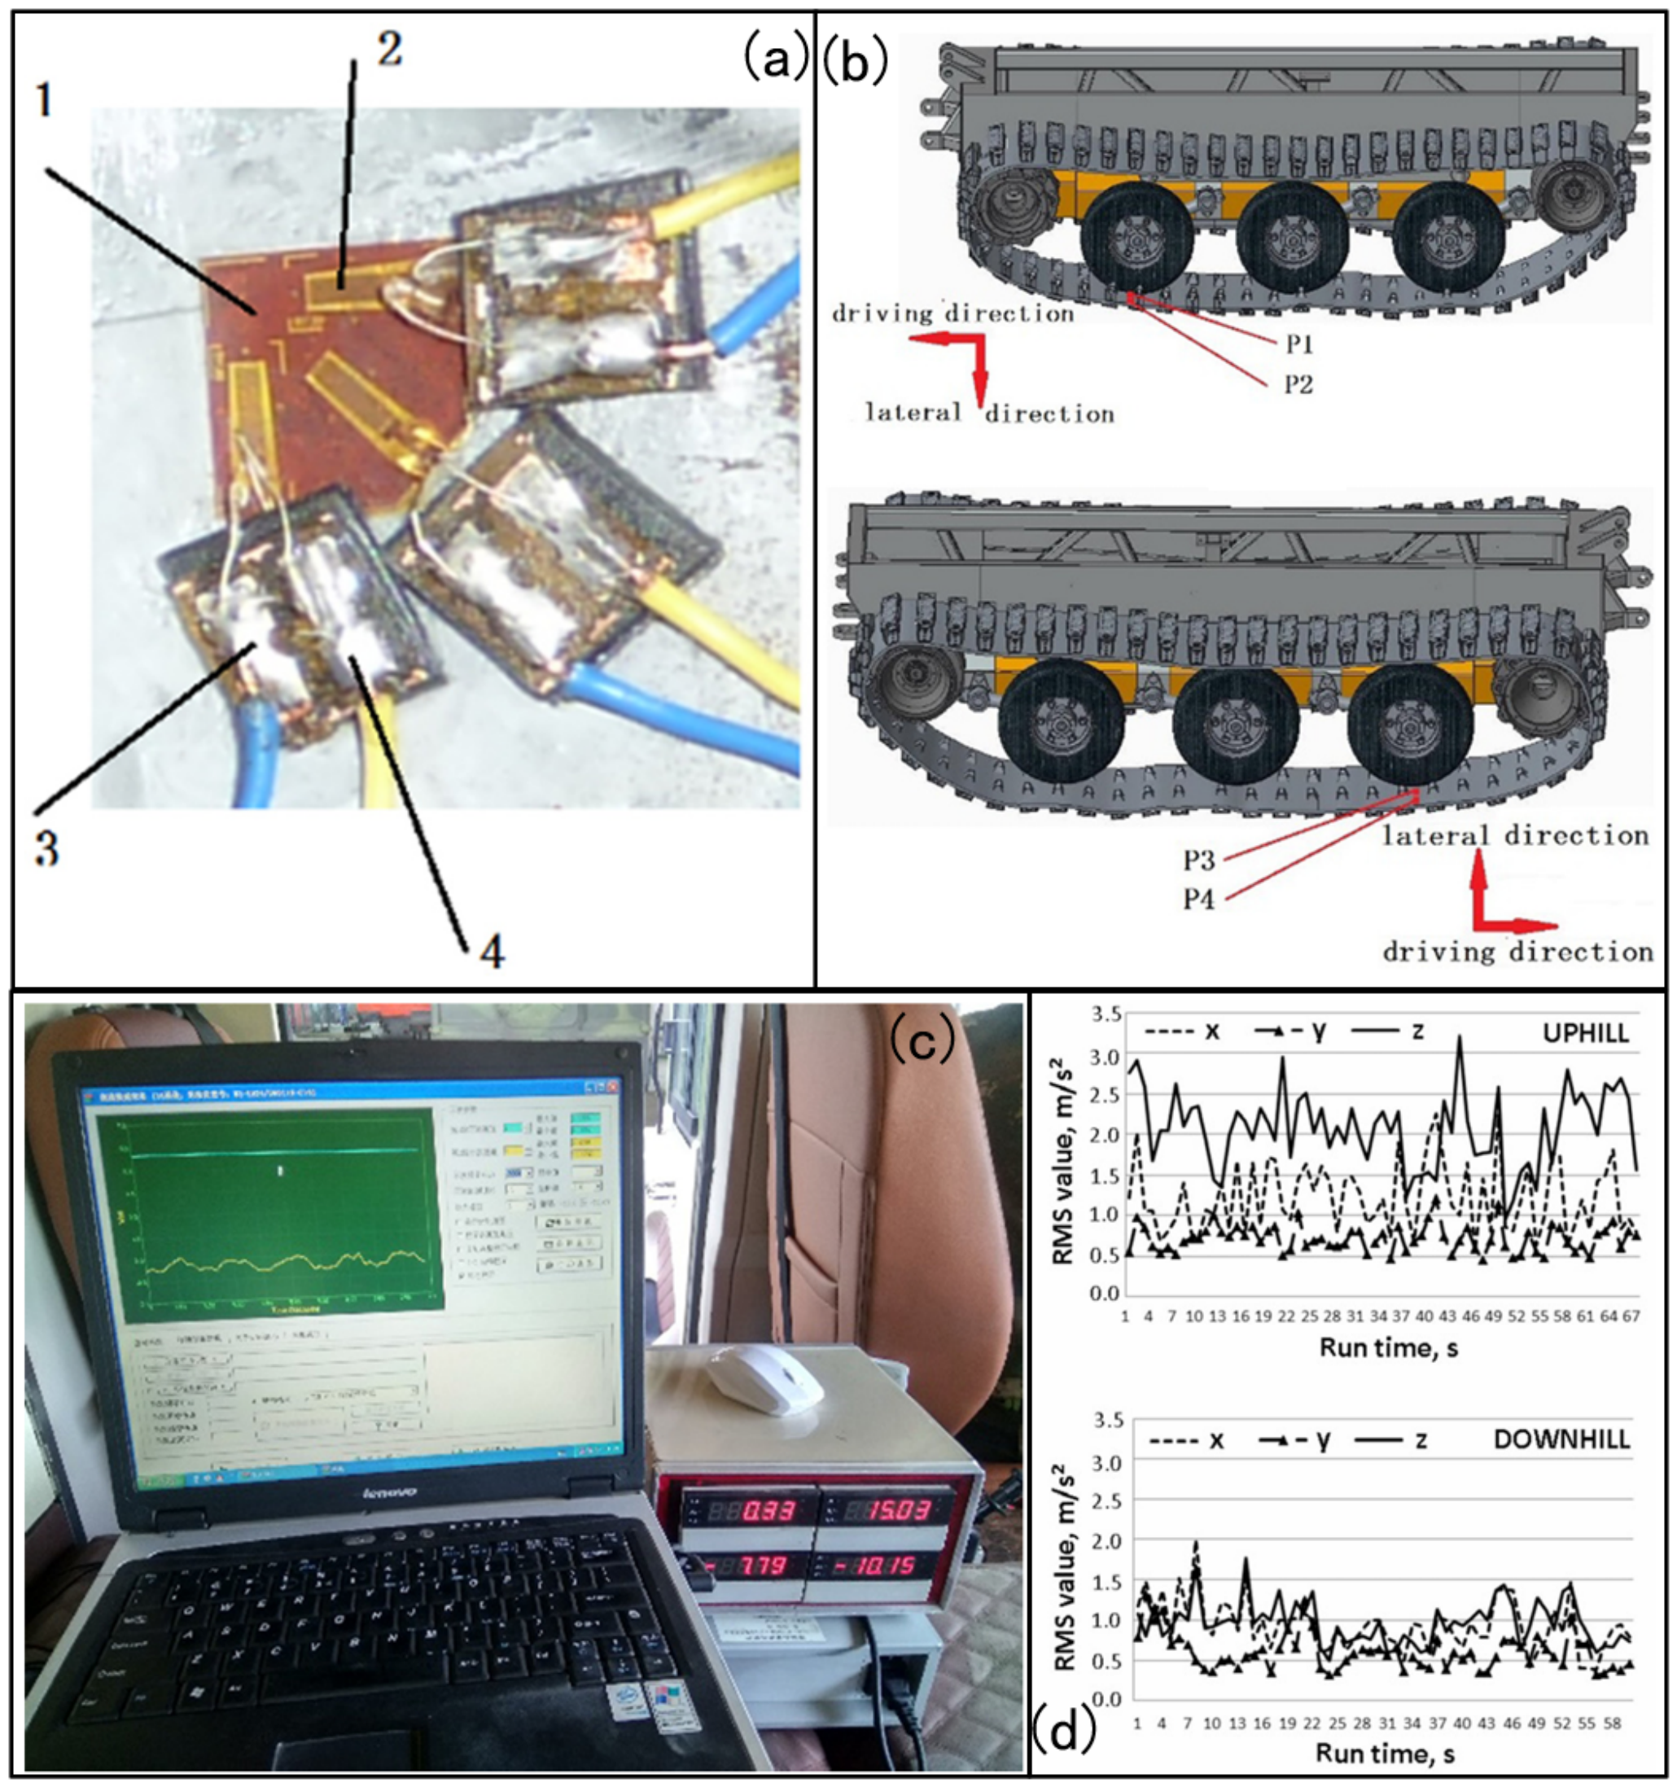
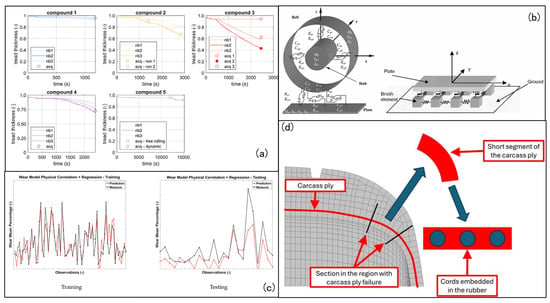
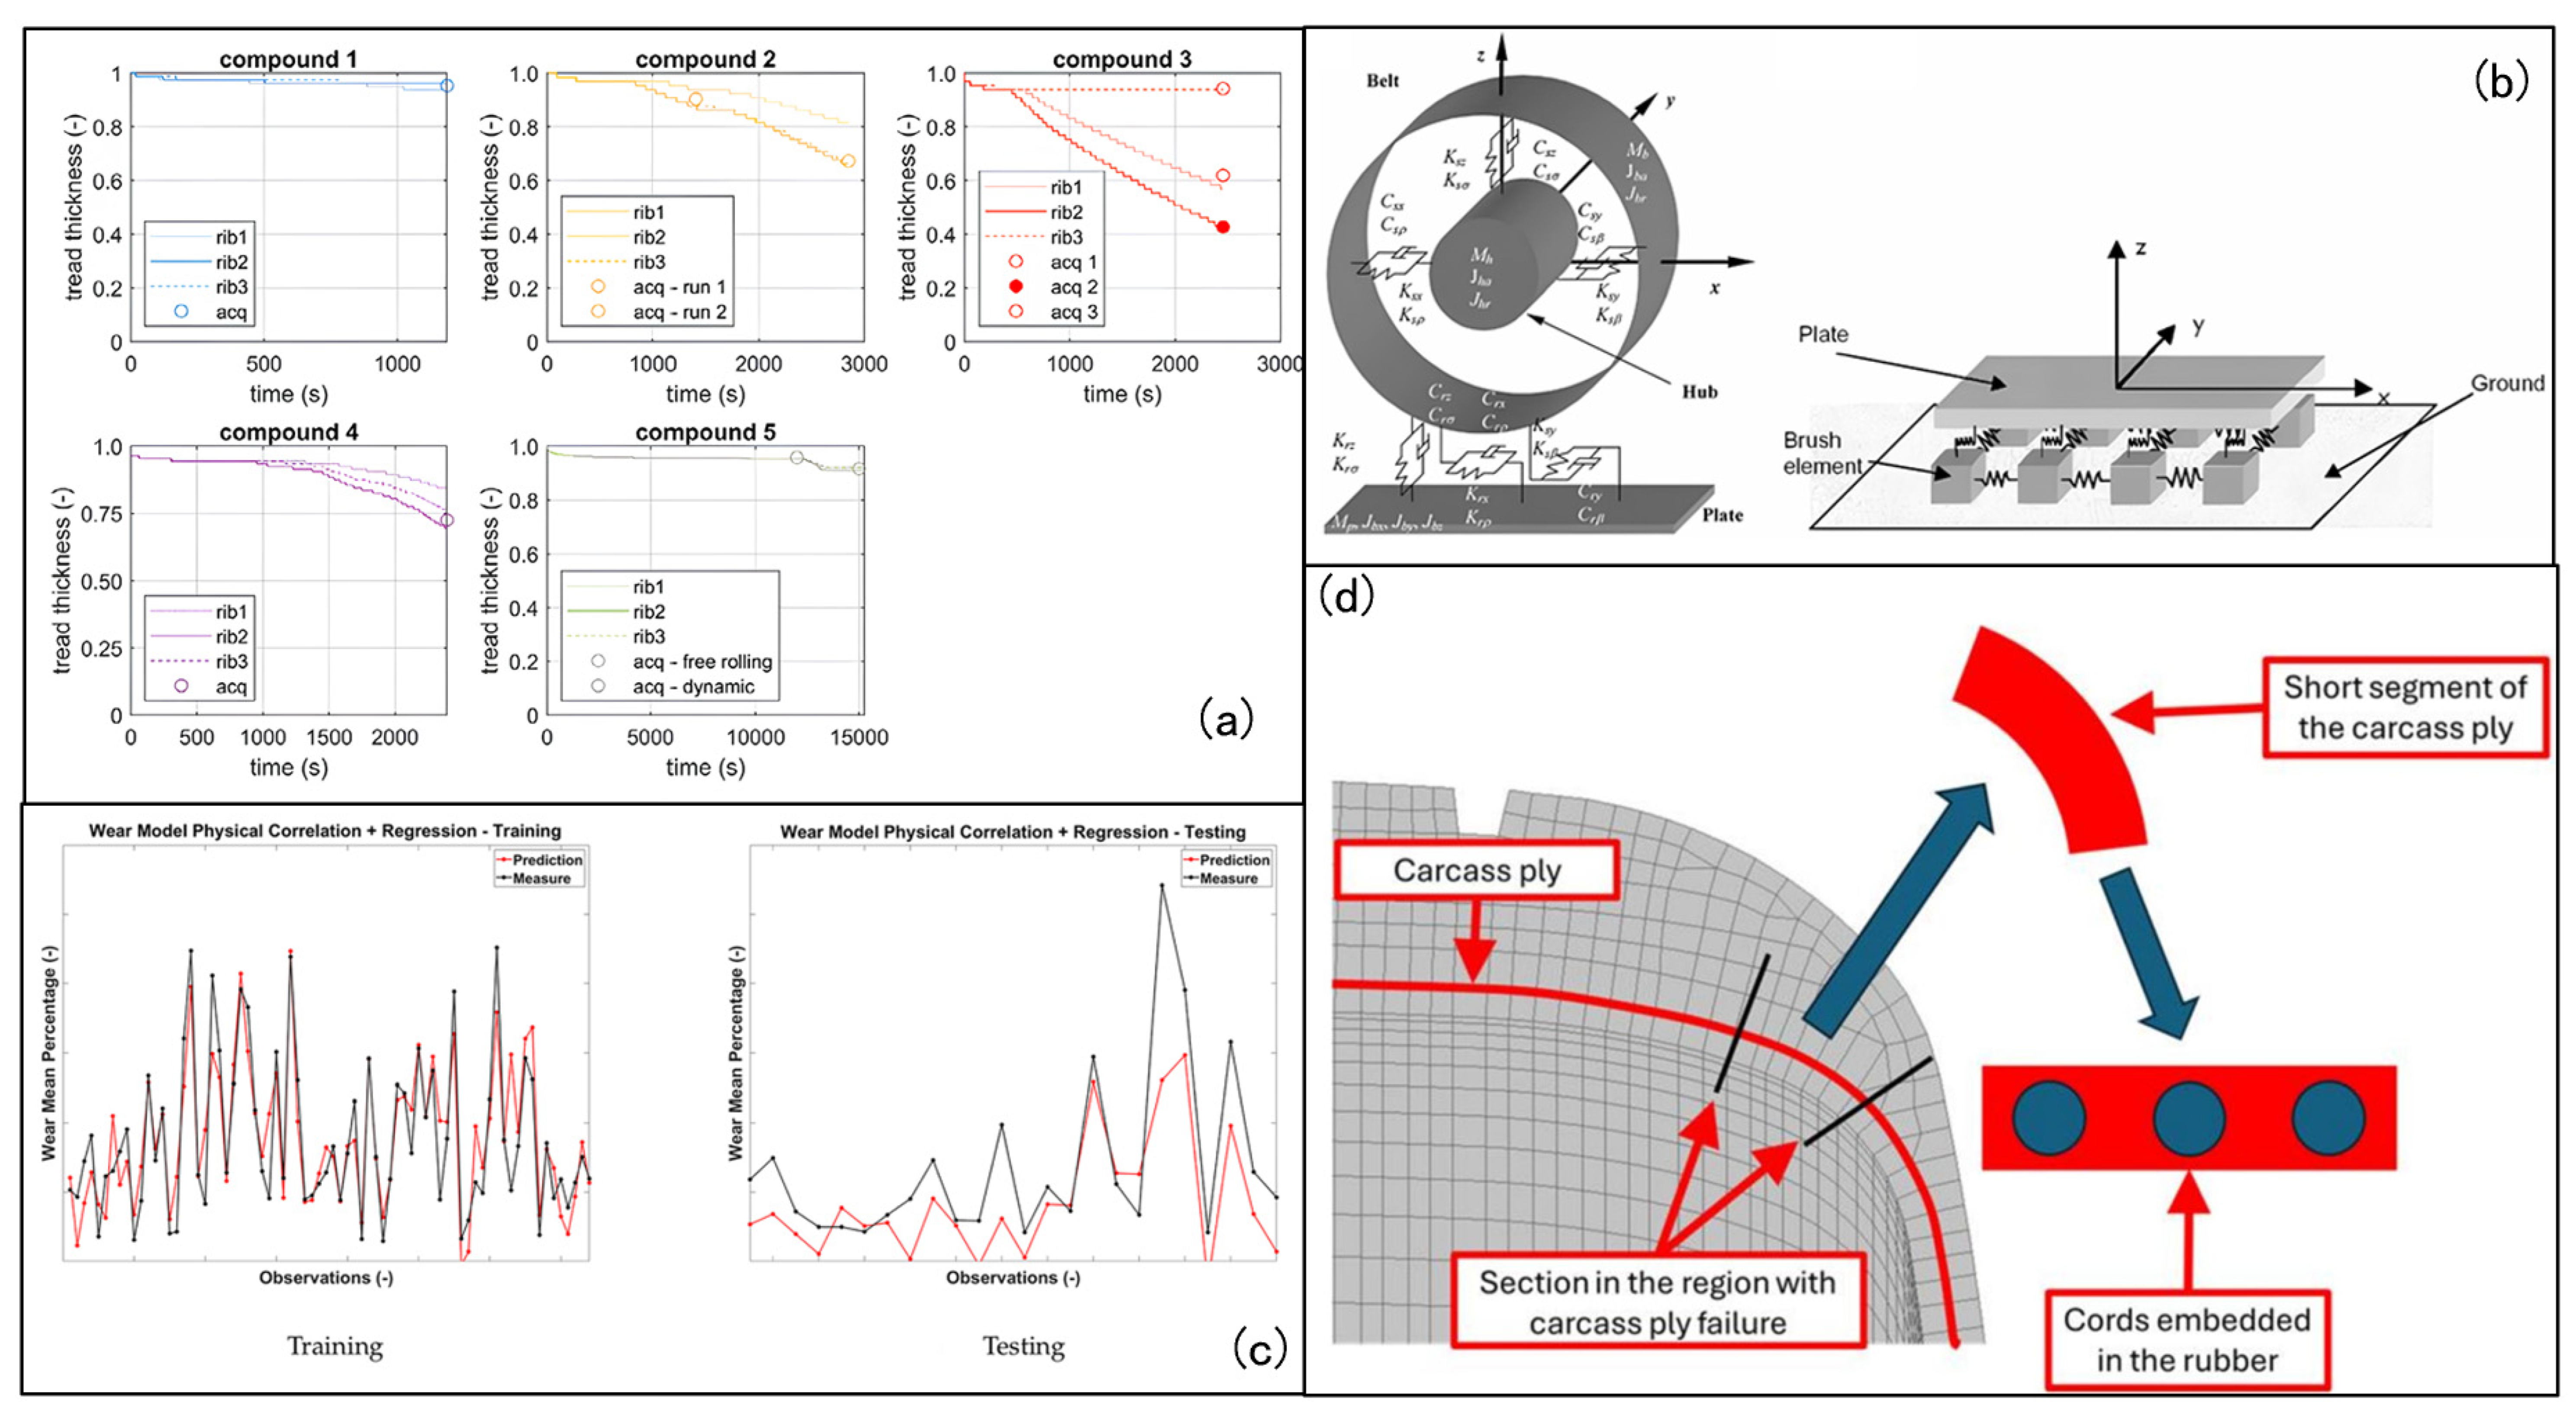
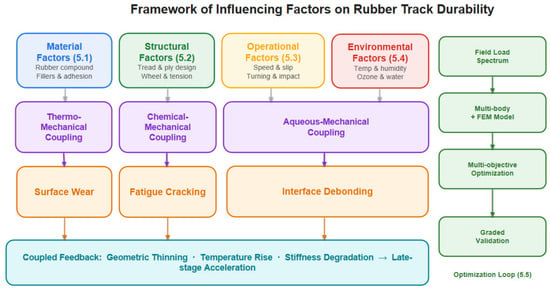
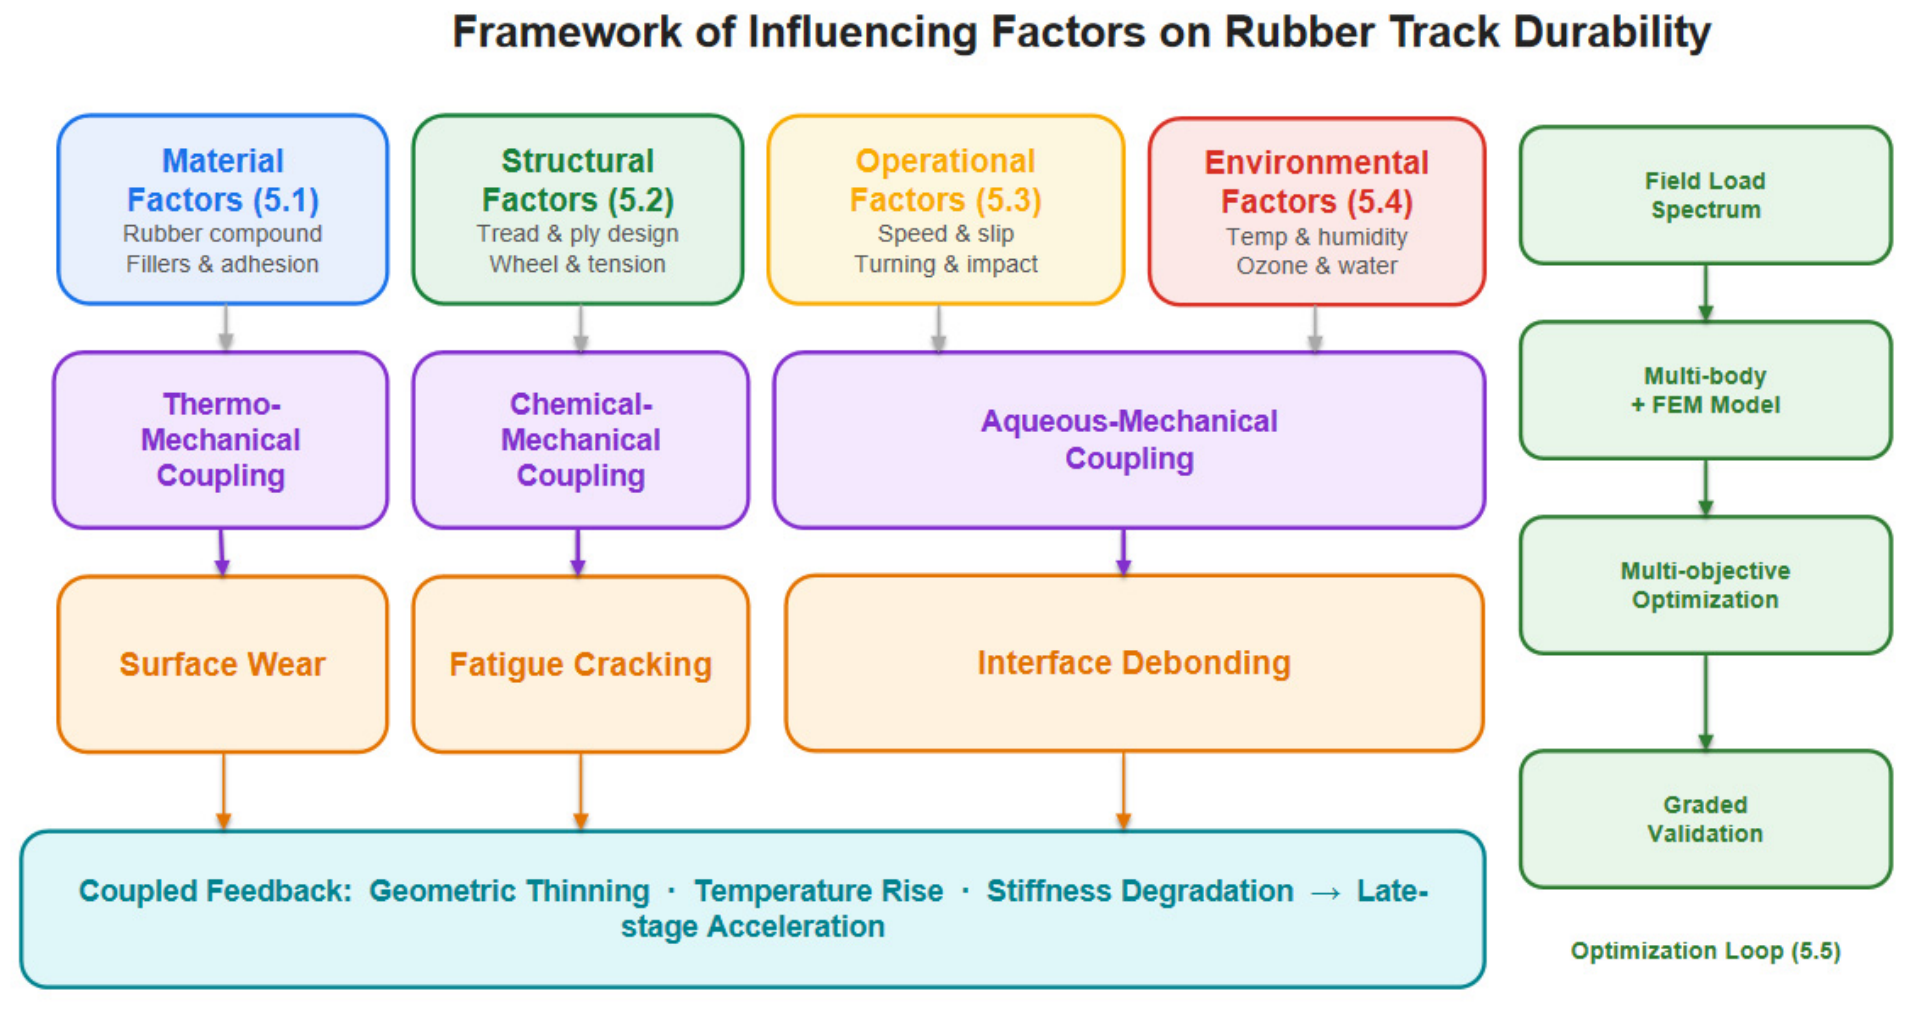
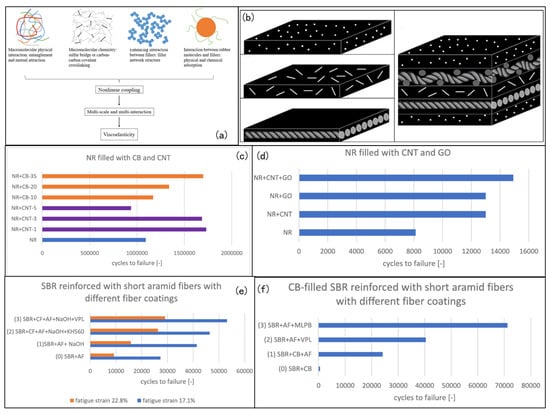
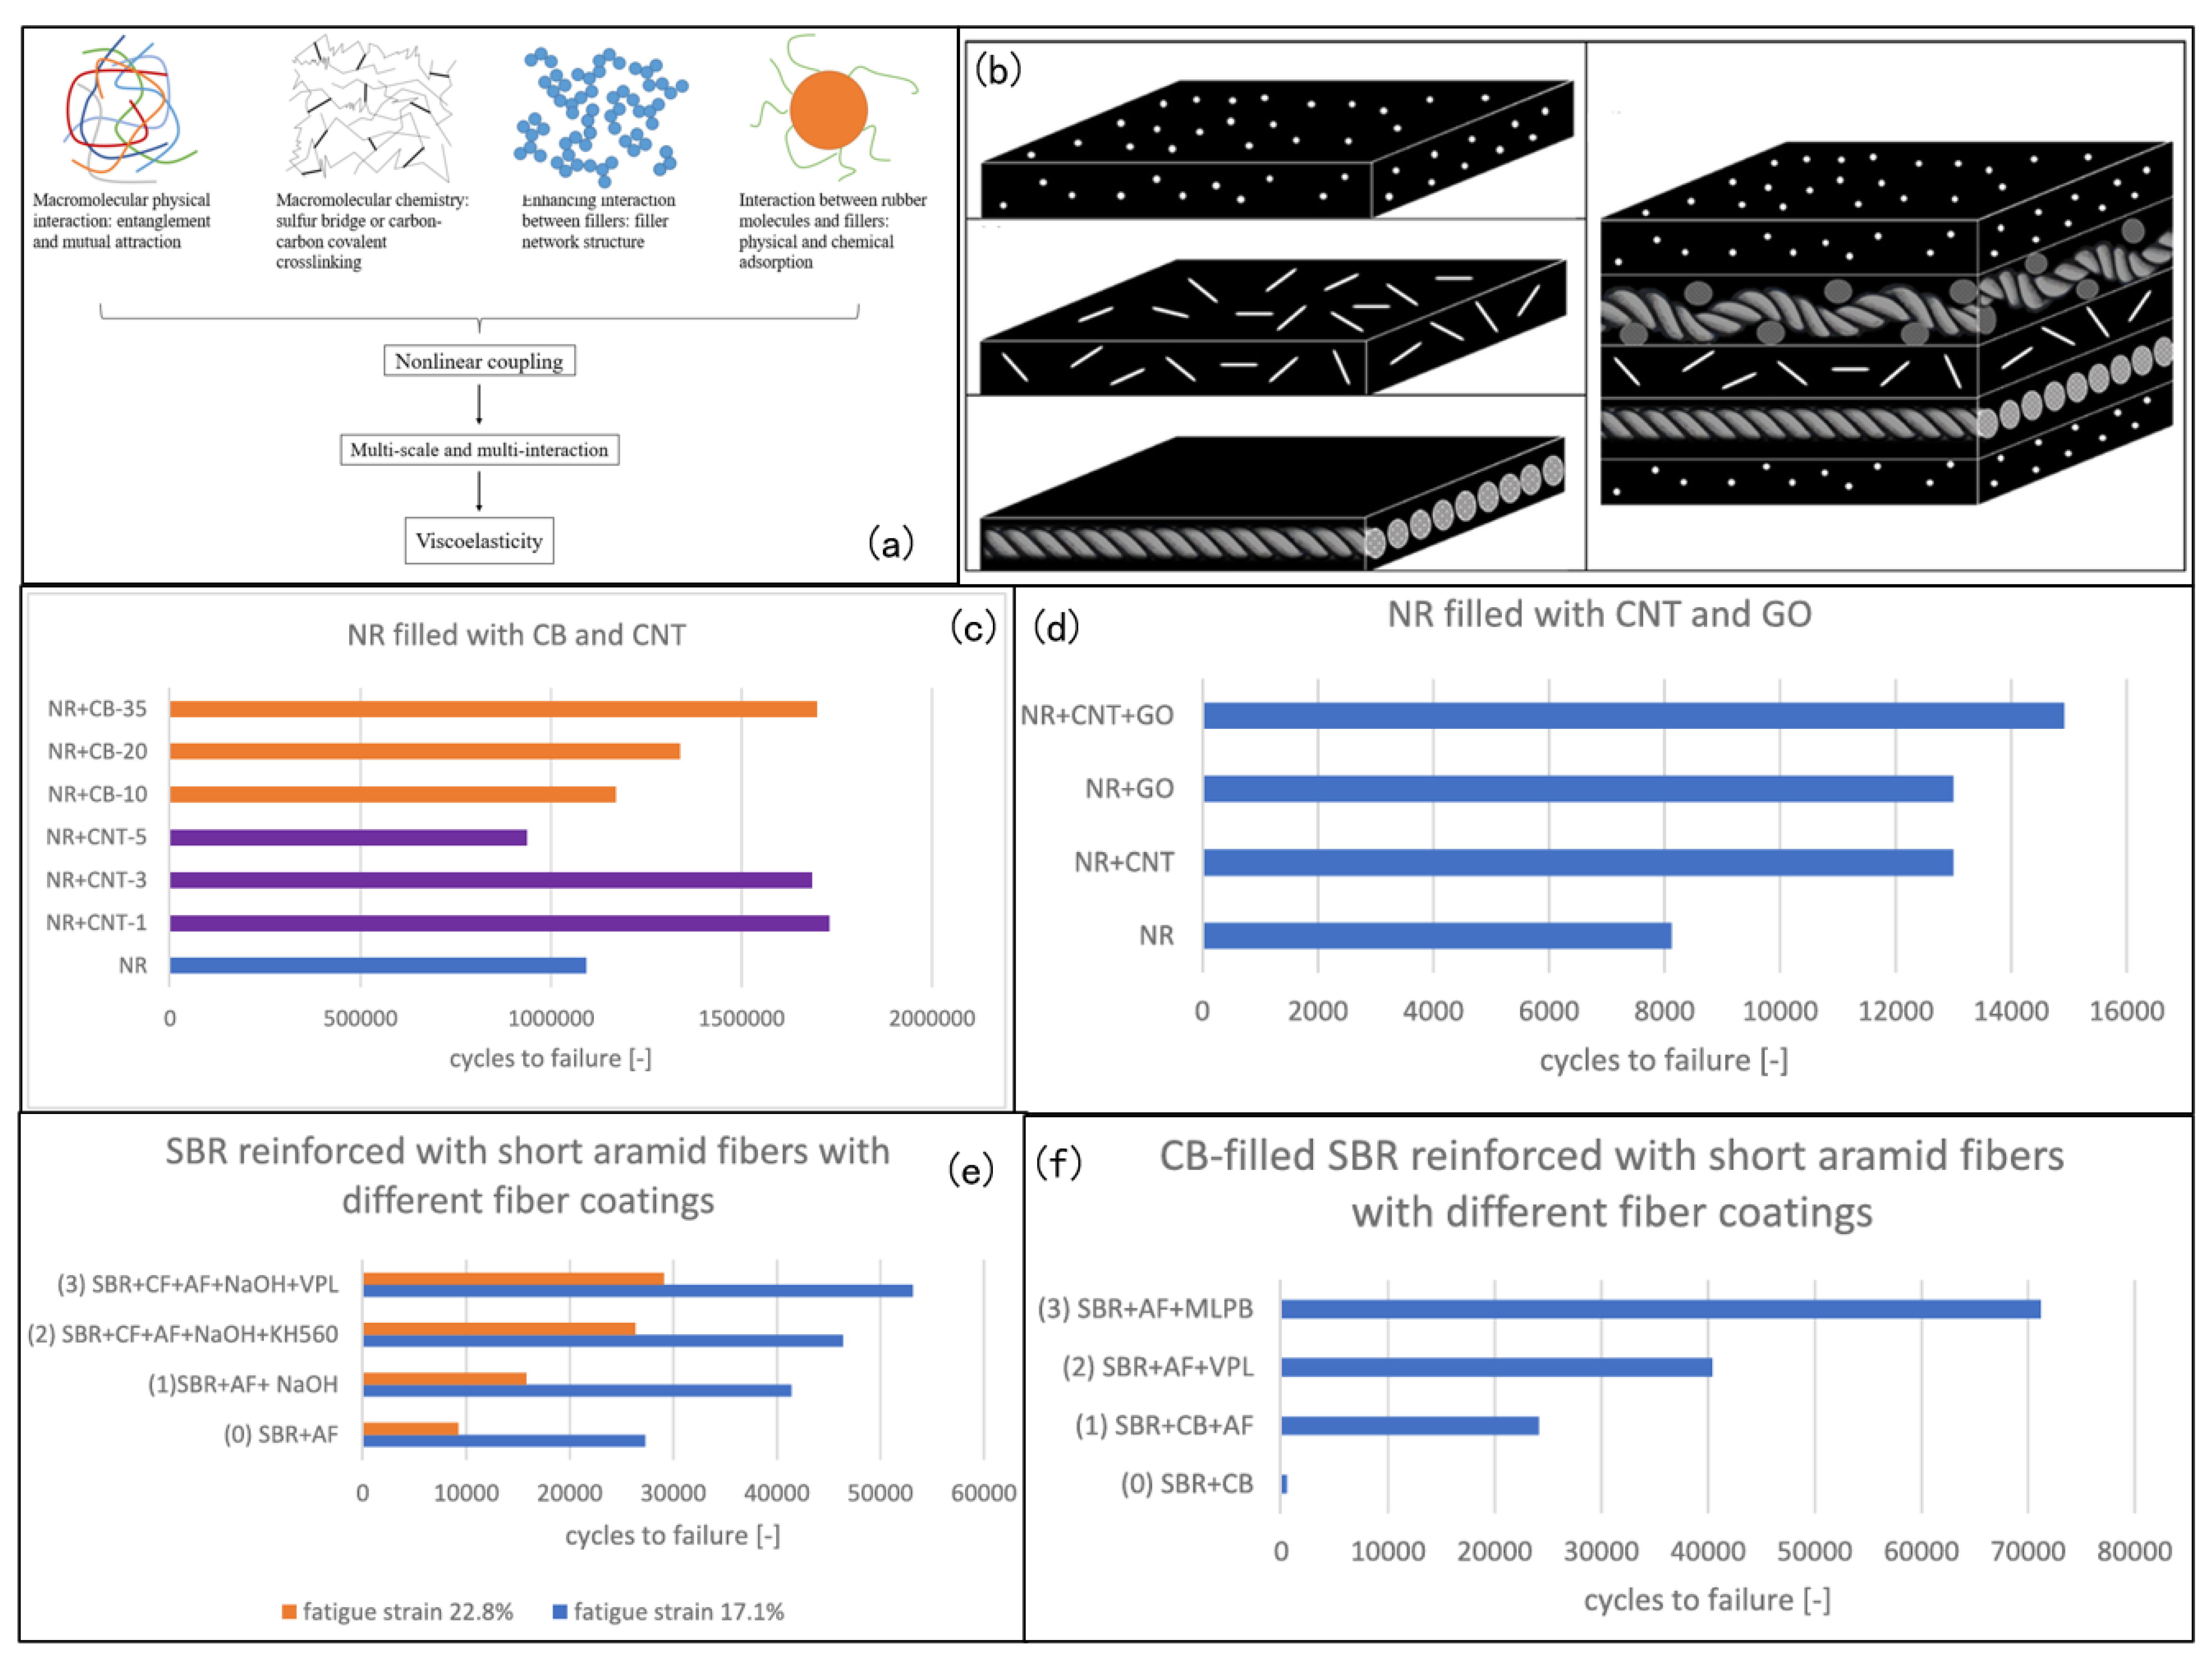

Disclaimer/Publisher’s Note: The statements, opinions and data contained in all publications are solely those of the individual author(s) and contributor(s) and not of MDPI and/or the editor(s). MDPI and/or the editor(s) disclaim responsibility for any injury to people or property resulting from any ideas, methods, instructions or products referred to in the content. |
© 2026 by the authors. Licensee MDPI, Basel, Switzerland. This article is an open access article distributed under the terms and conditions of the Creative Commons Attribution (CC BY) license.