


Abstract
Background/Objectives: The measurement of radiotracer uptake in specific organs has potential clinical implications. However, manual delineation is time-consuming. We aimed to evaluate the agreement between manual delineation and automatic segmentation by the artificial intelligence model TotalSegmentator for extraction of standard uptake values (SUVs) from [18F]FDG-PET/CT scans for the aorta, spleen, lumbar spine bone marrow, liver, and superior vena cava. Methods: The aorta, spleen, lumbar spine bone marrow, liver, and superior vena cava were segmented manually by trained physicians and automatically by the TotalSegmentator version 2.4 software, and the correlations between SUV values obtained were assessed. Results: We found good agreement between manually and automatically obtained SUVmean values for the aorta (manual/TotalSegmentator: 2.10/2.11), spleen (2.00/1.95), liver (2.53/2.37), lumbar spine bone marrow (1.88/1.85), and superior vena cava (2.02/1.88) with high correlation coefficients across all organs, ranging from 0.93 to 0.99 and high intraclass correlation coefficients (ICCs) of 0.81–0.99. Agreement for SUVmax showed greater variability across the organs which were assessed: agreement was good for the spleen (ICC 0.83) and lumbar spine bone marrow (ICC 0.86), but weak for the aorta (ICC 0.11). Bland–Altman analyses for SUVmean indicated no systematic bias in the aorta or spleen, slight bias in bone marrow, liver, and superior vena cava, and variable bias for SUVmax across all structures. Conclusions: TotalSegmentator provided reliable SUVmean values from the aorta, spleen, lumbar spine bone marrow, liver, and superior vena cava. However, the agreement between manually and automatically obtained SUVmax values was variable, suggesting that additional quality control steps should be applied if using TotalSegmentator for SUVmax extraction.
1. Introduction
Quantitative assessment of organ-specific uptake of 2-deoxy-2-[18F]fluoro-D-glucose ([18F]FDG) with positron emission tomography and computed tomography (PET/CT) has emerged as a potential clinical imaging biomarker. Organ-specific [18F]FDG uptake has demonstrated prognostic value and potential utility for disease characterization in malignant, autoimmune, and cardiovascular disorders [1,2,3,4,5].
The quantification of organ-specific [18F]FDG uptake may be particularly relevant in immune-mediated diseases. Studies have demonstrated increased [18F]FDG uptake in spleen, bone marrow, arterial walls and subcutaneous fat, interpreted as a sign of systemic inflammation, e.g., in patients with psoriasis and rheumatoid arthritis [3,6,7,8,9]. Accordingly, if robust and clinically feasible methods for quantifying organ-specific [18F]FDG uptake become available, such measurements may provide complementary information on systemic inflammatory activity beyond focal, disease-specific inflammatory lesions.
The [18F]FDG uptake in specific anatomical structures can be semi-quantified using standard uptake values (SUVs). The SUV is calculated based on the measured tissue activity concentration, divided by the administered [18F]FDG dose, normalized to body weight [10]. It is usually reported as the mean SUV within an organ/volume (SUVmean) and/or the highest voxel value (SUVmax) [10,11], often normalized to the [18F]FDG uptake in the liver or central venous blood pool [11,12].
Quantification of organ-specific SUV requires delineation of the organ or anatomical structure of interest, typically defined as a volume of interest (VOI) or region of interest (ROI). In clinical or research settings, this delineation is often performed manually, which can be an extremely time-consuming process, especially for larger structures [13]. To overcome the limitations of manual delineation, several automated deep learning-based segmentation tools have been developed and applied across a broad range of tasks, including organ segmentation, body composition assessment, and tumour delineation [14,15,16,17,18].
Among these is TotalSegmentator, an open-source, artificial intelligence (AI) model for automatic anatomical segmentation, built on the nnU-Net framework [16,19]. TotalSegmentator provides automatic segmentation of more than 100 anatomical structures on computed tomography (CT) images and has been widely adopted for research and clinical imaging applications. It has been extensively validated across large CT datasets and has shown high segmentation performance using geometric metrics such as Dice similarity coefficients and normalized surface distance as well as high reproducibility [16,20,21,22].
However, geometric agreement between automated and manual CT segmentations does not necessarily translate into agreement in PET-derived quantitative biomarkers, since SUV measurements are potentially sensitive to small differences in segmentation boundaries, spatial resolution, and registration of the PET relative to the CT.
To date few studies have explored whether TotalSegmentator segmentations provide quantitatively equivalent PET-derived SUV measurements compared with established manual ROI methods, with existing evidence restricted to a very limited number of organs [21,23]. Therefore, the aim of this study was to evaluate the agreement between SUV measurements derived from manual and TotalSegmentator-based segmentations of the aorta, spleen, lumbar spine bone marrow, liver, and superior vena cava in patients with active polymyalgia rheumatica or previous malignant melanoma.
2. Materials and Methods
This cross-sectional study included 38 individuals who had a [18F]FDG-PET/CT scan performed as part of a clinical study of patients with active polymyalgia rheumatica (PMR) or as part of regular follow-up after radical resection of localized malignant melanoma.
The SUVs in the aorta, spleen, lumbar spine bone marrow, liver, and superior vena cava were obtained by delimiting the ROIs by manual delineation as well as by automatic segmentation with TotalSegmentator, after which agreement between the two methods was assessed.
2.1. [18F]FDG-PET/CT Acquisition and Analysis
All patients included in the study fasted at least 4 h prior to tracer administration (3 MBq kg−1) and were not permitted strenuous exercise during the 24 h before tracer injection. No patient had a blood glucose level exceeding 7 mmol/L. After one hour of resting post-tracer injection, a low-dose CT scan was performed from skull to mid-thighs for anatomical mapping and attenuation correction. Of the 38 patients included, 35 were scanned on a Long axial Field-of-View (LAFOV) PET/CT Biograph Vision Quadra (Siemens Healthineers, Knoxville, TN, USA) and 3 patients were, for logistical reasons, scanned on a Standard axial Field-of-View (SAFOV) PET/CT Biograph Vision 600 (Siemens Healthineers, Erlangen, Germany). PET acquisition time was 3 min per bed (26 cm) for the SAFOV and 5 min (one bed, 106 cm) for the LAFOV PET/CT. PET attenuation-corrected images were reconstructed using 3D ordinary Poisson-ordered subsets expectation maximization with point spread modelling using 2 iterations, 21 subsets, and 4 iterations, 5 subsets into 440 × 440 matrices at 1.65 mm × 1.65 mm voxels for the SAFOV and LAFOV PET/CT, respectively. A Gaussian post-filter of 2 mm was applied using the scanner’s software (Syngo VB30/VG80). CT was sliced-matched at 2 mm thickness reconstructed at 512 × 512 pixels with a FOV of 500 mm for an inplane pixel size of 0.97 mm × 0.97 mm. Seven patients had a diagnostic CT with intravenous contrast. In these cases, the low-dose unenhanced CT was used for attenuation correction only.
2.2. Manually Obtained Standard Uptake Values
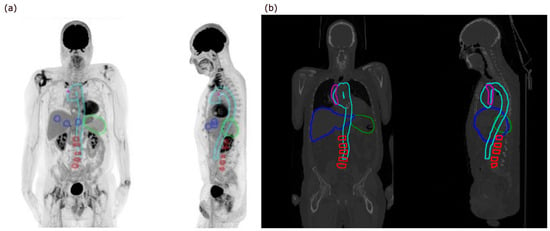
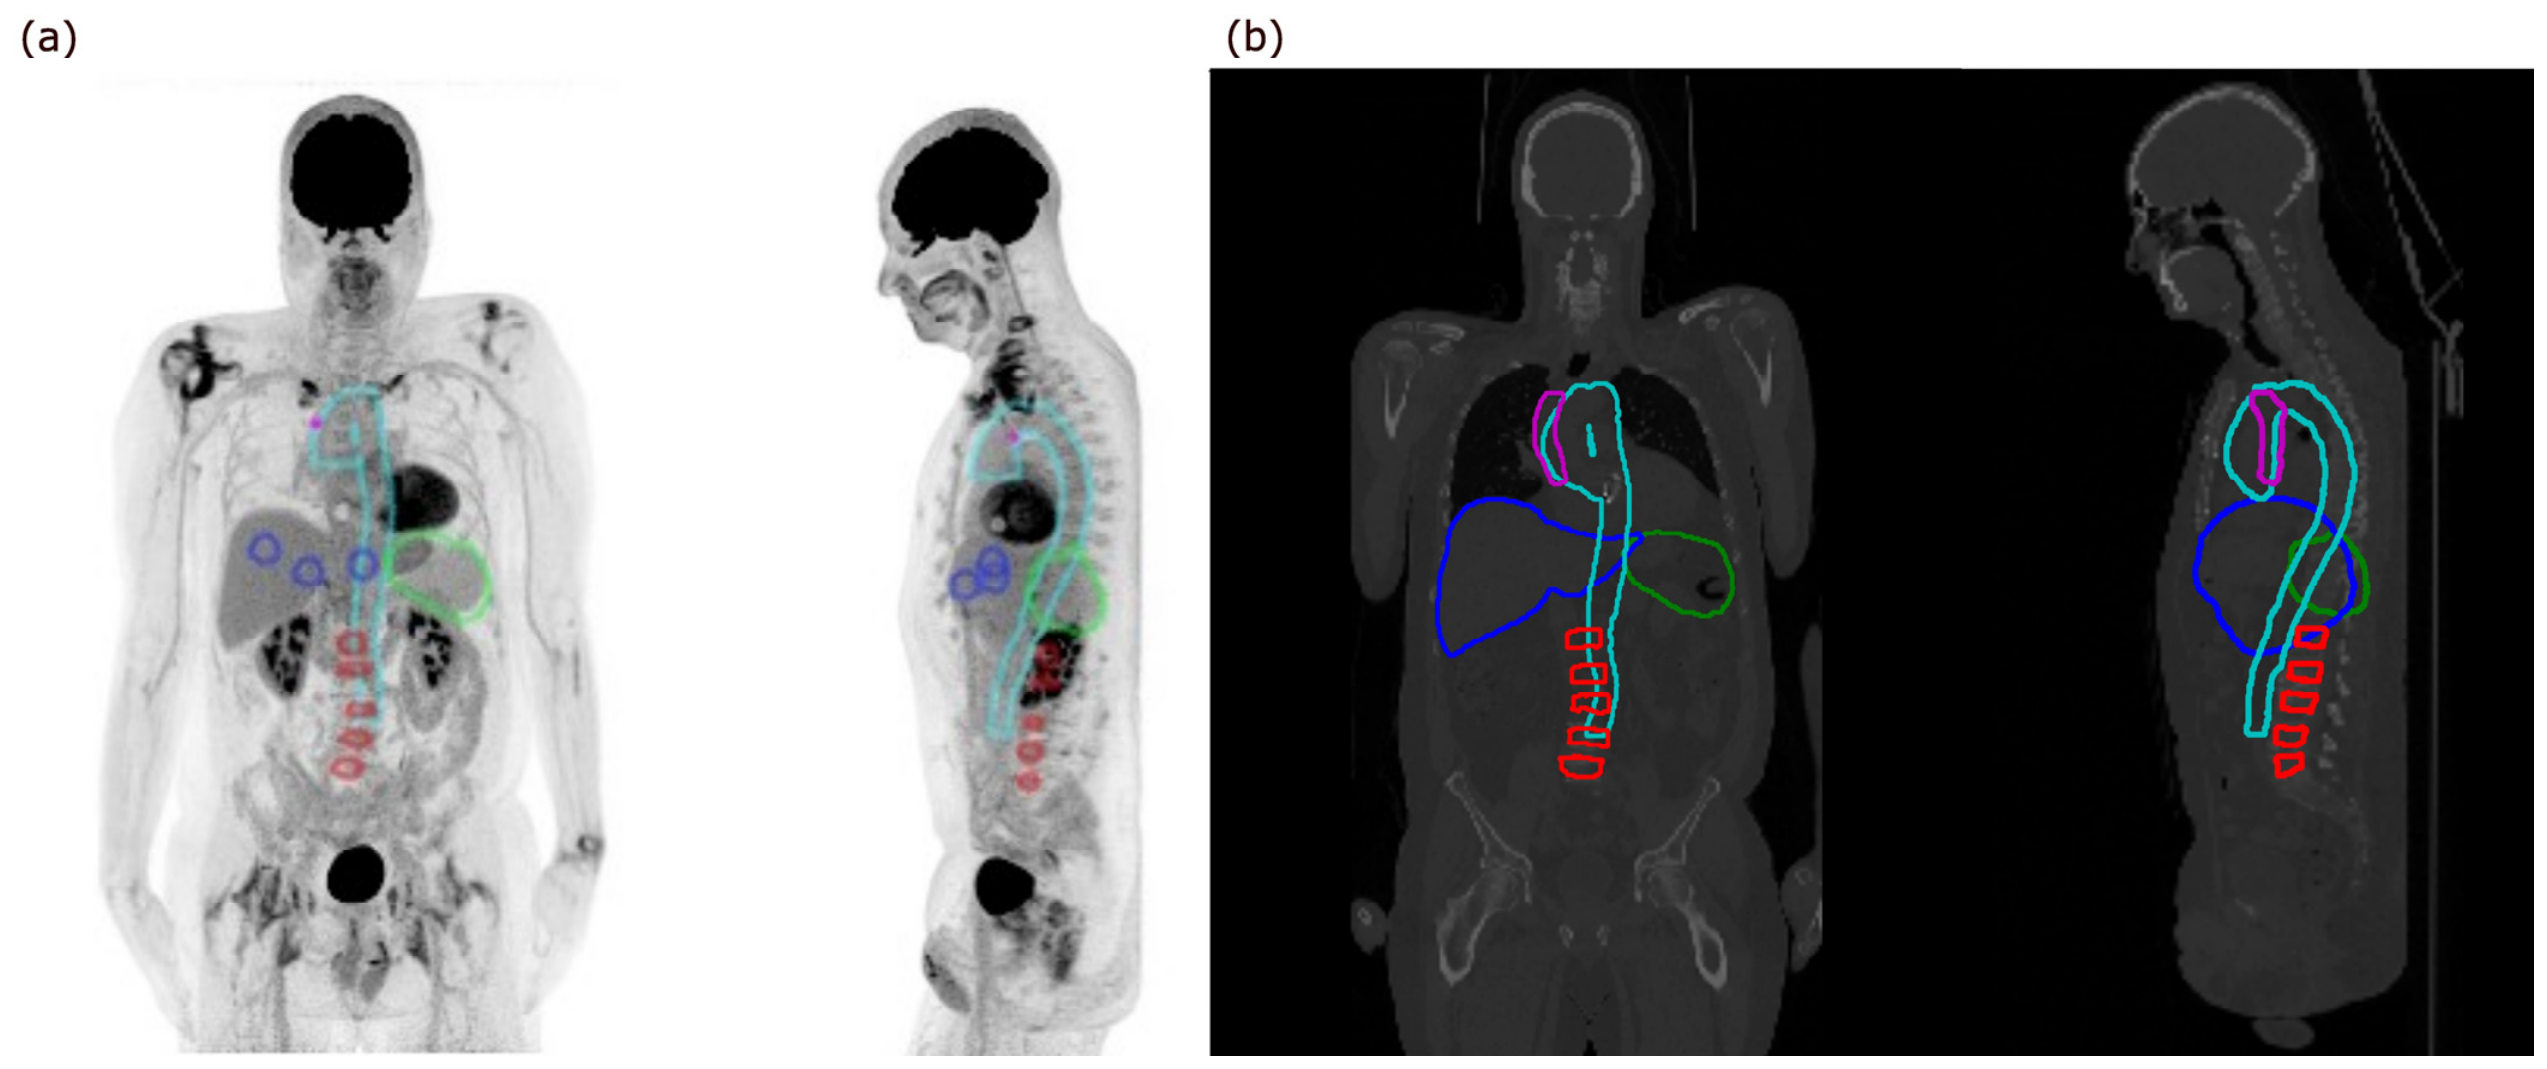
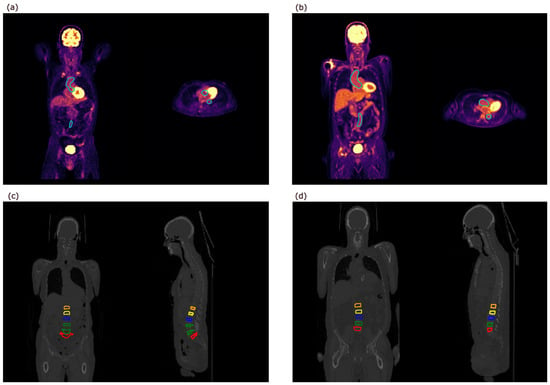
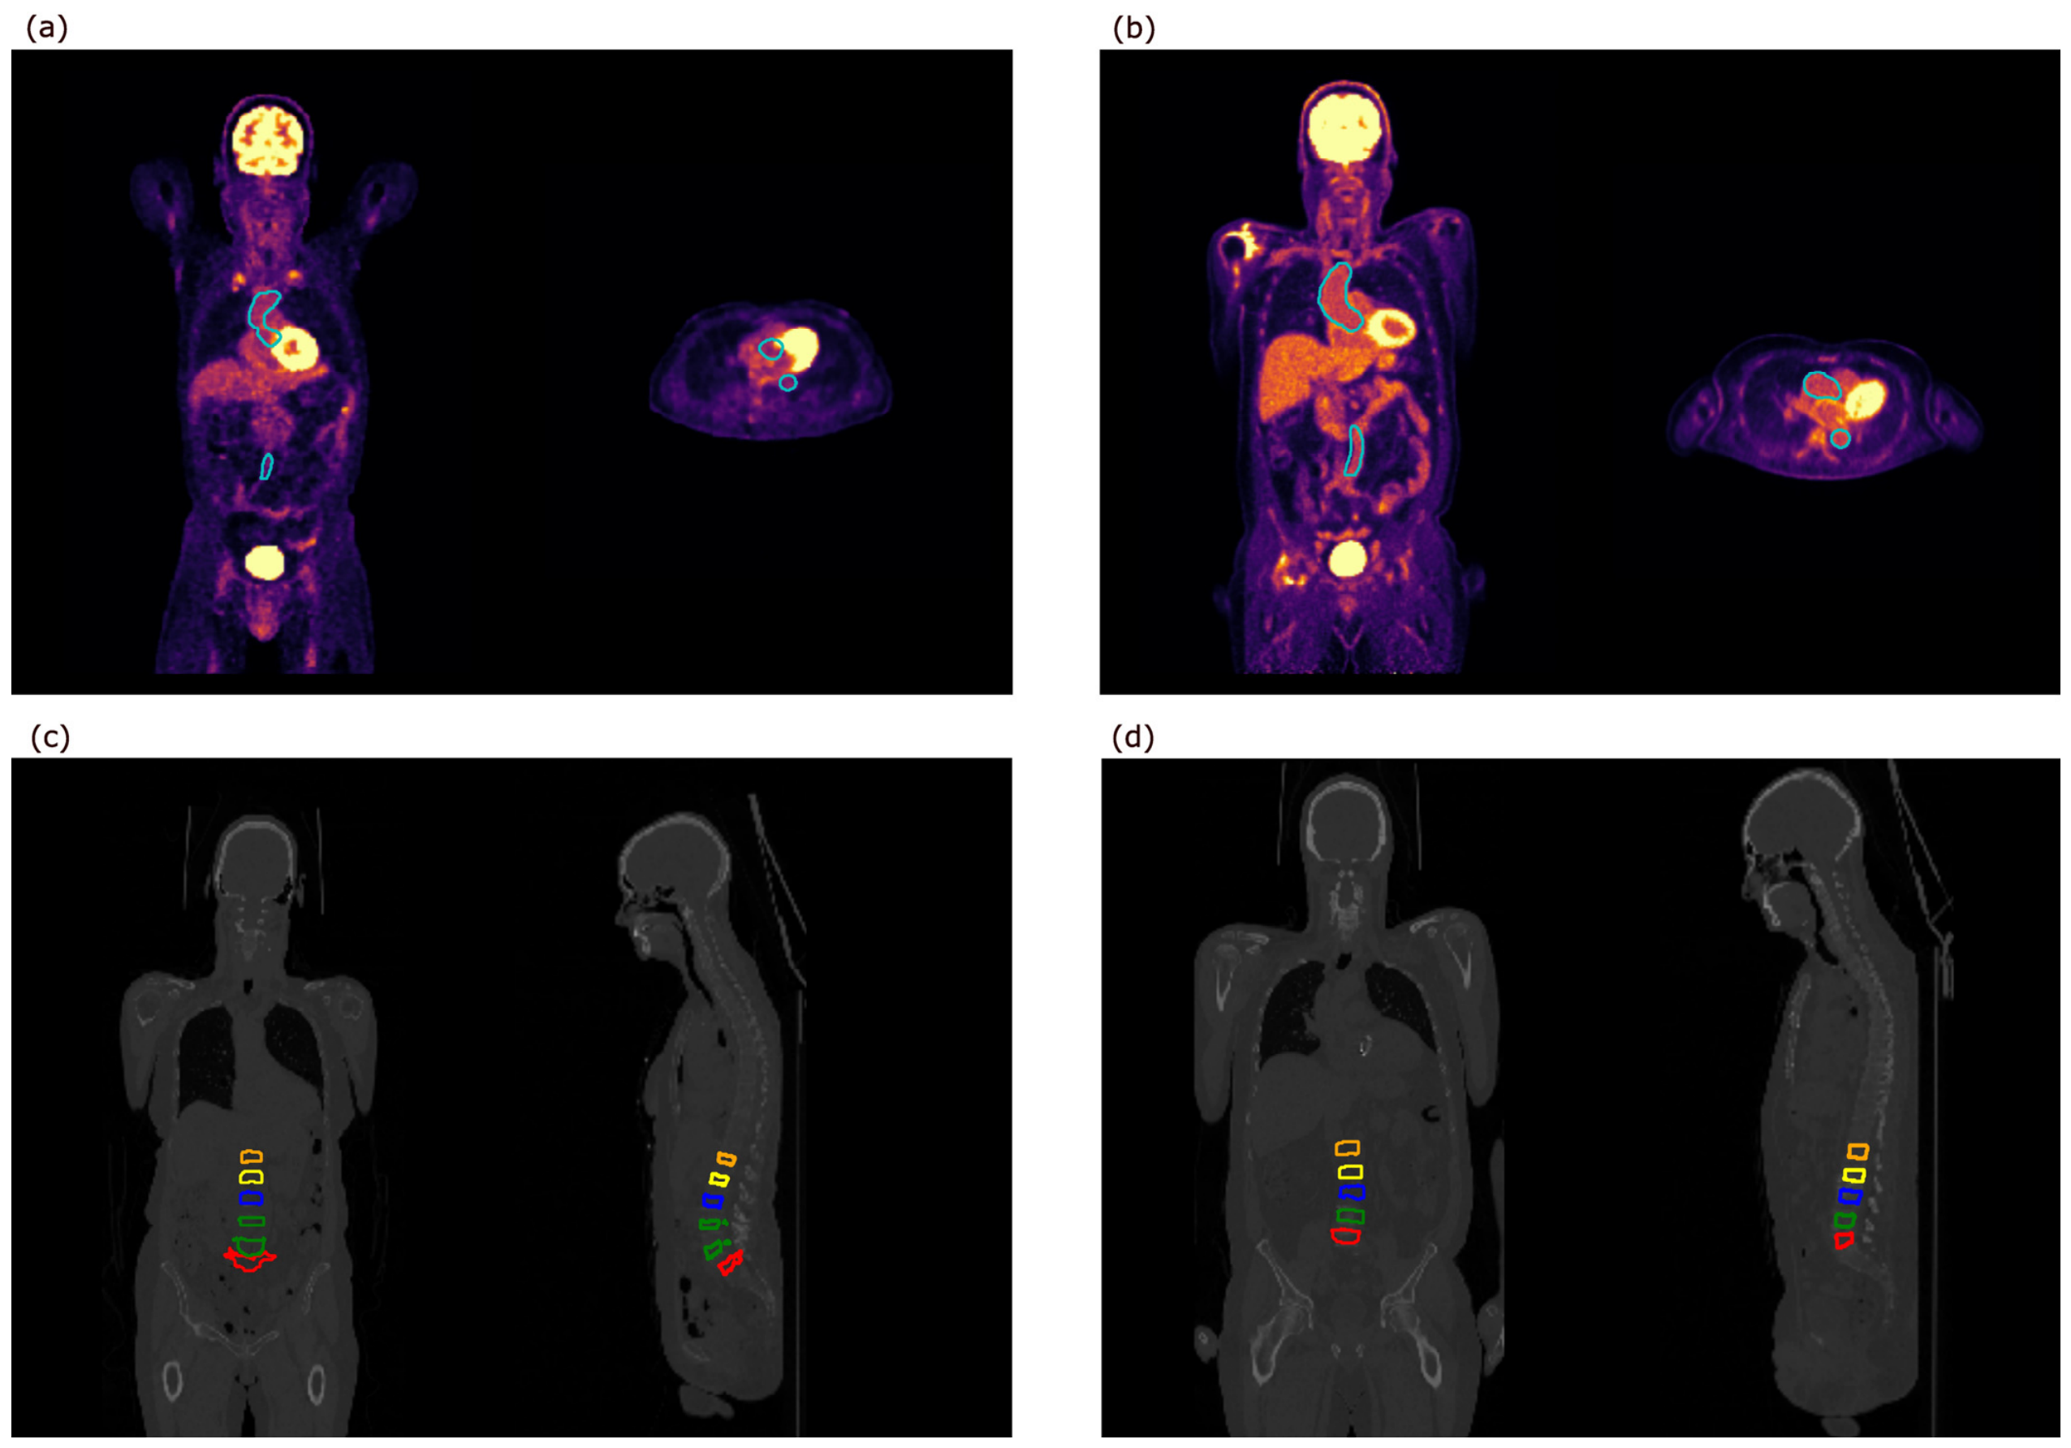
The ROIs were manually drawn on the CT axial images in RTx Advanced–Fusion and Contouring (version 1.8, Mirada Medical Ltd., Oxford, UK), and SUV measurements were subsequently extracted from the co-registered PET images. Manual delineation was performed by two trained physicians (TFG and JMB). Subsequently, these ROIs were copied onto the spatially aligned PET images to extract PET quantification values. One physician (TFG) delineated the aorta and lumbar spine bone marrow for all 38 scans, while the other (JMB) delineated the liver, spleen, and superior vena cava for all 38 scans. The aorta and spleen were delineated in full in 3D. In the liver, three non-overlapping spherical ROIs with a diameter of 3 cm were placed in the liver parenchyma, two in the right liver lobe, and one in the left, equivalent to normal clinical practice and previous methodological studies [3,12]. If the left liver lobe was very small, all three ROIs were placed in the right lobe. If any liver cysts were present, these were avoided. An example of all ROIs is shown in Figure 1a. The SUVmean was calculated as the mean value of the SUVmean from the three ROIs. In the superior vena cava, three small ROIs were placed in the lumen. The SUVmean was calculated as the mean value of the SUVmean from the three ROIs [11]. To obtain SUVs in bone marrow, one spherical ROI was placed in the corpus of each vertebrae, L1-L5, encompassing as much of the vertebral body containing bone marrow as possible, while avoiding the bone cortex [3,4,5]. The SUVmean was calculated as the mean value of the five SUVmean values obtained from each of the vertebrae. The SUVmax value was calculated as the mean value of the five SUVmax values obtained from each of the vertebrae [3].
Figure 1.
Example of regions of interest (a) manually delineated and (b) segmented by TotalSegmentator. Colour codes: Light blue, aorta; green, spleen; dark blue, liver; red, lumbar spine bone marrow; purple, superior vena cava.
2.3. Standard Uptake Values Obtained by Automatic Segmentation
TotalSegmentator version 2.4 was used to extract structure masks matching the manual segmentation from the CT part of the PET/CT examination. The software was installed in a Linux environment on a standard Lenovo p330 workstation using an Nvidia Quadro P5000 GPU with 16 GB memory (NVIDIA Corp., Santa Clara, CA, USA). TotalSegmentator was used with the default model for the selected structures and processed using a GPU. To reduce the computational load of TotalSegmentator, the argument “force_split” was used, which splits the image into three parts. The individual parts are then segmented sequentially and afterwards merged into a final segmentation mask. PET and CT images were pre-registered by the scanner software. The PET images were subsequently resampled to the CT image space in Python version 3.12.3 using the nilearn library’s “resample_img” function with the default interpolation setting “continuous”.
As TotalSegmentator does not include a specific bone marrow model, eroded masks of the vertebrae L1-L5 were used as a surrogate for bone marrow, with erosion of 4 mm applied in-plane and 6 mm applied axially to exclude most of the compact bone structure.
[18F]FDG SUVmean and SUVmax were automatically extracted from the PET images by applying the CT-derived TotalSegmentator masks. An example of the segmentations is shown in Figure 1b. All values were manually reviewed, and any deviations prompted visual inspection of the segmentations to assess potential segmentation errors or spill-in from adjacent structures. To evaluate the impact of boundary regions on SUVmean measurements and improve comparability with the centrally placed manual ROIs in the liver and superior vena cava, additional measurements were obtained from eroded TotalSegmentator-derived masks. The masks were eroded by 15 mm for the liver and 2 mm for the superior vena cava. These depths were chosen in relation to organ size to remove boundary voxels while preserving a representative organ volume.
2.4. Statistical Analysis
The agreement between manually and automatically obtained SUV values was assessed using scatterplots and correlation analysis. SUVmean was compared for all organs, and SUVmax was compared for the aorta, spleen and lumbar spine bone marrow. Depending on the distribution of the data and the presence of outliers, either Pearson’s (with 95% confidence intervals [CI]) or Spearman’s correlation coefficient was calculated. The choice of method was guided by visual inspection of linearity and normality assumptions, based on scatterplots, histograms and QQ-plots. Furthermore, intraclass correlation coefficients (ICC) were calculated using a two-way mixed-effects model for absolute agreement and single measurements [ICC(A,1)].
To evaluate potential systematic differences between the two segmentation methods, Bland–Altman analyses were performed. Because the differences between the two methods were not normally distributed in any of the investigated structures, we used Bland–Altman plots with non-parametric limits of agreement. However, if signs of proportional bias were identified, regression-based Bland–Altman plots were used instead. For the non-parametric Bland–Altman analyses, bias was defined as the median difference between methods, and limits of agreement were defined as the 2.5th and 97.5th percentiles of the distribution of differences. For regression-based Bland–Altman analyses, fixed limits of agreement were not applicable because agreement varied across the measurement range. Therefore, regression parameters (intercept and slope) with 95% CI are reported.
Bias was considered statistically significant if the 95% CI of the median difference did not include zero in the non-parametric Bland–Altman analysis, or if the 95% CI for the regression intercept or slope did not include zero in the regression-based Bland–Altman analysis. p-values below 0.05 were considered statistically significant.
All statistical analyses were conducted using RStudio (version 2024.04.02 + 764).
3. Results
Patient characteristics of the 38 included patients are summarized in Table 1. None of the participants had focal disease in the investigated organs. Furthermore, none of the patients with a history of malignant melanoma were receiving active cancer treatment at the time of the scan, and no signs of disseminated disease were observed on the PET/CT scans.
Table 1.
Patient characteristics.
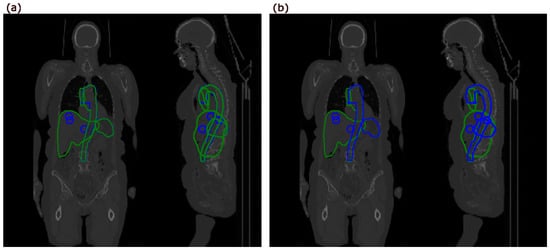
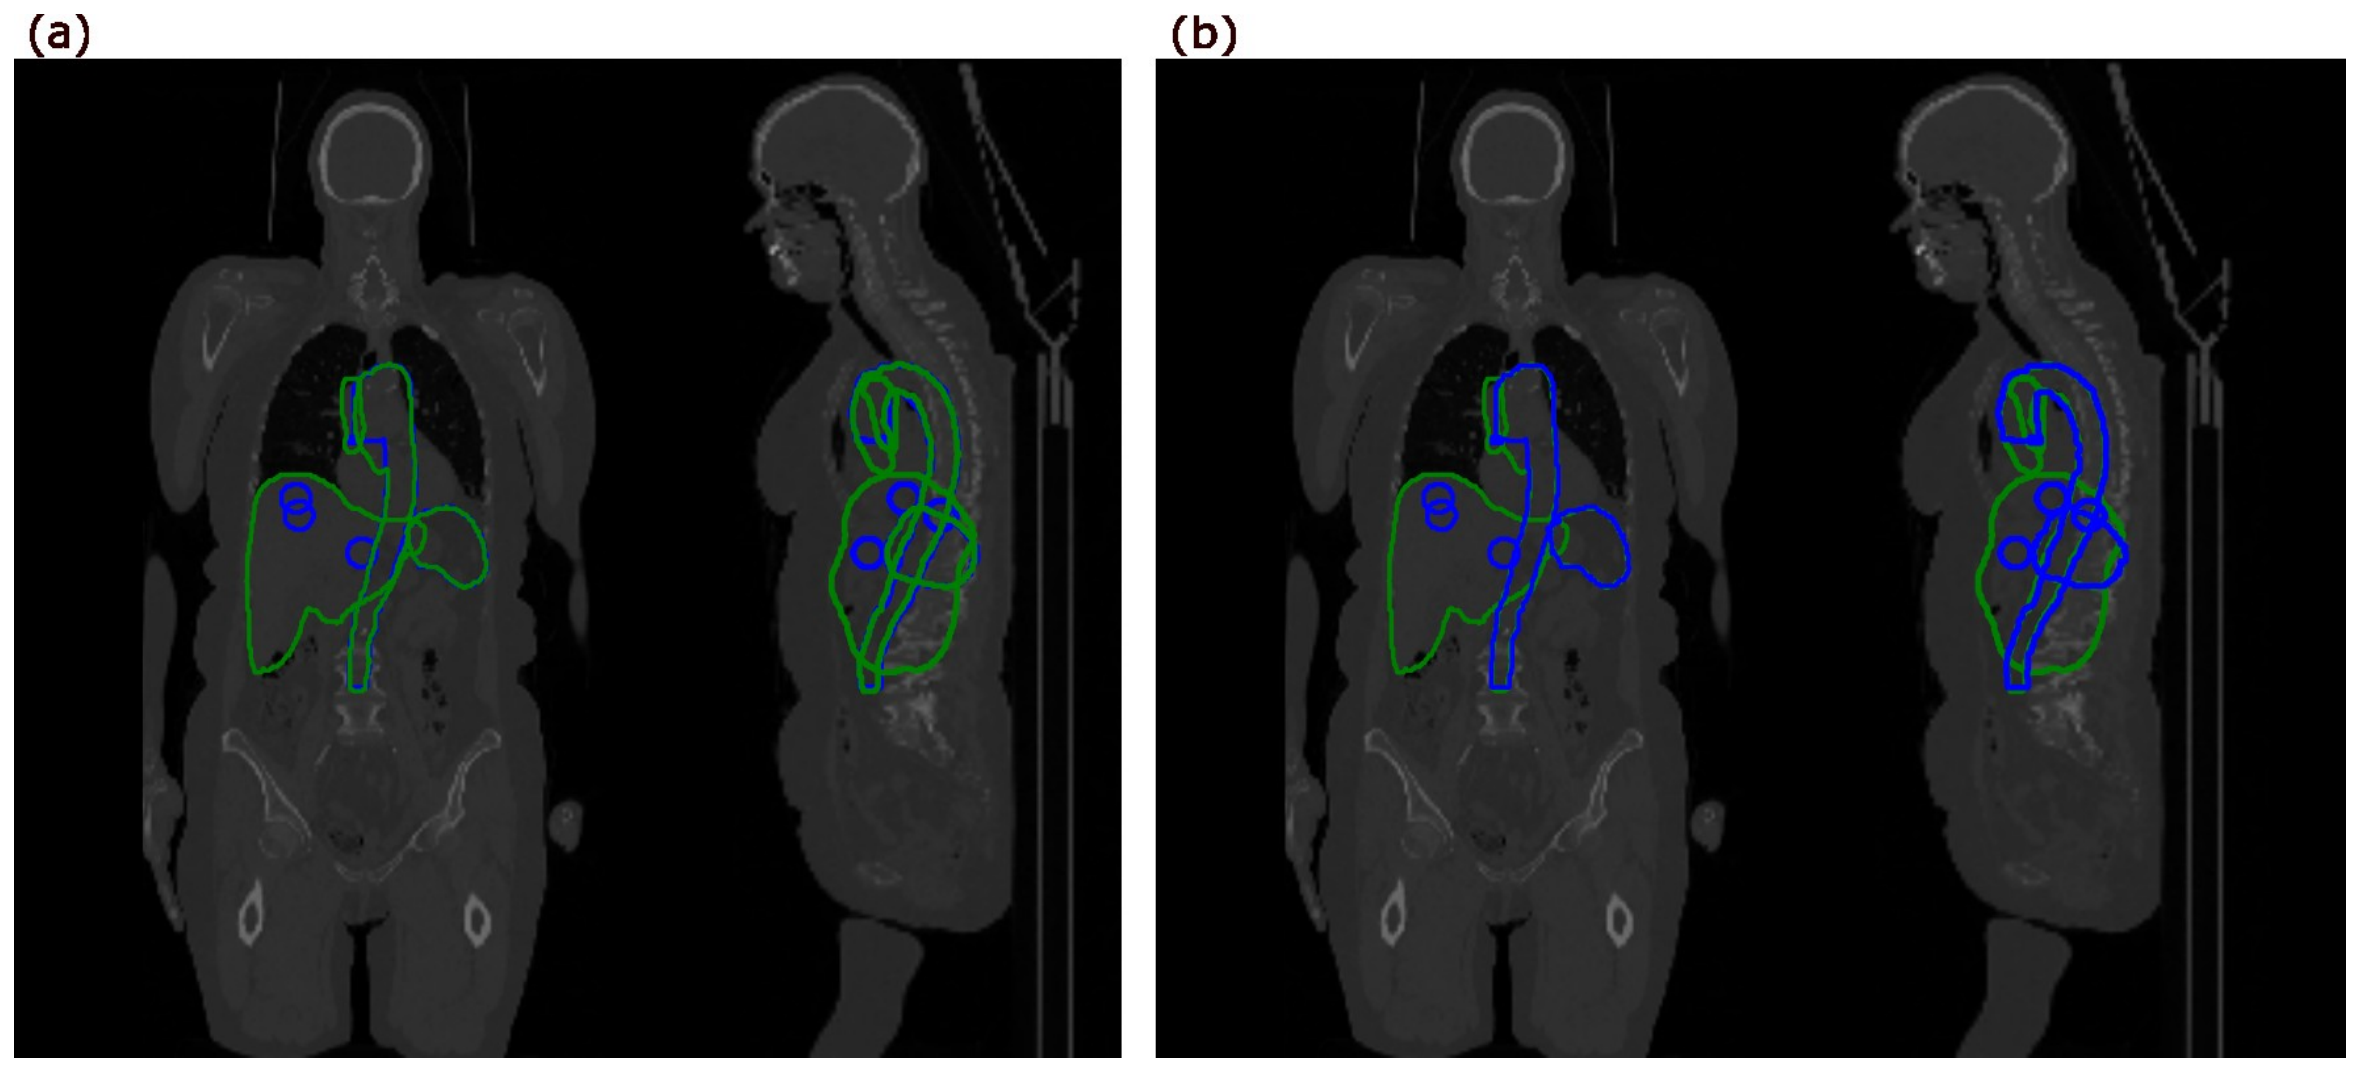
Representative overlay comparisons between manual and TotalSegmentator-derived segmentations of the aorta, spleen, liver, and superior vena cava are shown in Figure 2. The SUVs from the manually drawn ROIs and the ROIs segmented by TotalSegmentator are presented in Table 2.
Figure 2.
Overlay comparisons between manual and TotalSegmentator-derived segmentations of the aorta, spleen, liver, and superior vena cava with (a) TotalSegmentator-derived segmentations (green) overlaid on the manual delineations (blue) and (b) manual delineations overlaid on the TotalSegmentator-derived segmentations.
Table 2.
Comparison of manually and automatically derived SUV measurements across the investigated anatomical structures.
Visual inspection revealed minor segmentation errors in a small number of vertebrae, likely due to the use of the “force_split” argument. As the impact on the resulting SUV measurements was considered negligible, no corrections were applied in the primary analyses. However, to evaluate the robustness of the findings, sensitivity analyses excluding the affected cases were subsequently performed (Section 3.3).
3.1. SUVmean
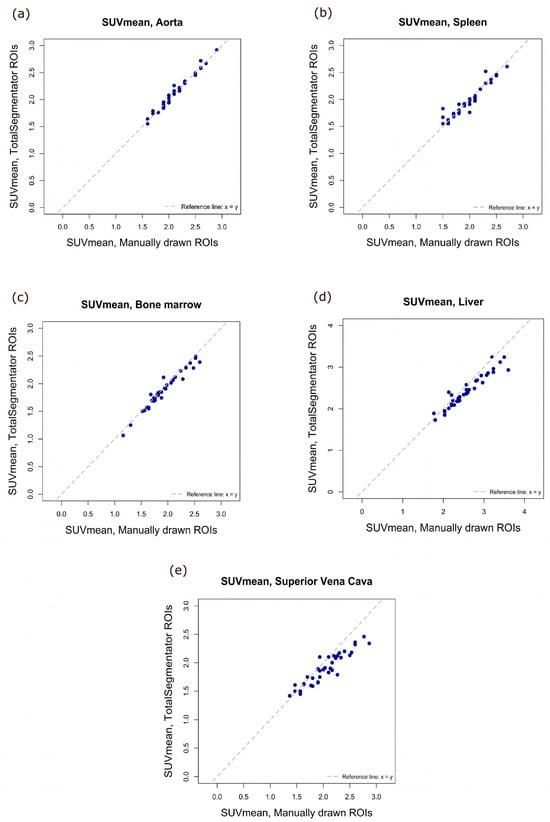
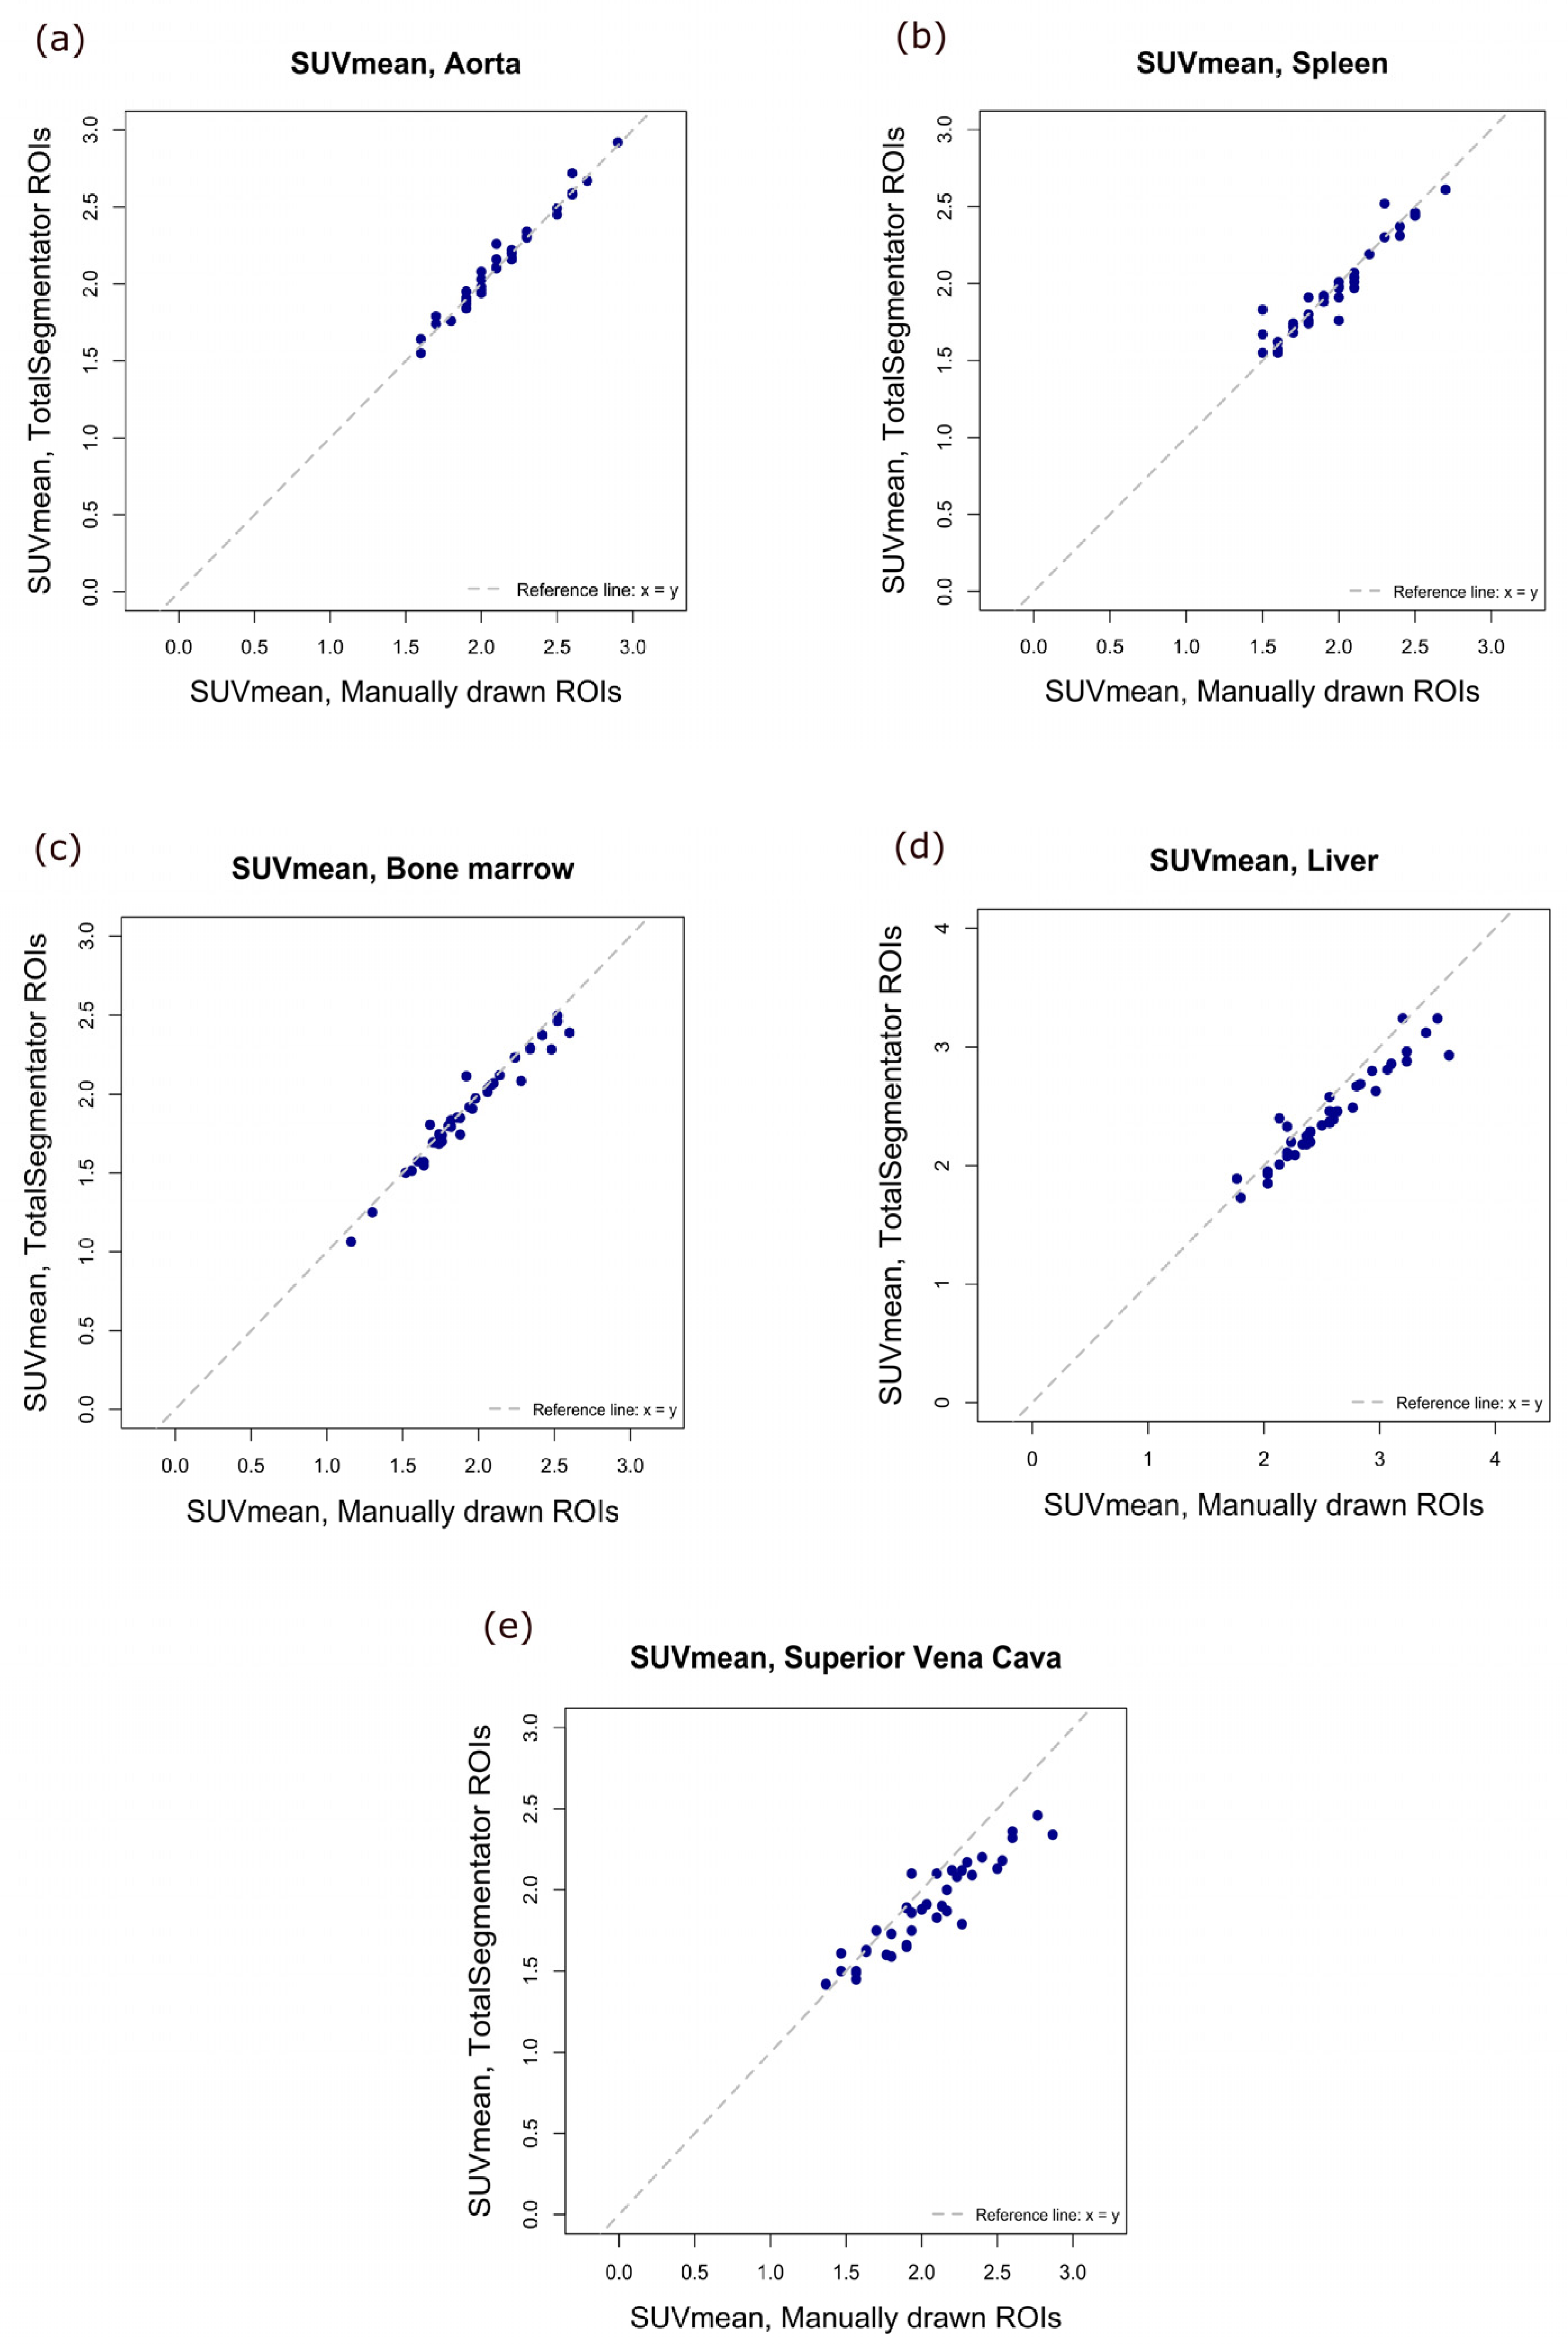
Scatterplots comparing manually and automatically obtained SUVmean values for the aorta, spleen, lumbar spine bone marrow, liver, and superior vena cava are shown in Figure 3. The SUVmean values, as well as Pearson correlation coefficients and ICCs, are presented in Table 2. All anatomical regions demonstrated very strong correlations between the two methods, with coefficients ranging from 0.93 to 0.99. The lower limit of the confidence interval fell below 0.9 only for the superior vena cava. All correlations were statistically significant (p < 0.0001). ICC analyses demonstrated good to excellent agreement across all structures, with excellent agreement (ICC > 0.90) for the aorta, spleen and lumbar spine bone marrow, whereas agreement was somewhat lower for the liver (ICC = 0.86, 95% CI 0.43–0.96) and superior vena cava (ICC = 0.81, 95% CI 0.27–0.93).
Figure 3.
Scatterplots of SUVmean values obtained by manual delineation versus by TotalSegmentator for (a) aorta, (b) spleen, (c) bone marrow, (d) liver, and (e) superior vena cava. SUVmean, mean standard uptake value; ROI, region of interest.
In a supplementary analysis, liver and superior vena cava masks were eroded prior to SUVmean extraction to evaluate the influence of organ boundaries and improve comparability with the centrally placed manual ROIs. Correlation coefficients remained largely unchanged for both structures (liver: 0.96 vs. 0.95; superior vena cava: 0.95 vs. 0.93). However, agreement improved substantially, with ICCs increasing to 0.95 (95% CI 0.90–0.98) for the liver and to 0.93 (95% CI 0.86–0.96) for the superior vena cava.
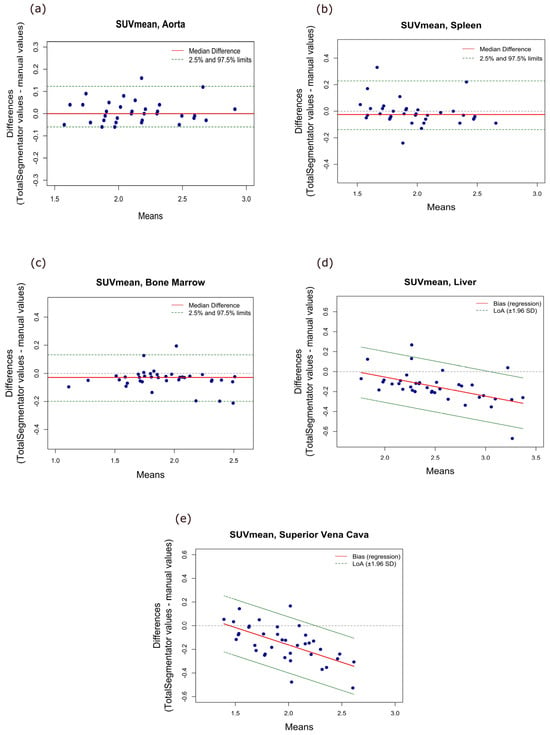
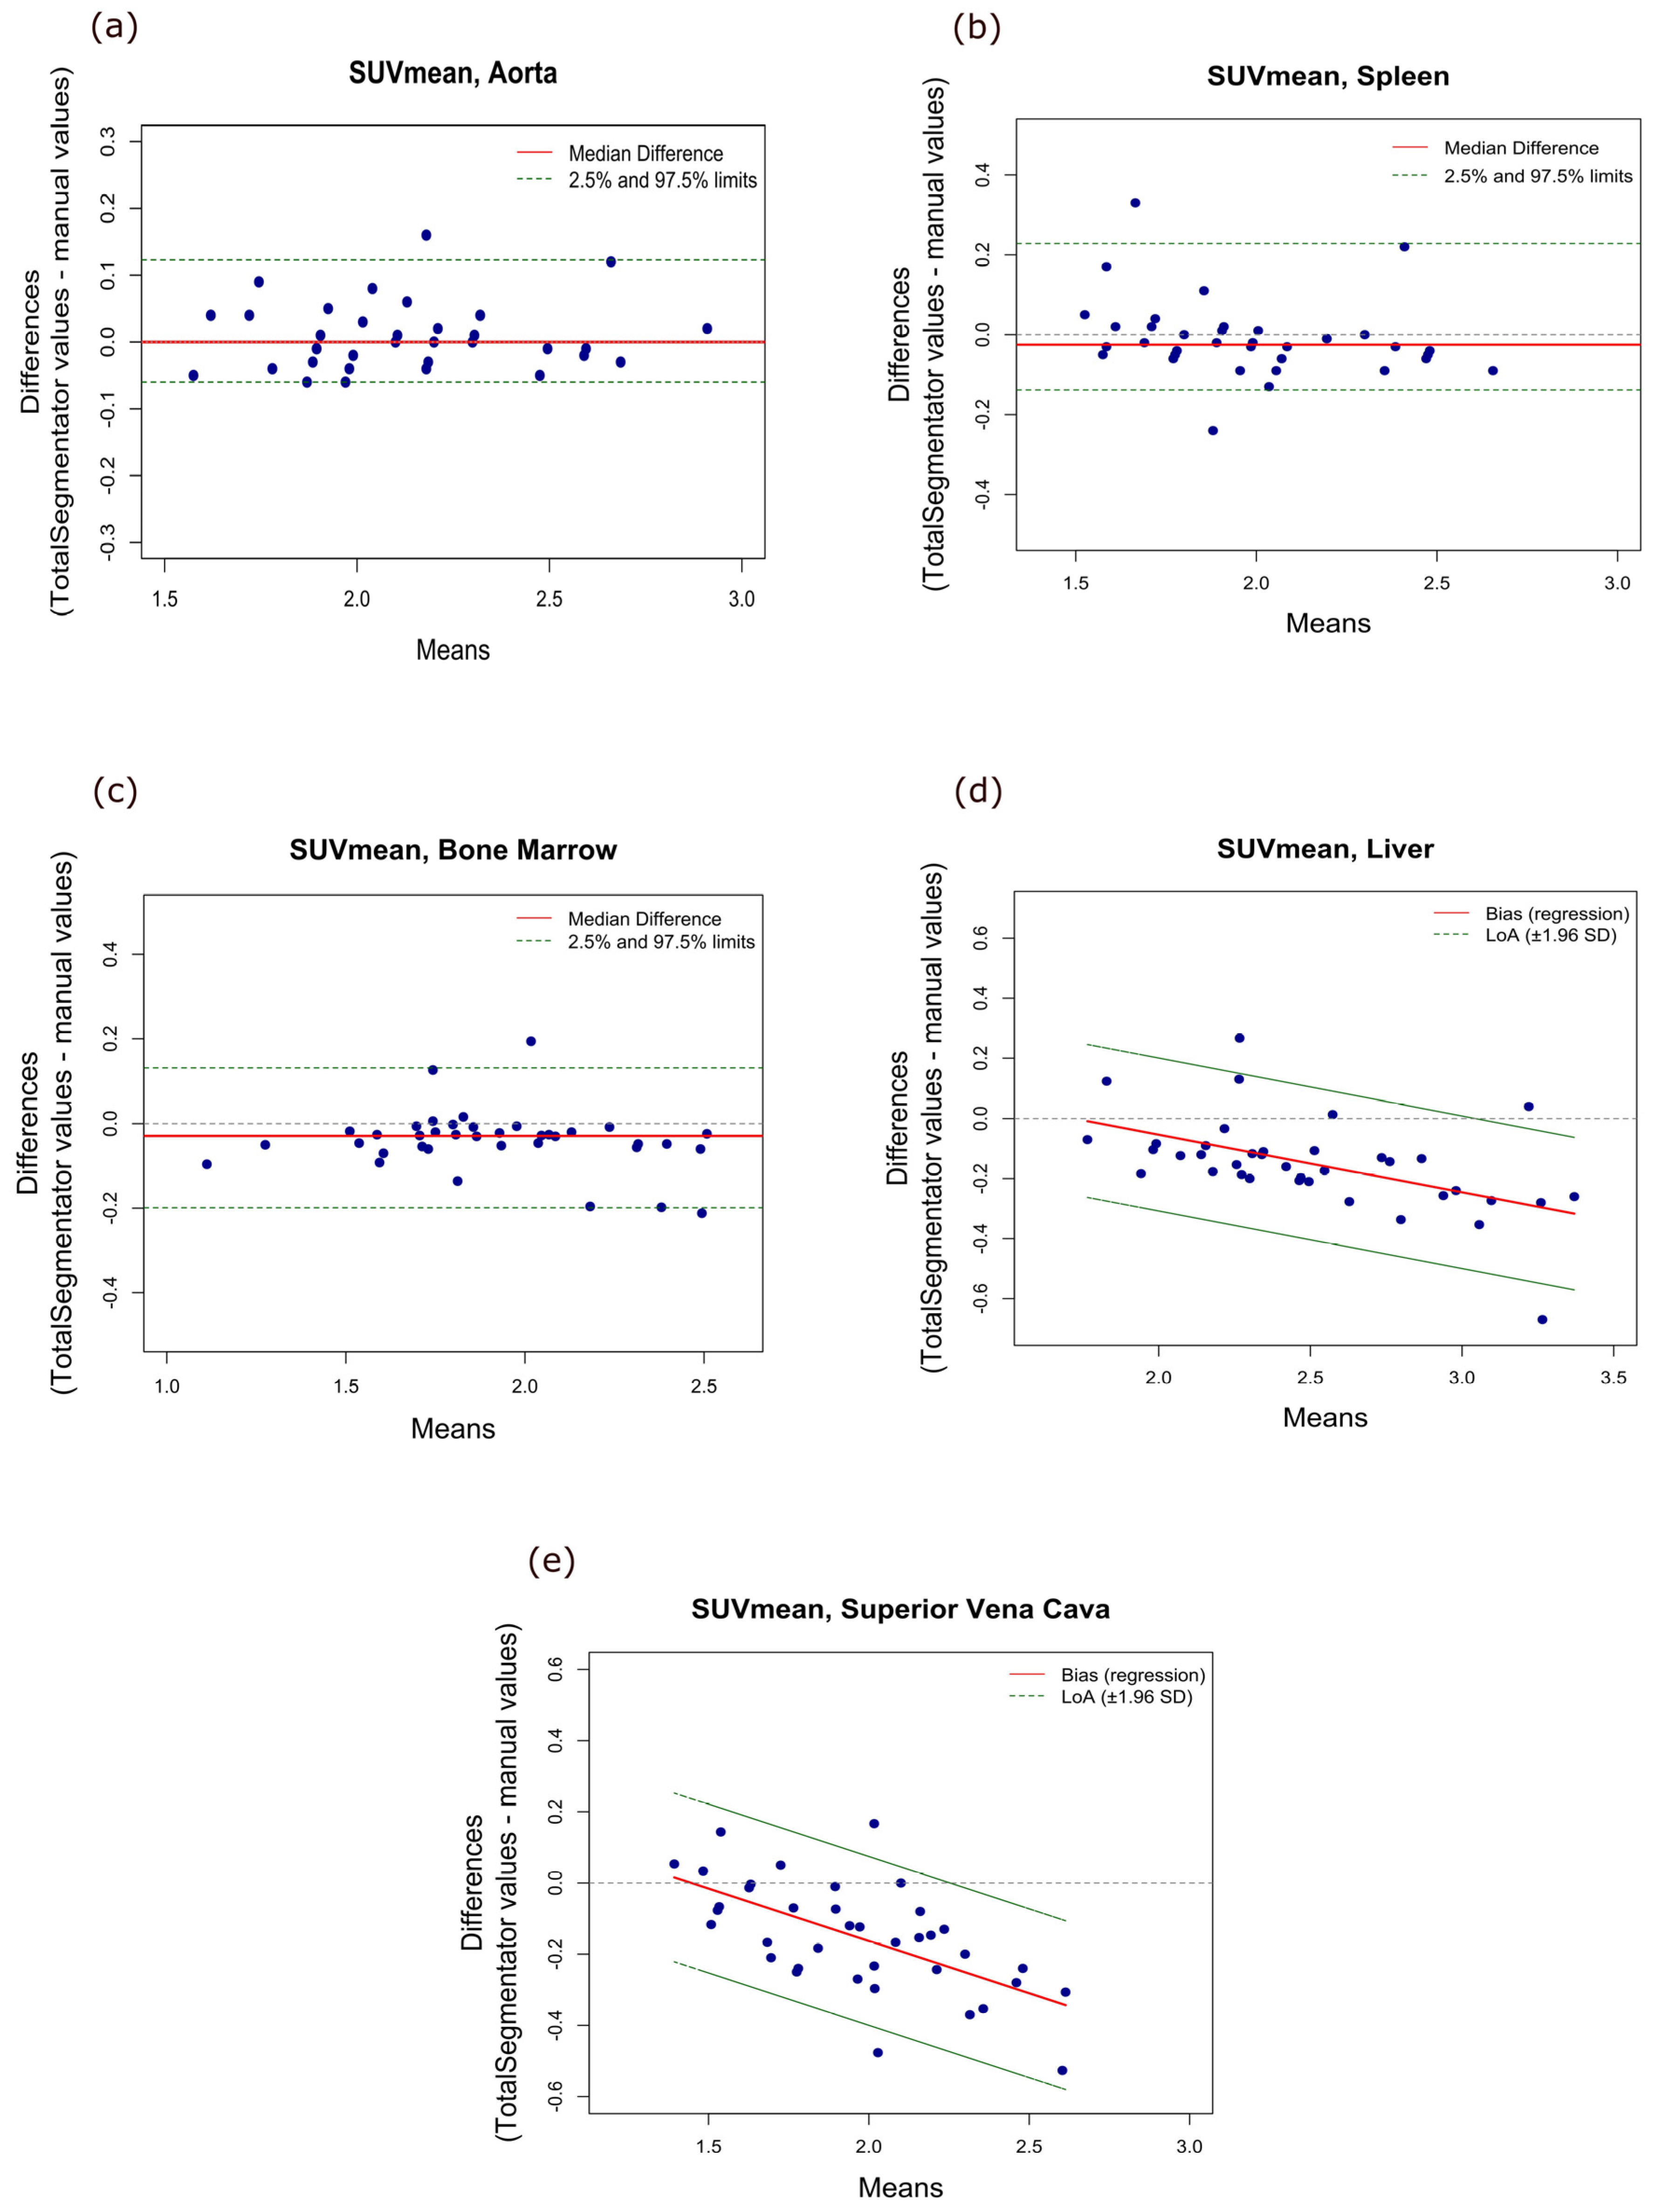
Bland–Altman analyses revealed no evidence of systematic bias for the aorta or spleen. The median difference between the two methods was 0.00 (95% CI −0.02–0.02) for the aorta and −0.025 (95% CI −0.05–0.00) for the spleen.
For the superior vena cava and liver, the analyses indicated statistically significant proportional bias with weakly positive intercepts of 0.43 (95% CI 0.18–0.67, p = 0.001) and 0.33 (95% CI 0.07–0.59, p = 0.01), respectively, and negative slopes of −0.29 (95% CI −0.42–−0.17, p < 0.0001) and −0.19 (95% CI −0.29–−0.09, p = 0.0006), respectively. This suggests that the difference between TotalSegmentator-derived and manually derived measurements showed a slight increase with increasing SUV values, with TotalSegmentator yielding relatively lower values at the upper end of the measurement range.
For the bone marrow, we found a small negative median difference of −0.03 (95% CI −0.05–−0.02) indicating that TotalSegmentator values were slightly, but statistically significantly, lower than manually derived values. These findings are visualized in Figure 4. A summary of the Bland–Altman analysis results is provided in Table 3.
Figure 4.
Bland–Altman plots of SUVmean for (a) aorta, (b) spleen, (c) bone marrow, (d) liver, and (e) superior vena cava. SUVmean, mean standard uptake value; ROI, region of interest; LoA, limits of agreement.
Table 3.
(A). Non-parametric Bland–Altman analyses for SUVmean and SUVmax measurements. (B) Regression-based Bland–Altman analyses for SUVmean and SUVmax measurements.
For the additional analyses using eroded liver and superior vena cava masks, evidence of proportional bias was no longer observed for the liver, but the TotalSegmentator values were slightly higher than the manually derived values with a median difference of 0.02 (95% CI 0.006–0.06), limits of agreement ranging from −0.12 to 0.41, and relative bias of 0.79%. Proportional bias was still observed for the superior vena cava, but the slope was reduced to −0.16 (95% CI −0.27–−0.05), and the intercept was 0.28 (95% CI 0.05–0.51).
3.2. SUVmax
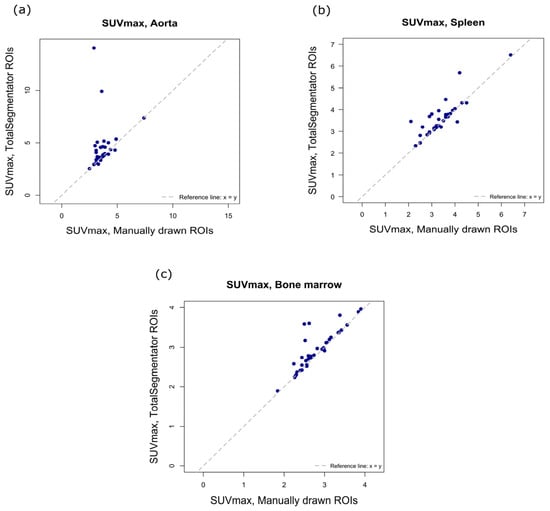
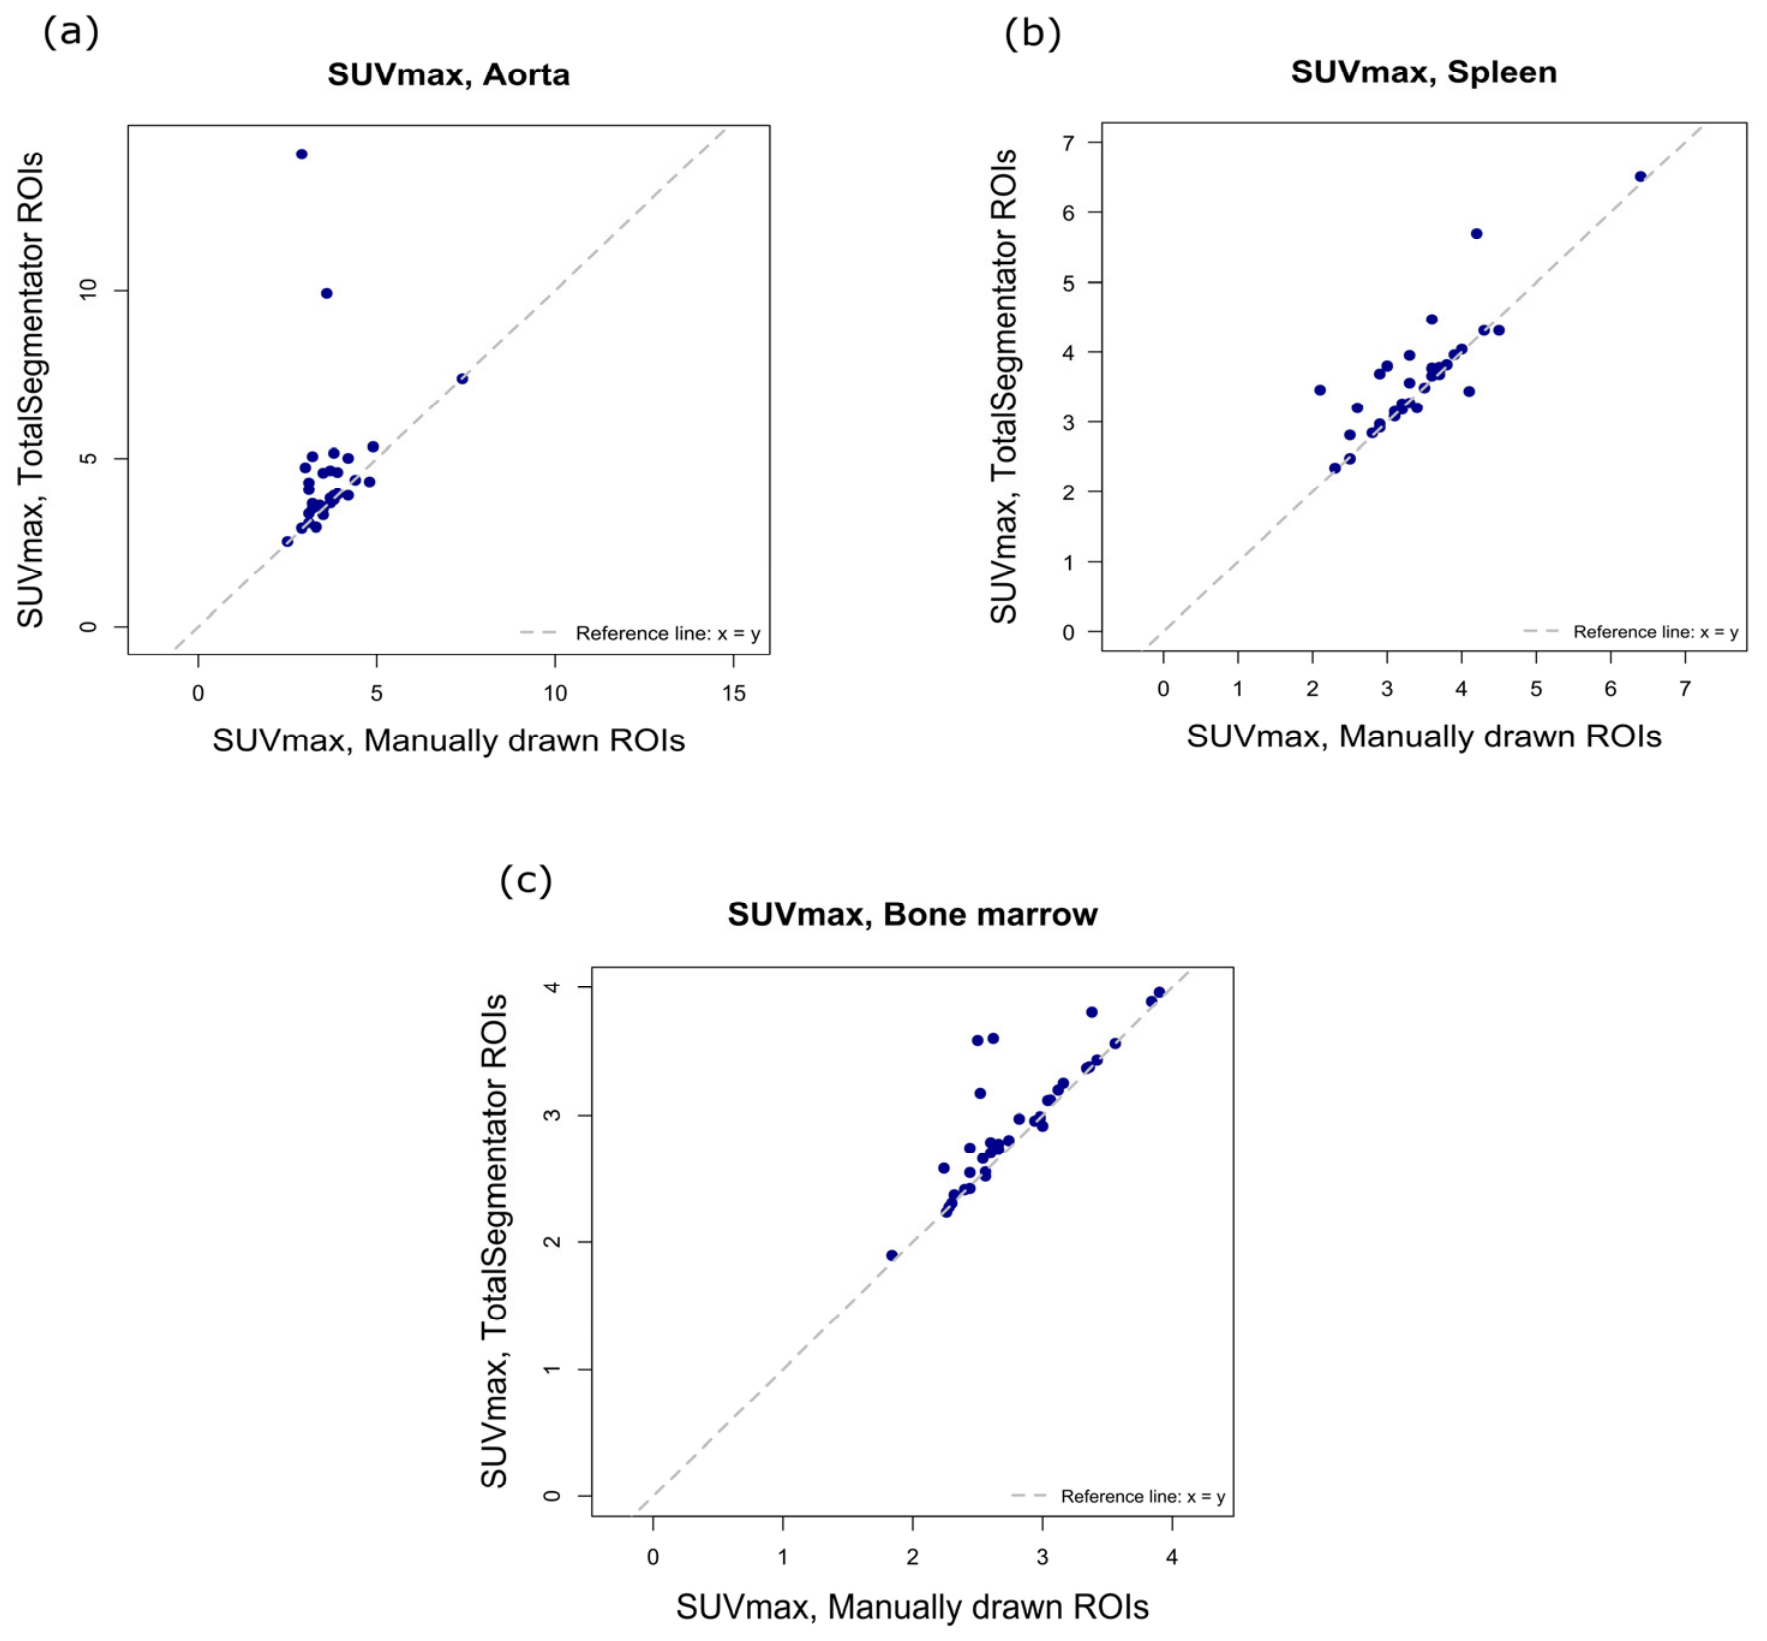
Scatterplots comparing manually and automatically obtained SUVmax values for the aorta, spleen and lumbar spine bone marrow are shown in Figure 5.
Figure 5.
Scatterplots of SUVmax values obtained by manual delineation vs. by TotalSegmentator for (a) aorta, (b) spleen, and (c) bone marrow. SUVmax, Maximum standard uptake value; ROI, region of interest.
The SUVmax values as well as Pearson or Spearman correlation coefficients and ICCs are presented in Table 2. For the spleen and bone marrow, the correlations were strong at 0.80 and 0.86, respectively. Similarly, the ICC analyses showed good agreement with ICCs at 0.83 for both structures. For the aorta, the coefficients showed weak correlation and poor agreement.
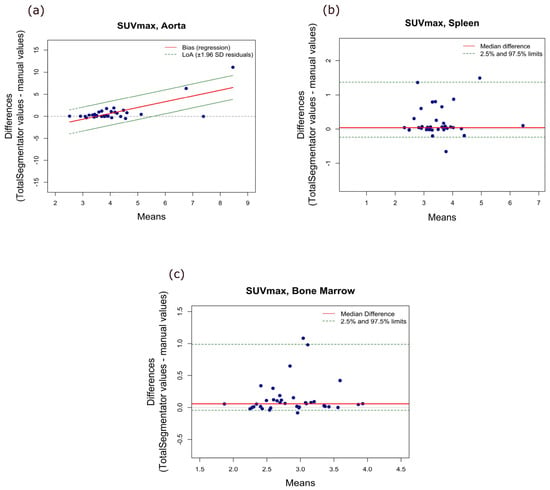
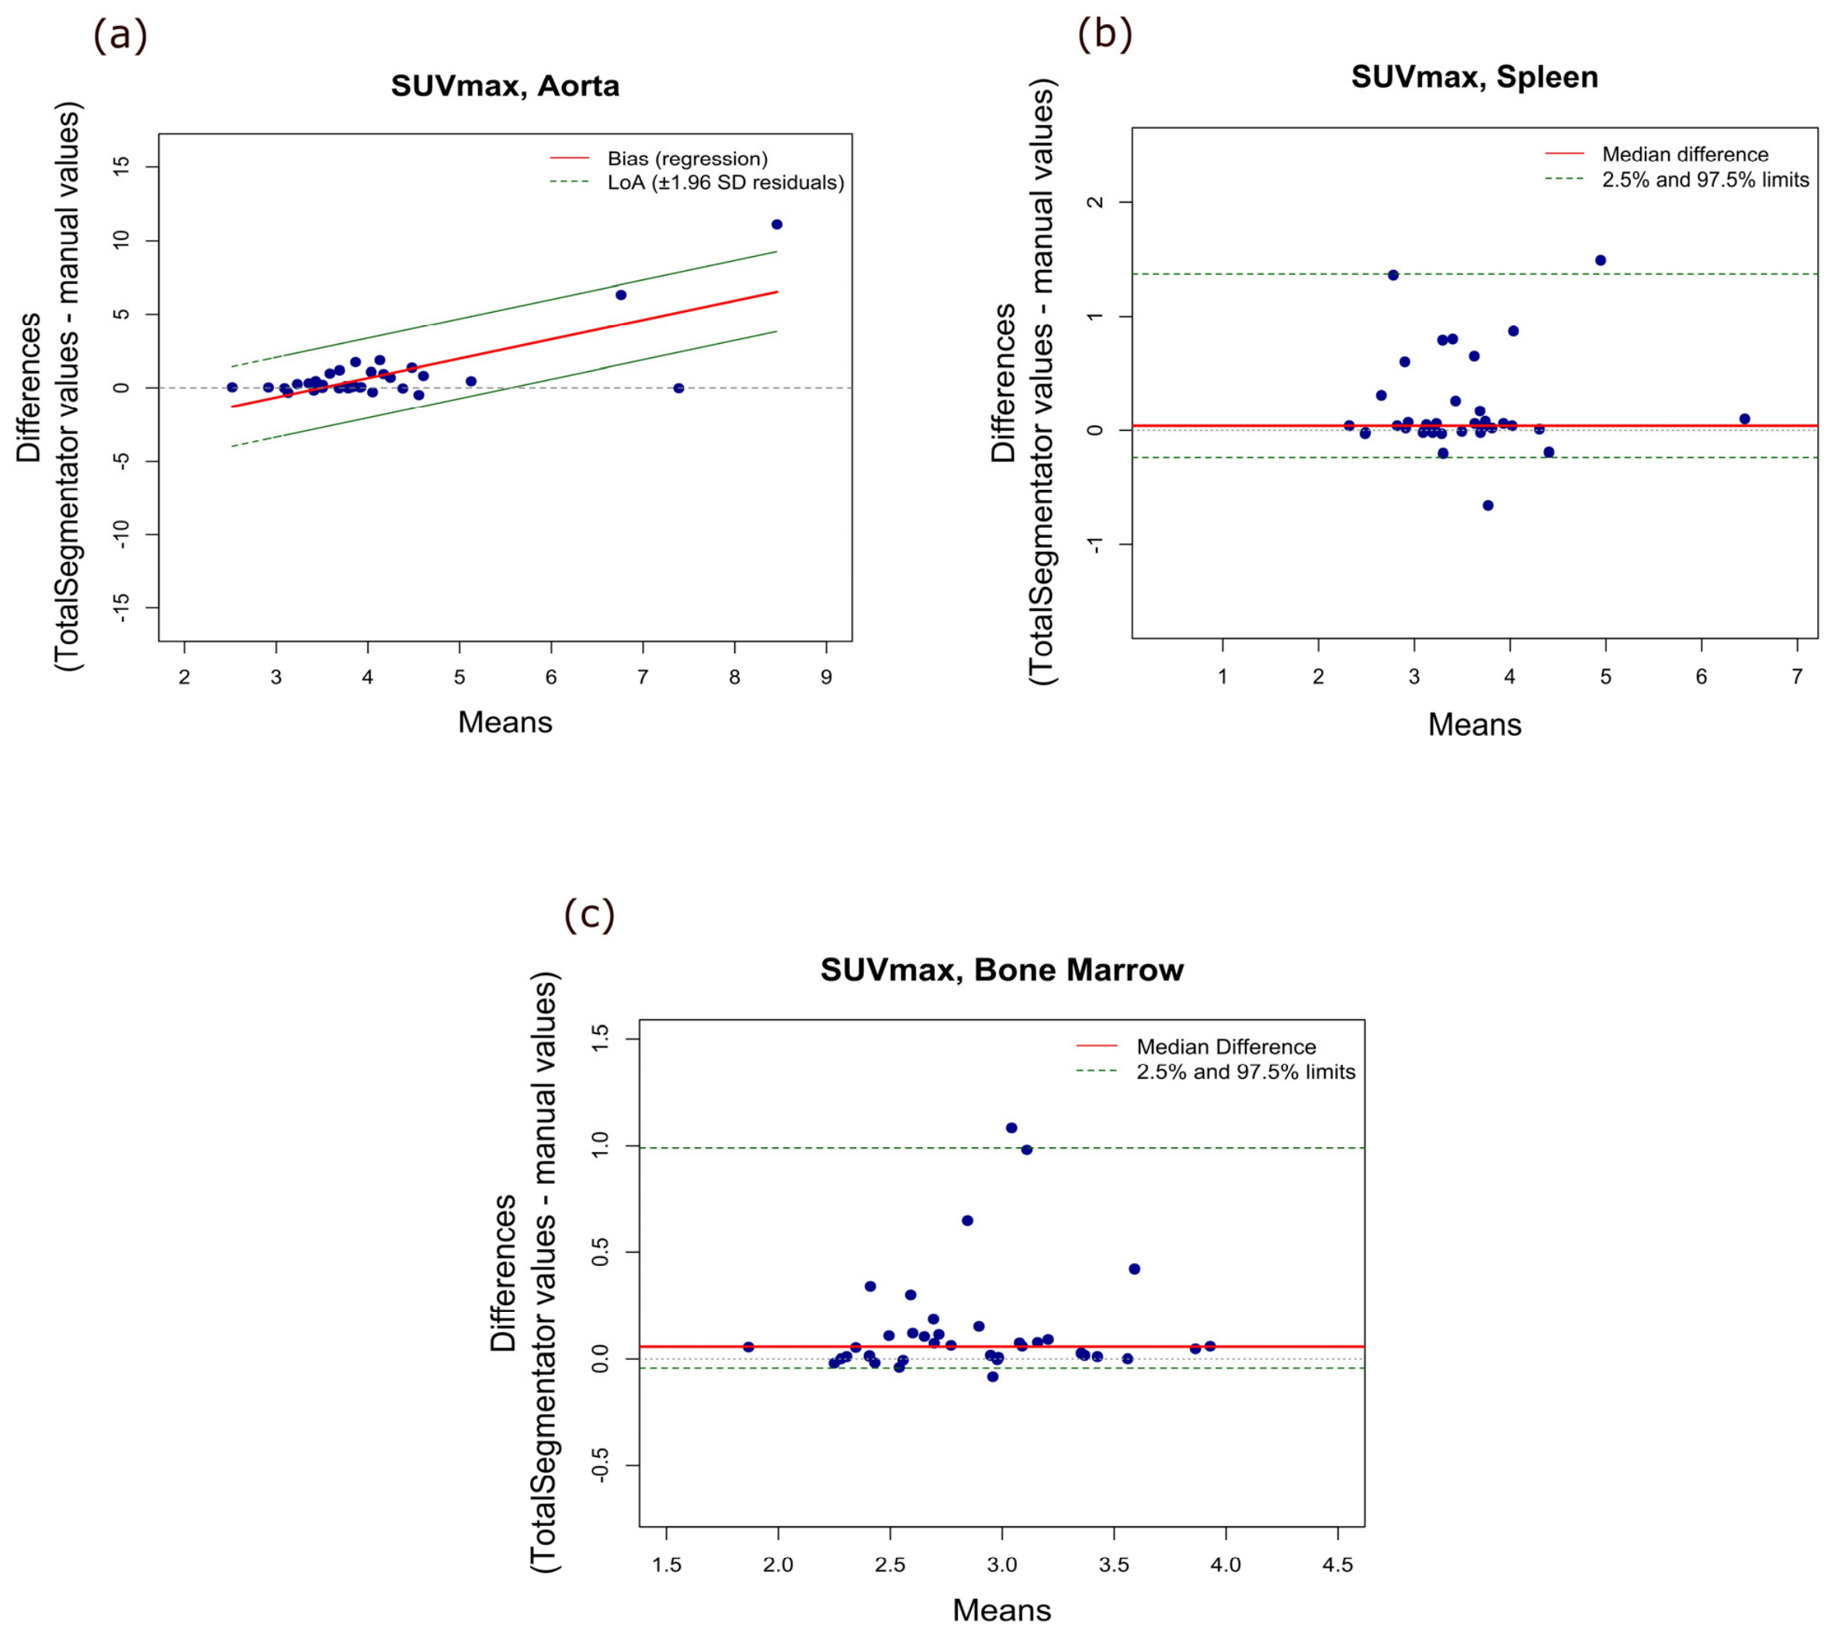
The Bland–Altman plots for SUVmax are shown in Figure 6, and a summary of the Bland–Altman analysis results is provided in Table 3. In all investigated structures, we found varying degrees of systematic bias between the TotalSegmentator-derived and manually obtained values.
Figure 6.
Bland–Altman plots of SUVmax for (a) aorta, (b) spleen, (c) bone marrow. SUVmax, maximum standard uptake value.
For both the spleen and bone marrow, we found that TotalSegmentator measurements were slightly higher than the manually obtained values with a median difference of 0.04 (95% CI 0.02–0.08) for the spleen, and 0.06 (95% CI 0.01–0.09) for bone marrow.
For SUVmax measurements in the aorta, the regression-based Bland–Altman plot presented a markedly positive slope of 1.32 (95% CI 0.91–1.72, p < 0.0001) and a negative intercept of −4.61 (95% CI −6.31–−2.89, p < 0.0001). These findings indicate that the difference between the two methods increased with increasing SUV values, with TotalSegmentator yielding progressively higher values at the upper end of the measurement range.
3.3. Sensitivity Analyses
As the SUVmax values for the aorta contained two extreme outliers (Figure 5a), we conducted a visual inspection of the automatic segmentation in the two affected scans. In both cases we confirmed a spill-in of highly intensive [18F]FDG uptake from the heart into the segmented ROI (see an example in Figure 7a). Subsequently, we performed a sub-analysis for SUVmax excluding the two affected scans.
Figure 7.
Examples of unsuccessful and successful automatic segmentations. (a) A segmentation of the aorta with myocardial spill-in and (b) a segmentation of the aorta without spill-in. (c) A segmentation error in the lumbar spine bone marrow, where T12 is segmented as L1 (orange) and the segmentation of L4 (green) includes both L3 and L4, and (d) a successful lumbar spine bone marrow segmentation.
This resulted in only slightly altered median SUVmax values, with a manually obtained median SUVmax of 3.70 (IQR 3.20–3.90) and an automatically obtained median SUVmax of 3.90 (IQR 3.56–4.41). Likewise, the correlation coefficient was only slightly increased to 0.55 (Spearman correlation test). However, the ICC markedly improved from 0.11 (−0.18–0.39) to 0.72 (0.44–0.86) and the previously observed proportional bias was no longer present.
Indications of a minor systematic bias remained, however, since the TotalSegmentator values were higher than the manually obtained values with a median difference of 0.06 (95% CI 0.02–0.31).
Minor segmentation errors affecting the lumbar vertebrae were identified in three patients following visual inspection (see an example in Figure 7c). Sensitivity analyses performed after exclusion of these patients resulted in unchanged median SUVmean values of 1.88 (IQR 1.73–2.19) for manual delineation and 1.85 (IQR 1.70–2.12) for automatic segmentation and slightly altered median SUVmax values of 2.66 (IQR 2.47–3.09) for manual delineation and 2.96 (IQR 2.57–3.31) for TotalSegmentator segmentation. The correlation coefficient remained at 0.98 (95% CI 0.95–0.99) for SUVmean and decreased slightly from 0.86 (95% CI 0.75–0.92) to 0.85 (95% CI 0.73–0.92) for SUVmax. Similarly, the ICC remained at 0.97 (95% CI 0.92–0.99) for SUVmean and decreased marginally from 0.83 (95% CI 0.64–0.92) to 0.82 (95% CI 0.61–0.91) for SUVmax.
3.4. Feasibility
The total time required for segmentation and SUV extraction of all investigated organs using TotalSegmentator was approximately 3 min per patient. Visual inspection of the segmentations for quality control added approximately 5 min. In contrast, the manual delineation process required roughly 2 h per patient.
4. Discussion
To our knowledge, this is the first study to evaluate the agreement between manually derived and TotalSegmentator-derived measurements of [18F]FDG uptake across the aorta, spleen, lumbar spine bone marrow, liver, and superior vena cava. Our findings demonstrate good overall agreement between TotalSegmentator-derived and manually derived segmentations for SUVmean across the investigated structures, although agreement was lower for the liver and superior vena cava than for the remaining structures. In contrast, the SUVmax results were more variable. For the aorta, automatically extracted SUVmax values showed only weak correlation and poor agreement with the corresponding manually derived measurements.
Overall, the existing literature supports our finding that automated segmentation provides more reliable SUVmean measurements than SUVmax measurements. Previously, there have been few studies exploring TotalSegmentator-derived SUV values compared with SUV values extracted by manual delineation, and these have assessed a limited number of organs. In one study, manual segmentation was compared with automatic segmentation using TotalSegmentator and another automatic segmentation tool, Multiple Organ Objective Segmentation (MOOSE). No differences in liver SUVmean and SUVmax were observed between all three segmentation methods. However, the methodology differed somewhat from the present study, as the liver was manually delineated in full, and SUVmax was defined as the average SUV of the five hottest voxels within the ROI [23]. Another study compared manually derived SUV measurements in the spleen and liver with values obtained using three automated segmentation methods, including TotalSegmentator. This study reported good agreement for SUVmean but more variable results for SUVmax, especially for liver measurements [21].
A third study compared the SUVmean and SUVmax values for 33 anatomical structures, obtained with automatic segmentation by two different segmentation models, TotalSegmentator and MOOSE, and found high reproducibility between the models for SUVmean values, but only moderate reproducibility for SUVmax for the aorta, liver and spleen [24]. However, no manually delineated segmentations were performed in this study.
Other research groups have investigated the agreement between SUVs obtained by other AI-based automatic segmentation models and manual delineation. One group trained a model for aortic wall segmentation in [18F]-sodium fluoride (NaF) PET/CT scans and reported excellent agreement for SUVmean, while SUVmax tended to be lower with automatic segmentation [13]. This pattern resembles the findings from our current study identifying poorer SUVmax agreement. Another group trained a model in the segmentation of the liver and mediastinal blood pool and found high agreement between the automatically and manually obtained SUVmedian in both structures [25]. Importantly, these studies relied on models trained by the respective research groups, whereas TotalSegmentator is a fully pre-trained model that can be applied directly without the need for additional training.
The agreement observed between manual and automated measurements should be interpreted relative to the inherent variability associated with manual delineation. Published studies generally report good to excellent intra- and inter-reader reliability for manually derived [18F]FDG uptake measurements, although the reported agreement for SUVmax is somewhat more variable than for SUVmean [26,27,28,29].
Because SUVmax is determined by the single voxel with the highest uptake within the ROI, variability between the two methods was expected. The lowest correlation between manual and automatic SUVmax was observed for the aorta, which also showed significant proportional bias in the Bland–Altman analysis. The aorta is located adjacent to the myocardium, which has a physiologically high [18F]FDG uptake, making automatic segmentations susceptible to tracer spill-in; an issue typically avoided with manual ROI delineation. By contrast, vertebral bone marrow, which is not near tissues with physiologically high glucose metabolism, yielded comparatively reliable SUVmax estimates. Excluding two visually confirmed myocardial spill-in outliers resulted in improved, but still modest, correlation and ICC values and eliminated proportional bias for aortic SUVmax.
When evaluating patients with inflammatory disease, SUVmean is still the most commonly used measure. Similarly, SUVmean is used as a measure of the tracer uptake in the whole organ, when using the liver and superior vena cava as reference structures for measurements in other organs. The lower agreement between TotalSegmentator and manual delineation for extraction of SUVmax may therefore not have significant clinical impact. On the contrary, when examining [18F]FDG uptake in arteries, such as the aorta, the SUVmax is often of interest as a specific measure of the [18F]FDG uptake in the vessel wall [27].
Several different approaches could improve the reliability of SUVmax values when using TotalSegmentator. Some imaging platforms currently allow the importation of automatic segmentations for visual inspection and manual adjustment to reduce spill-in effects. Other strategies include calculating a “hot-average” based on the average of the hottest voxels, applying an upper SUV cut-off, or eroding the segmented volumes at organ borders. These corrective methods were not applied in the present study, and further research is needed to determine whether they can yield more reproducible SUVmax measurements. Based on our results, aortic SUVmax values extracted using aortic segmentation by TotalSegmentator, may be subject to bias, and we recommend performing quality control of the individual results, especially for myocardial spill-in.
Determining [18F]FDG uptake in specific organs may have several clinical applications. Increased [18F]FDG uptake in the arterial wall reflects vascular inflammation and has been linked to a higher risk of cardiovascular events [30]. Previous studies have shown significantly higher splenic SUVs in patients with autoimmune diseases and macrophage activation syndrome compared with patients with localized infection and sepsis, respectively, suggesting that splenic uptake may help distinguish inflammatory or autoimmune conditions from infection [2,3]. These studies also reported associations between elevated splenic SUVs and in-hospital mortality [2,3]. Moreover, increased bone marrow SUVs have been linked to poorer survival in patients with colorectal cancer and metastatic melanoma [4,5]. However, a fast and reliable technique for assessment of [18F]FDG uptake is a prerequisite for clinical translation. In this context, the combination of LAFOV PET/CT scanners, which allow either very low radiation burden or substantially reduced acquisition times [31,32], and the very short segmentation time of TotalSegmentator, makes the use of SUV values feasible in routine clinical practice.
This study has several strengths. The manual segmentations were performed in a consistent manner, as the same experienced physician delineated the same organs across all 38 scans. Despite the limited cohort size, the study included two well-defined disease groups, representing patients with and without systemic inflammation. Furthermore, by including organs with different levels of anatomical complexity and susceptibility to spill-in, this study offers a broad assessment of the capabilities and limitations of automatic segmentation in a [18F]FDG-PET/CT context.
The study also has limitations. First, the manually delineated regions for the bone marrow, and particularly the superior vena cava and liver, did not fully correspond to the areas included in the automatic segmentations. For this reason, we did not include comparison of SUVmax measurements for the superior vena cava and liver in the current study. These spatial differences may have introduced a degree of uncertainty into the results for these structures and may, in part, explain the lower agreement and systematic bias observed for SUVmean in the liver and superior vena cava. Previous work has demonstrated that SUVmean measurements derived from spherical liver ROIs are largely unaffected by ROI size and placement within the liver parenchyma [12]. Thus, differences between the manual and automated measurements observed in the present study are unlikely to be attributable solely to the manual delineation strategy. Both manual and automatic segmentations were based on the CT images, and minor misalignments between the PET and CT images are common, just as respiration artefacts at the level of the diaphragm are a usual finding in PET/CT imaging. In contrast to the large whole-organ segmentations generated by TotalSegmentator, the manually placed ROIs were smaller and centrally located, thereby avoiding organ borders and certain specific structures such as liver cysts and the vessel wall of the superior vena cava, thus reducing the risk of influence from misalignment, spill-in or respiration artefacts. Furthermore, compared with whole-organ segmentations, the smaller manually placed ROIs cover a more limited tissue volume and may therefore be more influenced by focal uptake patterns within an organ. In the presence of heterogeneous tracer distribution, this may contribute to systematic differences in measured SUV values, particularly SUVmax, whereas the impact is expected to be less pronounced in organs with relatively homogeneous uptake, such as the liver.
The potential influence of boundary-related effects is further supported by the additional analyses using eroded liver and superior vena cava masks. Erosion of the segmentation boundaries resulted in substantially improved agreement between manual and automated SUVmean measurements. Furthermore, the evidence of proportional bias disappeared for the liver and was reduced for the superior vena cava. Notably, these improvements were observed even though the eroded masks did not correspond exactly to the manually placed ROIs with respect to location and volume. Together, these findings support the notion that boundary-related effects contribute to the lower agreement observed for these structures. In addition to these geometric differences, the limited spatial resolution of PET must be considered. Because the spatial resolution of PET is considerably coarser than that of CT, voxels close to organ borders are subject to partial-volume effects, i.e., spill-out of activity from the structure and spill-in from adjacent tissues with different uptake. These effects are most pronounced for small or thin structures such as the aortic wall and superior vena cava, and for structures adjacent to high-uptake tissue such as the myocardium, and they may differ between the two methods because the whole-organ segmentation include more boundary voxels than the centrally placed manual ROIs. In addition, PET images for the automatic SUV calculation were resampled to the CT grid using interpolation, which may alter voxel values and thereby affect measures such as SUVmax. However, despite this recognized limitation of SUVmax, it is still a metric used in the clinical setting and therefore included in some of our comparisons. SUVmax is determined by a single voxel and is therefore more sensitive to partial-volume effects, interpolation, noise and ROI size than SUVmean, which averages over many voxels. This is consistent with the poorer agreement we observed for SUVmax, and our SUVmax results should be interpreted with this well-known limitation in mind. Since the study was designed to compare SUV values rather than segmentation geometry, we did not quantify geometric overlap between the masks or apply partial-volume correction. The potential contribution of these effects to the observed differences is therefore supported by our eroded-mask analyses and the spill-in outliers in the aorta, but was not directly quantified.
Second, although most scans included were LAFOV [18F]FDG-PET with low-dose CT, seven of the scans were performed as diagnostic CT scans with intravenous contrast, and three scans were acquired on a SAFOV scanner, resulting in some heterogeneity in image acquisition. However, TotalSegmentator was originally trained on a heterogeneous set of CT images, including both contrast-enhanced and non-contrast-enhanced scans [16]. Furthermore, as the aim of the present study was to compare measurements obtained using different segmentation methods on the same images, all analyses were inherently paired. We therefore consider it unlikely that the observed heterogeneity in scan type substantially influenced the results.
Finally, this was a single-centre study with a modest sample size, and thus generalizability of our findings remains uncertain and should be determined by further research.
In conclusion, we found good agreement between manually and automatically obtained SUVmean values for the aorta, spleen, liver, lumbar spine bone marrow, and superior vena cava, indicating that TotalSegmentator is a reliable tool for automatic extraction of SUVmean across these structures. In contrast, SUVmax agreement was more variable, and particularly weak for the aorta. Therefore, if SUVmax values are required, additional measures and quality control should be considered to improve robustness when using TotalSegmentator.
Author Contributions
Conceptualization, L.T., T.F.G. and R.S.R.; methodology, L.T., M.Ø., P.R.H., T.F.G., J.M.B. and R.S.R.; software, E.S. and F.L.A.; formal analysis, T.F.G.; investigation, T.F.G., J.M.B. and E.S.; resources, F.L.A., L.T. and M.Ø.; data curation, E.S. and T.F.G.; writing—original draft preparation, T.F.G.; writing—review and editing, J.M.B., E.S., F.L.A., M.Ø., P.R.H., R.S.R. and L.T.; visualization, T.F.G.; supervision, R.S.R., L.T., M.Ø. and P.R.H.; project administration, R.S.R., T.F.G., J.M.B. and E.S.; funding acquisition, T.F.G. All authors have read and agreed to the published version of the manuscript.
Funding
This research was funded by the Danish Rheumatism Association, grant numbers A7440 and A8956.
Institutional Review Board Statement
The study was performed in accordance with the Declaration of Helsinki, and all data were collected after approval from the Regional Scientific Ethical Committee for the Capital Region of Denmark (reference number H-22001097, approval date 31 August 2022).
Informed Consent Statement
Written informed consent was obtained for all PMR patients, whereas this was not, according to Danish legislation, required for the anonymized scans of patients with malignant melanoma.
Data Availability Statement
The data used in this study are not publicly available for legal reasons. Data may be shared upon reasonable request to the corresponding author and are accessible only within the framework of applicable GDPR legislation and institutional ethical approvals. Access to the data requires the completion of a data-sharing agreement.
Acknowledgments
The authors would like to thank the Department of Clinical Physiology and Nuclear Medicine, Copenhagen University Hospital, Rigshospitalet, for providing personnel and access to PET/CT scanners in support of this project. The authors would also like to thank Simon Stebbings, Department of Medicine, Dunedin School of Medicine, University of Otago, Dunedin, New Zealand, for reviewing the language of the manuscript and providing valuable suggestions for improvement.
Conflicts of Interest
M.Ø. has received research grants from AbbVie, Amgen, BMS, Merck, Celgene, Eli Lilly, Novartis, and UCB, speaker fees from Abbvie, BMS, Celgene, Eli-Lilly, Galapagos, Gilead, Janssen, MEDAC, Merck, Novartis, Pfizer and UCB, and consultancy fees from Abbvie, AlfaSigma, BMS, Celgene, Eli-Lilly, Galapagos, Gilead, Janssen, Merck, Novartis, Pfizer, and UCB. L.T. has received speaker fees from IBSA, Johnson and Johnson, Novartis and UCB. R.S.R. has worked as a paid consultant for Novo Nordisk. F.L.A. has a research agreement with and received funding from Siemens Healthineers. T.F.G., J.M.B., E.S. and P.R.H. declared no potential conflicts of interest with respect to the research, authorship, and/or publication of this article.
Abbreviations
The following abbreviations are used in this manuscript:
| AI | Artificial intelligence |
| CI | Confidence interval |
| CT | computed tomography |
| LAFOV | Long axial Field-of-View |
| MOOSE | Multiple Organ Objective Segmentation |
| NaF | [18F]-sodium fluoride |
| PET | Positron emission tomography |
| PMR | Polymyalgia rheumatica |
| ROI | Region of interest |
| SAFOV | Standard axial Field-of-View |
| SUV | Standard uptake value |
| SUVmax | Maximum standard uptake value |
| SUVmean | Mean standard uptake value |
| VOI | Volume of interest |
| [18F]FDG | deoxy-2-[18F]fluoro-D-glucose |
| [18F]FDG-PET/CT | 2-deoxy-2-[18F]fluoro-D-glucose positron emission tomography and computed tomography |
References
- Figueroa, A.L.; Abdelbaky, A.; Truong, Q.A.; Corsini, E.; MacNabb, M.H.; Lavender, Z.R.; Lawler, M.A.; Grinspoon, S.K.; Brady, T.J.; Nasir, K.; et al. Measurement of Arterial Activity on Routine FDG PET/CT Images Improves Prediction of Risk of Future CV Events. JACC Cardiovasc. Imaging 2013, 6, 1250–1259. [Google Scholar] [CrossRef] [Scilit] [PubMed]
- Ahn, S.S.; Hwang, S.H.; Jung, S.M.; Lee, S.-W.; Park, Y.-B.; Yun, M.; Song, J.J. The Clinical Utility of Splenic Fluorodeoxyglucose Uptake for Diagnosis and Prognosis in Patients with Macrophage Activation Syndrome. Medicine 2017, 96, e7901. [Google Scholar] [CrossRef] [Scilit] [PubMed]
- Ahn, S.S.; Hwang, S.H.; Jung, S.M.; Lee, S.-W.; Park, Y.-B.; Yun, M.; Song, J.J. Evaluation of Spleen Glucose Metabolism Using 18F-FDG PET/CT in Patients with Febrile Autoimmune Disease. J. Nucl. Med. 2017, 58, 507–513. [Google Scholar] [CrossRef] [Scilit] [PubMed]
- Lee, J.-H.; Lee, H.S.; Kim, S.; Park, E.J.; Baik, S.H.; Jeon, T.J.; Lee, K.Y.; Ryu, Y.H.; Kang, J. Prognostic Significance of Bone Marrow and Spleen 18F-FDG Uptake in Patients with Colorectal Cancer. Sci. Rep. 2021, 11, 12137. [Google Scholar] [CrossRef] [Scilit] [PubMed]
- Nakamoto, R.; Zaba, L.C.; Liang, T.; Reddy, S.A.; Davidzon, G.; Aparici, C.M.; Nguyen, J.; Moradi, F.; Iagaru, A.; Franc, B.L. Prognostic Value of Bone Marrow Metabolism on Pretreatment 18 F-FDG PET/CT in Patients with Metastatic Melanoma Treated with Anti-PD-1 Therapy. J. Nucl. Med. 2021, 62, 1380–1383. [Google Scholar] [CrossRef] [Scilit] [PubMed]
- Patel, N.H.; Osborne, M.T.; Teague, H.; Parel, P.; Svirydava, M.; Sorokin, A.V.; Teklu, M.; Manyak, G.; Zhou, W.; Pantoja, C.; et al. Heightened Splenic and Bone Marrow Uptake of 18F-FDG PET/CT Is Associated with Systemic Inflammation and Subclinical Atherosclerosis by CCTA in Psoriasis: An Observational Study. Atherosclerosis 2021, 339, 20–26. [Google Scholar] [CrossRef] [Scilit] [PubMed]
- Hjuler, K.F.; Gormsen, L.C.; Vendelbo, M.H.; Egeberg, A.; Nielsen, J.; Iversen, L. Increased Global Arterial and Subcutaneous Adipose Tissue Inflammation in Patients with Moderate-to-Severe Psoriasis. Br. J. Dermatol. 2017, 176, 732–740. [Google Scholar] [CrossRef] [Scilit] [PubMed]
- Kaiser, H.; Kvist-Hansen, A.; Krakauer, M.; Gørtz, P.M.; Henningsen, K.M.A.; Wang, X.; Becker, C.; Zachariae, C.; Skov, L.; Hansen, P.R. Association between Vascular Inflammation and Inflammation in Adipose Tissue, Spleen, and Bone Marrow in Patients with Psoriasis. Life 2021, 11, 305. [Google Scholar] [CrossRef] [Scilit] [PubMed]
- Agca, R.; Blanken, A.B.; van Sijl, A.M.; Smulders, Y.M.; Voskuyl, A.E.; van der Laken, C.; Boellaard, R.; Nurmohamed, M.T. Arterial Wall Inflammation Is Increased in Rheumatoid Arthritis Compared with Osteoarthritis, as a Marker of Early Atherosclerosis. Rheumatology 2021, 60, 3360–3368. [Google Scholar] [CrossRef] [Scilit] [PubMed]
- Nanni, C.; Farolfi, A.; Castellucci, P.; Fanti, S. Total Body Positron Emission Tomography/Computed Tomography: Current Status in Oncology. Semin. Nucl. Med. 2025, 55, 31–40. [Google Scholar] [CrossRef] [Scilit] [PubMed]
- Bucerius, J.; Hyafil, F.; Verberne, H.J.; Slart, R.H.J.A.; Lindner, O.; Sciagra, R.; Agostini, D.; Übleis, C.; Gimelli, A.; Hacker, M. Position Paper of the Cardiovascular Committee of the European Association of Nuclear Medicine (EANM) on PET Imaging of Atherosclerosis. Eur. J. Nucl. Med. Mol. Imaging 2016, 43, 780–792. [Google Scholar] [CrossRef] [Scilit] [PubMed]
- Zwezerijnen, G.J.C.; Eertink, J.J.; Ferrández, M.C.; Wiegers, S.E.; Burggraaff, C.N.; Lugtenburg, P.J.; Heymans, M.W.; de Vet, H.C.W.; Zijlstra, J.M.; Boellaard, R. Reproducibility of [18F]FDG PET/CT Liver SUV as Reference or Normalisation Factor. Eur. J. Nucl. Med. Mol. Imaging 2023, 50, 486–493. [Google Scholar] [CrossRef] [Scilit] [PubMed]
- Piri, R.; Edenbrandt, L.; Larsson, M.; Enqvist, O.; Nøddeskou-Fink, A.H.; Gerke, O.; Høilund-Carlsen, P.F. Aortic Wall Segmentation in 18F-Sodium Fluoride PET/CT Scans: Head-to-Head Comparison of Artificial Intelligence-Based versus Manual Segmentation. J. Nucl. Cardiol. 2022, 29, 2001–2010. [Google Scholar] [CrossRef] [Scilit] [PubMed]
- Lee, Y.S.; Hong, N.; Witanto, J.N.; Choi, Y.R.; Park, J.; Decazes, P.; Eude, F.; Kim, C.O.; Kim, H.C.; Goo, J.M.; et al. Deep Neural Network for Automatic Volumetric Segmentation of Whole-Body CT Images for Body Composition Assessment. Clin. Nutr. 2021, 40, 5038–5046. [Google Scholar] [CrossRef] [Scilit] [PubMed]
- Sundar, L.K.S.; Yu, J.; Muzik, O.; Kulterer, O.C.; Fueger, B.; Kifjak, D.; Nakuz, T.; Shin, H.M.; Sima, A.K.; Kitzmantl, D.; et al. Fully Automated, Semantic Segmentation of Whole-Body 18F-FDG PET/CT Images Based on Data-Centric Artificial Intelligence. J. Nucl. Med. 2022, 63, 1941–1948. [Google Scholar] [CrossRef] [Scilit] [PubMed]
- Wasserthal, J.; Breit, H.-C.; Meyer, M.T.; Pradella, M.; Hinck, D.; Sauter, A.W.; Heye, T.; Boll, D.T.; Cyriac, J.; Yang, S.; et al. TotalSegmentator: Robust Segmentation of 104 Anatomic Structures in CT Images. Radiol. Artif. Intell. 2023, 5, e230024. [Google Scholar] [CrossRef] [Scilit] [PubMed]
- Constantino, C.S.; Leocádio, S.; Oliveira, F.P.M.; Silva, M.; Oliveira, C.; Castanheira, J.C.; Silva, Â.; Vaz, S.; Teixeira, R.; Neves, M.; et al. Evaluation of Semiautomatic and Deep Learning-Based Fully Automatic Segmentation Methods on [18F]FDG PET/CT Images from Patients with Lymphoma: Influence on Tumor Characterization. J. Digit Imaging 2023, 36, 1864–1876. [Google Scholar] [CrossRef] [Scilit] [PubMed]
- Carles, M.; Kuhn, D.; Fechter, T.; Baltas, D.; Mix, M.; Nestle, U.; Grosu, A.L.; Martí-Bonmatí, L.; Radicioni, G.; Gkika, E. Development and Evaluation of Two Open-Source nnU-Net Models for Automatic Segmentation of Lung Tumors on PET and CT Images with and without Respiratory Motion Compensation. Eur. Radiol. 2024, 34, 6701–6711. [Google Scholar] [CrossRef] [Scilit] [PubMed]
- Isensee, F.; Jaeger, P.F.; Kohl, S.A.A.; Petersen, J.; Maier-Hein, K.H. NnU-Net: A Self-Configuring Method for Deep Learning-Based Biomedical Image Segmentation. Nat. Methods 2021, 18, 203–211. [Google Scholar] [CrossRef] [Scilit] [PubMed]
- Abel, L.; Wasserthal, J.; Meyer, M.T.; Vosshenrich, J.; Yang, S.; Donners, R.; Obmann, M.; Boll, D.; Merkle, E.; Breit, H.-C.; et al. Intra-Individual Reproducibility of Automated Abdominal Organ Segmentation—Performance of TotalSegmentator Compared to Human Readers and an Independent nnU-Net Model. J. Imaging Inf. Med. 2024, 38, 1617–1627. [Google Scholar] [CrossRef] [Scilit] [PubMed]
- Krokos, G.; Kotwal, T.; Malaih, A.; Barrington, S.; Jackson, P.; Hicks, R.J.; Marsden, P.K.; Fischer, B.M. Evaluation of Manual and Automated Approaches for Segmentation and Extraction of Quantitative Indices from [18F]FDG PET-CT Images. BioMed Phys. Eng. Express 2024, 10, 025007. [Google Scholar] [CrossRef] [Scilit] [PubMed]
- Lappas, G.; Patlakas-Giavridis, N.; Giannikopoulos, P.; Triantafyllou, M.; Kalaitzakis, G.; Klontzas, M.E.; Petropoulos, K. Multifaceted Validation of TotalSegmentator Performance in Abdominal Organ Segmentation on CT Scans Integrated in Clinical-Grade PACS. Eur. J. Radiol. Artif. Intell. 2026, 6, 100090. [Google Scholar] [CrossRef] [Scilit]
- Wheeler, C.; Khaing, P.H.; D’Arnese, E.; Tavares, A.A.S. Comparison of Multi-Organ CT Image Segmentation Tools for Whole-Body [18F]FDG-PET/CT Clinical Imaging. Eur. J. Nucl. Med. Mol. Imaging 2026, 53, 3172–3181. [Google Scholar] [CrossRef] [Scilit] [PubMed]
- Auriac, J.; Nioche, C.; Hovhannisyan-Baghdasarian, N.; Loisel, C.; Seban, R.-D.; Jehanno, N.; Sundar, L.K.S.; Beyer, T.; Buvat, I.; Orlhac, F. Comparison of Organ Volumes and Standardized Uptake Values in [18F]FDG-PET/CT Images Using MOOSE and TotalSegmentator to Segment CT Images. Med. Phys. 2025, 52, e70025. [Google Scholar] [CrossRef] [Scilit] [PubMed]
- Sadik, M.; Lind, E.; Polymeri, E.; Enqvist, O.; Ulén, J.; Trägårdh, E. Automated Quantification of Reference Levels in Liver and Mediastinal Blood Pool for the Deauville Therapy Response Classification Using FDG-PET/CT in Hodgkin and Non-Hodgkin Lymphomas. Clin. Physiol. Funct. Imaging 2019, 39, 78–84. [Google Scholar] [CrossRef] [Scilit] [PubMed]
- Rosenblum, J.S.; Quinn, K.A.; Rimland, C.A.; Mehta, N.N.; Ahlman, M.A.; Grayson, P.C. Clinical Factors Associated with Time-Specific Distribution of 18F-Fluorodeoxyglucose in Large-Vessel Vasculitis. Sci. Rep. 2019, 9, 15180. [Google Scholar] [CrossRef] [Scilit] [PubMed]
- Ripa, R.S.; Zobel, E.H.; von Scholten, B.J.; Jensen, J.K.; Binderup, T.; Diaz, L.J.; Curovic, V.R.; Hansen, T.W.; Rossing, P.; Kjaer, A. Effect of Liraglutide on Arterial Inflammation Assessed as [18F]FDG Uptake in Patients with Type 2 Diabetes: A Randomized, Double-Blind, Placebo-Controlled Trial. Circ. Cardiovasc Imaging 2021, 14, e012174. [Google Scholar] [CrossRef] [Scilit] [PubMed]
- Malaih, A.A.; Dunn, J.T.; Nygård, L.; Kovacs, D.G.; Andersen, F.L.; Barrington, S.F.; Fischer, B.M. Test-Retest Repeatability and Interobserver Variation of Healthy Tissue Metabolism Using FDG-PET/CT of the Thorax among Lung Cancer Patients. Nucl. Med. Commun. 2022, 43, 549–559. [Google Scholar] [CrossRef] [Scilit] [PubMed]
- Kimeu, R.; Shah, A.; Gitau, S.; Doolub, G.; Mohamed, J. Interobserver Variability in Cardiovascular FDG PET/CT Analysis in Large Vessel Vasculitis. Glob. Heart 2025, 20, 48. [Google Scholar] [CrossRef] [Scilit] [PubMed]
- Sammartino, A.M.; Falco, R.; Drera, A.; Dondi, F.; Bellini, P.; Bertagna, F.; Vizzardi, E. Vascular Inflammation and Cardiovascular Disease: Review about the Role of PET Imaging. Int. J. Cardiovasc. Imaging 2023, 39, 433–440. [Google Scholar] [CrossRef] [Scilit] [PubMed]
- Alberts, I.; Hünermund, J.-N.; Prenosil, G.; Mingels, C.; Bohn, K.P.; Viscione, M.; Sari, H.; Vollnberg, B.; Shi, K.; Afshar-Oromieh, A.; et al. Clinical Performance of Long Axial Field of View PET/CT: A Head-to-Head Intra-Individual Comparison of the Biograph Vision Quadra with the Biograph Vision PET/CT. Eur. J. Nucl. Med. Mol. Imaging 2021, 48, 2395–2404. [Google Scholar] [CrossRef] [Scilit] [PubMed]
- Alberts, I.; Sari, H.; Mingels, C.; Afshar-Oromieh, A.; Pyka, T.; Shi, K.; Rominger, A. Long-Axial Field-of-View PET/CT: Perspectives and Review of a Revolutionary Development in Nuclear Medicine Based on Clinical Experience in over 7000 Patients. Cancer Imaging 2023, 23, 28. [Google Scholar] [CrossRef] [Scilit] [PubMed]

Disclaimer/Publisher’s Note: The statements, opinions and data contained in all publications are solely those of the individual author(s) and contributor(s) and not of MDPI and/or the editor(s). MDPI and/or the editor(s) disclaim responsibility for any injury to people or property resulting from any ideas, methods, instructions or products referred to in the content. |
© 2026 by the authors. Licensee MDPI, Basel, Switzerland. This article is an open access article distributed under the terms and conditions of the Creative Commons Attribution (CC BY) license.