


Abstract
Background: This study investigated the incremental value of radiomic features derived from 18F-FDG PET/CT over clinicopathological characteristics and conventional PET parameters for predicting and assessing metabolic treatment response in breast cancer, using independent external validation. Materials and Methods: This retrospective, two-center study included 153 patients with metastatic or non-metastatic breast cancer representing different biological subtypes, all of whom underwent systemic treatment and paired pretreatment and post-treatment 18F-FDG PET/CT. The development cohort comprised 115 patients, while 38 patients from a second institution formed the external validation cohort. The endpoint was complete metabolic response (CMR) of the primary breast tumor. Scenario A examined pretreatment prediction of CMR using baseline variables, whereas Scenario B assessed imaging-defined CMR using post-treatment and longitudinal PET/CT parameters. Models were developed using L1-regularized logistic regression with five-fold stratified cross-validation and evaluated in the external cohort without refitting. Results: Primary-tumor CMR was observed in 14 of 115 patients (12.2%) in the development cohort and 18 of 38 patients (47.4%) in the external cohort. In Scenario A, the multimodal model incorporating radiomics achieved an external validation AUC of 0.747 (95% CI, 0.577–0.887), compared with 0.636 for the model combining clinicopathological variables and conventional PET parameters (ΔAUC = 0.111). Compared with the clinical-only model (AUC = 0.658), the multimodal model improved discrimination by 0.089, although the difference was not statistically significant (DeLong p = 0.146). In Scenario B, conventional post-treatment PET parameters achieved an AUC of 0.986 (95% CI, 0.953–1.000). Adding radiomic features did not improve discrimination (AUC = 0.986). Conclusions: Pretreatment radiomics showed potential additional value for predicting primary-tumor CMR, although the improvement in discrimination was not statistically significant. After treatment, conventional PET parameters provided high discrimination for imaging-defined primary-tumor CMR, with no further improvement from radiomics. These findings require confirmation in larger, prospective cohorts before their clinical application.
1. Introduction
Breast cancer is the most commonly diagnosed malignancy among women worldwide and remains a major global health burden [1]. Advances in surgery, radiotherapy, chemotherapy, endocrine therapy, and targeted treatments have substantially improved the management of breast cancer [2]. Nevertheless, predicting individual responses to systemic treatment remains a clinical challenge [3].
Among imaging modalities, 18F-FDG PET/CT has been increasingly used to investigate treatment response in breast cancer. In addition to conventional metabolic parameters, radiomic analysis provides quantitative features that may capture aspects of intratumoral heterogeneity not readily apparent on visual assessment. Previous studies combining PET/CT-derived radiomic features with machine learning methods have reported promising results, particularly in patients receiving neoadjuvant treatment [4,5,6,7,8,9]. However, whether radiomics provides additional information beyond established clinicopathological characteristics and conventional PET parameters remains uncertain.
Clinicopathological biomarkers, including estrogen receptor (ER), progesterone receptor (PR), human epidermal growth factor receptor 2 (HER2), and Ki-67, are central to breast cancer characterization and treatment selection. Integrating these biomarkers with quantitative imaging features may improve the assessment of treatment response. Several studies have examined combined models incorporating pretreatment 18F-FDG PET/CT radiomics and clinicopathological characteristics, with encouraging predictive and prognostic findings [10]. Nevertheless, the relative contributions of clinical variables, conventional PET measurements, and radiomic features require further evaluation, particularly in independent patient cohorts.
The present study therefore investigated whether PET/CT-derived radiomic features provide incremental value beyond clinicopathological characteristics and conventional PET parameters for predicting and assessing primary-tumor complete metabolic response to systemic treatment in breast cancer. Two scenarios were examined separately: pretreatment prediction using baseline variables (Scenario A) and post-treatment classification of imaging-defined response using post-treatment and longitudinal imaging parameters (Scenario B). The models were developed in one institution and evaluated in an independent external cohort.
2. Materials and Methods
2.1. Patient Cohort
This retrospective, two-center study was approved by the Institutional Ethics Committee (Approval No. 2026/281; 29 April 2026). The requirement for written informed consent was waived because of the retrospective design. The study was conducted in accordance with the Declaration of Helsinki, and all patient data were anonymized before analysis.
A total of 153 patients with histologically confirmed breast cancer who underwent baseline and follow-up 18F-FDG PET/CT examinations for systemic treatment-response assessment between December 2023 and February 2026 at both participating centers were included.
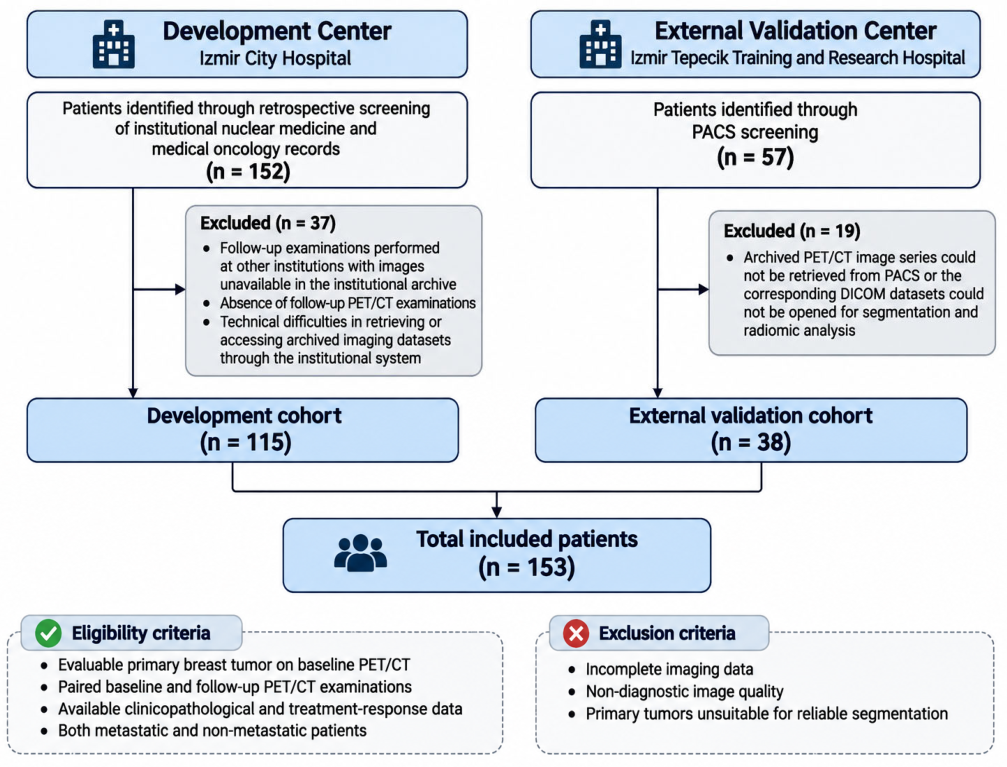
At the development center (Izmir City Hospital), 152 patients were initially identified through retrospective screening of institutional nuclear medicine and medical oncology records. Of these, 37 patients were excluded because complete paired baseline and follow-up 18F-FDG PET/CT datasets were unavailable for analysis. The reasons included follow-up examinations performed at other institutions with images unavailable in the institutional archive, absence of follow-up PET/CT examinations, and technical difficulties in retrieving or accessing archived imaging datasets through the institutional system. Consequently, 115 patients with complete paired imaging datasets and the required clinicopathological information were included in the final development cohort.
At the external validation center (Izmir Tepecik Training and Research Hospital), 57 candidate patients were initially identified through PACS screening. However, 19 patients were excluded during initial DICOM retrieval because their archived PET/CT image series could not be retrieved or opened for segmentation and radiomic analysis, leaving 38 patients in the final external validation cohort. Because these exclusions occurred before clinicopathological and conventional PET data collection, patient-level variables were unavailable for comparison between excluded and included external cases. All 153 included patients were female and of Turkish ethnicity. The external validation cohort was used exclusively for independent model evaluation and was not included in model training or feature selection.
Eligible patients were required to have an evaluable primary breast tumor on baseline PET/CT, paired baseline and follow-up PET/CT examinations, and available clinicopathological and treatment-response data. Both metastatic and non-metastatic patients were included. Patients with incomplete imaging data, non-diagnostic image quality, or primary tumors unsuitable for reliable segmentation were excluded. The patient selection process for both cohorts is illustrated in Figure 1.
Figure 1.
Flowchart of patient selection in the development and independent external validation cohorts. Abbreviations: DICOM, Digital Imaging and Communications in Medicine; PACS, Picture Archiving and Communication System; PET/CT, positron emission tomography/computed tomography.
Systemic treatment was individualized according to disease stage, tumor biological characteristics, and clinical indications. Treatment regimens included anthracycline- and taxane-based chemotherapy, platinum-containing chemotherapy, HER2-directed regimens, pembrolizumab-containing chemoimmunotherapy, and endocrine therapy with or without CDK4/6 inhibitors [11]. The number of administered chemotherapy cycles varied according to the prescribed regimen and individual clinical circumstances.
Follow-up 18F-FDG PET/CT examinations were performed at different stages of systemic treatment. In patients receiving chemotherapy, interim response assessments were performed after selected treatment cycles (generally after four or six cycles), while assessments following completion of chemotherapy were performed after completion of the planned chemotherapy regimen. In both settings, PET/CT was generally performed at least 10 days, preferably 15 days, after the most recent chemotherapy administration. Patients receiving continuous endocrine or targeted therapy underwent response assessment at clinically determined timepoints during ongoing treatment, without a fixed imaging interval.
In the development cohort, 39 patients (33.9%) underwent response assessment following completion of chemotherapy, 37 (32.2%) underwent interim response assessment during chemotherapy, and 39 (33.9%) were evaluated during ongoing endocrine or targeted therapy. In the external validation cohort, the corresponding numbers were 5 (13.2%), 27 (71.1%), and 6 (15.8%) patients, respectively. The distribution of treatment status at follow-up PET/CT is presented in Supplementary Table S1.
No patients underwent breast surgery between the baseline (Scan 1) and follow-up (Scan 2) 18F-FDG PET/CT examinations. Palliative radiotherapy directed to distant bone metastases was recorded in 2 of 115 patients (1.7%) in the development cohort and 10 of 38 patients (26.3%) in the external validation cohort, corresponding to 12 of 153 patients (7.8%) overall. Radiotherapy was not directed to the primary breast tumor. The study primarily evaluated the metabolic response of the primary breast tumor following systemic treatment, predominantly chemotherapy-based regimens. The independent contribution of radiotherapy to treatment response was not separately investigated. The timing of palliative radiotherapy for bone metastases was individualized according to clinical indications, including pain severity, spinal involvement, and the risk of skeletal complications. Accordingly, radiotherapy could be administered during systemic treatment or after several chemotherapy cycles, depending on clinical need. The exact timing of radiotherapy relative to chemotherapy cycles and PET/CT examinations was not systematically evaluated in this retrospective study.
In this study, the term “follow-up PET/CT” refers to the second (Scan 2) PET/CT examination performed for metabolic response assessment, including interim evaluations during chemotherapy, assessments after completion of chemotherapy, and evaluations during ongoing endocrine or targeted therapy. Thus, follow-up imaging did not necessarily indicate completion of all systemic treatments.
The primary study endpoint was complete metabolic response (CMR) of the primary breast tumor at follow-up 18F-FDG PET/CT. CMR was defined as a reduction in FDG uptake of the primary breast lesion to background activity. Patients with residual primary-tumor FDG uptake above background levels or progression involving the primary breast tumor were classified as having incomplete metabolic response (ICMR). Response classification was based exclusively on the metabolic status of the primary breast lesion, irrespective of the presence or response of distant metastatic lesions. Therefore, patients could be classified as having primary-tumor CMR despite persistent or progressive metastatic disease elsewhere. Primary-tumor CMR should not be interpreted as whole-body complete metabolic response or pathological complete response.
2.2. PET/CT Image Acquisition
All patients underwent 18F-FDG PET/CT according to institutional imaging protocols and the recommendations of the European Association of Nuclear Medicine (EANM) [12]. Comparable patient preparation and acquisition protocols were applied at both institutions. PET/CT examinations in the development cohort were performed using a Discovery IQ PET/CT scanner (GE Medical Systems, LLC, Waukesha, WI, USA; November 2022), whereas examinations in the independent external validation cohort were performed using a Biograph Horizon 4R PET/CT scanner (Siemens Healthineers, Erlangen, Germany, April 2023).
Patients fasted for at least 6 h before intravenous administration of 185–370 MBq (5–10 mCi) of 18F-FDG. Blood glucose levels were confirmed to be between 70 and 200 mg/dL before tracer injection. Image acquisition was targeted at approximately 60 min after tracer administration. Based on DICOM headers, actual 18F-FDG uptake times in the development cohort (n = 115) had a median of 63.5 min (IQR, 57.1–72.4; range, 36.1–102.2) at baseline and 62.6 min (IQR, 56.2–70.1; range, 36.8–107.8) at follow-up, with a median within-patient difference (Scan 2 − Scan 1) of −2.6 min (IQR, −10.1 to +9.9; range, −63.7 to +56.5; median absolute difference, 10.3 min [IQR, 5.5–25.3]). In the external validation cohort (n = 38), actual uptake times had a median of 56.1 min (IQR, 47.5–72.0; range, 33.5–116.3) at baseline and 58.4 min (IQR, 50.9–70.9; range, 40.5–124.9) at follow-up, with a median within-patient difference of +2.7 min (IQR, −7.5 to +12.8; range, −40.9 to +35.3; median absolute difference, 11.2 min [IQR, 5.2–23.6]). Whole-body PET images were acquired from the vertex to the mid-thigh in three-dimensional mode.
Low-dose CT images were acquired for attenuation correction and anatomical localization. When clinically indicated and available as part of institutional workflows, contrast-enhanced CT protocols used nonionic iodinated contrast material (iohexol 350 mg I/mL or iopromide 370 mg I/mL) at a dose of 1.2–1.5 mL/kg (approximately 80–100 mL), administered at 2.0–2.5 mL/s, followed by a 20–30 mL saline flush, with a scan delay of 60–70 s. However, direct verification of DICOM metadata and thoracic vascular attenuation confirmed that all 115 patients (100%) in the development cohort and all 38 patients (100%) in the external validation cohort contributed unenhanced low-dose CT series (0% contrast-enhanced CT) from the hybrid PET/CT acquisition to radiomic feature extraction at both baseline and follow-up. At the development center, CT images were acquired at 120 kVp with SmartmA tube-current modulation (179–326 mA) and a reconstruction slice thickness of 2.5 mm. At the external validation center, CT acquisition used 130 kVp with CareDose4D tube-current modulation and a reconstruction slice thickness of 1.4–2.0 mm.
PET images were reconstructed using institution-specific iterative reconstruction algorithms. At the development center (GE Discovery IQ), ordered-subsets expectation maximization (OSEM) reconstruction was performed using 4 iterations and 12 subsets, a Gaussian smoothing filter with a full width at half maximum (FWHM) of 3.26 mm, a 192 × 192 reconstruction matrix, and reconstructed voxel dimensions of 3.65 × 3.65 × 3.27 mm3. Point spread function (PSF) modeling, time-of-flight (TOF) reconstruction, and Q.Clear were not used.
At the external validation center (Siemens Biograph Horizon 4R), PET images were reconstructed using the TrueX algorithm with 4 iterations and 10 subsets, a Gaussian smoothing filter with an FWHM of 5 mm, a 192 × 192 reconstruction matrix, and reconstructed voxel dimensions of 4 × 4 × 2.03 mm3. TOF reconstruction was not used. CT-based attenuation correction and scatter and random coincidence corrections were applied at both centers.
Patients in both cohorts underwent paired 18F-FDG PET/CT examinations, including a baseline scan before systemic treatment and a follow-up scan for metabolic response assessment at clinically determined treatment timepoints. Follow-up examinations included interim assessments during chemotherapy, evaluations after completion of chemotherapy, and assessments during ongoing endocrine or targeted therapy, as described in Section 2.1.
Conventional PET-derived metabolic parameters, including maximum standardized uptake value (SUVmax), mean standardized uptake value (SUVmean), metabolic tumor volume (MTV), and total lesion glycolysis (TLG), were obtained as standard quantitative PET measurements from the PET/CT examinations using PET Odyssey software (version 5.34) in the development cohort and Siemens syngo software (Siemens Healthineers) in the external validation cohort, and were recorded separately from the radiomic analysis. These parameters were measured from the primary breast tumor on both baseline and follow-up PET/CT examinations. Percentage changes in conventional metabolic PET parameters between the baseline and follow-up examinations were subsequently calculated to quantify longitudinal metabolic changes. SUVmax, SUVmean, MTV, and TLG were considered conventional metabolic PET parameters and were not classified as radiomic features.
2.3. Clinicopathological Evaluation
Pretreatment clinicopathological data were obtained from patient medical records and pathology reports. The evaluated variables included patient age, menopausal status, histological grade, estrogen receptor (ER) status, progesterone receptor (PR) status, human epidermal growth factor receptor 2 (HER2) status, Ki-67 proliferation index, and clinical T, N, and M stage.
ER and PR status were encoded as binary variables (0 = negative, 1 = positive). HER2 status was also encoded as a binary variable (0 = negative, 1 = positive). HER2 positivity was defined as an immunohistochemistry score of 3+ or an equivocal score of 2+ with confirmed gene amplification by in situ hybridization. The Ki-67 proliferation index was dichotomized at 30%, with values below 30% coded as 0 and values of 30% or higher coded as 1.
Clinical T stage was categorized as T1–T2 (0) and T3–T4 (1), while clinical N stage was categorized as N0 (0) and N1–N3 (1). Histological grade was recorded as Grade 1, 2, or 3, and distant metastatic status was classified as M0 or M1. Menopausal status was classified as premenopausal or postmenopausal, while patient age was treated as a continuous variable.
These pretreatment clinicopathological variables were considered as candidate predictors in the machine learning models. Feature selection was performed as described in Section 2.6.
2.4. Tumor Segmentation and Radiomic Feature Extraction
Primary breast tumor volumes of interest (VOIs) were delineated on fused PET/CT images using a semi-automated threshold-based approach. At baseline (Scan 1), the primary tumor was identified manually, followed by application of a 41% SUVmax isocontour. VOI boundaries were reviewed on fused images and manually adjusted according to anatomical CT boundaries when necessary.
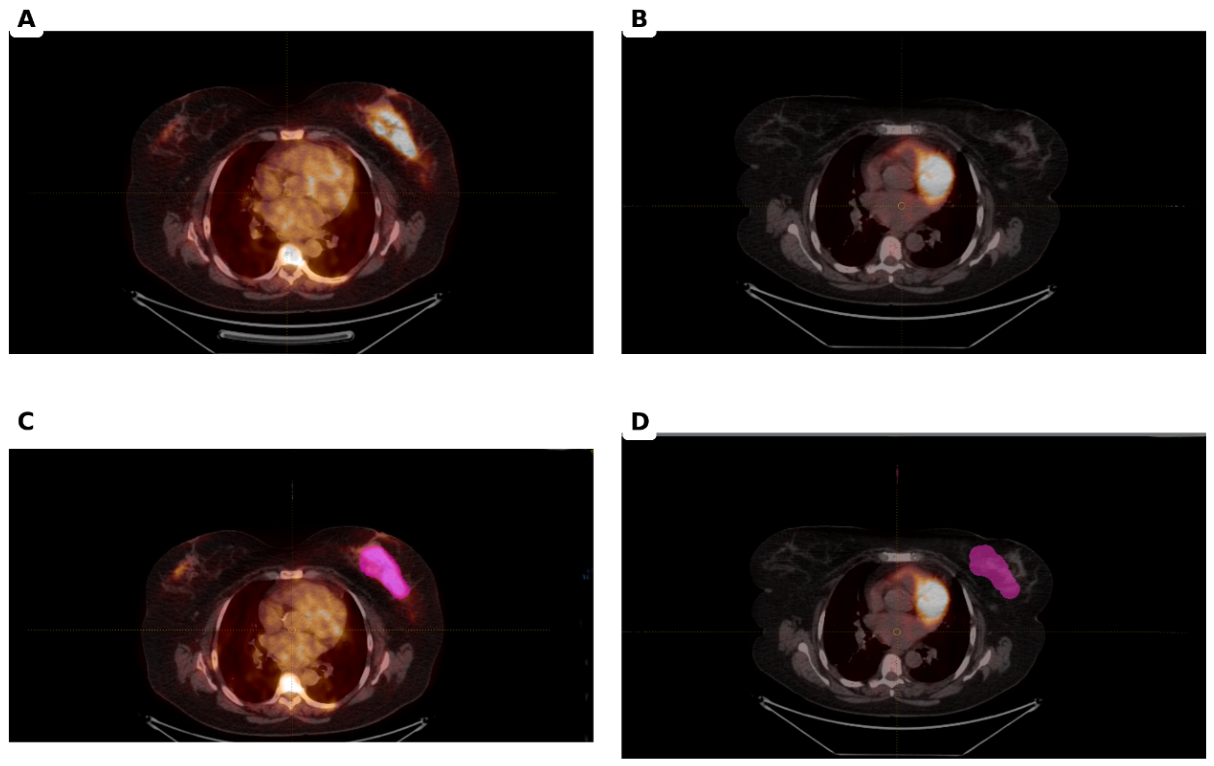
At follow-up imaging (Scan 2), residual or progressive primary tumors in patients with incomplete metabolic response (ICMR) were newly delineated using the same procedure, without constraint by the baseline VOI. For patients with complete metabolic response (CMR) and no identifiable residual hypermetabolic lesion, the baseline VOI was copied to the follow-up examination and positioned over the corresponding tumor bed using anatomical CT landmarks, preserving its original shape and volume.
All segmentations were independently reviewed by two nuclear medicine physicians, with discrepancies resolved by consensus.
An interobserver intraclass correlation coefficient (ICC) of 0.92 was reported for PET-derived metabolic tumor volume (MTV), although the estimate and its 95% confidence interval could not be verified. Furthermore, consensus agreement on PET-based MTV delineation does not establish interobserver reproducibility of the retained baseline CT texture feature (CT-derived GLDM Large Dependence Emphasis), which was not separately evaluated.
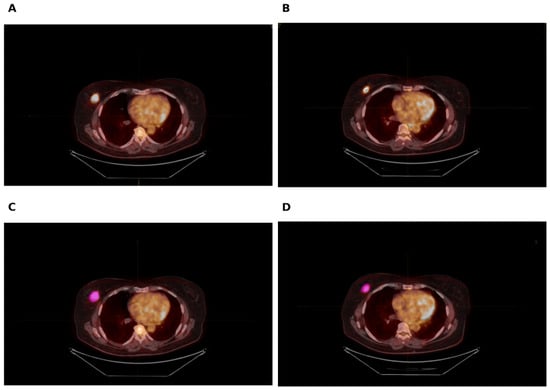
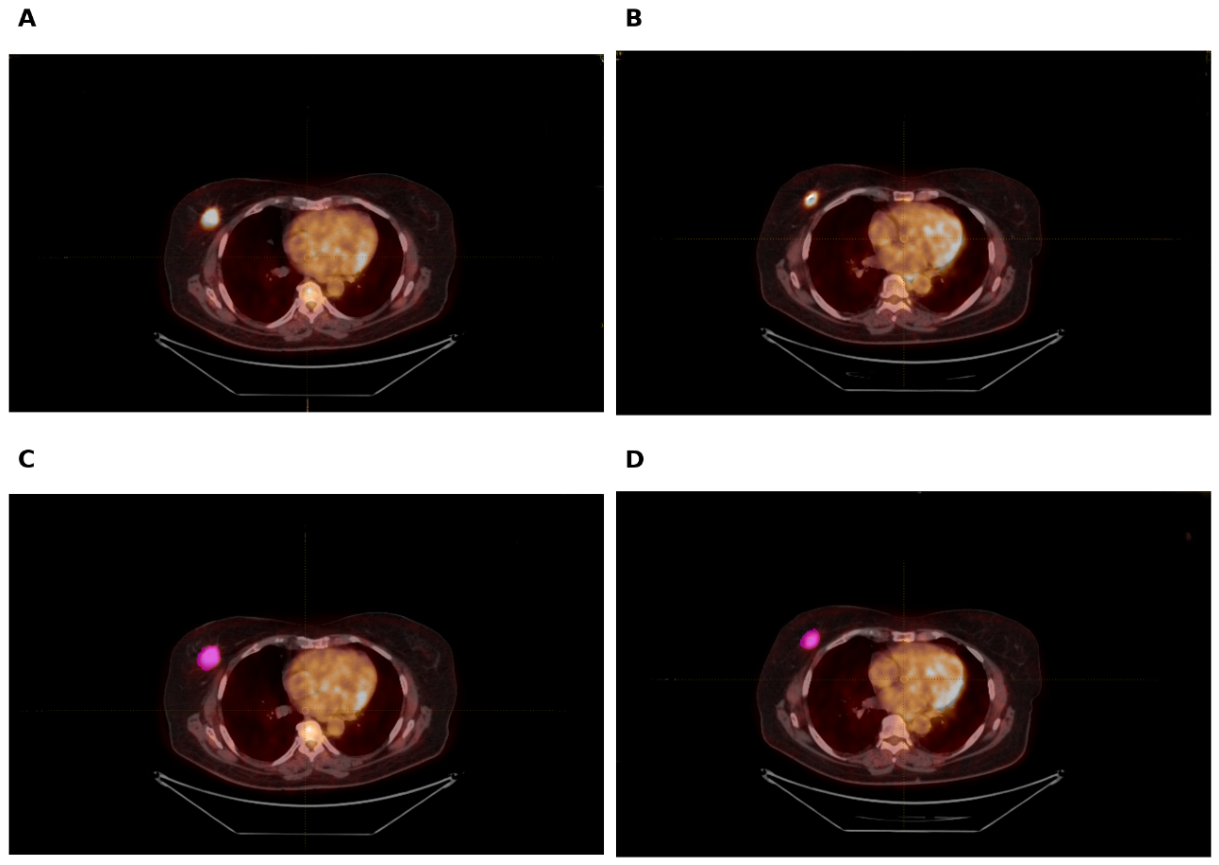
Representative pretreatment and follow-up 18F-FDG PET/CT images, with and without ROI delineation, are presented for patients with complete metabolic response (CMR) and incomplete metabolic response (ICMR) in Figure 2 and Figure 3, respectively.
Figure 2.
Representative 18F-FDG PET/CT images illustrating complete metabolic response (CMR) and ROI delineation for radiomic feature extraction. (A) Pretreatment (baseline) axial fused 18F-FDG PET/CT image without ROI delineation showing intense hypermetabolic uptake in the left primary breast tumor. (B) Follow-up axial fused 18F-FDG PET/CT image without ROI delineation showing complete resolution of abnormal FDG uptake to surrounding background activity at the primary breast tumor site (CMR). (C) Pretreatment PET/CT image showing the delineated primary tumor ROI (magenta). (D) Follow-up PET/CT image showing the baseline ROI copied and positioned over the corresponding left breast tumor bed using anatomical CT landmarks for radiomic feature extraction. Abbreviations: 18F-FDG, 18F-fluorodeoxyglucose; CMR, complete metabolic response; PET/CT, positron emission tomography/computed tomography; ROI, region of interest.
Figure 3.
Representative 18F-FDG PET/CT Images Illustrating Incomplete Metabolic Response (ICMR) of the Primary Breast Tumor and ROI Delineation for Radiomic Feature Extraction. (A) Pretreatment PET/CT image without ROI delineation. (B) Follow-up PET/CT image showing residual FDG uptake above background activity at the primary breast tumor site. (C) Pretreatment PET/CT image showing the delineated primary tumor ROI. (D) Follow-up PET/CT image showing the newly delineated ROI encompassing the residual metabolically active lesion for radiomic feature extraction.
Radiomic features were extracted separately from PET and CT images using PyRadiomics version 3.0.1 in Python 3.10, following Image Biomarker Standardisation Initiative reporting recommendations. CT and PET images were resampled to isotropic voxel sizes of 1 × 1 × 1 mm3 and 2 × 2 × 2 mm3, respectively, using three-dimensional B-spline interpolation; masks were resampled using nearest-neighbor interpolation. CT and PET intensities were restricted to −1000 to +1000 HU and 0–50 SUV, respectively. Fixed bin widths of 25 HU for CT and 0.25 SUV for PET were used for intensity discretization.
Radiomic features were extracted separately from baseline and follow-up examinations. Absolute and percentage changes between Scan 1 and Scan 2 were also calculated. Longitudinal percentage changes in conventional PET parameters and radiomic features were calculated as %Δ = [(Scan 2 value − Scan 1 value)/Scan 1 value] × 100. Negative values indicate a reduction in the corresponding parameter or feature at follow-up.
For each primary-tumor VOI, 107 features were extracted from each modality: 14 shape, 18 first-order, 24 gray-level co-occurrence matrix, 16 gray-level run-length matrix, 16 gray-level size-zone matrix, 14 gray-level dependence matrix, and 5 neighboring gray-tone difference matrix features. Conventional PET parameters—SUVmax, SUVmean, metabolic tumor volume, and total lesion glycolysis—were analyzed separately and were not classified as radiomic features. In patients with CMR, follow-up MTV and TLG were assigned a value of zero in the conventional PET parameter analysis.
The CT-derived GLDM Large Dependence Emphasis feature selected in the final models was extracted from the baseline (Scan 1) CT examination in both Scenario A and Scenario B.
The same segmentation, image-preprocessing, and feature-extraction pipeline was applied to the independent external validation cohort. Detailed radiomics settings and parameter configuration are provided in Supplementary File S1.
2.5. Metabolic Response Definition
Metabolic response of the primary breast tumor was assessed on follow-up 18F-FDG PET/CT examinations by two nuclear medicine physicians, with disagreements resolved by consensus. Consistent with the EORTC concept of complete metabolic response, primary-tumor CMR was defined as the complete resolution of abnormal FDG uptake, with the SUVmax at the primary-tumor site decreasing to a level indistinguishable from the surrounding background activity [13].
Patients with residual or progressive primary-tumor uptake above the surrounding background level were classified as having incomplete metabolic response (ICMR). The same response definition was applied to the development and external validation cohorts.
2.6. Feature Selection and Model Development
Model development was performed exclusively in the development cohort (n = 115). Missing values were median-imputed, and continuous variables were robust-scaled. To prevent information leakage, imputation, scaling, feature selection, and hyperparameter optimization were conducted within the training folds of stratified five-fold cross-validation.
L1-regularized logistic regression (LASSO) was used for feature selection and final model construction. The regularization parameter C was optimized over a logarithmic range from 10−3 to 101 using stratified five-fold cross-validation. The optimal C value for the Tier 4 model was 0.250. Given the limited number of complete metabolic response (CMR) events in the development cohort (14 of 115 patients, 12.2%), models were restricted to a maximum of five predictors, corresponding to an events-per-variable (EPV) ratio of 2.8 for models containing five predictors. This restriction was applied to reduce model complexity and mitigate overfitting. Feature selection was limited to the five highest-ranked predictors based on the absolute values of their standardized coefficients.
Feature selection stability was evaluated using 100 bootstrap resamples of the development cohort. The selection frequencies were 93% for PR status, 93% for clinical N stage, 84% for HER2 status, 70% for Ki-67, and 17% for CT-derived GLDM Large Dependence Emphasis. PR was retained instead of ER in the final multimodal model, consistent with the correlation between these two hormone receptor variables and the variable selection performed by L1 regularization.
Four model tiers were evaluated: Tier 1, clinicopathological variables; Tier 2, conventional PET-derived metabolic parameters; Tier 3, clinicopathological and conventional PET parameters; and Tier 4, radiomic features combined with the clinicopathological and conventional PET candidate pool. Features were independently reselected for each tier; therefore, Tier 4 was not required to be strictly nested within Tier 3.
Scenario A used baseline (Scan 1) clinicopathological and imaging features to predict subsequent CMR. Scenario B used baseline and follow-up (Scan 2) imaging features, together with longitudinal changes between Scan 1 and Scan 2, to distinguish CMR from non-CMR.
After model development and hyperparameter optimization, decision thresholds were selected exclusively in the development cohort by maximizing the Youden index. The models and thresholds were then locked and applied unchanged to the independent external validation cohort (n = 38), without feature reselection, recalibration, threshold adjustment, or refitting.
2.7. Statistical Analysis and Model Evaluation
Continuous variables were summarized as median and interquartile range [IQR, 25th–75th percentile], and categorical variables as frequencies and percentages. Between-cohort differences were evaluated using the two-sided Mann–Whitney U test for continuous variables and the chi-square or Fisher’s exact test for categorical variables.
Model discrimination was assessed using the area under the receiver operating characteristic curve (AUC). Model performance was evaluated using AUC, sensitivity, specificity, balanced accuracy, F1-score, and Brier score. Non-parametric 95% confidence intervals for AUC, NRI, and IDI were estimated using 1000 stratified bootstrap resamples, whereas exact Clopper–Pearson binomial 95% confidence intervals were calculated for sensitivity and specificity at the locked development-derived Youden thresholds. Differences between competing AUCs were assessed using the DeLong test.
Continuous net reclassification improvement (NRI) and integrated discrimination improvement (IDI) were used to evaluate the incremental value of additional predictor groups. These analyses were performed to determine whether adding radiomic features improved model performance beyond clinicopathological and conventional PET parameters.
Calibration was evaluated using the calibration slope, calibration intercept, and Brier score. Calibration slope and intercept were estimated by logistic recalibration of the original model predictions. Decision curve analysis was performed to assess clinical net benefit across threshold probabilities ranging from 0 to 0.60, with comparisons against treat-all and treat-none strategies.
Sensitivity, specificity, and balanced accuracy were evaluated using decision thresholds determined exclusively in the development cohort. The same thresholds were applied to the independent external validation cohort without adjustment. Reclassification and decision-curve analyses were considered exploratory because of the limited external validation sample size.
All analyses were performed in Python using scikit-learn, SciPy, NumPy, and pandas. Statistical tests were two-sided, with p < 0.05 considered statistically significant.
Detailed radiomics preprocessing and feature-extraction parameters are provided in Supplementary File S1 to facilitate reproducibility.
3. Results
3.1. Patient Characteristics and Conventional PET Parameters
A total of 153 patients with histologically confirmed breast cancer were included in the final analysis, comprising 115 patients in the development cohort and 38 patients in the independent external validation cohort. The cohorts included patients with different disease stages and systemic treatment approaches, reflecting a clinically heterogeneous breast cancer population. The median age was 56 years (IQR, 48–70) in the development cohort and 54 years (IQR, 46–65) in the external validation cohort, with no statistically significant difference between cohorts (p = 0.1819).
No statistically significant between-cohort differences were observed in menopausal status, histological grade, ER expression, PR expression, HER2 immunohistochemistry (IHC) distribution, Ki-67 proliferation index, or molecular subtype distribution. Following verification of pathology records, HER2 IHC scores of 3+ were identified in 31 patients (27.0%) in the development cohort and 14 patients (36.8%) in the external validation cohort. HER2 IHC scores of 2+ were recorded in 12 patients (10.4%) and 2 patients (5.3%), respectively. The difference in HER2 IHC distribution was not statistically significant (p = 0.2464).
Clinical T3–T4 disease was observed in 24.3% of patients in the development cohort and 28.9% in the external validation cohort (p = 0.5694). The proportions of patients with node-positive disease (N1–N3) were 61.7% and 63.2%, respectively (p = 0.8752). Distant metastatic disease (M1) was present in 42.6% and 31.6% of patients, respectively (p = 0.2286). Complete metabolic response (CMR) of the primary breast tumor was observed in 14 of 115 patients (12.2%) in the development cohort and 18 of 38 patients (47.4%) in the external validation cohort, representing a significant between-cohort difference (p < 0.001). Clinicopathological characteristics and primary-tumor metabolic response distributions are summarized in Table 1.
Table 1.
Clinicopathological characteristics of the development and independent external validation cohorts.
Conventional PET parameters at baseline and follow-up are presented in Table 2. At baseline, metabolic tumor volume (MTV) was significantly higher in the external validation cohort than in the development cohort (8.01 vs. 1.82 cm3, p < 0.001), whereas SUVmax, SUVmean, and total lesion glycolysis (TLG) did not differ significantly between cohorts. At follow-up, the external validation cohort demonstrated significantly higher SUVmax (3.00 vs. 2.00, p = 0.0379) and MTV (4.33 vs. 0.77 cm3, p < 0.001), while differences in SUVmean and TLG were not statistically significant. The percentage reduction in MTV was greater in the development cohort than in the external validation cohort (−57.3% vs. −28.0%, p = 0.0349). No statistically significant between-cohort differences were observed in percentage changes in SUVmax or TLG.
Table 2.
Conventional PET Parameters in the Development and External Validation Cohorts.
3.2. Scenario A: Pretreatment Prediction of Complete Metabolic Response
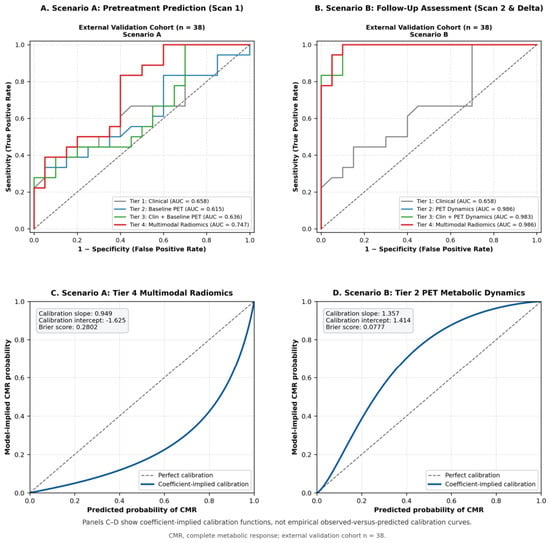
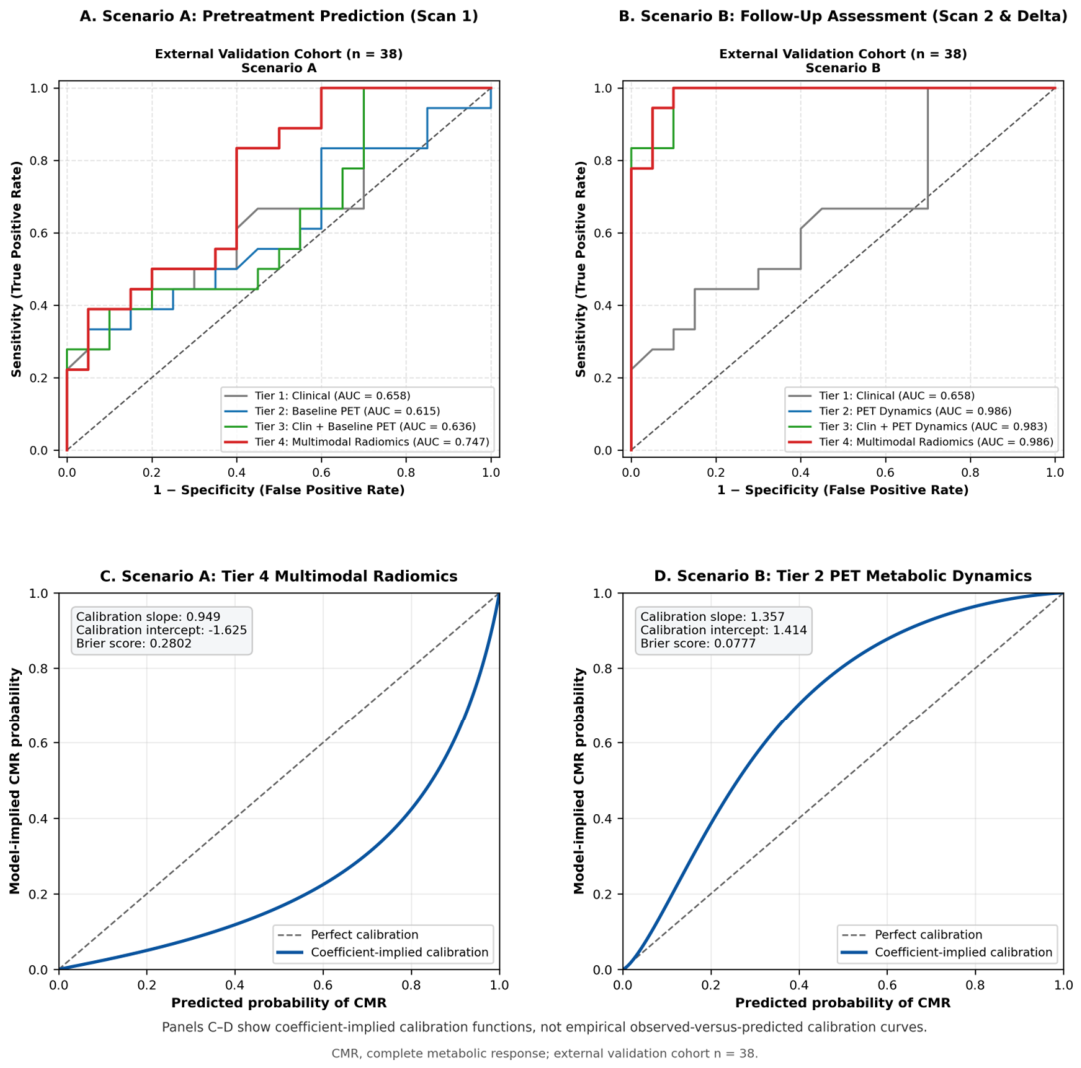
In Scenario A, only pretreatment clinicopathological and baseline PET/CT-derived features were used to predict subsequent complete metabolic response (CMR). Four hierarchical model tiers were evaluated. In the independent external validation cohort, the clinicopathological model (Tier 1) achieved an AUC of 0.658, whereas the conventional PET model (Tier 2) achieved an AUC of 0.615. Combining clinicopathological and conventional PET parameters (Tier 3) resulted in an AUC of 0.636.
Confusion matrices and classification results for the selected models in the independent external validation cohort are provided in Supplementary Figure S1.
The radiomics-containing multimodal model (Tier 4) showed the highest discrimination in the external validation cohort, with an AUC of 0.747 (95% CI, 0.577–0.887). The final Tier 4 model retained PR expression, HER2 status, Ki-67 proliferation index, clinical N stage, and the baseline CT-derived GLDM Large Dependence Emphasis radiomic feature. In comparison, the Tier 3 model retained PR expression, HER2 status, Ki-67 proliferation index, clinical N stage, and baseline SUVmean. Feature selection stability was evaluated across 100 bootstrap iterations. PR status and clinical N stage were each selected in 93% of iterations, followed by HER2 status (84%) and Ki-67 (70%). The baseline CT-derived GLDM Large Dependence Emphasis radiomic feature was selected in 17% of iterations (Supplementary Figure S2).
Compared with Tier 3, the Tier 4 model showed an absolute AUC increase of 0.111. Compared with the clinical-only model (Tier 1), the AUC increase was 0.089, which was not statistically significant by the DeLong test (p = 0.146). Continuous NRI for the Tier 3 versus Tier 4 comparison was 0.000 (95% CI, −0.611 to 0.600), whereas IDI was 0.0826 (p = 0.020). Given the limited size of the external validation cohort, these findings were considered exploratory.
At the locked development-derived Youden decision threshold (0.581), the Tier 4 model yielded a sensitivity of 100.0% (95% CI, 81.5–100.0) and a specificity of 40.0% (95% CI, 19.1–63.9) in the independent external validation cohort, with a balanced accuracy of 70.0% and a Brier score of 0.2802. The calibration slope and intercept were 0.949 and −1.625, respectively. Detailed discrimination, classification, and calibration performance metrics for all Scenario A models are presented in Table 3.
Table 3.
Performance of machine learning models for pretreatment prediction of complete metabolic response (Scenario A).
3.3. Scenario B: Follow-Up Assessment of Complete Metabolic Response
In Scenario B, follow-up PET/CT-derived parameters and longitudinal changes between the baseline and follow-up examinations were evaluated for the assessment of complete metabolic response (CMR). The clinicopathological model (Tier 1) achieved an AUC of 0.658 in the independent external validation cohort. In contrast, the conventional PET metabolic dynamics model (Tier 2), which retained baseline TLG, follow-up SUVmax, follow-up SUVmean, follow-up TLG, and %ΔSUVmax, demonstrated excellent discrimination, with an external validation AUC of 0.986 (95% CI, 0.953–1.000).
The combined clinicopathological and conventional PET model (Tier 3) retained PR expression, clinical N stage, baseline TLG, follow-up SUVmax, and follow-up SUVmean and achieved an external validation AUC of 0.983 (95% CI, 0.948–1.000). The radiomics-containing multimodal model (Tier 4), which retained PR expression, follow-up SUVmax, follow-up SUVmean, %ΔMTV, and baseline CT-derived GLDM Large Dependence Emphasis, achieved an AUC of 0.986 (95% CI, 0.954–1.000).
At the locked development-derived Youden decision cutoffs (0.591, 0.588, and 0.657 for Tiers 2, 3, and 4, respectively), the Tier 2 model yielded a sensitivity of 66.7% (95% CI, 41.0–86.7) and a specificity of 100.0% (95% CI, 83.2–100.0), whereas the Tier 3 model yielded a sensitivity of 72.2% (95% CI, 46.5–90.3) and a specificity of 100.0% (95% CI, 83.2–100.0). The Tier 4 model yielded a sensitivity of 88.9% (95% CI, 65.3–98.6) and a specificity of 95.0% (95% CI, 75.1–99.9). The corresponding balanced accuracies were 83.3%, 86.1%, and 91.9% for Tiers 2, 3, and 4, respectively.
Despite the excellent discrimination of the radiomics-containing Tier 4 model, its AUC was identical to that of the conventional PET Tier 2 model (0.986 vs. 0.986), indicating no additional improvement in discrimination from the inclusion of radiomic features in this follow-up setting. Detailed discrimination, classification, and calibration performance metrics for all Scenario B models are presented in Table 4. The ROC curves for Scenario A and Scenario B are shown in Figure 4A,B, respectively.
Table 4.
Performance of machine learning models for follow-up assessment of complete metabolic response (Scenario B).
Figure 4.
Receiver operating characteristic (ROC) curves and calibration assessment of the prediction models in the independent external validation cohort. (A) ROC curves for the four model tiers in Scenario A (pretreatment). (B) ROC curves for the four model tiers in Scenario B (follow-up). (C) Coefficient-implied calibration function for the selected Scenario A Tier 4 model. (D) Coefficient-implied calibration function for the selected Scenario B Tier 2 model. Panels (C,D) represent coefficient-implied calibration functions rather than empirical observed-versus-predicted calibration curves. The dashed lines represent random classification (AUC = 0.5) in panels (A,B) and perfect calibration in panels (C,D).
3.4. Incremental Model Performance
The incremental performance of the models was evaluated using pairwise AUC comparisons, continuous net reclassification improvement (NRI), and integrated discrimination improvement (IDI).
In Scenario A, the radiomics-containing multimodal model (Tier 4) achieved a higher external validation AUC than the clinicopathological and conventional PET model (Tier 3), with an absolute AUC increase of 0.111. However, this difference did not reach statistical significance by the DeLong test (p = 0.0504). Continuous NRI was 0.000 (95% CI: −0.611 to 0.600; p = 1.000), whereas IDI was 0.0826 (95% CI: 0.021–0.159; p = 0.0203). Compared with the clinicopathological model alone (Tier 1), Tier 4 increased AUC by 0.089 (p = 0.1463), with an NRI of 0.100 (p = 0.7499) and an IDI of 0.0883 (p = 0.0149).
In Scenario B, the conventional PET metabolic dynamics model (Tier 2) demonstrated substantially greater discrimination than the clinicopathological model (Tier 1), with an AUC increase of 0.328 (p = 0.0003). Continuous NRI was 0.3333 (p = 0.0546), while IDI was 0.5314 (p < 0.001). In contrast, the radiomics-containing multimodal model (Tier 4) did not improve discrimination compared with Tier 2 (ΔAUC = 0.000; p = 1.000). Neither NRI (−0.1944; p = 0.4304) nor IDI (−0.0054; p = 0.9019) was statistically significant.
An additional multimodal ablation analysis was performed to assess the contribution of PET and CT radiomic feature groups to model discrimination in both the pretreatment (Scenario A) and follow-up (Scenario B) settings (Supplementary Figure S3).
Given the limited external validation sample size and multiple exploratory comparisons, these findings should be interpreted cautiously. None of the Scenario A AUC comparisons reached statistical significance. Detailed results are summarized in Table 5.
Table 5.
Incremental performance comparisons between machine learning models in the independent external validation cohort.
3.5. Calibration and Clinical Utility
Calibration analysis in the independent external validation cohort demonstrated different patterns between the two scenarios. In Scenario A, the radiomics-containing multimodal Tier 4 model showed a calibration slope of 0.949 and an intercept of −1.625, with a Brier score of 0.2802. In Scenario B, the conventional PET metabolic dynamics Tier 2 model showed a calibration slope of 1.357 and an intercept of 1.414, with a Brier score of 0.0777. These findings indicate that, despite the excellent discriminative performance of the Scenario B Tier 2 model, its absolute predicted probabilities exhibited some degree of miscalibration. Calibration plots for the selected Scenario A and Scenario B models are shown in Figure 4C,D, respectively.
Decision curve analysis was performed to evaluate the potential clinical utility of the models across a range of threshold probabilities. In the independent external validation cohort, the Scenario A Tier 4 model demonstrated net benefit over the treat-all and treat-none strategies across threshold probabilities of approximately 0.15–0.45, whereas the Scenario B Tier 2 model demonstrated net benefit across a broader range of approximately 0.05–0.55 (Supplementary Figure S4).
These findings indicate that discrimination, calibration, and clinical utility provide complementary information on model performance and should be considered together, particularly given the difference in CMR prevalence between the development and external validation cohorts.
4. Discussion
In this two-center study with independent external validation, we evaluated the incremental value of radiomics for predicting and assessing primary-tumor complete metabolic response (CMR) at two clinically distinct timepoints. In the pretreatment setting (Scenario A), the radiomics-containing multimodal model achieved the highest external validation AUC (0.747), compared with 0.636 for the clinicopathological plus conventional PET model. Although the numerical difference in AUC was 0.111, the available analyses did not establish a statistically significant improvement in discrimination. In the follow-up setting (Scenario B), conventional PET metabolic parameters alone provided excellent discrimination (AUC 0.986), and the radiomics-containing model achieved a comparable AUC (0.986). These findings suggest that the incremental contribution of radiomics may be timepoint-dependent: radiomics may provide complementary information before treatment, whereas conventional metabolic measurements may already capture most of the information used to classify primary-tumor metabolic response at follow-up.
Previous studies have reported heterogeneous findings regarding pretreatment PET radiomics in breast cancer. Sollini et al. [14] highlighted the potential clinical contribution of PET/CT radiomics while emphasizing that differences in image acquisition, reconstruction, tumor segmentation, feature extraction, and statistical analysis continue to limit reproducibility and clinical translation. This methodological variability may partly explain the broad range of reported model performances. In a prospective cohort, Gelardi et al. [15] found that neither clinicopathological variables nor baseline 18F-FDG PET radiomic features reliably predicted pathological response to neoadjuvant chemotherapy; the corresponding mean accuracies were approximately 0.42 and 0.50. Their negative findings are important because they illustrate that favorable retrospective radiomic results may not always be reproduced in prospectively collected populations.
Other studies have reported more encouraging results. Antunovic et al. [16] evaluated pretreatment 18F-FDG PET/CT radiomics together with clinicopathological parameters for predicting pathological response after neoadjuvant chemotherapy and reported moderate predictive performance, with AUC values of approximately 0.70–0.73. Araz et al. [17] investigated whether primary-tumor PET/CT radiomic features could predict hormone-receptor status rather than treatment response. Their findings nevertheless support the broader concept that quantitative PET features may reflect biologically relevant tumor characteristics. Ha et al. [18] subsequently demonstrated associations between pretreatment metabolic radiomic patterns, histopathological characteristics, response to neoadjuvant chemotherapy, and prognosis in locally advanced breast cancer. Wang et al. [19] further showed that combining clinicopathological and imaging indicators could provide high discrimination for early pCR prediction, with AUCs of 0.942 in the training cohort and 0.921 in the validation cohort. Although the imaging approach used by Wang et al. was not identical to ours, these studies collectively support multimodal integration. Consistent with this concept, our radiomics-containing multimodal model showed the highest external discrimination in Scenario A; however, the improvement over the clinicopathological plus conventional PET model was not statistically significant and should be interpreted cautiously, particularly given the limited number of CMR events in the development cohort.
Most previous studies evaluated pathological complete response after neoadjuvant chemotherapy, whereas the present study used primary-tumor CMR assessed on follow-up 18F-FDG PET/CT. Pathological and metabolic response are related but not interchangeable endpoints. In addition, our cohort included different systemic treatment approaches rather than a uniform neoadjuvant chemotherapy regimen. Therefore, direct numerical comparisons with previous pCR studies are limited. However, these studies remain relevant because they address the central question of whether pretreatment PET-derived quantitative information can identify tumors more likely to respond to systemic therapy.
Independent validation is particularly important for evaluating the generalizability of radiomics models. Lim et al. [20] developed a pretreatment 18F-FDG PET-based model for predicting pCR and reported an AUC of 0.963 in the training cohort, which decreased to 0.731 and 0.729 in the internal and external validation cohorts, respectively. Incorporating HER2 status improved the integrated model, supporting the potential value of combining radiomic and clinical information. Chen et al. [21] evaluated pretreatment 18F-FDG PET/CT radiomics in a multicenter, multi-scanner setting and maintained moderate predictive performance across independent test datasets, with AUCs generally ranging from approximately 0.70 to 0.77. More recently, Li et al. [22] developed and validated a multicenter 18F-FDG PET/CT radiomic nomogram for predicting axillary lymph-node status after neoadjuvant chemotherapy, highlighting the broader applicability of radiomics to different clinical endpoints in breast cancer.
Their optimal radiomics model achieved a test-set AUC of 0.798, which increased to 0.811 after incorporating clinical characteristics. In our study, the final models were locked before being applied to the independent second-center cohort, without feature reselection, threshold adjustment, recalibration, or refitting. The pretreatment radiomics-containing model achieved an external validation AUC of 0.747 despite institutional and scanner differences, suggesting potential transportability while avoiding an overly optimistic interpretation of development-cohort performance.
More recently, Aksu et al. [23] evaluated baseline 18F-FDG PET radiomics for predicting pCR in 137 patients with HER2-positive breast cancer. Their combined model achieved an internally validated AUC of 0.731 and significantly outperformed clinical and conventional PET models, although it did not significantly outperform the radiomics-only model. Because that analysis was single-center and relied on repeated cross-validation, the authors emphasized the need for external confirmation. Our findings provide complementary evidence under a more stringent transportability setting: a locked pretreatment multimodal model achieved an AUC of 0.747 in an independent second-center cohort, although its improvement over clinicopathological and conventional PET information did not reach statistical significance. These studies should not be regarded as direct replications because their populations and endpoints differed—HER2-positive pCR versus primary-tumor CMR. Taken together, however, they support the potential complementary value of baseline PET radiomics while emphasizing the importance of independent validation and cautious interpretation of incremental performance. Furthermore, our separate evaluation of pretreatment and follow-up scenarios suggests that the incremental contribution of radiomics may depend on the imaging timepoint.
Longitudinal PET studies provide further context for our follow-up findings. Jiang et al. [5] evaluated baseline and treatment-related 18F-FDG PET/CT information using radiomic and deep-learning approaches for chemotherapy-response prediction. Gómez et al. [6] investigated multiple combinations of feature-selection and machine learning methods for metabolic response prediction in metastatic breast cancer lesions. Together, these studies indicate that quantitative PET features and treatment-related imaging changes may contribute to response modeling. Our Scenario B, however, showed that follow-up and longitudinal conventional PET parameters alone achieved an external AUC of 0.986, with no improvement after adding radiomics. Importantly, because primary-tumor CMR was defined using follow-up PET findings, the inclusion of metabolic parameters derived from the same examination introduces overlap between the predictors and the imaging-defined outcome. Therefore, the high discrimination observed in Scenario B should be interpreted as classification of primary-tumor metabolic response rather than independent prediction of treatment efficacy. Once treatment-induced metabolic changes are visible, parameters directly reflecting residual tumor activity may already contain most of the information required to distinguish CMR from ICMR. Thus, the lack of additional radiomic benefit at follow-up does not contradict its possible pretreatment contribution; rather, it suggests that incremental value depends on the information already available at the relevant clinical timepoint.
Discrimination alone does not fully characterize model performance. In Scenario A, the radiomics-containing model showed imperfect calibration but potential net benefit across selected threshold probabilities. In Scenario B, excellent discrimination coexisted with a positive calibration intercept, indicating that accurate ranking of patients did not necessarily yield well-calibrated absolute probabilities in the external cohort. The substantial difference in CMR prevalence between the development and external validation cohorts may have contributed to this finding. Therefore, calibration and clinical utility should be considered together with AUC when evaluating the transportability of predictive imaging models.
The principal strengths of this study were the use of an independent external validation cohort, evaluation of locked models without refitting, and direct comparison of hierarchical models at two distinct clinical timepoints. The inclusion of clinicopathological variables, conventional PET parameters, and radiomic features allowed the incremental contribution of radiomics to be assessed rather than reporting radiomics performance in isolation. Nevertheless, several limitations should be acknowledged. The sample size was relatively small, particularly in the external cohort, and only 14 CMR events occurred in the development cohort. Although L1 regularization and a maximum of five predictors were used to limit model complexity, overfitting and instability in feature selection cannot be excluded. In particular, the baseline CT-derived GLDM Large Dependence Emphasis feature was selected in only 17% of bootstrap iterations, indicating limited selection stability.
Differences in disease stage, systemic treatment, PET/CT systems, and CMR prevalence between centers introduced clinical and technical heterogeneity. The CMR rate differed substantially between the development cohort (14/115, 12.2%) and the external validation cohort (18/38, 47.4%), potentially affecting model calibration and generalizability. In the development cohort, 37 of 152 initially screened patients were excluded because complete paired PET/CT imaging datasets were unavailable. In the external validation cohort, 19 of 57 candidate patients were excluded because archived PET/CT DICOM images could not be retrieved for radiomic analysis. As clinicopathological data were not collected for these excluded external candidates, comparison with included patients was not possible, and selection bias cannot be excluded. Scanner differences may have affected quantitative and radiomic measurements, although the use of different scanners also provided an opportunity to evaluate cross-center transportability.
The Scenario A improvement in AUC did not reach statistical significance by the DeLong test, and continuous NRI was not significant despite a significant IDI. Given the limited number of events and multiple exploratory comparisons, the incremental value of radiomics should be considered hypothesis-generating rather than established.
In Scenario B, the high discrimination achieved by conventional PET parameters was partly attributable to their direct relationship with residual FDG uptake, which was also used to define the imaging-based CMR endpoint. This predictor–outcome overlap limits the interpretation of Scenario B as an independent assessment of treatment efficacy. Furthermore, different segmentation strategies were applied according to metabolic response: baseline volumes of interest (VOIs) were transferred to the corresponding follow-up tumor bed in CMR cases, whereas residual metabolically active lesions were newly delineated in ICMR cases. Separate interobserver reproducibility testing was not performed for individual radiomic features—including the retained baseline CT-derived GLDM Large Dependence Emphasis feature—and consensus review of PET-based MTV segmentation cannot be regarded as evidence of CT texture reproducibility; differences in VOI geometry and sampled tissue composition may still have influenced radiomic feature extraction. The robustness of model performance to alternative segmentation strategies was not specifically evaluated. Treatment-related necrosis, fibrosis, and inflammation may have further influenced follow-up imaging features independently of viable tumor burden.
Finally, long-term oncological outcomes were not evaluated. Larger prospective multicenter studies with standardized imaging protocols, consistent segmentation strategies, adequate event numbers, and independent clinical or pathological endpoints are required before clinical implementation.
5. Conclusions
In this two-center study with independent external validation, the integration of clinicopathological variables, conventional 18F-FDG PET/CT parameters, and radiomic features showed potential for assessing primary-tumor metabolic response in breast cancer. In the pretreatment setting (Scenario A), the multimodal model achieved an external validation AUC of 0.747, but its improvement over the model without radiomics was not statistically significant. Although IDI suggested incremental information, the lack of significant improvement in AUC and continuous NRI warrants cautious interpretation.
In the follow-up setting (Scenario B), conventional PET parameters achieved excellent discrimination (AUC = 0.986), with no additional discriminative benefit from radiomics. Because these parameters were derived from the same PET examination used to define complete metabolic response, this finding should be interpreted as metabolic response classification rather than independent prediction of treatment efficacy.
Overall, the incremental value of radiomics remains uncertain. Larger prospective multicenter studies with standardized imaging protocols and independent clinical or pathological endpoints are needed to establish its clinical utility.
Supplementary Materials
The following supporting information can be downloaded at: https://www.mdpi.com/article/10.3390/diagnostics16223772/s1, Supplementary File S1: Radiomics preprocessing, feature-extraction parameters, and PyRadiomics configuration; Supplementary Table S1: Treatment status at follow-up PET/CT; Supplementary Figure S1: Confusion matrices and classification results for the selected models in the independent external validation cohort.; Supplementary Figure S2: Feature-selection stability analysis based on 100 bootstrap iterations; Supplementary Figure S3: Multimodal ablation analysis evaluating the contribution of PET and CT radiomic feature groups to model discrimination in Scenarios A and B; Supplementary Figure S4: Decision curve analysis of the selected models in the independent external validation cohort.
Author Contributions
Conceptualization, O.S.; methodology, O.S. and E.G.K.; software, E.G.K.; formal analysis, E.G.K.; investigation, O.S. and F.H.; data curation, O.S., I.F.O. and F.H.; external validation data acquisition, I.F.O. and O.S.; writing—review and editing, O.S. and E.G.K.; supervision, O.S. All authors have read and agreed to the published version of the manuscript.
Funding
This research received no external funding.
Institutional Review Board Statement
The study was conducted in accordance with the Declaration of Helsinki, and approved by the Institutional Ethics Committee (protocol code No. 2026/281 and date of approval 29 April 2026).
Informed Consent Statement
Patient consent was waived due to the retrospective design.
Data Availability Statement
The data that support the findings of this study are available from the corresponding author upon reasonable request. The data are not publicly available because of patient privacy and institutional restrictions.
Acknowledgments
During the preparation of this manuscript, the authors used ChatGPT (OpenAI GPT-6) to assist with English language editing, grammar, and improving the clarity and readability of the text. The tool was not used to generate or modify patient data, perform statistical analyses, or determine scientific conclusions. All AI-assisted revisions were reviewed and approved by the authors, who take full responsibility for the content of the manuscript.
Conflicts of Interest
The authors declare no conflicts of interest.
References
- Bray, F.; Laversanne, M.; Sung, H.; Ferlay, J.; Siegel, R.L.; Soerjomataram, I.; Jemal, A. Global cancer statistics 2022: GLOBOCAN estimates of incidence and mortality worldwide for 36 cancers in 185 countries. CA Cancer J. Clin. 2024, 74, 229–263. [Google Scholar] [CrossRef] [Scilit]
- Łukasiewicz, S.; Czeczelewski, M.; Forma, A.; Baj, J.; Sitarz, R.; Stanisławek, A. Breast Cancer—Epidemiology, Risk Factors, Classification, Prognostic Markers, and Current Treatment Strategies—An Updated Review. Cancers 2021, 13, 4287. [Google Scholar] [CrossRef] [Scilit]
- Fang, S.; Xia, W.; Zhang, H.; Ni, C.; Wu, J.; Mo, Q.; Jiang, M.; Guan, D.; Yuan, H.; Chen, W. A real-world clinicopathological model for predicting pathological complete response to neoadjuvant chemotherapy in breast cancer. Front. Oncol. 2024, 14, 1323226. [Google Scholar] [CrossRef] [Scilit]
- Hadebe, B.; Harry, L.; Ebrahim, T.; Pillay, V.; Vorster, M. The role of PET/CT in breast cancer. Diagnostics 2023, 13, 597. [Google Scholar] [CrossRef] [Scilit]
- Jiang, Z.; Low, J.; Huang, C.; Yue, Y.; Njeh, C.; Oderinde, O. 18F-FDG PET/CT-based deep radiomic models for enhancing chemotherapy response prediction in breast cancer. Med. Oncol. 2025, 42, 425. [Google Scholar] [CrossRef] [Scilit]
- Gómez, O.V.; Herraiz, J.L.; Udías, J.M.; Haug, A.; Papp, L.; Cioni, D.; Neri, E. Analysis of cross-combinations of feature selection and machine-learning classification methods based on [18F]FDG PET/CT radiomic features for metabolic response prediction of metastatic breast cancer lesions. Cancers 2022, 14, 2922. [Google Scholar] [CrossRef] [Scilit]
- García Vicente, A.M.; Soriano Castrejón, A.; Pruneda-González, R.E.; Calvo, G.F.; Sánchez, M.M.; Cabellos, R.Á.; Aunión, R.E.; Calatayud, F.R. Basal 18F-FDG PET/CT as a predictive biomarker of tumor response for neoadjuvant therapy in breast cancer. Rev. Esp. Med. Nucl. Imagen Mol. 2016, 35, 81–87. [Google Scholar] [CrossRef] [Scilit]
- Yang, L.; Chang, J.; He, X.; Peng, M.; Zhang, Y.; Wu, T.; Xu, P.; Chu, W.; Gao, C.; Cao, S.; et al. PET/CT-based radiomics analysis may help to predict neoadjuvant chemotherapy outcomes in breast cancer. Front. Oncol. 2022, 12, 849626. [Google Scholar] [CrossRef] [Scilit]
- Crivelli, P.; Ledda, R.E.; Parascandolo, N.; Fara, A.; Soro, D.; Conti, M. A new challenge for radiologists: Radiomics in breast cancer. BioMed Res. Int. 2018, 2018, 6120703. [Google Scholar] [CrossRef] [Scilit]
- Jia, T.; Lv, Q.; Cai, X.; Ge, S.; Sang, S.; Zhang, B.; Yu, C.; Deng, S. Radiomic signatures based on pretreatment 18F-FDG PET/CT, combined with clinicopathological characteristics, as early prognostic biomarkers among patients with invasive breast cancer. Front. Oncol. 2023, 13, 1210125. [Google Scholar] [CrossRef] [Scilit]
- PDQ Adult Treatment Editorial Board. PDQ Breast Cancer Treatment; Breast Cancer Treatment (PDQ®)–Health Professional Version; National Cancer Institute: Bethesda, MD, USA, 2025. Available online: https://pubmed.ncbi.nlm.nih.gov/26389187/ (accessed on 16 September 2026).
- Boellaard, R.; Delgado-Bolton, R.; Oyen, W.J.G.; Giammarile, F.; Tatsch, K.; Eschner, W.; Verzijlbergen, F.J.; Barrington, S.F.; Pike, L.C.; Weber, W.A.; et al. FDG PET/CT: EANM procedure guidelines for tumour imaging: Version 2.0. Eur. J. Nucl. Med. Mol. Imaging 2015, 42, 328–354. [Google Scholar] [CrossRef] [Scilit]
- Young, H.; Baum, R.; Cremerius, U.; Herholz, K.; Hoekstra, O.; Lammertsma, A.A.; Pruim, J.; Price, P. Measurement of clinical and subclinical tumour response using [18F]-fluorodeoxyglucose and positron emission tomography: Review and 1999 EORTC recommendations. Eur. J. Cancer 1999, 35, 1773–1782. [Google Scholar] [CrossRef] [Scilit]
- Sollini, M.; Cozzi, L.; Ninatti, G.; Antunovic, L.; Cavinato, L.; Chiti, A.; Kirienko, M. PET/CT radiomics in breast cancer: Mind the step. Methods 2021, 188, 122–132. [Google Scholar] [CrossRef] [Scilit]
- Gelardi, F.; Cavinato, L.; De Sanctis, R.; Ninatti, G.; Tiberio, P.; Rodari, M.; Zambelli, A.; Santoro, A.; Fernandes, B.; Chiti, A.; et al. The Predictive Role of Radiomics in Breast Cancer Patients Imaged by [18F]FDG PET: Preliminary Results from a Prospective Cohort. Diagnostics 2024, 14, 2312. [Google Scholar] [CrossRef] [Scilit]
- Antunovic, L.; De Sanctis, R.; Cozzi, L.; Kirienko, M.; Sagona, A.; Torrisi, R.; Tinterri, C.; Santoro, A.; Chiti, A.; Zelic, R.; et al. PET/CT radiomics in breast cancer: Promising tool for prediction of pathological response to neoadjuvant chemotherapy. Eur. J. Nucl. Med. Mol. Imaging 2019, 46, 1468–1477. [Google Scholar] [CrossRef] [Scilit]
- Araz, M.; Soydal, Ç.; Gündüz, P.; Kırmızı, A.; Bakırarar, B.; Dizbay Sak, S.; Özkan, E. Can Radiomics Analyses in 18F-FDG PET/CT Images of Primary Breast Carcinoma Predict Hormone Receptor Status? Mol. Imaging Radionucl. Ther. 2022, 31, 49–56. [Google Scholar] [CrossRef] [Scilit]
- Ha, S.; Park, S.; Bang, J.I.; Kim, E.K.; Lee, H.Y. Metabolic radiomics for pretreatment 18F-FDG PET/CT to characterize locally advanced breast cancer: Histopathologic characteristics, response to neoadjuvant chemotherapy, and prognosis. Sci. Rep. 2017, 7, 1556. [Google Scholar] [CrossRef] [Scilit]
- Wang, H.; Lu, Y.; Li, Y.; Li, S.; Zhang, X.; Geng, C. Nomogram for early prediction of pathological complete response to neoadjuvant chemotherapy in breast cancer combining both clinicopathological and imaging indicators. Curr. Probl. Cancer 2022, 46, 100914. [Google Scholar] [CrossRef] [Scilit]
- Lim, C.H.; Choi, J.Y.; Choi, J.H.; Lee, J.H.; Lee, J.; Lim, C.W.; Kim, Z.; Woo, S.-K.; Park, S.B.; Park, J.M. Development and External Validation of 18F-FDG PET-Based Radiomic Model for Predicting Pathologic Complete Response after Neoadjuvant Chemotherapy in Breast Cancer. Cancers 2023, 15, 3842. [Google Scholar] [CrossRef] [Scilit]
- Chen, K.; Wang, J.; Li, S.; Zhou, W.; Xu, W. Predictive value of 18F-FDG PET/CT-based radiomics model for neoadjuvant chemotherapy efficacy in breast cancer: A multi-scanner/center study with external validation. Eur. J. Nucl. Med. Mol. Imaging 2023, 50, 1869–1880. [Google Scholar] [CrossRef] [Scilit]
- Li, Y.; Chen, K.; Jin, L.; Huang, H. Development and validation of an 18F-FDG PET/CT radiomic nomogram for predicting axillary lymph-node status after neoadjuvant chemotherapy for breast cancer: A multicenter study. Ann. Nucl. Med. 2025, 39, 1326–1336. [Google Scholar] [CrossRef] [Scilit]
- Aksu, A.; Vezir, Ö.K.; Güç, Z.G.; Küçüker, K.A.; Alacacıoğlu, A.; Turgut, B. Baseline 18F-FDG PET radiomics for predicting pathological complete response in HER2-positive breast cancer: Incremental value beyond routine clinical variables. Clin. Transl. Imaging 2026. [Google Scholar] [CrossRef] [Scilit]

Disclaimer/Publisher’s Note: The statements, opinions and data contained in all publications are solely those of the individual author(s) and contributor(s) and not of MDPI and/or the editor(s). MDPI and/or the editor(s) disclaim responsibility for any injury to people or property resulting from any ideas, methods, instructions or products referred to in the content. |
© 2026 by the authors. Licensee MDPI, Basel, Switzerland. This article is an open access article distributed under the terms and conditions of the Creative Commons Attribution (CC BY) license.