


Abstract
Background: Malaria is a life-threatening disease caused by Plasmodium species, which is endemic in tropical and subtropical regions worldwide. In clinical settings, experienced parasitologists perform microscopic examinations of thick/thin blood slides. This method is labour-intensive and is adversely affected by inter- and intra-observer variability among the microscopists. The present study aimed to develop a malaria screening algorithm using computer vision to identify and classify malaria parasite-infected red blood cells (RBC) from microscopic blood slide images. Methods: The proposed classification methodology first employs digital image processing techniques, the watershed transform, to preprocess the raw images, followed by connected component labelling to accurately segment and isolate individual RBCs from the background. To classify these segmented cells as either normal or infected, convolutional neural networks (CNNs) were utilized, leveraging their ability to automatically extract relevant features through deep, hidden layers, thus eliminating the need for manual feature engineering. Results: To compare and determine the most effective classification engine, the study developed and evaluated five distinct models: four well-established transfer learning architectures (VGG16, VGG19, DenseNet121, and InceptionV3), alongside a newly proposed custom CNN model. A total of 2422 segmented RBC images were used for the training, and 692 different images were used for testing, with the VGG model showing the best accuracy at 99.57%. The proposed CNN architecture also showed competitive results with 99.14% accuracy. Conclusions: Transfer learning models demonstrated remarkable accuracy for malaria parasite classification from blood smear slides, with VGG19 (99.57%) achieving the highest accuracy on diverged datasets for the test images. The analysis demonstrates the potential of this approach as a computational aid for future image-based malaria screening in conjunction with existing diagnostic tests.
1. Introduction
Malaria is a potentially life-threatening disease caused by protozoan parasites of the genus Plasmodium, which infect and proliferate within the human red blood cells (RBCs). The transmission of malaria occurs via the bite of infected female Anopheles mosquitoes, which serve as biological vectors for the parasite. Multiple species, including Plasmodium falciparum, P. vivax, P. malariae, P. ovale, and P. knowlesi, can infect humans. The level of malaria parasitemia (MP) is assessed by quantifying the RBCs infected by Plasmodium parasites, which helps determine the severity of the infection [1]. The most effective approach to preventing malaria is early diagnosis and prompt treatment. In 2023, there were 263 million cases and 597,000 deaths worldwide, as reported by the World Health Organization [2]. Children under five years old are the most vulnerable group, comprising 61% of estimated malaria-related deaths. Thick blood smears are utilized to detect the presence of Plasmodium parasites, offering enhanced sensitivity for parasite detection compared to thin smears. In contrast, thin blood slides are utilized to identify the specific species and life-cycle stage and to compute parasitemia. Alternative techniques are available, such as polymerase chain reaction (PCR)-based tests, which are expensive for wide use in disease-endemic regions, and rapid diagnostic tests (RDTs), which have limited sensitivity [3,4,5]. Researchers have developed several computer-aided diagnosis (CAD) software programs for identifying malaria-infected cells from slide images. Advancements in computer vision approaches for malaria diagnosis leverage image processing, machine learning (ML), and deep learning (DL) methods [6,7]. The CAD image analysis software employs ML methods that utilize hand-crafted features for diagnosing malaria from slide images [6,7,8]. The classification of malaria parasites is done in two stages using ML techniques. The initial stage classifies cells as either normal or infected by analyzing texture and color features. The subsequent stage incorporates additional attributes, including shape, relative size, parasite color, as well as the number, size, and positions of parasites within the cell, to distinguish parasite species (falciparum, vivax, malariae, or ovale). A normalized RGB color space [9] technique is used for pixel classification to differentiate between RBCs and the background. Subsequently, an inclusion-tree representation is used to identify the RBCs. A support vector machine (SVM) employing a polynomial kernel is implemented to classify RBCs as either infected or normal. A detection approach has been proposed [10] that uses thresholding and stage classification (schizont and trophozoite) based on 23 morphological features extracted from unstained slides. This method applies k-nearest neighbour (KNN), logistic regression (LR), and linear discriminant analysis (LDA) classifiers. Another method focuses on separating overlapping cells [11] by utilizing morphological operations and analyzing focal points in concave regions to enhance RBC quantification. Additionally, it extracts histogram-based features such as LBP and HOG to classify malaria parasites into different life-cycle stages, using Naïve Bayes, KNN, and multi-class SVM.
However, these ML methods with hand-crafted feature engineering for the automated malaria analysis process have limitations. They need expertise in analyzing textural and morphological features, as well as the position and angle of the image’s region of interest (ROI), and background. To overcome these challenges, data-driven DL models combine layers with non-linear processing units that can solve this problem by self-learning features in the raw data without designing any feature sets, extracting the end-to-end hierarchical features, and performing classification. DL methods have revolutionized the field of artificial intelligence and ML, promising scalable, improved performance with increased computational resources and data size [12]. The method based on CNNs has played a vital role in this revolution and has performed very well in medical image analysis.
The DL models using CNNs, a hierarchical architecture of learning, have shown promising results in image recognition, localization, and classification tasks [13,14]. The CNN models utilize spatial correlations between neighbouring voxels or pixels to capture local patterns, such as edges in an image, thereby minimizing the number of parameters that must be learned. The key features of CNNs include local connectivity, shared weights, pooling layers, and multiple layers. This improves the accuracy of the feedforward-backpropagation training procedure. CNN-based DL models, including AlexNet [13], VGGNet [15], ResNet [16], GoogLeNet [17], Xception [18], Inception-V3 [19], and DenseNet [20], have demonstrated notable advancements in performance. These models achieve significant improvements in CNN efficiency by utilizing fewer parameters and computations for natural image classification tasks conducted as part of the ImageNet Large-Scale Visual Recognition Challenge (ILSVRC) [21].
The current literature underscores the adoption of transfer learning in medical image analysis, primarily attributed to the constrained availability of annotated datasets. A model trained on the ImageNet dataset is employed as generic feature extractor and fine-tuned on specific tasks on the new datasets for image recognition [22]. Current studies reveal that the application of CNN-based DL models provides promising performance in detecting malaria parasites from thin blood slide images. A comparison of kernel-based approaches [23], such as SVM, and pre-trained CNN models, i.e., GoogLeNet, AlexNet, and LeNet, was used to classify normal and parasitized cells. The results showed the CNN models outperformed the SVM classifier, achieving an accuracy of 95%, while the SVM achieved 92%. The authors [24] proposed a custom-designed CNN model that analyzes the focus stack of slide smear images and achieves a 98.77% Matthews Correlation Coefficient (MCC) score. In another work [25], authors used a large-scale clinical annotated dataset to find the optimal layers of a pre-trained DL model for feature extraction to discriminate between normal and parasitized cells. They also performed statistical validation of their results and observed that the pre-trained ResNet-50 model demonstrated superior performance compared to other CNN models, achieving an accuracy of 95.9%. In a recent work [26], authors have constructed an ensemble model with SqueezeNet and VGG19 to reduce model variance and improve generalization and robustness towards classifying normal and parasitized cells. The related work on malaria classification is shown in Table 1.
Table 1.
Deep learning architectural and accuracy comparison.
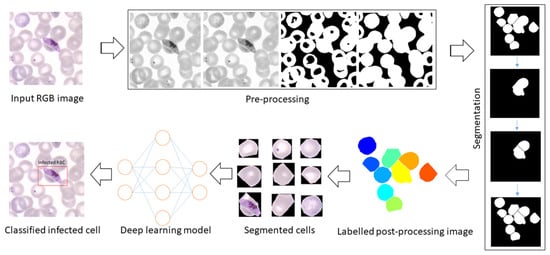
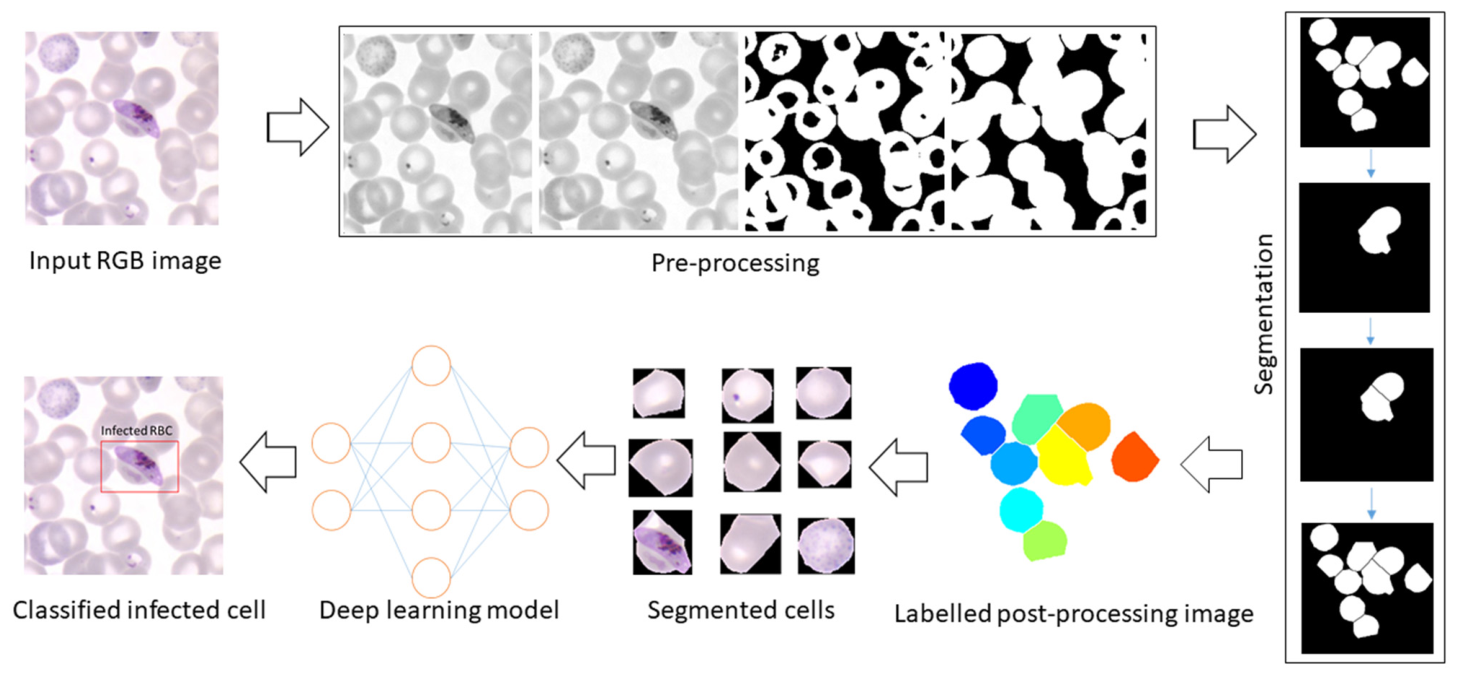
This study presents a computer-assisted method to enhance automated malaria disease screening. A schematic representation of the algorithm employed is shown in Figure 1. This includes the introduction of a method for segmentation of RBCs from microscopic blood slide images, followed by their classification as healthy or infected. The predominant species, P. falciparum and P. vivax, are identified based on internal characteristics such as texture, morphology, and other features. A complete automation of RBC quantification is hindered by overlapping cells, so the present work also explored the quantification problem of clumped cells. This method distinguished overlapping shapes through the application of morphological and convexity analysis, which relies on implicit conditions related to cell size and shape and separates them using a watershed. Additionally, DL-based CNN architectures have been designed for the classification of malaria-infected cells, utilizing segmented RBCs extracted from whole images.
Figure 1.
Overview of the proposed methodology for parasite classification.
The primary contributions of this study include the development of architectures for various pre-trained DL models through modifications to their final fully connected (FC) layers and the creation of customized CNN models for the classification of parasitized and uninfected cells. Additionally, a comparative assessment was conducted to identify the most effective CNN architecture.
2. Materials and Methods
2.1. Sample Image Dataset
Database 1 (DB1): Microscopic images of Giemsa-stained thin peripheral blood slides from human blood samples infected with Plasmodium parasites were captured from the slides by trained microscopists using an Olympus BX3-25ND25 digital microscope (100× magnification and ten μm pixel resolution) at the Department of Medical Parasitology, Postgraduate Institute of Medical Education and Research (PGIMER), Chandigarh. The study received approval from the Institute Ethics Committee (IEC) of PGIMER, Chandigarh (PGI/IEC/2021/001348).
Database 2 (DB2): This dataset has been downloaded from the online repository DPDx-Laboratory Identification of Parasites website, managed by the Division of Parasitic Diseases and Malaria (DPDM) at the CDC, Atlanta, USA (Centers for Disease Control and Prevention) [30]. The exact numbers of samples and RBCs are given in Table 2.
Table 2.
DB1 and DB2 dataset statistics.
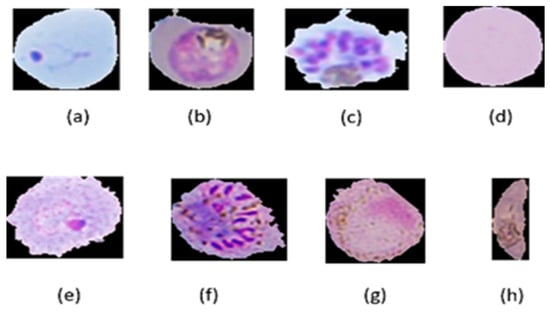
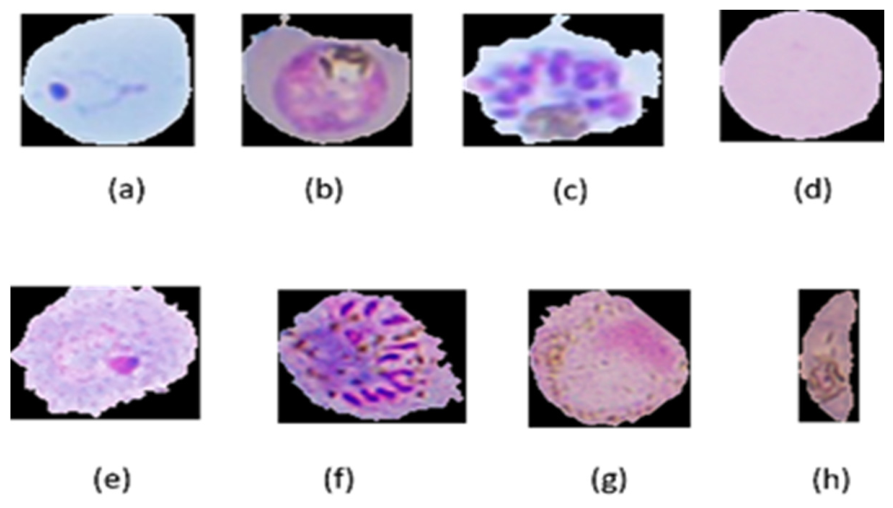
The study focused on two parasite species infected cells, which include a combination of seven life-cycle stages infected cells (PFR: P. falciparum ring, PFT: P. falciparum trophozoite, PFS: P. falciparum schizont, NOR: normal, PVT: P. vivax tropphozoite, PVS: P. vivax schizont, PVG: P. vivax gametocyte, and PFG: P. falciparum gametocyte). Figure 2 represents a sample of infected and normal cells, highlighting the target cells for both the datasets (DB1 and DB2).
Figure 2.
Cell Images: (a) PFR, (b) PFT, (c) PFS, (d) NOR, (e) PVR, (f) PVS, (g) PVG, and (h) PFG.
2.2. Segmentation of RBCs
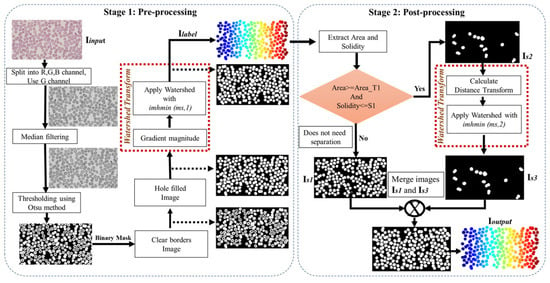
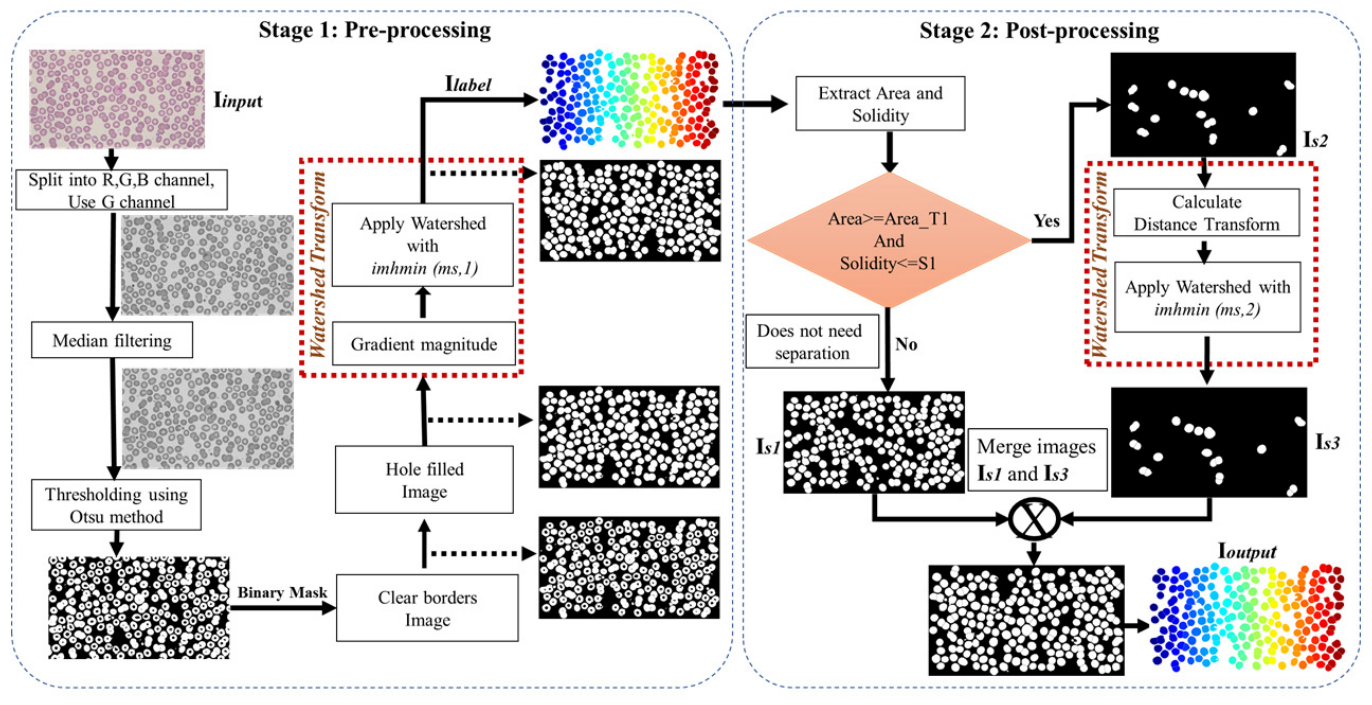
The proposed pipeline leverages standard image enhancement techniques followed by a watershed to accurately delineate cell boundaries. A two-stage distance transform watershed is applied for accurate segmentation and to overcome the overlapping cells segmentation, as well as the over-segmentation of the cells, from complete microscopic images.
The first stage addresses the issue of over-segmentation (Figure 3). An h-min value of 1 is applied along with the distance transform watershed to produce the initial segmented image. However, some of the overlapping RBCs remain unsplit, i.e., under-segmentation (Figure 3). In the second stage, clusters within the remaining overlapping cells of the image are identified based on key characteristics of the RBCs, such as their convexity and size. For each enclosed region, the solidity value is defined as follows:
where Area denotes the area of the closed region, and Convex Area refers to the area of the smallest convex polygon enclosing the closed region.
Figure 3.
Flowchart of the distance transform watershed algorithm.
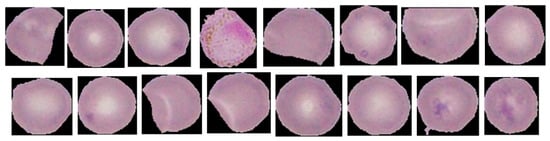
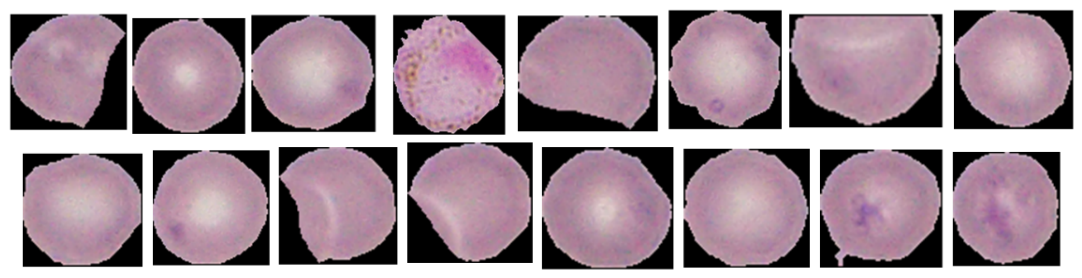
The final step in the segmentation process involves labelling each RBC and extracting its corresponding region of interest (ROI) from the original image, resulting in a set of cropped RBC images. This was achieved using the connected component labelling method, where similar pixels are grouped based on 8-neighborhood pixel connectivity. Once these groups, or blobs, were identified, each was assigned a unique label. The label data also contained the coordinates of the bounding box, which were then used to extract the original RBCs from the color images. Since other cells, such as platelets and white blood cells (WBCs) may also be segmented, area-based filtering is applied to retain only RBCs (DB1: 3500–5000 px, DB2: 2100–3000 px), by measuring the average pixel area for RBCs in the respective databases. This method removes the irrelevant cells based on size. The resulting RBCs are then cropped and resized to standardized color images for consistent analysis. The segmented cells from the acquired input image, using the proposed method as shown in Figure 3, are highlighted in Figure 4.
Figure 4.
Segmented red blood cell images from the input image.
2.3. Binary Classification
2.3.1. Data Preparation and Augmentation
All segmented RBC images were resized to 240 × 320 and 128 × 128 pixels to meet the input requirements of both pre-trained and custom CNN models, and normalized to speed up convergence. The dataset was split into training (70%), validation (10%), and testing (20%) sets, with 2422 images for training, 348 for validation, and 692 for testing—balanced across infected and normal RBCs. To improve generalization and prevent overfitting, image augmentation was applied to the training set, creating a more diverse dataset. Augmentation techniques included height/width shifts, rotation, zoom, shearing, and horizontal flips, performed dynamically during training. These augmented datasets were used across all models with adjusted final layers. Due to limited annotated medical data, such augmentation is critical for building robust generalized models for malaria diagnosis.
2.3.2. A Customized Convolution Neural Network
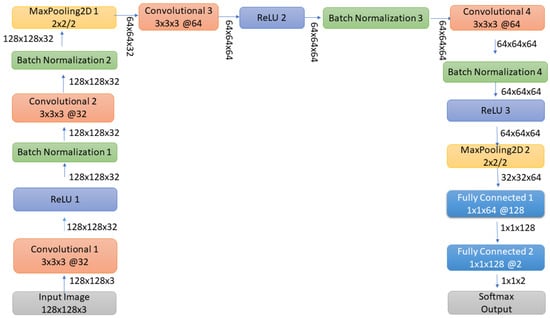
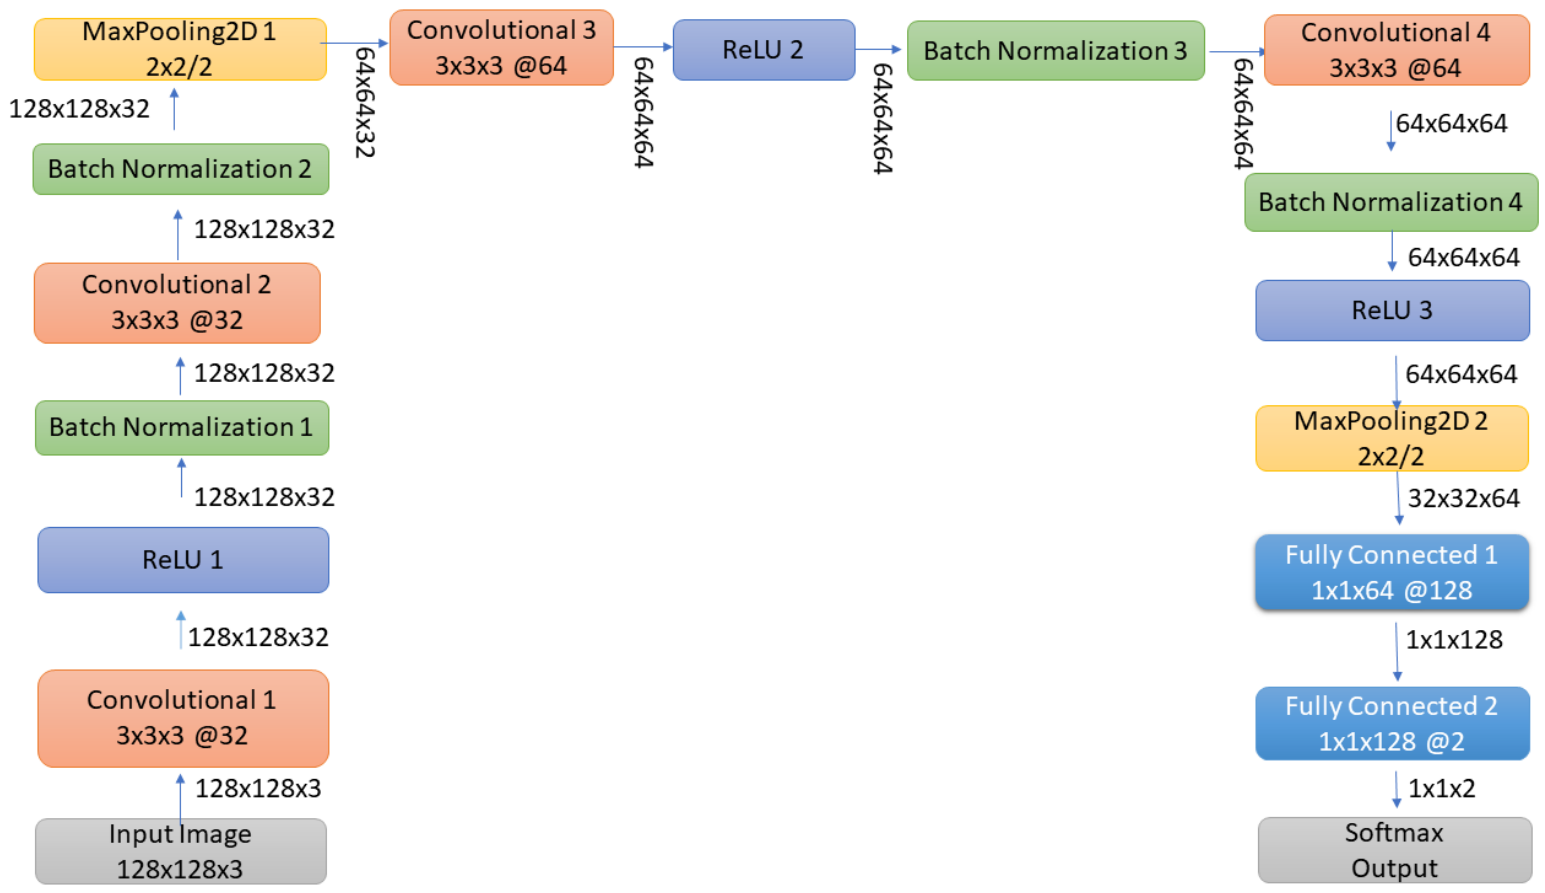
The architecture of the proposed CNN model for classifying segmented RBC images (128 × 128 × 3) is illustrated in Figure 5. The model consists of four convolutional layers and two fully connected layers. All convolutional layers utilize 3 × 3 filters with a stride of 1.
Figure 5.
The architecture of the customized CNN model.
The first two convolutional layers each have 32 filters, while the third and fourth have 64 filters. To enhance learning efficiency, each convolutional layer is followed by a sandwich block comprising a ReLU activation function and batch normalization. Max-pooling layers with a 2 × 2 window and a stride of 2 are applied after the second and fourth convolutional layers to reduce spatial dimensions and retain important features. The output feature maps from the final convolutional layer are flattened and passed to the first fully connected (dense) layer with 128 neurons. Finally, the second fully connected layer serves as a SoftMax function that outputs the probability distribution across the target classes (infected vs. normal RBCs).
2.3.3. Transfer Learning
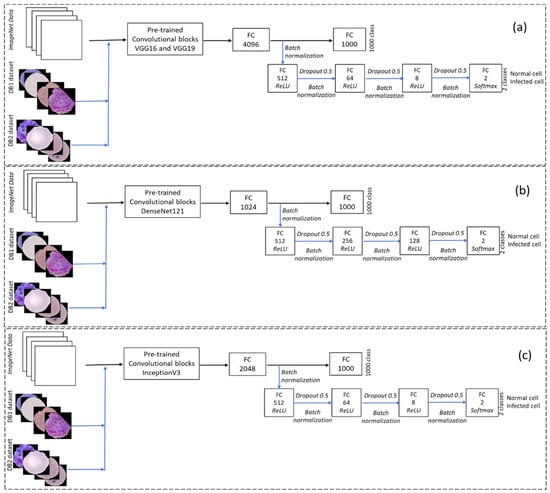
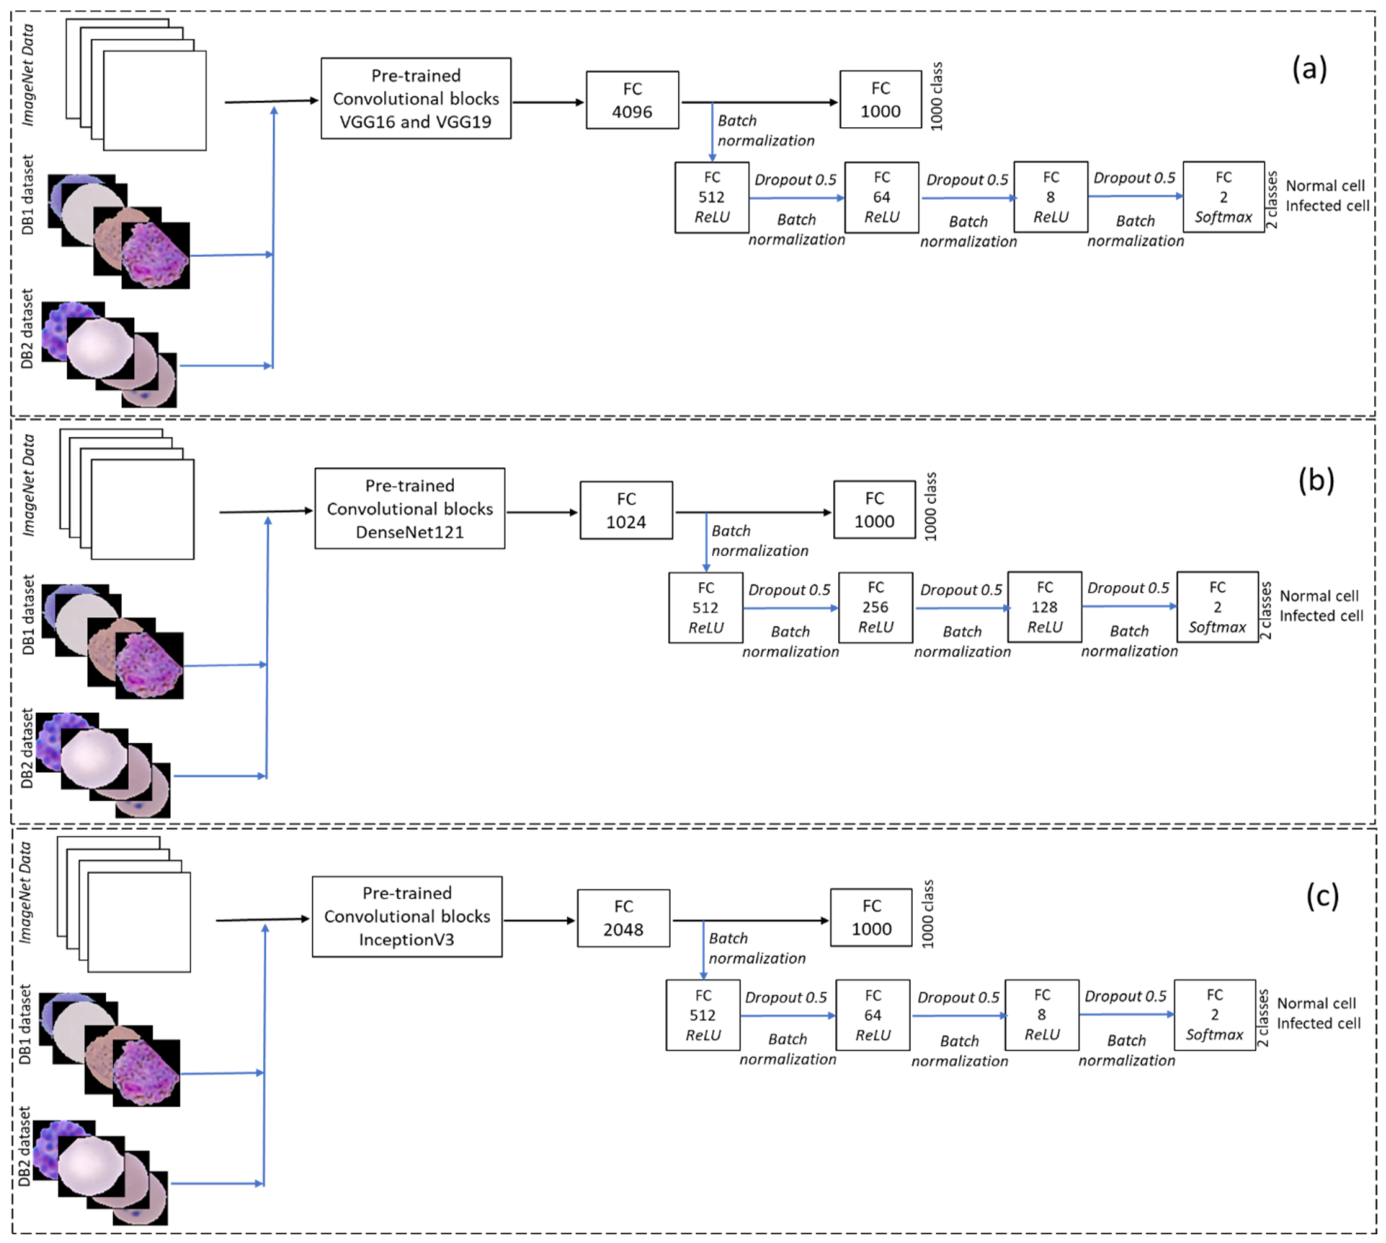
Several CNN architectures utilize pre-trained weights from models trained on the ImageNet dataset for transfer learning [21], leading to substantial improvements in the performance of medical image analysis tasks. We assessed the performance of various pre-trained CNNs, including VGG16, VGG19, DenseNet121, and InceptionV3, in classifying parasitized and uninfected cells. To fine-tune these models for our dataset, which focuses on classifying infected or normal cells, additional customized fully connected layers were added. The additional fully connected layers utilize the rectified linear unit (ReLU) activation function and are defined as follows:
To predict cell image data, the final dense layer consists of two neurons, utilizing the SoftMax function defined as follows:
Figure 6 illustrates the schematic transfer learning framework developed for binary classification of RBCs into infected and normal categories. Pre-trained models—VGG16, VGG19, DenseNet121, and InceptionV3—were originally trained for 1000 classes on the ImageNet dataset. In this transfer learning, all the pre-trained layers of these models were frozen, and new fully connected layers were added. The added layers included dropout and batch normalization, which are fine-tuned using our dataset to improve generalization and convergence. VGG16 and VGG19 are grouped within a single block due to their architectural similarity. Similarly, for InceptionV3 and DenseNet121 architectures, fully connected layers were added to update batch normalization, with these layers set as trainable to classify the two-class output.
Figure 6.
The proposed transfer learning scheme with different pre-trained classifiers: (a) VGG16 and VGG19, (b) DenseNet121, and (c) InceptionV3.
The proposed methodology was trained on 2422 segmented RBCs, validated on 348 cell images and evaluated using 692 unseen RBC images from a separate test set. The RBC segmentation was performed using MATLAB R2020a, while model development and training were conducted in Python 3.10.12 using Keras 2.9 with TensorFlow 2.9 as the backend, accelerated by CUDA 11 and an NVIDIA RTX 3080 GPU. Pre-trained models from the Keras 2.9 applications library were customized for the dataset. Additional libraries like OpenCV 4.6, NumPy 1.23, Scikit-learn 1.1.3, and Matplotlib 3.6.2 supported image processing, evaluation, and visualization. The entire methodology was executed on a high-performance Windows 11 Pro workstation with an Intel Xeon W-1370P CPU and 64 GB RAM.
2.3.4. Performance Metrics
The proposed CNN architectures were evaluated using a comprehensive set of performance metrics to identify the best-performing model for RBC classification. A five-fold cross-validation approach was applied to reduce bias and enhance generalization, with training accuracy curves and confusion matrices used to monitor model behavior across folds. The optimal model was selected based on performance from the best fold. Further evaluation on a separate test set of 692 unseen images was conducted using classification reports, summarizing precision, recall, F1-score, accuracy, and weighted and macro accuracy. Additional metrics such as sensitivity, specificity, and the MCC were also calculated to provide a balanced and robust evaluation. MCC, in particular, offers a single, informative score for binary classification based on TP, TN, FP, and FN, and these values are utilized to calculate the performance metrics.
2.3.5. AI-Based Web Application for Cell Classification
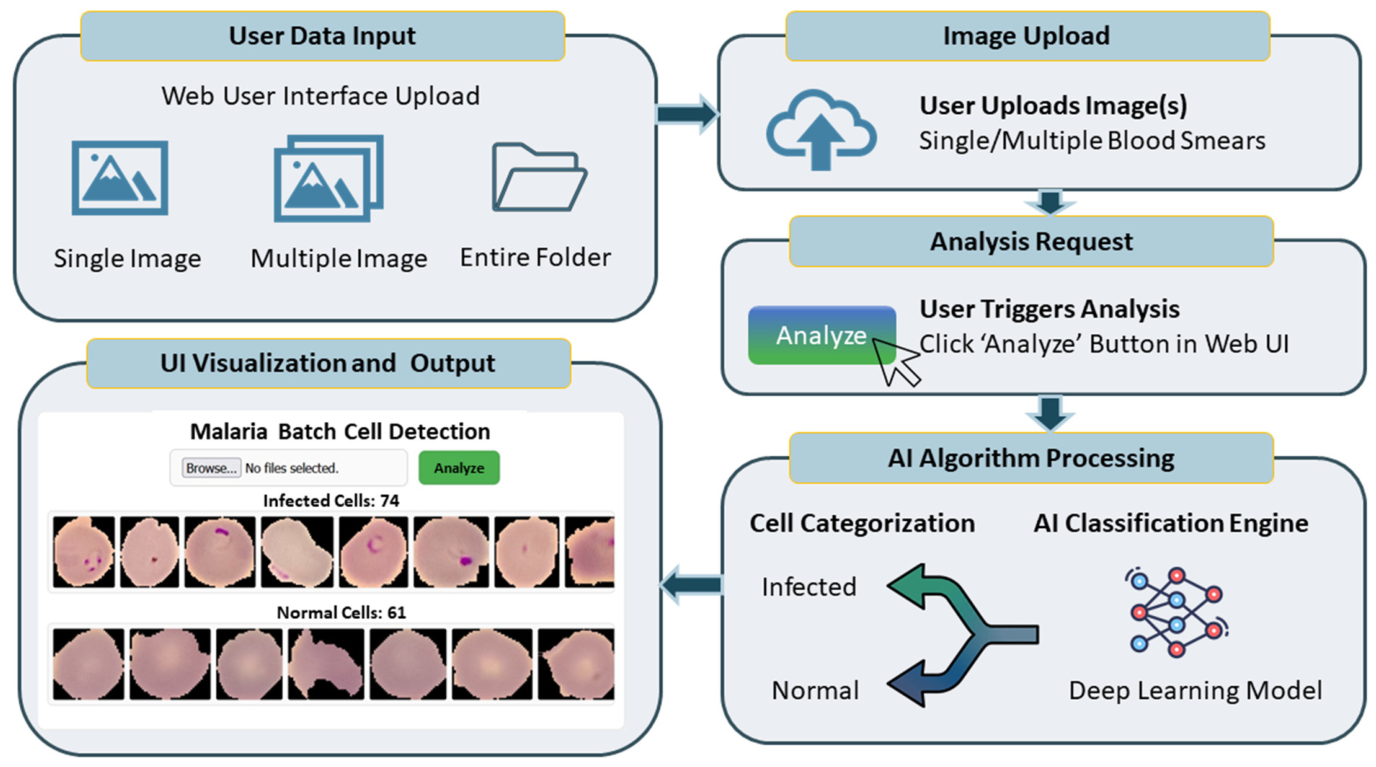
The end-to-end workflow of the proposed AI-enabled malaria cells classification application is depicted in Figure 7. The application is developed using a stack of Python, HTML, and JavaScript; the system leverages a Flask-based backend server, currently validated in a local host environment. The process is structured and involves the following steps:
Figure 7.
AI-enabled cells classification web-based application.
Data Acquisition: Users initiate the workflow by uploading images via the web interface, which supports single-image, multi-image, or batch folder uploads.
Analysis Initiation: Upon clicking the “Analyze” button, the interface triggers a request to the backend AI engine.
AI Classification: The server-side engine processes the raw data to categorize cells into “Infected” or “Normal” classes using the optimized deep learning model.
Data Streaming and Visualization: The results are transmitted back to the client via data streaming, accompanied by metadata containing the total cell counts for both classes.
User Interface (UI) Rendering: The frontend visualizes the categorized results in a scrollable output area, allowing the user to review the entire set of classified cell images.
3. Results and Discussion
To recognize RBCs, they were first segmented using the image processing approach described in Section 2. The segmentation time for one image from dataset DB1 was 4.195 s, while for an image from DB2, it was 0.509 s. Subsequently, a customized CNN model and ImageNet pre-trained models with additional modified fully connected layers were trained using these augmented samples. The training, validation, and test datasets were strictly separated to prevent any leakage of staining variations or other artifacts. All image datasets were normalized in the range [0, 1].
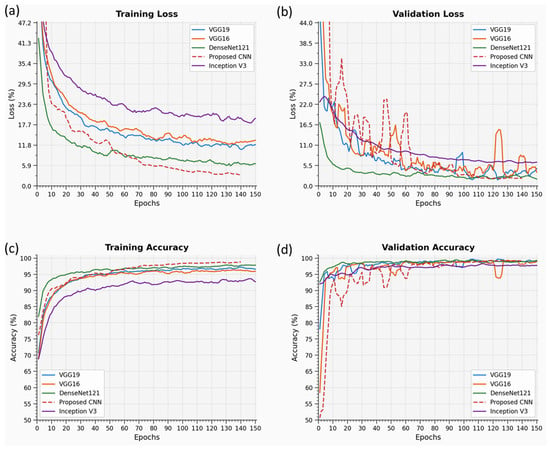
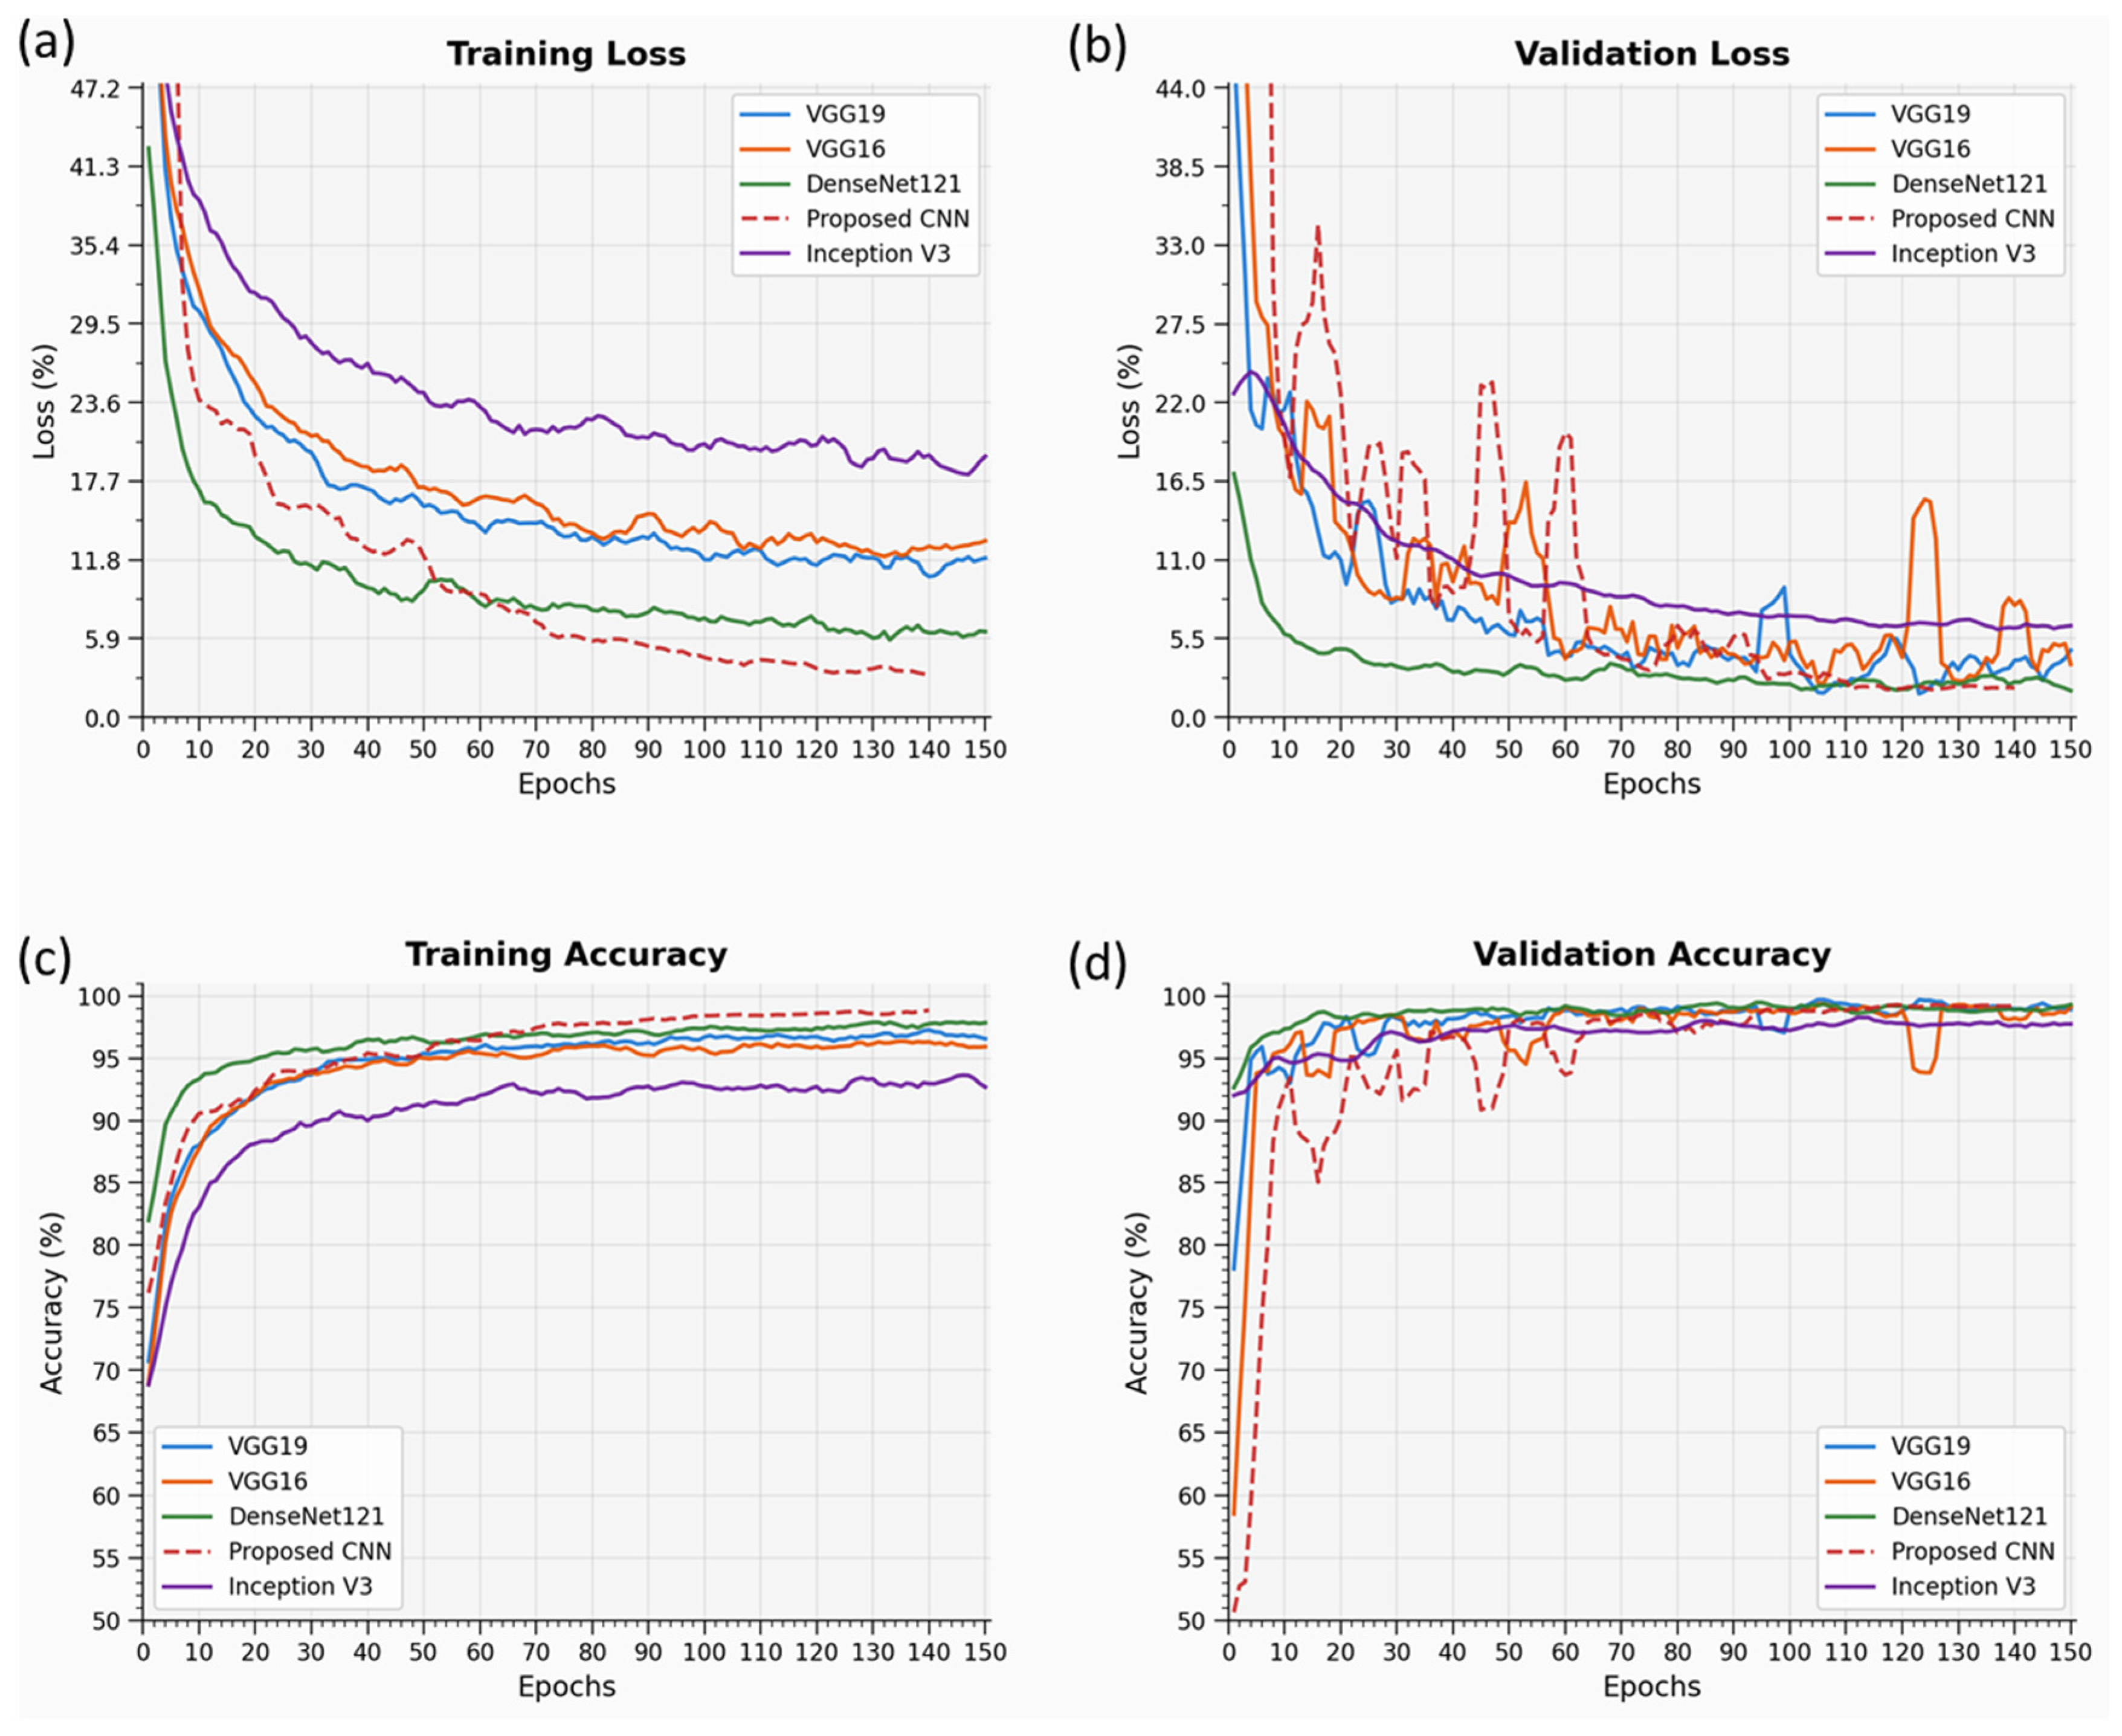
The networks were trained over 75, 150, 225, and 300 epochs, with a batch size of 32. Hyperparameter optimization for all CNN models was performed using a random grid search within the range [1 × 10⁻⁷, 5 × 10⁻²], employing Adam, RMSprop, and SGD optimizers. The Adam optimizer, with a learning rate of 1 × 10⁻⁴, was ultimately selected for minimizing cross-entropy loss and producing probability-based predictions. The custom CNN attains optimal convergence through (a) optimization of its architecture and hyperparameters, (b) the use of batch normalization for implicit regularization, and (c) improved generalization achieved by applying aggressive dropout to both convolutional and dense layers. Optimal convergence for all models was achieved at 150 epochs. The best-performing architectures were evaluated through training accuracy curves and confusion matrices using five-fold cross-validation. The performance of these models during training in terms of training accuracies and losses for 150 epochs is presented in Figure 8.
Figure 8.
VGG16, VGG19, DenseNet121, Inception V3 and a proposed CNN: (a) training loss, (b) validation loss, (c) training accuracy, and (d) validation accuracy for all models.
A comparative performance analysis of different architectures is summarized in Table 3. Among all tested models, VGG networks outperformed others in terms of accuracy across all epochs, with VGG19 emerging as the top performer based on training time compared to VGG16. VGG19 was selected for further comparative analysis across all five networks.
Table 3.
Performance metrics for transfer learning and proposed CNN models.
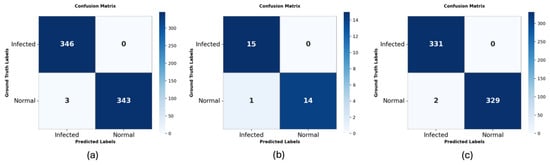
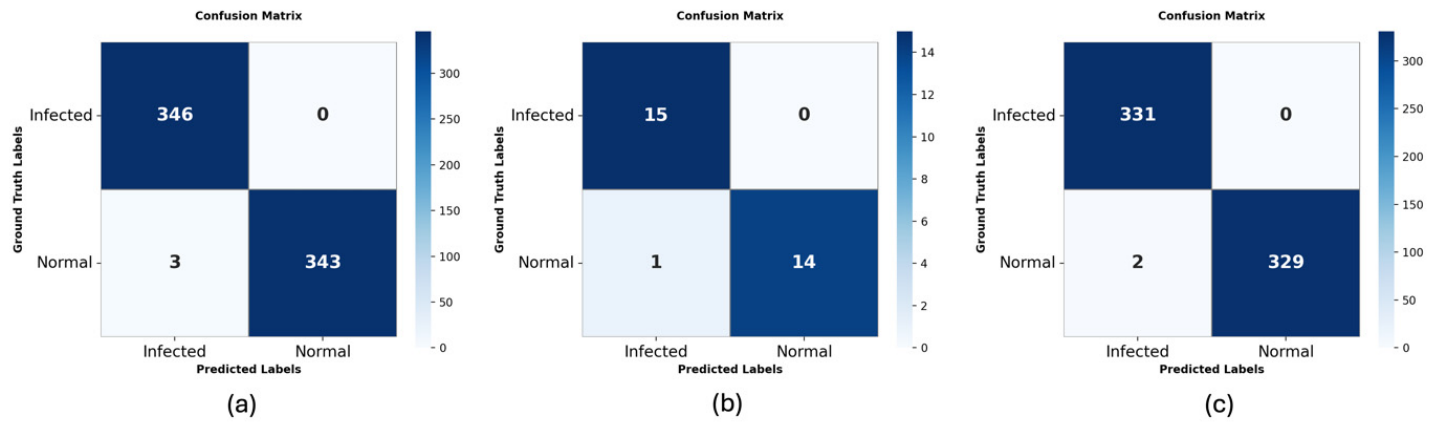
The test accuracy of VGG19 on the total test dataset is compared with different models in Table 3. The individual cell classification confusion matrix is depicted in Figure 9a, and their performance classification report that includes the precision, recall, F1-score and support is shown in Table 4. The sensitivity and specificity for the VGG19 model on combined data is 99.42.
Figure 9.
Confusion matrix for the pre-trained VGG19 network with additional fully connected layers applied to (a) test data, (b) DB1, and (c) DB2.
Table 4.
Classification report for the VGG19 network with additional fully connected layers applied to the test data.
The performance classification for the test dataset DB1 is reported. The DB1 individual cell classification performance is detailed in Table 5, and the confusion matrix in Figure 9b. Sensitivity and specificity for the VGG19 model on the DB1 dataset is 96.66.
Table 5.
Classification report for the VGG19 network with additional fully connected layers on DB1 dataset.
Table 6 presents the performance of the cell classification of the selected model on the dataset DB2. Figure 9c shows the confusion matrix. Sensitivity and specificity for the VGG19 model on the DB2 dataset is 99.54.
Table 6.
Classification report for the VGG19 network with additional fully connected layers on the DB2 dataset.
For 150 epochs, the VGG19 transfer learning model needed a training time of 86.02 min for two-class cell classification. The VGG19 model’s weight size was 126.87 MB, and the total model size was 321.77 MB. Despite the model’s larger size and weight, the VGG19 network outperformed other models for malaria cell classification. The comparative assessment demonstrates that the VGG19 pre-trained model, as a transfer learning, efficiently classifies malaria cells, achieving accuracy comparable to state-of-the-art methods, as shown in Table 7.
Table 7.
Comparison of classification accuracy with state-of-the-art methods.
4. Limitations
The present work should be interpreted as a proof-of-concept study focused on image-level classification of segmented red blood cells as infected or uninfected using computer vision and CNN architectures. There is no direct comparison with conventional reference malaria diagnostics such as microscopy, rapid diagnostic tests, or molecular assays as it was not designed as a prospective diagnostic accuracy study, which would include indices such as sensitivity, specificity, positive predictive value, and negative predictive value. The findings, therefore, primarily demonstrate the technical feasibility and high classification performance of the tested approaches, while future studies should address external validation, comparison with existing diagnostic tests, and evaluation in real-world settings.
5. Conclusions
Computer-aided image analysis using DL, particularly CNNs, offers significant advantages in medical diagnostics by enabling end-to-end feature extraction and classification directly from raw data. Our findings are broadly consistent with prior studies showing strong performance of deep learning and transfer learning models for malaria image classification. However, direct comparisons across studies remain difficult because of differences in image datasets, preprocessing strategies, class balance, and evaluation protocols. This study implemented both customized CNN models and four pre-trained architectures, demonstrating high predictive performance with efficient training times. Among them, VGG19 achieved the best results, with 99.57% test accuracy for a wide variation of blood smear cell datasets combining state-of-the-art and lab-acquired data. To enhance usability, a web-based application was developed, allowing real-time RBC classification. The deployed model functions effectively as a triage tool, showing strong generalization, minimal overfitting, and potential for clinical use in detecting parasitized and normal cells in blood smear images. Thus, the proposed model may be used in the future as a supportive computational approach for image-based screening, alongside standard diagnostic modalities.
Author Contributions
Conceptualization, K.K. and S.T.; methodology, K.K. and S.T.; software, K.K.; validation, T.K., A.M. and S.T.; formal analysis, S.T.; investigation, S.T.; resources, N.M.G.; data curation, T.K., A.M. and S.T.; writing—original draft preparation, K.K. and S.T.; writing—review and editing, A.M. and N.M.G.; visualization, S.T.; supervision, S.T., A.M. and N.M.G.; project administration, S.T. and N.M.G.; funding acquisition, K.K. All authors have read and agreed to the published version of the manuscript.
Funding
This research received no external funding.
Institutional Review Board Statement
Ethical approval for Database 1 (DB1) was obtained from the Institute Ethics Committee (IEC) of the Postgraduate Institute of Medical Education and Research (PGIMER), Chandigarh (Approval No. PGI/IEC/2021/001348) dated 23 September 2021. The study was conducted at the Department of Medical Parasitology, PGIMER, Chandigarh.
Informed Consent Statement
Informed consent for participation was obtained from all subjects involved in the study.
Data Availability Statement
The data used in this manuscript will be available on request to the corresponding author.
Acknowledgments
The authors would like to acknowledge the Director, CSIR-CSIO Chandigarh, for providing research facilities and infrastructure support in carrying out this work. The authors are also thankful to PGIMER Chandigarh for providing the annotated dataset. The author, T.K., also acknowledges the fellowship [DST/WOS-B/AI-1/2021/Taruna] from the Department of Science and Technology, New Delhi, India (WISE-KIRAN Division). The authors declare that no generative AI or AI-assisted tools were used in the research, analysis, or writing of this manuscript.
Conflicts of Interest
The authors declare that they have no conflicts of interest.
References
- Tek, F.B.; Dempster, A.G.; Kale, I. Computer Vision for Microscopy Diagnosis of Malaria. Malar. J. 2009, 8, 153. [Google Scholar] [CrossRef] [Scilit] [PubMed]
- World Malaria Report 2024. Available online: https://www.who.int/teams/global-malaria-programme/reports/world-malaria-report-2024 (accessed on 18 February 2026).
- Hommelsheim, C.M.; Frantzeskakis, L.; Huang, M.; Ülker, B. PCR Amplification of Repetitive DNA: A Limitation to Genome Editing Technologies and Many Other Applications. Sci. Rep. 2014, 4, 5052. [Google Scholar] [CrossRef] [Scilit] [PubMed]
- Hawkes, M.; Katsuva, J.P.; Masumbuko, C.K. Use and Limitations of Malaria Rapid Diagnostic Testing by Community Health Workers in War-Torn Democratic Republic of Congo. Malar. J. 2009, 8, 308. [Google Scholar] [CrossRef] [Scilit] [PubMed]
- Kettelhut, M.M.; Chiodini, P.L.; Edwards, H.; Moody, A. External Quality Assessment Schemes Raise Standards: Evidence from the UKNEQAS Parasitology Subschemes. J. Clin. Pathol. 2003, 56, 927–932. [Google Scholar] [CrossRef] [Scilit] [PubMed]
- Poostchi, M.; Silamut, K.; Maude, R.J.; Jaeger, S.; Thoma, G. Image Analysis and Machine Learning for Detecting Malaria. Transl. Res. 2018, 194, 36–55. [Google Scholar] [CrossRef] [Scilit] [PubMed]
- Jan, Z.; Khan, A.; Sajjad, M.; Muhammad, K.; Rho, S.; Mehmood, I. A Review on Automated Diagnosis of Malaria Parasite in Microscopic Blood Smears Images. Multimed. Tools Appl. 2018, 77, 9801–9826. [Google Scholar] [CrossRef] [Scilit]
- Ross, N.E.; Pritchard, C.J.; Rubin, D.M.; Dusé, A.G. Automated Image Processing Method for the Diagnosis and Classification of Malaria on Thin Blood Smears. Med. Bio Eng. Comput. 2006, 44, 427–436. [Google Scholar] [CrossRef] [Scilit] [PubMed]
- Díaz, G.; González, F.A.; Romero, E. A Semi-Automatic Method for Quantification and Classification of Erythrocytes Infected with Malaria Parasites in Microscopic Images. J. Biomed. Inform. 2009, 42, 296–307. [Google Scholar] [CrossRef] [Scilit] [PubMed]
- Park, H.S.; Rinehart, M.T.; Walzer, K.A.; Chi, J.-T.A.; Wax, A. Automated Detection of P. Falciparum Using Machine Learning Algorithms with Quantitative Phase Images of Unstained Cells. PLoS ONE 2016, 11, e0163045. [Google Scholar] [CrossRef] [Scilit] [PubMed]
- Abbas, N.; Saba, T.; Rehman, A.; Mehmood, Z.; Kolivand, H.; Uddin, M.; Anjum, A. Plasmodium Life Cycle Stage Classification Based Quantification of Malaria Parasitaemia in Thin Blood Smears. Microsc. Res. Tech. 2019, 82, 283–295. [Google Scholar] [CrossRef] [Scilit] [PubMed]
- Srivastava, N.; Hinton, G.; Krizhevsky, A.; Sutskever, I.; Salakhutdinov, R. Dropout: A Simple Way to Prevent Neural Networks from Overfitting. J. Mach. Learn. Res. 2014, 15, 1929–1958. [Google Scholar]
- Krizhevsky, A.; Sutskever, I.; Hinton, G.E. ImageNet Classification with Deep Convolutional Neural Networks. Commun. ACM 2017, 60, 84–90. [Google Scholar] [CrossRef] [Scilit]
- Redmon, J.; Divvala, S.; Girshick, R.; Farhadi, A. You Only Look Once: Unified, Real-Time Object Detection. In Proceedings of the 2016 IEEE Conference on Computer Vision and Pattern Recognition (CVPR); IEEE: Las Vegas, NV, USA, 2016; pp. 779–788. [Google Scholar]
- Simonyan, K.; Zisserman, A. Very Deep Convolutional Networks for Large-Scale Image Recognition 2015. arXiv 2015, arXiv:1409.1556. [Google Scholar]
- He, K.; Zhang, X.; Ren, S.; Sun, J. Deep Residual Learning for Image Recognition. In Proceedings of the 2016 IEEE Conference on Computer Vision and Pattern Recognition (CVPR); IEEE: Las Vegas, NV, USA, 2016; pp. 770–778. [Google Scholar]
- Szegedy, C.; Liu, W.; Jia, Y.; Sermanet, P.; Reed, S.; Anguelov, D.; Erhan, D.; Vanhoucke, V.; Rabinovich, A. Going Deeper with Convolutions. In Proceedings of the 2015 IEEE Conference on Computer Vision and Pattern Recognition (CVPR); IEEE: Boston, MA, USA, 2015; pp. 1–9. [Google Scholar]
- Chollet, F. Xception: Deep Learning with Depthwise Separable Convolutions. In Proceedings of the 2017 IEEE Conference on Computer Vision and Pattern Recognition (CVPR); IEEE: New York, NY, USA, 2017; pp. 1800–1807. [Google Scholar]
- Szegedy, C.; Vanhoucke, V.; Ioffe, S.; Shlens, J.; Wojna, Z. Rethinking the Inception Architecture for Computer Vision. In Proceedings of the 2016 IEEE Conference on Computer Vision and Pattern Recognition (CVPR); IEEE: Las Vegas, NV, USA, 2016; pp. 2818–2826. [Google Scholar]
- Huang, G.; Liu, Z.; Van Der Maaten, L.; Weinberger, K.Q. Densely Connected Convolutional Networks. In Proceedings of the 2017 IEEE Conference on Computer Vision and Pattern Recognition (CVPR); IEEE: New York, NY, USA, 2017; pp. 2261–2269. [Google Scholar]
- Deng, J.; Dong, W.; Socher, R.; Li, L.-J.; Li, K.; Li, F.-F. ImageNet: A Large-Scale Hierarchical Image Database. In Proceedings of the 2009 IEEE Conference on Computer Vision and Pattern Recognition; IEEE: Miami, FL, USA, 2009; pp. 248–255. [Google Scholar]
- Razavian, A.S.; Azizpour, H.; Sullivan, J.; Carlsson, S. CNN Features Off-the-Shelf: An Astounding Baseline for Recognition. In Proceedings of the 2014 IEEE Conference on Computer Vision and Pattern Recognition Workshops; IEEE: Columbus, OH, USA, 2014; pp. 512–519. [Google Scholar]
- Dong, Y.; Jiang, Z.; Shen, H.; David Pan, W.; Williams, L.A.; Reddy, V.V.B.; Benjamin, W.H.; Bryan, A.W. Evaluations of Deep Convolutional Neural Networks for Automatic Identification of Malaria Infected Cells. In Proceedings of the 2017 IEEE EMBS International Conference on Biomedical & Health Informatics (BHI); IEEE: Orland, FL, USA, 2017; pp. 101–104. [Google Scholar]
- Gopakumar, G.P.; Swetha, M.; Sai Siva, G.; Sai Subrahmanyam, G.R.K. Convolutional Neural Network-based Malaria Diagnosis from Focus Stack of Blood Smear Images Acquired Using Custom-built Slide Scanner. J. Biophotonics 2018, 11, e201700003. [Google Scholar] [CrossRef] [Scilit] [PubMed]
- Rajaraman, S.; Antani, S.K.; Poostchi, M.; Silamut, K.; Hossain, M.A.; Maude, R.J.; Jaeger, S.; Thoma, G.R. Pre-Trained Convolutional Neural Networks as Feature Extractors toward Improved Malaria Parasite Detection in Thin Blood Smear Images. PeerJ 2018, 6, e4568. [Google Scholar] [CrossRef] [Scilit] [PubMed]
- Rajaraman, S.; Jaeger, S.; Antani, S.K. Performance Evaluation of Deep Neural Ensembles toward Malaria Parasite Detection in Thin-Blood Smear Images. PeerJ 2019, 7, e6977. [Google Scholar] [CrossRef] [Scilit] [PubMed]
- Zhu, Z.; Wang, S.; Zhang, Y. ROENet: A ResNet-Based Output Ensemble for Malaria Parasite Classification. Electronics 2022, 11, 2040. [Google Scholar] [CrossRef] [Scilit] [PubMed]
- Chaudhry, H.A.H.; Farid, M.S.; Fiandrotti, A.; Grangetto, M. A Lightweight Deep Learning Architecture for Malaria Parasite-Type Classification and Life Cycle Stage Detection. Neural Comput. Appl. 2024, 36, 19795–19805. [Google Scholar] [CrossRef] [Scilit]
- Wang, G.; Luo, G.; Lian, H.; Chen, L.; Wu, W.; Liu, H. Application of Deep Learning in Clinical Settings for Detecting and Classifying Malaria Parasites in Thin Blood Smears. In Proceedings of the Open Forum Infectious Diseases; Oxford University Press: New York, NY, USA, 2023; Volume 10, p. ofad469. [Google Scholar] [CrossRef] [Scilit] [PubMed]
- CDC-DPDx-Malaria. Available online: https://www.cdc.gov/dpdx/malaria/index.html (accessed on 18 February 2026).
- Kanojia, M.; Gandhi, N.; Armstrong, L.J.; Pednekar, P. Automatic Identification of Malaria Using Image Processing and Artificial Neural Network. In Intelligent Systems Design and Applications; Abraham, A., Muhuri, P.K., Muda, A.K., Gandhi, N., Eds.; Advances in Intelligent Systems and Computing; Springer International Publishing: Cham, Switzerland, 2018; Volume 736, pp. 846–857. ISBN 978-3-319-76347-7. [Google Scholar]
- Pan, W.D.; Dong, Y.; Wu, D. Classification of Malaria-Infected Cells Using Deep Convolutional Neural Networks. In Machine Learning-Advanced Techniques and Emerging Applications; Farhadi, H., Ed.; InTech: London, UK, 2018; ISBN 978-1-78923-752-8. [Google Scholar]
- Vijayalakshmi, A.; Rajesh Kanna, B. Deep Learning Approach to Detect Malaria from Microscopic Images. Multimed. Tools Appl. 2020, 79, 15297–15317. [Google Scholar] [CrossRef] [Scilit]
- Liang, Z.; Powell, A.; Ersoy, I.; Poostchi, M.; Silamut, K.; Palaniappan, K.; Guo, P.; Hossain, M.A.; Sameer, A.; Maude, R.J.; et al. CNN-Based Image Analysis for Malaria Diagnosis. In Proceedings of the 2016 IEEE International Conference on Bioinformatics and Biomedicine (BIBM); IEEE: Shenzhen, China, 2016; pp. 493–496. [Google Scholar]
- Rajasekar, S.S.; Balamurugan, R. A Hybrid Image Processing and Graph Neural Networks for Malaria Detection in Blood Smears. Biomed. Signal Process. Control 2026, 113, 108961. [Google Scholar] [CrossRef] [Scilit]
- Madhu, G.; Mohamed, A.W.; Kautish, S.; Shah, M.A.; Ali, I. Intelligent Diagnostic Model for Malaria Parasite Detection and Classification Using Imperative Inception-Based Capsule Neural Networks. Sci. Rep. 2023, 13, 13377. [Google Scholar] [CrossRef] [Scilit] [PubMed]
- Özdemir, E.Y.; Koç, C.; Küçük, K.; Özyurt, F. Ensemble-Based Early Detection of Malaria via Explainable ViT-CNN Feature Fusion and SHAP. J. Digit. Imaging. Inform. Med. 2025. [Google Scholar] [CrossRef] [Scilit] [PubMed]
- Khan, Z.A.; Waqar, M.; Raja, M.J.A.A.; Chaudhary, N.I.; Khan, A.T.M.A.; Raja, M.A.Z. Generalized Fractional Optimization-Based Explainable Lightweight CNN Model for Malaria Disease Classification. Comput. Biol. Med. 2025, 185, 109593. [Google Scholar] [CrossRef] [Scilit] [PubMed]

Disclaimer/Publisher’s Note: The statements, opinions and data contained in all publications are solely those of the individual author(s) and contributor(s) and not of MDPI and/or the editor(s). MDPI and/or the editor(s) disclaim responsibility for any injury to people or property resulting from any ideas, methods, instructions or products referred to in the content. |
© 2026 by the authors. Licensee MDPI, Basel, Switzerland. This article is an open access article distributed under the terms and conditions of the Creative Commons Attribution (CC BY) license.