


Abstract
Metabolic disorders from a high-fat diet impair salivary gland integrity, and the effect of tirzepatide on these glands is unknown. We investigated tirzepatide’s effects on high-fat diet (HFD)-induced salivary gland injury in rats. Forty adult male rats were randomly assigned to four groups: control (G1), HFD-fed (G2), HFD + saline (G3), and HFD + tirzepatide (G4). We assessed metabolic parameters, oxidative stress markers, inflammatory cytokines (TNF-α, IL-1β), caspase-3 concentration, stimulated salivary flow rate (SSFR), histopathology, and mast cell morphometry. HFD feeding caused insulin resistance and dyslipidemia, increased oxidative stress, TNF-α, IL-1β, and caspase-3 in salivary gland homogenate, histological damage to salivary gland tissue, increased mast cell indices, and collagen deposition. Tirzepatide significantly improved metabolic abnormalities and attenuated oxidative stress and inflammation, reduced caspase-3, mast cell, and fibrotic changes, and preserved salivary gland structure. SSFR showed no significant differences in pairwise comparisons. HFD-fed groups (G2 and G3) showed a reduced stimulated salivary rate per 100 g body weight (mL/15 min/100 g BW) compared with the control (G1). The tirzepatide-treated group (G4) had an improved stimulated salivary rate per 100 g BW, with no significant difference from the control (G1). The data suggest that tirzepatide ameliorates HFD-induced salivary gland injury, and this effect was associated with reduced oxidative stress, inflammatory cytokine levels (TNF-α, IL-1β), and caspase-3. The preservation of absolute SSFR despite marked tissue damage suggests that structural damage may occur without a concomitant reduction in overall stimulated salivary secretion.
1. Introduction
Obesity is a major global health issue, with the World Obesity Atlas 2024 predicting a huge increase in the prevalence of adult obesity by 2035 [1]. A prolonged high-fat diet (HFD) leads to obesity and insulin resistance. It is associated with oxidative stress, chronic inflammation, fatty liver disease, gut dysbiosis, intestinal injury, cardiovascular disease, and cognitive dysfunction [2,3,4]. The systemic complications of obesity are well established [5,6]. However, the effect of obesity on salivary gland homeostasis is less well understood; salivary glands are metabolically active organs and are susceptible to oxidative injury [7]. Experimental studies in the HFD-induced obese model have demonstrated mitochondrial dysfunction, oxidative and nitrosative stress, inflammation, apoptosis, fibrosis, disrupted intracellular Ca2+ signaling, and structural injury in the salivary glands [7,8,9]. Some of these pathological changes occur without a corresponding reduction in salivary flow, whereas other studies report impaired stimulated secretion, particularly in the parotid gland [7,8]. Clinical data from overweight and obese adolescents further document a relationship between obesity, reduced salivary antioxidant defense, and salivary gland dysfunction [10].
Histopathology has shown vascular congestion, intracellular lipid accumulation, hemorrhage, and fibrosis in the salivary glands after prolonged HFD exposure [9]. The submandibular and sublingual glands produce most unstimulated saliva, whereas the parotid glands produce about 50–65% of stimulated salivary flow. Assessing stimulated whole salivary flow, along with submandibular and sublingual histology, therefore provides complementary functional and structural information [11,12].
Tirzepatide (TZP) is a dual GLP-1 and GIP receptor agonist, approved by the FDA to treat type 2 diabetes and obesity [13]. It produces substantial weight loss and ameliorates obesity-associated metabolic derangements [14,15]. Moreover, experimental evidence shows antioxidant, anti-inflammatory, and anti-apoptotic effects in other tissues [16]. Emerging evidence suggests incretin signaling may affect salivary gland biology, with GLP-1 receptors present in the submandibular gland (predominantly in the ductal areas) [17] and GIP receptors in the ductal compartments of the major salivary glands in the rat [18]. This suggests a potential local incretin-mediated response, though its functional significance is unknown. In contrast, in a rat model of doxorubicin-induced neurotoxicity, TZP did not reduce markers of oxidative stress, mitochondrial dysfunction, or cognitive impairment [19]. The effect of TZP on HFD-associated salivary gland injury remains poorly defined. This study therefore assessed TZP’s overall ameliorative effect in this model by examining metabolic, biochemical, functional, morphometric, and histological parameters, without assuming a direct effect on the salivary gland-specific mechanism.
2. Materials and Methods
2.1. Experimental Animals and Study Design
In the current study, 40 adult (aged 8–12 weeks) male albino rats weighing 180–250 g were obtained from the animal house at the College of Veterinary Medicine, Zagazig University, and acclimatized for two weeks before being randomly divided into four equal groups (n = 10 per group). No formal a priori power calculation was performed, and the sample size was determined based on the cited prior study [7], considering biological replication, animal welfare, and available resources. The animals had unlimited access to water and chow (regular and HFD chow were supplied by the Faculty of Agriculture, Zagazig University) and were maintained at room temperature under a 12/12-h light/dark cycle. Rats were assigned identification numbers from 1 to 40, and a random group assignment was generated using the random number generator in Excel for Microsoft 365 to reduce sampling bias. The sample size was designed in accordance with ethical guidelines to minimize the number of animals employed. Rats of the control group (G1) received ordinary chow of 62.8% carbohydrate, 25.8% protein, and 11.4% fat (calories = 12.6 kJ/g) for 12 weeks, while rats of the HFD-fed group (G2) were fed an HFD of 58.0% fat, 25.6% carbohydrate, and 16.4% protein (calories = 23.4 kJ/g) for 12 weeks. At the same time, rats in the HFD + saline group (G3) were fed an HFD for 12 weeks plus a single subcutaneous injection/week (S.C.) of isotonic saline for four weeks (starting from the 9th week), while rats in the treated group (G4) were fed an HFD for 12 weeks plus S.C. injection with tirzepatide (10 nmol/kg/week) [20,21] for 4 weeks (starting from the 9th week). All procedures were approved by the Institutional Animal Care and Use Committee of Zagazig University (ZU-IACUC; No. ZU-IACUC/3/F/121/2025). Animal care and use followed the institutionally approved protocol and the recommendations of the National Research Council’s Guide for the Care and Use of Laboratory Animals, 8th edition (2011) [22]. Reporting was prepared with reference to the ARRIVE 2.0 guidelines [23].
By week 12, the animals were fasted for 12 h and anesthetized with an intraperitoneal injection (IPI) of ketamine (100 mg/kg) [24], followed by an IPI of pilocarpine hydrochloride (1.5 mg/kg) to induce salivary secretion. We placed cotton balls of the same size and weight in the rats’ mouths to collect saliva for 15 min [25]. The cotton balls were then centrifuged, the saliva was recovered, and the stimulated salivary flow rate (SSFR) was expressed as mL/15 min. For each animal, the saliva volume collected over 15 min (mL) was divided by its corresponding body weight (g) and multiplied by 100. The ratio of stimulated salivary output (mL/15 min) per 100 g body weight was expressed as mL/15 min/100 g body weight (mL/15 min/100 g BW).
Following salivary collection, the rats were anesthetized with halothane and sacrificed by decapitation. Briefly, 5 mL of blood was collected from the major cervical veins immediately after decapitation, allowed to clot at room temperature, and centrifuged at 3000 rpm for 15 min. The separated serum was stored at −80 °C until analysis. We then rapidly dissected the right and left submandibular and sublingual salivary glands, rinsed them with ice-cold phosphate-buffered saline (PBS), blotted them dry, and weighed them. Tissue for biochemical analysis was immediately frozen in liquid nitrogen and stored at −80 °C, whereas separate specimens for histopathology were placed in 10% formalin. Biochemical and histopathological assessments were performed by investigators blinded to group allocation.
All 40 animals completed the experimental protocol and were included in the final analyses (n = 10/group); no animals died, and no observations were excluded.
2.2. Preparation of Tissue Homogenates
Frozen submandibular and sublingual salivary gland tissue samples from each rat were combined and homogenized in ice-cold PBS (pH 7.4) at a tissue-to-buffer ratio of 1:10 (w/v). Each animal provided one independent homogenate. The homogenates were centrifuged for 15 min at 10,000× g at 4 °C, after which the clear supernatants were split into two groups. One aliquot of the tissue homogenate was used for measurement of malondialdehyde (MDA) concentration and superoxide dismutase (SOD) activity using the verified laboratory procedures described in Section 2.4, whereas the second aliquot was used for TNF-α, IL-1β, and caspase-3 measurements.
2.3. Histopathological Examination
The submandibular and sublingual salivary glands were fixed separately in 10% formalin for 24 h, then dehydrated in graded ethanol, cleared in xylene, embedded in paraffin wax, sectioned at 4 μm, and mounted on glass slides. Four sections from the submandibular and sublingual salivary glands of each rat were stained with hematoxylin and eosin (H&E), Masson’s trichrome, Periodic Acid-Schiff (PAS) reagent to stain both mucous and serous secretory components, and toluidine blue for light-microscopic analysis [26,27].
2.4. Biochemical Measurement of Glucose, Insulin, Lipid Profile, TNF-α, IL-1β, and Caspase-3
We determined serum glucose levels using the glucose oxidase–peroxidase (GOD-POD) enzymatic method with Liquizyme kits (Biotechnology, Obour City, Egypt), as outlined by Trinder [28]. We measured serum insulin levels using a rat insulin ELISA kit (Cat. No. RAB0904; Sigma-Aldrich, St. Louis, MO, USA) according to the manufacturer’s instructions and expressed results as µIU/mL. Total cholesterol (TC) was determined enzymatically using TRTU 61218 kits (bioMérieux S.A., Lyon, France), following Allain et al. [29]. Serum triglyceride (TG) concentrations were measured using ESPAS SL enzymatic kits (Elttech S.A., Sees, France) according to Naito [30]. High-density lipoprotein cholesterol (HDL-C) was determined by an enzymatic colorimetric method using the Stanbio HDL-Cholesterol Procedure No. 0599 kits (Stanbio Laboratory Inc., San Antonio, TX, USA) as specified by Warnick et al. [31]. Low-density lipoprotein cholesterol (LDL-C) was calculated using the Friedewald equation [32]: LDL-C = TC − HDL-C − (TG/5). We measured malondialdehyde (MDA) levels and superoxide dismutase (SOD) activity in tissue homogenates using procedures described by Kakkar et al. [33] and Nielsen et al. [34]; results were reported as nmol/mL of homogenate for MDA and U/mL of homogenate for SOD. The concentrations of TNF-α, IL-1β, and caspase-3 were determined by sandwich ELISA in the tissue homogenates using kits (catalog No. EL0013Ra, One-EK009R, and SL0152Ra, respectively) from Sunlong Biotech CO., Ltd., (Hangzhou, Zhejiang, China).
2.5. Estimation of the Homeostasis Model of Insulin Resistance (HOMA-IR)
HOMA-IR is equal to fasting insulin (μIU/mL) multiplied by fasting plasma glucose (mg/dL) and then divided by 405 [35]. The Department of Medical Biochemistry, College of Medicine, Zagazig University, Egypt, measured the biochemical and hormonal parameters.
2.6. Semiquantitative Scoring of H&E, Masson’s Trichrome, and PAS-Stained Sections
A blinded semiquantitative histopathological assessment was performed using a 5-point ordinal scoring system (0–4) to evaluate each parameter of H&E-stained histological injury separately, Masson’s trichrome-stained collagen deposition, and PAS staining intensity (indicating secretory activity). We used a paired-gland, animal-level scoring approach because each rat contributes two physiologically related glands (the submandibular salivary gland [SMSG] and the sublingual salivary gland [SLSG]), and we used the rat as the independent experimental unit. We derived the original raw scores from two blinded measurements of both glands in all groups (n = 10) and summarized the median and interquartile range (IQR) for the four semiquantitative ordinal scores of SMSG and SLSG, yielding a single animal-level score for each rat. An animal-level composite score (ALS) was calculated for each parameter by averaging the four microscopic field scores (S1–S4). We reported the first SMSG reading as S1, the second as S2, the first SLSG reading as S3, and the second as S4, and combined the scores of the four microscopic field readings from each rat (S1–S4) using the arithmetic-mean ALS calculation to obtain one representative ALS. Accordingly, each animal contributed one composite score per histological parameter, resulting in ten independent observations per experimental group. Data were expressed as median and interquartile range (IQR). Differences among the four experimental groups were assessed using the Kruskal–Wallis test, followed by Dunn’s multiple-comparison test with Holm adjustment for post hoc pairwise comparisons. Adjusted p-values were reported, and statistical significance was established at p < 0.05. Subsequently, group results were summarized as median and IQR, followed by the Kruskal–Wallis test and Dunn’s multiple-comparison test with the Holm adjustment, and we reported exact p-values alongside the adjusted significance levels.
2.6.1. Scoring of Submandibular and Sublingual Salivary Glands Injury in H&E-Stained Sections
We used a 0–4 scale and recorded each of the following features separately to assess acinar degeneration, ductal injury, inflammatory infiltration, vascular congestion or hemorrhage, and overall architectural disruption (Table 1).
Table 1.
Scores of submandibular and sublingual gland injury.
2.6.2. Scoring of Submandibular and Sublingual Gland Fibrosis in Masson’s Trichrome-Stained Sections
We used a 0–4 scale and recorded each degree of submandibular and sublingual gland fibrosis (Table 2).
Table 2.
Scores of the submandibular and sublingual gland fibrosis.
2.6.3. Scoring of Submandibular and Sublingual Gland Activity in PAS-Stained Sections
We scored PAS-positive secretory material intensity in the acini and ducts of both submandibular and sublingual salivary glands (Table 3).
Table 3.
Shows cores of PAS-positive secretory material intensity in the acini and ducts of both submandibular and sublingual salivary glands.
2.7. Quantitative Analysis of Collagen Fiber Area Percentage and Mast-Cell Morphometry
For each animal, we acquired original images from both submandibular and sublingual salivary gland sections stained with Masson’s trichrome and toluidine blue using Leica LM (England) for quantitative analysis of collagen fiber area percentage (%), mast-cell metachromasia area (%), and mast-cell numbers (/10 high-power fields [HPF]) at ×400 magnification. Two independent observers, blinded to experimental group allocation and image filenames, analyzed the captured images using imageJ 1.54 (NIH, Bethesda, MD, USA). The observers analyzed predefined, non-overlapping fields at the same magnification for each animal. They excluded tears, folds, spaces, and non-tissue background using predefined rules. They applied a consistent color-thresholding method to identify collagen and metachromatic-positive regions.
2.8. Statistical Analysis of Biochemical, Physiological, and Histomorphometric Parameters
We presented biochemical and physiological variables, as well as histomorphometric parameters, as mean ± SD. We assessed data normality using the Shapiro–Wilk test, and homogeneity of variances was evaluated using Levene’s test. Variables satisfying the homogeneity assumption were analyzed using one-way ANOVA followed by Tukey’s multiple-comparison test. For variables showing unequal variances, Welch’s ANOVA followed by Games–Howell multiple comparisons was used. p < 0.05 indicates statistical significance. We statistically analyzed all data using SPSS Statistics for Windows, Version 31.0.0 (IBM Corp., Armonk, NY, USA).
3. Results
3.1. Biochemical Measurement of Glucose, Insulin, Lipid Profile, TNF-α, IL-1β, and Caspase-3
Table 4 shows non-significant differences in initial body weight among the four experimental groups. By week 12, the obesity group (G2) and the placebo group (G3) showed a significant increase in body weight compared with the control group (G1) (p < 0.05). In contrast, the tirzepatide-treated group (G4) showed a significant reduction in body weight compared with both G2 and G3 (p < 0.05 for both), although it remained significantly higher than that of G1 (p < 0.05). Glycemic status was higher in G2 and G3 than in G1 for fasting insulin, glucose, and HOMA-IR. Tirzepatide treatment (G4) lowered all three indices relative to G2 and G3. Glucose remained higher in G4 than G1 (Games–Howell-adjusted p < 0.05), whereas HOMA-IR showed no significant difference compared with G1 after Games–Howell adjustment (p > 0.05). The lipid profile showed dyslipidemia in G2 and G3, including higher TC, TG, and LDL-C (p < 0.05) and lower HDL-C than G1 (p < 0.05). G4 showed lower TC, TG, and LDL-C and higher HDL-C; TC and LDL-C were lower than in the HFD-fed groups (p < 0.05 for all), and HDL-C did not differ from G1 (p > 0.05), whereas TG remained higher than G1 (p < 0.05). Moreover, both G2 and G3 showed a significant rise in MDA (a marker of lipid peroxidation) and a significant decline in the antioxidant enzyme superoxide dismutase (SOD) compared to G1 (p < 0.05 for all), indicating greater oxidative stress. In contrast, tirzepatide significantly reduced oxidative stress in G4 by lowering MDA levels and increasing SOD activity compared with G2 and G3 (p < 0.05 for all), with values similar to G1 (p > 0.05). TNF-α and IL-1β levels were also significantly elevated in both G2 and G3 compared with G1 (p < 0.05), indicating a marked inflammatory response associated with HFD feeding. In contrast, tirzepatide treatment significantly reduced inflammatory cytokines in G4 compared with G2 and G3 (p < 0.05 for all), bringing concentrations to control levels in G1. At the same time, the levels of caspase-3 in G2 and G3 were significantly higher than those in G1 (p < 0.05), which shows that there was increased apoptosis marker in the submandibular and sublingual salivary glands. Tirzepatide treatment significantly reduced caspase-3 levels in G4 compared with both G2 and G3 (p < 0.05 for both), bringing them down to control levels (p > 0.05). G2 and G3 animals had greater recorded gland weights (combined submandibular and sublingual) than G1 (p < 0.05). Tirzepatide-treated animals (G4) had lower gland weights than both G2 and G3, with no significant difference detected from controls (G1). In contrast, total stimulated salivary flow rate (SSFR) over 15 min showed no significant pairwise differences among the four groups, indicating that both HFD in G2 and G3 and tirzepatide treatment in G4 did not significantly affect stimulated SFR compared with G1 (p > 0.05 for all). The ratio of stimulated salivary output (mL/15 min) per 100 g body weight differed significantly among groups (p < 0.05). The ratio (mL/15 min/100 g BW) was lower in the HFD-fed groups (G2 and G3) than in the controls (p < 0.05 for both). Tirzepatide-treated rats exhibited higher output than G2 and G3 (p < 0.05). No significant difference was detected between the tirzepatide-treated and control groups (p > 0.05), or between the HFD-fed and saline-treated groups (p > 0.05).
Table 4.
Body weight, glycemic status, lipid profile, oxidative stress biomarkers, inflammatory cytokines, caspase-3, and SSFR in all groups (n = 10).
3.2. Histopathological Results of H&E, Masson’s Trichrome, and PAS-Stained Sections
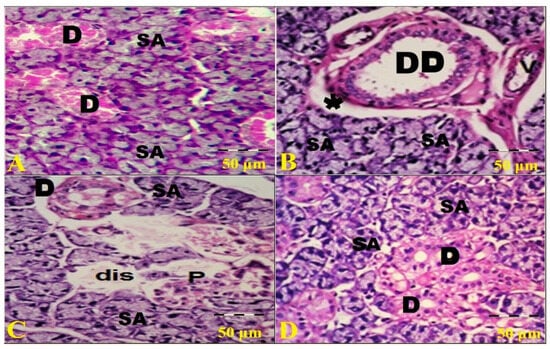
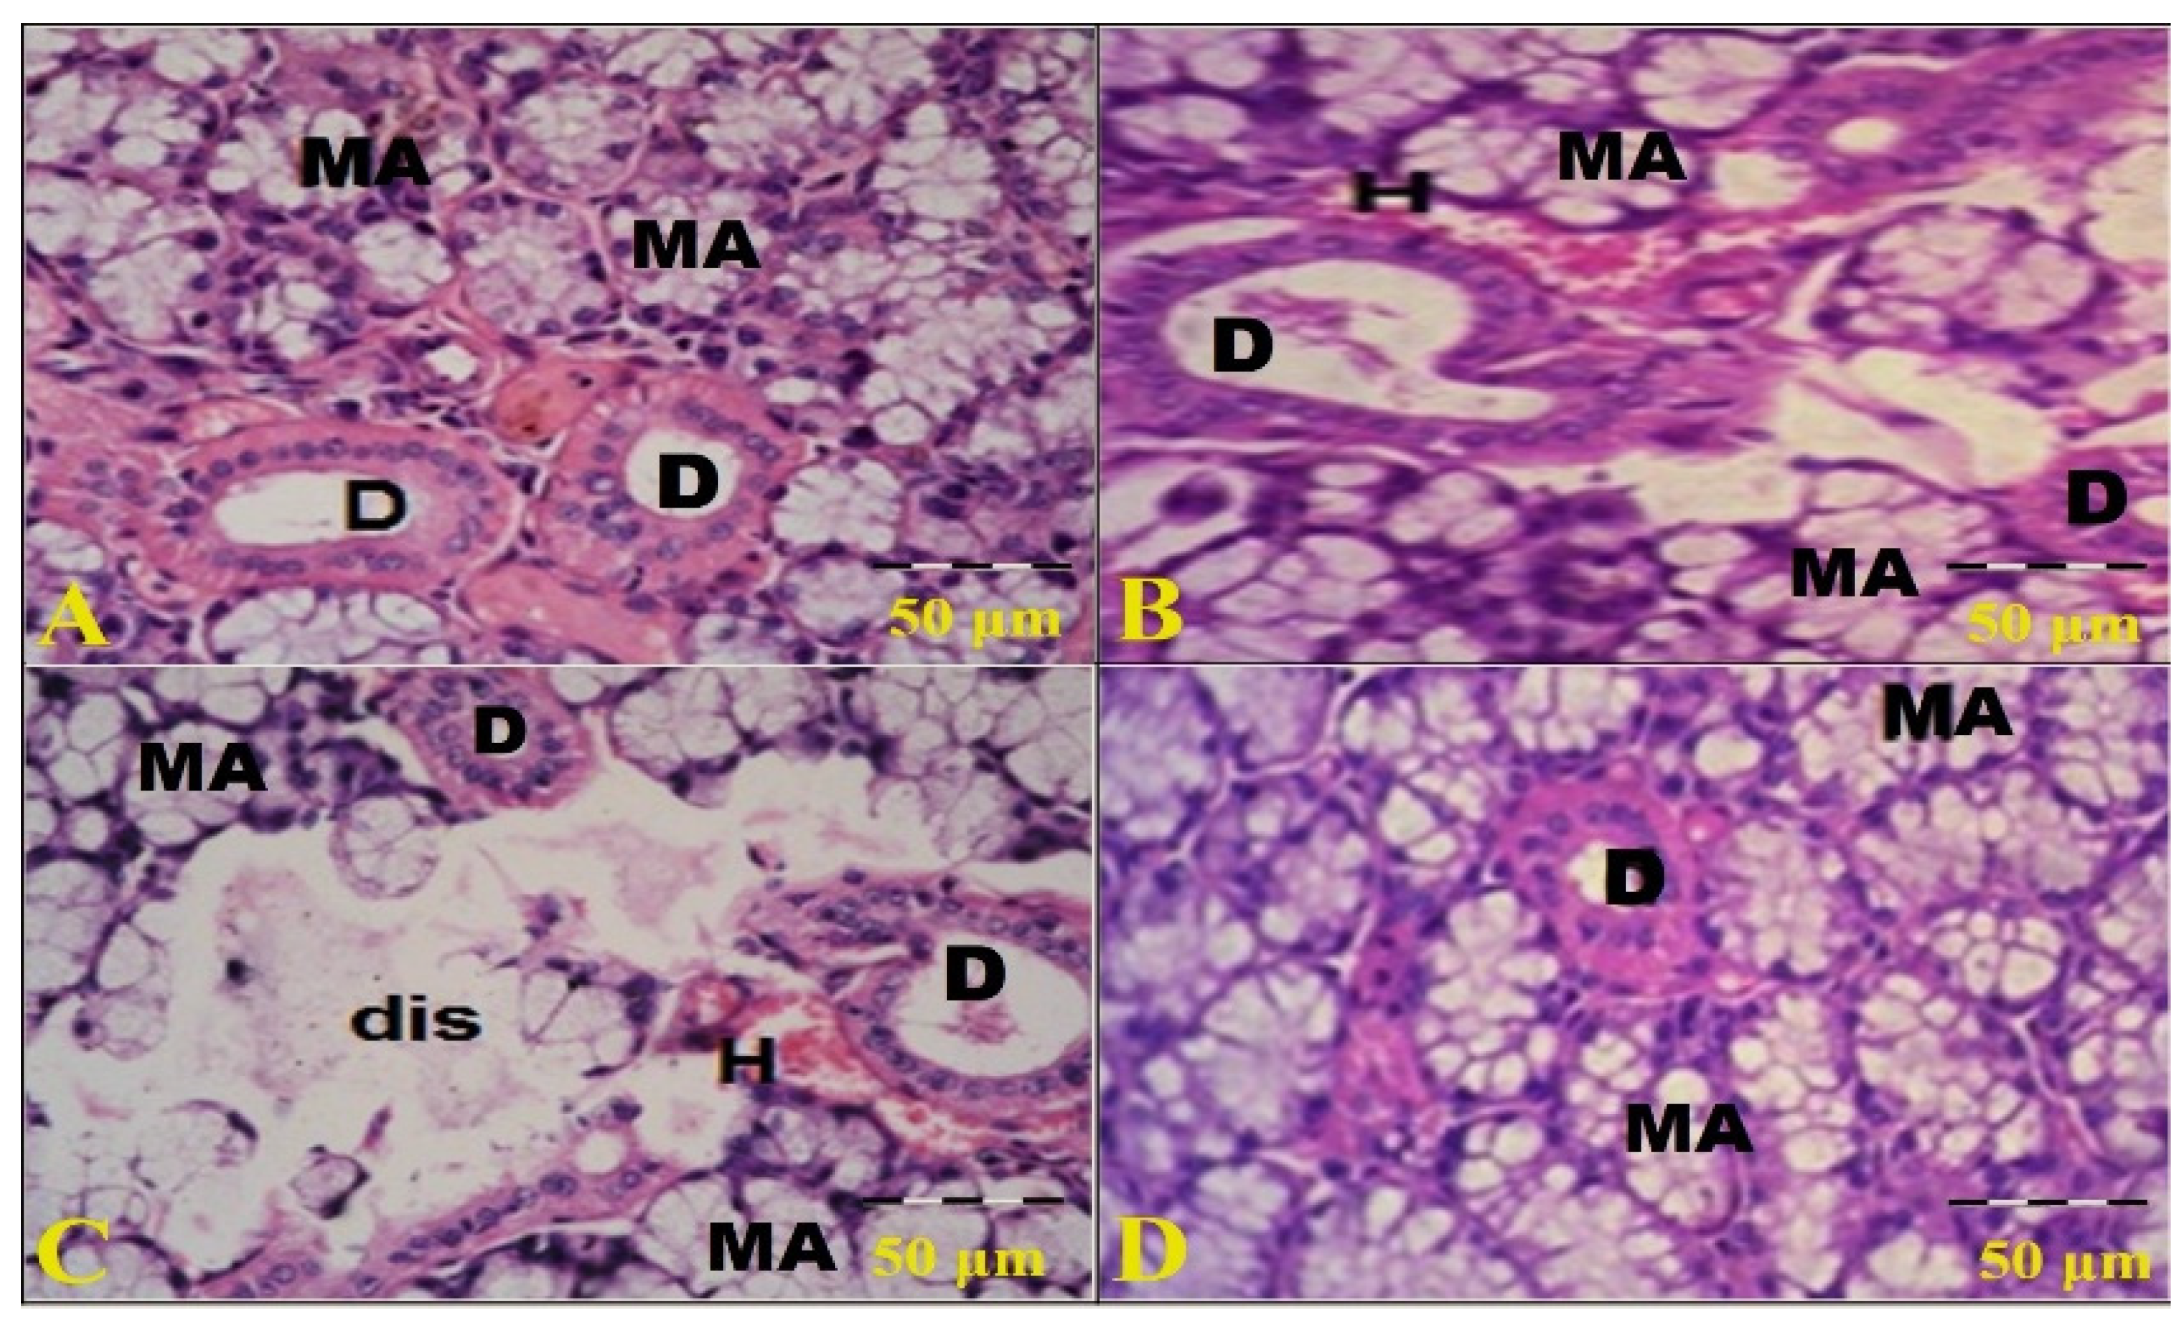
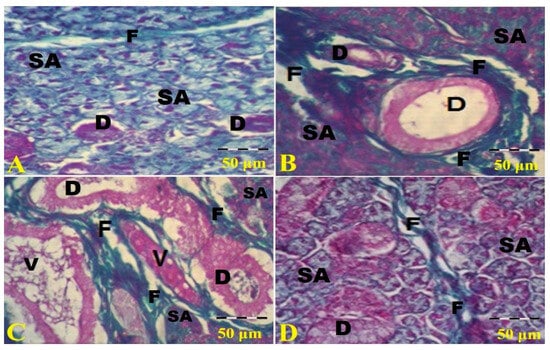
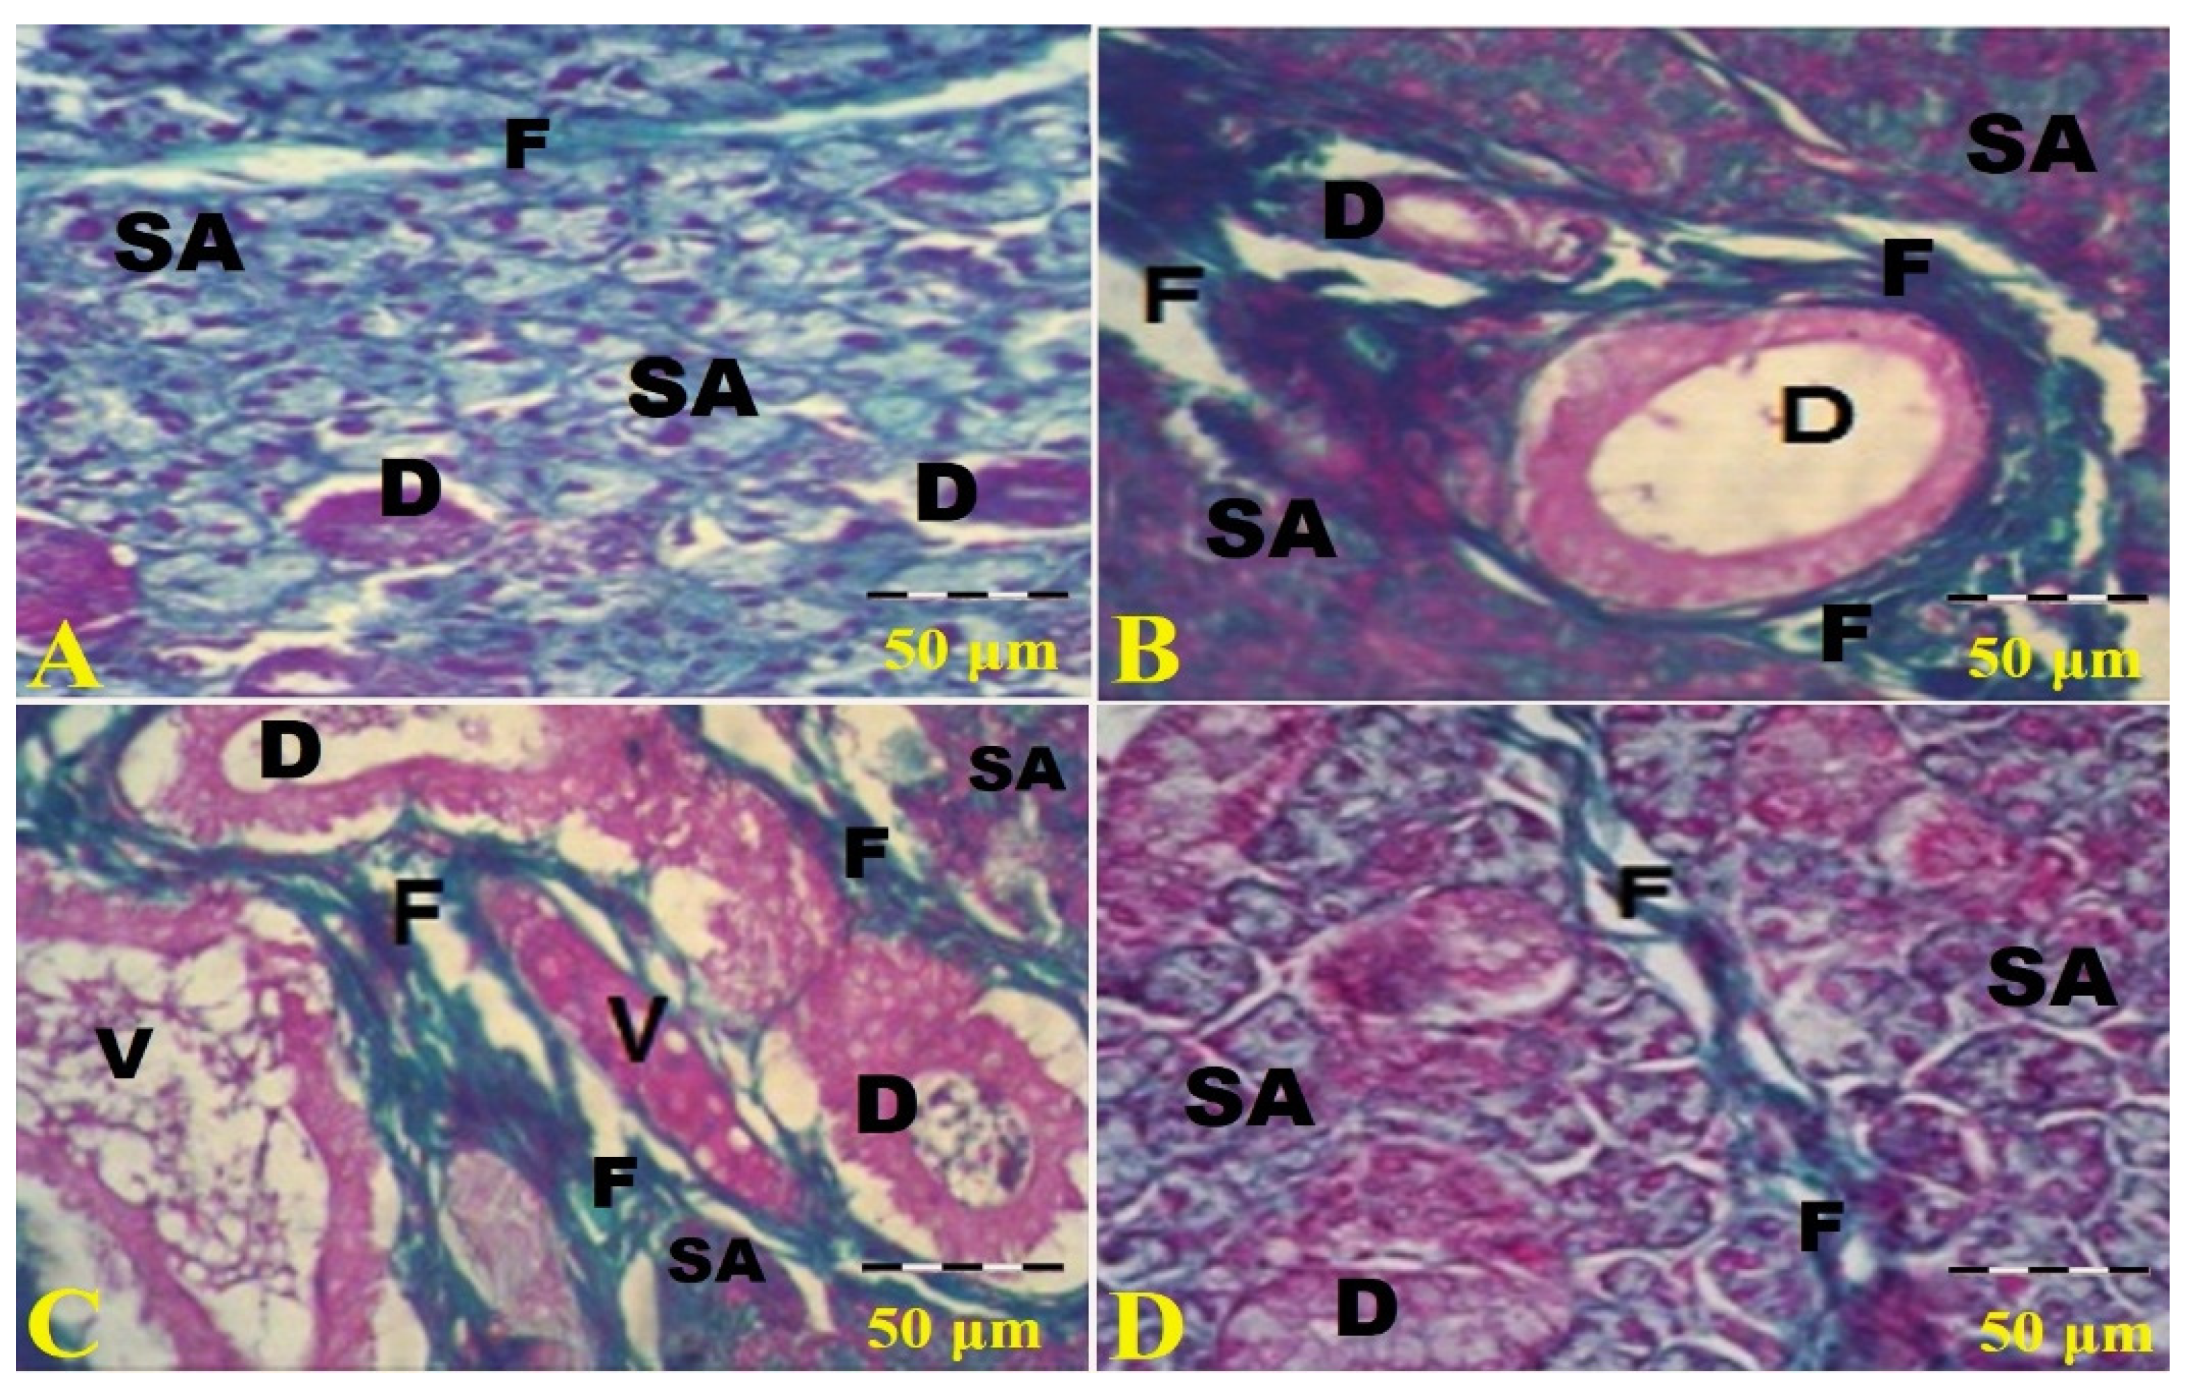
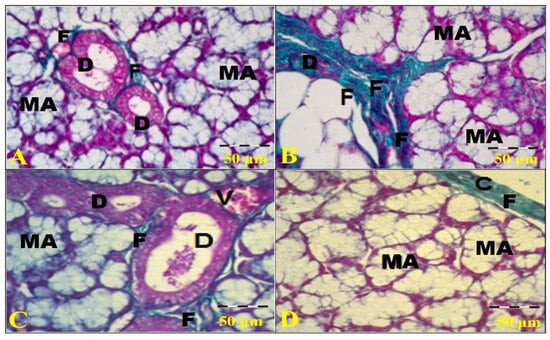
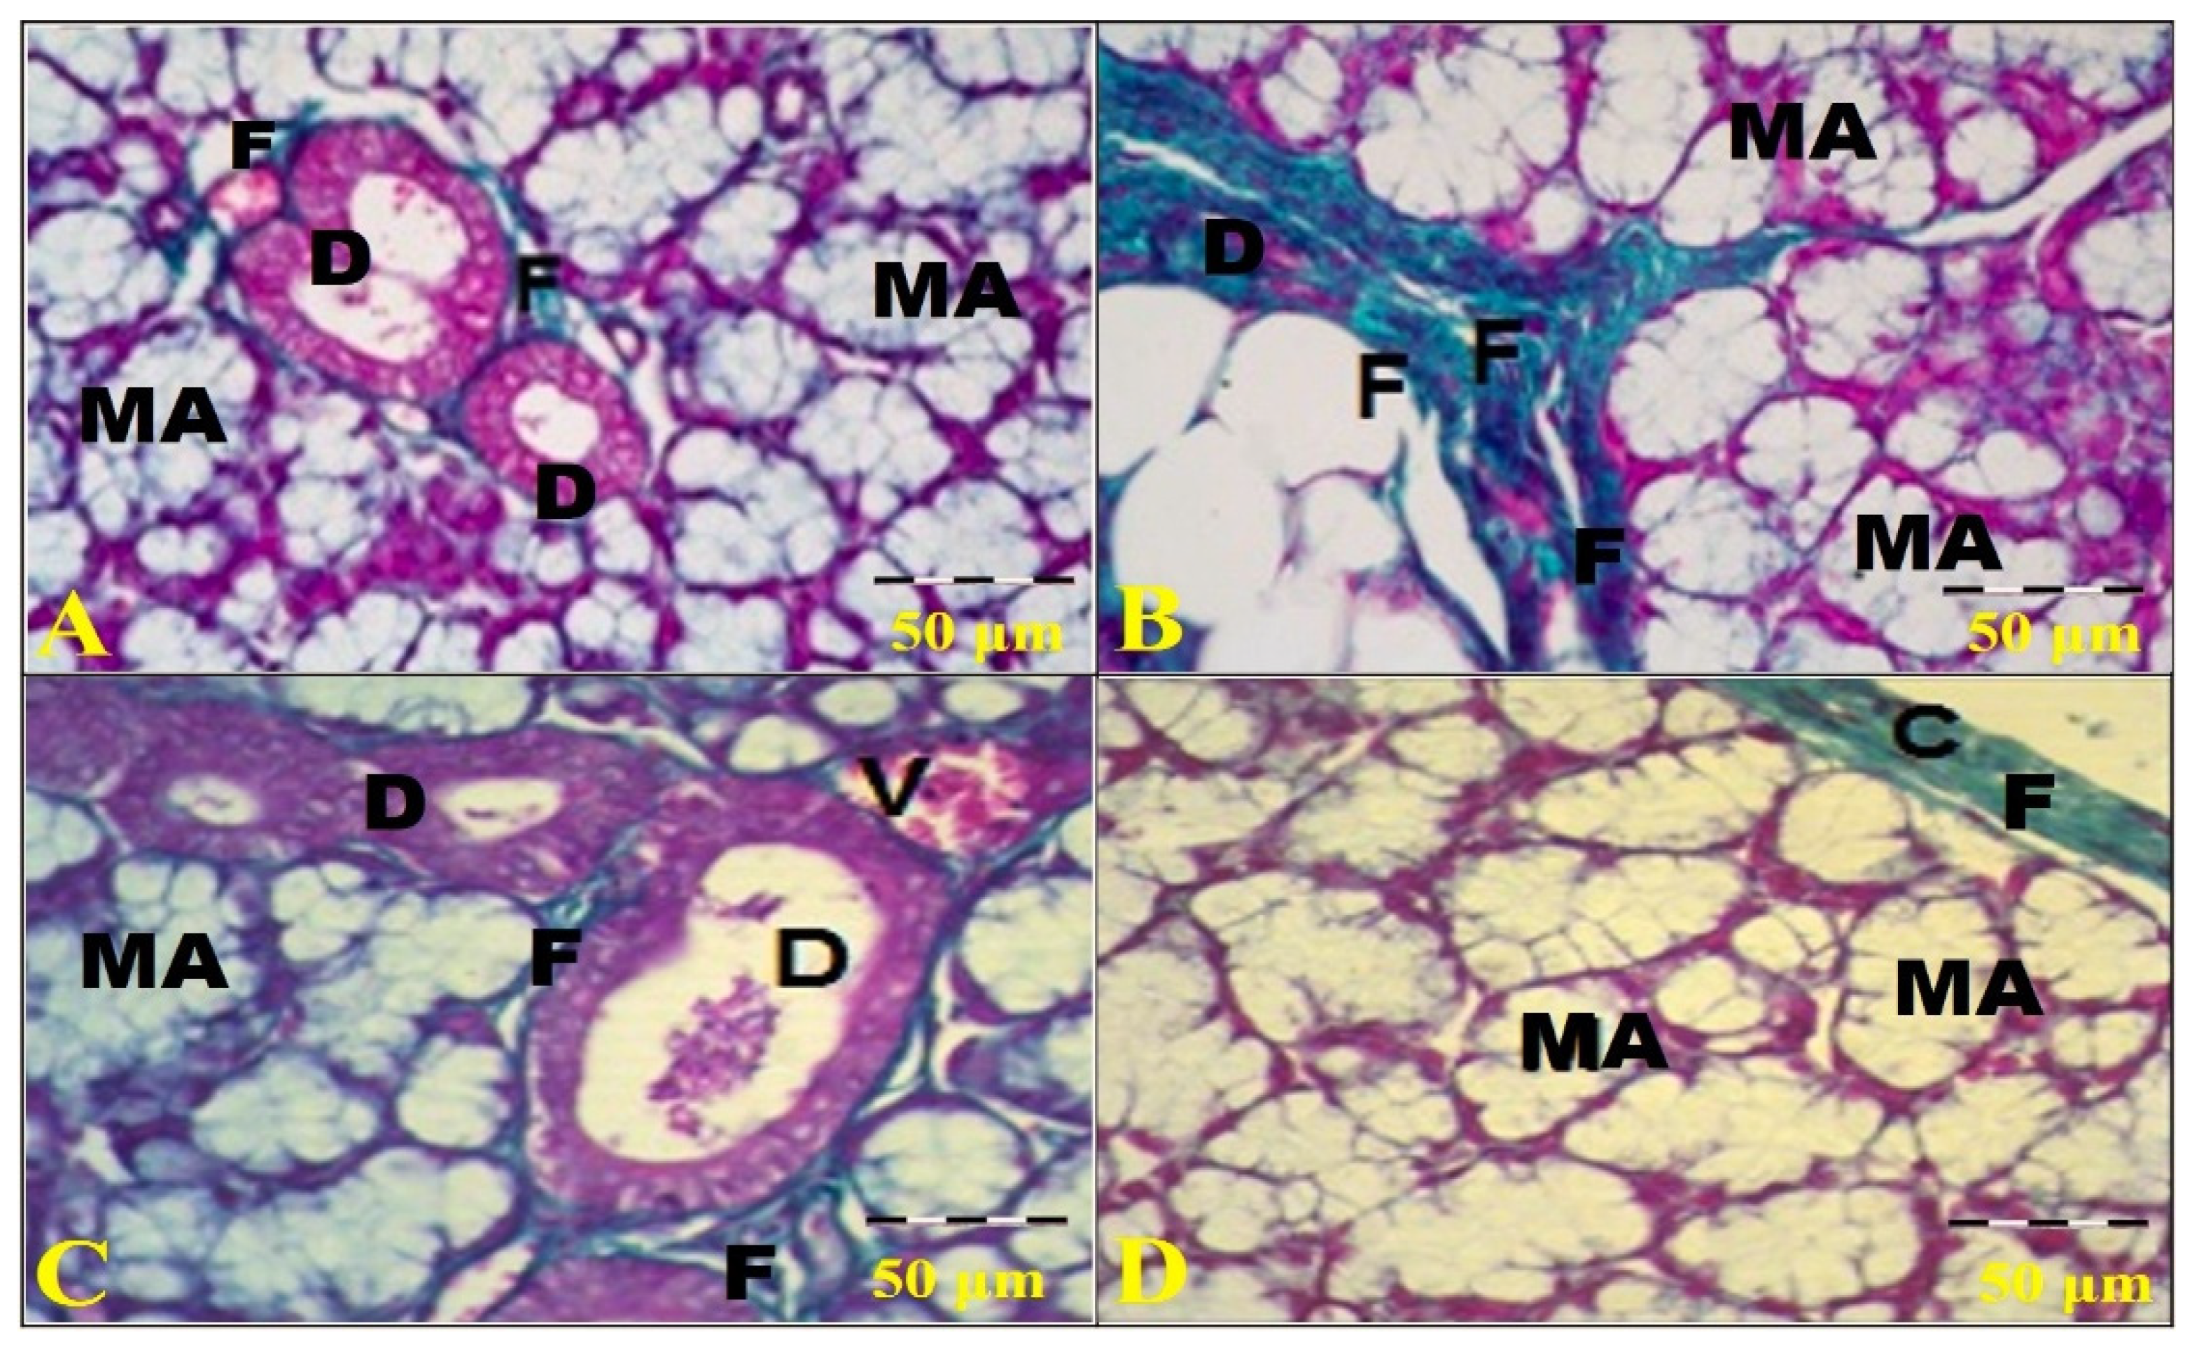
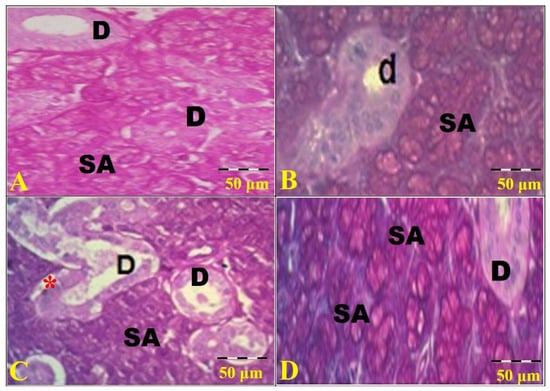
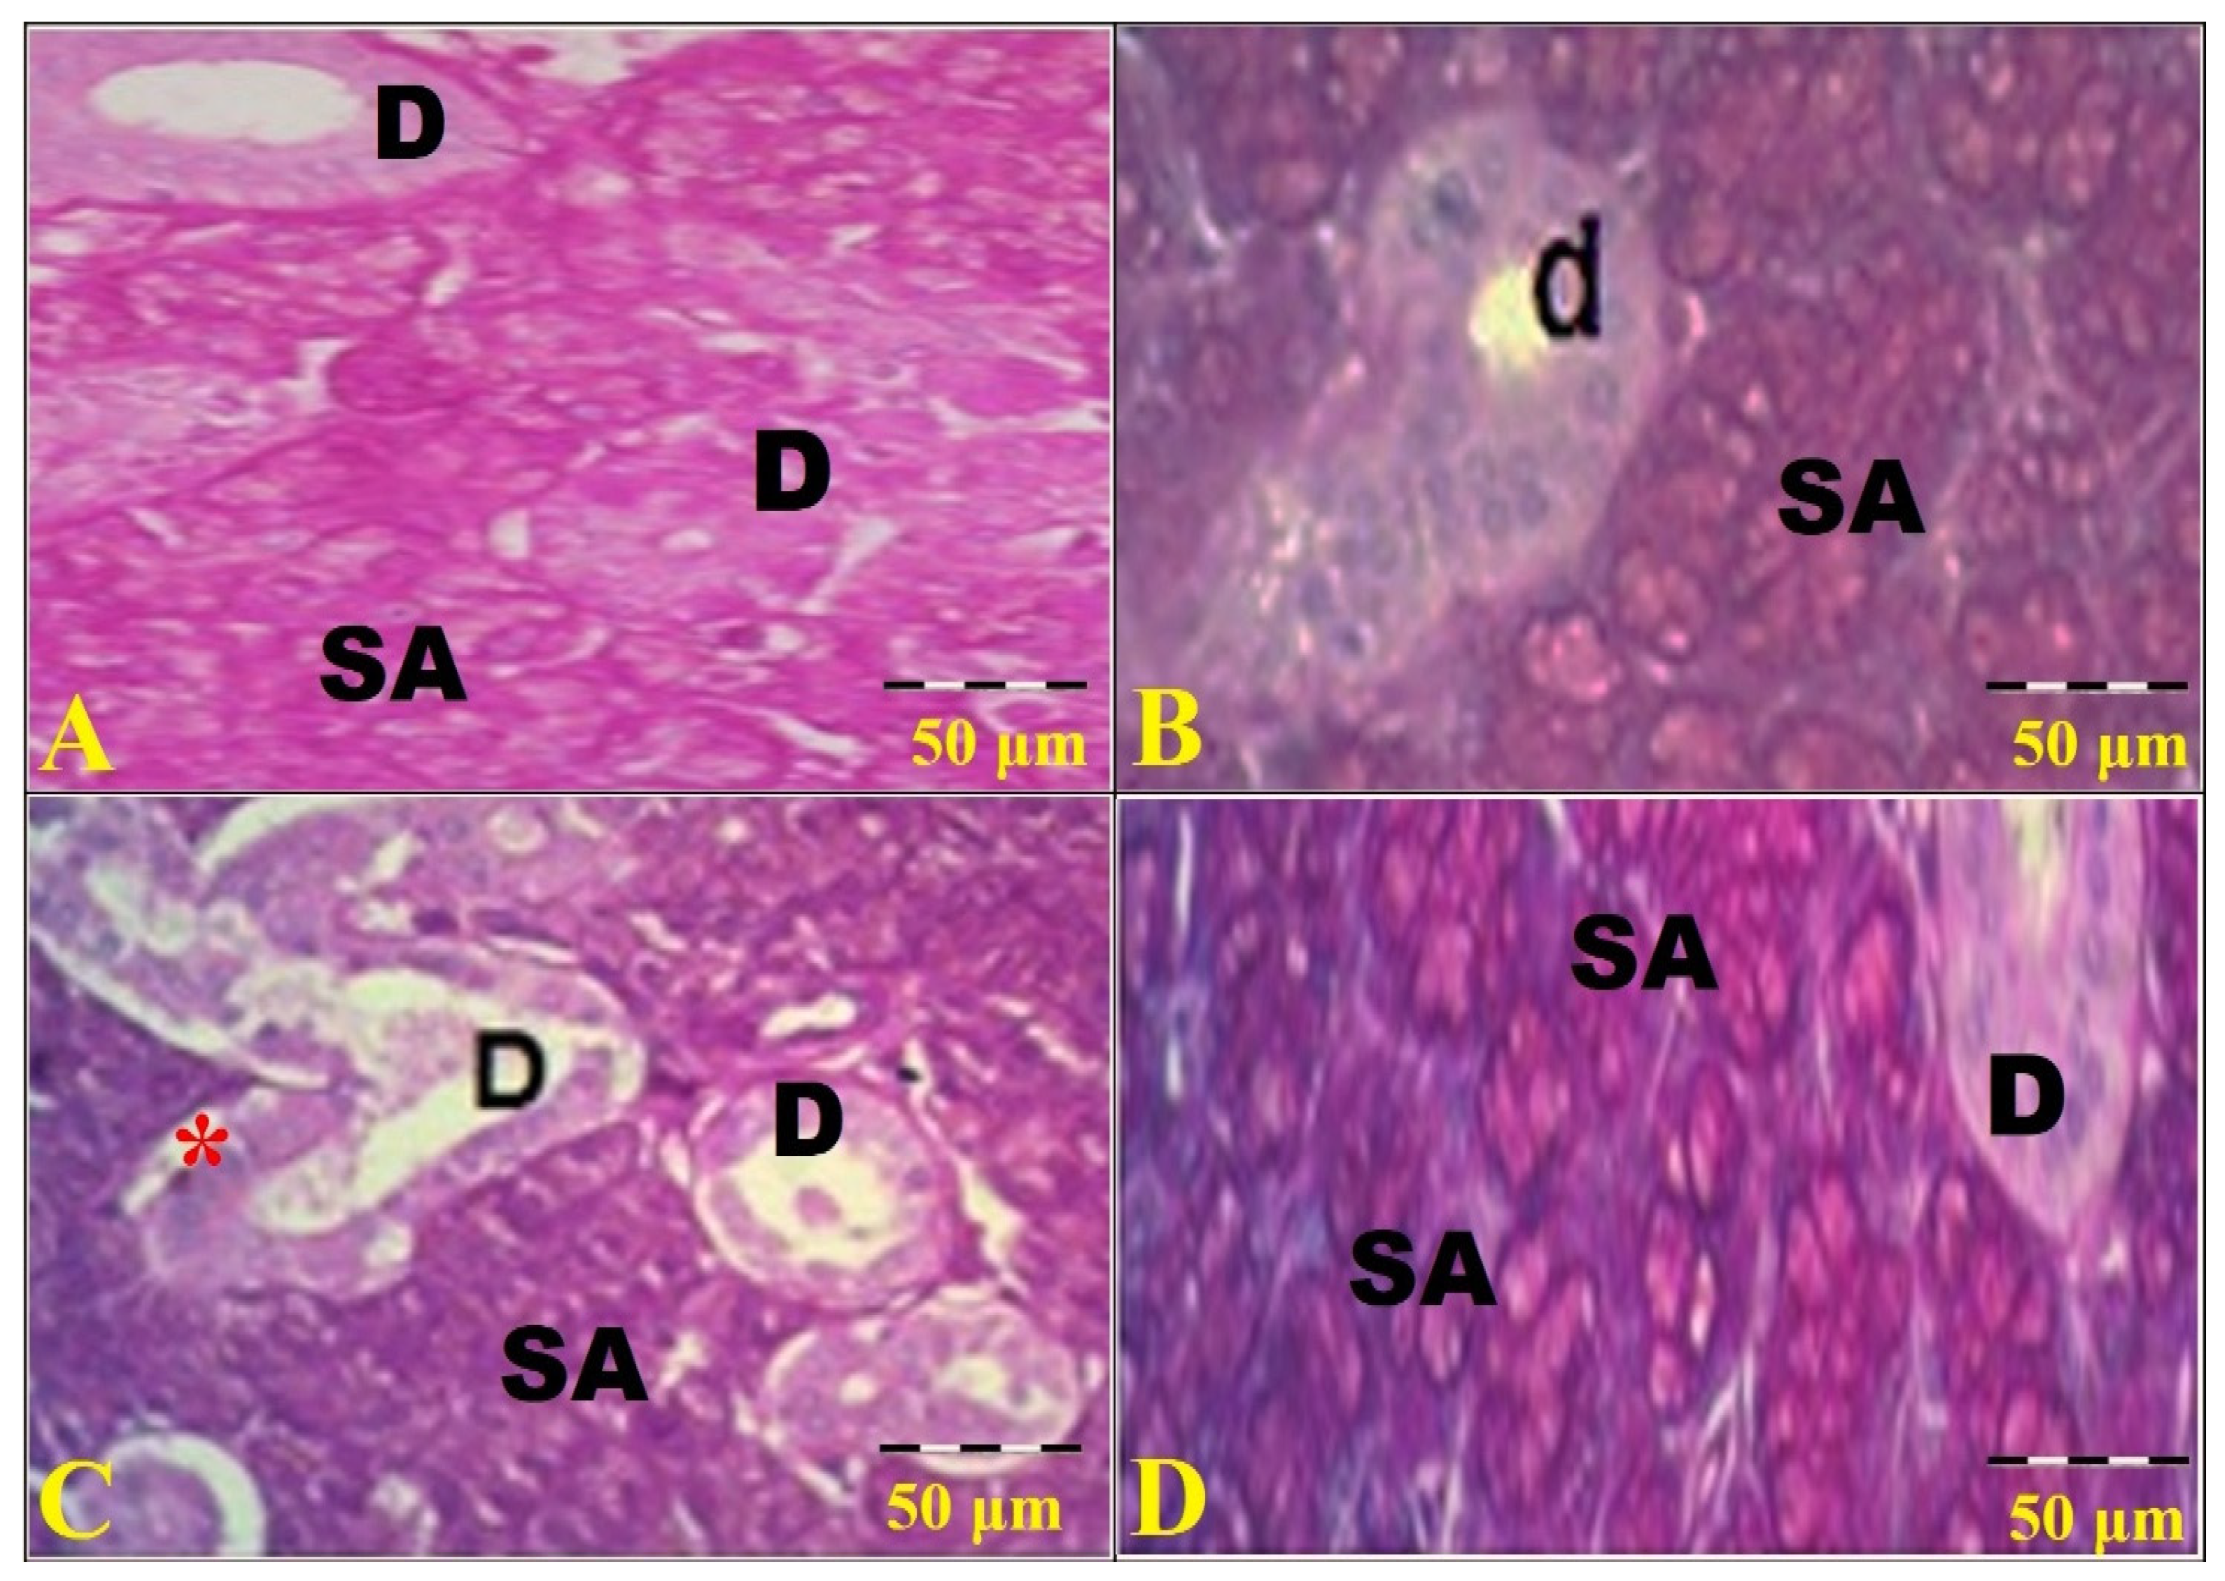
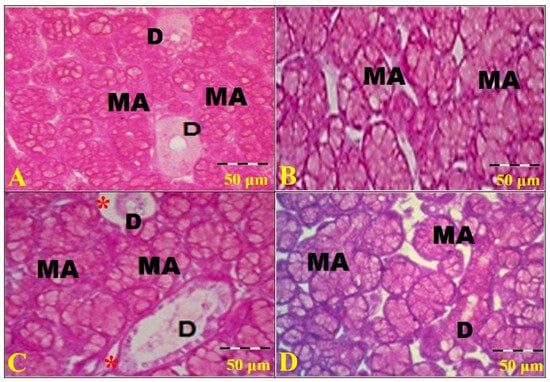
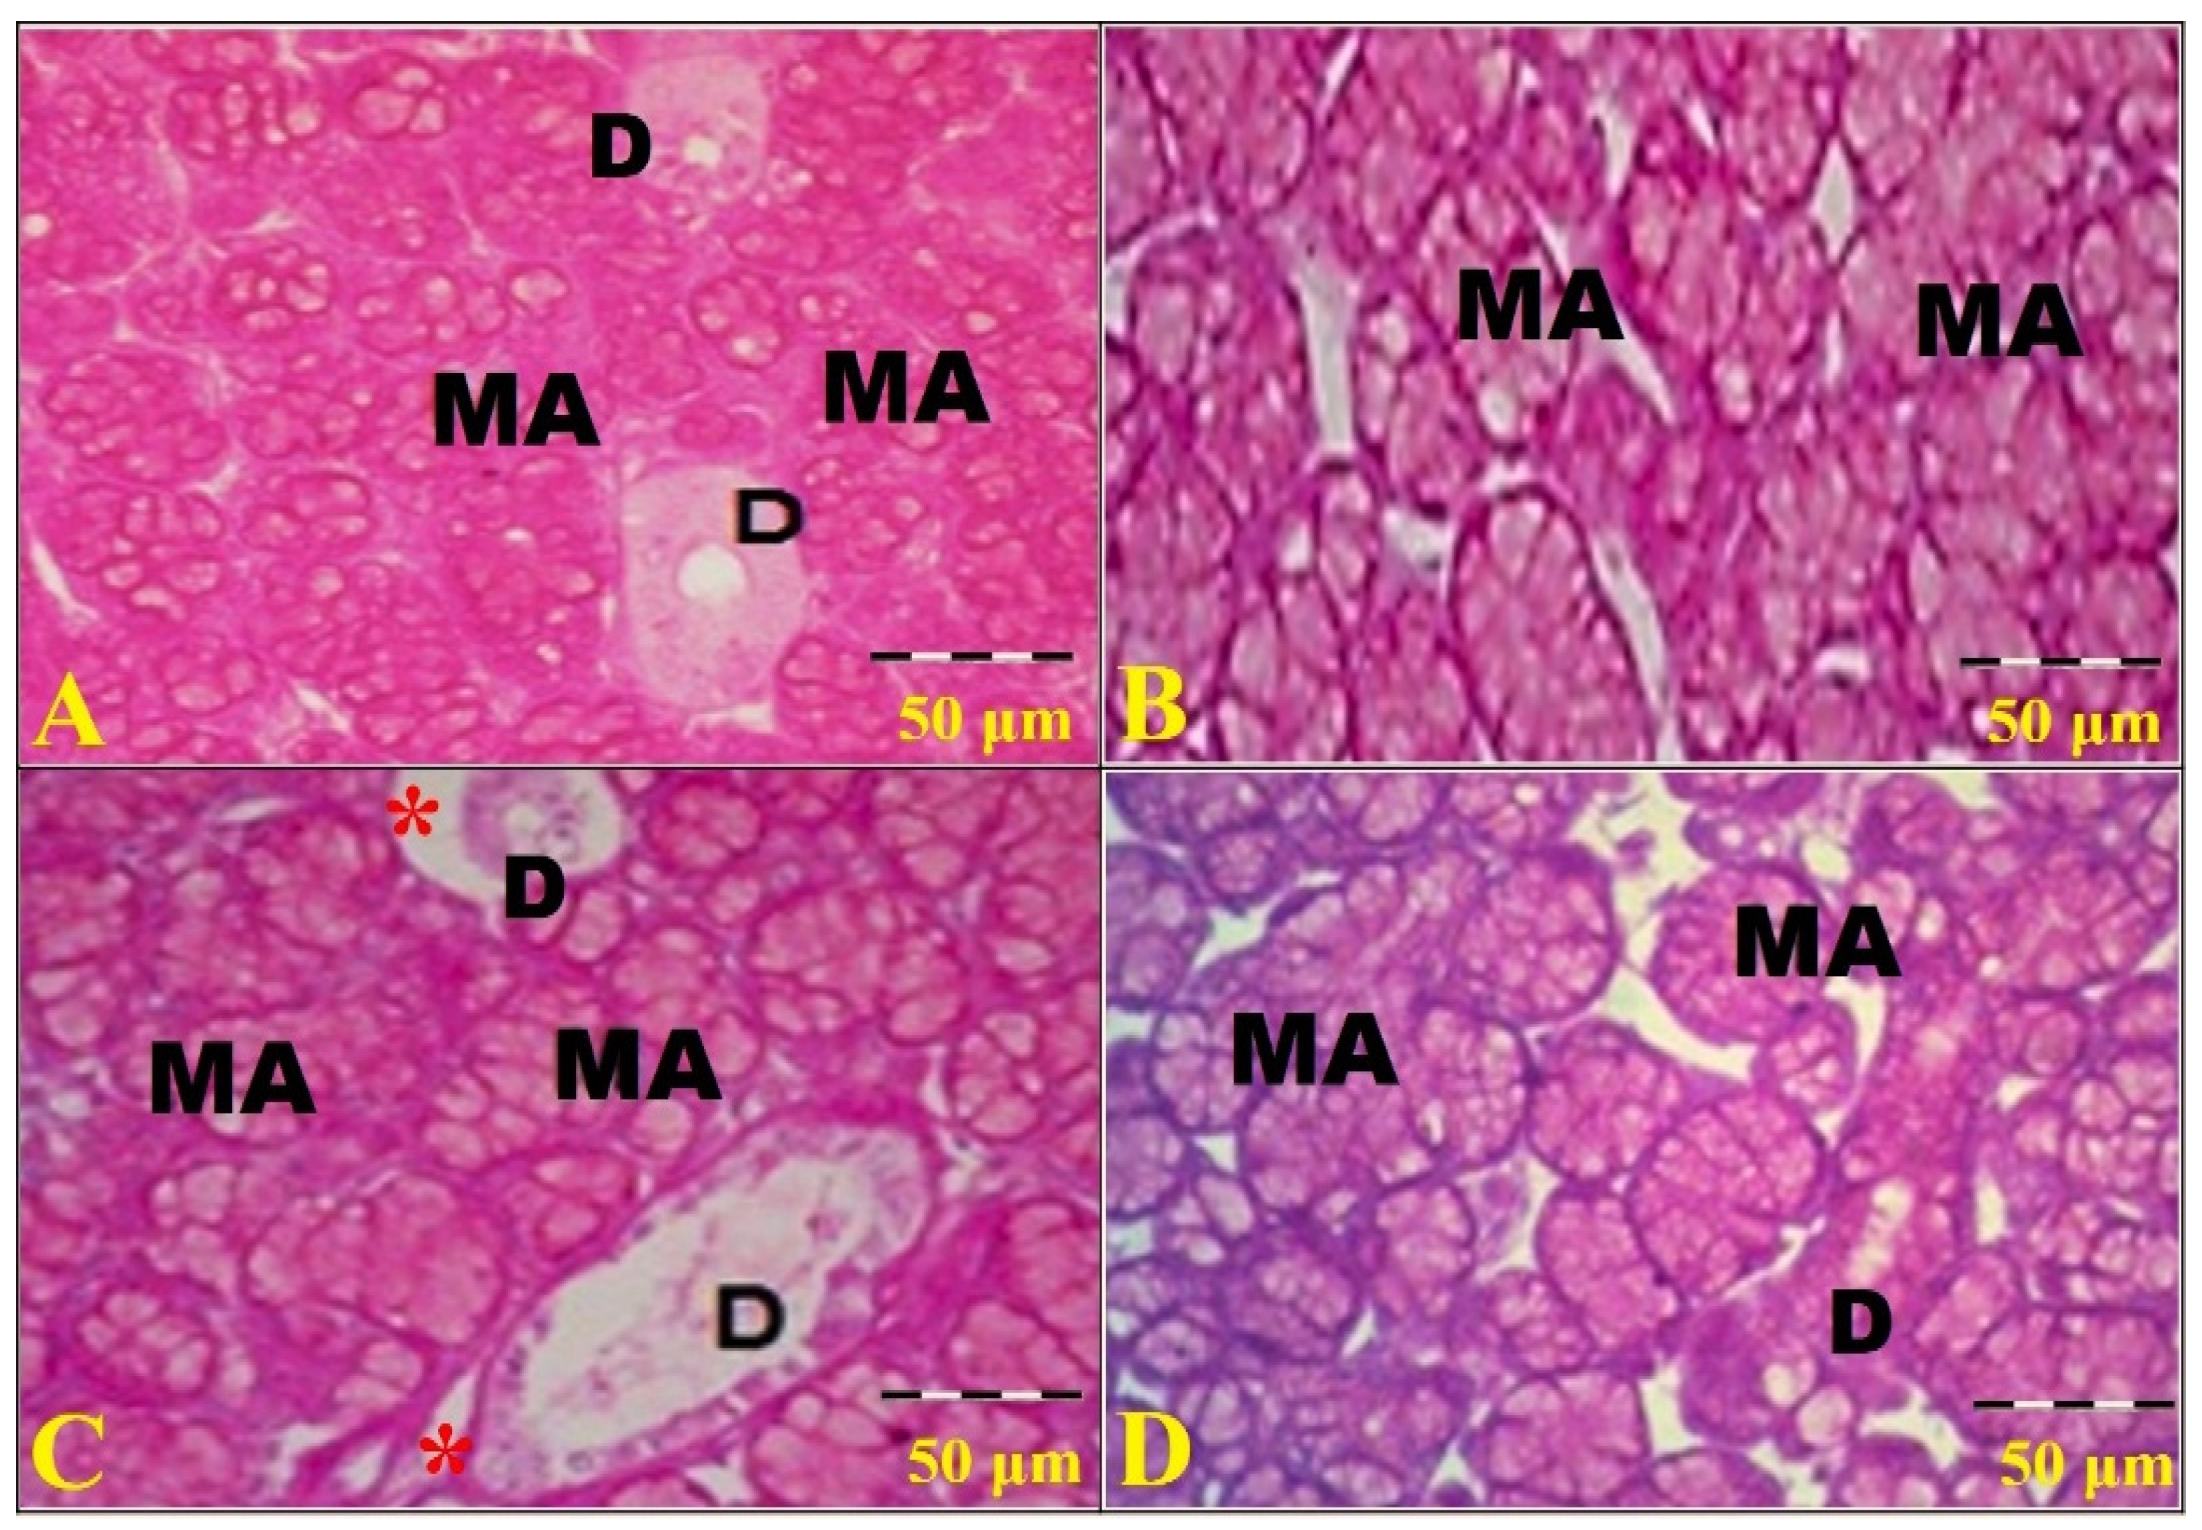
Histological examination of H&E-stained sections reveals normal submandibular (SMSG) and sublingual (SLSG) salivary gland architecture in G1 (control group). The lobules of the SMSG are composed mainly of serous (SA) secretory acini and excretory ducts, while lobules of the SLSG are composed mainly of mucous acini (MA) and excretory ducts. Serous cells of the SA are pyramidal, with basal dark, rounded nuclei and acidophilic cytoplasm, while mucous cells have pale cytoplasm with dark, basal, flat nuclei. The intervening excretory ducts appear intact within the connective tissue septa between the lobules of the SMSG and SLSG, which are lined with normal cuboidal cells in Figure 1A and Figure 2A. The sections of G2 (HFD-fed) reveal degenerative and inflammatory changes, with disorganization and disruption of normal glandular parenchymal structure; degenerated acinar cells with cytoplasmic vacuolation and apoptotic nuclei; some ducts are degenerated, and their lumens contain exfoliated cellular debris; and some blood vessels are congested and disrupted with extravasation of blood in Figure 1B and Figure 2B. Also, examination of sections from G3 (HFD + Saline) in the SMSG and the SLSG shows desquamated epithelial cells of degenerated acini and excretory ducts, collapsed mucous acini, indistinct acinar boundaries, marked atrophy of the acini with pyknotic nuclei of acinar cells, and many ducts that appear irregular with marked disruption of their epithelial lining and periductal outlines, congested blood vessels, and focal interstitial hemorrhage in Figure 1C and Figure 2C. In contrast, G4 (HFD + tirzepatide) largely preserved SMSG and SLSG lobules composed of SA, MA, and ducts in Figure 1D and Figure 2D. Furthermore, examination of Masson’s trichrome-stained sections from the SMSG in Figure 3 and SLSG in Figure 4 shows the distribution of collagen fibers (F) in all groups. A normal distribution of fine F is observed in the interstitial septa of G1 in both glands (Figure 3A and Figure 4A). In contrast, G2 rats show a marked distribution of thick F between the SA and ducts (D) in Figure 3B and Figure 4B. Also, G3 rats show deposition of thick interlobular F (indicating significant fibrotic changes) between the SA and around the D, with dilated, blood-engorged vessels (V) in the lobular stroma of the SMSG in Figure 3C and the SLSG in Figure 4C, whereas rats of G4 markedly reduced collagen deposition, with only few pale-green collagen fibers between the acini and ducts of the SMSG in Figure 3D and within the capsule/interlobular tissue of the SLSG in Figure 4D and Table 5. PAS staining of G1 and G4 revealed a strong positive reaction in the SA (Figure 5A,D) in the SMSG and the MA of the SLSG (Figure 6A,D), with a moderate reaction in their ducts. In contrast, PAS staining was moderate in the SA and weak in the irregular, distended ducts, with wide spaces between the SA in the SMSG of G2 and G3 (Figure 5B,C). Also, PAS staining of G1 and G4 revealed a strong positive reaction in the MA and a moderate reaction in the ducts of the SLSG (Figure 6A,D). In contrast, PAS reaction appeared moderate in the MA and weak in the irregularly distended ducts, with wide spaces between the MA in the SLSG of G2 and G3 (Figure 6B,C).
Figure 1.
Photomicrographs from histological sections in all groups of the submandibular salivary gland (SMSG). The parenchymal lobules of the SMSG consist mainly of serous secretory acini and ducts. The control group (G1) shows numerous serous acini (SA) around central ducts (D), which are lined by a simple layer of cuboidal epithelium. The serous cells are pyramidal, with dark, basal, rounded nuclei and acidophilic cytoplasm, and the ducts are regularly arranged and lined by intact cuboidal epithelial cells (A). In contrast, the HFD-fed group (G2) shows extensive parenchymal spacing and disorganization, massive atrophy of the acini and ducts with disrupted ductal outlines (black asterisk), numerous SA around a large degenerated duct (DD), which is lined by a simple layer of cuboidal epithelium, and an extravasated blood vessel (V) in (B), whereas examination of the HFD + saline group (G3) shows severe parenchymal disorganization (dis) with many pyknotic nuclei (P) in the acinar cells and ducts (D). A chronic inflammatory reaction is also present in (C). At the same time, the HFD + tirzepatide group (G4) shows a similar parenchymal structure to that of G1, with intact SA and ducts lined by a cuboidal epithelium in (D) (H&E, 400× with a scale bar of 50 µm).
Figure 2.
Photomicrographs from all groups of the sublingual salivary gland (SLSG). The control group (G1) shows numerous mucous acini (MA) around central ducts (D), which are lined by a simple layer of cuboidal epithelium. The mucous cells have pale cytoplasm with dark, basally located, flattened nuclei (A). In contrast, examination of G2 rats shows severe parenchymal disorganization with degenerated, collapsed MA, indistinct acinar boundaries, cytoplasmic vacuolation, degenerated ducts (D), and extravasated blood (H) in (B), whereas examination of G3 rats shows extensive parenchymal spacing, massive atrophy of the acini (dis), indistinct acinar boundaries, cytoplasmic vacuolation, degenerated ducts (D) with disrupted ductal outlines, and extravasated blood (H) in (C). Examination of G4 rats shows structures similar to G1, with preserved MA and secretory ducts (D), which are lined by a cuboidal epithelium in (D) (H&E, 400× with a scale bar of 50 µm).
Figure 3.
Photomicrographs from examination of sections from all SMSG groups. G1 shows a normal distribution of pale green interlobular collagen fibers (F) between numerous green serous acini (SA) and small ducts (D) of the SMSG (A). In contrast, G2 rats show marked distribution of dense thick interlobular F between the SA and D in the SMSG (B). Also, rats of G3 show deposition of thick interlobular F (indicating marked fibrosis) around the D and dilated blood-engorged vessels (V) and between the SA in the SMSG (C), whereas G4 rats show few green interlobular F between the SA and D of the SMSG (D) (Masson’s trichrome, 400× with a scale bar of 50 µm).
Figure 4.
Photomicrographs from examination of sections from all SLSG groups. G1 shows a normal distribution of pale green interlobular collagen fibers (F) between numerous pale green mucous acini (MA) and small ducts (D) of the SLSG (A). In contrast, G2 rats show marked distribution of dense thick bundles of interlobular F between the MA and D in the SLSG (B). Also, obese rats of G3 show deposition of thick interlobular F (indicating marked fibrosis) around the D and dilated blood-engorged vessels (V) and between the MA in the SLSG (C), whereas G4 rats show thick green F in the capsule (C) and very thin pale green interlobular F between the MA and D of the SLSG (D) (Masson’s trichrome, 400× with a scale bar of 50 µm).
Table 5.
Scores for histological injury, fibrosis, and PAS intensity across all groups (n = 10).
Figure 5.
Photomicrographs from sections of all SMSG groups. The PAS staining shows a strong positive reaction in the serous acini (SA) and a moderate reaction in the ducts (D) of the SMSG in G1 and G4 (A,D). In contrast, the PAS reaction appeared moderate in the SA and weak in the thick irregular ducts (d) of the SMSG in G2 and thin distended D with wide spaces (red star) in the SMSG of G3 (B,C) (PAS, 400× with a scale bar of 50 µm).
Figure 6.
Photomicrographs from sections of all SLSG groups. The PAS staining of G1 and G4 shows a strong positive reaction in the mucous acini (MA) and a moderate reaction in their ducts (D) in (A,D). In contrast, the PAS reaction appears moderate in the MA of G2, and weak in the MA and the thin, distended ducts (D) with wide spaces (red stars) of G3 compared with G1 (B,C) (PAS, 400× with a scale bar of 50 µm).
3.3. Semiquantitative Scoring of Histological Injury, Fibrosis, and PAS-Staining Intensity
Table 5 shows significant overall differences among the four experimental groups in histological injury, fibrosis, and PAS-staining intensity (Kruskal–Wallis test, all p < 0.001).
For H&E injury, the control group (G1) showed the lowest median score [0.25 (IQR: 0.25–0.25)], whereas higher scores were observed in G2 [2.75 (2.75–2.75)] and G3 [3.75 (3.50–3.75)]. G4 showed a lower median injury score [1.25 (1.25–1.25)]. Dunn’s post hoc test with Holm adjustment demonstrated significant differences between G1 and G2 (adjusted p = 0.000466), G1 and G3 (adjusted p < 0.000001), and G3 and G4 (adjusted p = 0.000466). Although the median injury score was lower in G4 than in G2, this comparison did not remain statistically significant after Holm adjustment (adjusted p = 0.152).
A similar pattern was observed for fibrosis. The median fibrosis score was 0.25 (IQR: 0.25–0.50) in G1, 2.63 (2.50–2.75) in G2, 3.75 (3.50–3.75) in G3, and 1.25 (1.25–1.25) in G4. Significant pairwise differences were detected between G1 and G2 (adjusted p = 0.000523), G1 and G3 (adjusted p < 0.000001), and G3 and G4 (adjusted p = 0.000523). The lower fibrosis score in G4 compared with G2 did not reach statistical significance after adjustment for multiple comparisons (adjusted p = 0.157).
PAS-staining intensity was highest in G1 [2.63 (IQR: 2.50–2.75)] and was reduced in G2 [1.38 (1.25–1.50)] and G3 [1.00 (0.75–1.25)]. G4 showed a higher PAS score [2.50 (2.50–2.50)], approaching the control-group distribution. Dunn’s test with Holm adjustment demonstrated significant differences between G1 and G2, G1 and G3, G2 and G4 (adjusted p = 0.025635), and G3 and G4 (adjusted p = 0.000137). No significant difference was detected between G1 and G4.
Collectively, the semiquantitative findings indicate that tirzepatide was associated with lower histological injury and fibrosis scores and higher PAS-staining intensity relative to the HFD groups, although the value of the pairwise differences varied according to the histological outcome and the comparison group.
3.4. Quantitative Results of Mast Cell Morphometry
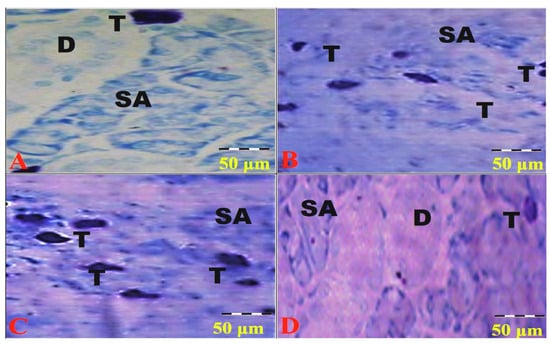
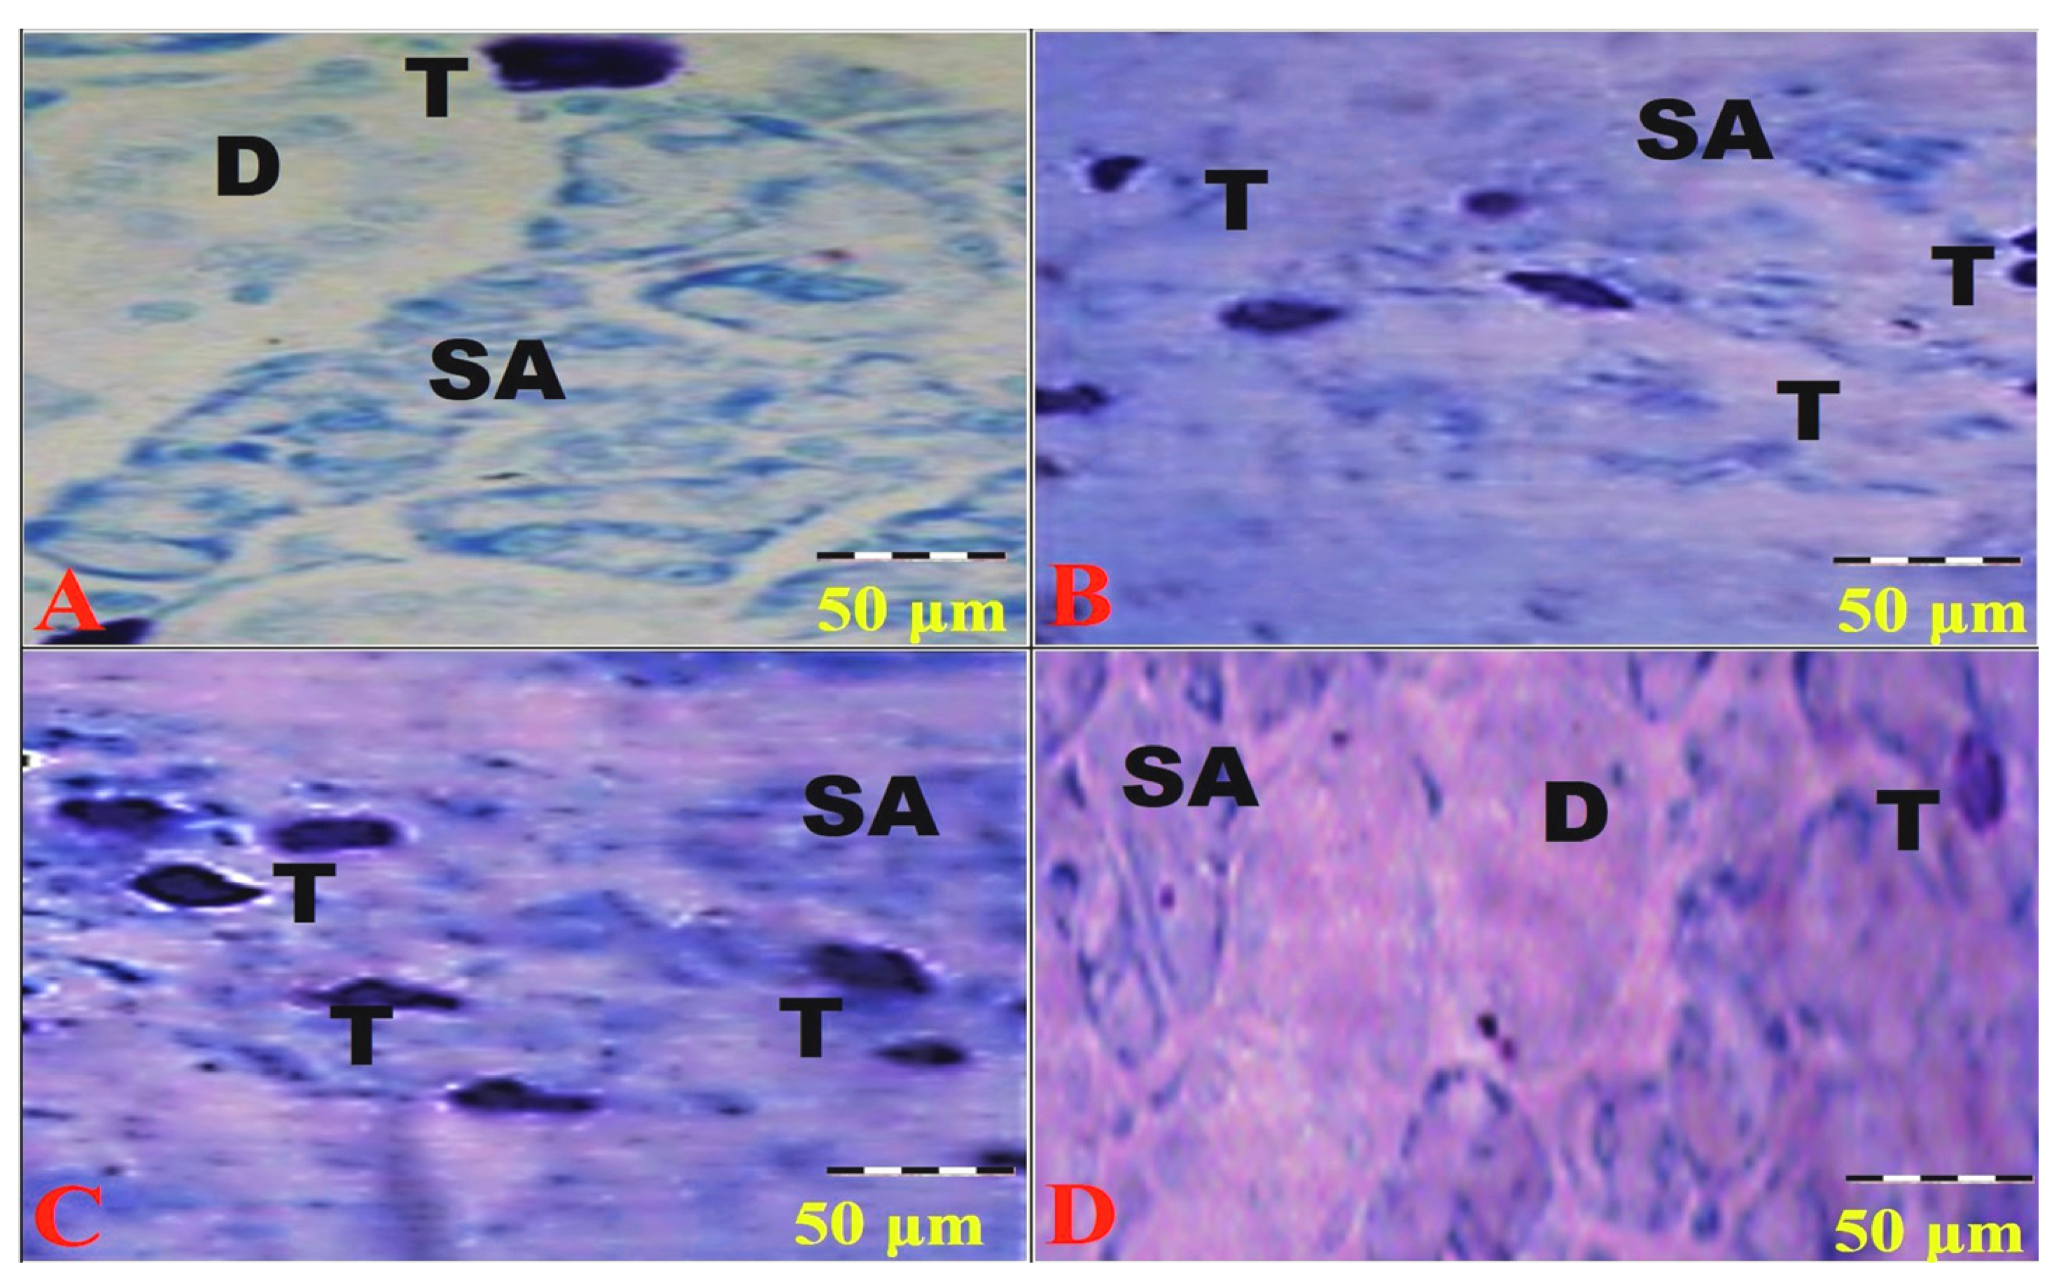
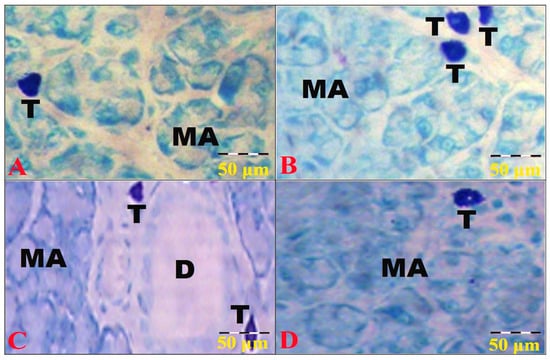
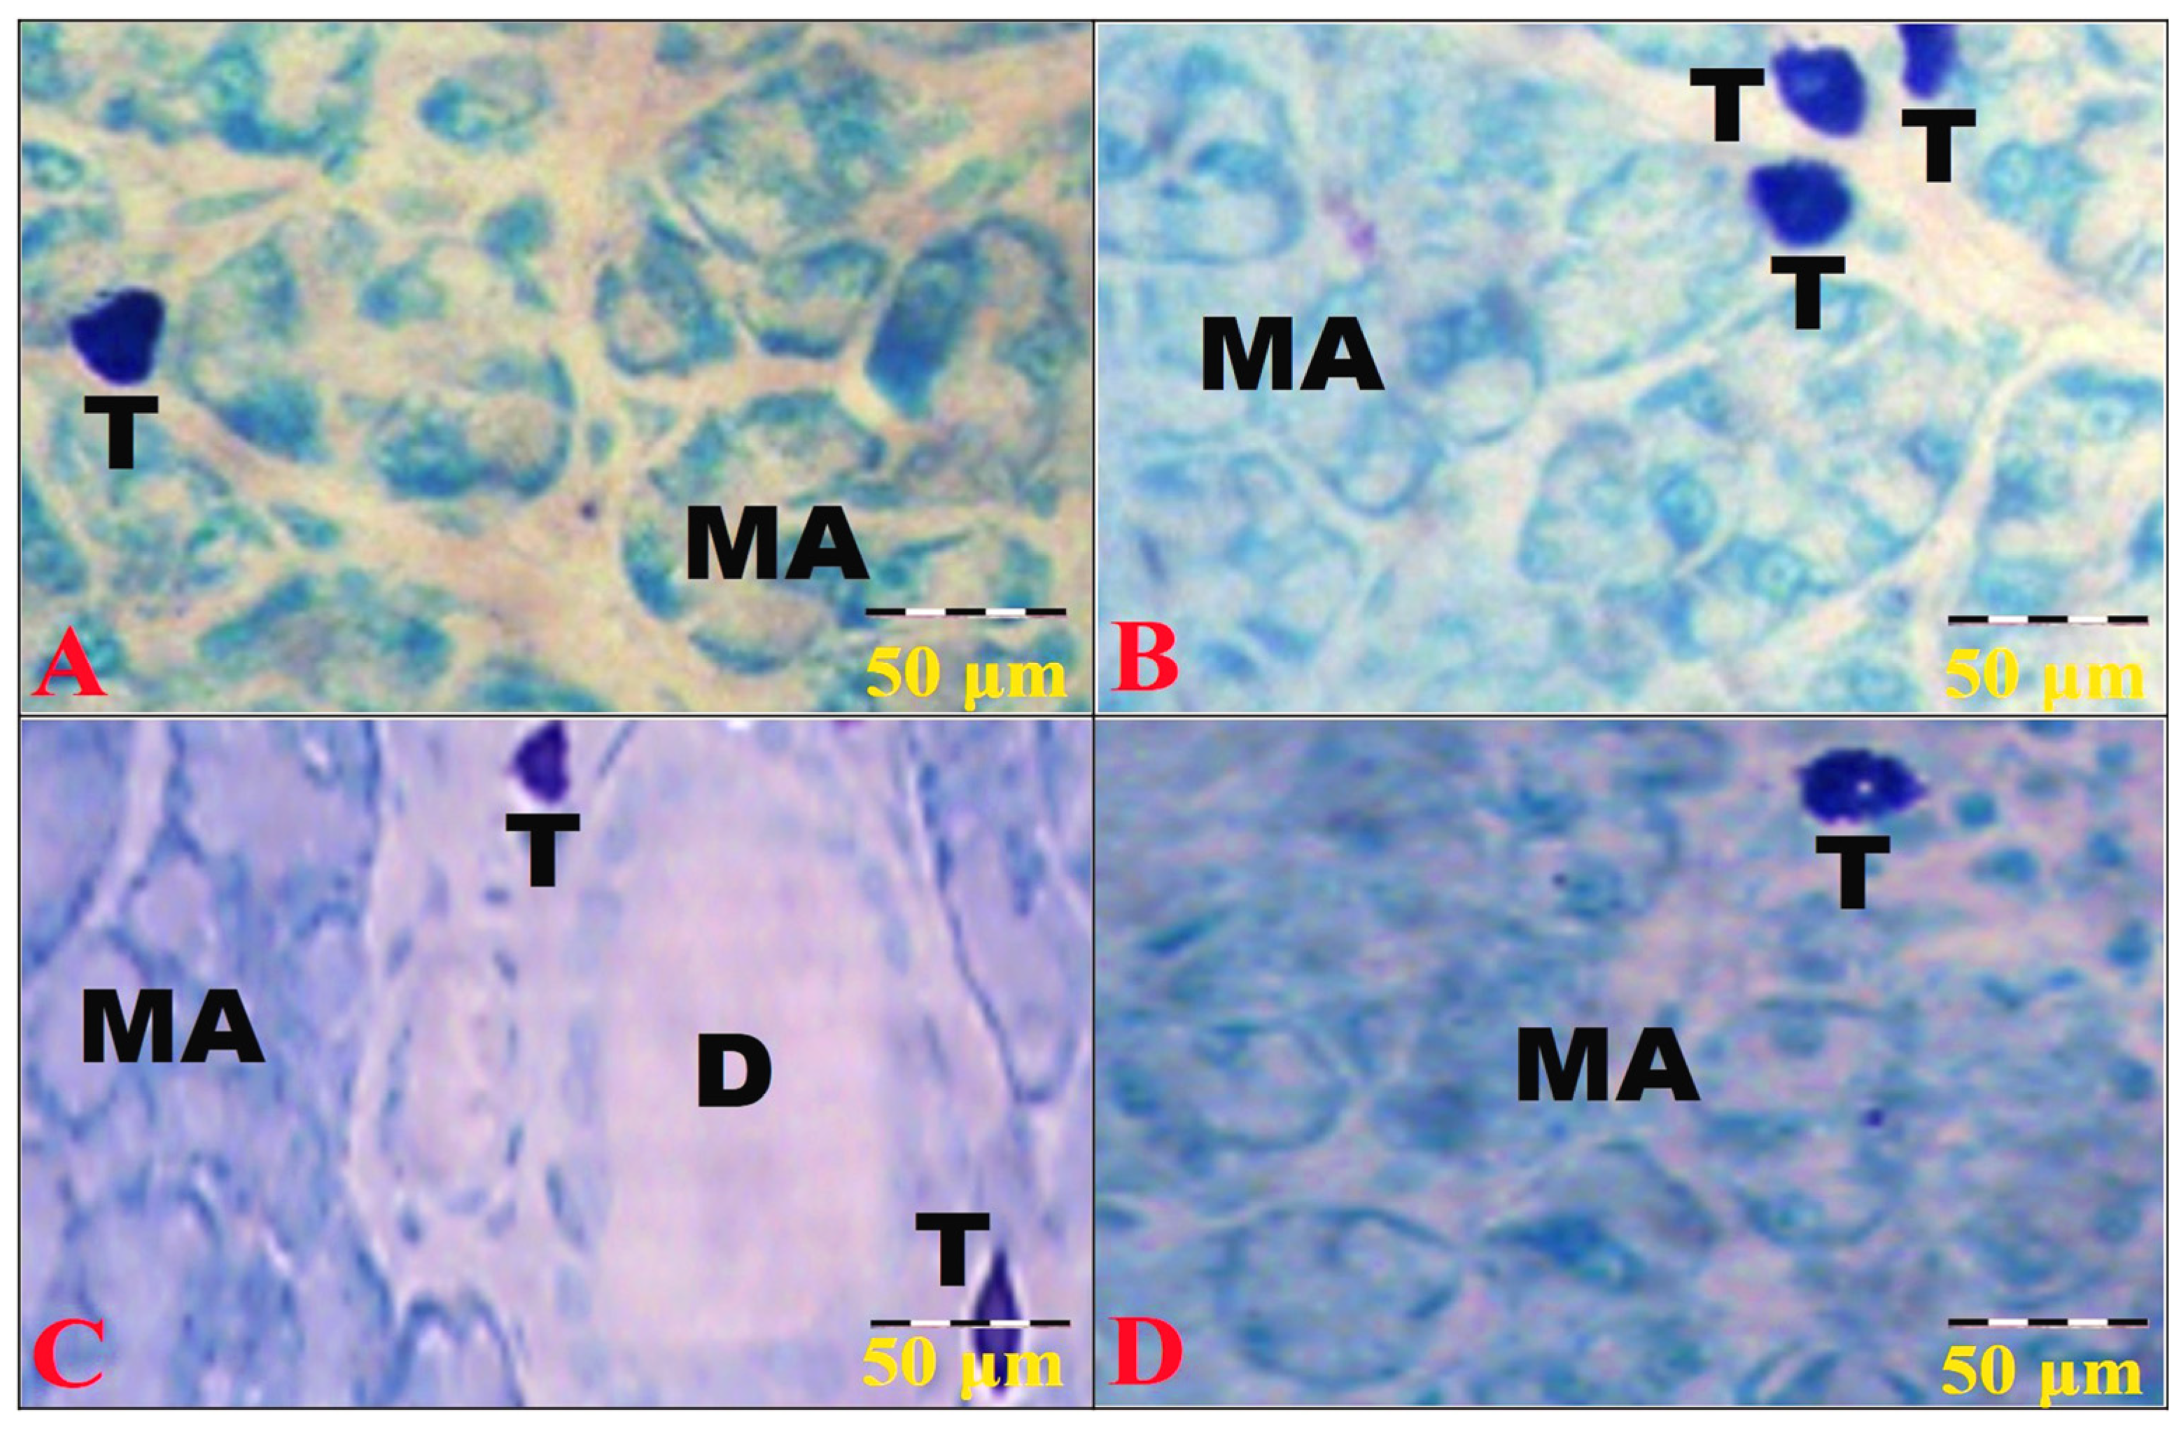
A few mast cells appear adjacent to the acini and scattered throughout the interstitial tissues of G1 and G4 in the SMSG (Figure 7A,D) and the SLSG (Figure 8A,D). The mast cells are oval and exhibit strong metachromasia that obscures their nuclei (Figure 7A). In contrast, numerous mast cells appear with marked metachromasia adjacent to the acini of the SMSG (Figure 7B,C) and the SLSG (Figure 8B,C) in G2 and G3, which is consistent with the results of mast cell quantitative analysis in Table 6.
Figure 7.
Photomicrographs from sections of all SMSG groups. A few mast cells (T) appear in the SMSG of G1 (A) and G4 (D) between the SA and ducts (D) in the interstitial connective tissue. In contrast, mast cells (T) are numerous and mainly located around the SA of the SMSG in G2 (B) and G3 (C) (Toluidine blue, 400× with a scale bar of 50 µm).
Figure 8.
Photomicrographs from sections of all SLSG groups. A few mast cells (T) are present in the interstitial connective tissue of SLSG between the MA in G1 (A) and G4 (D). In contrast, mast cells (T) appear numerous and mainly located between the MA and around the ducts (D) of the SLSG in G2 (B) and G3 (C) (Toluidine blue, 400× with a scale bar of 50 µm).
Table 6.
Quantitative analysis of mast cell metachromatic area % and number (n = 10).
4. Discussion
In the present study, HFD-fed groups showed marked and consistently elevated fasting glucose concentrations. Although this hyperglycemia exceeds that reported in many HFD-only models, we verified the individual-animal values, which were accompanied by increased fasting insulin and HOMA-IR, supporting a severe insulin-resistant phenotype. Differences in animal background, metabolic susceptibility, dietary composition, duration of HFD exposure, and individual energy intake may contribute to variability among experimental HFD models.
Obesity caused by a high-fat diet (HFD) is closely linked to insulin resistance, dyslipidemia, and increased oxidative stress. This is mainly due to excessive reactive oxygen species and insufficient antioxidant defenses. The salivary glands are particularly vulnerable to oxidative damage because they have high blood flow and metabolic activity [36]. Previous studies have found that rats fed an HFD develop mitochondrial problems, more oxidative and nitrosative stress, inflammation, fibrosis, cell death, and disrupted calcium balance in their salivary glands [7,8]. In this study, we observed changes in malondialdehyde and superoxide dismutase (SOD) levels, along with higher pro-inflammatory cytokine levels, supporting these earlier findings. Oxidative stress may contribute to local inflammatory responses and tissue injury. HFD-induced oxidative stress in the salivary glands has been linked to higher levels of inflammatory and apoptotic markers, especially IL-1β and caspase-3 [7], as well as more inflammation, apoptosis, and fibrosis in the salivary glands of insulin-resistant obese rats [8]. Our data match these reports, as shown by increased IL-1β, more mast cells, and a larger metachromatic area, all indicating local inflammation. Mast cells have been reported to participate in tissue remodeling by releasing inflammatory and profibrotic mediators, including TGF-β and tryptase, which can stimulate fibroblasts and extracellular matrix deposition [37]. This may explain the rise in mast cell numbers and collagen seen in HFD-fed animals in this study. The presence of caspase-3 and pyknotic acinar nuclei also shows that apoptosis may contribute to HFD-induced structural damage in the salivary glands, supporting the findings of Ittichaicharoen et al. [8] and Zalewska et al. [7].
Tirzepatide treatment was associated with an improved redox profile, lower TNF-α and IL-1β levels, reduced mast-cell changes, lower caspase-3 concentration, less collagen deposition, and preservation of acinar and ductal structure. This aligns with the protective effects of tirzepatide observed in other tissues. In diabetic rat testicular tissue, tirzepatide increased antioxidant signaling by activating the Nrf2/Keap1 pathway, thereby suppressing oxidative stress, inflammation, and apoptosis [16]. In the livers of HFD-induced obese rats, tirzepatide reduced TNF-α, IL-1β, and caspase-3, which supports its anti-inflammatory and anti-apoptotic properties [20]. A direct salivary gland contribution cannot be ruled out, as GLP-1R is expressed in submandibular ductal regions [17] and GIPR in the ductal compartments of the major rat salivary glands [18]. Receptor expression and downstream signaling, however, were not assessed in the present model. The changes observed could therefore be the result of a combination of potential local receptor-mediated effects and systemic improvements in body weight, glucose control, insulin resistance, lipid metabolism, oxidative stress, and inflammation. They are interpreted as an overall beneficial response rather than evidence of a direct, weight-independent glandular mechanism.
Moreover, the increased combined submandibular and sublingual gland weight in HFD-fed animals did not correspond to increased absolute stimulated salivary flow rate (SSFR); the weight gain may reflect inflammatory changes, collagen deposition, or lipid accumulation rather than increased secretory tissue. Previous histological studies reported lipid accumulation and fibrosis in the parotid glands of obese rats [9], and this may account for the observed gland enlargement. However, gland lipid content was not measured in this study.
Although there were significant structural and biochemical changes, the SSFR was not significantly reduced. This finding should be considered in light of how the salivary glands function. The submandibular and sublingual salivary glands are responsible for 70% of the unstimulated basal salivary flow, while the parotid glands contribute much more to the SSFR (50–65%) [11,12]. Consequently, the SFR caused by pilocarpine reflects the total secretory response of all the salivary glands and does not directly show the function of the submandibular and sublingual glands, indicating that their damage can occur without measurable decrease in the total stimulated secretion. This result is in agreement with those reported by Ittichaicharoen et al. [8] and Lasisi et al. [38], who found changes in salivary structure linked to obesity without any significant alteration in the SSFR. On the other hand, Zalewska et al. [7] noted impaired stimulated parotid secretion and an increased oxidative susceptibility of the parotid gland; this difference may be due to the different duration of HFD exposure. The various mechanisms involved in stimulated secretion explain why the SSRF is maintained even in the face of clear oxidative, inflammatory, and structural damage. Established salivary physiology indicates that pilocarpine stimulates muscarinic receptors and downstream PLC–IP3/Ca2+ signaling, promoting ion transport and AQP5-dependent water movement [39,40]; these signaling components were not directly assessed in the present study. Even though oxidative stress and inflammation can damage mitochondrial function and Ca2+ signaling, such changes may not lead to a reduction in the stimulated flow unless the secretory system is severely damaged. This could explain the considerable tissue injury seen in the present study, even though the response to pharmacological stimulation had not changed. Moreover, the parotid glands make a major contribution to the stimulated whole-mouth secretion, whereas the histological examination was limited to the submandibular and sublingual glands. Hence, the measured SSFR may not fully represent the degree of structural damage in those glands.
The difference between absolute secretion and body-weight-normalized secretion is important. Absolute SSFR showed no significant pairwise differences. However, output per 100 g of body weight was lower in both of the HFD groups and higher in the tirzepatide-treated groups. As body weight is the denominator in this calculation and is affected by both the HFD and the treatment, the normalized data represent secretion per unit of body weight (100 g BW) rather than an increase in total secretion independent of body weight. These results should be interpreted alongside the increased MDA, TNF-α, IL-1β, and mast cell indices; decreased SOD activity; acinar degeneration; and collagen deposition observed in the HFD groups. This pattern aligns with previous studies that indicated that HFD exposure led to oxidative stress, inflammation, and structural damage in the salivary gland [7,8]. The lower gland weight and increased salivary rate per 100 g BW, along with the improved metabolic profile and reduced biochemical and histological abnormalities, indicate an overall beneficial effect. However, these findings do not specify which gland component was responsible for the change in secretory function.
The study has several limitations. Tirzepatide was tested using only one dose over four weeks without checking how different doses affect the rats or how the drug moves through their bodies. Food intake was not recorded, and there was no group fed the same amount or a lean control group given tirzepatide. Because of this, we cannot tell whether the glandular effects are direct or due to weight loss, better blood sugar control, or improved insulin sensitivity. Although GLP-1R and GIPR presence in salivary glands is known from other studies, we did not check receptor levels or related cell signals here. The parotid gland was not studied, and only saliva flow from the whole mouth after stimulation was measured (no saliva flow was measured without stimulation or from specific glands). The chemical tests were done on combined SMSG and SLSG tissues, so we cannot say anything about individual glands. The MDA and SOD results were not adjusted for total protein. Only male rats were used, and the number of animals was based on past studies rather than a formal calculation.
5. Conclusions
Tirzepatide treatment reduced the HFD-induced salivary gland injury and improved metabolic status, redox balance, inflammatory biomarkers, caspase-3 levels, mast cell changes, gland weight, and structural integrity. After multiplicity adjustment, absolute SSFR showed no significant pairwise differences. These findings support an overall beneficial effect of tirzepatide in preserving salivary glands, although they do not establish a direct, weight-independent glandular mechanism or a specific molecular pathway.
Author Contributions
Conceptualization, E.N.M.; software, formal analysis, investigation, resources, and data curation, E.N.M. and A.M.M.; writing—original draft preparation, E.N.M.; writing—review and editing, A.M.M.; visualization and supervision, E.N.M. and A.M.M.; project administration, E.N.M.; funding acquisition, no external funding. All authors have read and agreed to the published version of the manuscript.
Funding
The researchers would like to thank the Deanship of Graduate Studies and Scientific Research at Qassim University (www.qu.edu.sa) for financial support (QU-APC-2026) for the publication fee.
Institutional Review Board Statement
All experimental procedures involving animals in the current study were approved and conducted in accordance with the ARRIVE Essential 10 and the institutional guidelines for the Care and Use of Laboratory Animals by the Institutional Animal Care and Use Committee, Zagazig University (ZU-IACUC) (Approval No. ZU-IACUC/3/F/121/2025).
Informed Consent Statement
Not applicable.
Data Availability Statement
Data will be available from the corresponding author upon reasonable request.
Acknowledgments
The researchers would like to thank the Deanship of Graduate Studies and Scientific Research at Qassim University (www.qu.edu.sa) for financial support (QU-APC-2026).
Conflicts of Interest
The authors declare no conflicts of interest.
Abbreviations
The following abbreviations are used in this manuscript:
| Abbreviation | Full term |
| ANOVA | Analysis of variance |
| AQP5 | Aquaporin 5 |
| ARRIVE | Animal Research: Reporting of In Vivo Experiments |
| BMI | Body mass index |
| BW | Body weight |
| ELISA | Enzyme-linked immunosorbent assay |
| FDA | Food and Drug Administration |
| GIP | Glucose-dependent insulinotropic polypeptide |
| GIPR | Glucose-dependent insulinotropic polypeptide receptor |
| GLP-1 | Glucagon-like peptide-1 |
| GLP-1R | Glucagon-like peptide-1 receptor |
| GOD-PAP | Glucose oxidase–peroxidase |
| HDL-C | High-density lipoprotein cholesterol |
| HFD | High-fat diet |
| HOMA-IR | Homeostasis model assessment of insulin resistance |
| IL-1β | Interleukin-1β |
| IP3 | Inositol 1,4,5-trisphosphate |
| Keap1 | Kelch-like ECH-associated protein 1 |
| LDL-C | Low-density lipoprotein cholesterol |
| MA | Mucous acini |
| MDA | Malondialdehyde |
| SLSG | Sublingual salivary gland |
| SMSG | Submandibular salivary gland |
| SOD | Superoxide dismutase |
| SSFR | Stimulated salivary flow rate |
| TC | Total cholesterol |
| TG | Triglycerides |
| TGF-β | Transforming growth factor-β |
| TNF-α | Tumor necrosis factor-α |
| TZP | Tirzepatide |
References
- World Obesity Federation. World Obesity Atlas 2024. Available online: https://www.worldobesity.org/resources/resource-library/world-obesity-atlas-2024 (accessed on 1 July 2026).
- Chen, J.; Xiao, Y.; Li, D.; Zhang, S.; Wu, Y.; Zhang, Q.; Bai, W. New insights into the mechanisms of high-fat diet-mediated gut microbiota in chronic diseases. iMeta 2023, 2, e69. [Google Scholar] [CrossRef] [Scilit]
- Duan, Y.; Zeng, L.; Zheng, C.; Song, B.; Li, F.; Kong, X.; Xu, K. Inflammatory Links Between High-Fat Diets and Diseases. Front. Immunol. 2018, 9, 2649. [Google Scholar] [CrossRef] [Scilit]
- Adolph, T.E.; Tilg, H. Western diets and chronic diseases. Nat. Med. 2024, 30, 2133–2147. [Google Scholar] [CrossRef] [Scilit]
- Henning, R.J. Obesity and obesity-induced inflammatory disease contribute to atherosclerosis: A review of the pathophysiology and treatment of obesity. Am. J. Cardiovasc. Dis. 2021, 11, 504–529. [Google Scholar]
- Jin, X.; Qiu, T.; Li, L.; Yu, R.; Chen, X.; Li, C.; Proud, C.G.; Jiang, T. Pathophysiology of obesity and its associated diseases. Acta Pharm. Sin. B 2023, 13, 2403–2424. [Google Scholar] [CrossRef] [Scilit]
- Zalewska, A.; Ziembicka, D.; Żendzian-Piotrowska, M.; Maciejczyk, M. The Impact of High-Fat Diet on Mitochondrial Function, Free Radical Production, and Nitrosative Stress in the Salivary Glands of Wistar Rats. Oxidative Med. Cell. Longev. 2019, 2019, 2606120. [Google Scholar] [CrossRef] [Scilit]
- Ittichaicharoen, J.; Apaijai, N.; Tanajak, P.; Sa-Nguanmoo, P.; Chattipakorn, N.; Chattipakorn, S.C. Impaired mitochondria and intracellular calcium transients in the salivary glands of obese rats. Appl. Physiol. Nutr. Metab. Physiol. Appl. Nutr. Metab. 2017, 42, 420–429. [Google Scholar] [CrossRef] [Scilit]
- Montaser, M.M.; El Hak, A.R.; Elba, G.; Eladawy, M.; Hamza, S.A. Effect of obesity on general health and on parotid salivary glands of rats (Histological and ultrastructural study). Alex. Dent. J. 2024, 49, 114–121. [Google Scholar] [CrossRef] [Scilit]
- Zalewska, A.; Kossakowska, A.; Taranta-Janusz, K.; Zięba, S.; Fejfer, K.; Salamonowicz, M.; Kostecka-Sochoń, P.; Wasilewska, A.; Maciejczyk, M. Dysfunction of Salivary Glands, Disturbances in Salivary Antioxidants and Increased Oxidative Damage in Saliva of Overweight and Obese Adolescents. J. Clin. Med. 2020, 9, 548. [Google Scholar] [CrossRef] [Scilit]
- Jha, N.; Harris, J.; Seikaly, H.; Jacobs, J.R.; McEwan, A.J.; Robbins, K.T.; Grecula, J.; Sharma, A.K.; Ang, K.K. A phase II study of submandibular gland transfer prior to radiation for prevention of radiation-induced xerostomia in head-and-neck cancer (RTOG 0244). Int. J. Radiat. Oncol. Biol. Phys. 2012, 84, 437–442. [Google Scholar] [CrossRef] [Scilit]
- Saarilahti, K.; Kouri, M.; Collan, J.; Kangasmäki, A.; Atula, T.; Joensuu, H.; Tenhunen, M. Sparing of the submandibular glands by intensity-modulated radiotherapy in the treatment of head and neck cancer. Radiother. Oncol. J. Eur. Soc. Ther. Radiol. Oncol. 2006, 78, 270–275. [Google Scholar] [CrossRef] [Scilit]
- U.S. Food and Drug Administration. FDA Approves New Medication for Chronic Weight Management; U.S. Food and Drug Administration: Silver Spring, MD, USA, 2023.
- Hamza, M.; Papamargaritis, D.; Davies, M.J. Tirzepatide for overweight and obesity management. Expert Opin. Pharmacother. 2025, 26, 31–49. [Google Scholar] [CrossRef] [Scilit]
- Lu, J.; Liu, P.; Cai, M.; Lv, T.; Zhang, M.; Yin, K.; Cheng, J.; Zhang, G. Recent progress in the pharmacotherapy for obesity. Eur. J. Pharmacol. 2025, 1002, 177850. [Google Scholar] [CrossRef] [Scilit]
- Albokhadaim, I. Tirzepatide ameliorates type 2 diabetes-associated male reproductive dysfunction via modulation of the Nrf2/Keap1 pathway. Toxicol. Res. 2026, 15, tfag010. [Google Scholar] [CrossRef] [Scilit]
- Akakura, M.; Watari, I.; Watanabe, M.; Jiratchaya, S.; Ono, T. Expression of Glucagon-Like Peptide-1 Receptors in the Submandibular Gland of Mice and Its Implications in Type 2 Diabetes. Cureus 2024, 16, e70465. [Google Scholar] [CrossRef] [Scilit]
- Privatananupunt, J.; Watari, I.; Podyma-Inoue, K.A.; Kubono, M.; Ono, T. Expression of glucose-dependent insulinotropic polypeptide and its receptor in the rat major salivary glands. Acta Histochem. 2014, 116, 545–550. [Google Scholar] [CrossRef] [Scilit]
- Alolayan, S.A.; Alhowail, A.H. Ineffectiveness of tirzepatide in mitigating Doxorubicin-induced oxidative stress and cognitive deficits in a rat model. Front. Pharmacol. 2025, 16, 1638527. [Google Scholar] [CrossRef] [Scilit]
- Alathary, A.; Al-Isawi, Z. Tirzepatide therapy counters inflammatory and apoptotic responses induced by high-fat diet in rat liver. Wiad. Lek. 2025, 78, 797–805. [Google Scholar] [CrossRef] [Scilit]
- Yang, S.; Zhao, X.; Zhang, Y.; Tang, Q.; Li, Y.; Du, Y.; Yu, P. Tirzepatide shows neuroprotective effects via regulating brain glucose metabolism in APP/PS1 mice. Peptides 2024, 179, 171271. [Google Scholar] [CrossRef] [Scilit]
- National Research Council. Guide for the Care and Use of Laboratory Animals, 8th ed.; The National Academies Press: Washington, DC, USA, 2011. [Google Scholar] [CrossRef] [Scilit]
- Percie du Sert, N.; Ahluwalia, A.; Alam, S.; Avey, M.T.; Baker, M.; Browne, W.J.; Clark, A.; Cuthill, I.C.; Dirnagl, U.; Emerson, M.; et al. Reporting animal research: Explanation and elaboration for the ARRIVE guidelines 2.0. PLoS Biol. 2020, 18, e3000411. [Google Scholar] [CrossRef] [Scilit]
- Borella, T.L.; De Luca, L.A., Jr.; Colombari, D.S.A.; Menani, J.V. Central muscarinic receptor subtypes involved in pilocarpine-induced salivation, hypertension and water intake. Br. J. Pharmacol. 2008, 155, 1256–1263. [Google Scholar] [CrossRef] [Scilit]
- Jung, W.K.; Park, S.-B.; Yu, H.Y.; Kim, J. Gemigliptin Improves Salivary Gland Dysfunction in D-Galactose-Injected Aging Rats. Pharmaceutics 2024, 16, 35. [Google Scholar] [CrossRef] [Scilit]
- Suvarna, S.K.; Layton, C.; Bancroft, J.D. (Eds.) Bancroft’s Theory and Practice of Histological Techniques, 7th ed.; Churchill Livingstone Elsevier: London, UK, 2013. [Google Scholar]
- Mozaffari, M.S.; Borke, J.L. Taurine in submandibular gland of the rat: Effect of muscarinic drugs. J. Histochem. Cytochem. Off. J. Histochem. Soc. 2002, 50, 527–532. [Google Scholar] [CrossRef] [Scilit]
- Trinder, P. Determination of blood glucose using an oxidase-peroxidase system with a non-carcinogenic chromogen. J. Clin. Pathol. 1969, 22, 158–161. [Google Scholar] [CrossRef] [Scilit]
- Allain, C.C.; Poon, L.S.; Chan, C.S.G.; Richmond, W.; Fu, P.C. Enzymatic determination of total serum cholesterol. Clin. Chem. 1974, 20, 470–475. [Google Scholar] [CrossRef] [Scilit]
- Naito, H.K. Triglycerides. In Clinical Chemistry: Theory, Analysis and Correlation, 2nd ed.; Kaplan, L.A., Pesce, A.J., Eds.; Mosby: St. Louis, MO, USA, 1989; p. 997. [Google Scholar]
- Warnick, G.R.; Benderson, J.; Albers, J.J. Dextran sulfate-Mg2+ precipitation procedure for quantitation of high-density-lipoprotein cholesterol. Clin. Chem. 1982, 28, 1379–1388. [Google Scholar] [CrossRef] [Scilit]
- Friedewald, W.T.; Levy, R.I.; Fredrickson, D.S. Estimation of the concentration of low-density lipoprotein cholesterol in plasma, without use of the preparative ultracentrifuge. Clin. Chem. 1972, 18, 499–502. [Google Scholar] [CrossRef] [Scilit]
- Kakkar, P.; Das, B.; Viswanathan, P.N. A modified spectrophotometric assay of superoxide dismutase. Indian J. Biochem. Biophys. 1984, 21, 130–132. [Google Scholar]
- Nielsen, F.; Mikkelsen, B.B.; Nielsen, J.B.; Andersen, H.R.; Grandjean, P. Plasma malondialdehyde as biomarker for oxidative stress: Reference interval and effects of life-style factors. Clin. Chem. 1997, 43, 1209–1214. [Google Scholar] [CrossRef] [Scilit]
- Matthews, D.R.; Hosker, J.P.; Rudenski, A.S.; Naylor, B.A.; Treacher, D.F.; Turner, R.C. Homeostasis model assessment: Insulin resistance and β-cell function from fasting plasma glucose and insulin concentrations in man. Diabetologia 1985, 28, 412–419. [Google Scholar] [CrossRef] [Scilit]
- Chibly, A.M.; Aure, M.H.; Patel, V.N.; Hoffman, M.P. Salivary gland function, development, and regeneration. Physiol. Rev. 2022, 102, 1495–1552. [Google Scholar] [CrossRef] [Scilit]
- Bradding, P.; Pejler, G. The controversial role of mast cells in fibrosis. Immunol. Rev. 2018, 282, 198–231. [Google Scholar] [CrossRef] [Scilit]
- Lasisi, T.J.; Shittu, S.T.; Alada, A.R. Re-establishing normal diet following high fat-diet-induced obesity reverses the altered salivary composition in Wistar rats. J. Basic Clin. Physiol. Pharmacol. 2019, 30, 111–120. [Google Scholar] [CrossRef] [Scilit]
- Ambudkar, I.S. Ca2+ signaling and regulation of fluid secretion in salivary gland acinar cells. Cell Calcium 2014, 55, 297–305. [Google Scholar] [CrossRef] [Scilit]
- Ambudkar, I.S. Calcium signalling in salivary gland physiology and dysfunction. J. Physiol. 2016, 594, 2813–2824. [Google Scholar] [CrossRef] [Scilit]

Disclaimer/Publisher’s Note: The statements, opinions and data contained in all publications are solely those of the individual author(s) and contributor(s) and not of MDPI and/or the editor(s). MDPI and/or the editor(s) disclaim responsibility for any injury to people or property resulting from any ideas, methods, instructions or products referred to in the content. |
© 2026 by the authors. Licensee MDPI, Basel, Switzerland. This article is an open access article distributed under the terms and conditions of the Creative Commons Attribution (CC BY) license.