


Abstract
Background and Objective: Sarcopenic obesity (SO) may contribute to cognitive decline through mechanisms involving the muscle–brain axis. Brain-derived neurotrophic factor (BDNF) and amyloid-β are potential biomarkers linking muscle health, adiposity, and cognitive function, but these relationships remain poorly understood. This study examined SO, circulating BDNF, amyloid-β, the Aβ42/Aβ40 ratio, and cognitive performance in middle-aged women. Methods: A comparative cross-sectional study was conducted among 78 women aged 45–65 years in Amman, Jordan, classified as SO (n = 26), overweight/obesity without sarcopenia (OW/OB, n = 27), or normal weight (n = 25), following the ESPEN/EASO algorithm. Body composition was assessed using bioelectrical impedance analysis, and appendicular skeletal muscle mass was adjusted for body weight (ASM/W, %). Muscle strength and physical performance were evaluated using handgrip dynamometry and the five-repetition chair-stand test, and self-reported functional limitations using the SARC-F questionnaire. Cognitive performance was assessed using the Montreal Cognitive Assessment (MoCA), and habitual physical activity was assessed using the International Physical Activity Questionnaire. Plasma BDNF, Aβ40, and Aβ42 were measured by enzyme-linked immunosorbent assay, and the Aβ42/Aβ40 ratio was calculated. Results: Women with SO had lower handgrip strength, poorer chair-stand performance, higher SARC-F scores, and lower total physical activity than women in the other two groups (p < 0.001). ASM/W was lowest in women with SO (22.0 ± 2.6%), compared with OW/OB (24.9 ± 1.9%) and normal-weight women (28.1 ± 2.5%) (p < 0.001), and 18 of 26 women with SO (69.2%) had low ASM/W according to a sample-derived cut-off. Total MoCA scores differed across groups (p = 0.002), and attention scores were lower in women with SO than in women with OW/OB (p = 0.010). Plasma BDNF, Aβ42, and the Aβ42/Aβ40 ratio were lowest in women with SO (all p ≤ 0.004), whereas Aβ40 did not differ between the SO and OW/OB groups. In multivariable analyses, SO was associated with lower BDNF (β = −0.66, p < 0.001), a lower Aβ42/Aβ40 ratio (β = −0.75, p = 0.001), and poorer attention (β = −0.56, p = 0.041). The biomarker associations persisted when the SO group was restricted to women with low ASM/W, whereas the association with attention did not. Conclusions: In middle-aged women, SO was associated with lower circulating BDNF and Aβ42/Aβ40 ratio, reduced physical activity, and poorer cognitive performance, particularly attention. These findings suggest that SO may involve alterations in neurotrophic and amyloid-related pathways within the muscle–brain axis; longitudinal studies are needed to confirm them.
1. Introduction
Obesity is a major global chronic disease and a significant public health concern, affecting more than one billion individuals worldwide [1]. Characterized by excessive adiposity, obesity is associated with insulin resistance, cardiovascular and musculoskeletal disorders, mitochondrial dysfunction, chronic low-grade inflammation and functional decline [2]. Concurrently, dementia affects more than 57 million people worldwide, with approximately 10 million new cases reported annually [3].
During the last decade, growing attention has been directed to sarcopenic obesity (SO), which affects approximately 11% of older adults, with a higher prevalence among women (14%). SO is a condition characterized by excess adiposity accompanied by impaired skeletal muscle strength, mass and function [4,5]. This phenotype represents a detrimental metabolic state that exacerbates metabolic dysregulation and physical disability [5,6].
The public-health relevance of SO is further underscored by the growing burden of sarcopenia and cognitive impairment [5]. In 2022, the European Society for Clinical Nutrition and Metabolism (ESPEN) and the European Association for the Study of Obesity (EASO) established a standardized definition and diagnostic criteria for SO emphasizing the need to assess both adiposity and muscle impairment simultaneously [4]. Recent large-scale cohort studies demonstrate that sarcopenic obesity is associated with a significantly higher risk of dementia compared with obesity alone, with evidence of sex-specific differences in dementia and brain structure [7,8,9].
Although SO has predominantly been investigated in older adults, deterioration in skeletal muscle mass, strength, adiposity and metabolic dysfunction begins during middle age, before overt functional limitations emerge [9]. Middle age may therefore provide an important opportunity to identify early changes in body composition, muscle function, and cognitive health [10,11]. This period may be particularly relevant for women in whom hormonal transitions and changes in body fat distribution, skeletal muscle mass, and metabolic health may influence musculoskeletal and cognitive outcomes [9,10,11].
The potential consequences of SO may extend beyond the musculoskeletal system. Increasing evidence supports a bidirectional muscle–brain axis involving metabolic, inflammatory, endocrine, and neurotrophic pathways [12,13]. Skeletal muscle functions as an endocrine organ, releasing signaling molecules that influence systemic metabolism and neuronal function [13]. In SO, reduced muscle mass and strength, physical inactivity, and excess adiposity may disrupt these signaling pathways, contributing to chronic inflammation, metabolic dysregulation, and impaired neuronal health [13,14].
Brain-derived neurotrophic factor (BDNF) is a potential mediator of muscle health and cognitive function [15]. BDNF plays a central role in neuronal survival, neurogenesis, synaptic plasticity, learning, and memory [15]. Although BDNF is highly expressed in the central nervous system, skeletal muscle and exercise-related pathways also contribute to its regulation. Physical activity and muscle contraction may influence BDNF-related signaling directly or indirectly through exercise-responsive mediators and myokines, whereas obesity, physical inactivity, and metabolic dysfunction may impair neurotrophic signaling [13,16]. Altered BDNF signaling has therefore been proposed as a possible biological link between SO and impaired cognitive function [17].
Amyloid-β (Aβ) represents a complementary pathway. Amyloid-β peptides are generated through proteolytic processing of amyloid precursor protein and are widely studied due to their role in Alzheimer-related pathology. However, Amyloid precursor protein and its cleavage products are also expressed in peripheral tissues, including skeletal muscle [18]. Experimental evidence suggests their potential relationships with mitochondrial dysfunction, impaired insulin signaling, and muscle degeneration [18,19]. Aβ42/Aβ40 ratio may provide a more reliable indicator of amyloid pathology than measurement of either peptide alone [20]. Aβ42 is more prone to deposition in cerebral amyloid plaques, whereas Aβ40 is more abundant as a circulatory Aβ species [21].
Despite growing evidence linking sarcopenic obesity with cognitive impairment, the biological pathways underlying this association remain poorly characterized. Previous human studies have primarily examined the relationship between SO and cognitive outcomes, particularly in older adults, without simultaneously evaluating circulating biomarkers representing both neurotrophic and amyloid-related pathways. Although BDNF has been proposed as a potential link between impaired muscle health, obesity, and neurodegeneration, and amyloid-β has been implicated in both neural and skeletal muscle dysfunction, their combined relationship with SO has not been adequately investigated in humans. To our knowledge, few studies have simultaneously assessed circulating BDNF and amyloid-β together with muscle mass, muscle strength, physical performance, and cognitive function in middle-aged women with SO compared with women with overweight/obesity without sarcopenia and normal-weight controls.
2. Materials and Methods
2.1. Study Design and Population
A comparative cross-sectional study was conducted among middle-aged women aged 45–65 years residing in Amman, Jordan. The study protocol was reviewed and approved by the Institutional Review Board of the Faculty of Allied Medical Sciences, Applied Science Private University, Amman, Jordan (Approval No. IRB-AMS-2026-30), and the study was conducted in accordance with the Declaration of Helsinki. Reporting followed the Strengthening the Reporting of Observational Studies in Epidemiology (STROBE) recommendations for cross-sectional studies.
2.2. Data Collection
Women aged 45–65 years residing in Amman, Jordan, were recruited through community-based recruitment from 22 July to 7 October 2026. More than 500 invitations/questionnaires were electronically distributed through community networks, including WhatsApp ladies’ groups, personal contacts, friends, ladies’ gatherings, and workplace groups. Potential participants underwent eligibility screening based on medical history, medication use, anthropometric measurements, body composition, muscle strength, and functional capacity. Women were eligible for participation if they were aged 45–65 years and were able to complete the proposed anthropometric, body-composition, muscle function, cognitive, and physical-activity assessments. For the two groups with excess body weight (sarcopenic obesity and overweight/obesity without sarcopenia), participants were required to have a body mass index (BMI) ≥ 25 kg/m2, whereas the normal-weight reference group had a BMI of 18.5–24.9 kg/m2. Adiposity was further characterized using percentage body fat and central adiposity indicators, including waist circumference, waist-to-hip ratio, and waist-to-height ratio.
Participants were excluded if they had medical conditions, treatments, or functional limitations that could substantially influence body composition, skeletal muscle function, circulating biomarker concentrations, or cognitive performance. Exclusion criteria included current or recent use of glucagon-like peptide-1 receptor agonists for weight management, including semaglutide; active cancer; renal failure; uncontrolled diabetes mellitus; major neurological disorders; current antipsychotic or other psychiatric pharmacotherapy that could influence cognitive or neurological outcomes; and musculoskeletal or physical conditions preventing safe completion of handgrip or chair-stand testing. Participants with incomplete anthropometric, body-composition, cognitive, or biochemical measurements were excluded from the final analytical sample.
A total of 112 women responded to the initial recruitment questionnaire, of whom 87 attended the scheduled assessment sessions. Nine participants were excluded due to medication use that could influence the study outcomes; seven were using semaglutide and two were receiving antipsychotic medications. The final analytical sample consisted of 78 women, distributed among three groups: sarcopenic obesity (n = 26), obesity (n = 27), and normal weight (n = 25). Women receiving semaglutide were excluded because this treatment may influence body composition and metabolism [22,23] and may have neuroprotective effects [24,25]. All eligible participants received verbal and written information describing the study objectives, procedures, potential risks and benefits, confidentiality measures, and voluntary nature of participation. Written informed consent was obtained before any study-related procedures were performed.
2.3. Procedures
Data collection was performed using standardized procedures (Figure 1). Participants completed a structured questionnaire covering sociodemographic, lifestyle, and medical characteristics, followed by anthropometric measurements, body-composition analysis, muscle-strength and cognitive assessment, physical-activity assessment, and fasting blood collection. The collected sociodemographic and clinical variables included age, marital status, educational level, smoking status, menopausal status, medical history, chronic diseases, current medication use, sleep characteristics, and habitual physical activity. Educational level was categorized as high school or below, bachelor’s degree, or postgraduate education.
Figure 1.
Flowchart of participant recruitment, study assessments, group classification, and biochemical analyses.
Anthropometric and body-composition assessments were completed under standardized conditions. Muscle strength was subsequently assessed using handgrip dynamometry, followed by the five-repetition chair-stand test to evaluate lower-body physical performance. Cognitive performance was assessed using the Arabic version of the Montreal Cognitive Assessment (MoCA) [26], and habitual physical activity was assessed using the International Physical Activity Questionnaire (IPAQ). In addition, participants completed the Strength, Ambulation, Rising from a Chair, Stair Climbing and History of Falling questionnaire (SARC-F) to assess self-reported symptoms and functional limitations [27]. Fasting venous blood samples were subsequently collected for determination of circulating BDNF and amyloid-β concentrations.
2.4. Anthropometric and Body-Composition Assessment
Body weight and height were measured using standardized procedures while participants wore light clothing and no shoes. Body mass index (BMI) was calculated as body weight in kilograms divided by height squared in meters (kg/m2).
Waist circumference was measured using a non-stretchable measuring tape at the standardized anatomical site, while hip circumference was measured at the widest portion of the buttocks. Waist-to-hip ratio (WHR) was calculated using the following equation:
WHR = waist circumference (cm)/hip circumference (cm)
Waist-to-height ratio (WHtR) was calculated as waist circumference (cm)/height (cm).
Body composition was assessed using the InBody 270 bioelectrical impedance analyzer (InBody Co., Ltd., Seoul, Republic of Korea), a segmental device with an eight-point tactile electrode system that measures impedance at 20 and 100 kHz. Body composition estimates are derived from the manufacturer’s proprietary prediction equations. The following variables were obtained: body fat mass (kg); percentage body fat (%), i.e., body fat mass (kg)/body weight (kg) × 100; skeletal muscle mass (SMM, kg), the estimated whole-body skeletal muscle mass; appendicular skeletal muscle mass (ASM, kg), the estimated lean soft tissue mass of the arms and legs; and visceral fat level, a dimensionless index (scale 1–20) of visceral adiposity estimated by the device. The InBody 270 does not report resistance, reactance, phase angle, or the extracellular-to-total body water ratio; raw bioelectrical parameters could therefore not be analysed. To standardize measurement conditions, participants underwent BIA assessment following a fasting period of at least 4 h, with bladder voiding before measurement and avoidance of strenuous physical activity for at least 12 h. Assessments were performed during a consistent morning measurement window to minimize diurnal variations in body fluid distribution. Participants wore light clothing, removed their shoes and socks, and maintained an upright position during measurement. Menstrual cycle phase was recorded for premenopausal participants at the time of assessment; because of the small number of premenopausal women (n = 25), it was not included in the analyses.
The skeletal muscle index (SMI) reported by the InBody 270 corresponds to ASM adjusted for height squared:
where ASM represented appendicular skeletal muscle mass obtained from the bioelectrical impedance assessment.
SMI (kg/m2) = ASM (kg)/height2 (m2)
In accordance with the ESPEN/EASO consensus, which recommends adjusting muscle mass for body weight in individuals with obesity [4], weight-adjusted appendicular skeletal muscle mass (ASM/W) was calculated as: ASM/W (%) = ASM (kg)/body weight (kg) × 100. In addition, whole-body skeletal muscle mass was adjusted for body weight as SMM/W (%) = SMM (kg)/body weight (kg) × 100, because the bioelectrical impedance cut-offs listed in the ESPEN/EASO consensus refer to this index [4,28].
BMI, body fat percentage, visceral fat level, waist circumference, WHR, and WHtR were used to characterize overall and central adiposity, whereas SMM, ASM, SMI, ASM/W, and SMM/W were used to characterize skeletal muscle quantity. ASM/W and SMM/W express muscle quantity relative to body size; they do not provide information on muscle quality.
2.5. Assessment of Muscle Strength and Physical Performance
Muscle strength was assessed using a Baseline® Smedley Digital Hand Dynamometer (Model 12-0286; Fabrication Enterprises Inc., Elmsford, NY, USA), following the Southampton protocol. Participants were seated with the shoulder in a neutral position, the elbow flexed to approximately 90°, the forearm in a neutral position, and the wrist maintained in a comfortable functional position.
Participants were instructed to squeeze the dynamometer with maximal effort for approximately 3–5 s, with standardized verbal encouragement provided during each attempt. Three measurements were obtained from each hand, alternating between the right and left hands, with sufficient rest between trials to minimize fatigue. The highest valid handgrip-strength value from either hand was used for statistical analysis, irrespective of hand dominance. Handgrip strength < 16 kg was considered indicative of reduced muscle strength in women, according to the EWGSOP2 cut-off [29] recommended in the ESPEN/EASO consensus [4].
Lower-body muscle function and physical performance were assessed using the five-repetition chair-stand test. Participants began in a seated position on a standardized chair with their feet firmly positioned on the floor and their arms crossed over the chest. They were instructed to rise to a full standing position and return to the seated position five consecutive times as quickly and safely as possible without using their arms for assistance.
The total time required to complete the five repetitions was recorded in seconds. A completion time > 15 s was considered indicative of impaired physical performance according to the EWGSOP2 cut-off for women [29], as recommended in the ESPEN/EASO consensus [4].
2.6. Sample Classification
Participants were classified following the sequence of the ESPEN/EASO consensus on sarcopenic obesity [4]: screening, assessment of skeletal muscle function, and assessment of body composition. Step 1 (screening): women with BMI ≥ 25 kg/m2 and/or waist circumference ≥ 88 cm [30] were considered at risk if they had a SARC-F score ≥ 4 or clinical suspicion of sarcopenia (self-reported weakness, slowness, or difficulty rising from a chair). Step 2 (muscle function): altered skeletal muscle function was defined as handgrip strength < 16 kg and/or five-repetition chair-stand time > 15 s, using the EWGSOP2 cut-offs for women [29]. Step 3 (body composition): excess adiposity was defined as body fat ≥ 35%, measured by bioelectrical impedance analysis. Low muscle mass, the second component of altered body composition, was evaluated as weight-adjusted muscle mass (ASM/W; Section 2.4). Because no validated ASM/W cut-off is available for middle-aged Arab women, low muscle mass was not applied as an individual criterion at classification; it was evaluated after classification, as described below. Women who met Steps 1–3 (Step 1 AND Step 2 AND Step 3) were classified as having sarcopenic obesity (SO). Waist-to-hip ratio and waist-to-height ratio were measured to characterize central adiposity but were not used for classification.
Women with BMI ≥ 25 kg/m2 who did not meet these criteria formed the overweight/obesity without sarcopenia group (OW/OB). Because this group was defined by BMI, it included women with overweight (BMI 25.0–29.9 kg/m2) as well as women with obesity. Women with BMI 18.5–24.9 kg/m2, handgrip strength ≥ 16 kg, and chair-stand time ≤ 15 s formed the normal-weight reference group. To examine whether women with SO had low muscle mass at the individual level, weight-adjusted muscle mass was evaluated after classification against three cut-offs: (i) SMM/W < 22.1%, the bioelectrical impedance cut-off for women listed in the ESPEN/EASO consensus [4,28]; (ii) the less restrictive SMM/W < 27.6% (class I low muscle mass [28]); and (iii) a sample-derived cut-off of ASM/W < 23.1%, corresponding to the mean − 2 SD of the normal-weight group (28.1% − 2 × 2.5%). The sample-derived cut-off was used as the main criterion, because the bioelectrical impedance cut-offs listed in the consensus were derived in older populations with different prediction equations. The main analyses were repeated after restricting the SO group to women below the sample-derived cut-off and, separately, to women with body fat ≥ 35% (sensitivity analyses). Height-adjusted muscle mass (SMI) is reported descriptively only, because indices adjusted for height squared tend to overestimate muscle mass in individuals with obesity [4].
2.7. Cognitive and Physical-Activity Assessment
Cognitive performance was assessed using the Arabic version of the Montreal Cognitive Assessment (MoCA), administered by trained and certified MoCA professionals. Permission to use the MoCA for this academic research study was obtained from the MoCA organization prior to assessment. The MoCA evaluated visuospatial and executive functioning, naming, attention, language, abstraction, delayed recall, and orientation. The total score ranged from 0 to 30, with higher scores indicating better cognitive performance.
A score of ≥ 26 was conventionally considered within the normal range, although interpretation took educational background and the validated scoring procedures of the administered version into consideration. The MoCA was administered individually by a trained researcher under standardized and quiet conditions. The total MoCA score was primarily analyzed as a continuous variable.
Habitual physical activity was assessed using the International Physical Activity Questionnaire (IPAQ). Participants reported the frequency and duration of walking and moderate- and vigorous-intensity physical activity during the specified reference period. Physical activity was expressed as metabolic-equivalent minutes per week (MET-min/week) and categorized as low, moderate, or high according to the standard IPAQ scoring protocol.
2.8. Blood Collection and Biochemical Assessment
Blood was collected into EDTA-containing tubes using standard aseptic procedures and labeled with unique participant identification codes. Samples were maintained under controlled cold conditions until processing. Plasma was separated by centrifugation at approximately 3000× g for 15 min and subsequently aliquoted into labeled cryovials to minimize repeated freeze–thaw cycles. Plasma samples were stored at −80 °C until biochemical analysis.
Plasma brain-derived neurotrophic factor (BDNF) concentrations were measured using a commercially available Human BDNF enzyme-linked immunosorbent assay (ELISA) kit (Reed Biotech Ltd., Wuhan, China; Cat. No. RE2848H), following the manufacturer’s instructions. The assay had a reported analytical sensitivity of 18.75 pg/mL and a detection range of 31.25–2000 pg/mL. According to the manufacturer, the assay demonstrated high specificity for human BDNF, with no significant cross-reactivity or interference from tested analogues. The reported coefficient of variation (CV) was ≤ 10%, indicating acceptable assay repeatability. Standards, reagents, and plasma samples were prepared and analyzed according to the manufacturer’s protocol. Amyloid-β concentrations were measured using a commercially available Human Aβ1-40 ELISA kit (Reed Biotech; Cat. No. E2924H) and Human Aβ1-42 ELISA kit (Reed Biotech; Cat. No. E2925H) according to the manufacturer’s protocol. Concentrations were calculated from the standard curve of each plate, and samples underwent no more than one freeze–thaw cycle before analysis. The Aβ42/Aβ40 ratio was calculated for each participant from the two measured concentrations.
2.9. Statistical Analysis
Statistical analyses were performed using IBM SPSS Statistics version 25 (IBM Corp., Armonk, NY, USA). The distribution of continuous variables was assessed with the Shapiro–Wilk test and visual inspection of histograms. Approximately normally distributed variables are presented as mean ± SD and were compared across the three groups using one-way ANOVA with Tukey’s post hoc test, and between the SO and OW/OB groups using the independent-samples t-test. Non-normally distributed variables are presented as median (IQR) and were compared using the Kruskal–Wallis test with Dunn’s post hoc test (Bonferroni-adjusted) and the Mann–Whitney U test, respectively. Categorical variables are presented as n (%) and were compared using the chi-square test or Fisher’s exact test, as appropriate.
Differences in plasma biomarkers between the SO and OW/OB groups were additionally tested by linear regression on log10-transformed concentrations, adjusted for age and education, the latter differing between groups (Table 1); the difference in ASM/W between these groups was adjusted for age. Associations of muscle, adiposity and physical-activity measures with plasma biomarkers and cognitive scores were examined with Spearman’s rank correlation in the full sample, in the combined SO and OW/OB groups, and within each group. Because ASM/W was strongly correlated with body fat percentage, partial rank correlations adjusted for body fat percentage and age were calculated for ASM/W.
Table 1.
Sociodemographic and clinical characteristics of the participants by study group.
Multivariable linear regression was restricted to the SO and OW/OB groups (n = 53) to examine SO independently of excess body weight. BDNF and the Aβ42/Aβ40 ratio were log10-transformed to reduce skewness. Covariates were selected a priori on the basis of previous literature and the between-group differences shown in Table 1: the models for BDNF and the Aβ42/Aβ40 ratio included group, handgrip strength, body fat percentage, total physical activity and age, and the models for total MoCA and attention scores included group, BDNF, the Aβ42/Aβ40 ratio, handgrip strength, age and education. The number of predictors was limited to five or six per model because of the sample size. Multicollinearity was assessed with variance inflation factors (VIF), and the normality and homoscedasticity of residuals were examined graphically. Sensitivity analyses repeated these models after restricting the SO group as described in Section 2.6.
Analyses were performed on complete cases, and no data were imputed. Missing values were few: SMI (n = 1, SO group), MoCA abstraction score (n = 2, SO group), physical activity (n = 1, normal-weight group) and menopausal status (n = 1, SO group). The number of participants analysed is reported for each table and figure. Post hoc pairwise comparisons were adjusted for multiple testing (Tukey or Bonferroni); the correlation analyses were considered exploratory and were not adjusted for multiple comparisons. All tests were two-sided, and p < 0.05 was considered statistically significant.
3. Results
Table 1 shows significant differences among the three groups in educational attainment (p = 0.036), employment status (p = 0.042), and sleep duration (p = 0.015). Participants with SO had the highest proportion of lower educational attainment (61.5%) and retirement (23.1%), whereas normal-weight participants were more likely to report sleeping ≥ 7 h per night (68.4%). No significant differences were observed in age, marital status, menopausal status, or smoking status (p > 0.05).
Table 2 shows significant differences among the three groups in most anthropometric, body-composition, muscle-strength, and physical-performance parameters. Participants with SO exhibited significantly higher BMI, waist circumference, waist-to-height ratio, body fat percentage, body fat mass, and visceral fat level than both the normal-weight and OW/OB groups (p ≤ 0.002). Despite having skeletal muscle mass and height-adjusted muscle indices comparable to those of the OW/OB group, the SO group demonstrated significantly lower handgrip strength (14.6 vs. 23.3 kg), longer chair-stand time (17.0 vs. 12.9), and higher SARC-F scores (4 vs. 1) (p < 0.001). Additionally, 80.8% of participants with SO had reduced handgrip strength, 76.9% exhibited impaired chair-stand performance, and 65.4% had SARC-F scores ≥ 4. When muscle mass was adjusted for body weight, ASM/W differed significantly among the groups (p < 0.001), being highest in normal-weight women (28.1 ± 2.5%), intermediate in women with OW/OB (24.9 ± 1.9%), and lowest in women with SO (22.0 ± 2.6%). ASM/W was significantly lower in the SO group than in both the OW/OB (p < 0.001) and normal-weight groups (p < 0.001), and the difference between the SO and OW/OB groups remained significant after adjustment for age (B = −2.8%, 95% CI −4.1 to −1.6; p < 0.001). SMM/W showed the same pattern (38.4 ± 3.5%, 33.3 ± 2.8%, and 29.6 ± 3.3%, respectively; p < 0.001). Thus, although height-adjusted indices were not lower in women with SO, weight-adjusted muscle mass was lower at the group level.
Table 2.
Anthropometric, body-composition, muscle-strength and physical-performance characteristics by study group.
All 26 women with SO had BMI ≥ 25 kg/m2, 22 (84.6%) had waist circumference ≥ 88 cm, and 17 (65.4%) had a SARC-F score ≥ 4; the remaining 9 were screened on the basis of clinical suspicion of sarcopenia. Fifteen women (57.7%) met both muscle-function criteria, 6 (23.1%) had low handgrip strength only, and 5 (19.2%) had a prolonged chair-stand time only. Twenty-four (92.3%) had body fat ≥ 35%; the other two had body fat of 34.3% and 34.5% and were classified on the basis of BMI (34.2 and 27.2 kg/m2) and waist circumference (116 and 103 cm), together with impaired muscle function (Table S1). In the OW/OB group, 16 women (59.3%) had a BMI of 25.0–29.9 kg/m2 and 11 (40.7%) had a BMI ≥ 30 kg/m2; 22 (81.5%) had body fat ≥ 35%, and 17 (63.0%) had waist circumference ≥ 88 cm. One woman in the OW/OB group had a chair-stand time just above 15 s (15.01 s) but was screening-negative.
At the individual level, no woman with SO met the ESPEN/EASO-listed bioelectrical impedance cut-off for low muscle mass (SMM/W < 22.1%). Ten (38.5%) met the less restrictive cut-off of SMM/W < 27.6%, and 18 (69.2%) had ASM/W below the sample-derived cut-off of 23.1%, compared with 5 (18.5%) women in the OW/OB group and none in the normal-weight group (Table S1). Thus, most women with SO (69.2%) had low weight-adjusted muscle mass according to the sample-derived cut-off, whereas the consensus-listed cut-off, derived in older populations, identified none.
Table 3 shows significant differences in cognitive performance and physical activity among the three groups. Participants with SO had lower total MoCA scores (23 vs. 27; overall p = 0.002) and delayed recall scores (3 vs. 4; overall p < 0.001) compared with normal-weight participants. Attention scores were significantly lower in the SO group than in the OW/OB group (4 vs. 6, p = 0.010), although total MoCA scores did not differ significantly between these two groups (p = 0.244). The prevalence of MoCA scores < 26 was highest in the SO group (80.8%), followed by the OW/OB (63.0%) and normal-weight (36.8%) groups (p = 0.011).
Table 3.
Cognitive performance and physical activity by study group.
Regarding physical activity, participants with SO exhibited significantly lower total activity compared with participants with OW/OB and normal body weight (516 vs. 1190 and 1713 MET-min/week), fewer active days per week, and greater sedentary time than participants with OW/OB (p ≤ 0.002).
Table 4 shows significant differences in plasma BDNF, Aβ40, Aβ42, and Aβ42/Aβ40 ratios among the three groups (p ≤ 0.004). Participants with SO exhibited markedly lower BDNF concentrations (59.5 pg/mL) compared with the OW/OB (334.6 pg/mL) and normal-weight (495.4 pg/mL) groups (p < 0.001). Similarly, Aβ42 concentrations were lowest in the SO group (90.0 pg/mL), followed by the OW/OB (163.0 pg/mL) and normal-weight (289.8 pg/mL) groups (p < 0.001). Aβ40 concentrations were significantly lower in both the SO and OW/OB groups than in the normal-weight group, with no significant difference between the SO and OW/OB groups (p = 0.531).
Table 4.
Plasma BDNF and amyloid-β concentrations by study group.
The Aβ42/Aβ40 ratio was significantly reduced in participants with SO (0.168) compared with those with OW/OB (0.326) and normal weight (0.359; p = 0.004). Differences in BDNF, Aβ42, and the Aβ42/Aβ40 ratio between the SO and OW/OB groups remained significant after adjustment for age and education (all adjusted p ≤ 0.003).
Table 5 shows significant associations between muscle function, adiposity, physical activity, plasma biomarkers, and cognitive performance. Among all participants (n = 78), handgrip strength was positively correlated with BDNF (ρ = 0.59, p < 0.001), MoCA total score (ρ = 0.30, p < 0.01), and attention (ρ = 0.39, p < 0.001), whereas chair-stand time showed significant negative correlations with these measures. Higher BMI, body fat percentage, and visceral fat level were associated with lower BDNF, Aβ40, Aβ42, and cognitive performance.
Table 5.
Spearman correlations of muscle, adiposity and physical-activity measures with plasma biomarkers and cognitive performance.
Total physical activity was positively correlated with BDNF (ρ = 0.47, p < 0.001), Aβ42 (ρ = 0.43, p < 0.001), and MoCA total score (ρ = 0.24, p < 0.05). In the combined SO and OW/OB groups (n = 53), handgrip strength remained strongly associated with BDNF (ρ = 0.65, p < 0.001) and attention (ρ = 0.38, p < 0.01), while body fat percentage was negatively correlated with BDNF (ρ = −0.37, p < 0.01). Notably, the Aβ42/Aβ40 ratio was not significantly associated with cognitive performance in either analysis. Weight-adjusted muscle mass (ASM/W) was positively correlated with BDNF (ρ = 0.52, p < 0.001), Aβ42 (ρ = 0.35, p < 0.01), MoCA total score (ρ = 0.37, p < 0.01), attention (ρ = 0.30, p < 0.05), and delayed recall (ρ = 0.38, p < 0.01) in the full sample, and with BDNF (ρ = 0.36, p < 0.01) and attention (ρ = 0.35, p < 0.01) in the combined SO and OW/OB groups. Because ASM/W was strongly inversely correlated with body fat percentage (ρ = −0.91 in the full sample and −0.87 in the combined groups; both p < 0.001), partial rank correlations adjusted for body fat percentage and age were additionally calculated in the combined SO and OW/OB groups (n = 53). After this adjustment, the association between ASM/W and attention persisted (partial r = 0.30, p = 0.031), whereas the associations with BDNF (partial r = 0.03, p = 0.807) and the Aβ42/Aβ40 ratio (partial r = 0.05, p = 0.731) were no longer present.
Table 6 shows distinct correlation patterns between adiposity, plasma biomarkers, and cognitive performance within the SO and OW/OB groups. Among participants with SO (n = 26), Aβ42 concentrations were positively correlated with BMI (ρ = 0.63, p < 0.001), waist circumference (ρ = 0.61, p < 0.001), visceral fat level (ρ = 0.55, p < 0.01), and ASM (ρ = 0.54, p < 0.01). Additionally, Aβ42 was negatively correlated with attention scores (ρ = −0.39, p < 0.05). In contrast, among participants with OW/OB (n = 27), BMI and visceral fat level were negatively correlated with Aβ42 concentrations and the Aβ42/Aβ40 ratio (p < 0.05).
Table 6.
Spearman correlations within the SO and OW/OB groups.
Both BMI (ρ = −0.44, p < 0.05) and visceral fat level (ρ = −0.42, p < 0.05) were also negatively associated with attention scores. BDNF was negatively correlated with attention in the OW/OB group (ρ = −0.41, p < 0.05), whereas no significant BDNF–cognition associations were observed in the SO group.
Table 7 presents multivariable linear regression analyses examining associations between SO, plasma biomarkers, and cognitive performance in the SO and OW/OB groups (n = 53). SO remained associated with lower plasma BDNF concentrations (B = −0.544, p < 0.001) and Aβ42/Aβ40 ratios (B = −0.461, p = 0.001), after adjustment for handgrip strength, body fat percentage, physical activity, and age. These models explained 59.7% and 24.3% of the variance, respectively.
Table 7.
Multivariable linear regression models in women with SO and OW/OB.
For cognitive performance, education level was the only significant predictor of total MoCA score (B = 0.752, p = 0.015), although the overall model was not statistically significant (p = 0.258). In contrast, SO was associated with lower attention scores after adjustment (B = −1.585, p = 0.041), while BDNF showed a borderline association (p = 0.058). Neither BDNF nor the Aβ42/Aβ40 ratio was significantly associated with overall cognitive performance after adjustment for covariates.
In sensitivity analyses (Table S2), restricting the SO group to the 18 women with ASM/W < 23.1% (all of whom had body fat ≥ 35%) did not change the direction of the biomarker findings: SO remained associated with lower BDNF (B = −0.373, 95% CI −0.721 to −0.025; p = 0.036) and a lower Aβ42/Aβ40 ratio (B = −0.526, 95% CI −0.881 to −0.172; p = 0.005). In contrast, the adjusted association with attention was no longer significant (B = −1.171, 95% CI −2.767 to 0.426; p = 0.146), although unadjusted attention scores remained lower than in the OW/OB group (median 3 vs. 6; p = 0.007). Excluding only the two women with body fat < 35% gave similar results for BDNF (p < 0.001) and the Aβ42/Aβ40 ratio (p = 0.003), and again the adjusted association with attention was not significant (p = 0.146). The association between SO and attention is therefore less robust than the biomarker findings.
As shown in Figure 2, plasma BDNF and Aβ42 concentrations and the Aβ42/Aβ40 ratio were significantly lower in women with SO compared with both normal-weight women and women with OW/OB. Furthermore, handgrip strength was positively correlated with plasma BDNF concentrations across all participants (ρ = 0.59, p < 0.001) and in the combined SO and OW/OB groups (ρ = 0.65, p < 0.001). However, these associations were not statistically significant within individual groups.
Figure 2.
Plasma biomarkers by study group and their relationship with muscle strength. (A) BDNF, (B) Aβ42 and (C) Aβ42/Aβ40 ratio in normal-weight (n = 25), OW/OB (n = 27) and SO (n = 26) women; boxes show median and IQR, whiskers 1.5 × IQR, points are individual participants; pairwise comparisons by Dunn test with Bonferroni adjustment (* p < 0.05, ** p < 0.01, *** p < 0.001, ns = not significant). (D) Handgrip strength versus plasma BDNF; dashed line = 16 kg cut-off for low muscle strength; Spearman correlations shown on the right.
4. Discussion
Sarcopenic obesity represents a complex phenotype in which excess adiposity coexists with impaired skeletal muscle function and is increasingly acknowledged as a condition associated with chronic metabolic disorders and adverse cognitive outcomes [14,31,32]. These clinical observations underscore the widespread impact of metabolic disease on both peripheral tissues and the central nervous system [14,33].
Although SO is more frequently investigated in older adults, it may also occur during middle age when early changes in muscle function, metabolic health, and physical activity may become apparent [10,34,35].
Reported SO prevalence estimates vary considerably according to population characteristics, sex, and diagnostic criteria, particularly whether the definition requires low muscle mass in addition to reduced muscle strength and excess adiposity [36,37]. A recent systematic review showed that studies of SO have used highly heterogeneous diagnostic algorithms, body composition indices, and cut-offs, and that many did not follow the ESPEN/EASO algorithm [38]. In the present study, classification followed the ESPEN/EASO sequence of screening, muscle-function assessment, and body-composition assessment; however, low muscle mass was evaluated after classification with a sample-derived weight-adjusted cut-off, which limits comparability with studies of SO defined by height-adjusted indices or other algorithms. Evidence specific to middle-aged women remains limited, and data on the prevalence and characteristics of SO in Jordan are scarce. In this context, the present study investigated associations between SO, circulating BDNF, amyloid-β biomarkers, muscle function, physical activity, and cognitive performance in women aged 45–65 years.
The findings contribute to the emerging literature on the muscle–brain axis by examining neurotrophic and amyloid-related biomarkers alongside physical and cognitive measures in middle-aged women. BDNF plays a central role in maintaining neuronal health, synaptic plasticity and cognitive function [39,40]. Experimental and observational studies indicate that decreased BDNF levels may impair neurogenesis and synaptic plasticity, thereby increasing vulnerability to cognitive decline [13,39]. This makes BDNF a critical biomarker in investigating the muscle–brain axis [17]. In parallel, circulating amyloid-β concentrations and the Aβ42/Aβ40 ratio are being investigated as potential indicators of amyloid-related physiological changes [18,19,41].
Despite growing interest in the muscle–brain axis, there remains a lack of comprehensive clinical studies examining the combined effects of SO and physical activity on neurodegenerative risk [15,17]. Limited evidence exists regarding how these factors interact to influence BDNF and amyloid-β in middle-aged populations [13].
4.1. Sarcopenic Obesity and Cognitive Performance
The present study investigated the association of SO with circulating BDNF and amyloid-β biomarkers, muscle function, physical activity, and cognitive performance in middle-aged women. The lower cognitive performance observed among women with SO is consistent with emerging evidence linking SO to cognitive dysfunction. Recent meta-analyses [42] reported approximately 1.7-fold higher odds of cognitive dysfunction among individuals with SO compared with those without this phenotype, although substantial heterogeneity across studies highlights the influence of differences in study populations and diagnostic criteria [42]. Most previous studies, however, have focused predominantly on older adults. The present findings extend this evidence to women aged 45–65 years, suggesting that cognitive differences associated with SO may be detectable during middle age, prior to the age at which clinically overt cognitive disorders become more prevalent. This observation highlights the potential importance of midlife as a period during which changes in adiposity, metabolic dysfunction, hormonal status, declining skeletal-muscle function, and physical inactivity may jointly converge and contribute to a greater likelihood of cognitive decline and deterioration.
The pattern across individual MoCA domains also warrants consideration. Although both groups with excess body weight had lower global MoCA scores than normal-weight women, the SO and OW/OB groups did not differ significantly in total MoCA score in the unadjusted pairwise analysis. In contrast, attention was significantly lower in women with SO than in women with OW/OB. Furthermore, in the multivariable model, SO status remained associated with a lower attention score after adjustment for BDNF, Aβ42/Aβ40 ratio, handgrip strength, age, and education. Conversely, SO status was not independently associated with total MoCA score, while education was the only significant predictor of global MoCA performance. These findings suggest that the cognitive differences associated with SO may not be uniform across cognitive domains and may be more apparent for selected processes, particularly attention, than for global cognition. Lower weight-adjusted muscle mass (ASM/W) was also associated with poorer attention independently of body fat percentage and age. However, the adjusted association between SO and attention was not maintained in sensitivity analyses restricted to women with low ASM/W or to women with body fat ≥ 35%, so this finding should be interpreted with caution. These findings also reinforce the importance of accounting for educational background when interpreting MoCA scores.
4.2. Circulating BDNF and the Muscle–Brain Axis
One of the most notable findings was the substantially lower circulating BDNF concentration in women with SO. Median BDNF decreased from approximately 495 pg/mL in normal-weight women to 335 pg/mL in women with OW/OB and only 60 pg/mL in women with SO. Moreover, the difference between the SO and OW/OB groups remained highly significant after adjustment for age and education and in the multivariable model incorporating body fat, physical activity, handgrip strength, and age, and it persisted when the SO group was restricted to women with low weight-adjusted muscle mass. These findings support the possibility that the SO phenotype is associated with altered neurotrophic signaling beyond the effect of adiposity alone.
The observed associations are consistent with the proposed muscle–brain axis, which provides a potential biological framework linking skeletal muscle function with cognitive health [43,44]. BDNF plays an important role in neuronal survival, synaptic plasticity, learning, memory, mitochondrial regulation, and metabolic homeostasis [45]. Emerging evidence also indicates that skeletal muscle activity is connected to neurotrophic signaling through exercise-responsive pathways involving Peroxisome proliferator-activated receptor gamma coactivator 1-alpha (PGC-1α), Fibronectin type III domain containing protein 5 (FNDC5)/irisin, BDNF, and other muscle-derived signaling myokines and exerkines [46,47]. Disruption of these pathways has been proposed as one mechanism linking sarcopenia, obesity, metabolic dysfunction, and declining cognitive health [12]. The present finding that handgrip strength was positively correlated with BDNF across all participants and particularly in the combined SO and OW/OB groups is compatible with this biological framework. Conversely, chair-stand time, SARC-F score, BMI, body-fat percentage, waist circumference, and visceral adiposity were inversely associated with BDNF in the overall sample.
However, these correlations should be interpreted carefully. Several associations were substantially reduced or disappeared when examined within the SO and OW/OB groups. For example, the strong inverse relationship between body fat percentage and BDNF in the total sample was weaker within groups. This pattern suggests that part of the overall association may reflect separation between phenotypically distinct groups rather than a continuous biological relationship within each phenotype. Similarly, the positive correlation between weight-adjusted muscle mass (ASM/W) and BDNF disappeared after adjustment for body fat percentage, suggesting that this association largely reflects the inverse relationship between muscle mass relative to body weight and adiposity rather than an independent effect of muscle mass on circulating BDNF. Nevertheless, multivariable analysis remained informative: SO status remained associated with lower BDNF even after body fat percentage, physical activity, handgrip strength, and age were simultaneously included. Thus, the very low BDNF observed in SO cannot be explained solely by higher adiposity or lower habitual physical activity within the variables included in the model, although residual confounding by unmeasured factors cannot be excluded. Recent studies showing increases in BDNF alongside improvements in muscle function following exercise in women with obesity further support a potential connection between physical function and neurotrophic regulation [12,48].
4.3. Amyloid-β Biomarkers and Sarcopenic Obesity
Another novel observation was the pattern of circulating amyloid-β biomarkers. Absolute Aβ40 concentrations were highest in normal-weight women and were lower in both groups with excess body weight, but Aβ40 did not differ between the SO and OW/OB groups. In contrast, Aβ42 was progressively lower across the normal-weight, OW/OB, and SO groups, with a particularly marked reduction in women with SO. Consequently, the Aβ42/Aβ40 ratio was significantly lower in women with SO than in both normal-weight women and women with OW/OB. Importantly, the difference between the SO and OW/OB groups remained significant following adjustment for age and education and in the multivariable regression model.
The Aβ42/Aβ40 ratio is likely to be more informative than interpretation of either peptide in isolation. Studies comparing circulating amyloid biomarkers with amyloid positron-emission tomography have generally reported that lower plasma Aβ42/Aβ40 ratios are associated with greater cerebral amyloid burden, whereas plasma Aβ40 alone demonstrates substantially weaker and less consistent discrimination [49,50,51]. In addition, previous studies have reported lower plasma Aβ42/Aβ40 ratios in individuals with obesity than in lean individuals, suggesting that obesity may be accompanied by altered peripheral amyloid homeostasis [52]. In the present study, the low ratio observed in the SO group therefore raises the possibility that metabolic and muscle dysfunction may be associated with additional alterations in amyloid-related physiology.
Nevertheless, the present results should not be interpreted as evidence that women with SO had cerebral amyloid deposition or preclinical Alzheimer’s disease. Plasma amyloid-β concentrations are influenced by multiple factors beyond cerebral amyloid pathology, including peripheral metabolism, clearance, renal function, metabolic factors, and analytical methodology [53,54]. Moreover, the magnitude and diagnostic performance of plasma Aβ42/Aβ40 vary substantially across analytical platforms, reflecting differences in assay technologies and measurement characteristics [55]. Plasma Aβ assays have more limited robustness than current high-performing phosphorylated-tau biomarkers for detecting Alzheimer’s disease pathology [55,56]. Confirmation using highly sensitive biomarker platforms together with amyloid PET, cerebrospinal-fluid biomarkers, or complementary blood biomarkers such as phosphorylated tau would therefore be required before neurological significance could be established.
The absence of an association between the Aβ42/Aβ40 ratio and total MoCA score in the present study further supports this cautious interpretation. Although the SO group displayed both lower Aβ42/Aβ40 ratios and poorer cognitive performance at the group level, the ratio itself was not correlated with global cognition, attention, or delayed recall in the full sample, and it did not independently predict cognitive performance in multivariable analyses. These findings suggest that the biomarker and cognitive alterations may represent related characteristics of the SO phenotype without demonstrating a direct pathway from altered circulating amyloid to cognitive impairment. Longitudinal research is required to determine whether these biomarkers predict subsequent cognitive change.
The association between BDNF and cognition was similarly complex. BDNF was positively associated with total MoCA and delayed recall across the full sample, but these correlations were modest and were largely attenuated after restriction to the SO and OW/OB groups. Furthermore, BDNF was not an independent predictor of total MoCA in the adjusted model and showed only a borderline association with attention. Thus, although circulating BDNF appears strongly related to the SO phenotype, the present data do not support the conclusion that lower BDNF directly mediates cognitive impairment. BDNF may instead reflect broader alterations involving muscle function, adiposity, metabolic health, physical activity, inflammation, or neurotrophic regulation.
4.4. Physical Activity and the Investigated Biomarkers:
Physical activity represents another potential component of this muscle–brain relationship [16,57]. Women with SO reported substantially lower vigorous, moderate, and total physical activity and fewer active days per week than the other groups, while more than three-quarters were categorized as having low physical activity. Total physical activity was positively correlated with BDNF, Aβ40, Aβ42, and global MoCA score in the overall sample. Physical activity has been proposed to influence brain health through several mechanisms, including improvements in insulin sensitivity, vascular function, inflammatory regulation, mitochondrial health, muscle-derived signaling, and BDNF-related pathways [16,58,59,60]. However, in the present study, physical activity did not significantly moderate the association between SO status and BDNF, amyloid biomarkers, or MoCA assessment. Therefore, although lower physical activity characterized women with SO, the data do not indicate that physical activity statistically modified the association between SO and the investigated biomarkers. Limited statistical power for detecting interaction effects should also be considered.
4.5. Muscle Function, Body Composition and Interpretation of SMI
The body-composition findings deserve particular attention. Women with SO had markedly impaired handgrip strength and chair-stand performance, and 65.4% had SARC-F scores ≥ 4. Absolute skeletal muscle mass and height-adjusted muscle mass (SMI) were not lower than in the comparison groups, whereas muscle mass adjusted for body weight (ASM/W and SMM/W) was lower in women with SO than in both other groups, and the difference from the OW/OB group persisted after adjustment for age. Indices adjusted for height squared increase with body size and may mask low muscle mass in people with obesity, which is why the ESPEN/EASO consensus recommends adjusting muscle mass for body weight [4]. However, a lower group mean does not demonstrate that each woman had low muscle mass. When individual cut-offs were applied, no woman with SO met the bioelectrical impedance cut-off listed in the consensus (SMM/W < 22.1%), 38.5% met a less restrictive cut-off, and 69.2% were below a sample-derived ASM/W cut-off. Low muscle mass was therefore confirmed in most, but not all, women with SO. The consensus-listed cut-off was derived in older adults with different prediction equations and may not be applicable to middle-aged women measured with the InBody 270; the remaining 30.8% of women had excess adiposity and impaired muscle function without low weight-adjusted muscle mass. It should also be noted that ASM/W was strongly and inversely related to body fat percentage (ρ = −0.91 in the full sample), so lower ASM/W in women with SO partly reflects their greater adiposity. Importantly, the BDNF and Aβ42/Aβ40 findings were maintained when the SO group was restricted to women with low ASM/W, suggesting that they are not explained by the inclusion of women with preserved weight-adjusted muscle mass.
ASM/W and SMM/W are indices of muscle quantity relative to body size and cannot provide information on muscle quality. It is possible that women with SO have impaired muscle quality, for example, greater intramuscular fat infiltration or reduced cellular integrity, which could contribute to low strength and poor physical performance despite preserved absolute muscle mass. This is a hypothesis that the present data cannot test, and it should be examined in future studies. Raw bioelectrical parameters such as phase angle, which reflects cellular integrity and has been proposed as a proxy of muscle mass and quality, were not available from the InBody 270 (Section 2.4). In adults aged over 50 years classified according to the ESPEN/EASO and EWGSOP2 criteria, specific bioelectrical impedance vector analysis (BIVA) distinguished SO from other phenotypes: the SO group showed a longer vector, indicating higher fat mass, and a lower phase angle, and this approach combined with low handgrip strength made it possible to identify SO [61]. Phase angle and vector analysis have also been reviewed as tools for evaluating body composition in SO [38]. In younger women, phase angle and the extracellular-to-total body water ratio obtained with multifrequency analyzers were sensitive to lifestyle factors independently of BMI and physical activity [62]. Future studies in middle-aged women should therefore use devices that provide resistance, reactance, and phase angle, or imaging-based assessment of muscle composition, together with muscle strength normalized for muscle mass, to test whether impaired muscle quality characterizes SO.
4.6. Strengths and Limitations:
This study has several notable strengths. First, it was a community-based study of middle-aged women. Second, it incorporated comprehensive assessment of body composition, muscle strength, physical performance, physical activity, cognitive function, BDNF, and circulating amyloid-β peptides, providing an integrated evaluation of the proposed muscle–brain axis. Third, the inclusion of normal-weight and overweight/obesity groups enabled a more differentiated examination of factors associated with excess adiposity and with impaired muscle function. Fourth, the use of objective measures, including handgrip dynamometry and chair-stand testing, strengthened the evaluation of muscle function. Furthermore, measuring both Aβ40 and Aβ42 enabled calculation of the Aβ42/Aβ40 ratio, providing a more comprehensive biomarker assessment. However, several limitations should nevertheless be acknowledged. First, the cross-sectional design precludes determination of temporal relationship or causality. Therefore, it cannot be established whether alterations in BDNF or amyloid-β profiles precede SO, occur as a consequence of the condition, or reflect shared underlying metabolic and lifestyle factors. Second, the relatively small sample size, particularly following stratification into three groups, may have limited statistical power to detect modest associations and conduct subgroup or interaction analyses. Third, the study did not include a group with sarcopenia without obesity; therefore, the separate contributions of impaired muscle function and adiposity to the biomarker and cognitive findings could not be fully disentangled. Moreover, the normal-weight reference group was selected without evidence of muscle impairment (handgrip strength ≥ 16 kg and chair-stand time ≤ 15 s), which may have increased the contrast between groups and may overestimate the differences compared with an unselected normal-weight population; this group was also the smallest (n = 25). Fourth, low muscle mass was not applied as an individual classification criterion, because no validated weight-adjusted cut-off is available for middle-aged Arab women, and the cut-offs listed in the ESPEN/EASO consensus were derived in other populations; it was evaluated afterwards with a sample-derived cut-off, which was met by 69.2% of women with SO. The remaining 30.8% did not have low weight-adjusted muscle mass; no woman met the consensus-listed bioelectrical impedance cut-off, and the proportion with low muscle mass depended strongly on the cut-off used. The SO group is therefore heterogeneous with respect to muscle mass, although the main biomarker findings persisted when it was restricted to women with low ASM/W. In addition, two women classified as SO had body fat slightly below 35% and were classified on the basis of BMI and waist circumference, and nine were screened on the basis of clinical suspicion rather than a SARC-F score ≥ 4. Fifth, body composition was assessed by bioelectrical impedance analysis rather than dual-energy X-ray absorptiometry. The InBody 270 estimates muscle mass using proprietary prediction equations that have not been validated in middle-aged Arab women with obesity, and altered hydration and body geometry in obesity may reduce the accuracy of BIA-derived muscle mass, which may have affected the estimation of ASM, ASM/W, and SMM/W. The device does not provide resistance, reactance, phase angle, or the extracellular-to-total body water ratio, so muscle quality could not be assessed; ASM/W and SMM/W are indices of muscle quantity only. Sixth, dietary intake, particularly protein and energy intake, was not assessed, although it may influence muscle mass, BDNF, and cognitive function. Menstrual cycle phase was recorded but was not included in the analyses because of the small number of premenopausal women. Seventh, residual confounding by unmeasured factors, such as inflammation, insulin resistance, depressive symptoms, medication use, and genetic factors (e.g., APOE genotype), cannot be excluded. Finally, the numerous correlation analyses increase the possibility of false-positive findings, and these exploratory results should therefore be interpreted cautiously and should be confirmed in larger studies.
5. Conclusions
This study showed that middle-aged women with SO had reduced muscle strength and physical performance, lower physical activity, lower circulating BDNF concentrations and Aβ42/Aβ40 ratios, and poorer cognitive performance, particularly in attention, although the association with attention was not robust in sensitivity analyses. Most women with SO (69.2%) had low weight-adjusted muscle mass according to a sample-derived cut-off, and the biomarker findings persisted when the analysis was restricted to these women. These findings suggest that SO is associated with distinct neurotrophic and amyloid-related biomarker profiles, potentially reflecting alterations in muscle–brain communication. Longitudinal studies using validated muscle mass cut-offs and measures of muscle quality are needed to clarify the underlying mechanisms and to determine whether these biomarker alterations predict cognitive decline.
Supplementary Materials
The following supporting information can be downloaded at: https://www.mdpi.com/article/10.3390/life16111933/s1. Table S1: Classification criteria and low-muscle-mass cut-offs by study group; Table S2: Sensitivity analyses of the multivariable models.
Author Contributions
Methodology, R.A.-F. and M.A.-S.; software, M.A.-S. and F.S.A.; validation, R.A.-F. and A.A.-D.; investigation, A.A.-D.; writing—original draft preparation, R.A.-F. and A.A.-D.; writing—review and editing, R.A.-F. and A.A.-D.; visualization, F.S.A.; supervision, A.A.-D.; project administration, A.A.-D. Funding acquisition, A.A.-D. All authors have read and agreed to the published version of the manuscript.
Funding
This research was funded by Applied Science Private University, Amman, Jordan (grant number DRGS-2021-2022-11).
Institutional Review Board Statement
The study protocol was reviewed and approved by the Institutional Review Board of the Faculty of Allied Medical Sciences, Applied Science Private University (Approval No. IRB-AMS-2026-30).
Informed Consent Statement
Informed consent was obtained from all subjects involved in the study.
Data Availability Statement
All data used in the study are available upon the corresponding author’s request. The lead author has full access to the data reported in the manuscript.
Acknowledgments
The authors thank the participants for their patience and co-operation; the authors also thank the fitness facilities: Gx gymnasium and Goals gym for hosting the assessment sessions.
Conflicts of Interest
The authors declare no conflict of interest.
References
- World Health Organization (WHO). Obesity and Overweight; Fact Sheet; World Health Organization: Geneva, Switzerland, 2025; Available online: https://www.who.int/news-room/fact-sheets/detail/obesity-and-overweight (accessed on 11 November 2026).
- Liu, C.; Zhang, Z.; Wang, B.; Meng, T.; Li, C.; Zhang, X. Global health impacts of high BMI: A 30-year analysis of trends and disparities across regions and demographics. Diabetes Res. Clin. Pract. 2024, 217, 111883. [Google Scholar] [CrossRef] [Scilit] [PubMed]
- World Health Organization (WHO). Dementia; Fact Sheet; World Health Organization: Geneva, Switzerland, 2026; Available online: https://www.who.int/news-room/fact-sheets/detail/dementia (accessed on 11 November 2026).
- Donini, L.M.; Busetto, L.; Bischoff, S.C.; Cederholm, T.; Ballesteros-Pomar, M.D.; Batsis, J.A.; Bauer, J.M.; Boirie, Y.; Cruz-Jentoft, A.J.; Dicker, D.; et al. Definition and diagnostic criteria for sarcopenic obesity: ESPEN and EASO consensus statement. Obes. Facts 2022, 15, 321–335. [Google Scholar] [CrossRef] [Scilit] [PubMed]
- Prado, C.M.; Batsis, J.A.; Donini, L.M.; Gonzalez, M.C.; Siervo, M. Sarcopenic obesity in older adults: A clinical overview. Nat. Rev. Endocrinol. 2024, 20, 261–277. [Google Scholar] [CrossRef] [Scilit] [PubMed]
- Dong, P.; Wu, H.; Chai, Y.; Huang, P.; Huang, D.; Li, C.; Pan, X.; Tao, P.; Lai, L.; Cao, X.; et al. Comparative analysis of sarcopenic obesity detection and associated mental–cognitive outcomes in community-dwelling older adults: Impact of using body mass index versus waist circumference. BMC Geriatr. 2026, 26, 435. [Google Scholar] [CrossRef] [Scilit] [PubMed]
- Zhang, J.; Na, X.; Li, Z.; Ji, J.S.; Li, G.; Yang, H.; Yang, Y.; Tan, Y.; Zhang, J.; Xi, M.; et al. Sarcopenic obesity is part of obesity paradox in dementia development: Evidence from a population-based cohort study. BMC Med. 2024, 22, 133. [Google Scholar] [CrossRef] [Scilit] [PubMed]
- Someya, Y.; Tamura, Y.; Kaga, H.; Sugimoto, D.; Kadowaki, S.; Suzuki, R.; Aoki, S.; Hattori, N.; Motoi, Y.; Shimada, K.; et al. Sarcopenic obesity is associated with cognitive impairment in community-dwelling older adults: The Bunkyo Health Study. Clin. Nutr. 2022, 41, 1046–1051. [Google Scholar] [CrossRef] [Scilit] [PubMed]
- Sui, S.X.; Balanta-Melo, J.; Pasco, J.A.; Plotkin, L.I. Musculoskeletal deficits and cognitive impairment: Epidemiological evidence and biological mechanisms. Curr. Osteoporos. Rep. 2022, 20, 260–272. [Google Scholar] [CrossRef] [Scilit] [PubMed]
- Du, Y.; Xu, T.; Yin, Z.; Espinoza, S.; Xie, Y.; Gentry, C.; Tian, Q.; Zhao, L.-J.; Shen, H.; Luo, Z.; et al. Associations of physical activity with sarcopenia and sarcopenic obesity in middle-aged and older adults: The Louisiana osteoporosis study. BMC Public Health 2022, 22, 896. [Google Scholar] [CrossRef] [Scilit] [PubMed]
- Wang, Z.Z.; Xu, Q.; Zhang, Y.H.; Wu, R.R.; Cui, J.L.; Zhou, J.; Hong, J.F. Oxidative balance score is associated with increased risk of sarcopenia and sarcopenic obesity in non-elderly adults: Results from NHANES 2011–2018. Nutr. Metab. 2025, 22, 23. [Google Scholar] [CrossRef] [Scilit] [PubMed]
- Scisciola, L.; Fontanella, R.A.; Surina, N.; Cataldo, V.; Paolisso, G.; Barbieri, M. Sarcopenia and cognitive function: Role of myokines in muscle brain cross-talk. Life 2021, 11, 173. [Google Scholar] [CrossRef] [Scilit] [PubMed]
- Lee, H.; Lim, Y. Can Myokines Serve as Supporters of Muscle–Brain Connectivity in Obesity and Type 2 Diabetes? Potential of Exercise and Nutrition Interventions. Nutrients 2025, 17, 3615. [Google Scholar] [CrossRef] [Scilit] [PubMed]
- Rai, M.; Demontis, F. Muscle-to-brain signaling via myokines and myometabolites. Brain Plast. 2022, 8, 43–63. [Google Scholar] [CrossRef] [Scilit] [PubMed]
- Colucci-D’Amato, L.; Speranza, L.; Volpicelli, F. Neurotrophic factor BDNF, physiological functions and therapeutic potential in depression, neurodegeneration and brain cancer. Int. J. Mol. Sci. 2020, 21, 7777. [Google Scholar] [CrossRef] [Scilit] [PubMed]
- Cefis, M.; Chaney, R.; Wirtz, J.; Méloux, A.; Quirié, A.; Leger, C.; Prigent-Tessier, A.; Garnier, P. Molecular mechanisms underlying physical exercise-induced brain BDNF overproduction. Front. Mol. Neurosci. 2023, 16, 1275924. [Google Scholar] [CrossRef] [Scilit] [PubMed]
- Copeland, E.N.; LeBlanc, P.J.; Duarte-Guterman, P.; Fajardo, V.A.; MacPherson, R.E. The link between sarcopenic obesity and Alzheimer’s disease: A brain-derived neurotrophic factor point of view. J. Physiol. 2026, 604, 2400–2410. [Google Scholar] [CrossRef] [Scilit] [PubMed]
- Ullah, R.; Lee, E.J. Advances in amyloid-β clearance in the brain and periphery: Implications for neurodegenerative diseases. Exp. Neurobiol. 2023, 32, 216. [Google Scholar] [CrossRef] [Scilit] [PubMed]
- Wu, J.; Tang, J.; Huang, D.; Wang, Y.; Zhou, E.; Ru, Q.; Xu, G.; Chen, L.; Wu, Y. Effects and mechanisms of APP and its cleavage product Aβ in the comorbidity of sarcopenia and Alzheimer’s disease. Front. Aging Neurosci. 2024, 16, 1482947. [Google Scholar] [CrossRef] [Scilit] [PubMed]
- Hansson, O.; Edelmayer, R.M.; Boxer, A.L.; Carrillo, M.C.; Mielke, M.M.; Rabinovici, G.D.; Salloway, S.; Sperling, R.; Zetterberg, H.; Teunissen, C.E. The Alzheimer’s Association appropriate use recommendations for blood biomarkers in Alzheimer’s disease. Alzheimer’s Dement. 2022, 18, 2669–2686. [Google Scholar] [CrossRef] [Scilit] [PubMed]
- Pais, M.V.; Forlenza, O.V.; Diniz, B.S. Plasma biomarkers of Alzheimer’s disease: A review of available assays, recent developments, and implications for clinical practice. J. Alzheimer’s Dis. Rep. 2023, 7, 355–380. [Google Scholar] [CrossRef] [Scilit] [PubMed]
- Wilding, J.P.; Batterham, R.L.; Calanna, S.; Van Gaal, L.F.; McGowan, B.M.; Rosenstock, J.; Tran, M.T.D.; Wharton, S.; Yokote, K.; Zeuthen, N.; et al. Impact of semaglutide on body composition in adults with overweight or obesity: Exploratory analysis of the STEP 1 study. J. Endocr. Soc. 2021, 5, A16–A17. [Google Scholar] [CrossRef] [Scilit]
- Scheen, A.J. GLP-1-derived therapies and sarcopenia: Plea for a specific focus on at risk special populations. Diabetes Metab. 2025, 52, 101708. [Google Scholar] [CrossRef] [Scilit] [PubMed]
- Liang, Y.; Doré, V.; Rowe, C.C.; Krishnadas, N. Clinical evidence for GLP-1 receptor agonists in Alzheimer’s disease: A systematic review. J. Alzheimer’s Dis. Rep. 2024, 8, 777–789. [Google Scholar] [CrossRef] [Scilit] [PubMed]
- Saghazadeh, A.; Dolatshahi, M.; Mohammadi, S.; Kassani, S.H.; Naghashzadeh, M.; Ippolito, J.E.; Sirlin, C.B.; Mittendorfer, B.; Brier, M.R.; Schindler, S.E.; et al. A Systematic Review and Meta-Analysis of Semaglutide Effects on Adipose Tissue and Emerging Effects on Brain and Cognition. Obes. Rev. 2026, 27, e70108. [Google Scholar] [CrossRef] [Scilit] [PubMed]
- Islam, N.; Hashem, R.; Gad, M.; Brown, A.; Levis, B.; Renoux, C.; Thombs, B.D.; McInnes, M.D. Accuracy of the Montreal Cognitive Assessment tool for detecting mild cognitive impairment: A systematic review and meta-analysis. Alzheimer’s Dement. 2023, 19, 3235–3243. [Google Scholar] [CrossRef] [Scilit] [PubMed]
- Bahat, G.; Ozkok, S.; Kilic, C.; Karan, M.A. SARC-F questionnaire detects frailty in older adults. J. Nutr. Health Aging 2021, 25, 448–453. [Google Scholar] [CrossRef] [Scilit] [PubMed]
- Janssen, I.; Heymsfield, S.B.; Ross, R. Low relative skeletal muscle mass (sarcopenia) in older persons is associated with functional impairment and physical disability. J. Am. Geriatr. Soc. 2002, 50, 889–896. [Google Scholar] [CrossRef] [Scilit] [PubMed]
- Cruz-Jentoft, A.J.; Bahat, G.; Bauer, J.; Boirie, Y.; Bruyère, O.; Cederholm, T.; Cooper, C.; Landi, F.; Rolland, Y.; Sayer, A.A.; et al. Sarcopenia: Revised European consensus on definition and diagnosis. Age Ageing 2019, 48, 16–31. [Google Scholar] [CrossRef] [Scilit] [PubMed]
- World Health Organization (WHO). Waist Circumference and Waist–Hip Ratio: Report of a WHO Expert Consultation, Geneva, 8–11 December 2008; World Health Organization: Geneva, Switzerland, 2011. [Google Scholar]
- Ji, T.; Li, Y.; Ma, L. Sarcopenic obesity: An emerging public health problem. Aging Dis. 2022, 13, 379. [Google Scholar] [CrossRef] [Scilit] [PubMed]
- Mahmoodi, M.; Shateri, Z.; Nazari, S.A.; Nouri, M.; Nasimi, N.; Sohrabi, Z.; Dabbaghmanesh, M.H. Association between oxidative balance score and sarcopenia in older adults. Sci. Rep. 2024, 14, 5362. [Google Scholar] [CrossRef] [Scilit] [PubMed]
- Huang, Y.Y.; Zhang, W.S.; Wang, J.; Jin, Y.L.; Cheng, K.K.; Lam, T.H.; Xu, L. Associations of Sarcopenia and Sarcopenic Obesity Using Different Obesity Definitions With Memory Decline. J. Diabetes 2026, 18, e70210. [Google Scholar] [CrossRef] [Scilit] [PubMed]
- Yang, Y.S.; Han, B.D.; Han, K.; Jung, J.H.; Son, J.W. Obesity fact sheet in Korea, 2021: Trends in obesity prevalence and obesity-related comorbidity incidence stratified by age from 2009 to 2019. J. Obes. Metab. Syndr. 2022, 31, 169. [Google Scholar] [CrossRef] [Scilit] [PubMed]
- Xu, S.; Tu, S.; Hao, X.; Chen, X.; Pan, D.; Liao, W.; Wu, R.; Yang, L.; Xia, H.; Wang, S.; et al. Exercise, nutrition, and neuromuscular electrical stimulation for sarcopenic obesity: A systematic review and meta-analysis of management in middle-aged and older adults. Nutrients 2025, 17, 1504. [Google Scholar] [CrossRef] [Scilit] [PubMed]
- Gao, Q.; Mei, F.; Shang, Y.; Hu, K.; Chen, F.; Zhao, L.; Ma, B. Global prevalence of sarcopenic obesity in older adults: A systematic review and meta-analysis. Clin. Nutr. 2021, 40, 4633–4641. [Google Scholar] [CrossRef] [Scilit] [PubMed]
- Şengül Ayçiçek, G.; Okyar Baş, A.; Karabulut, E.; Halil, M.G. Prevalence, diagnosis and treatment of sarcopenic obesity in older adults: A systematic review and a meta-analysis. Acta Clin. Belg. 2025, 80, 226–249. [Google Scholar] [CrossRef] [Scilit] [PubMed]
- Pozo, K.; Frau, F.; Succa, V.; Donini, L.M.; Marini, E. Phase angle and vector analysis in the evaluation of body composition in sarcopenic obesity: A systematic review. Nutrition 2025, 142, 112960. [Google Scholar] [CrossRef] [Scilit] [PubMed]
- Zhao, X.; Liu, D.; Zhang, H.; Shen, S.; Zhang, N.; Pan, Y.; Fu, C.; Wang, W.; Ren, H.; Pan, X. Associations of physical activity intensity, frequency, duration, and volume with the incidence of sarcopenia in middle-aged and older adults: A 4-year longitudinal study in China. BMC Geriatr. 2024, 24, 258. [Google Scholar] [CrossRef] [Scilit] [PubMed]
- McPhee, G.M.; Downey, L.A.; Stough, C. Neurotrophins as a reliable biomarker for brain function, structure and cognition: A systematic review and meta-analysis. Neurobiol. Learn. Mem. 2020, 175, 107298. [Google Scholar] [CrossRef] [Scilit] [PubMed]
- Huang, J.; Li, M.; Luo, Q.; Li, J. The association of sarcopenia, possible sarcopenia and cognitive impairment: A systematic review and meta-analysis. PLoS ONE 2025, 20, e0324258. [Google Scholar] [CrossRef] [Scilit] [PubMed]
- Wu, J.T.; Koh, F.H. Sarcopenia and Its Impact on Surgical Outcomes. In Mastering Geriatric Surgery: Managing Frailty, Sarcopenia, and other Geriatric Issues in Surgery; Springer Nature: Singapore, 2025; pp. 49–63. [Google Scholar]
- Iglesias, P. Muscle in endocrinology: From skeletal muscle hormone regulation to myokine secretion and its implications in endocrine–metabolic diseases. J. Clin. Med. 2025, 14, 4490. [Google Scholar] [CrossRef] [Scilit] [PubMed]
- Severinsen, M.C.K.; Pedersen, B.K. Muscle–organ crosstalk: The emerging roles of myokines. Endocr. Rev. 2020, 41, 594–609. [Google Scholar] [CrossRef] [Scilit] [PubMed]
- Amini, N.; Lapauw, L.; Dupont, J.; Vercauteren, L.; Dalle, S.; Koppo, K.; Verschueren, S.; Tournoy, J.; Gielen, E. Do myokines influence the associations between sarcopenia-related parameters and cognitive function in community-dwelling older adults: Exploratory results from the ENHANce study. Exp. Gerontol. 2026, 214, 113042. [Google Scholar] [CrossRef] [Scilit] [PubMed]
- Inyushkin, A.N.; Poletaev, V.S.; Inyushkina, E.M.; Kalberdin, I.S.; Inyushkin, A.A. Irisin/BDNF signaling in the muscle-brain axis and circadian system: A review. J. Biomed. Res. 2023, 38, 1. [Google Scholar] [CrossRef] [Scilit] [PubMed]
- Duan, X.; Chen, Z.; Tong, X.; Li, X.; Liu, Z.; Yang, Y.; Liu, X.; Liu, W. Irisin-BDNF axis mediates muscle-brain communication: A complete molecular cascade and potential bidirectional feedback from peripheral activation to central protection. Biogerontology 2026, 27, 162. [Google Scholar] [CrossRef] [Scilit] [PubMed]
- Ersever, E.M. The exercise-induced irisin–BDNF axis: A systematic review of evidence and translational implications. Muscles Ligaments Tendons J. 2026, 16, 1–7. [Google Scholar] [CrossRef] [Scilit]
- Li, K.; Zhou, X.; Liu, Y.; Li, D.; Li, Y.; Zhang, T.; Fu, C.; Li, L.; Hu, Y.; Jiang, L. Serum amyloid beta 42 levels correlated with metabolic syndrome and its components. Front. Endocrinol. 2024, 15, 1278477. [Google Scholar] [CrossRef] [Scilit] [PubMed]
- Giudici, K.V.; de Souto Barreto, P.; Guyonnet, S.; Li, Y.; Bateman, R.J.; Vellas, B. Assessment of plasma amyloid-β42/40 and cognitive decline among community-dwelling older adults. JAMA Netw. Open 2020, 3, e2028634. [Google Scholar] [CrossRef] [Scilit] [PubMed]
- Hermesdorf, M.; Esselmann, H.; Morgado, B.; Jahn-Brodmann, A.; Herrera-Rivero, M.; Wiltfang, J.; Berger, K. The association of body mass index and body composition with plasma amyloid beta levels. Brain Commun. 2023, 5, fcad263. [Google Scholar] [CrossRef] [Scilit] [PubMed]
- Brook, E.S.; D’Alonzo, Z.J.; Lam, V.; Chan, D.C.; Dhaliwal, S.S.; Watts, G.F.; Mamo, J.C.; Takechi, R. Plasma amyloid-β homeostasis is associated with body mass index and weight loss in people with overweight and obesity. J. Alzheimer’s Dis. 2023, 93, 653–664. [Google Scholar] [CrossRef] [Scilit] [PubMed]
- Arslan, B.; Brum, W.S.; Pola, I.; Therriault, J.; Rahmouni, N.; Stevenson, J.; Servaes, S.; Tan, K.; Vitali, P.; Montembeault, M.; et al. The impact of kidney function on Alzheimer’s disease blood biomarkers: Implications for predicting amyloid-β positivity. Alzheimer’s Res. Ther. 2025, 17, 48. [Google Scholar] [CrossRef] [Scilit] [PubMed]
- Zeng, X.; Chen, Y.; Sehrawat, A.; Lee, J.; Lafferty, T.K.; Kofler, J.; Berman, S.B.; Sweet, R.A.; Tudorascu, D.L.; Klunk, W.E.; et al. Alzheimer blood biomarkers: Practical guidelines for study design, sample collection, processing, biobanking, measurement and result reporting. Mol. Neurodegener. 2024, 19, 40. [Google Scholar] [CrossRef] [Scilit] [PubMed]
- Schindler, S.E.; Petersen, K.K.; Saef, B.; Tosun, D.; Shaw, L.M.; Zetterberg, H.; Dage, J.L.; Ferber, K.; Triana-Baltzer, G.; Du-Cuny, L.; et al. Head-to-head comparison of leading blood tests for Alzheimer’s disease pathology. Alzheimer’s Dement. 2024, 20, 8074–8096. [Google Scholar] [CrossRef] [Scilit] [PubMed]
- Janelidze, S.; Teunissen, C.E.; Zetterberg, H.; Allué, J.A.; Sarasa, L.; Eichenlaub, U.; Bittner, T.; Ovod, V.; Verberk, I.M.W.; Toba, K.; et al. Head-to-head comparison of 8 plasma amyloid-β 42/40 assays in Alzheimer disease. JAMA Neurol. 2021, 78, 1375–1382. [Google Scholar] [CrossRef] [Scilit] [PubMed]
- Chung, H.S.; Choi, K.M. Exercise, Exerkines, and Sarcopenia. Diabetes Metab. J. 2026, 50, 19. [Google Scholar] [CrossRef] [Scilit] [PubMed]
- Chen, C.; Nakagawa, S. Physical activity for cognitive health promotion: An overview of the underlying neurobiological mechanisms. Ageing Res. Rev. 2023, 86, 101868. [Google Scholar] [CrossRef] [Scilit] [PubMed]
- Malin, S.K.; Stewart, N.R.; Ude, A.A.; Alderman, B.L. Brain insulin resistance and cognitive function: Influence of exercise. J. Appl. Physiol. 2022, 133, 1368–1380. [Google Scholar] [CrossRef] [Scilit] [PubMed]
- Schock, S.; Hakim, A. The physiological and molecular links between physical activity and brain health: A review. Neurosci. Insights 2023, 18, 26331055231191523. [Google Scholar] [CrossRef] [Scilit] [PubMed]
- Marini, E.; Sulis, S.; Vorobel’oVá, L.; Stagi, S. Specific bioelectrical vectors pattern in individuals with sarcopenic obesity. Clin. Nutr. 2024, 43, 620–628. [Google Scholar] [CrossRef] [Scilit] [PubMed]
- Falbová, D.; Sulis, S.; Hozáková, A.; Švábová, P.; Beňuš, R.; Vorobeľová, L. Associations between vegetarian diet and bioelectrical impedance parameters: Insights into body composition and cellular health in young adult women. Nutrients 2026, 18, 202. [Google Scholar] [CrossRef] [Scilit] [PubMed]
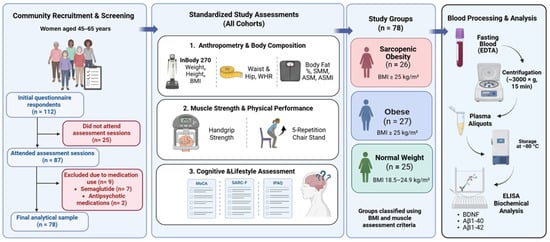
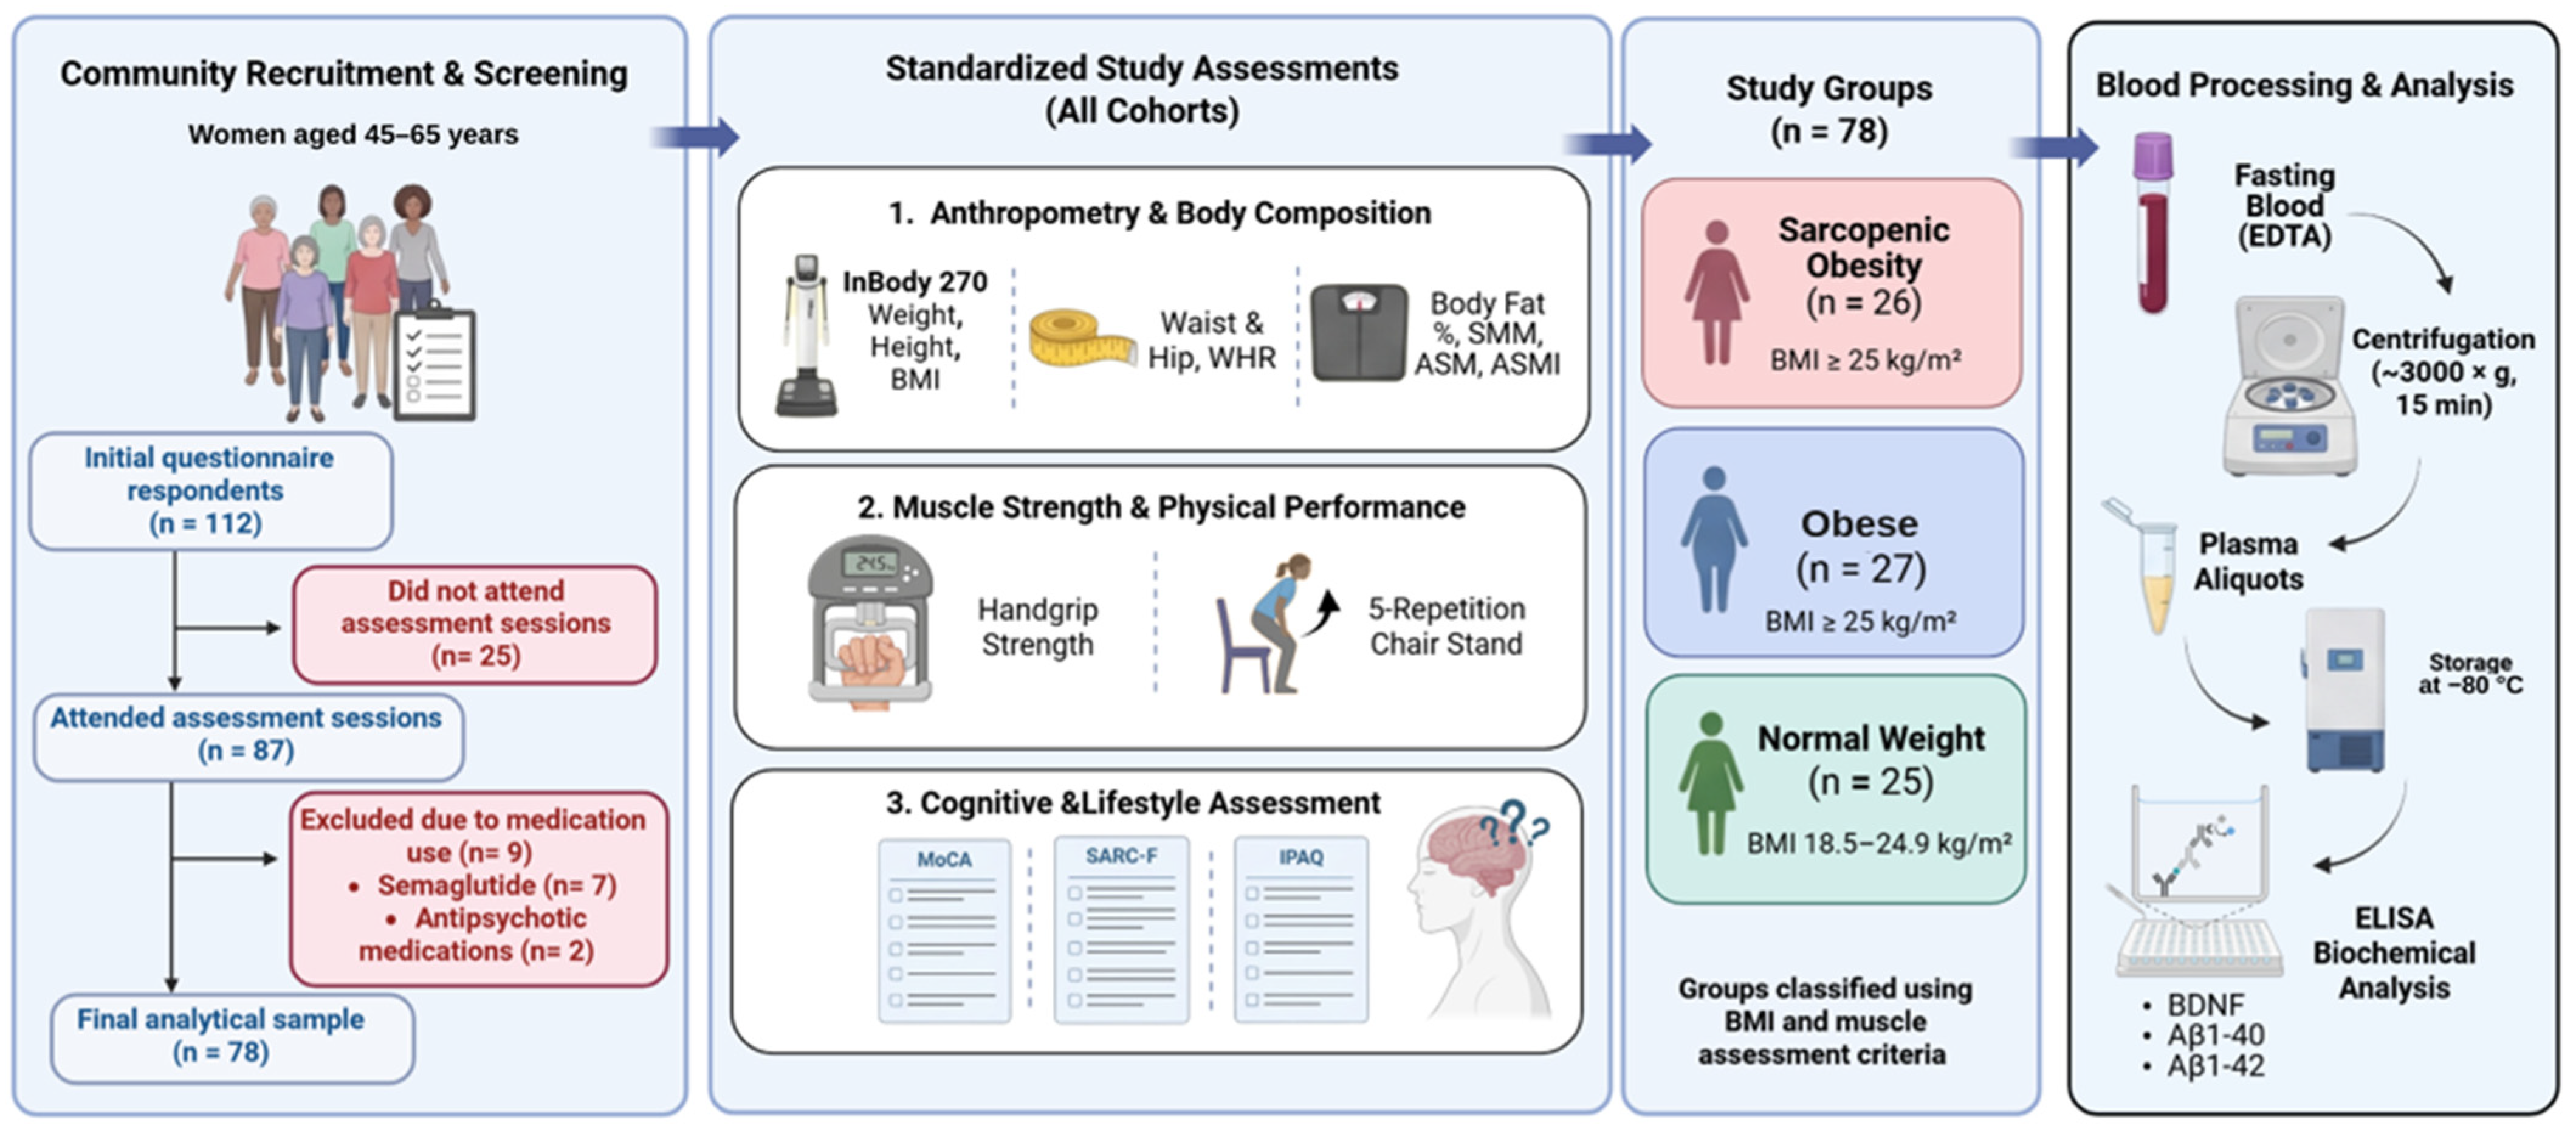
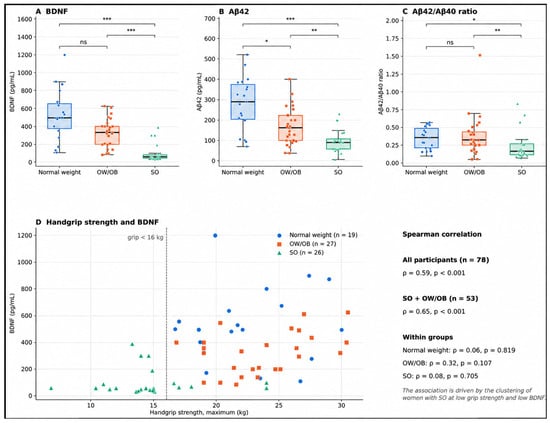
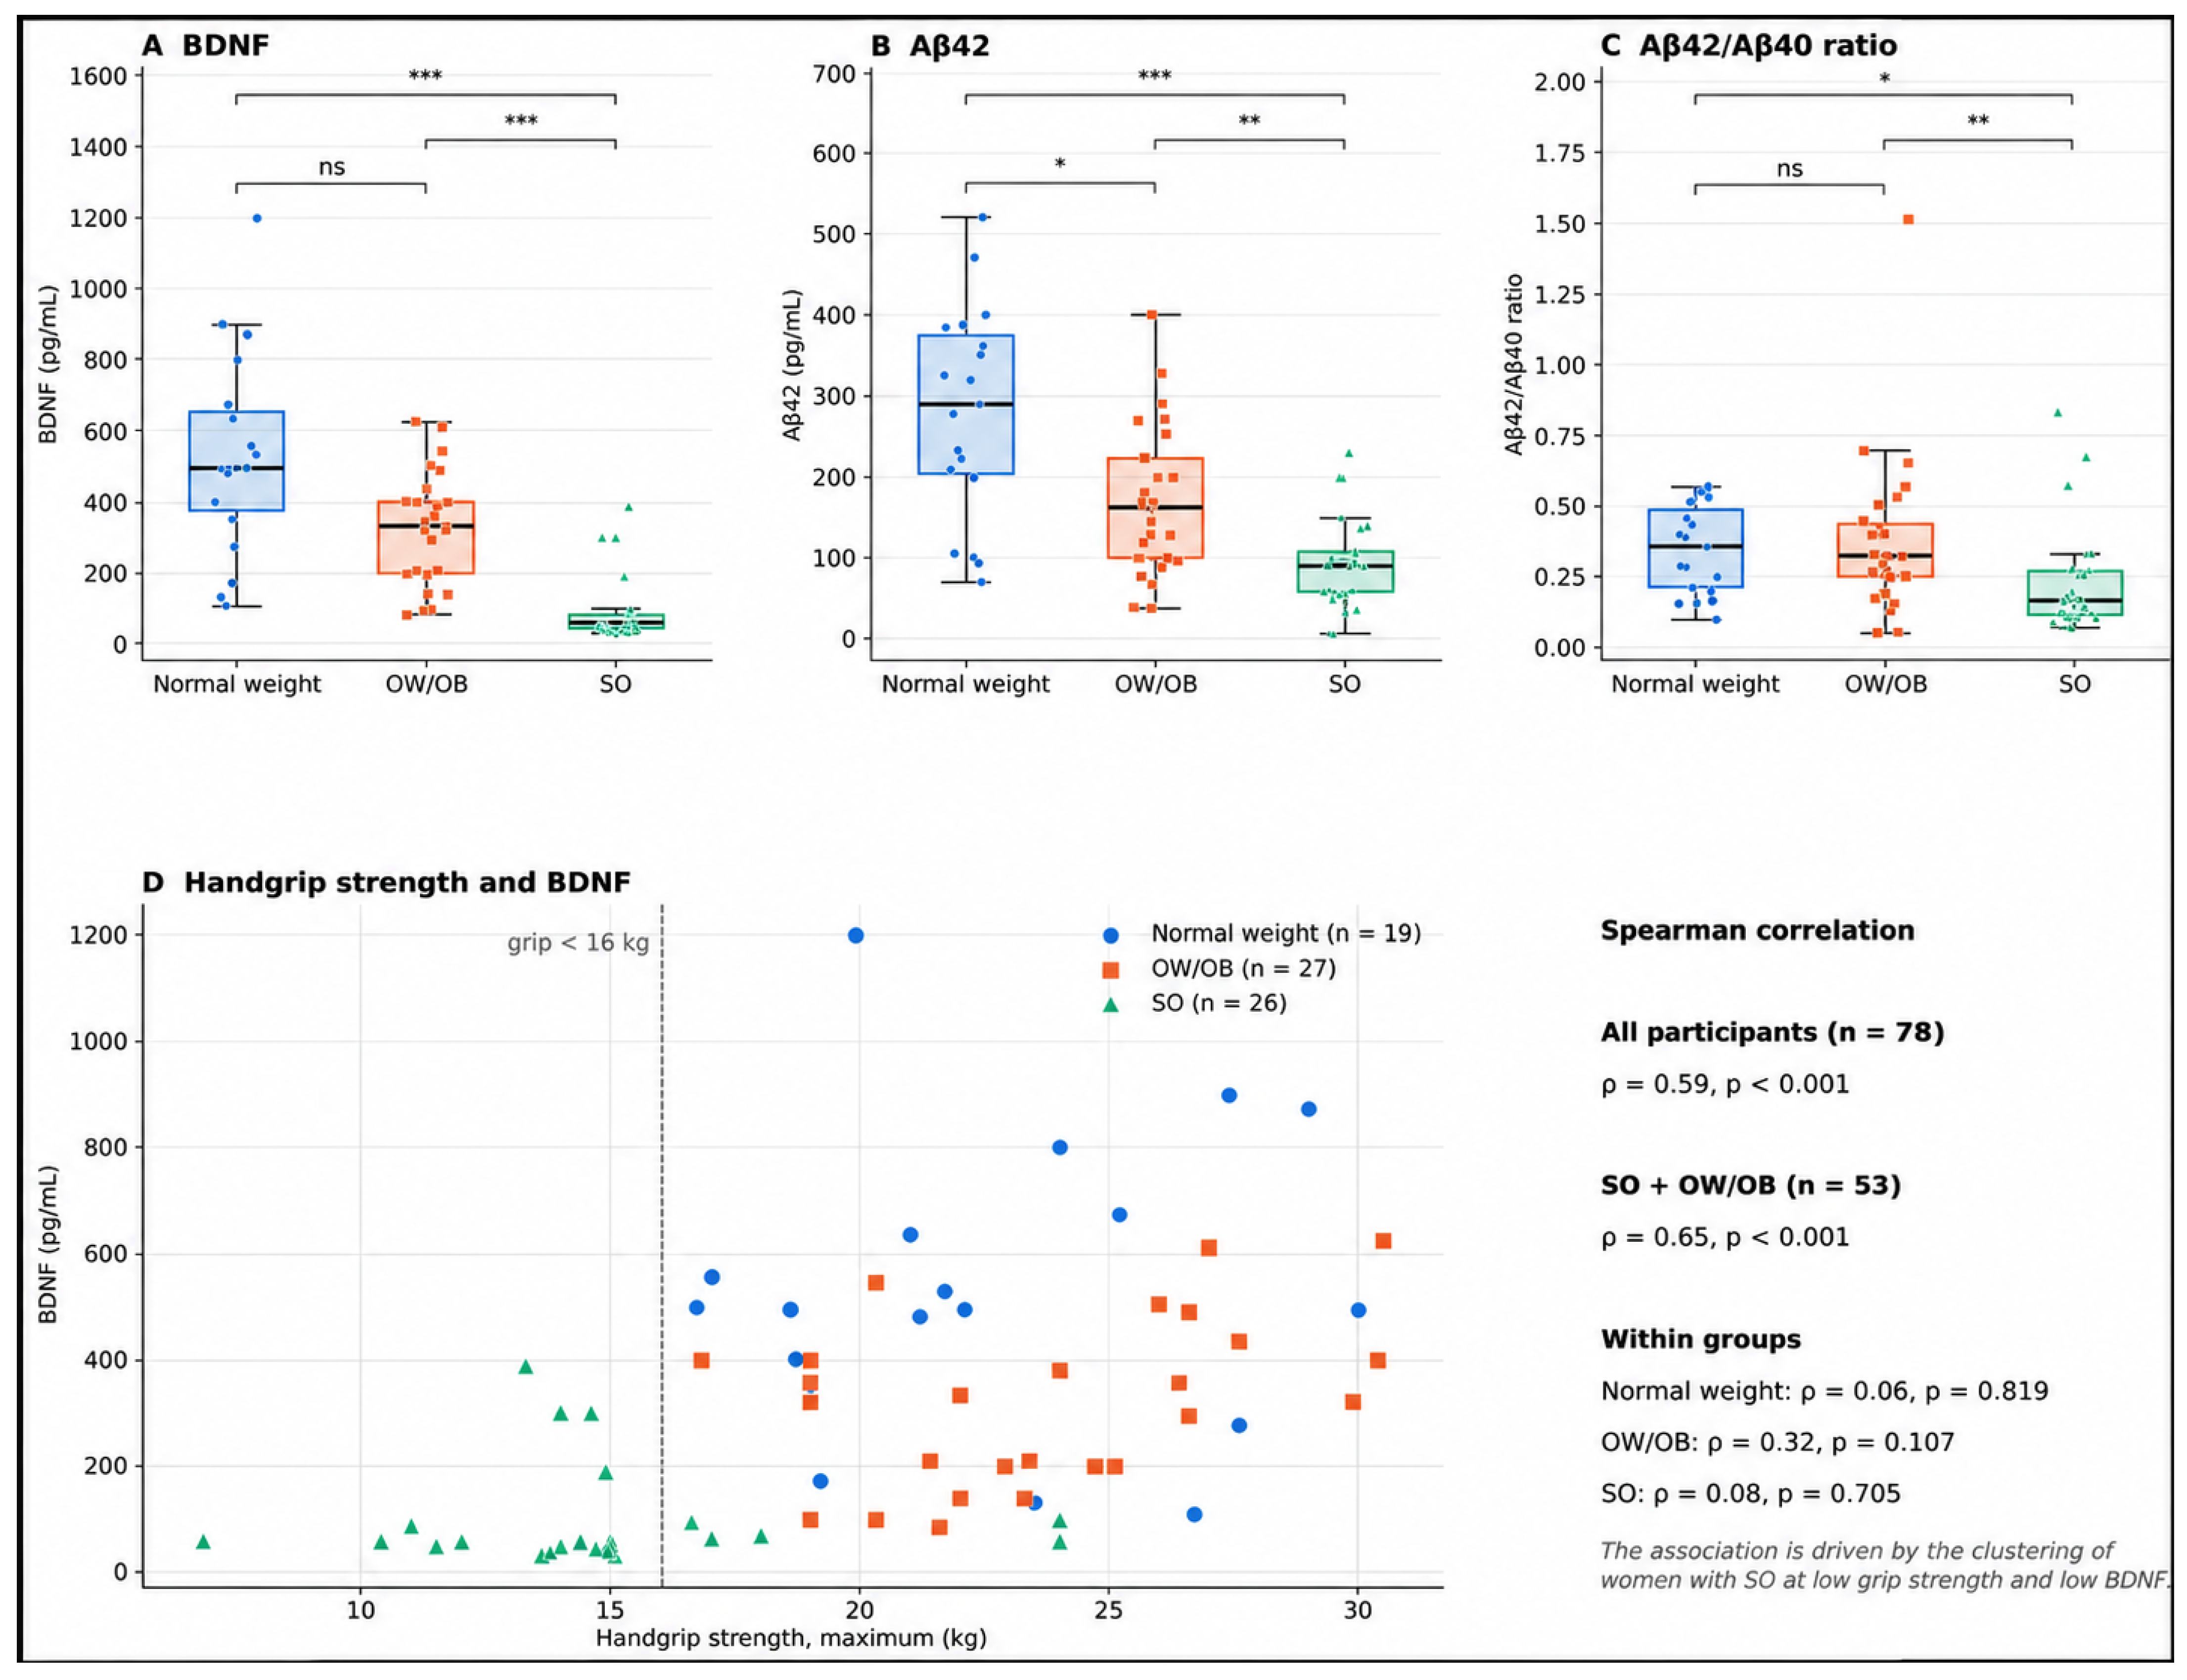

Disclaimer/Publisher’s Note: The statements, opinions and data contained in all publications are solely those of the individual author(s) and contributor(s) and not of MDPI and/or the editor(s). MDPI and/or the editor(s) disclaim responsibility for any injury to people or property resulting from any ideas, methods, instructions or products referred to in the content. |
© 2026 by the authors. Licensee MDPI, Basel, Switzerland. This article is an open access article distributed under the terms and conditions of the Creative Commons Attribution (CC BY) license.