


Abstract
This study presents a predictive modeling framework for estimating transient flow rates in PWM-driven solenoid valves. Building on a previously validated dynamic model, the proposed framework enables flow prediction under varying process conditions and valve configurations. Flow rates at fully open conditions are obtained using computational fluid dynamics (CFD) and validated experimentally. CFD analyses are further performed at partial valve openings, and the resulting data are incorporated into a numerical algorithm based on piecewise linear interpolation for prediction throughout the opening–closing cycle of the valve. The model is validated under PWM operation, and parametric analyses are conducted to examine the effects of duty ratio, period, and coil voltage. The maximum difference between the experimental and numerical results was 1.3% under fully open conditions and 2.8% under PWM operation, demonstrating good agreement across the investigated conditions. By incorporating flow characteristics at intermediate spool positions that cannot be directly measured experimentally, the proposed approach allows accurate prediction of both transient and time-averaged flow rates. This provides a computationally efficient alternative to fully coupled transient CFD simulations.
1. Introduction
Precise flow rate control is a critical issue in fuel injection systems. In addition to maintaining accurate regulation, these systems must rapidly respond to dynamically varying flow demands during operation, making proportional control essential. Among these approaches, pulse width modulation (PWM) enables precise flow regulation by adjusting the pulse width and period. Owing to its effectiveness and flexibility, PWM is widely used for fluid flow control not only in fuel injection systems but also in agriculture [1,2,3], the automotive industry [4,5,6,7], and robotics [8,9,10].
Studies focusing on dynamic behavior modeling and PWM-driven solenoids have been extensively investigated in the literature. Various experimental and numerical methods have been implemented to enhance performance and achieve more precise control of the solenoids. Taghizadeh et al. [11] carried out the modeling of a PWM-controlled solenoid valve and validated the model with experiments. Mathematical modeling was conducted on an individual basis for the electromagnetic, mechanical, and working fluid parts of the valve. As a result, the relationship between the average spool position and duty ratio for different working fluid pressures and PWM frequencies was obtained, rather than predicting the transient flow rate. Messian et al. [12] modeled the dynamic nonlinear behavior of a pneumatic actuator controlled by an on/off three-way PWM-driven solenoid valve using the Runge–Kutta method and compared the results with experimental data. As a result, the established mathematical model was verified under several working conditions with experiments. Taghizadeh et al. [13] designed a circuit and examined the effect of the circuit on PWM-controlled servo-pneumatic system linearity. Dynamic mathematical modeling of the system was performed, and the results were validated with experiments. Najjari et al. [14] conducted mathematical modeling of a PWM-based pneumatic system, performing system modeling for all subdomains such as electrical, magnetic, mechanical, and fluid. The performance of the fuzzy logic controller was tested by obtaining the relationship between position and time. Pipan and Herakovic [15] studied high-speed solenoid valves with a PWM algorithm and demonstrated their nonlinear characteristics by mass flow measurements. The effect of PWM pulse width, pressure difference, and operating frequency was investigated with a bilinear interpolation-based control approach. Gao et al. [16] suggested a new PWM-based control process for fast-switching hydraulic valves under varying pressure and frequency conditions in order to provide better dynamic performance and efficiency. Accordingly, the relationship between ball valve displacement and time was obtained for changing supply pressures. Ahn and Yokota [17] proposed a new control algorithm for on/off type solenoid valves based on the PWM technique. The variation in basic properties such as position, velocity, and acceleration versus time was investigated under varying loads. Gade and Mangrulkar [18] performed a modeling and simulation study of a pneumatic actuator including on/off solenoid valves and a PWM controller for a missile application. The model was validated with experiments, and a saving in gas consumption was achieved with the proposed PWM control method. Zhang et al. [19] studied the dynamic performance of fast-switching solenoid valves under varying working pressures. Accordingly, the mathematical model of the system was developed, and the behavior of the switching valve was investigated for different pressure values. Zhong et al. [20] investigated the most energy-efficient opening and closing voltages for high-speed solenoid valves by considering the electromagnetic and mechanical subdomains. They reported that a multi-stage driving strategy could shorten the switching time while maintaining power losses at a low level. Li et al. [21] carried out a 3D numerical simulation of the mechanical and fluid regions of a PWM-driven solenoid valve. The dynamic performance of the valve was investigated using the computational fluid dynamics (CFD) method with a dynamic mesh approach in order to characterize the spool movement. Under varying PWM duty ratios, the transient pressure and mass flow outputs were examined. Finally, the relationship between control pressure and valve opening time was obtained. Shiee et al. [22] conducted experiments to compare five common PWM schemes used to control the fluid flow in on/off solenoid valves. The operating conditions of each case were demonstrated, and a database was established for servo-pneumatic system designers. Chen et al. [23] similarly considered the mechanical and electromagnetic subdomains of a high-speed solenoid valve and performed CFD analyses using a moving-mesh approach. Unlike Zhong et al., they developed a multi-physics co-simulation model and validated it using current, pressure, and flow rate responses. Despite these advances, existing studies in the literature have not been structured around integrating CFD-derived flow rate values at discrete partial valve openings into a validated dynamic solenoid valve model to predict flow throughout a PWM cycle without directly coupling the transient spool motion to a moving-mesh CFD solution. With this approach, the need to apply moving/sliding mesh techniques for transient flow rate prediction throughout the spool motion is eliminated. As indicated above, the PWM-controlled solenoid valve was investigated through the combined use of dynamic modelling, experimental flow characterization, and CFD results obtained at full and partial valve openings. Accordingly, the present study proposes a hybrid computational approach that integrates CFD-derived flow characteristics at partial valve openings with a validated dynamic valve model [24], thereby enabling the flow rate to be predicted as a function of the instantaneous spool position. Thus, for operating conditions within the model’s validity range, the flow rate can be predicted throughout the input PWM cycle without requiring a separate experiment or transient CFD analysis for each condition.
The ability to predict instantaneous flow rates during the opening and closing of a PWM-driven valve is critically important for proportional control applications. The solenoid valve investigated in this study is intended to regulate nitrogen rather than liquid fuel in the actual application. Since the experiments were conducted using air, air was also selected as the working fluid in the CFD simulations to ensure consistency between the experimental and numerical analyses. In this study, CFD analyses were first validated experimentally under fully open conditions and subsequently extended to partial opening positions to obtain flow rate data during spool motion. These data were interpolated and integrated into a MATLAB 2020a Simulink model to enable time-dependent flow rate prediction under PWM control. Parametric analyses were conducted to investigate the effects of PWM duty ratio, PWM period, coil driving voltage, inlet pressure, and orifice diameter on the flow rate. The proposed framework provides a systematic basis for evaluating the combined influence of structural and operational parameters on transient valve flow behavior and supports proportional gas flow control applications within fuel control systems. Experimental results demonstrate the accuracy of the nonlinear model under varying PWM duty ratios. The main contribution of this study is the development of a coupled CFD–dynamic modeling framework that enables the prediction of transient and time-averaged flow rates in PWM-driven solenoid valves by incorporating flow characteristics at intermediate spool positions that cannot be directly measured experimentally.
2. Valve Characteristics for Partial Opening Conditions
In this study, CFD analyses were conducted to obtain the flow rate characteristics of the valve under partial opening conditions. The mass flow rate data obtained numerically at partial valve openings were used as input to the flow calculation algorithm. The valve opening represents the displacement of the spool, with 0% corresponding to the fully closed position and 100% to the fully open position. CFD calculations were performed at discrete spool positions.
2.1. Geometric Specifications
The detailed valve geometry and experimental configuration were presented in the preceding study [24]. To make the present study self-contained and facilitate reproducibility, the principal geometric dimensions defining the solenoid valve and computational flow domain are summarized in Table 1.
Table 1.
Geometric specifications of the solenoid valve and the computational domain.
2.2. Mesh Generation
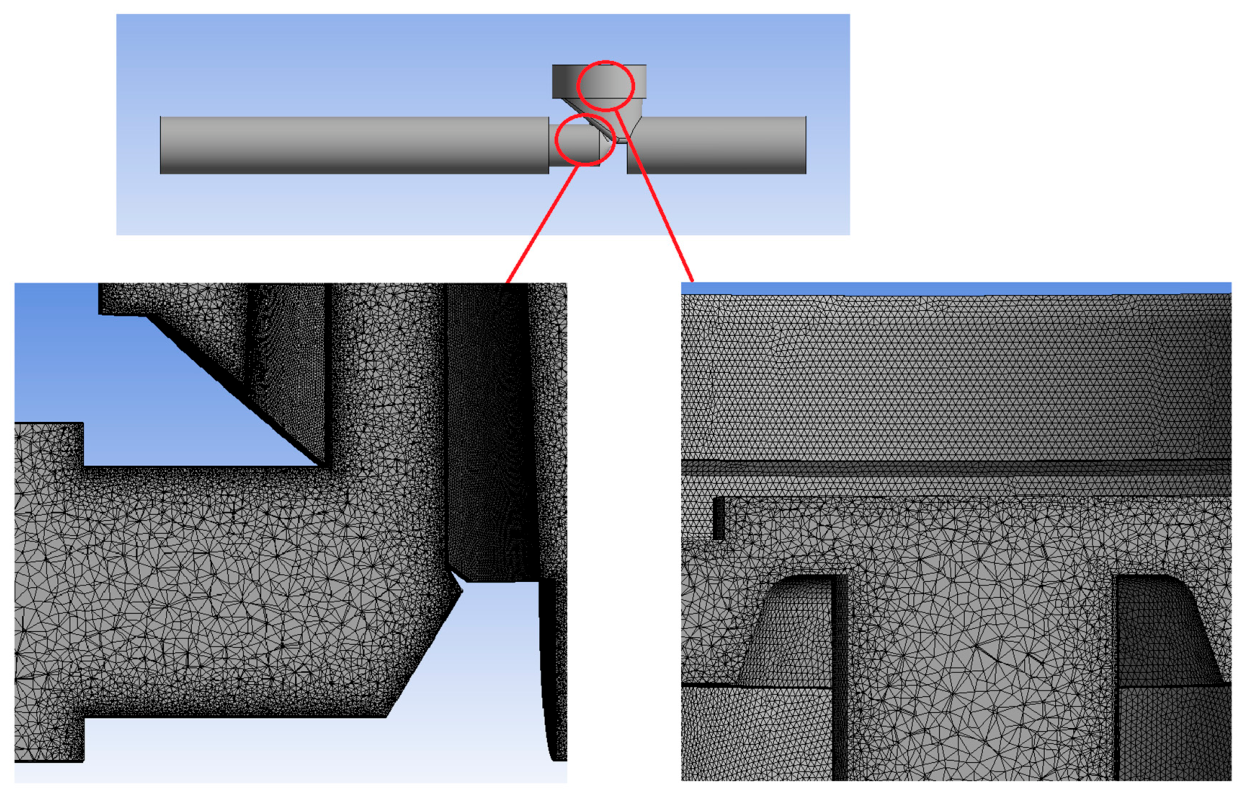
In order to carry out a 3D numerical study, an unstructured mesh composed of tetrahedrons is generated within the computational domain. However, ten layers of inflation are adopted due to the near-wall treatment requirement for capturing high gradients in the boundary layer region. Furthermore, the computational domain is extended from the inlet and outlet regions to ensure flow stability and convergence. Figure 1 demonstrates the mesh structure and required details within the computational domain.
Figure 1.
Mesh details of the solenoid valve.
The numerical results can be highly dependent on the mesh density of the computational domain. Accordingly, three different types of mesh schemes are generated: coarse, medium, and fine. The details of the mesh schemes and variations of the results are presented in Table 2.
Table 2.
Mesh independence study.
The mesh independence study was conducted for the valve with a 1 mm orifice diameter in the fully open position, using inlet and outlet boundary conditions of 1 bar total gauge and 0 bar gauge, respectively. Since mass flow rate is the quantity used in the flow calculation algorithm, its variation with mesh refinement was taken as the primary criterion for assessing mesh independence.
Inlet pressure and outlet pressure boundary conditions are implemented at the inlet and outlet boundaries of the computational domain within the study. Accordingly, the mass flow rate of the system is computed as a capacity indicator. When the mesh scheme is switched from coarse to medium, a 4.07% variation is observed in the mass flow rate. Due to this significant variation, it is assumed that the mesh-independent solution is not achieved with the coarse scheme, and further investigation is conducted with a fine mesh scheme. The results showed that only a 0.35% variation was observed in the mass flow rate, even though the total number of elements nearly doubled. As a result, the medium mesh scheme with 14,977,637 elements was selected for numerical simulations. The element sizes for the valve and the extended domain were 0.08 mm and 0.8 mm, respectively. Additionally, ten inflation layers with a 10−3 mm first layer thickness were applied for turbulence modeling. The same mesh generation strategy and near-wall treatment were applied to all investigated spool positions and operating conditions.
2.3. Turbulence Modeling
The Shear Stress Transport (SST) k-ω turbulence model was implemented within the computational domain due to its success in predicting swirling flows and its suitability for simulating fluid flow in solenoid valves [25,26,27]. The transport equations for turbulence kinetic energy (k) and specific dissipation rate (ω) are as follows:
Further details of the variables and constants are presented in the literature [28,29].
2.4. Boundary Conditions and Solution Methodology
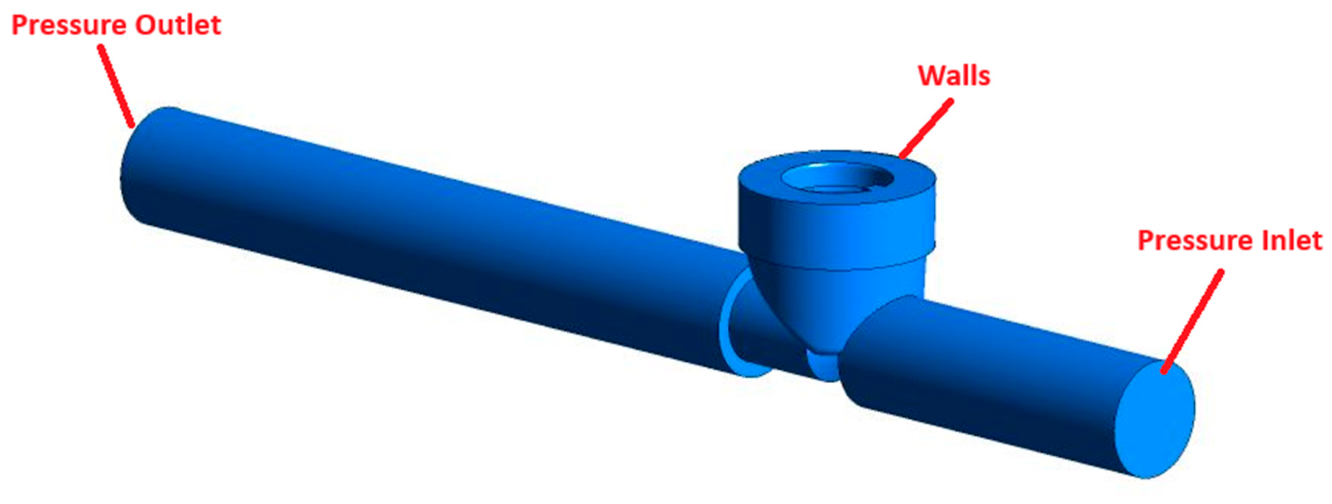
Pressure inlet and pressure outlet boundary conditions are specified at the inlet and outlet boundaries of the computational domain. The inlet total gauge pressure is set to 1, 2, 3, and 4 bar, while the outlet pressure is set to a static 0-bar gauge because the valve discharges to the atmosphere. Air is modeled using the ideal gas approximation to account for pressure-dependent density variations, and the energy equation is solved to account for the associated thermal effects. A pressure-based solver is employed for the numerical solution. As shown in Figure 2, pressure inlet and pressure outlet boundary conditions are specified at the inlet and outlet boundaries of the computational domain.
Figure 2.
Boundary conditions.
3. Details of the Flow Rate Calculation Algorithm
This section describes the computational framework used to determine the time-dependent flow rate of the solenoid valve under varying operational and structural parameters. Under PWM operation, knowledge of the fully open flow rate alone is insufficient to determine the transient flow through the valve because the spool continuously traverses intermediate positions during opening and closing. Moreover, the effective flow area, and consequently the flow rate, does not necessarily vary proportionally with normalized spool displacement. Therefore, CFD analyses were performed at discrete partial spool positions to establish position-dependent flow characteristics for each valve configuration. Flow rates between the CFD-calculated positions were estimated using piecewise linear interpolation and incorporated into the time-dependent flow calculation algorithm. For an instantaneous spool position x between two adjacent CFD-calculated positions xi and xi+1, the mass flow rate is calculated as
where i and i+1 denote the CFD-derived mass flow rates at the adjacent spool positions xi and xi+1, respectively. The CFD-derived mass flow rate values used as interpolation nodes are summarized in Table 3 for all investigated orifice diameters, inlet pressures, and spool positions.
Table 3.
CFD-derived mass flow rates at discrete spool positions.
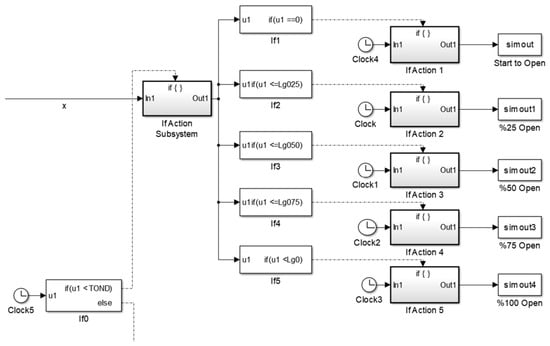
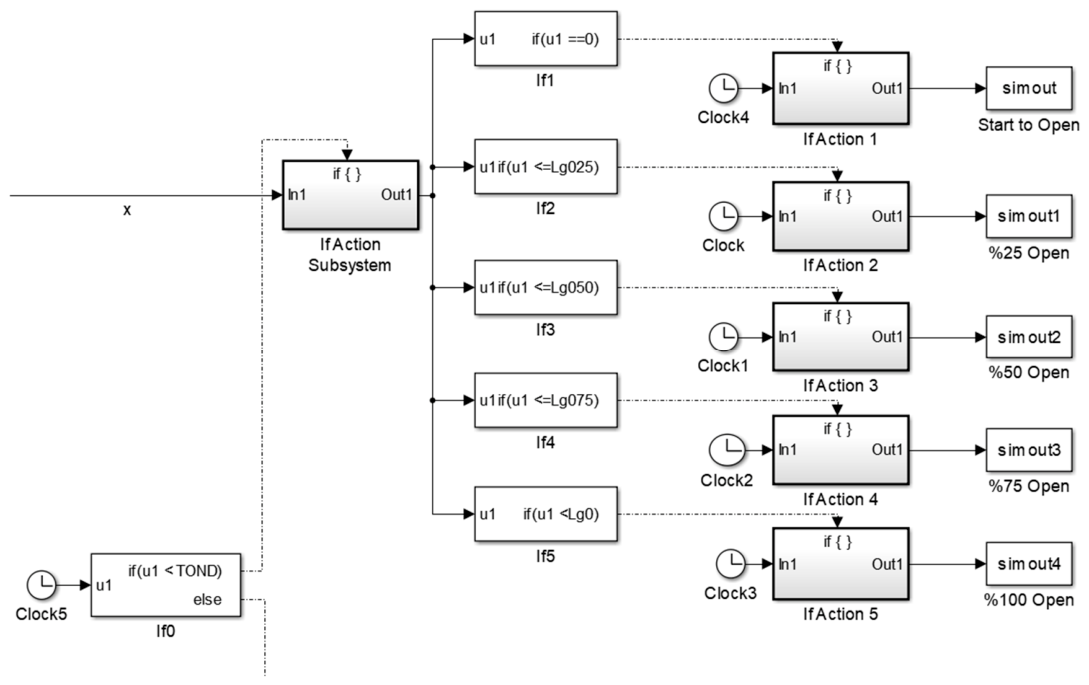
The spool position monitoring algorithm distinguishes between the opening and closing phases based on the PWM signal. The position–time relationships of the spool during valve opening and closing were obtained using the previously validated dynamic valve model presented in Part I [24]. During the opening phase, the elapsed time is compared with the applied PWM pulse width to determine the instantaneous valve position. The logical structure of this decision-making mechanism is illustrated in Figure 3.
Figure 3.
Valve opening subsystem block diagram.
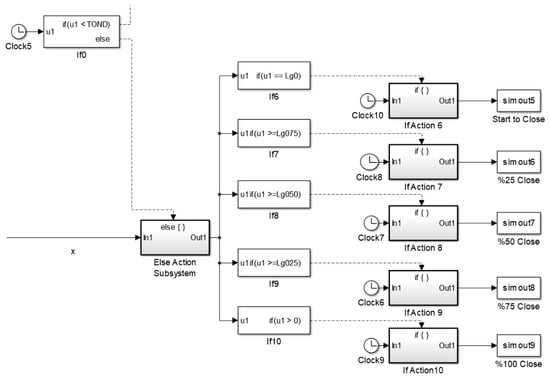
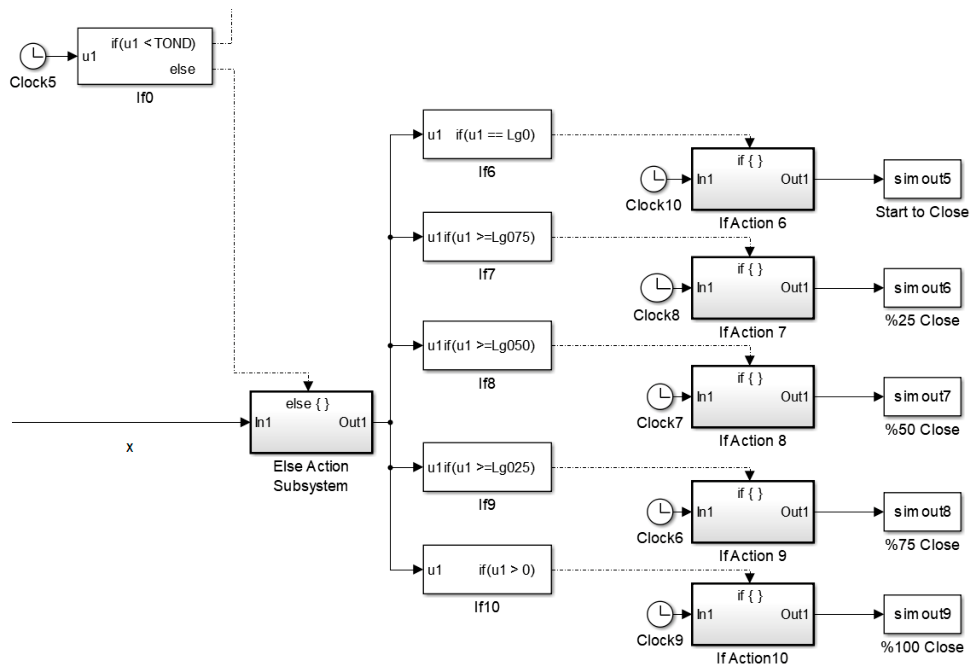
Conversely, when the PWM signal switches to the closing phase, the algorithm tracks the spool return motion using predefined position–time relationships. The corresponding decision structure for the closing phase is presented in Figure 4.
Figure 4.
Valve closing subsystem block diagram.
In the algorithm, the PWM signal generator supplies the voltage at the specified PWM period and duty ratio. The algorithm then determines the instantaneous spool position according to the position–time relationship. If the spool position is zero, the solenoid valve is closed, and the flow rate is zero; if the spool displacement reaches the maximum stroke, the valve is fully open. During the spool motion from the closed position to the fully open position, or from the open position to the fully closed position, CFD calculations were performed for the mass flow rates at partial openings. These CFD analyses were carried out at 25%, 50%, 75%, and 100% openings, and the mass flow rates at intermediate openings were calculated using piecewise linear interpolation. This process was repeated throughout the PWM cycle in the algorithm, and the total mass was calculated by integration. The total mass was then divided by the PWM period to obtain the average mass flow rate. The calculated mass flow rates were converted to volume flow rates for comparison with the experimental measurements and presentation of the results.
4. Validation of the CFD Study and Flow Rate Algorithm
The validation of the proposed methodology was carried out in two stages. First, the CFD results under fully open valve conditions were verified against experimental data. Subsequently, the CFD-derived flow data were embedded in the flow rate prediction algorithm and validated against experiments under PWM operation. A mathematical model of the solenoid valve was developed, and the valve characteristics were obtained and validated through experiments. To determine the flow rate through the valve during operation, the flow rates corresponding to both fully and partially open positions must be known.
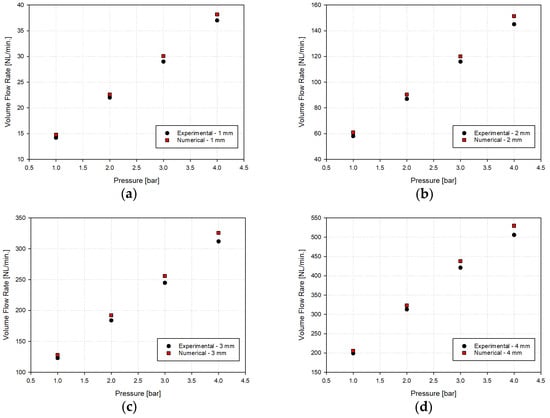
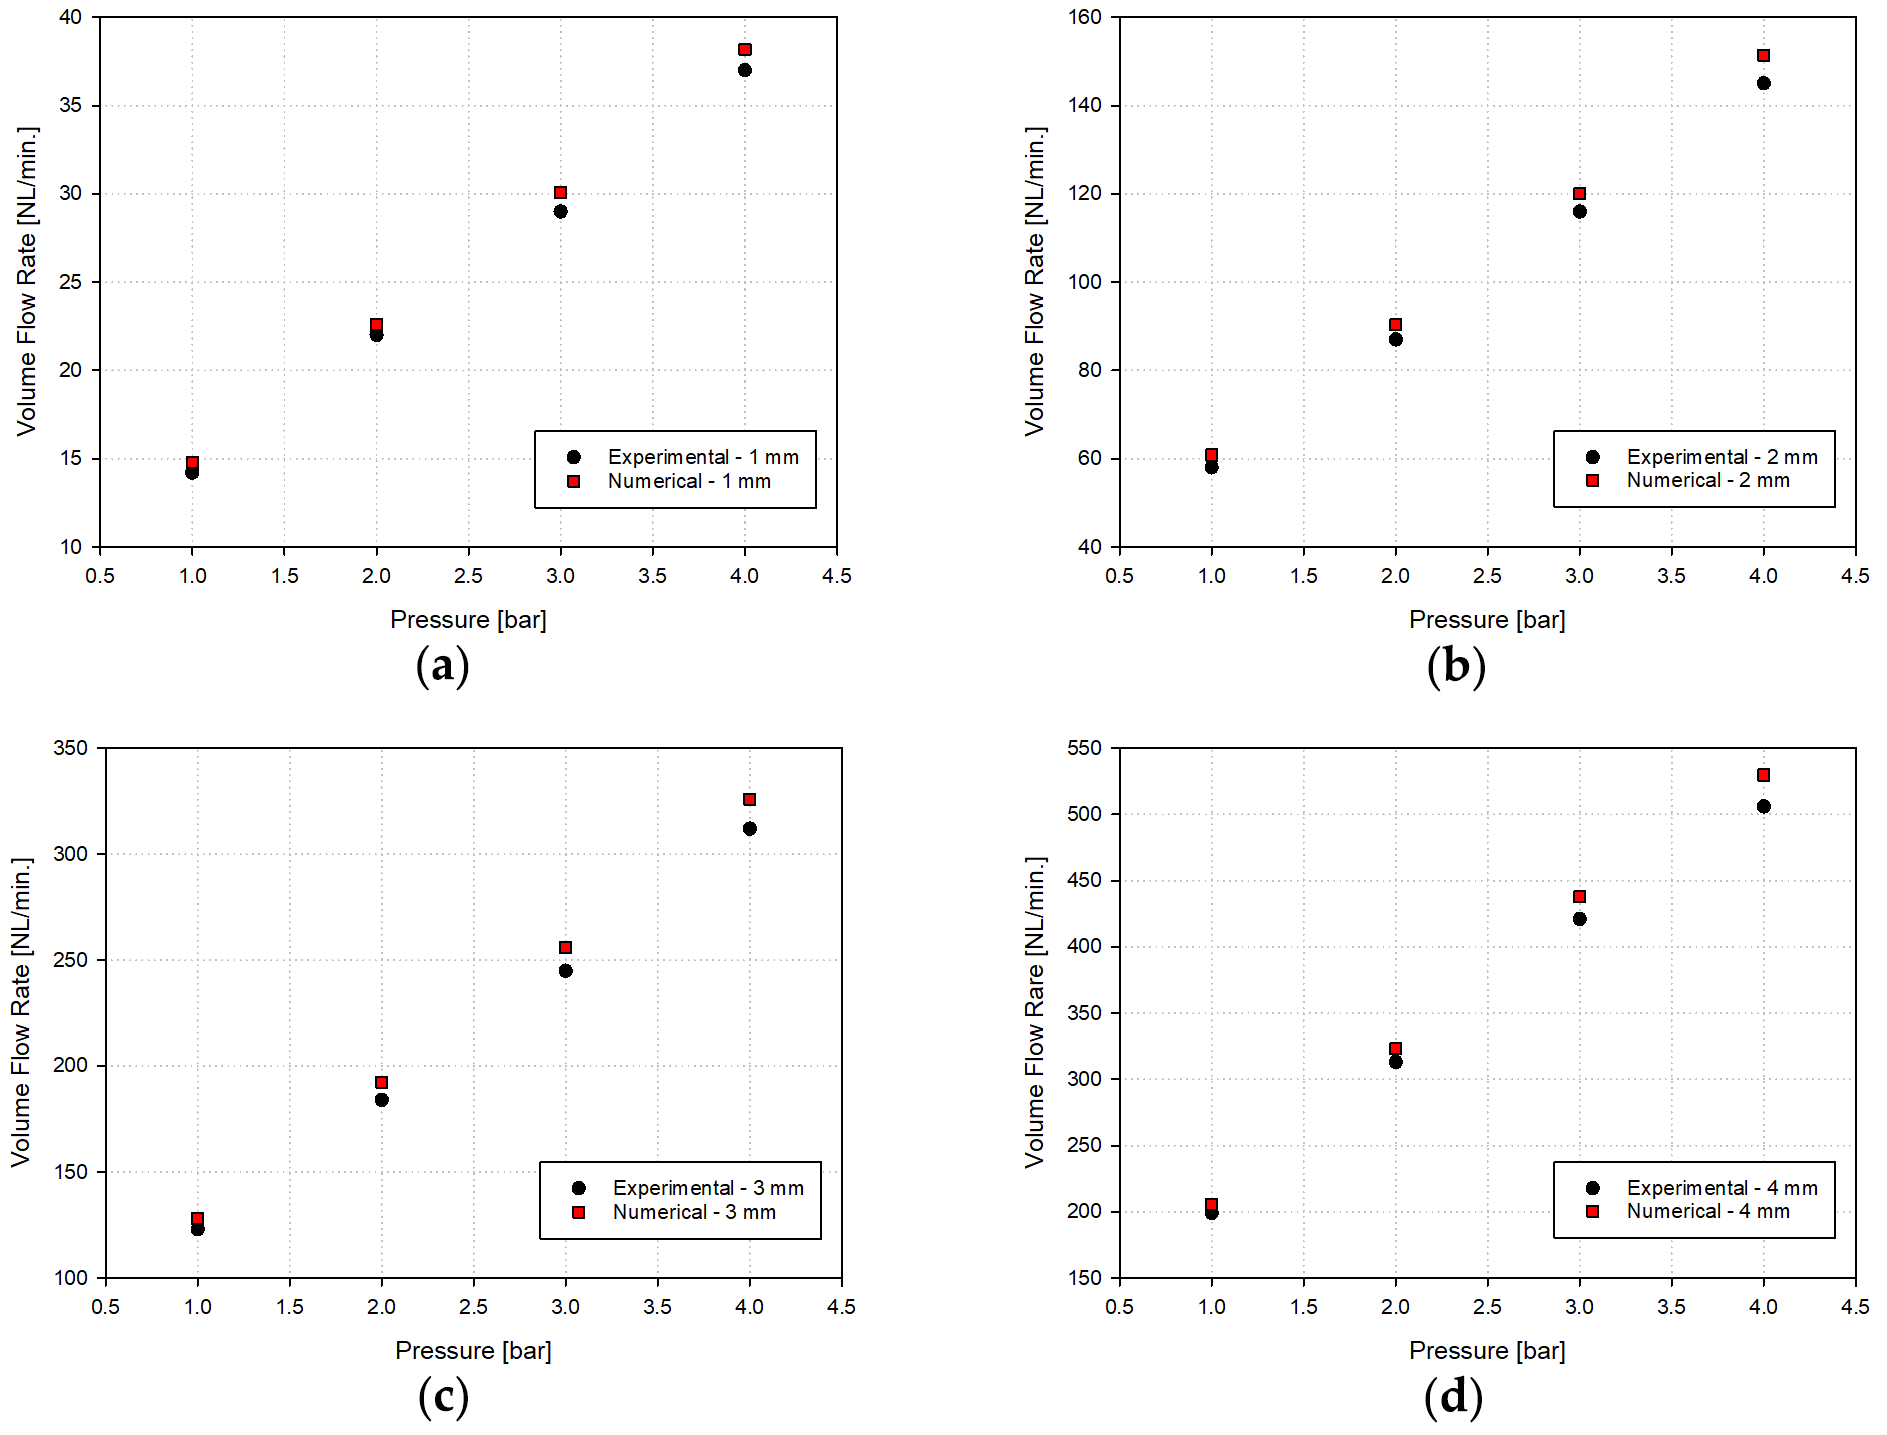
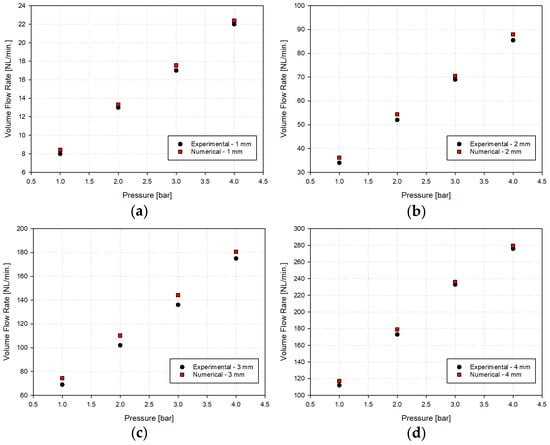
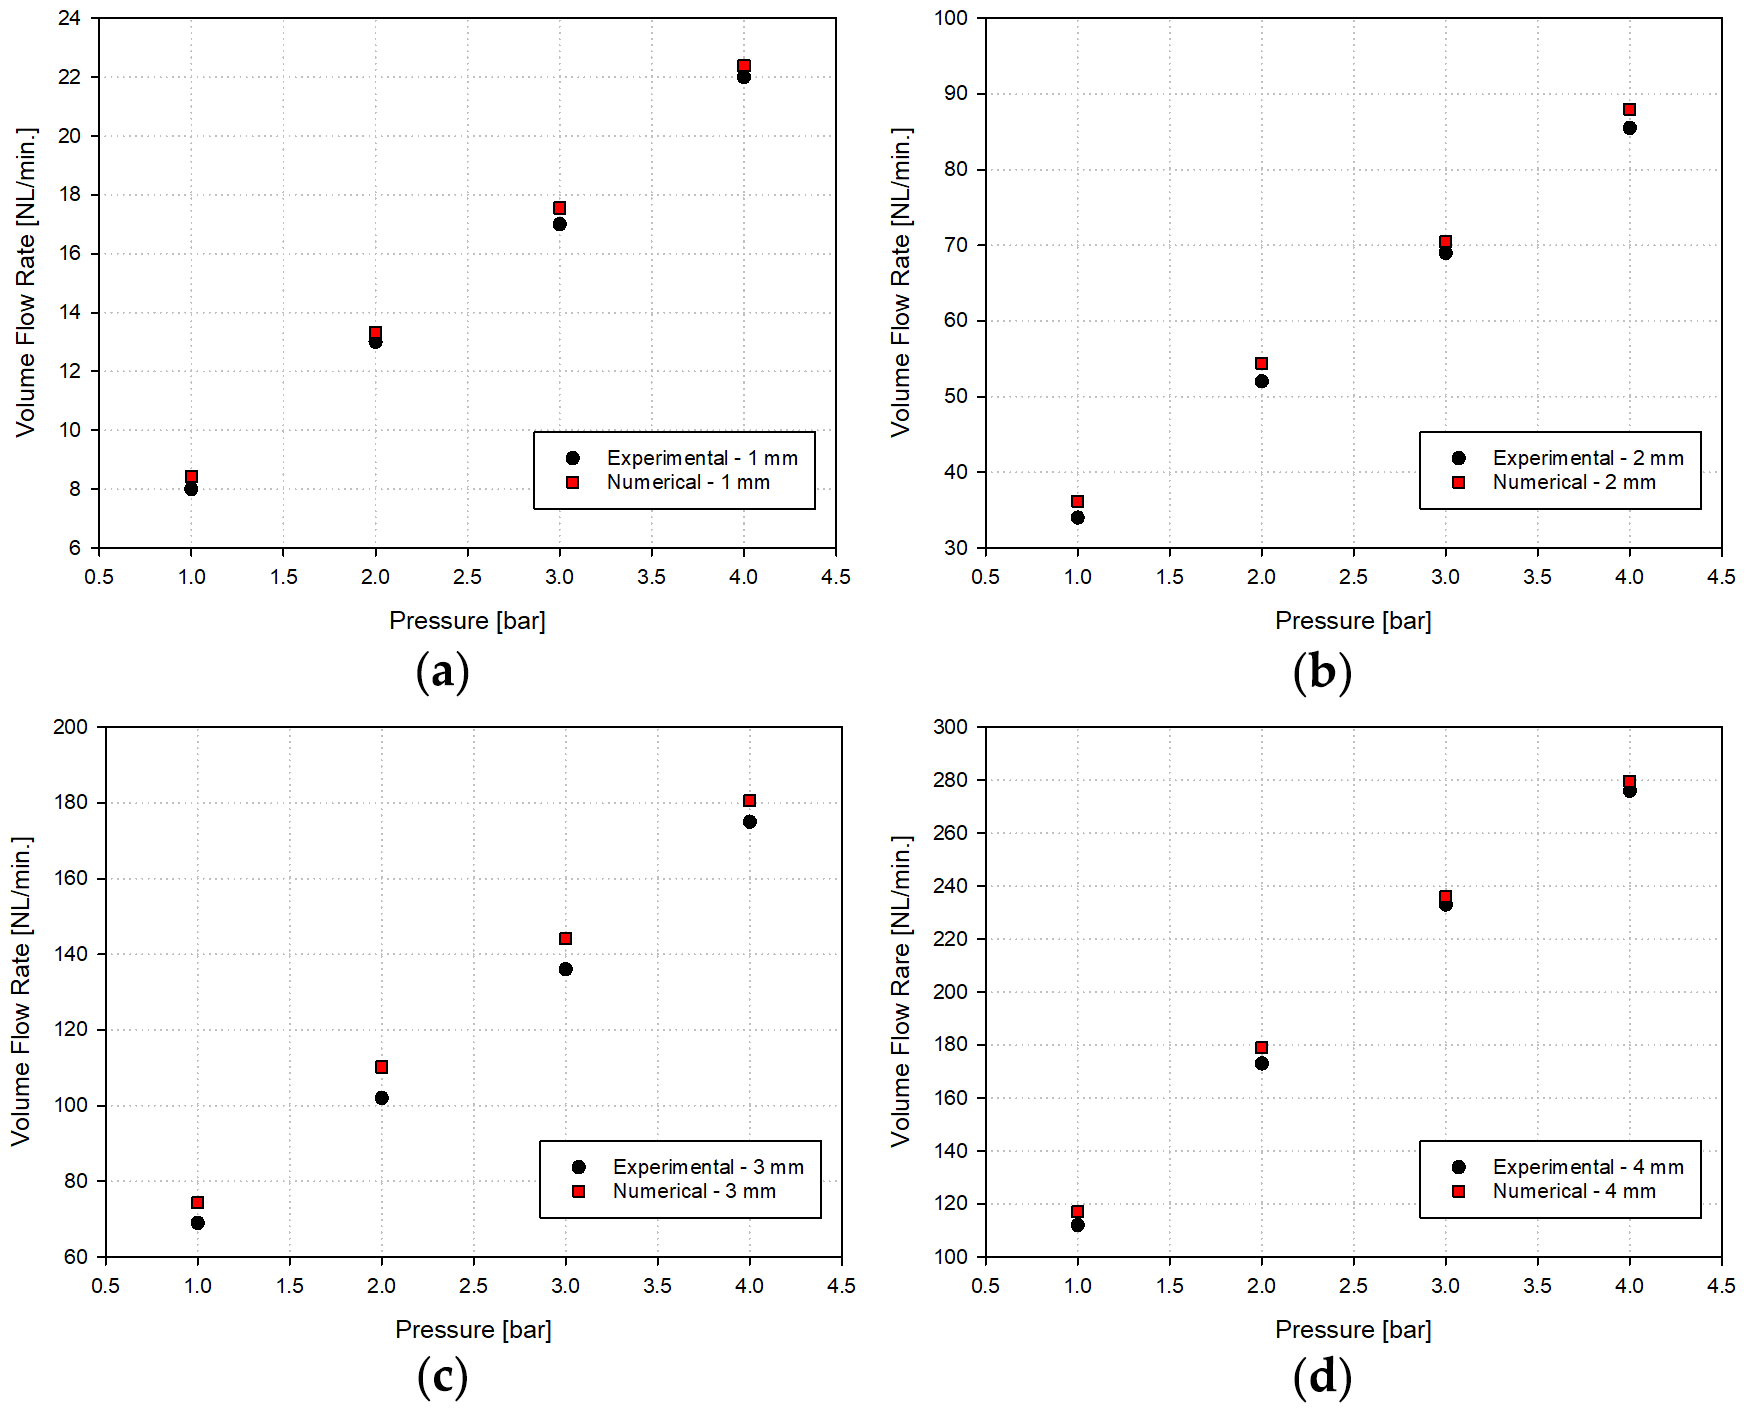
In addition to CFD analyses under fully open conditions, further simulations were conducted with the spool at partial openings. To ensure accurate flow rate control, the CFD results must be validated. This was done in two stages, beginning with a comparison of experimental and numerical flow rate values for the fully open condition. The volume flow rate was measured using a SUTO S418 thermal mass flow meter and reported in normal liters per minute (NL/min), referenced to 25 °C and an absolute pressure of 1 atm, with a manufacturer-specified accuracy of ±(1.5% of reading + 0.3% of full scale) and a repeatability of ±0.5% of reading. The inlet pressure was monitored using a Pakkens MG063 pressure gauge with a measurement range of 0–6 bar and an accuracy class of CL 2.5, corresponding to a maximum measurement uncertainty of ±0.15 bar. These measurement uncertainties were considered when evaluating the agreement between the experimental and numerical results. The results are shown in Figure 5.
Figure 5.
Comparison of experimental and numerically obtained valve characteristics under fully open conditions for varying orifice diameters: (a) 1 mm, (b) 2 mm, (c) 3 mm, and (d) 4 mm.
Figure 5 illustrates that the results of the experimental and numerical studies for the fully open condition of the valve are highly consistent. For example, the maximum difference between the experimental and numerical results was calculated to be 1.3% for a 4 mm orifice diameter and an inlet pressure of 4 bar.
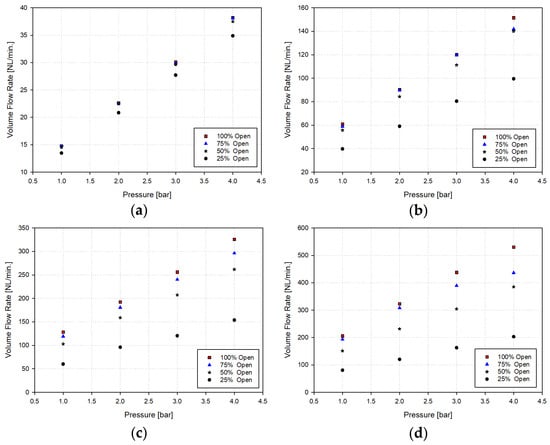
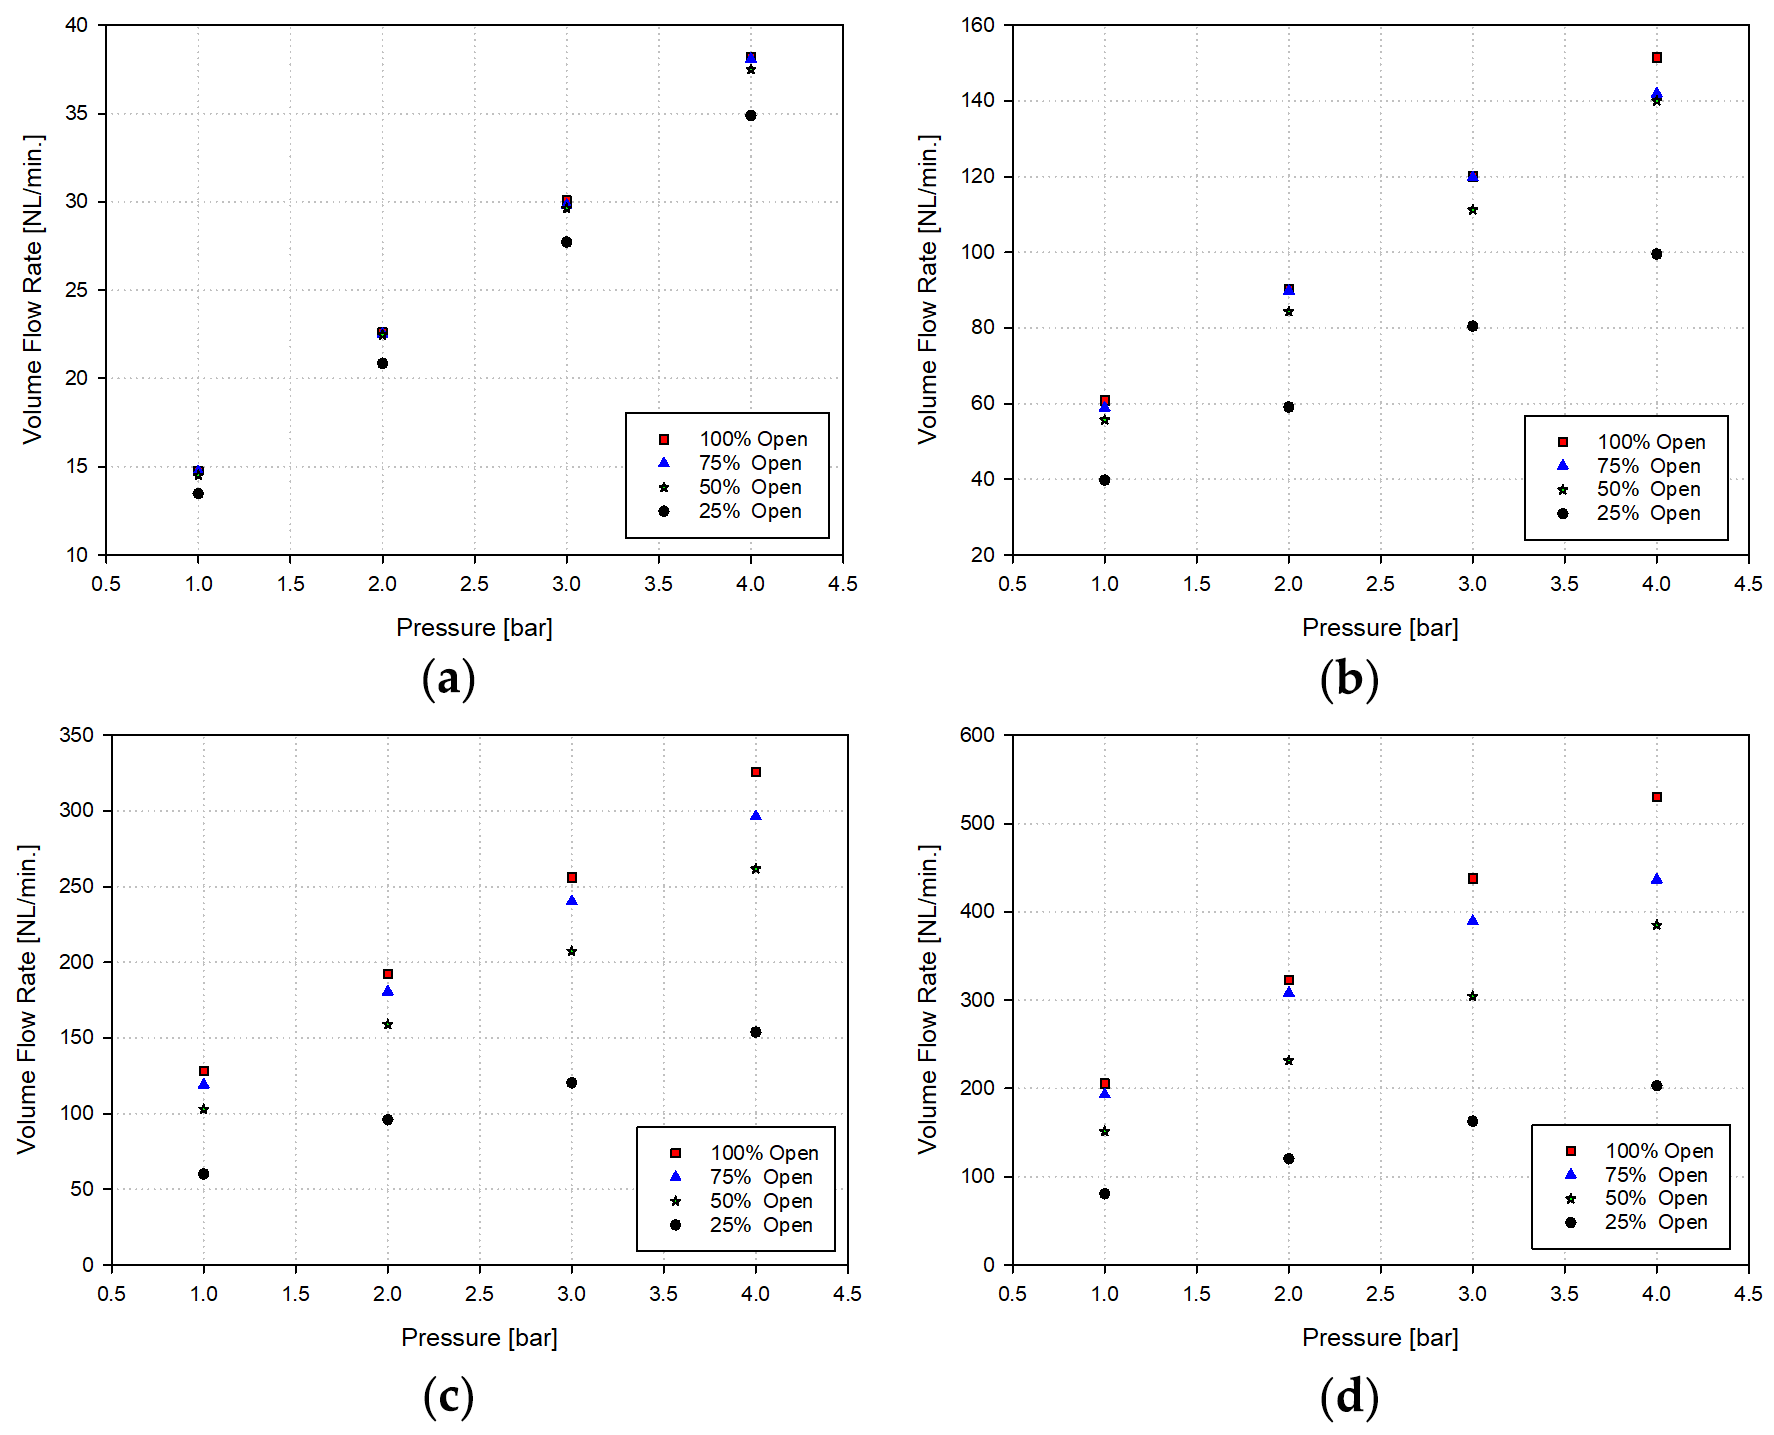
The second validation stage evaluates the accuracy of the flow rate prediction under PWM operation. Therefore, CFD studies were used to understand the valve’s behavior under partially open conditions. Figure 6 presents the numerically obtained flow rates for valves with orifice diameters ranging from 1 mm to 4 mm at various inlet pressures, under fully open and 75%, 50%, and 25% partial openings.
Figure 6.
Numerically obtained valve characteristics under fully and partially open conditions for various orifice diameters: (a) 1 mm, (b) 2 mm, (c) 3 mm, and (d) 4 mm.
In the valve with a 1 mm orifice diameter, a noticeable decrease in flow rate was observed only at the 25% opening, especially under high inlet pressure conditions. When the orifice diameter was 2 mm, a significant decrease in flow rate was again observed at the 25% opening. As the orifice diameter increased to 3 mm, a meaningful decrease in flow rate could still be observed even at the 50% opening. In the valve construction with a 4 mm orifice diameter, a significant flow rate reduction was observed at 75% openings, especially at inlet pressures above 3 bar. The corresponding CFD-derived mass flow rate values are used as the dataset for determining the flow rate through the valve at any spool position during operation. Since the flow rates at fixed intermediate spool positions cannot be directly measured during the rapid valve motion, the second validation stage was performed for the complete flow rate prediction framework under PWM operation. For this purpose, experimental flow rate values were obtained for solenoid valves with orifice diameters ranging from 1 mm to 4 mm, operated at inlet pressures between 1 and 4 bar, driven with a 50% PWM duty ratio, 0.1 s period, and 24 VDC. For the same operating conditions, the numerical flow rates presented in Figure 7 were obtained using the time-dependent flow calculation algorithm described in Section 3. A comparison of the numerical and experimental results is shown in Figure 7.
Figure 7.
Comparison of experimental and numerical valve characteristics under a 50% PWM duty ratio and a 0.1 s period for different orifice diameters: (a) 1 mm, (b) 2 mm, (c) 3 mm, and (d) 4 mm.
For the 1 mm orifice diameter, the maximum difference between the experimental and numerical results was calculated as 1.7% at an inlet pressure of 4 bar, while this difference reached its highest value of 2.8% for the 4 mm orifice diameter at the same inlet pressure. These results further demonstrate the suitability of the conducted CFD studies and the accuracy of the applied numerical method.
The full-scale flow rate of the SUTO S418 flow meter used in this study is 1000 NL/min. Since the maximum flow rate measured with this flow meter was 272 NL/min, the measurement uncertainty was calculated as ±7.08 NL/min [±(1.5% of reading + 0.3% of full scale)]. This corresponds to ±2.60% of the measured flow rate. This indicates that the 1.3% difference calculated under the fully open valve condition falls within the measurement uncertainty range, whereas the 2.8% difference calculated under PWM operating conditions is very close to this uncertainty value.
5. Results and Discussion
During the operation of the solenoid valve, operating conditions such as inlet pressure and coil voltage, as well as structural features like orifice diameter, directly affect the flow rate passing through the valve. In addition, the PWM duty ratio and the length of the PWM period, which are used for precise flow control, also emerge as parameters that influence the flow rate. For this purpose, the effects of these variables on the valve characteristics will be investigated.
From a physical perspective, the flow rate is determined by the spool position, which results from the interaction of electromagnetic, hydraulic, and spring forces. Changes in PWM parameters affect not only the valve’s opening and closing times but also the transient force balance. Consequently, the spool position and, therefore, the instantaneous flow area are directly influenced. The effects of the PWM duty ratio, PWM period, and coil voltage on the valve characteristics will be investigated both individually and simultaneously.
5.1. Effect of PWM Duty Ratio
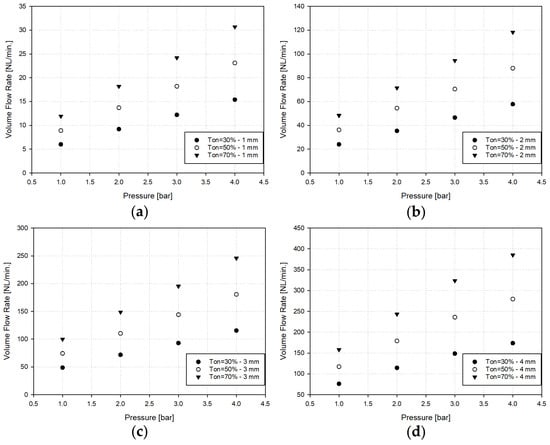
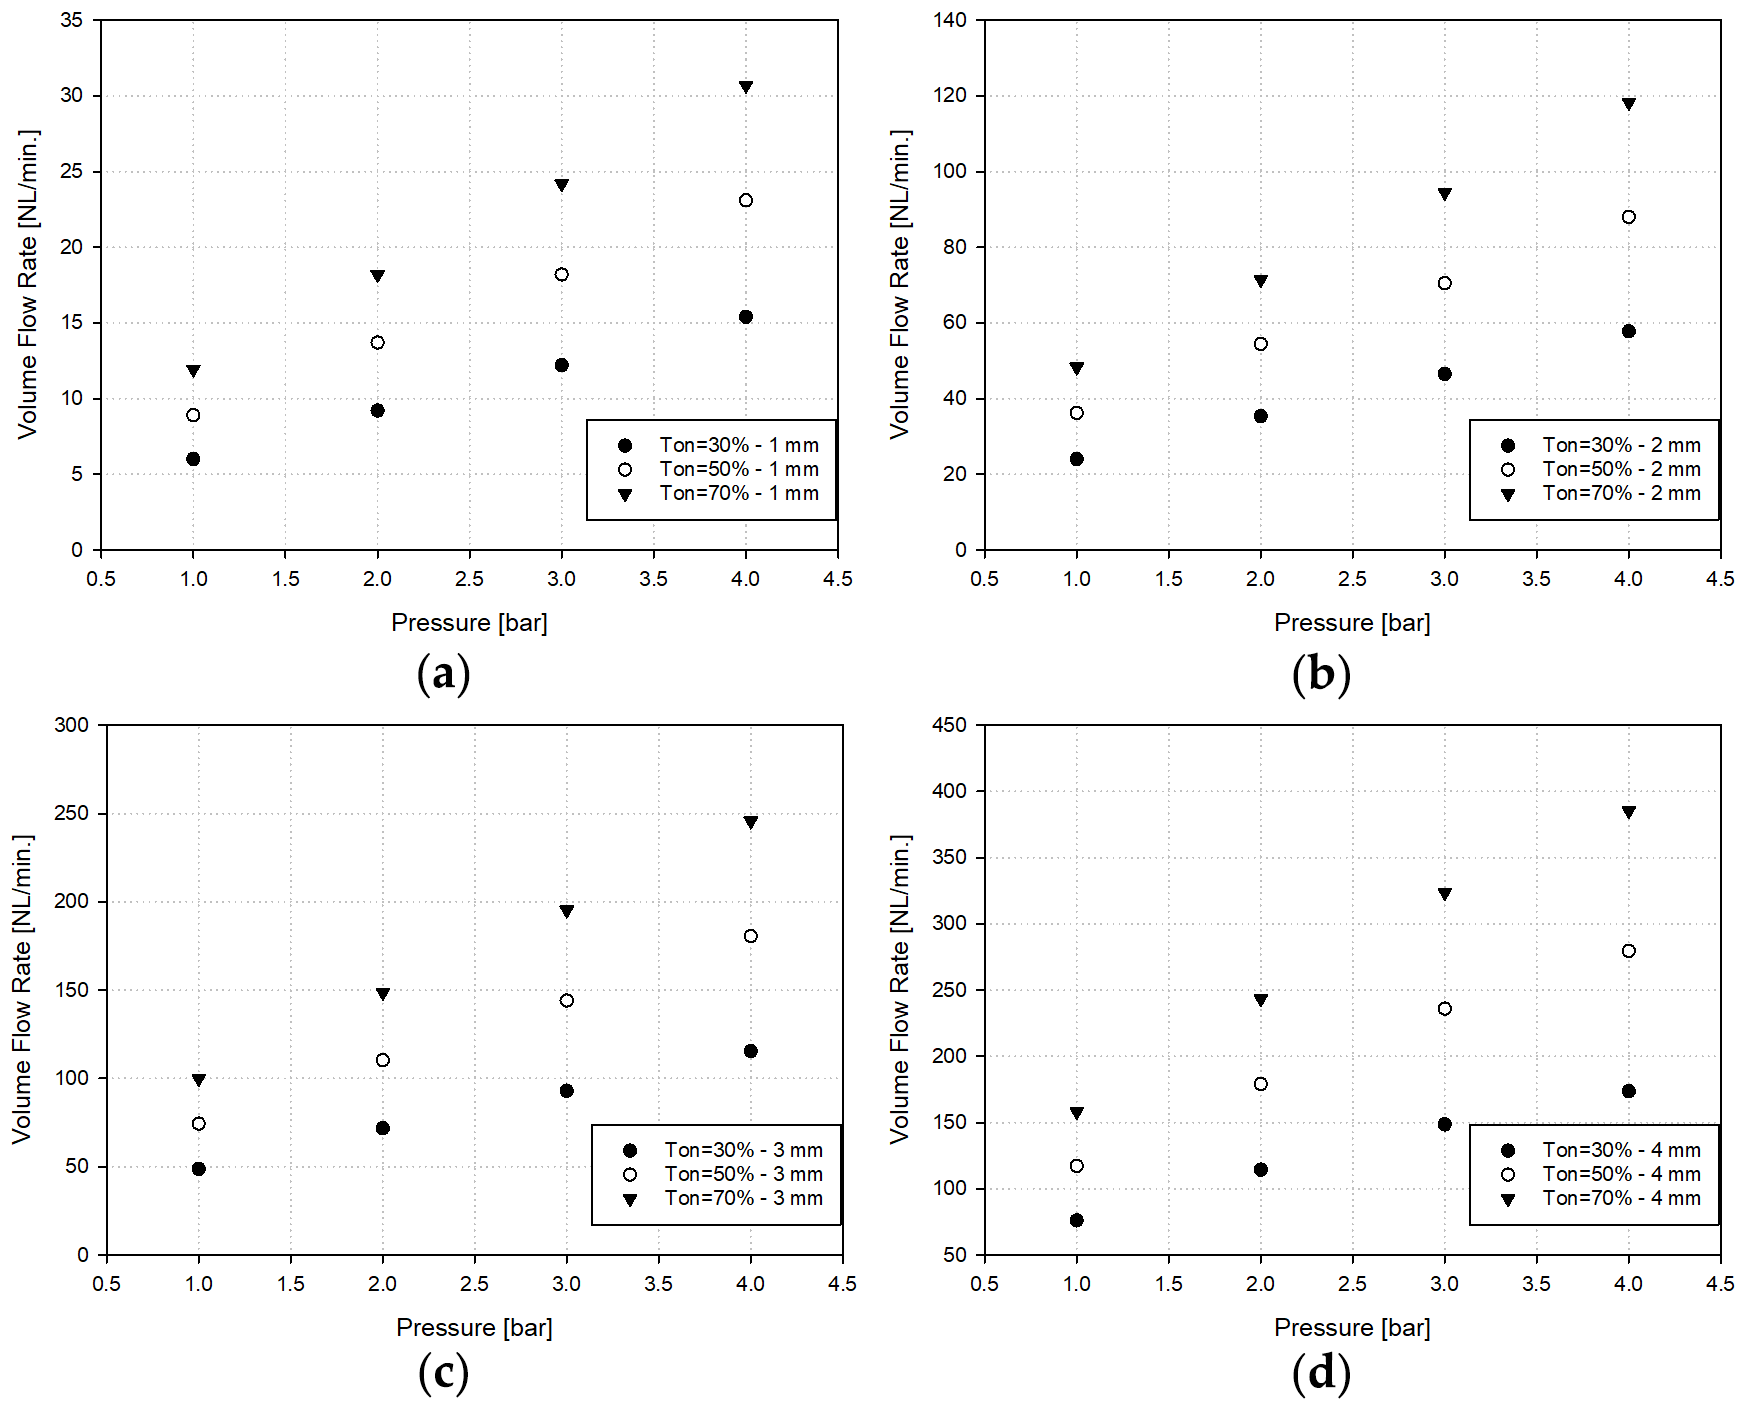
It is clear that the PWM duty ratio is a parameter that directly affects the flow rate through the valve. This is because the longer the valve remains open, the greater the flow rate through it will be. However, in order to examine how the flow rate changes with different PWM duty ratios, the flow rates were calculated for valves with orifice diameters ranging from 1 mm to 4 mm, driven with PWM duty ratios of 30%, 50%, and 70% for a period of 0.1 s. The results are shown in Figure 8.
Figure 8.
Effect of PWM duty ratio on volume flow rate under varying inlet pressure conditions for different orifice diameters: (a) 1 mm, (b) 2 mm, (c) 3 mm, and (d) 4 mm.
As seen in the figure, for a constant PWM duty ratio, the flow rate increases approximately linearly with increasing inlet pressure. This trend is also observed at the other PWM duty ratios investigated. The approximately linear pressure–flow relationship should not be interpreted as evidence of incompressible behavior, since compressible and choked flow conditions may occur under the investigated pressure ratios. As the PWM duty ratio increases, the valve remains open for a greater fraction of each PWM cycle. This increases the average spool opening and reduces the effective flow resistance. Consequently, for a given pressure differential, higher PWM duty ratios result in higher flow rates. This behavior is consistent with the findings reported in similar studies in the literature [11,15,21]. A significant change in flow rate with PWM duty ratio has been observed even in the configuration with the smallest inlet pressure and the smallest orifice diameter. The results indicate an approximately linear trend between PWM duty ratio and flow rate across the three investigated duty ratio levels.
5.2. Effect of Period
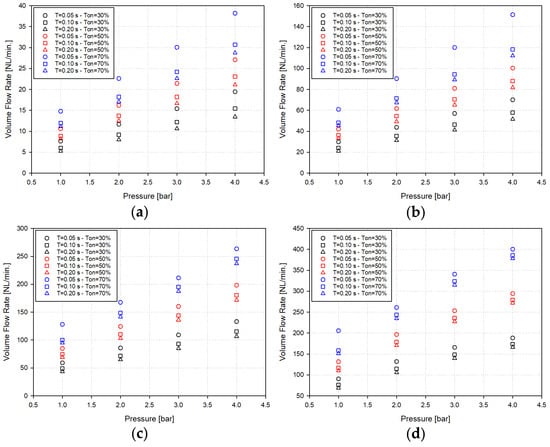
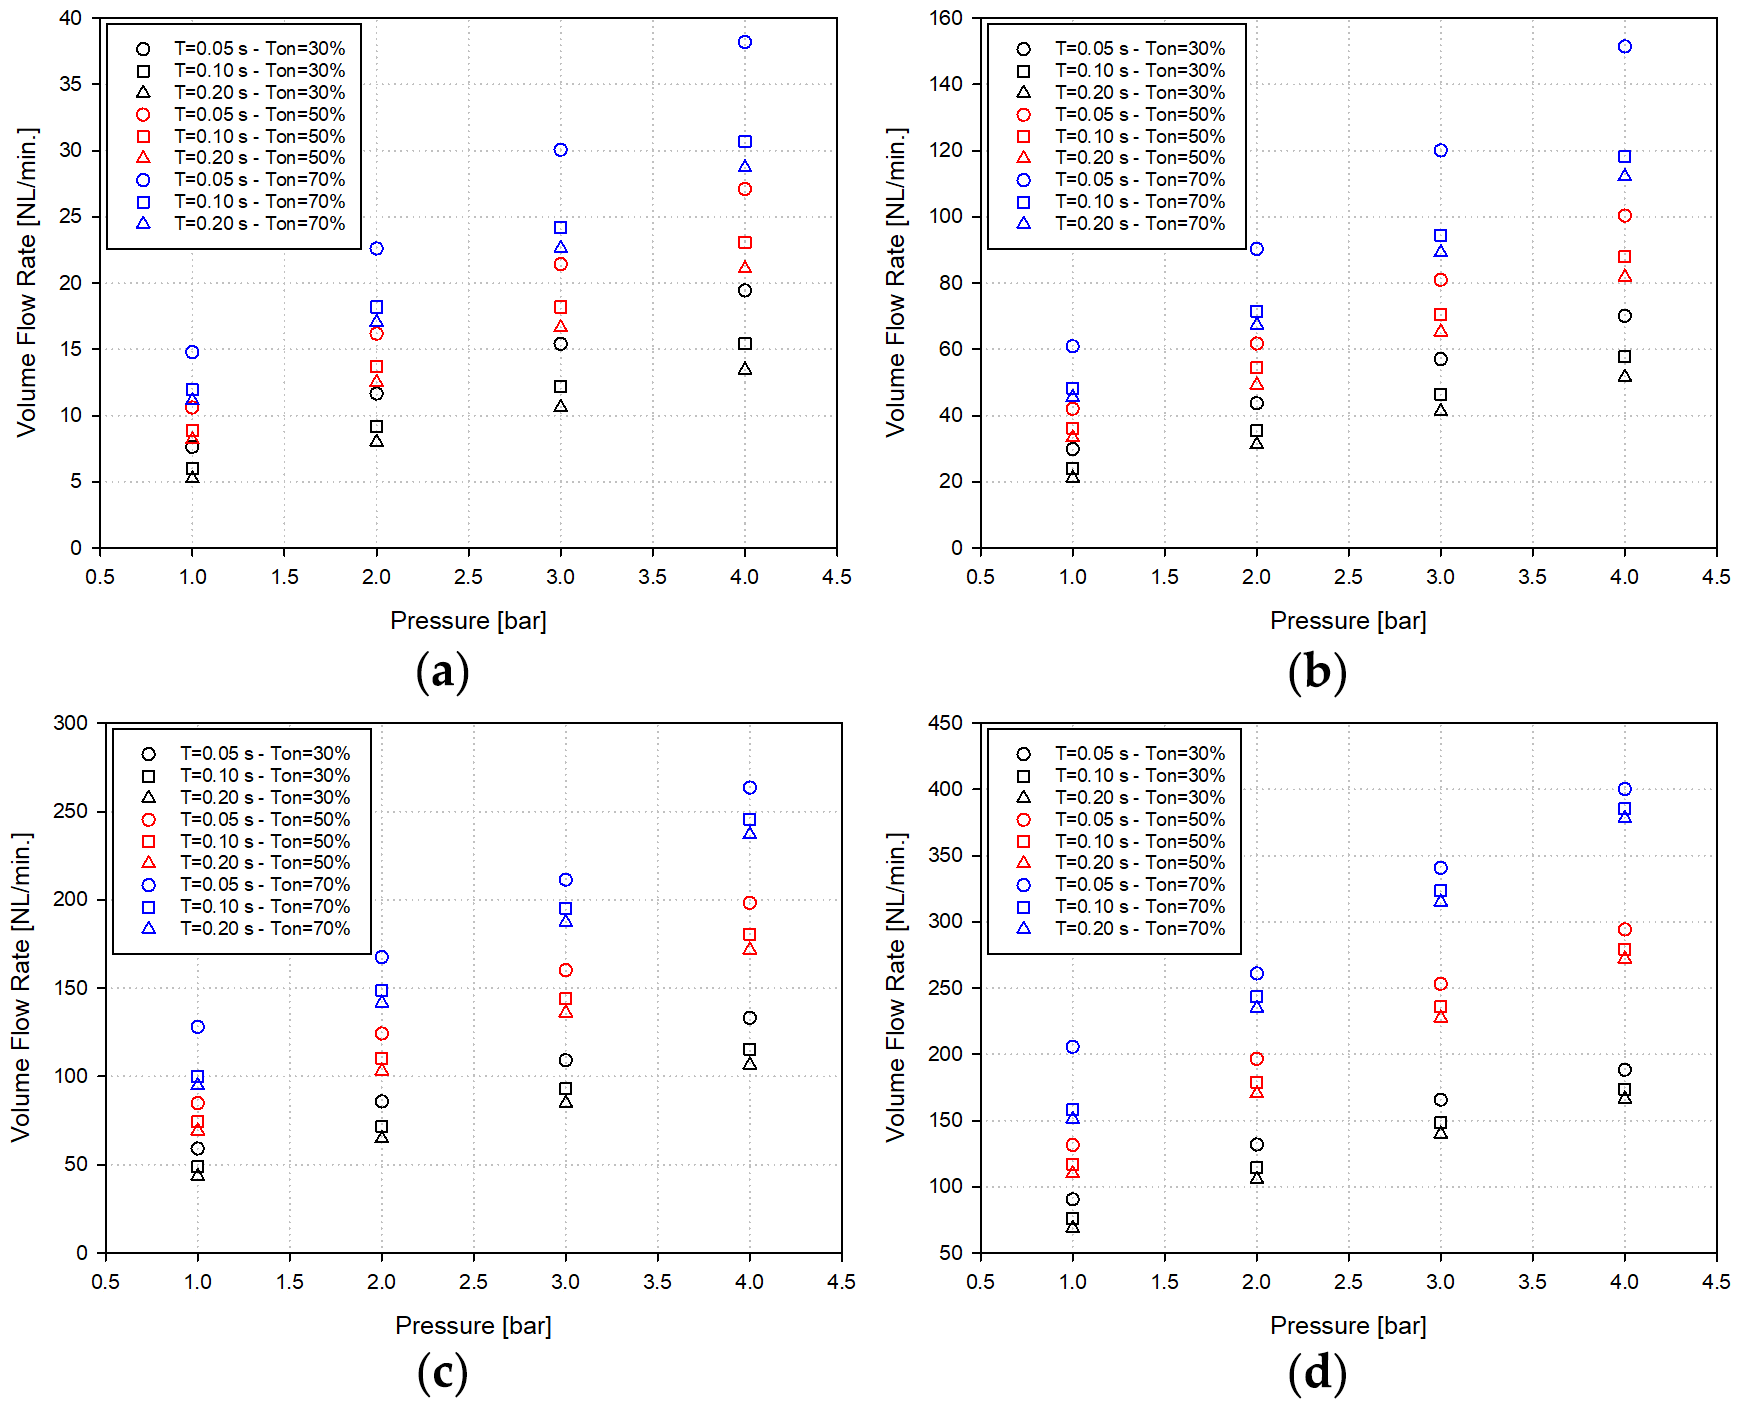
In the parametric study of the PWM period, the effect of the period was investigated for varying PWM duty ratios. For this purpose, in addition to the 0.1 s period used in the study where only the PWM duty ratio was examined, flow rates through the valve were obtained for period durations of 0.05 s and 0.2 s as well, under operating conditions with PWM duty ratios of 30%, 50%, and 70%, using different inlet pressures. The graphs obtained for valves with orifice diameters ranging from 1 mm to 4 mm are shown in Figure 9.
Figure 9.
Effect of period on volume flow rate under varying inlet pressure conditions for different orifice diameters: (a) 1 mm, (b) 2 mm, (c) 3 mm, and (d) 4 mm.
Figure 9 shows that the volume flow rate increases as the PWM period decreases at each investigated PWM duty ratio. The increase in flow rate observed when the period is reduced from 0.2 s to 0.1 s is smaller than the increase observed when it is further reduced from 0.1 s to 0.05 s. These changes become more noticeable, especially at higher inlet pressures. This behavior arises from the dynamic delay in spool motion caused by electromagnetic inductance, which prolongs the effective valve opening time at shorter PWM periods. The electromagnetic mechanism governing this behavior is described by the coupled electromechanical model developed and experimentally validated in Part I [24]. Within this framework, the transient coil current, position-dependent inductance, electromagnetic force, and spool motion are determined simultaneously through the coupled governing equations. Accordingly, the current decay behavior discussed herein arises directly from the established electromagnetic formulation and its coupled dynamic solution, rather than being inferred solely from the spool position response.
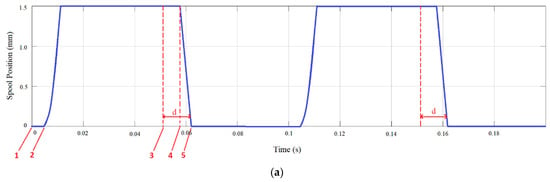
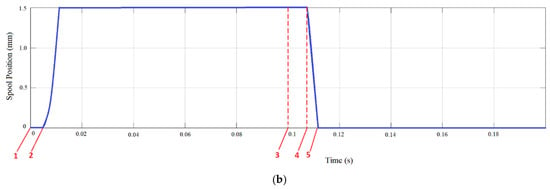
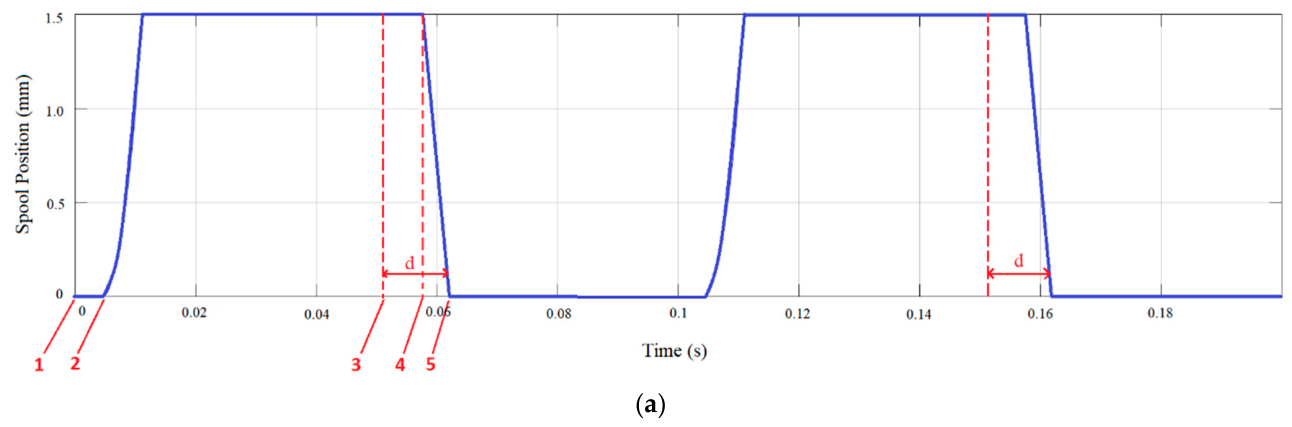
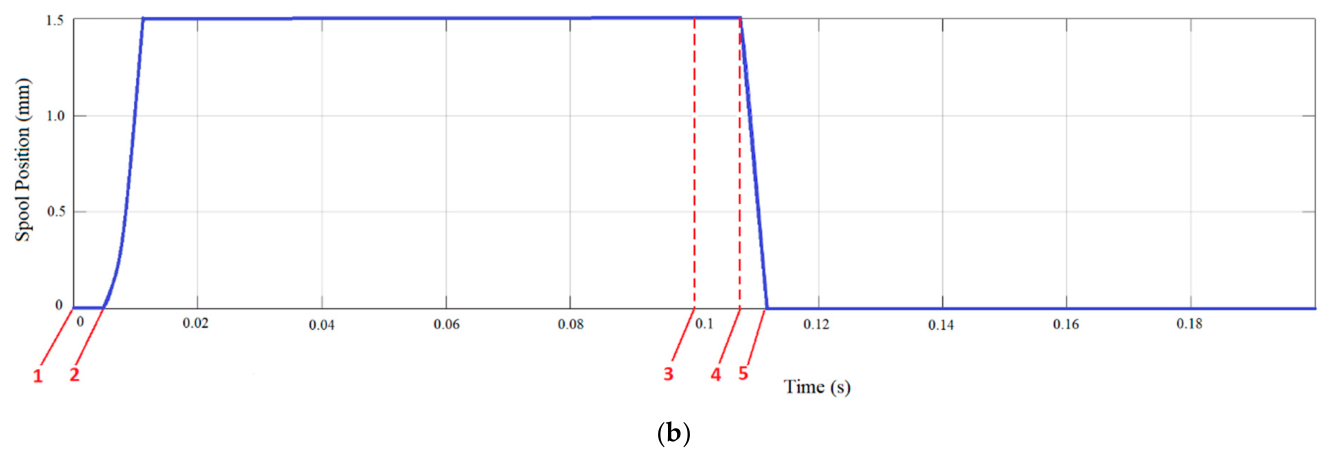
Although the commanded PWM on-time is defined by the duty ratio, the solenoid’s inductive nature causes a delayed closing, increasing the effective flow time. However, due to the inductive nature of the solenoid coil, the spool does not close immediately after the PWM signal is removed. As illustrated in Figure 10, the delayed decay of coil current causes the valve to remain partially open for an additional time interval, thereby increasing the effective flow duration within each PWM cycle.
Figure 10.
Spool position of a solenoid valve with a 4 mm orifice diameter at 50% PWM duty ratio for varying PWM periods: (a) 0.1 s; (b) 0.2 s. Points 1–5 indicate the open command, onset of spool opening, close command, onset of spool closing, and fully closed position, respectively; d denotes the closing delay.
Figure 10 shows the time-dependent movement of the spool in a solenoid valve with a 4 mm orifice diameter over a total duration of 0.2 s at a 50% PWM duty ratio, under identical process conditions. The spool position histories shown in Figure 10 were obtained from the previously validated dynamic valve model presented in Part I [24]. At point 1, the PWM generator sends an open signal to the solenoid valve. Between points 1 and 2, the open signal induces a current in the coil. By point 2, the resulting magnetic field overcomes the spring and pressure forces, causing the spool to open. At point 3, the PWM generator sends a close signal. However, as can be seen in the graphs in Figure 10, the solenoid valve does not close immediately after the close signal is sent. This delay is due to the fact that the induced current does not cease instantly but instead decays gradually over time.
Between points 3 and 4, the induced current gradually weakens, and by point 4, the magnetic force drops below the spring force, initiating the closing motion of the spool. At point 5, the solenoid valve reaches the fully closed position. As shown in Figure 10, the solenoid valve reaches the fully closed state after a delay time d following the close signal from the PWM generator. Although the PWM duty ratio is 50% in both images in Figure 10a,b, the closing delay causes the spool to remain open for a longer time as the PWM period decreases. This increases the effective flow duration and, consequently, the flow rate. Accordingly, the influence of the PWM period is nonlinear and becomes more pronounced at shorter periods due to inductive delays in the valve dynamics, which affect the effective opening and closing behavior.
5.3. Effect of Driving Voltage
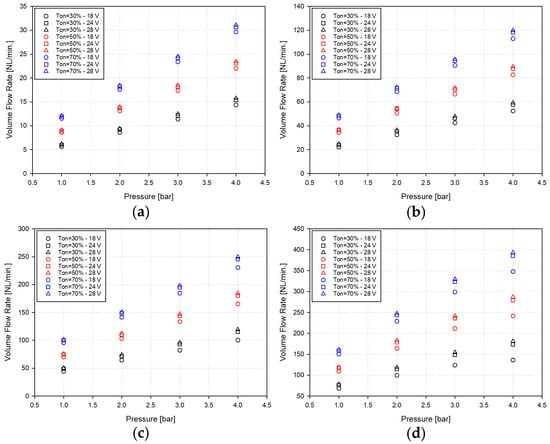
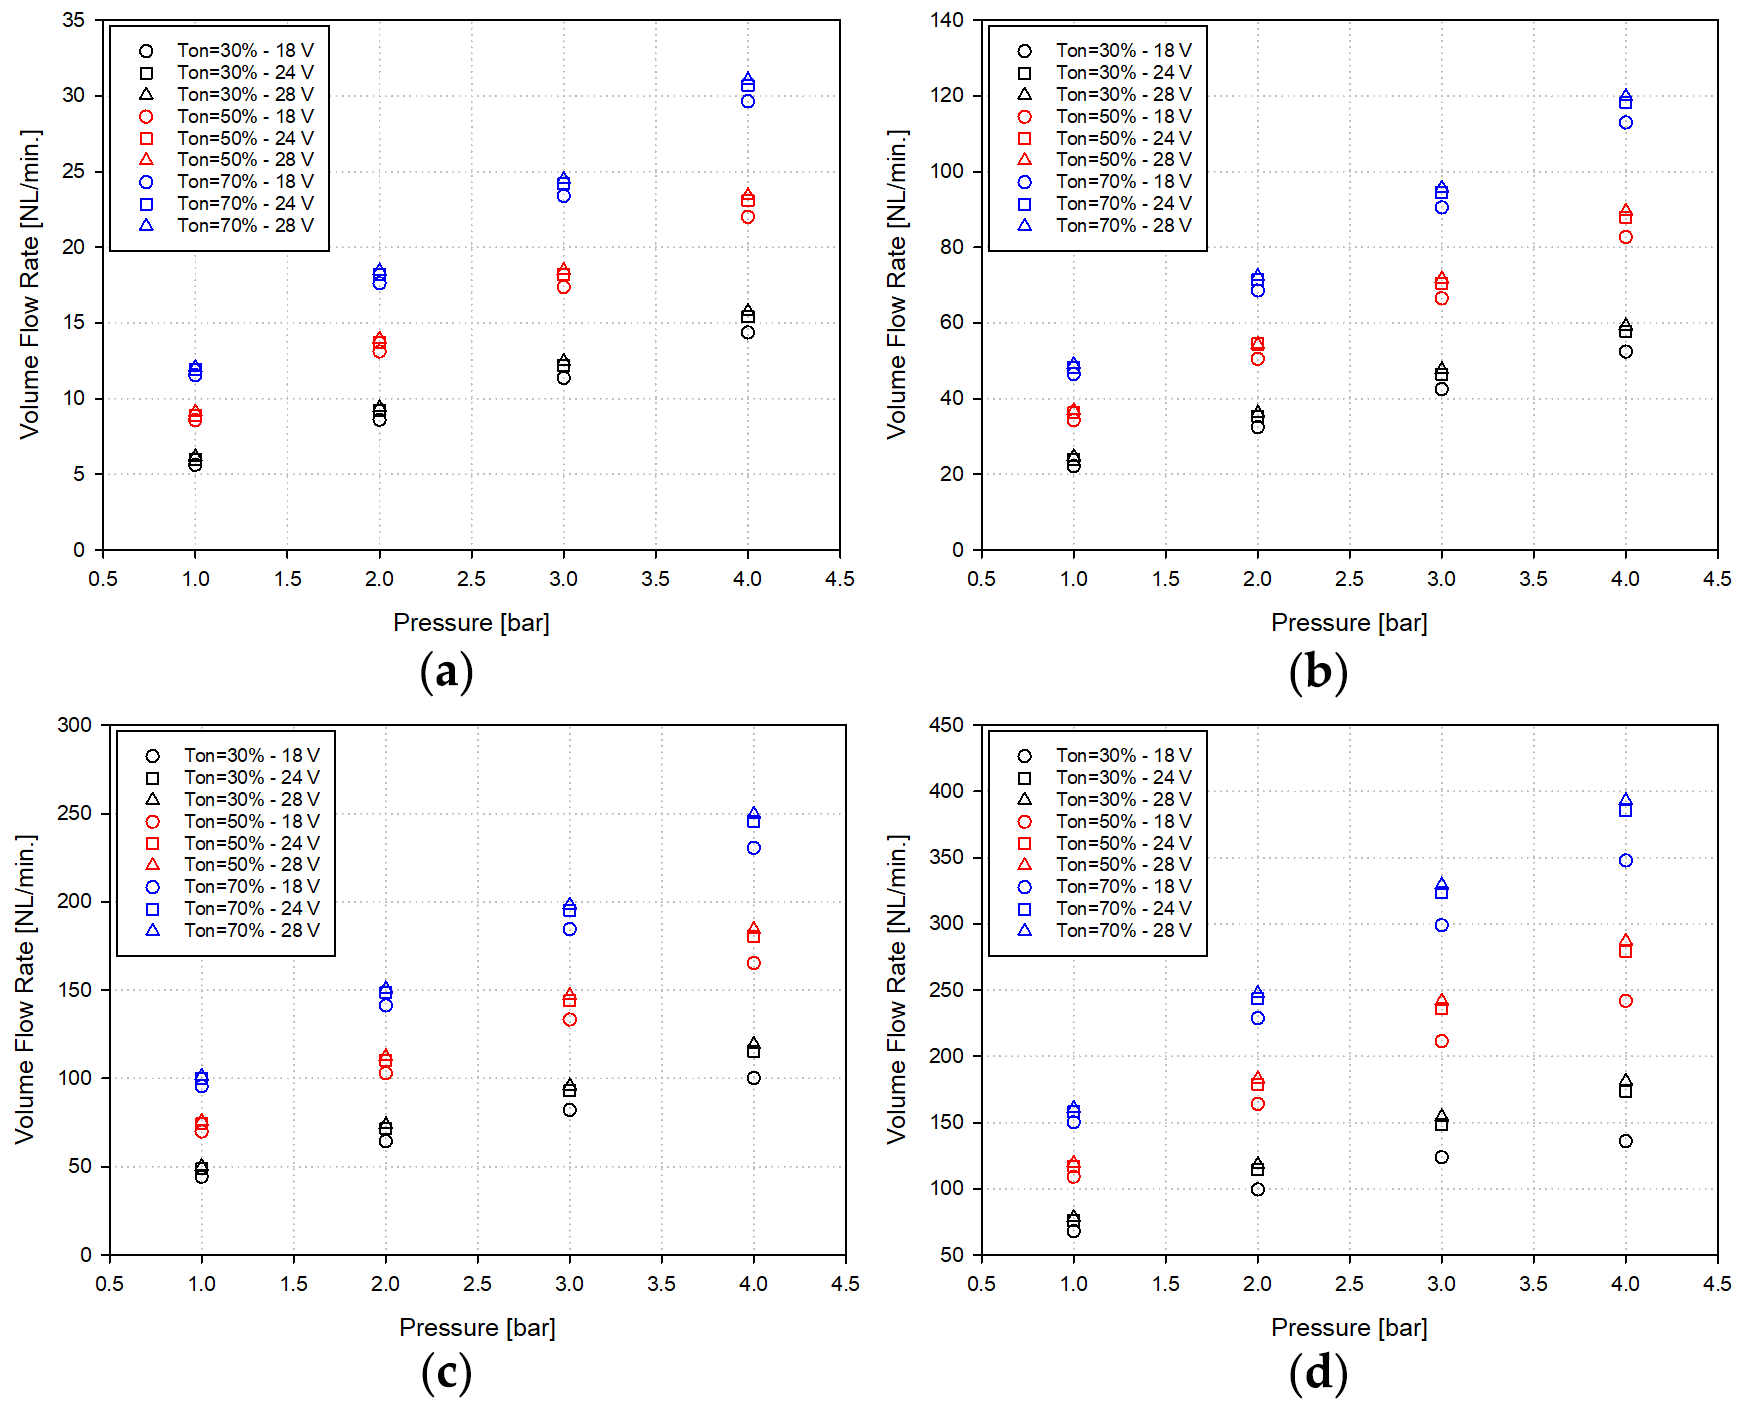
Solenoid valves can be powered by a generator driven by gas turbines or internal combustion engines, or directly by a battery. When the engine is running and power is supplied by the generator, the nominal supply voltage is 28 VDC. However, during startup—when the engine is not yet in operation—power is typically supplied by a battery. In this case, the nominal supply voltage is 24 VDC, but it can drop to as low as 18 VDC depending on the battery’s charge level. Since this directly affects the strength of the magnetic field, it also influences the valve’s opening time and, consequently, the amount of flow passing through the valve. Therefore, the effect of this variation in supply voltage on the flow rate is an issue that needs to be investigated. To this end, the impact of supply voltage on the flow rate has been examined parametrically for varying PWM duty ratios, and the results are presented in Figure 11.
Figure 11.
Effect of driving voltage on volume flow rate under varying inlet pressure conditions for different orifice diameters: (a) 1 mm, (b) 2 mm, (c) 3 mm, and (d) 4 mm.
The figure shows that as the voltage increases, the magnetic field force generated against the pressure also increases. Since the magnetic field force and the pressure force act in opposite directions, the difference between them becomes more pronounced at higher inlet pressures. As a result, at high inlet pressures, the change in flow rate due to varying voltage becomes more significant. Chakrabarti et al. [30] reported a faster valve response with increasing voltage in their study of a plunger-type solenoid valve.
5.4. Simultaneous Effect of PWM Duty Ratio and Period
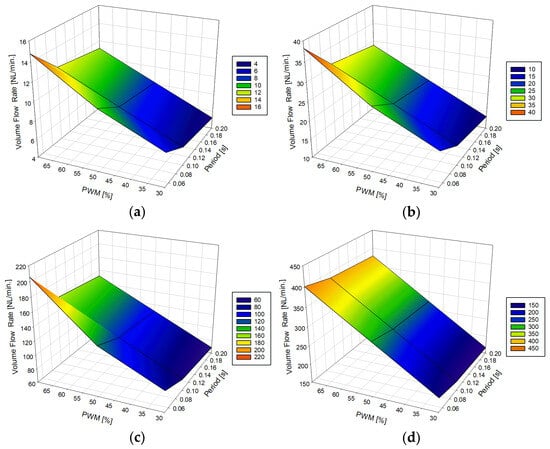
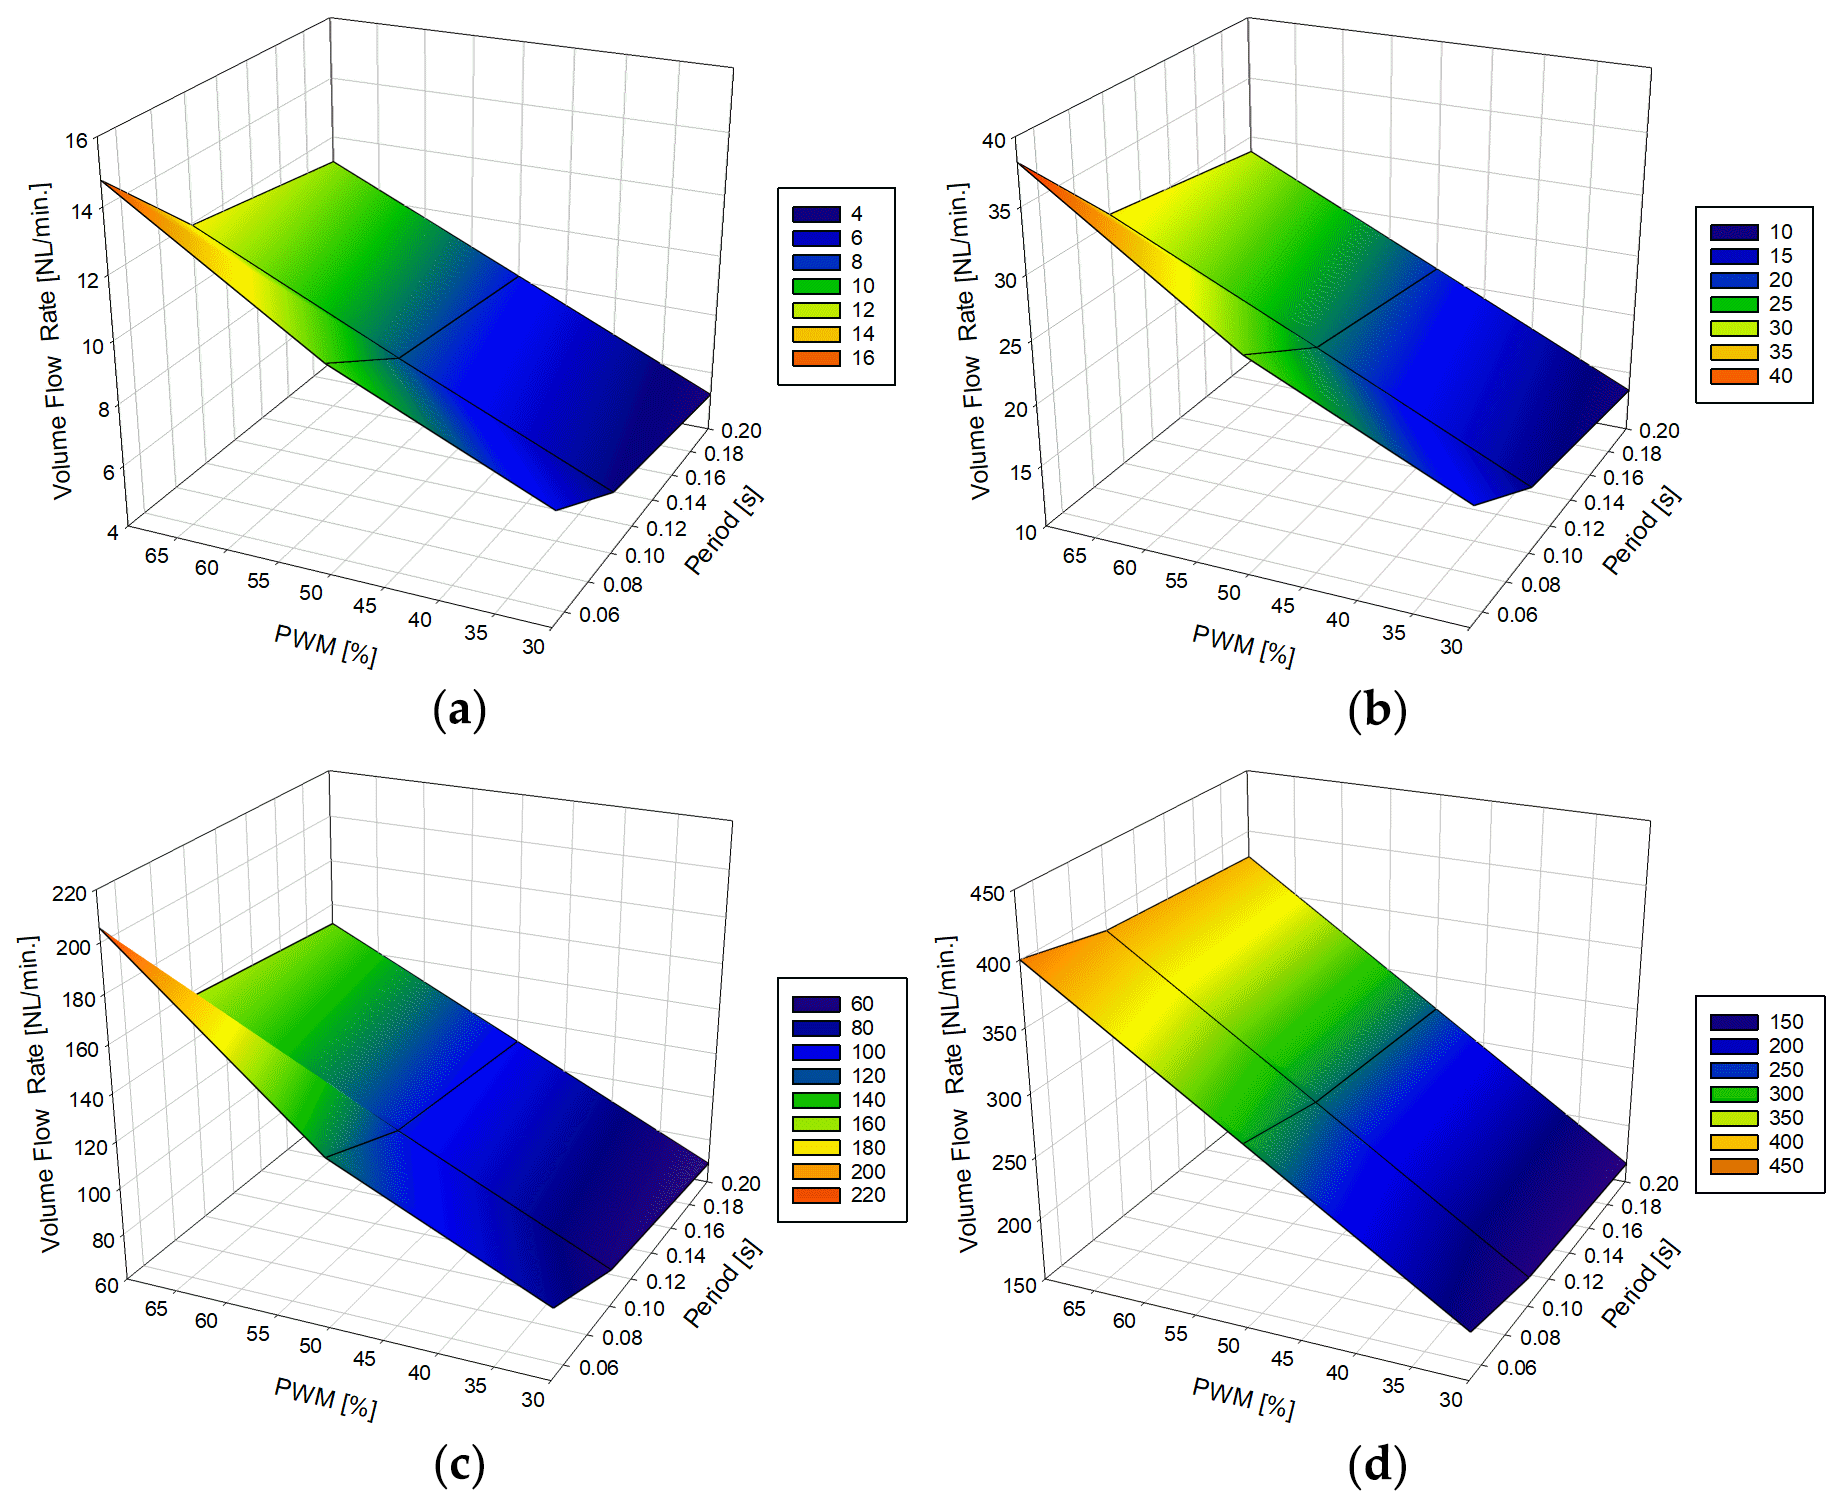
It has been demonstrated that the flow rate through the solenoid valve increases with a higher PWM duty ratio and a shorter period. However, to examine the combined effects of these two parameters on the flow rate within the investigated ranges, simultaneous variations in PWM duty ratio and period were evaluated. Figure 12 illustrates the effect of changes in the PWM duty ratio and period on the flow rate.
Figure 12.
Simultaneous effect of PWM duty ratio and period on volume flow rate under varying inlet pressure conditions for different orifice diameters: (a) 1 mm, (b) 2 mm, (c) 3 mm, and (d) 4 mm.
Figure 12 shows that the flow rate increases with increasing PWM duty ratio and decreasing PWM period across the investigated parameter levels. The duty ratio–flow rate response exhibits an approximately linear trend over the three investigated duty ratio levels. In contrast, the change in flow rate with PWM period is nonuniform over the investigated period levels. Specifically, the flow rate increase becomes more significant when the period is reduced from 0.2 s to 0.1 s and then to 0.05 s. This effect becomes even more pronounced as the orifice diameter decreases.
6. Conclusions
This study develops a predictive modeling framework for analyzing the flow rate of PWM-driven solenoid valves under varying operating conditions and structural parameters. The novelty of this study lies in its integrated approach, which combines CFD- and interpolation-derived flow data for partial openings with dynamic electromagnetic–mechanical modeling and experimental validation within a single integrated framework. The main contribution of this study is the integration of the flow rate obtained through CFD at partial openings into a previously validated dynamic valve model. This enables the flow during the dynamic motion of the valve to be predicted without conducting a CFD simulation using a moving mesh throughout the spool motion. Key findings of the study are summarized below.
- •
- A close match was observed between the experimental and numerical results. The maximum difference was 1.3% under fully open conditions and 2.8% under PWM operation, both for the 4 mm orifice diameter at an inlet pressure of 4 bar.
- •
- Within the investigated pressure range, the inlet pressure and the flow rate show an approximately linear relationship for a constant PWM duty ratio. However, the rate of increase in the flow rate increases with the increase in the PWM duty ratio.
- •
- The volume flow rate increases as the PWM period decreases, with a more pronounced effect at shorter periods. Additionally, as the orifice diameter increases, the slope of the flow rate–pressure curve increases.
- •
- An approximately linear relationship is observed between voltage and flow rate within the investigated voltage range. While the change in flow rate with increasing voltage is quite limited at small diameters, at larger diameters, the slope of the flow rate–pressure curve increases as the voltage increases.
- •
- Within the investigated parameter ranges and discrete levels, the variation in flow rate observed across the PWM duty-ratio levels was greater than that observed across the PWM-period levels.
Despite its contributions, this study has certain limitations. Since the experimental studies were conducted using air in the factory environment where serial production takes place, air was also specified as the working fluid in the CFD analyses to ensure consistency between the numerical and experimental studies. In the target application, however, nitrogen will be used as the working fluid. The investigated PWM periods in the range of 0.05–0.2 s (5–20 Hz) correspond to the operating range considered for the present valve configuration. In the CFD analyses, air compressibility was taken into account using the ideal gas approach and by solving the energy equation. The analyses revealed local supersonic flow regions, particularly near the orifice throat. The maximum local Mach number was 2.09 for the 1 mm orifice at an inlet total gauge pressure of 4 bar, with sonic conditions occurring at the orifice throat. Therefore, the proposed framework provides a practical tool for predicting the flow rate of gas-phase working fluids through the valve within the investigated operating range. Further studies could extend the present framework by accounting for viscosity effects in liquid fuel systems and by investigating broader ranges of orifice diameter and inlet pressure.
Author Contributions
A.H.D.: Investigation, Conceptualization, Methodology, Validation, Data Curation, Writing—original draft, Writing—Review & Editing. Y.M.: Investigation, Methodology, Validation, Software, Resources. P.M.: Investigation, Methodology. All authors have read and agreed to the published version of the manuscript.
Funding
This work was carried out without the support of any funding agency.
Data Availability Statement
The original contributions presented in this study are included in the article. Further inquiries can be directed to the corresponding author.
Acknowledgments
The authors would like to thank SMS Tork Valve and Automation Company (Kocaeli, Turkey) for providing experimental samples and the test facility. During the preparation of this work, the authors used ChatGPT-4 in order to improve the readability and language of the reported work. After using this tool, the authors reviewed and edited the content as needed and take full responsibility for the content of the published article.
Conflicts of Interest
The authors declare no conflicts of interest.
References
- Butts, T.R.; Butts, L.E.; Luck, J.D.; Fritz, B.K.; Hoffmann, W.C.; Kruger, G.R. Droplet Size and Nozzle Tip Pressure from A Pulse-Width Modulation Sprayer. Biosyst. Eng. 2019, 178, 52–69. [Google Scholar] [CrossRef] [Scilit]
- Salcedo, R.; Zhu, H.; Zhang, Z.; Wei, Z.; Chen, L.; Ozkan, E.; Falchieri, D. Foliar Deposition and Coverage on Young Apple Trees with PWM-Controlled Spray Systems. Comput. Electron. Agric. 2020, 178, 105794. [Google Scholar] [CrossRef] [Scilit]
- Mercaldi, H.V.; Peñaloza, E.A.; Mariano, R.A.; Oliveira, V.A.; Cruvinel, P.E. Flow and Pressure Regulation for Agricultural Sprayers Using Solenoid Valves. IFAC-PapersOnLine 2017, 50, 6607–6612. [Google Scholar] [CrossRef] [Scilit]
- Wu, M.C.; Shih, M.C. Simulated And Experimental Study of Hydraulic Anti-Lock Braking System Using Sliding-Mode PWM Control. Mechatronics 2003, 13, 331–351. [Google Scholar] [CrossRef] [Scilit]
- Kumar, R.; Divyanshu; Kumar, A. Nature Based Self-Learning Mechanism and Simulation of Automatic Control Smart Hybrid Antilock Braking System. Wirel. Pers. Commun. 2021, 116, 3291–3308. [Google Scholar] [CrossRef] [Scilit]
- Anusha, M.R.; Veena, M.G. PWM Controlled Solenoid Valves for Automatic Gear Change in Four-Wheelers. In Advances in Communication, Signal Processing, VLSI, and Embedded Systems; Springer: Singapore, 2020; pp. 335–344. [Google Scholar]
- Tkacz, E.; Kozanecki, Z.; Łagodziński, J. Solenoid Actuator for a Camless Control System of the Piston Engine Valve. In Mechatronics-Ideas for Industrial Application; Springer: Cham, Switzerland, 2015; pp. 141–148. [Google Scholar]
- Moezi, S.A.; Rafeeyan, M.; Zakeri, E.; Zare, A. Simulation and Experimental Control of a 3-RPR Parallel Robot Using Optimal Fuzzy Controller and Fast On/Off Solenoid Valves Based on the PWM Wave. ISA Trans. 2016, 61, 265–286. [Google Scholar] [CrossRef] [Scilit] [PubMed]
- Felix-Rendon, J.; Bello-Robles, J.C.; Fuentes-Aguilar, R.Q. Control of Differential-Drive Mobile Robots for Soft Object Deformation. ISA Trans. 2021, 117, 221–233. [Google Scholar] [CrossRef] [Scilit] [PubMed]
- Huang, H.; Lin, J.; Wu, L.; Fang, B.; Sun, F. Optimal Control Scheme for Pneumatic Soft Actuator Under Comparison of Proportional and PWM-Solenoid Valves. Photonic Netw. Commun. 2019, 37, 153–163. [Google Scholar] [CrossRef] [Scilit]
- Taghizadeh, M.; Ghaffari, A.; Najafi, F. Modeling and Identification of a Solenoid Valve for PWM Control Applications. Comptes Rendus Mec. 2009, 337, 131–140. [Google Scholar] [CrossRef] [Scilit]
- Messina, A.; Giannoccaro, N.I.; Gentile, A. Experimenting and Modelling the Dynamics of Pneumatic Actuators Controlled by The Pulse Width Modulation (PWM) Technique. Mechatronics 2005, 15, 859–881. [Google Scholar] [CrossRef] [Scilit]
- Taghizadeh, M.; Ghaffari, A.; Najafi, F. Improving Dynamic Performances of PWM-Driven Servo-Pneumatic Systems via a Novel Pneumatic Circuit. ISA Trans. 2009, 48, 512–518. [Google Scholar] [CrossRef] [Scilit] [PubMed]
- Najjari, B.; Barakati, S.M.; Mohammadi, A.; Futohi, M.J.; Bostanian, M. Position Control of An Electro-Pneumatic System Based on PWM Technique and FLC. ISA Trans. 2014, 53, 647–657. [Google Scholar] [CrossRef] [Scilit] [PubMed]
- Pipan, M.; Herakovic, N. Closed-Loop Volume Flow Control Algorithm for Fast Switching Pneumatic Valves with PWM Signal. Control Eng. Pract. 2018, 70, 114–120. [Google Scholar] [CrossRef] [Scilit]
- Gao, Q.; Zhu, Y.; Luo, Z.; Bruno, N. Investigation on Adaptive Pulse Width Modulation Control for High Speed On/Off Valve. J. Mech. Sci. Technol. 2020, 34, 1711–1722. [Google Scholar] [CrossRef] [Scilit]
- Ahn, K.; Yokota, S. Intelligent Switching Control of Pneumatic Actuator Using On/Off Solenoid Valves. Mechatronics 2005, 15, 683–702. [Google Scholar] [CrossRef] [Scilit]
- Gade, M.M.; Mangrulkar, K.K. Modeling and PWM Control of Electro-Pneumatic Actuator for Missile Applications. IFAC-PapersOnLine 2018, 51, 237–242. [Google Scholar] [CrossRef] [Scilit]
- Zhang, B.; Zhong, Q.; Ma, J.E.; Hong, H.C.; Bao, H.M.; Shi, Y.; Yang, H.Y. Self-Correcting PWM Control for Dynamic Performance Preservation in High Speed On/Off Valve. Mechatronics 2018, 55, 141–150. [Google Scholar] [CrossRef] [Scilit]
- Zhong, Q.; Mao, Y.X.; Xu, E.G.; Wang, X.L.; Li, Y.B.; Yang, H.Y. Fast Dynamics and Low Power Losses of High-Speed Solenoid Valve Based on Optimized Pre-Excitation Control Algorithm. Therm. Sci. Eng. Prog. 2024, 47, 102363. [Google Scholar] [CrossRef] [Scilit]
- Li, S.; Wu, P.; Cao, L.; Wu, D.; She, Y. CFD Simulation of Dynamic Characteristics of a Solenoid Valve For Exhaust Gas Turbocharger System. Appl. Therm. Eng. 2017, 110, 213–222. [Google Scholar] [CrossRef] [Scilit]
- Shiee, M.; Sharifi, A.; Fathi, M.; Najafi, F. An Experimental Comparison of PWM Schemes to Improve Positioning of Servo Pneumatic Systems. Int. J. Adv. Manuf. Technol. 2016, 82, 1765–1779. [Google Scholar] [CrossRef] [Scilit]
- Chen, X.; Zhu, Y.; Qin, C.; Li, Y. Characteristics Investigation of High Speed Solenoid Valve Based on Multi-Physics Co-Simulation Model. Nonlinear Dyn. 2025, 113, 24383–24404. [Google Scholar] [CrossRef] [Scilit]
- Mutlu, Y.; Dönmez, A.H.; Mutlu, P. Dynamic Behavior Modelling of Solenoid Valves Used for Proportional Fuel Control: Experimental Validation and Parametric Study. Flow Meas. Instrum. 2026, 109, 103255. [Google Scholar] [CrossRef] [Scilit]
- Szpica, D.; Mieczkowski, G.; Borawski, A.; Leisis, V.; Diliunas, S.; Pilkaite, T. The Computational Fluid Dynamics (CFD) Analysis of The Pressure Sensor Used in Pulse-Operated Low-Pressure Gas-Phase Solenoid Valve Measurements. Sensors 2021, 21, 8287. [Google Scholar] [CrossRef] [Scilit] [PubMed]
- Long, Z.; Shu, L.; Li, C.; Zheng, Y.; Huang, J. Numerical Simulation Study on Noise Pollution of The Solenoid Valve in Pressure Water-Air System of Pumped Storage Power Station. J. Phys. Conf. Ser. 2023, 2565, 012016. [Google Scholar] [CrossRef] [Scilit]
- Li, Z.Y.; Chen, S.J.; Long, Y.F.; Jin, Z.J.; Qian, J.Y. Numerical Simulation of Leakage Noise Field for Solenoid Valve. In Fluids Engineering Division Summer Meeting; American Society of Mechanical Engineers: New York, NY, USA, 2024; Volume 88124, p. V001T01A016. [Google Scholar]
- Menter, F.R. Two-Equation Eddy-Viscosity Turbulence Models for Engineering Applications. AIAA J. 1994, 32, 1598–1605. [Google Scholar] [CrossRef] [Scilit] [PubMed]
- ANSYS Inc. Ansys Fluent Theory Guide; ANSYS Inc.: Canonsburg, PA, USA, 2022. [Google Scholar]
- Chakrabarti, S.; Sidhartha, P.A.V.; Sai, N.V.S.; Verma, A.; Venkittaraman, D.; Kodeeswaran, M.; Kumar, A.; Sahoo, B. Effect of Annealing of the Core Material on Magnetic and Mechanical Performance of a Plunger Type Solenoid Valve During Its Start Transient. J. Magn. Magn. Mater. 2025, 628, 173158. [Google Scholar] [CrossRef] [Scilit]

Disclaimer/Publisher’s Note: The statements, opinions and data contained in all publications are solely those of the individual author(s) and contributor(s) and not of MDPI and/or the editor(s). MDPI and/or the editor(s) disclaim responsibility for any injury to people or property resulting from any ideas, methods, instructions or products referred to in the content. |
© 2026 by the authors. Licensee MDPI, Basel, Switzerland. This article is an open access article distributed under the terms and conditions of the Creative Commons Attribution (CC BY) license.