


Abstract
The research paper presents a simulation-driven investigation into the effects of tire dynamics on vehicle safety by examining the influence of inflation pressure and load variability in both new and service-aged pneumatic tires. The proposed methodology combines finite element analysis with experimental measurements to accurately characterize tire behaviour while avoiding the complexity associated with detailed composite material modelling. Pre-experimental data are employed to calibrate and validate the numerical model, enabling realistic prediction of tire dynamic responses under various operating conditions. The developed approach facilitates the assessment of tire performance across a range of inflation pressures and vertical loads, allowing a comparative evaluation of new and service-aged tires in terms of deformation characteristics and dynamic stability. Furthermore, the numerical simulations investigate how pressure loss and load variability affect tire blowout conditions and braking performance, both of which are relevant to overall vehicle safety. The results demonstrate that tire aging, together with improper inflation pressure and increased loading, significantly influences tire dynamic behaviour and vehicle stability, leading to measurable changes in braking distance and road-holding capability. The proposed simulation-driven framework provides an efficient and reliable tool for evaluating service-aged tire performance under realistic service conditions and supports the development of safer tire designs and maintenance strategies aimed at improving road traffic safety.
1. Introduction
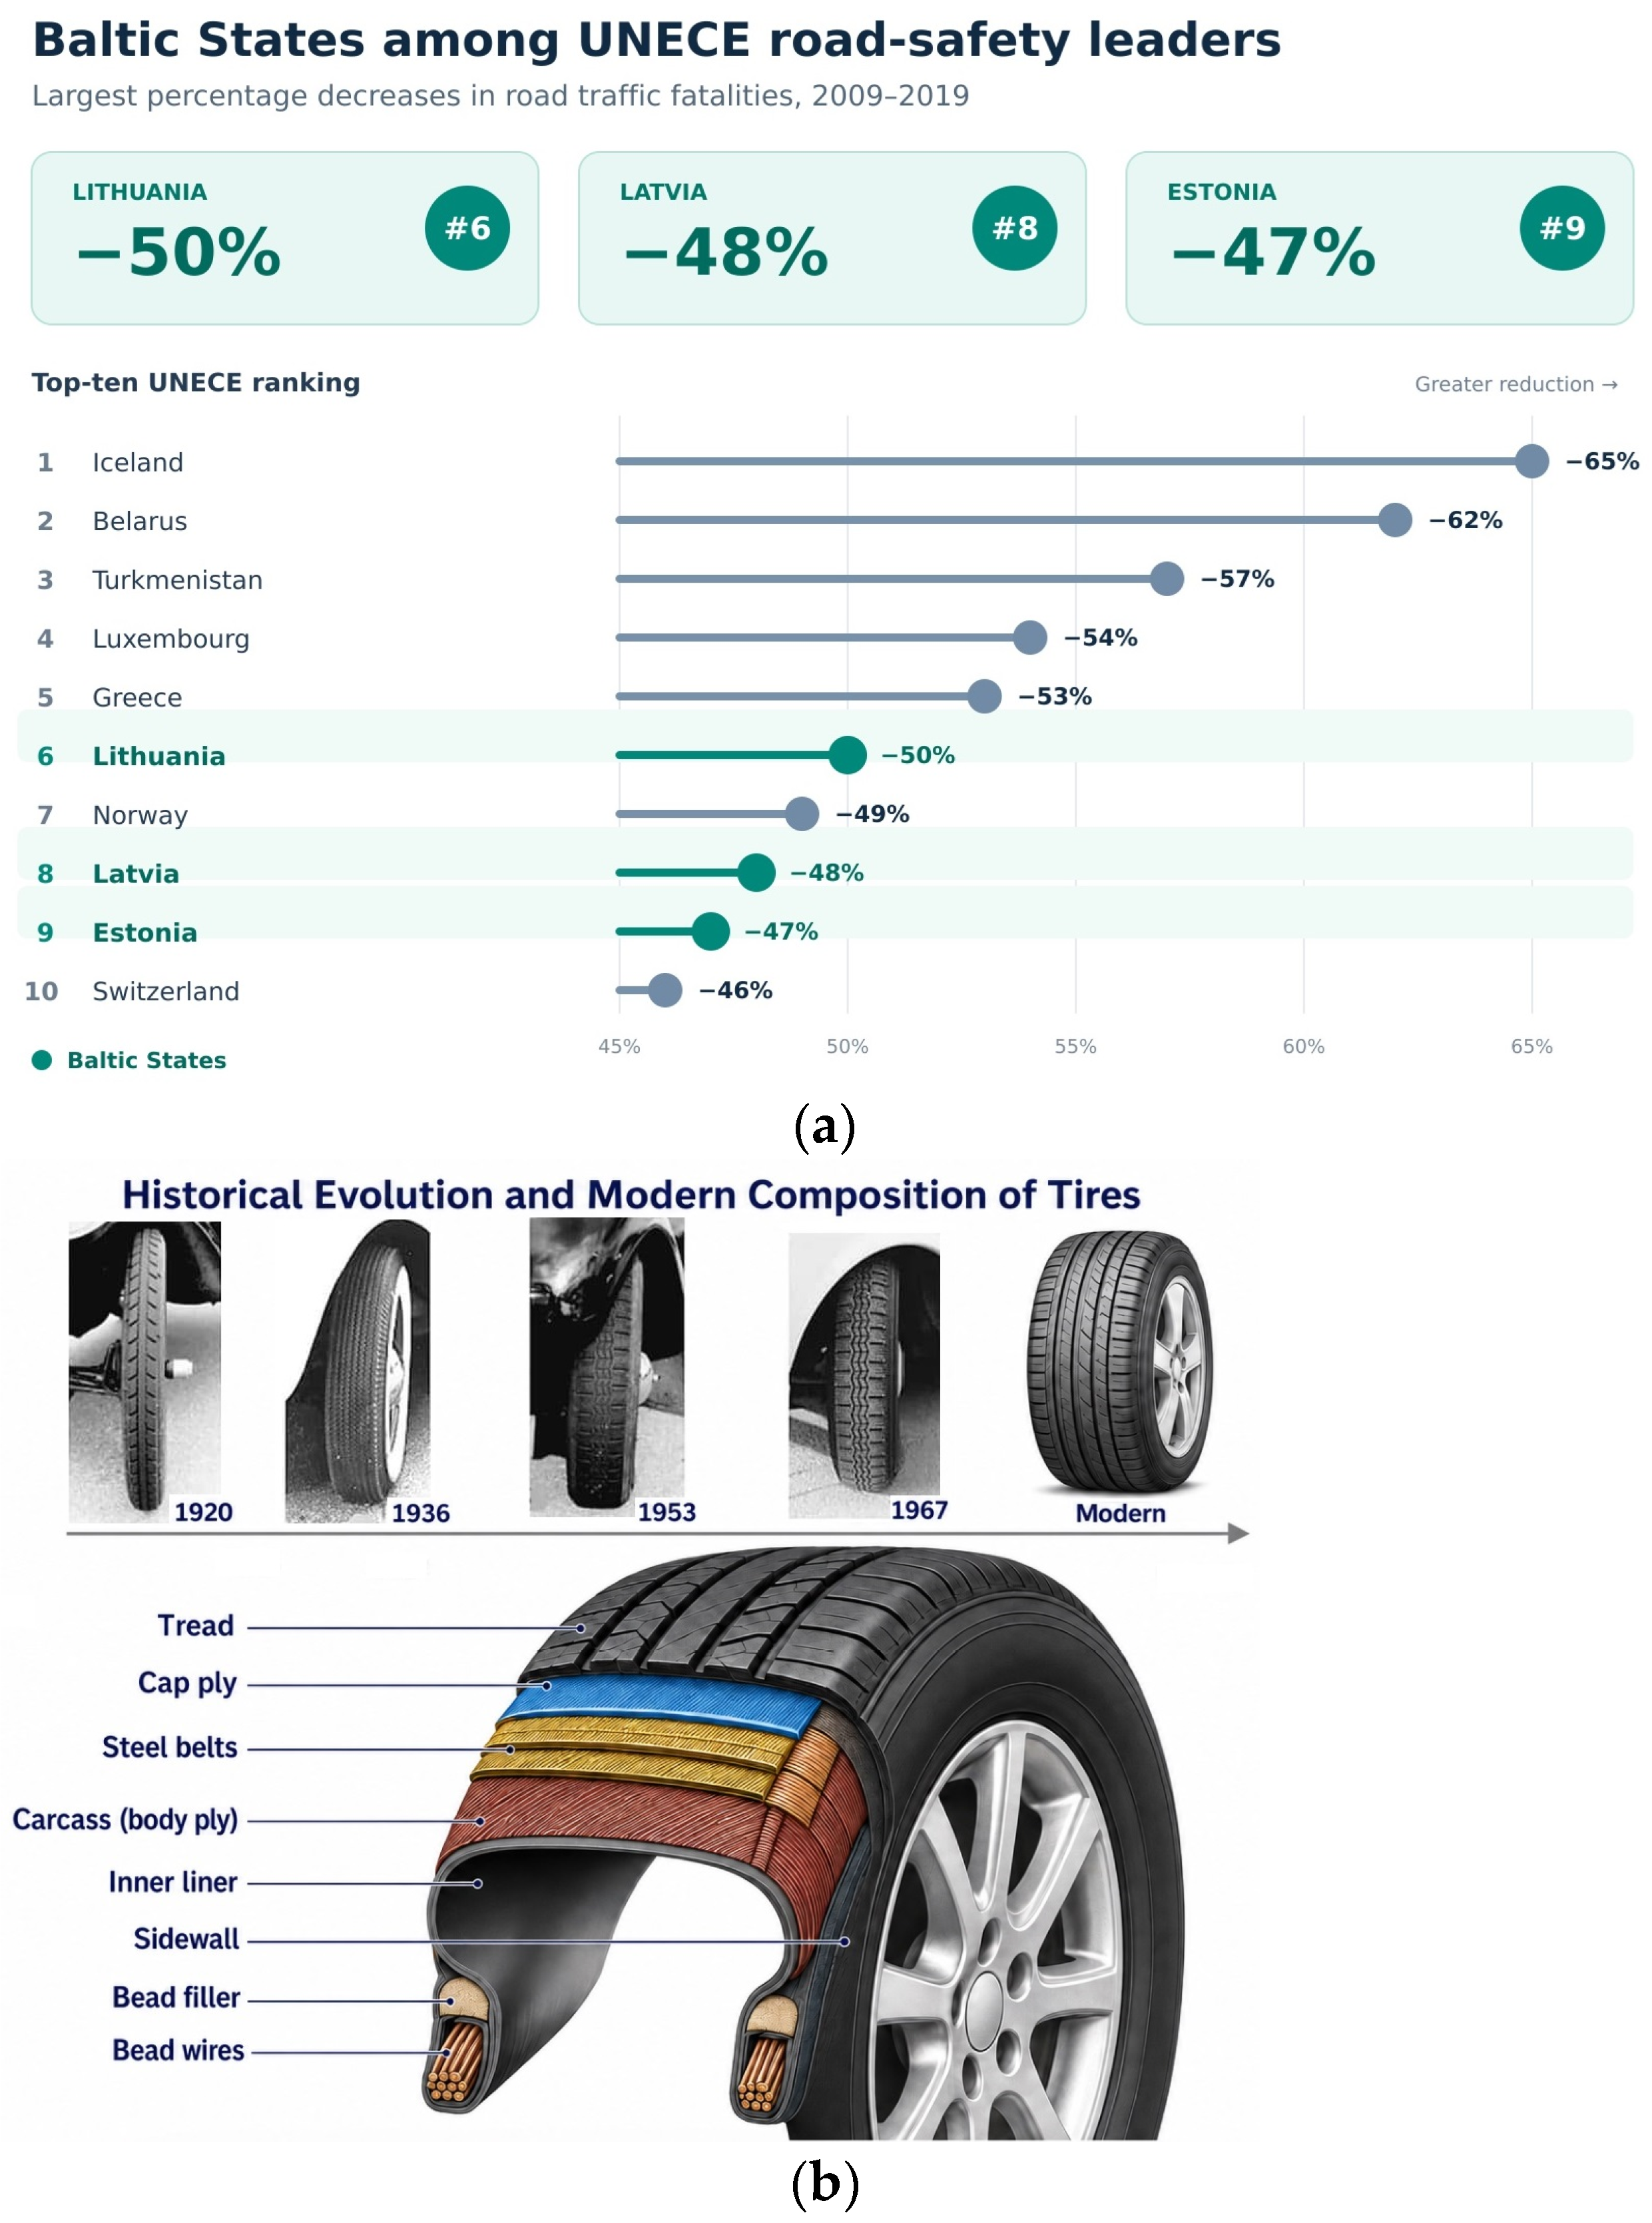
The rapid advancement of the automotive sector has established motor vehicles as the dominant means of land transportation. This development has been driven by the expansion of road infrastructure, relatively low transportation costs, and the convenience and flexibility offered by private vehicles. As a result, both the number of registered vehicles and the total annual distance travelled have increased steadily [1]. Despite continued growth in road transport, global road traffic deaths decreased by approximately 5% between 2010 and 2021, reaching approximately 1.19 million deaths annually [2,3]. Road traffic injuries nevertheless remain the leading cause of death among children and young adults aged 5–29 years [3,4]. Between 2009 and 2019, road traffic fatalities decreased by approximately 50% in Lithuania, 48% in Latvia, and 47% in Estonia, placing these countries sixth, eighth, and ninth, respectively, among the ten best-performing UNECE countries (refer to Figure 1a). According to recent studies, tire-related defects contribute to nearly 50% of road traffic accidents, with tire blowouts representing one of the most frequent causes of these incidents [5]. Car accidents continue to be a significant issue in road safety research, with numerous studies examining how vehicle-related factors, such as tire condition and aging, tire blowouts, and braking distance, affect accident risk and severity [6,7,8].
Since tires provide the only physical interface between a vehicle and the pavement through the tire–road contact patch, their condition plays a crucial role in ensuring vehicle stability, handling performance, and overall driving safety [9,10]. This influence becomes even more pronounced under adverse weather conditions, particularly during autumn and winter, when road surfaces often exhibit reduced friction. Tire technology has undergone continuous development over the past century. Following the introduction of synthetic rubber compounds in the 1920s, bias-ply tires became the dominant tire construction for several decades before the widespread adoption of modern radial designs [11,12]. Contemporary pneumatic tires are sophisticated composite structures consisting of synthetic rubber compounds reinforced with steel cords, textile fabrics, polymer-based materials, and additional reinforcing elements, as illustrated in Figure 1b.
Figure 1.
Background context and tire evolution: (a) trends in road traffic accidents and fatalities from 2009 to 2025 (author’s illustration based on [3,4]); (b) historical evolution and modern composition of tires (based on [11,12] and author’s illustration).
Considerable research efforts have been devoted to improving road safety by investigating tire–road interaction under various operating conditions. Recent studies have focused on optimizing tire selection according to seasonal and weather-dependent driving conditions, as well as developing strategies to mitigate the risks associated with tire failures, particularly sudden blowouts occurring during vehicle operation [13]. The risks associated with worn or defective tires, particularly in the context of blowout events and compromised braking performance, are highlighted as a critical factor in accident causation and prevention [14,15]. Reference [16] identifies excessive tread degradation and improper inflation pressure combined with excessive loading as the dominant factors contributing to tire blowouts. Such failure conditions become particularly critical during high-speed vehicle operation, overloading, or emergency braking. Worn, aged, or damaged tires have repeatedly been shown to significantly compromise vehicle control and increase accident risk, particularly in scenarios involving high speeds, heavy loads, or adverse road conditions [17,18,19,20]. The viscoelastic properties of tire tread, as well as tread wear and aging, play a crucial role in braking performance, especially on wet surfaces, affecting stopping distances and accident likelihood [14,20,21].
Furthermore, deviations from the recommended tire pressure range can negatively influence braking performance by increasing the required stopping distance [22]. However, the combined investigation of tire failure mechanisms and their influence on vehicle braking behaviour remains challenging because of the complex interactions among multiple variables and the need for extensive experimental characterization. For effective tire design and reliable operation, the parameters governing tire–road frictional contact mechanics and localized failure phenomena, such as tire blowouts, must be thoroughly investigated during the development stage. Accurate prediction of tire performance requires simultaneous consideration of operational loading conditions and material behaviour within a unified modelling framework, as indicated in [23]. During vehicle operation, tire loads can exhibit both periodic and stochastic characteristics, originating from variations in the road surface and vehicle motion conditions [24]. Therefore, a comprehensive understanding of tire material response is essential. The integration of experimental investigations with numerical simulations provides an advanced approach for developing accurate constitutive models of tire materials and improving predictive capabilities, thereby supporting efforts to reduce accidents associated with tire-related failures. According to [25], numerical methods based on the finite element method (FEM) and related computational techniques provide an effective alternative to purely experimental approaches, reducing both research time and economic costs when analysing tire behaviour. Numerous theoretical and experimental studies have already examined pneumatic tire responses under different loading scenarios [26,27]. Nevertheless, a comprehensive mathematical framework that simultaneously describes tire dynamic behaviour, inflation pressure effects, and their influence on vehicle braking distance underdeveloped in the existing literature, highlighting the relevance of the present research. Current approaches for modelling tire reinforcement structures mainly rely on two strategies: the application of composite material theories [28] or the separate representation of rubber matrices and reinforcing cords using embedded “rebar” elements [29]. However, these methods generally do not incorporate frequency-dependent material characteristics, which are important for understanding dynamic tire responses and predicting failure mechanisms under variable loading conditions.
The methodology proposed in this study combines experimental measurements with a numerical simulation framework to provide an efficient approach for evaluating the dynamics of new and service-aged vehicle tires. By avoiding complex descriptions of internal composite material interactions, the developed method enables realistic analysis of tire behaviour under various inflation pressures and loading conditions. In particular, the approach allows the investigation of tire blowout phenomena in service-aged tires and the quantification of the influence of inflation pressure on braking performance, providing valuable insights for improving vehicle safety and tire reliability.
2. Pre-Experimental Tests on New and Service-Aged Tires
The pre-experimental stage of the study focused on the characterization of tire dynamic properties using vibration-based measurements. The obtained experimental data were subsequently incorporated into the numerical modelling process to reduce uncertainties related to the representation of composite material behaviour and the effects of tire ageing. This approach enabled a more realistic simulation of the tire’s operational response under practical conditions.
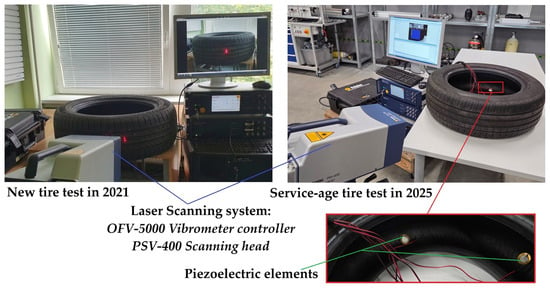
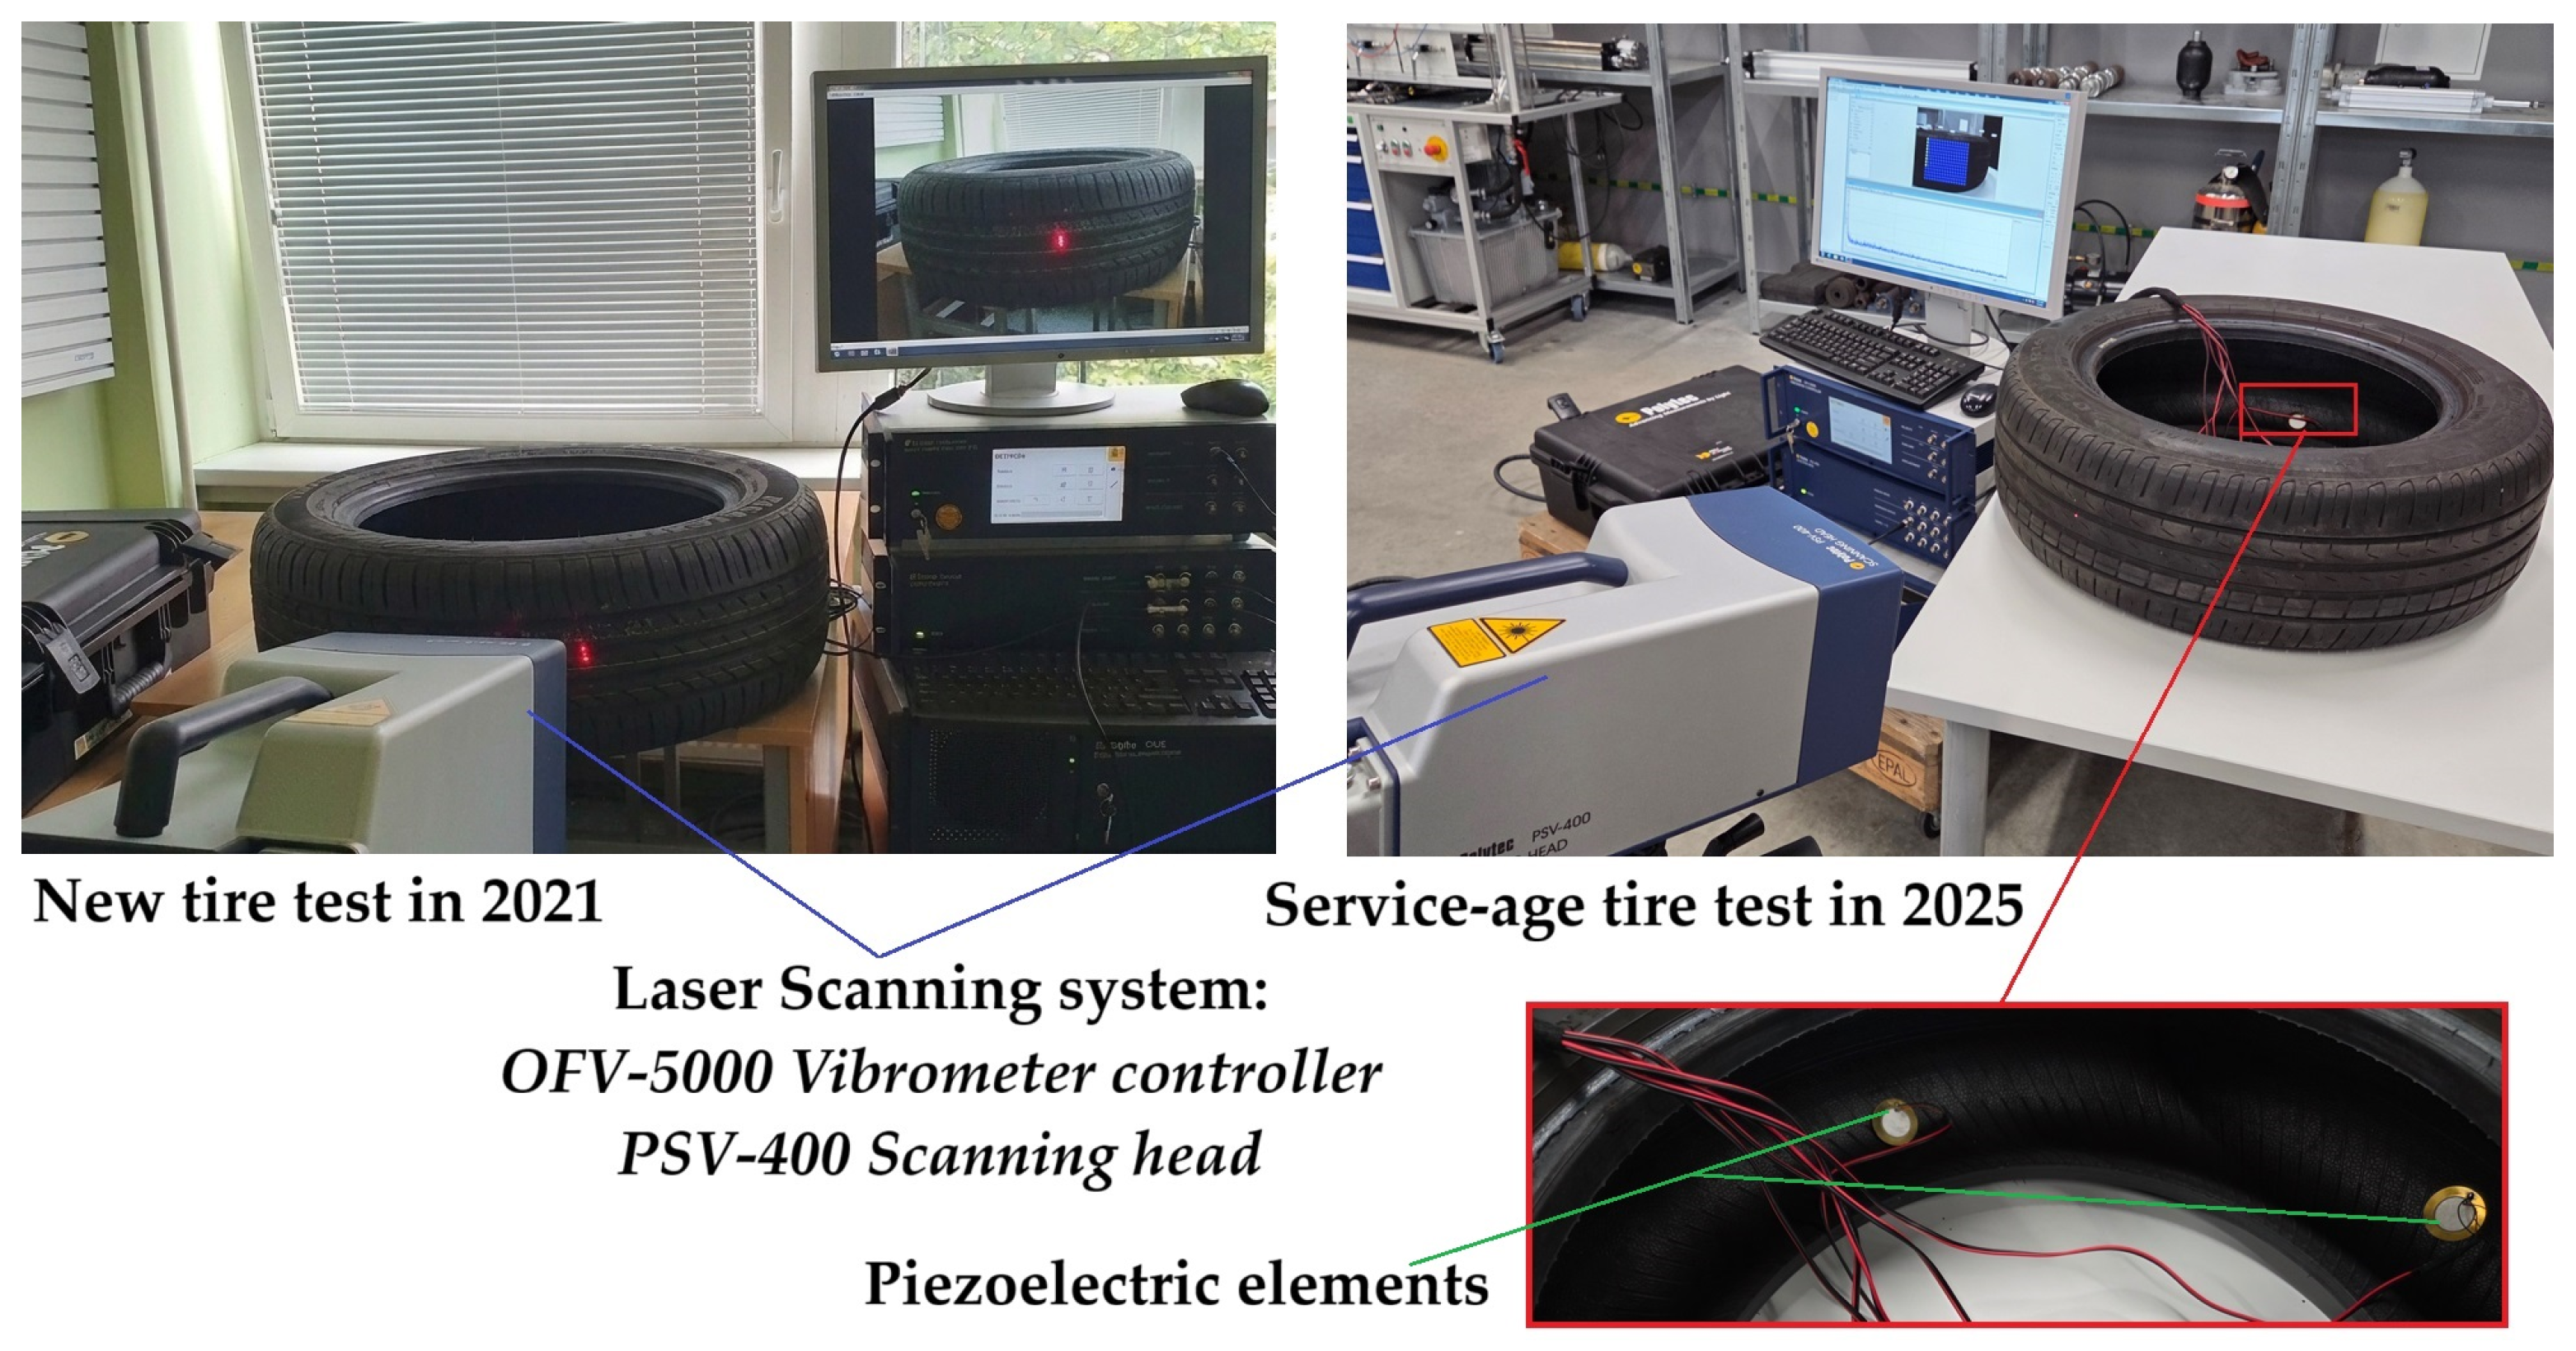
Piezoelectric micro-vibration measurements were performed on the investigated tire in two conditions: its new condition in 2021 and its service-aged condition in 2025. At each assessment stage, the vibration response was measured repeatedly at several predefined surface regions distributed over the tire structure rather than at a single measurement point. This spatial measurement procedure was used to account for local variations in the tire response and to obtain a more representative characterization of its overall dynamic behaviour. The investigated tire accumulated approximately 10,000–12,000 km during each summer-tire operating season in Lithuania, from 1 April to 31 October, under normal daily driving conditions. Tread depth was not recorded during the original measurements and therefore cannot be reported reliably for the two tire conditions. Service-related changes were incorporated through calibration of the equivalent tire properties against the measured vibration responses rather than through explicit modification of tread geometry. The study therefore represents a spatially sampled comparison between two service-condition endpoints rather than a gradient-based investigation of performance degradation with mileage. The experimental setup and measurement configuration, based on Fast Fourier Transform (FFT) analysis for vibration signal processing, are presented in Figure 2.
Figure 2.
Pre-experimental test benches for FFT analysis: the new tire configuration used in 2021 (left) and the service-aged tire configuration used in 2025 (right).
The experimental investigation was performed using a two-condition measurement approach, while the uncertainty in the repeated measurement data was evaluated using a single-sample statistical method in accordance with the methodology described in [30]. The measurement system consisted of a rigid metal base equipped with a low-frequency vibration isolation rubber layer, a tire specimen firmly fixed to the base, and a laser scanning system for non-contact measurement of tire surface vibrations induced by piezoelectric excitation.
During the vibration experiments, the velocity of tire surface deformation generated by impulse excitation from the piezoelectric elements was recorded. The measured signals were processed using the internal algorithms of the Polytec measurement system, which provided Fast Fourier Transform (FFT) spectra for evaluating the modal response. The testing procedure was repeated for both tire conditions, and statistical processing based on the single-sample method was applied to estimate the measurement uncertainty [31]. To reduce random measurement variation, five repeated measurements were performed at each investigated tire-surface region under identical excitation conditions. The arithmetic mean of the five measurements was used for further analysis. Measurements were collected from several predefined regions of the tire surface using the same excitation and acquisition settings. Repeated measurements were performed within each region, after which the results were statistically processed and combined to characterize the tire response in each investigated condition. The measurements obtained from different surface regions represent spatial observations from the same tire specimen and were therefore not treated as independent tire samples.
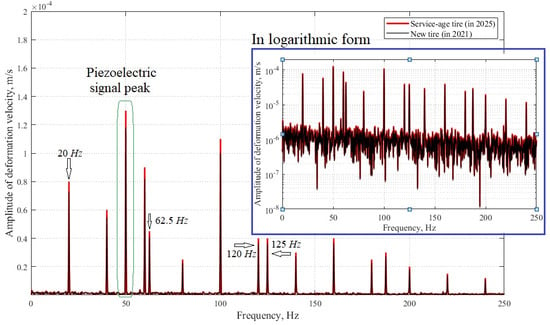
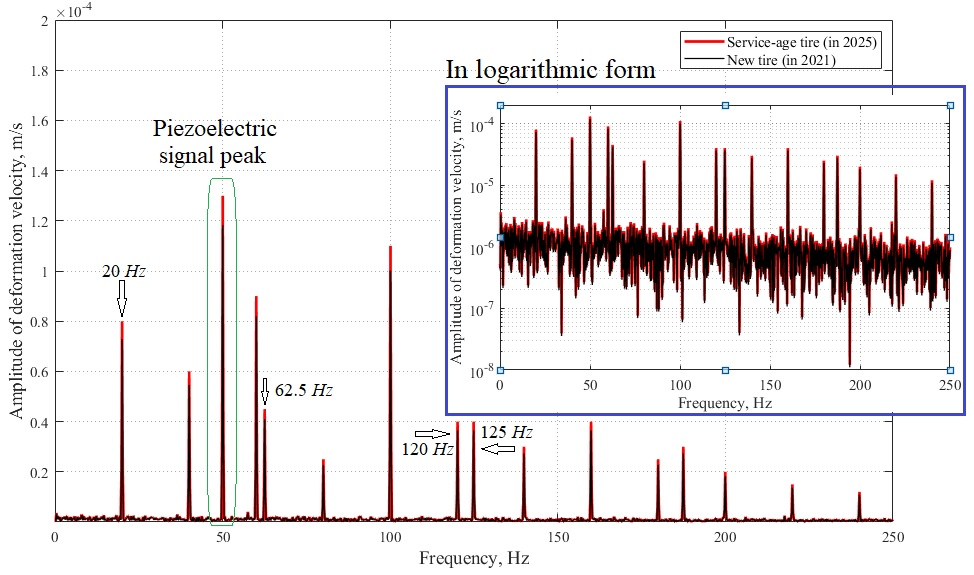
The piezoelectric actuator applied a sinusoidal excitation signal with a frequency of 50 Hz, with a force amplitude of 1 N. The resulting vibration response of the tire surface was captured using a laser scanning head of the Polytec measurement system. The final FFT results obtained for the new and service-aged tires after repeated measurements and statistical processing are presented in Figure 3. A Kalman filter was applied before the FFT analysis to suppress possible lateral vibration noise and other measurement disturbances.
Figure 3.
FFT results obtained for the new and service-aged tires after Kalman filtering, repeated measurements, and statistical processing.
The FFT analysis results demonstrate that both the new and service-aged tires exhibit dominant resonance behaviour in the low-frequency region, with the corresponding dynamic responses extending toward the lower boundary of the intermediate-frequency range. The identified frequencies may provide potential diagnostic indicators for tire-condition monitoring. In the present study, the principal response occurred near 20 Hz, with harmonics at approximately 40 and 60 Hz, while another component occurred near 62.5 Hz with harmonics at approximately 125 and 187.5 Hz. Although these frequencies remained broadly similar, the deformation-velocity response differed by approximately 9% between the new and service-aged conditions. This suggests that changes in harmonic amplitude may be more sensitive to service degradation than shifts in resonance frequency. However, because the analysis was based on one tire specimen, the 9% difference cannot be treated as a general quality-control threshold. Establishing diagnostic limits will require testing multiple tires at controlled degradation levels and will be considered in future research. The occurrence of multiple harmonic patterns can be attributed to the complex layered construction of pneumatic tires, which consists of heterogeneous materials such as rubber compounds, reinforcing cords, steel belts, and textile components. The interactions among these elements creates several coupled vibration modes that are reflected in the measured frequency spectra. Although several tire-surface regions were measured repeatedly, the experimental program involved only one tire specimen and two service-condition endpoints. Therefore, the observed differences characterize the investigated specimen.
Although the resonance frequencies remain generally comparable between the new and service-aged tires, noticeable differences are observed in the magnitude of the vibration response. The service-aged tire demonstrates altered deformation velocity characteristics compared with the new tire, indicating changes in structural stiffness, damping properties, and material elasticity caused by operational loading and environmental exposure. The average deviation in deformation velocity between the two tires is approximately 9% at corresponding frequency points, with the most pronounced differences occurring near the identified resonance peaks (refer to Figure 3).
The increased or reduced response amplitudes of the service-aged tire at specific resonant frequencies can be associated with the gradual degradation of the rubber matrix, changes in interlayer adhesion, and modifications in the mechanical properties of the reinforcing elements after prolonged service operation. These ageing-related effects influence the energy dissipation capability and dynamic stiffness of the tire structure, resulting in measurable differences in vibration behaviour even though the fundamental resonance frequencies remain similar. Therefore, FFT-based vibration analysis provides a sensitive method for identifying service-induced changes in tire dynamic performance and evaluating the influence of ageing on composite tire structures.
3. Computational Modelling of Tires
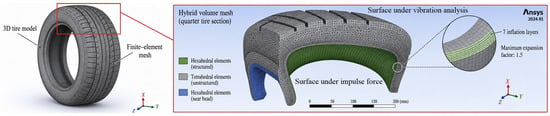
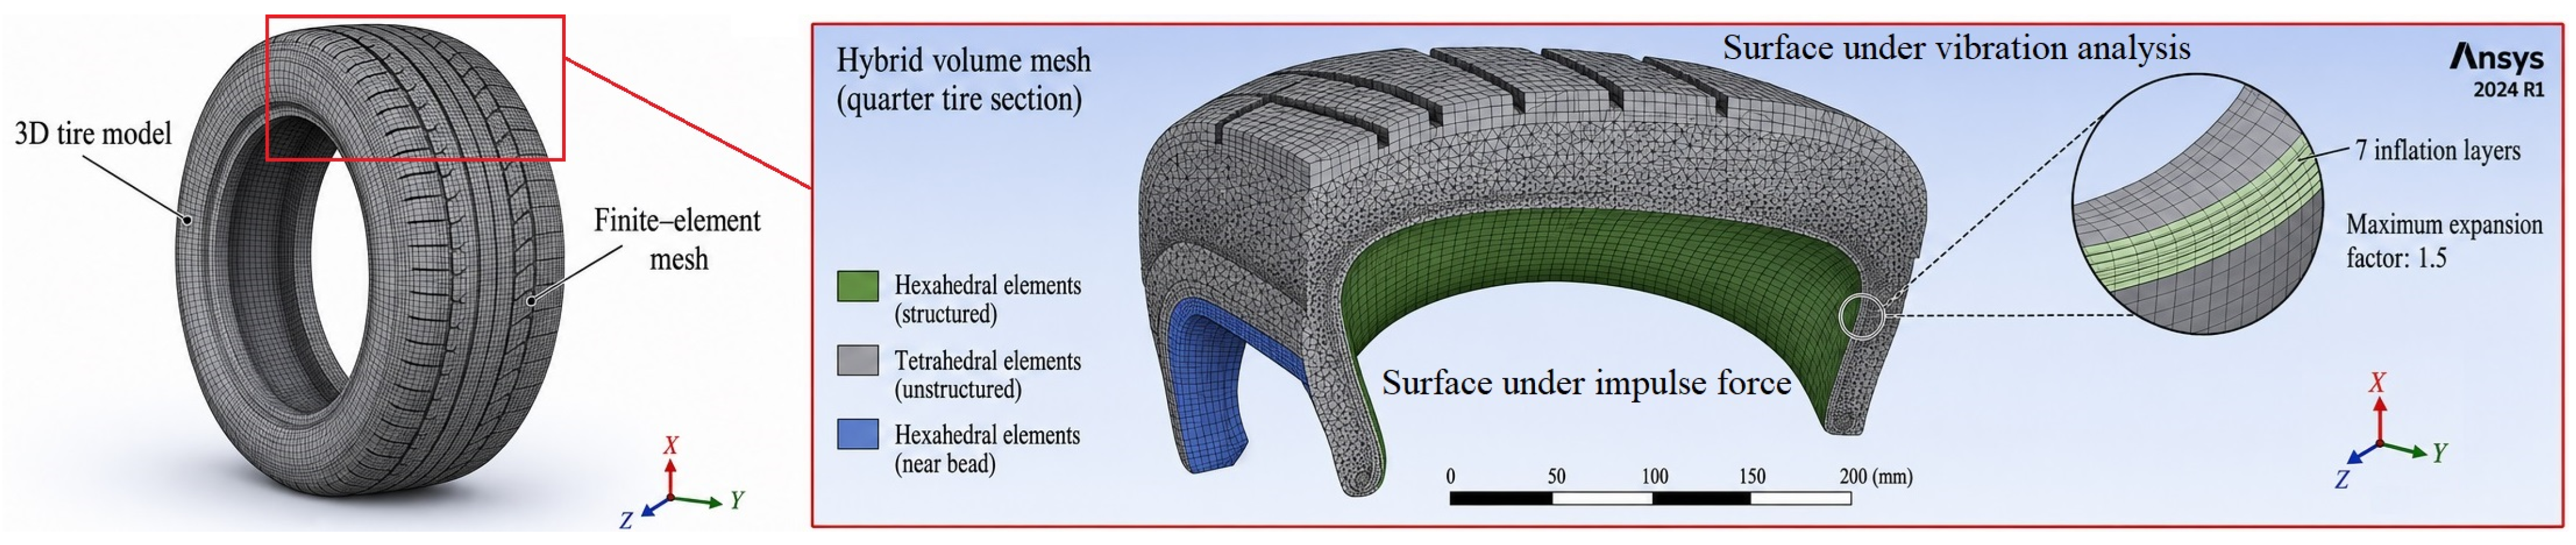
The numerical investigation was carried out using the FEM implemented in the commercial ANSYS® 2024 R1 software package. A full three-dimensional tire model was developed during the simulations. The tire geometry was discretized into a three-dimensional finite element mesh composed of hybrid hexahedral and tetrahedral elements. To improve the representation of transient responses within the near-wall regions, as many as seven inflation layers were generated, with a maximum expansion factor of 1.5 (see Figure 4).
Figure 4.
FEM tire numerical model.
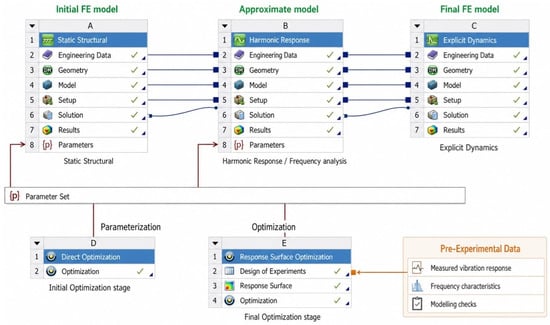
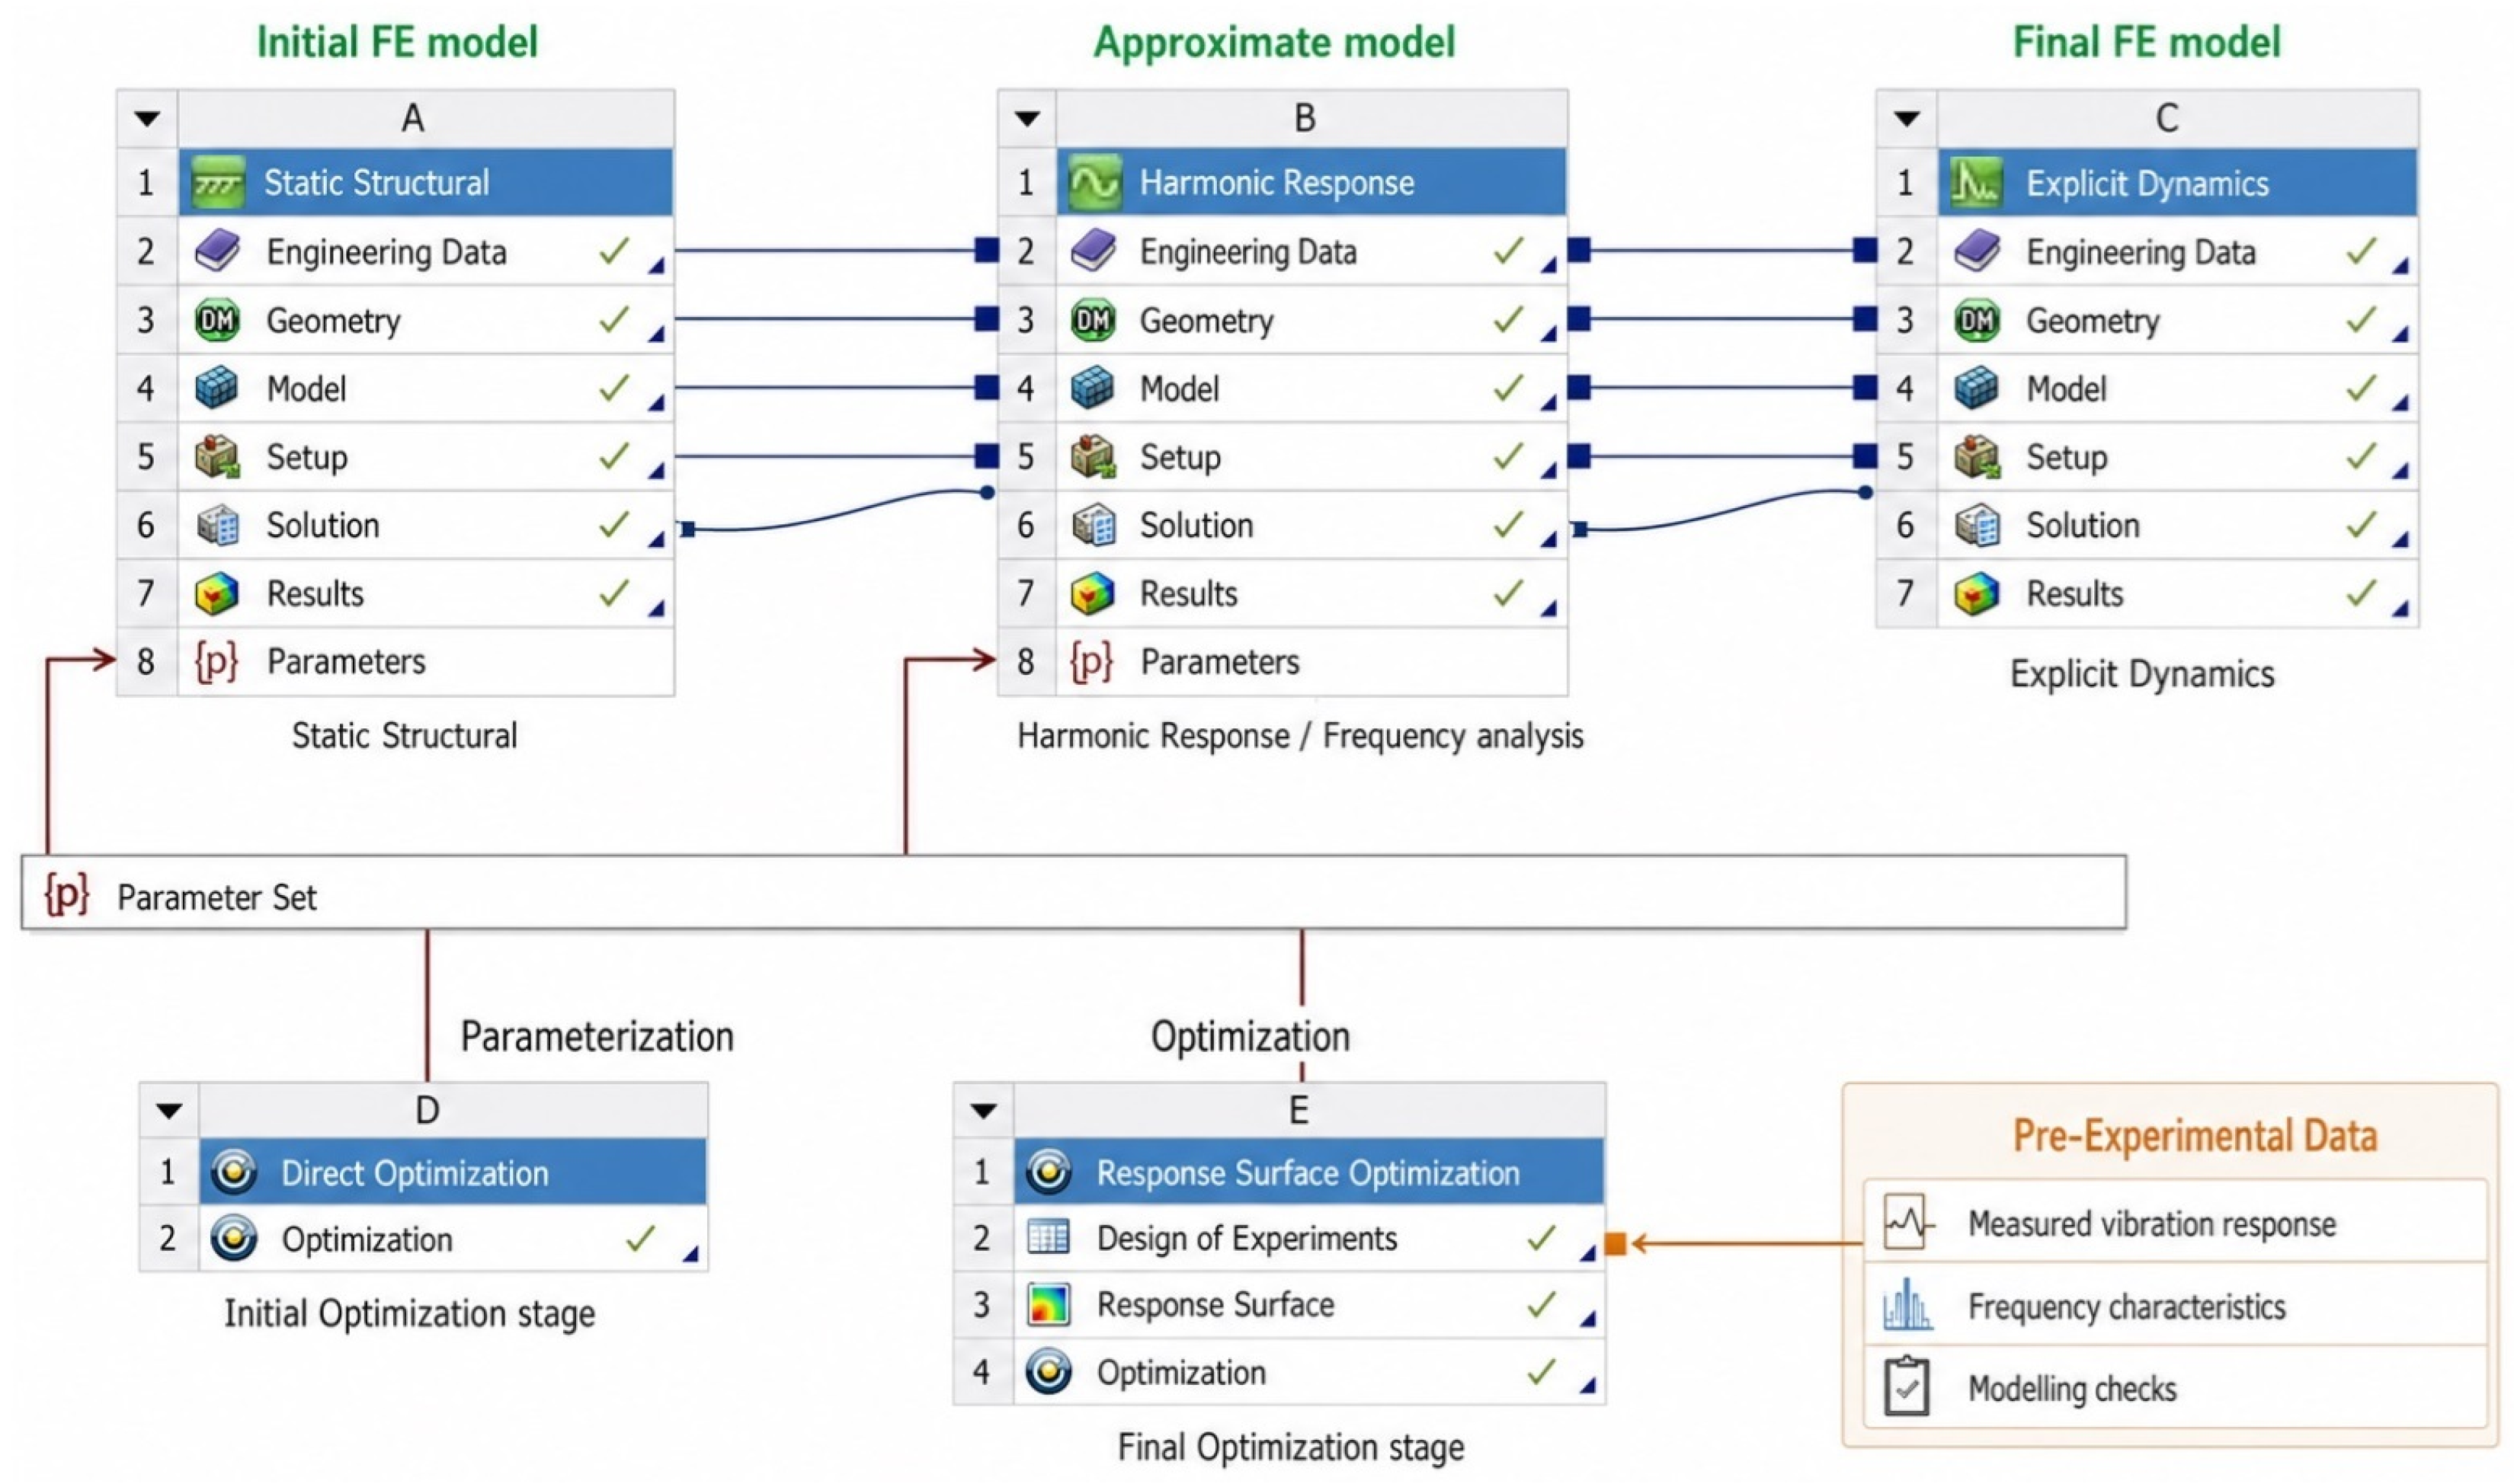
The overall modelling procedure consisted of a design optimization workflow in which the numerical tire model was calibrated using experimental measurements. The complete optimization framework implemented in ANSYS® is presented in Figure 5. Separate parameter sets were obtained for the new and service-aged tire conditions. In ANSYS®, the equivalent stiffness and damping properties were adjusted until the calculated resonance frequencies and vibration-response amplitudes agreed with the corresponding FFT measurements. The optimization strategy included the following stages.
Figure 5.
Complete optimization framework implemented in block-schemes of ANSYS®.
Model parameterization: The design variables were identified, and the numerical model was simplified to reduce computational complexity while preserving its physical characteristics.
Pre-experimental investigation: Experimental testing provided reference data for validating the numerical model and supplied the information required to reduce modelling inaccuracies in simulations of the composite tire structure.
Finite element simulations: A simulation database was generated using the pre-experimental data. During each optimization iteration, the finite element model was updated while maintaining identical numerical solution settings.
Surrogate modelling: The Kriging surrogate model was constructed from 30 design points generated using an optimal space-filling design. Four equivalent tire parameters—elastic modulus, density, damping ratio, and Poisson’s ratio—were varied within ±20% of their initial values. Ordinary Kriging with a Gaussian correlation function was used to approximate the vibration-response amplitude and resonance frequency. Five additional design points were used for validation. The surrogate model was accepted when the prediction error was below 5%, and optimization was terminated when the objective function change between successive iterations was below 2%.
Optimization procedure: An optimization algorithm was applied to minimize the objective function by iteratively adjusting the selected design variables.
Dynamic simulations were performed using the FEM together with the Newmark time integration scheme implemented in ANSYS®. According to [32,33], the governing equations of the numerical model can be expressed as follows:
where are internal forces; are external forces; {}t, {}t, {q}t are the acceleration, velocity and displacement vectors at solution time (t); and [M], [C] and [K] are matrices of masses, damping and stiffness, respectively.
Assuming that the variable vectors vary linearly within each time step, the equations governing acceleration, velocity, and displacement take the following form:
where b1–b6 are the calculated integration constants in simplified form:
where γ and β are specified dimensionless integration parameters. In the present simulations, the Newmark average-acceleration parameters were set to β = 0.25 and γ = 0.50, corresponding to the standard ANSYS implicit time-integration settings.
The selected Newmark integration approach reduces computational effort because only the diagonal mass matrix must be inverted, thereby eliminating repeated inversion of the global stiffness matrix. Although this considerably improves computational efficiency, the method is conditionally stable and therefore requires the integration time step size to satisfy the corresponding stability criterion:
where ωmax is the highest element frequency in the structural system mesh.
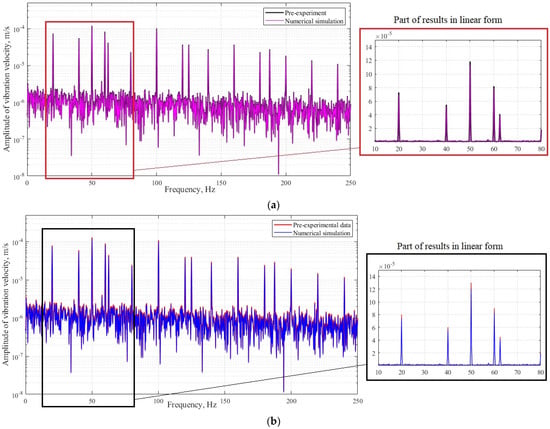
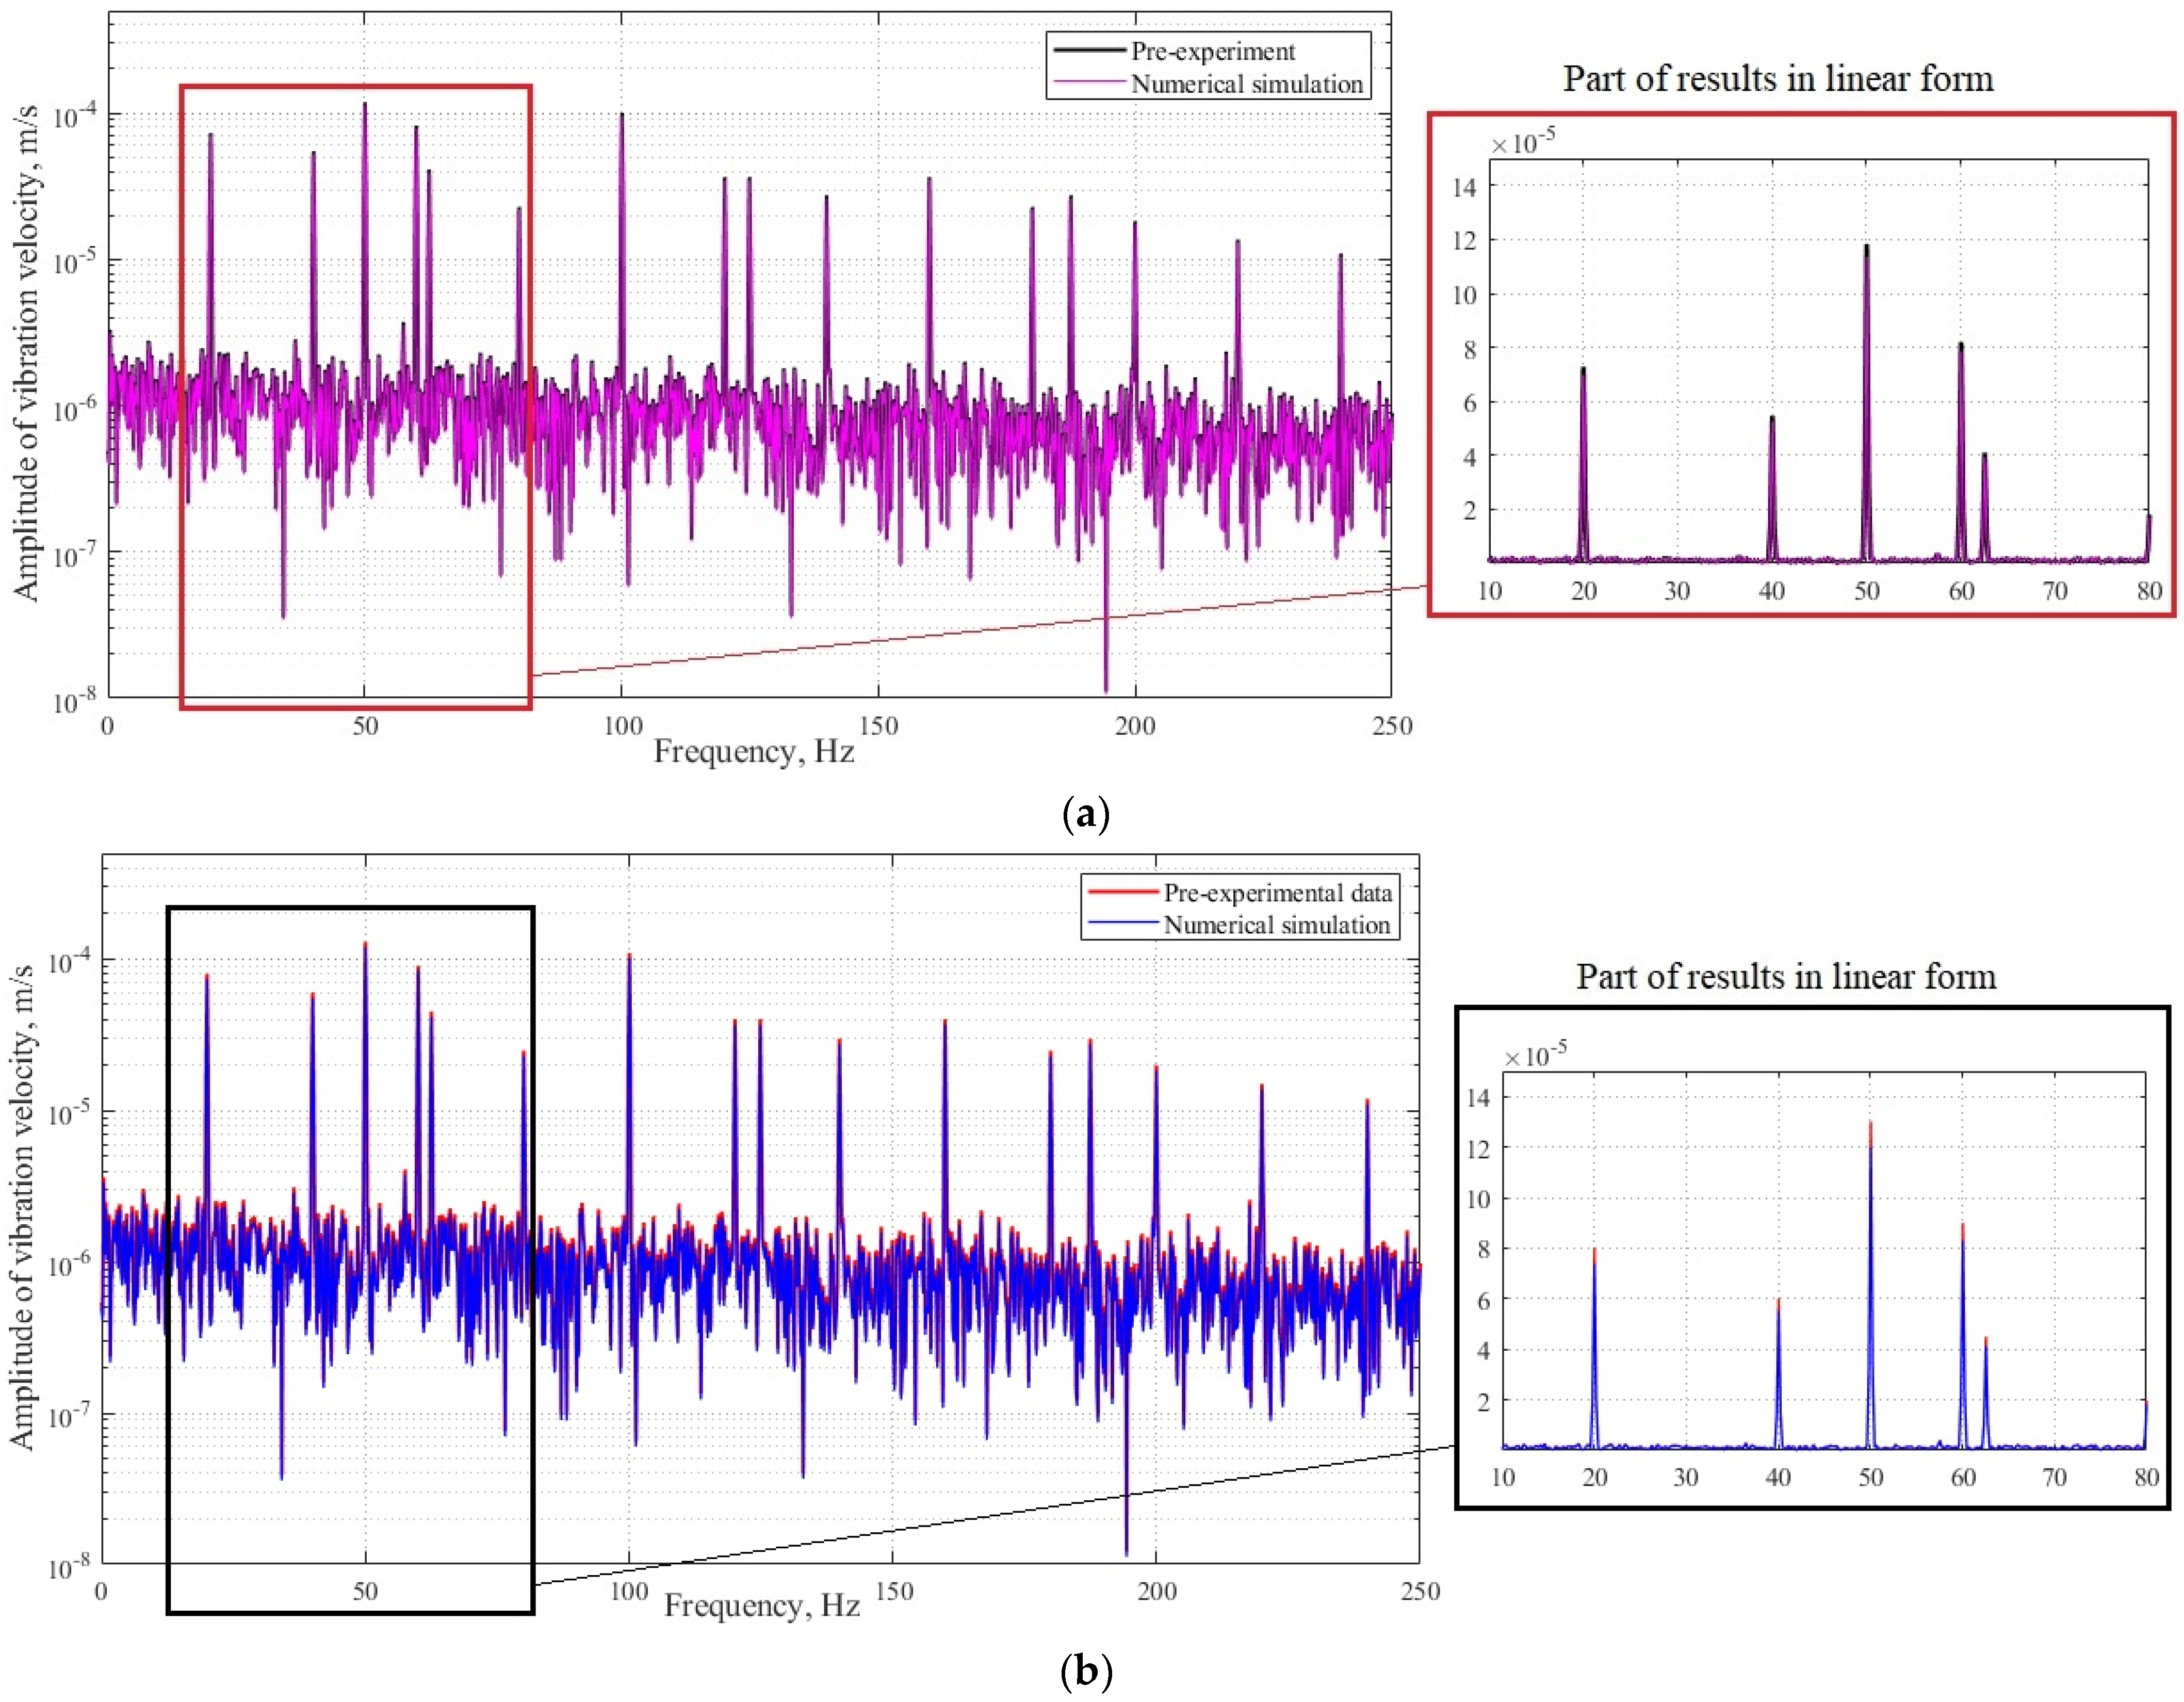
Following the optimization process, the numerical model was used to evaluate several response quantities. Figure 6 (presented on a logarithmic scale for clearer comparison) compares the frequency response of the tire surface deformation velocity obtained from experimental measurements with the corresponding response obtained from the numerical simulation after optimisation.
Figure 6.
Frequency response comparison between pre-experimental measurements numerical simulation results presented on a logarithmic scale: (a) new tire; (b) service-aged tire.
Separate calibration was performed for the new and service-aged tire conditions using their respective measured FFT responses. The equivalent tire parameters in ANSYS were adjusted until the simulated vibration-response amplitude and resonance frequencies agreed with the measurements.
The optimized numerical model demonstrated excellent agreement with the experimental data for the new tire. Across most of the investigated frequency range, the discrepancy between the measured and simulated responses remained below approximately 4%, while the deviation in the resonance frequencies did not exceed 2%. Although some differences in the logarithmic velocity amplitude spectrum were still observed at several frequencies, these discrepancies occurred at relatively low amplitude levels and therefore had only a minor influence on the overall response.
For the service-aged tire, the optimization procedure was less effective because of material degradation and the increased variability of the tire’s mechanical properties after long-term service. As a result, the agreement between the numerical and experimental responses was slightly reduced. The discrepancy between measured and simulated frequency responses remained below approximately 6–8% over most of the investigated frequency range, while the resonance frequency deviation increased to approximately 3–4%. Nevertheless, these differences remained within an acceptable range for engineering applications and did not significantly affect the prediction of the overall dynamic response.
Overall, the results confirm that the proposed methodology, which combines experimental characterization, finite element analysis, and numerical optimization, accurately represents the dynamic behaviour of both new and service-aged composite tire. Although the predictive accuracy is higher for new tires, the validated numerical model also provides reliable simulations of service-aged tires, making it suitable for investigating vehicle tire dynamics under operational loading conditions.
Compared with detailed composite and embedded-rebar approaches [28,29], the proposed framework uses experimental vibration data to calibrate the global tire response, reducing the need for constituent-level material characterization. The simulation–experiment differences remained below approximately 4% for the new tire and 6–8% for the service-aged tire across most of the investigated frequency range. Thus, the method provides a practical balance between modelling complexity and global predictive accuracy. A direct computational-cost comparison with alternative modelling approaches will be considered in future research.
4. Assessment of Operating Conditions Associated with Tire Failure Risk
The tire inflation process was represented numerically by applying internal pressure to the inner cavity of the pneumatic tire. The reference simulation employed an inflation pressure of 2.413 bar (35 psi), corresponding to the manufacturer’s recommended operating condition for the investigated tire. Additional simulations were performed with the inflation pressure reduced by 10% (to 2.172 bar/31.5 psi), 20% (to 1.930 bar/28 psi), and 30% (to 1.689 bar/24.5 psi) relative to the reference value.
The contact regions between the tire and the wheel rim were defined as the supporting boundaries of the model, whereas the outer tread surface interacted with the road. The road was represented as a rigid surface to isolate the effects of tire inflation pressure, vertical load, and service ageing from pavement-related variables and to maintain identical contact boundary conditions across all simulations. This assumption is suitable for the comparative purpose of the present study because the same road representation was used for every tire condition. Nevertheless, it neglects local asphalt-pavement compliance, viscoelastic deformation, and surface microtexture. These factors may alter the size and shape of the contact patch and redistribute local contact pressures and stresses. Therefore, the calculated contact-stress results should be interpreted primarily as comparative indicators of the effects of pressure, load, and ageing rather than as a detailed prediction of the local stress distribution within a deformable asphalt pavement.
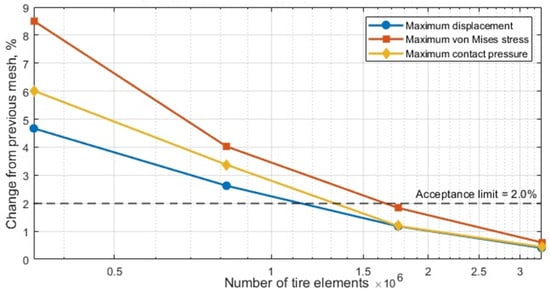
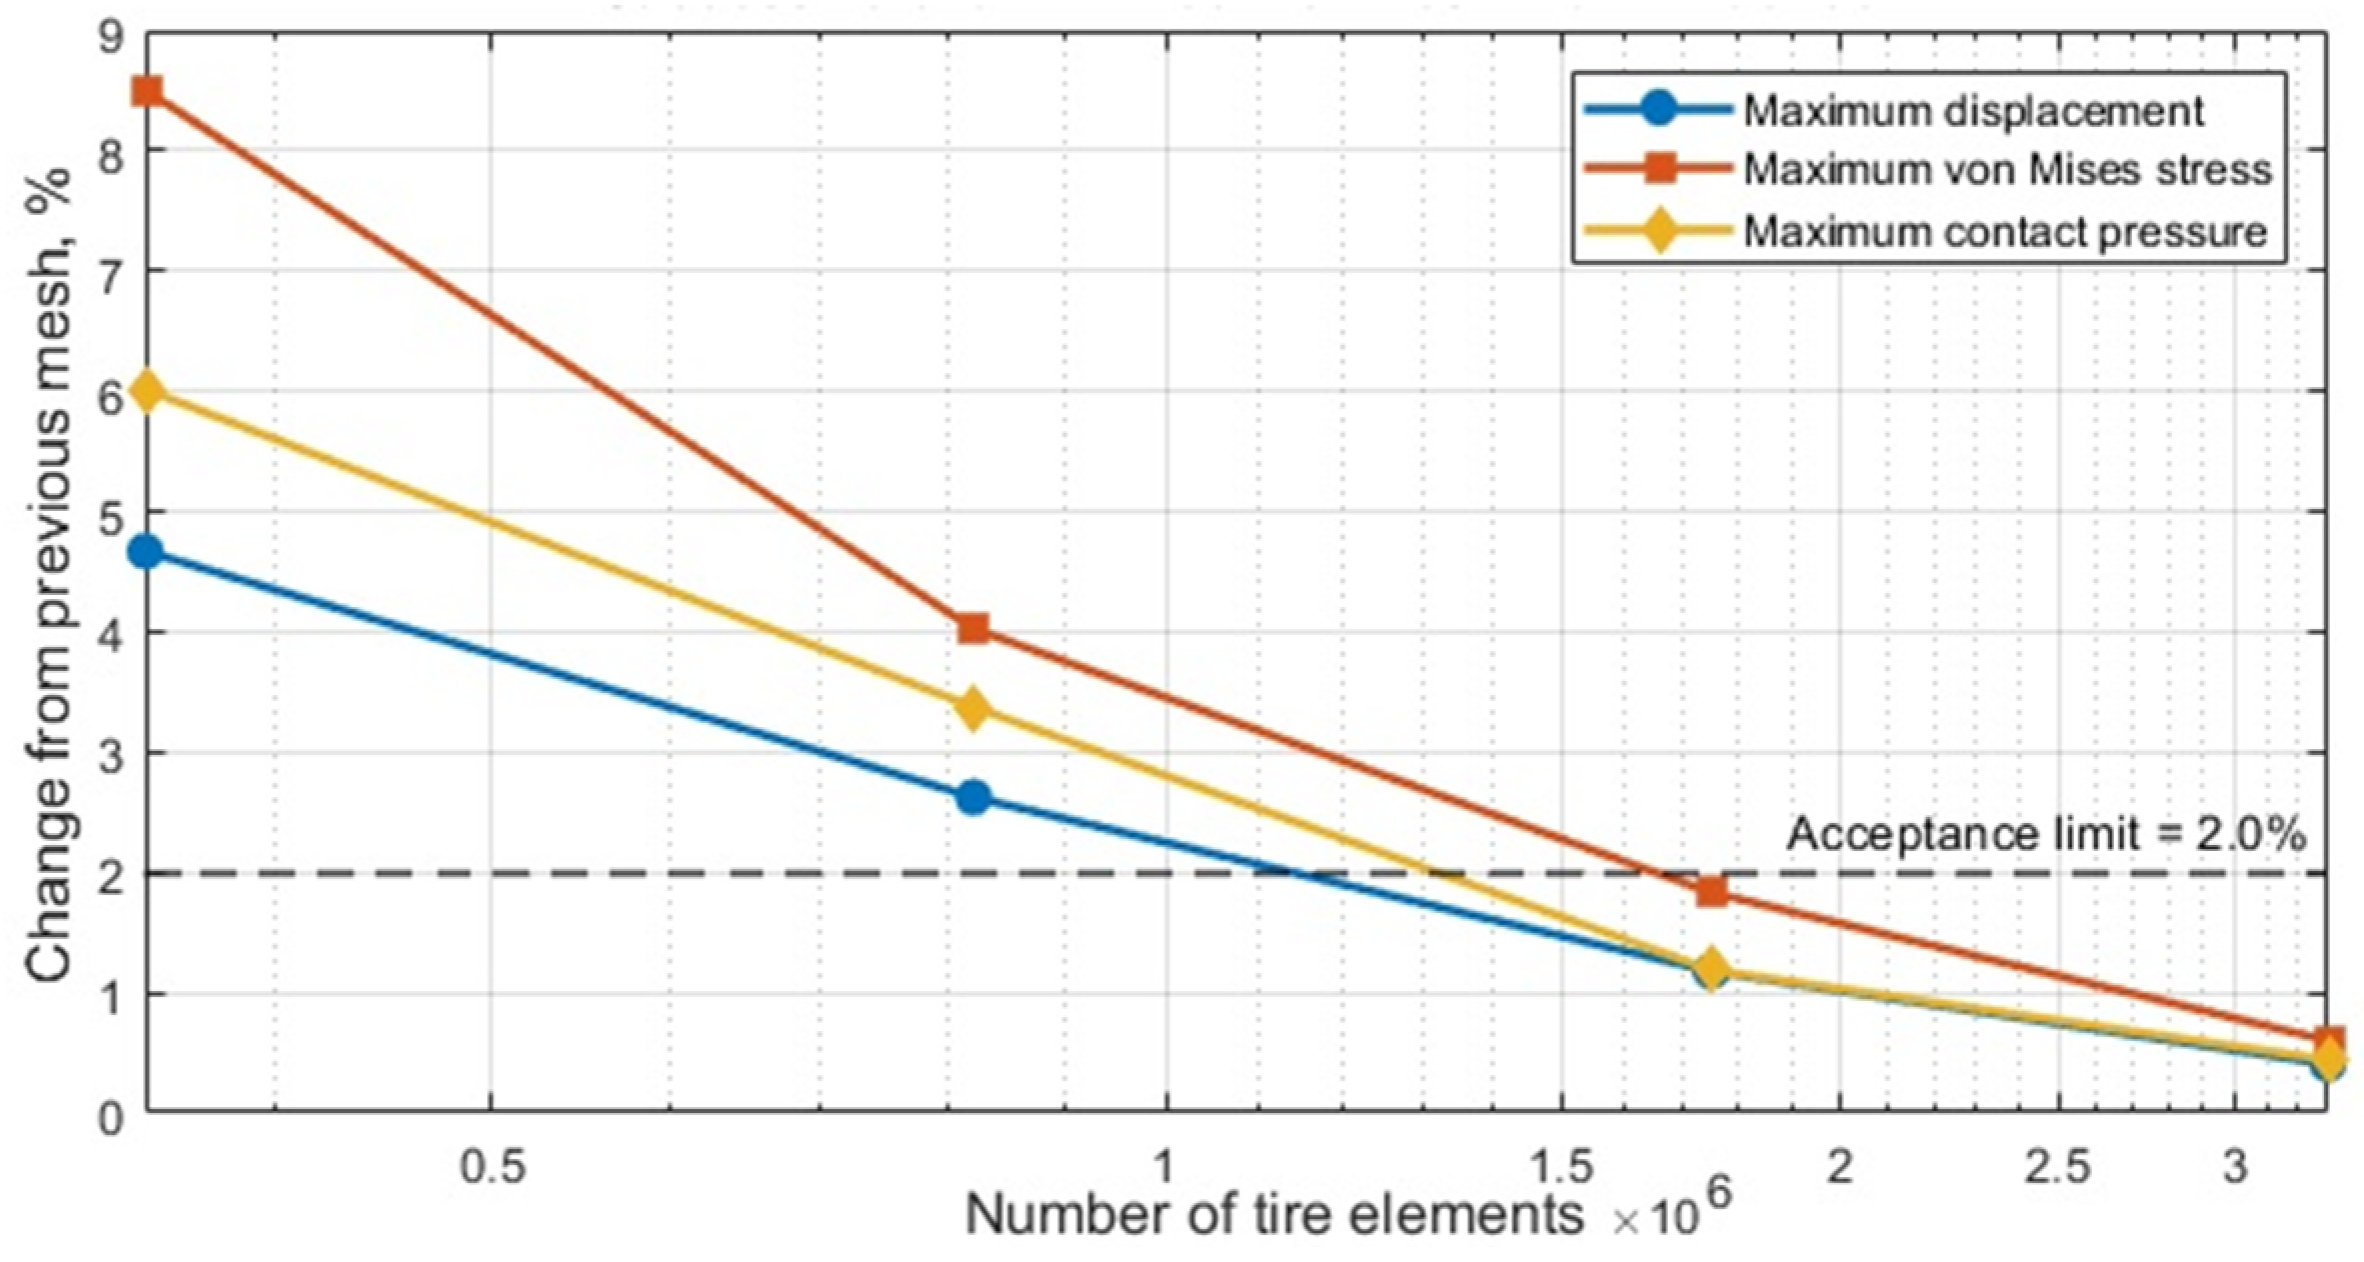
A mesh dependence study was conducted to verify that the numerical response of the tire–road FEM was sufficiently independent of the spatial discretization. Five progressively refined meshes were generated, with particular refinement applied to the tire tread, shoulder, sidewall, and tire–road contact region, where high gradients in deformation, stress, and contact pressure were expected. For all mesh configurations, the tire geometry, material properties, inflation pressure, applied vertical load, contact formulation, and boundary conditions were maintained constant. Mesh convergence was evaluated by comparing the maximum tire displacement, maximum von Mises stress, and maximum tire–road contact pressure obtained from each analysis. The results were plotted against both the characteristic element size and the total number of tire elements. In addition, the percentage changes between successive mesh levels were calculated for each monitored quantity, summarized, and are presented in Figure 7.
Figure 7.
Summary of the mesh-dependence study results.
Mesh independence was considered achieved when the percentage change in each selected response parameter between successive mesh levels fell below 2% (based on recommendations in [34]). The results showed that the solution gradually approached stable values as the tire mesh was refined. Consequently, the first mesh to satisfy the specified convergence criterion (Fine mesh) was selected for subsequent analyses, providing an appropriate compromise between numerical accuracy and computational cost.
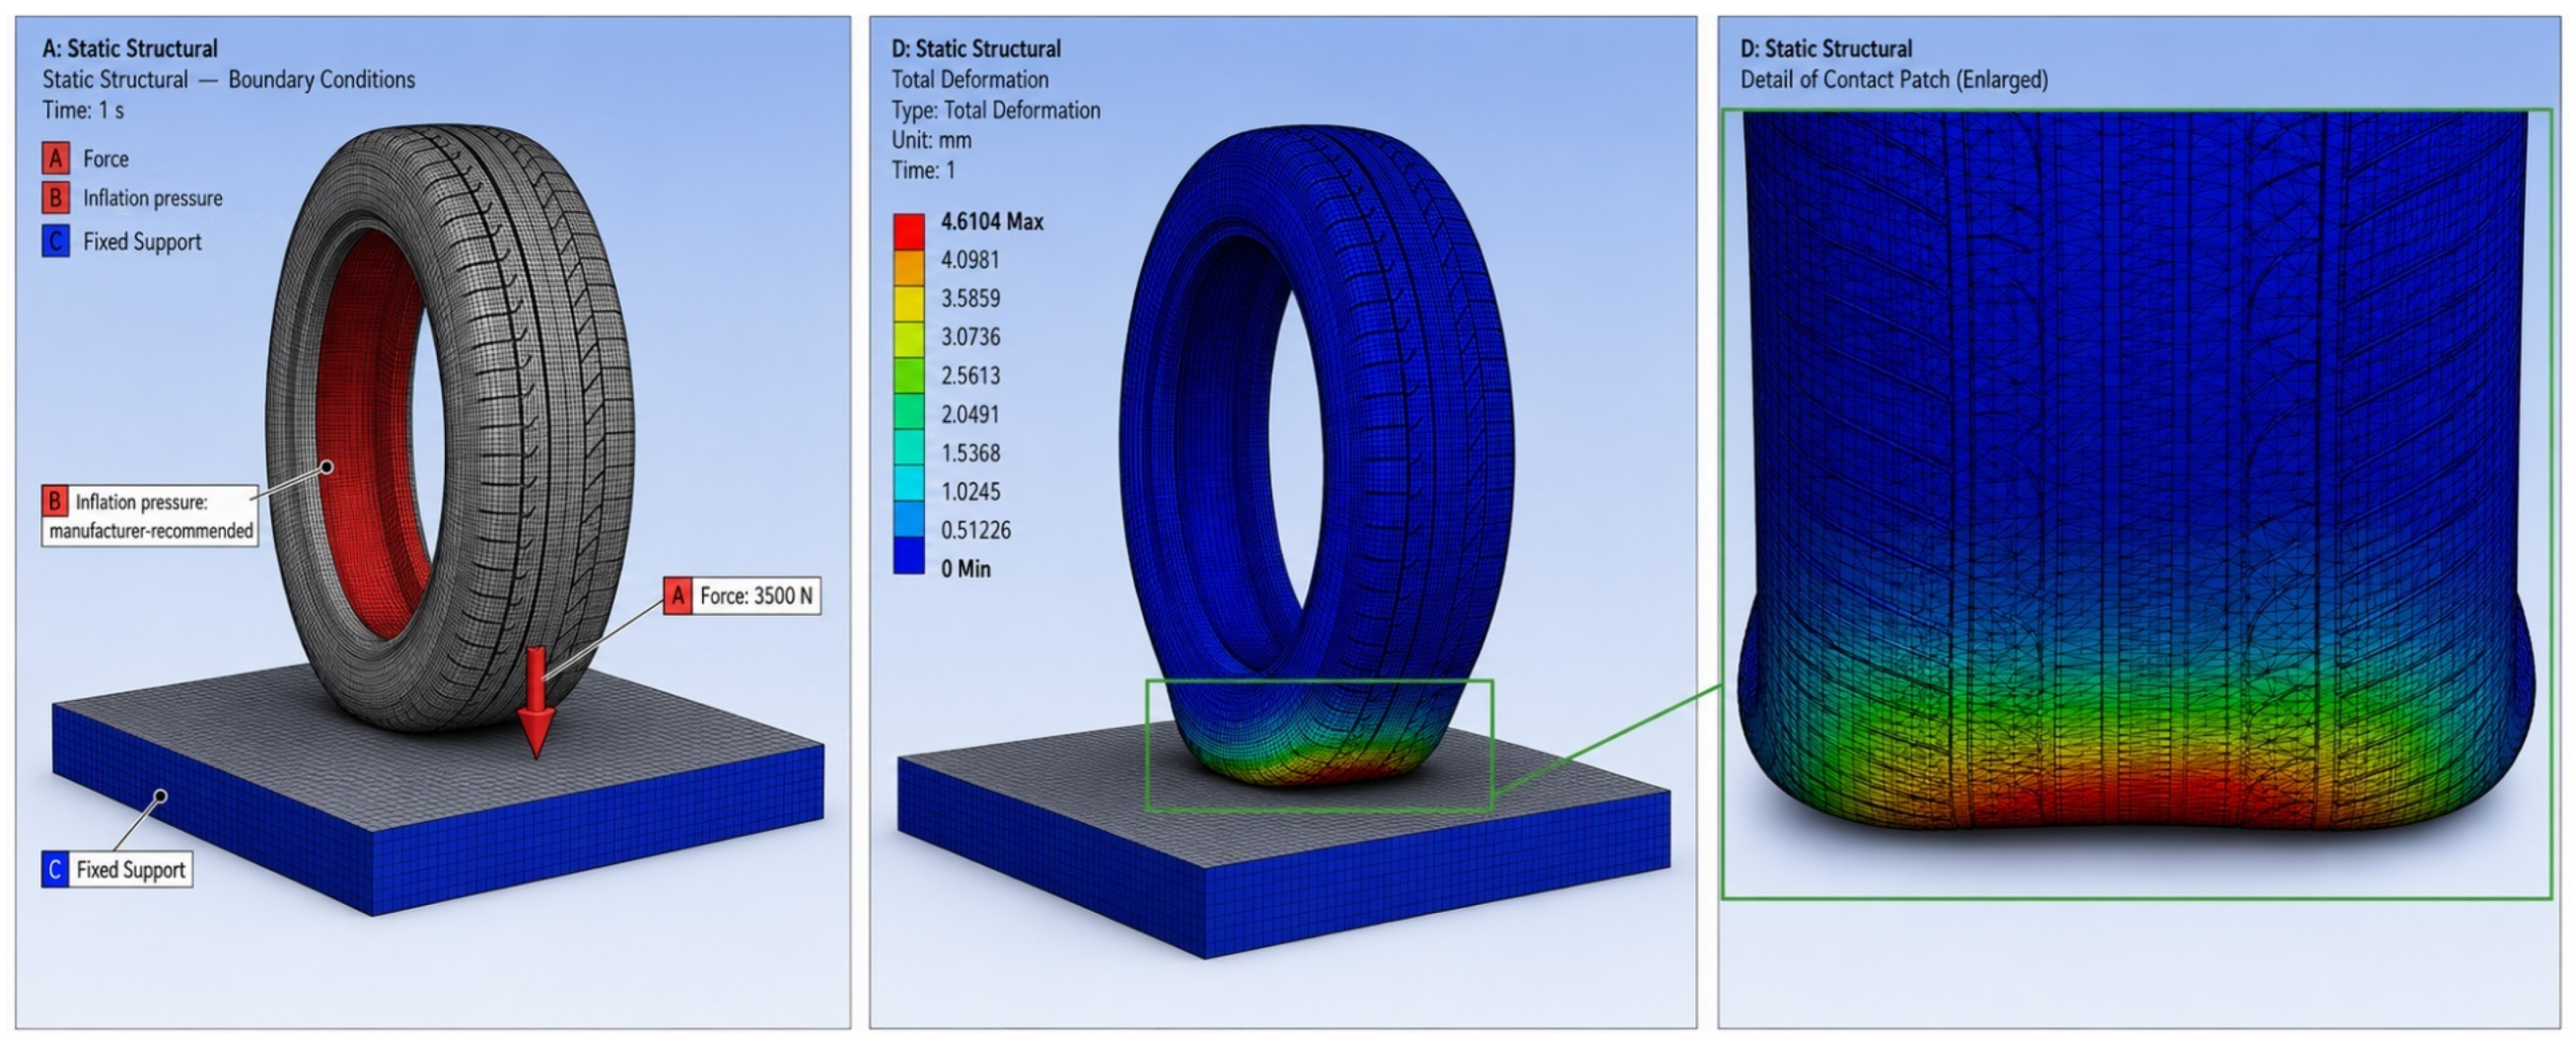
Finally, the adopted boundary conditions and representative examples of the simulated tire response are presented in Figure 8.
Figure 8.
Boundary conditions used in the model and an example visualization of the simulation results (3.5 kN external load (the midpoint of the applied load range) on a new tire with manufacturer-recommended inflation pressure).
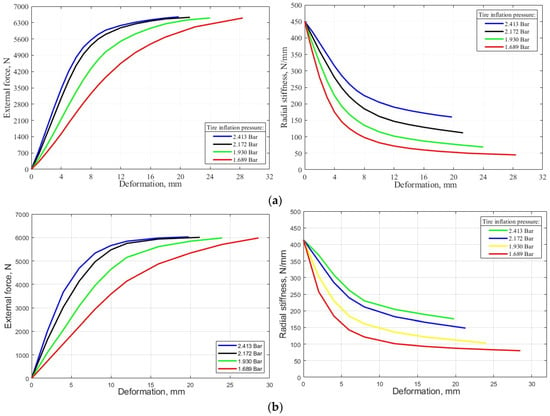
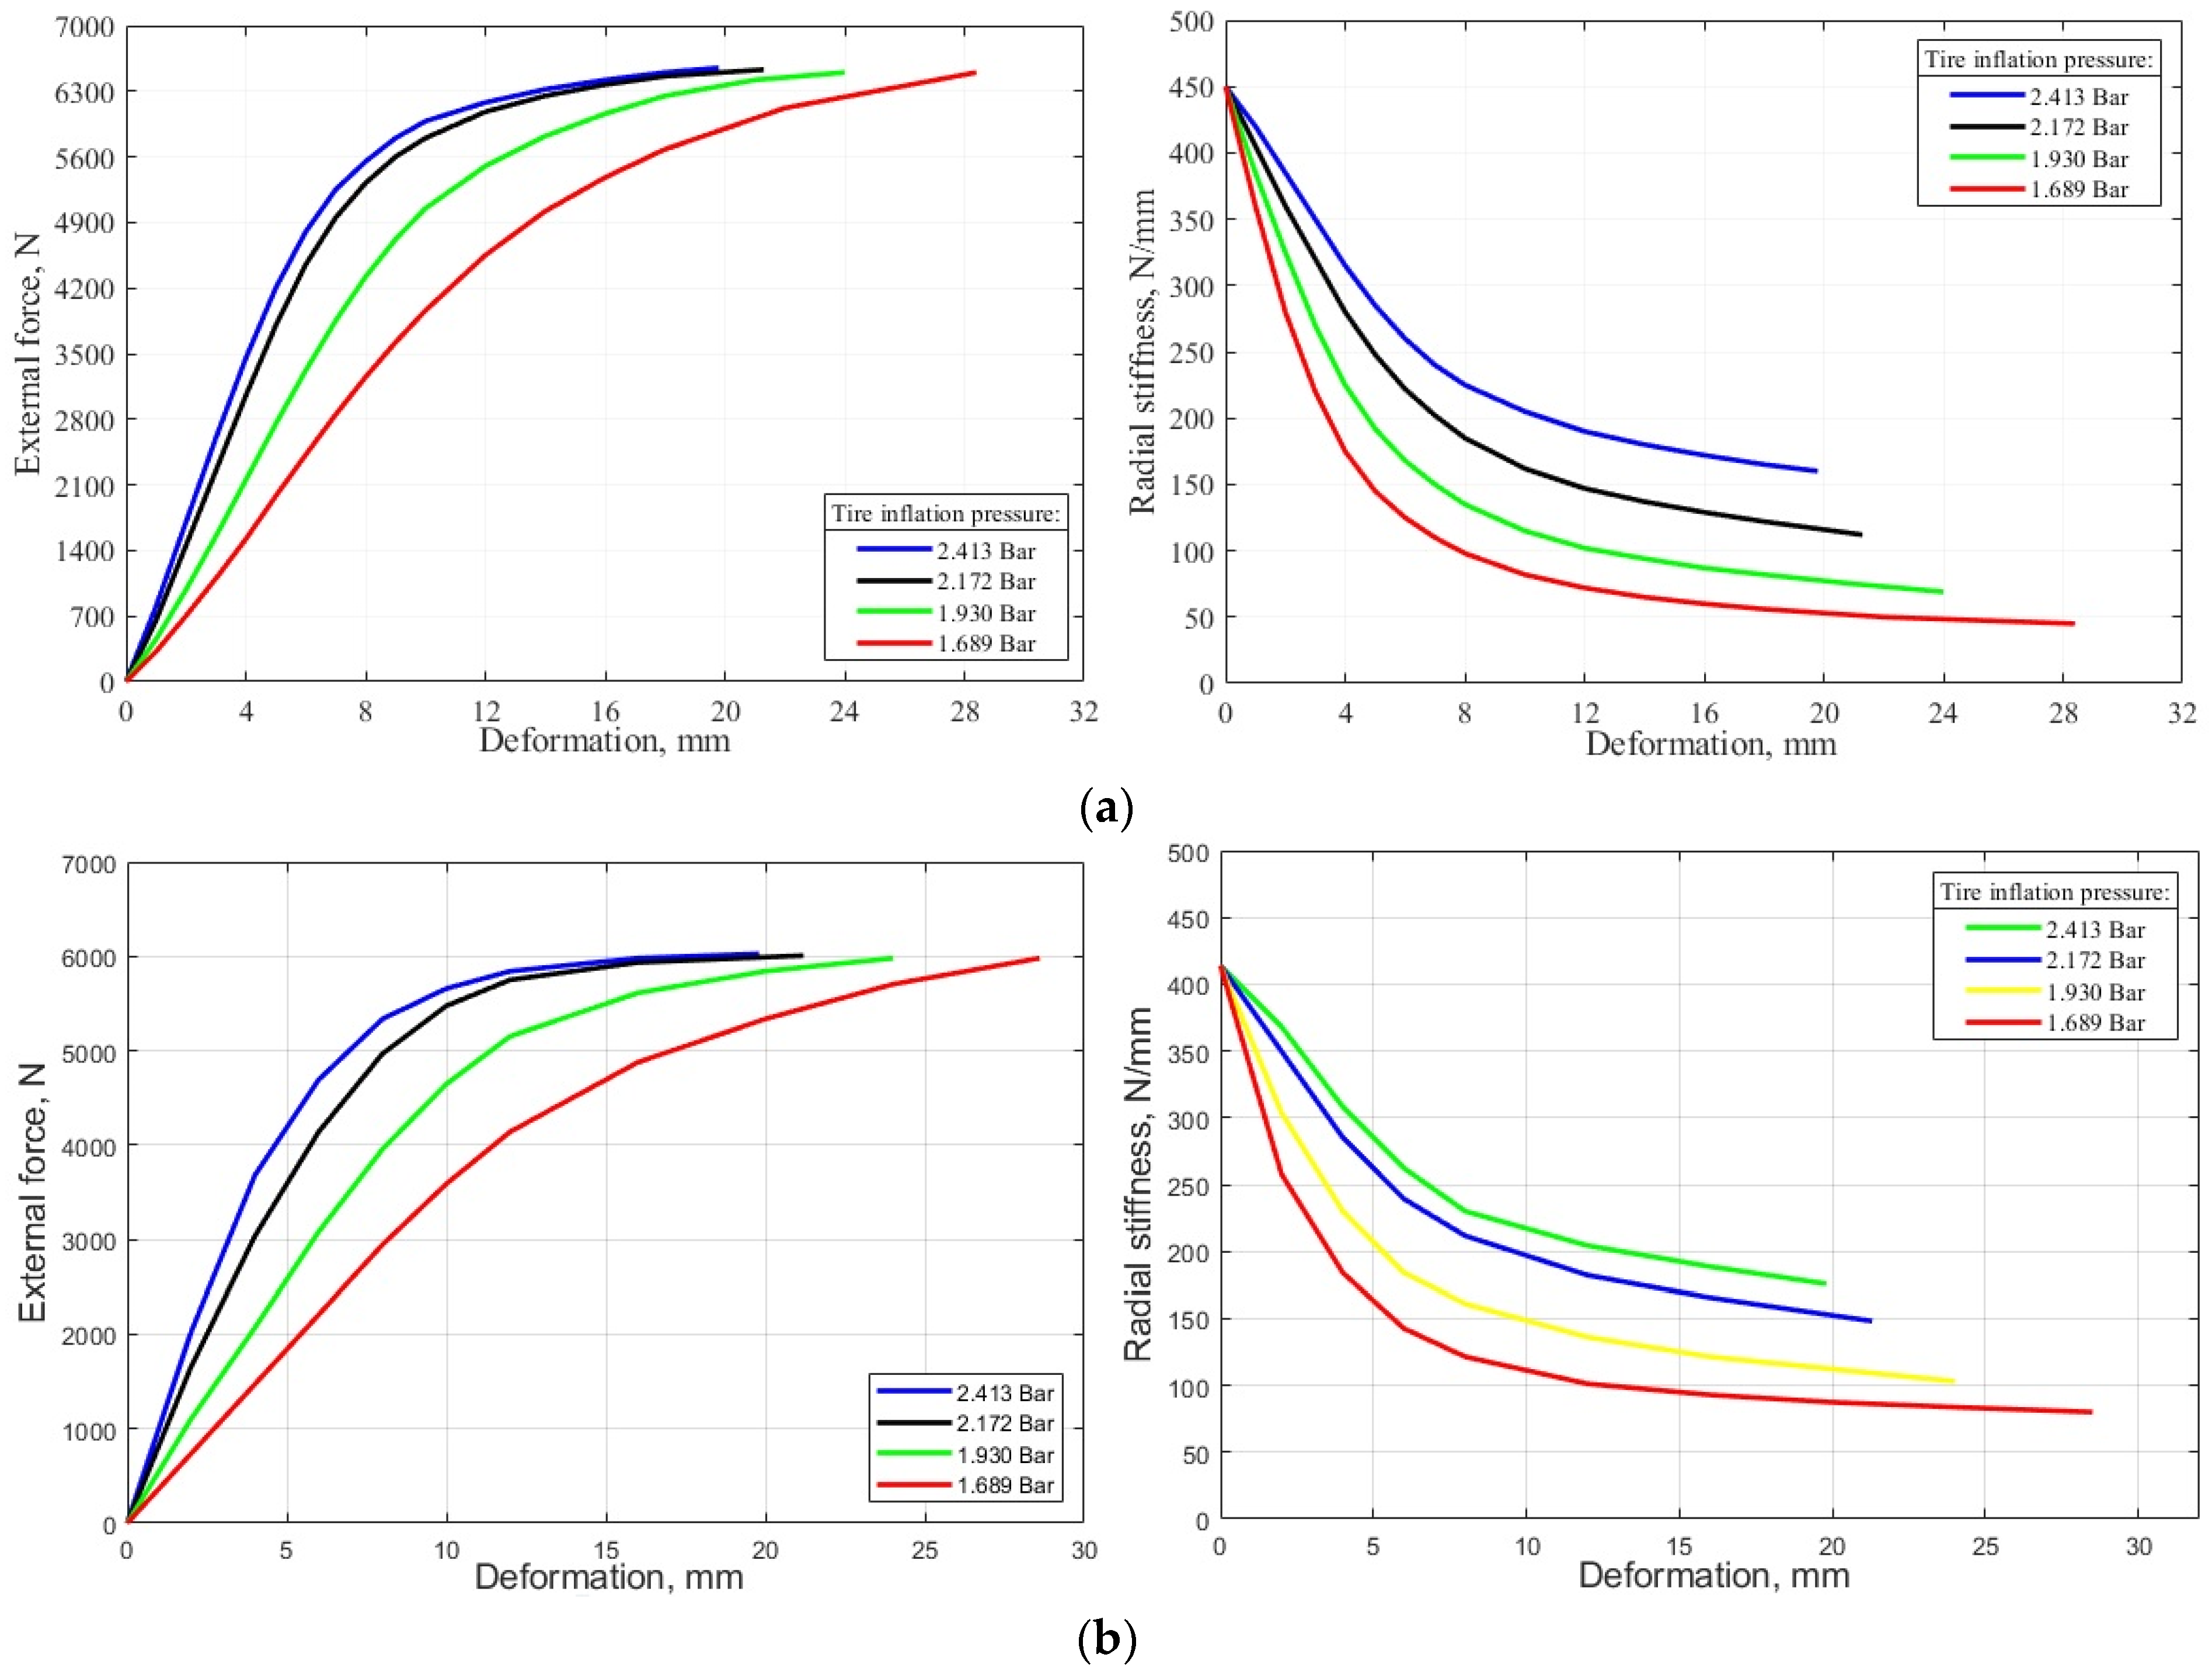
A comprehensive set of simulation results was generated for both new and service-aged tires. For comparative evaluation, the most relevant output parameters were selected and are presented as force–deformation and radial-stiffness–deformation relationships. Figure 9 compares the simulated force–deformation responses and radial stiffnesses of the new and service-aged tires at the recommended inflation pressure of 2.413 bar and at pressure reductions of 10%, 20%, and 30%.
Figure 9.
Influence of inflation pressure on tire mechanical response—external force versus deformation (left) and radial stiffness versus deformation (right): (a) new tire; (b) service-aged tire.
For both tires, reducing the inflation pressure shifts the force–deformation curves toward greater deformation. The tire inflated to 2.413 bar consistently exhibits the smallest deformation and the highest radial stiffness, whereas the lowest inflation pressure of 1.689 bar produces the largest deformation and the most rapid reduction in stiffness. The nonlinear shape of the curves reflects the combined response of the rubber compounds, reinforcing layers, sidewalls, and changing tire–road contact area. Increased deformation under underinflation may also increase cyclic hysteretic energy dissipation and internal heat generation. The resulting temperature increase can accelerate rubber ageing, reduce interlayer durability, and promote fatigue damage. Because tire temperature and thermomechanical coupling were not evaluated in the present study, this mechanism is discussed qualitatively and will be investigated in future research.
The service-aged tire demonstrates a less favourable mechanical response than the new tire. At comparable external loads and inflation pressures, it generally undergoes greater deformation, while its maximum load response is approximately 6.0 kN, compared with approximately 6.5 kN for the new tire. Its radial stiffness also remains lower over the investigated deformation range. These differences indicate that service ageing reduces the tire’s structural reserve and its ability to resist additional deformation, particularly when the inflation pressure is below the manufacturer’s recommendation.
In both cases, radial stiffness decreases progressively as deformation increases. This behaviour indicates that each additional increment in load produces a disproportionately larger deformation as the tire approaches its load-carrying limit. The effect is especially pronounced at 1.689 and 1.930 bar. A load index of 91T (on tires) corresponds to a maximum rated load of approximately 615 kg, or approximately 6.03 kN under static gravitational loading. Consequently, the flattening of the force–deformation curves at approximately 6.0–6.5 kN suggests that the tire is approaching or exceeding its rated load range.
The combination of underinflation, excessive loading, and service ageing therefore creates the most critical condition. Increased sidewall deflection produces greater cyclic bending, while ageing may be associated with rubber hardening, micro-cracking, fatigue damage, and weakened adhesion between structural layers. These mechanisms can promote crack propagation, cord or belt separation, air leakage, and ultimately a tire blowout. The results consequently support maintaining the recommended inflation pressure and avoiding loads above the rated capacity, particularly for service-aged tires and electric vehicles, whose greater mass and high drive torque may impose more demanding tire-loading conditions.
The present numerical analysis is limited to the instantaneous mechanical response of the tire under prescribed inflation pressures and vertical loads. It was not intended to simulate fatigue-damage accumulation, crack initiation and propagation, or the complete progressive blowout process under long-term cyclic driving loads. Development of such a model requires additional experimental identification of the cyclic and fracture properties of the tire materials and their interfaces. Incorporation of a fatigue-damage constitutive model and a validated crack-propagation criterion will therefore be considered in the further development of this research.
5. Influence of Tire Inflation Pressure on Vehicle Braking Distance
The experimental study examined how tire inflation pressure affects vehicle stopping distance and compared the measured results with predictions from the numerical model. The experiments were conducted using both new and service-aged tires to determine whether service ageing affected the pressure-related braking response. The test vehicle had a curb mass of approximately 1444 kg, corresponding to an estimated static load of approximately 3.54 kN per tire (equivalent to a supported mass of 361 kg), and the procedure was adapted from the methodology described in [14,35]. The anti-lock braking system (ABS) was disabled to ensure consistent test conditions and permit evaluation of the vehicle’s unassisted braking behaviour. Each braking test began at 50 km/h, which corresponds to the general maximum speed limit in urban areas of the European Union.
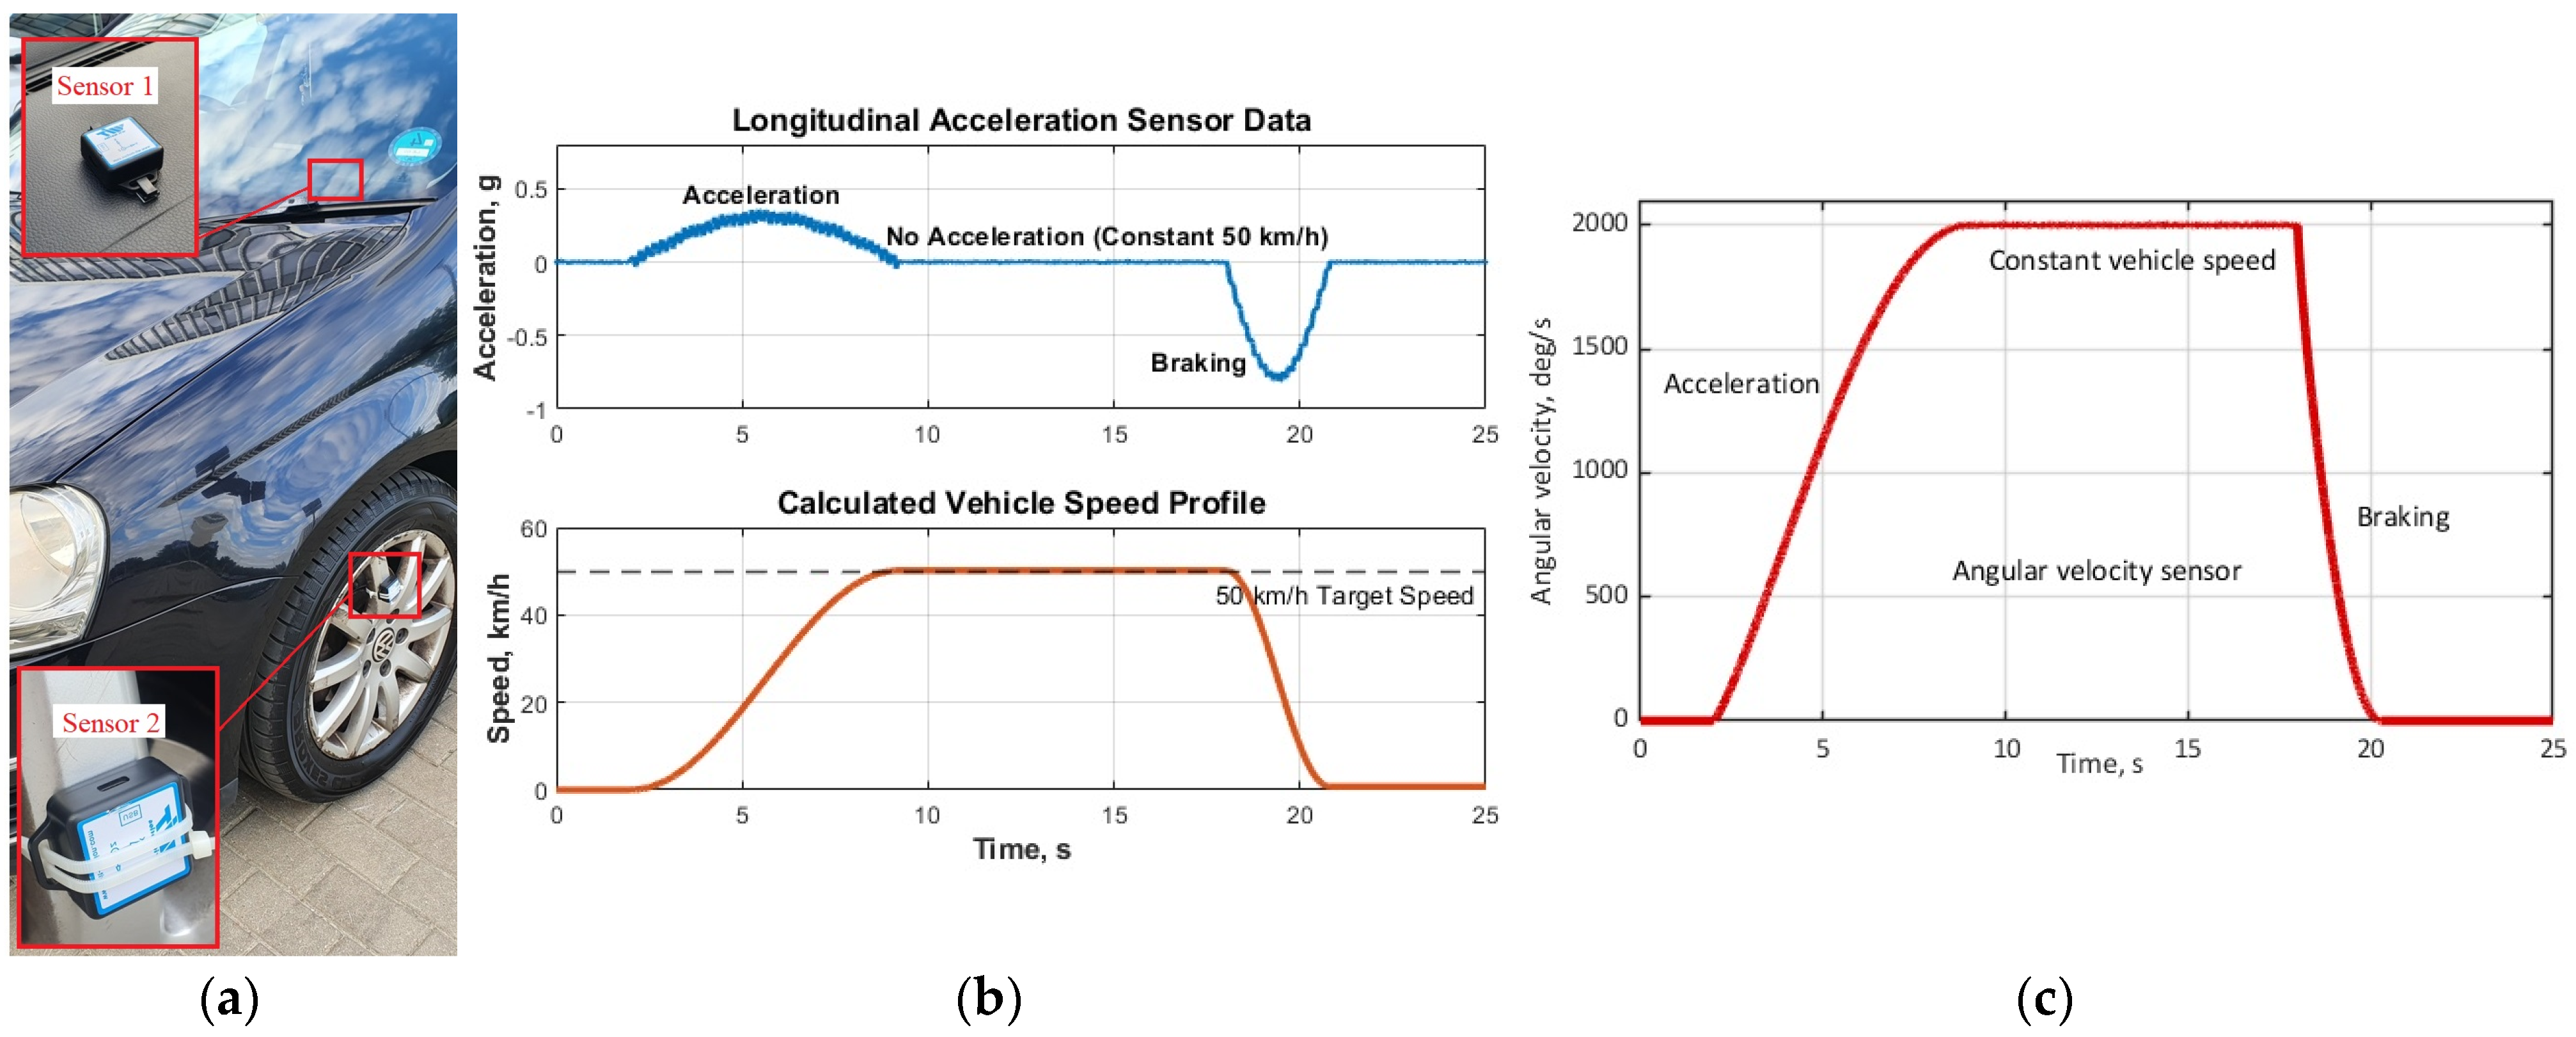
The braking tests were limited to dry asphalt at 20–22 °C; therefore, the results cannot quantify the additional effects of water, ice, low temperature, or pavement wear. These conditions will be investigated in future research using an extended multi-scenario testing framework. The test section had an undamaged AC 11 mastic asphalt–concrete surface containing aggregate particles of up to 11 mm. This pavement type is commonly used on main roads in Lithuania [36]. For each tire condition and inflation-pressure setting, the vehicle was accelerated to 50 km/h and stabilized at that speed. The driver then applied the brakes abruptly and maintained braking until the vehicle came to a complete stop. The braking distance was measured from the point at which braking was initiated to the vehicle’s final stopping position. Vehicle speed was monitored using a mobile-device application, while the overall testing procedure is illustrated in Figure 10.
Figure 10.
Experimental measurements illustration: (a) sensor installation; (b) example of sensor data acquisition—Sensor 1; (c) example of sensor data acquisition—Sensor 2.
Several repeated measurements were obtained for each combination of tire condition and inflation pressure to reduce the influence of random experimental variation. The collected data were processed according to the adopted methodology, and the mean braking distance was calculated for each test configuration based on limitations in analytical accuracy of comparing test results for analytical uncertainty, based on [37].
For each tire condition (new and service-aged) and inflation-pressure level, repeated braking-distance measurements were statistically processed. The arithmetic mean was used as the representative braking distance [37]:
where xi is an individual braking-distance measurement, and n = 5 is the number of repetitions.
The experimental variability was evaluated using the sample standard deviation:
The uncertainty of the mean was expressed using a 95% confidence interval:
where t0.975,n−1 is the Student’s t-value corresponding to a 95% confidence level and n − 1 degrees of freedom.
The summarized experimental results are provided in Table 1.
Table 1.
Summary of the effect of tire inflation pressure on the measured braking distance.
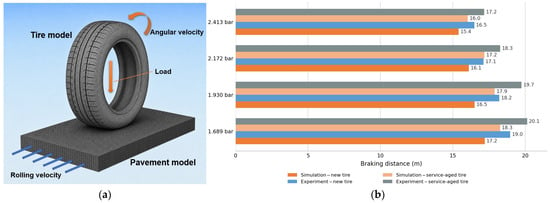
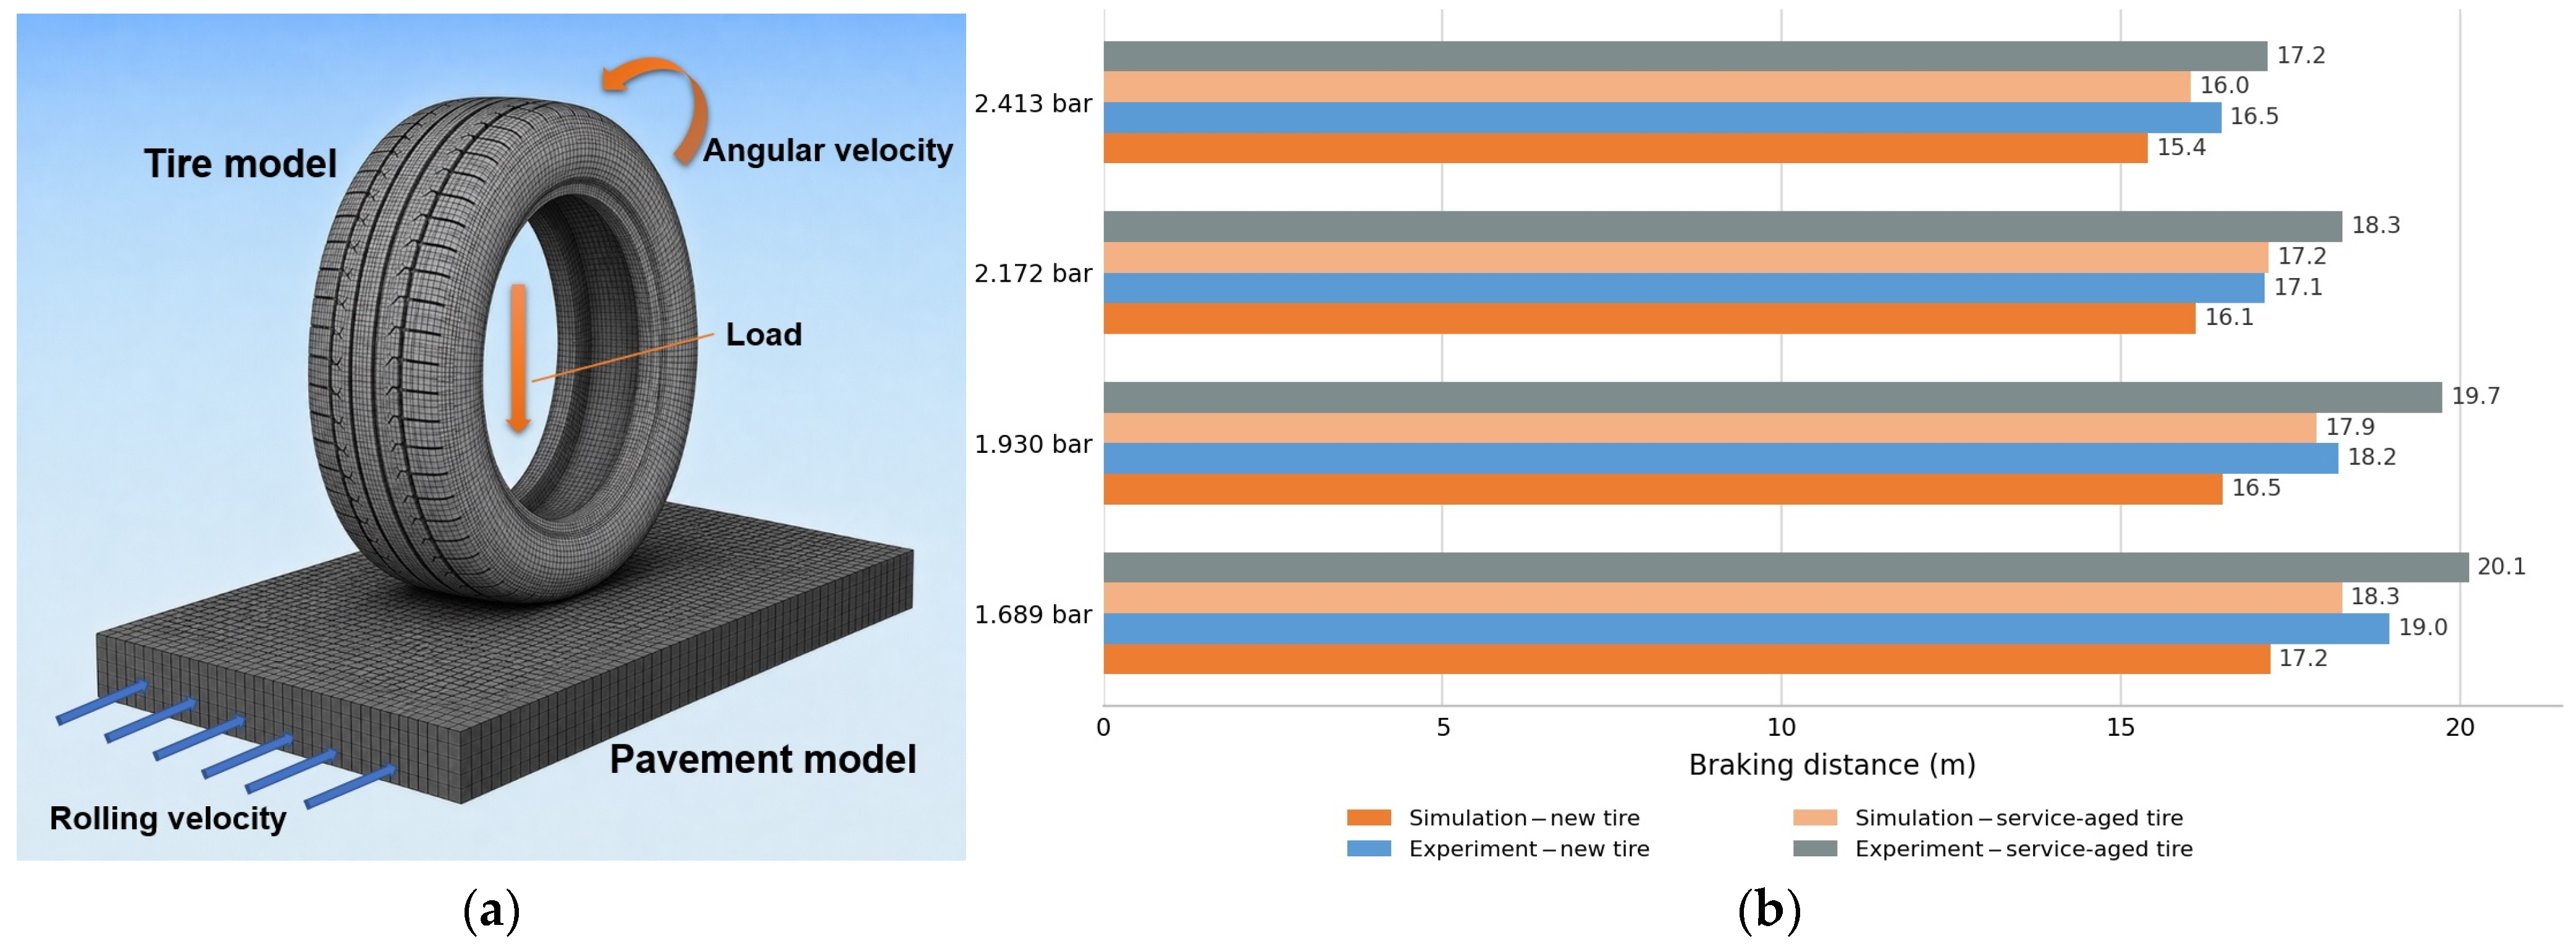
Finite element analysis (FEA) was performed using the commercial ANSYS® software. A constant kinetic tire-pavement friction coefficient of μ = 0.70 was adopted based on the dry-asphalt results reported in [38]. The selected value lies within the range reported for comparable asphalt mixtures at sliding velocities relevant to the present braking tests. The same coefficient was applied to all simulation cases to maintain consistent contact conditions and isolate the relative effects of inflation pressure and tire condition. The braking process was represented as a transient dynamic event. Because the assembly contained components with substantially different stiffness characteristics, a combined flexible–rigid modelling approach was employed. The tire was defined as a deformable body and solved using an explicit dynamic formulation, whereas the road surface and idealized wheel rim place were treated as rigid, not deformable surface (full tire model refer to first part of research), based on reccomendation from [39]. The individual components were connected through appropriate joints and contact interfaces. The scheme of numerical model, including the applied contacts, constraints, and boundary conditions, is presented in Figure 11a.
Figure 11.
Final research results: (a) scheme of dynamic simulation model and boundary conditions; (b) comparison of the mean experimental and simulated braking distances results.
The numerical model was validated by comparing the predicted braking distances with the experimental measurements obtained during the second stage of the preliminary study. This validation was conducted for the investigated inflation-pressure levels and included both new and service-aged tires. The comparison between the simulated and experimental braking distances is presented in Figure 11b.
The agreement between the mean experimental braking distance and the value obtained from numerical modelling was assessed using the relative difference:
where is the mean measured braking distance, and xnum is the numerical-model result.
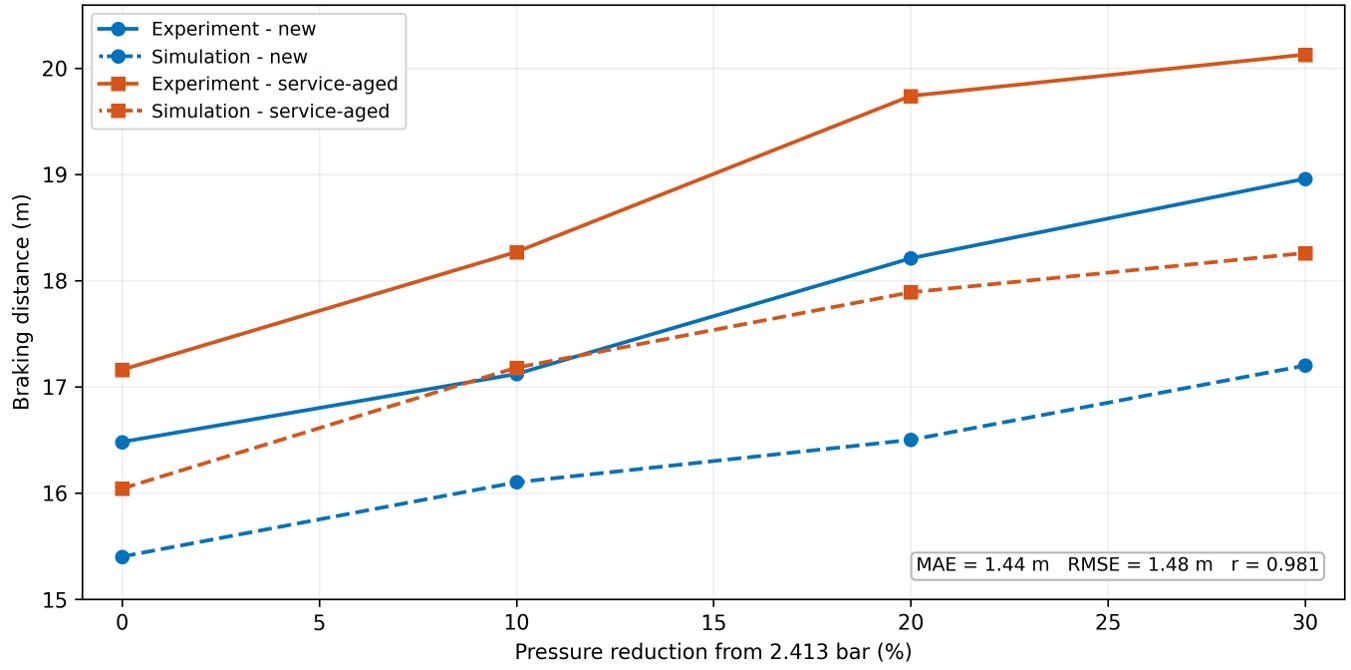
MAE describes the average absolute simulation error, whereas RMSE gives greater weight to cases with larger differences [40,41]. The Pearson coefficient (r) describes the similarity of the experimental and simulated trends but should not be interpreted as a direct measure of agreement [42,43].
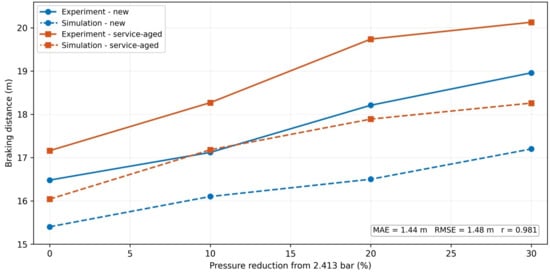
As shown in Figure 12, both the experimental and simulated braking distances increased as inflation pressure was reduced. From 0% to 30% pressure reduction, the experimental distance increased from 16.48 to 18.96 m for the new tire and from 17.16 to 20.13 m for the service-aged tire. The corresponding simulated values increased from 15.40 to 17.20 m and from 16.04 to 18.26 m, respectively.
Figure 12.
Experimental and simulated braking distances for new and service-aged tires at four inflation-pressure reductions.
Thus, the simulation reproduced the effects of pressure reduction and tire ageing but predicted shorter braking distances in every case. The absolute differences ranged from 1.02 to 1.87 m, and the relative differences ranged from 5.96% to 9.39%. The overall MAE was 1.44 m, the RMSE was 1.48 m, and (r = 0.981). The similar MAE and RMSE values indicate that no single case dominated the error. Nevertheless, the larger differences at 20% and 30% pressure reductions demonstrate reduced model accuracy under the most underinflated conditions.
For the new tire, the experimental braking distance increased from 16.48 m at 2.413 bar to 18.96 m at 1.689 bar. The 0.724 bar reduction in inflation pressure therefore added 2.48 m to the measured stopping distance, corresponding to a 15.0% increase. The simulation reproduced the same overall trend, increasing from approximately 15.4 to 17.2 m (about 11.7%). However, it consistently underpredicted the measured distance. The absolute simulation–experiment difference was approximately 1.08, 1.02, 1.71, and 1.76 m at 2.413, 2.172, 1.930, and 1.689 bar, respectively; relative to the experimental means, these differences were about 6.6%, 6.0%, 9.4%, and 9.3%. Thus, the model captured the pressure-dependent direction of change but was less accurate at the two lowest investigated pressures.
For the service-aged tire, the numerical braking distances were 16.04, 17.18, 17.89, and 18.26 m at 2.413, 2.172, 1.930, and 1.689 bar, respectively. These estimates remain below the corresponding service-aged measurements by approximately 1.12, 1.09, 1.85, and 1.87 m. Their relative differences are 6.6%, 6.0%, 9.4%, and 9.3%. Consequently, the estimated series is useful for illustrating the combined pressure-and-ageing trend, but it does not constitute an independent validation of the service-aged tire model.
The service-aged tire produced a longer experimental braking distance than the new tire at every tested inflation pressure. The increase was 0.68 m (4.1%) at 2.413 bar, 1.15 m (6.7%) at 2.172 bar, 1.53 m (8.4%) at 1.930 bar, and 1.17 m (6.2%) at 1.689 bar. For the service-aged tire, reducing pressure from 2.413 to 1.689 bar increased the stopping distance from 17.16 to 20.13 m, representing an additional 2.97 m or 17.3%. The combined influence of lower inflation pressure and tire ageing therefore gave the longest stopping distance in the investigated conditions.
From a safe-driving perspective, these results support maintaining the vehicle manufacturer’s specified cold-tire inflation pressure and monitoring tire condition rather than relying only on tread appearance. Even at the same initial speed of 50 km/h, differences of approximately 1–3 m can determine whether a vehicle stops before or within a conflict area. The reported distances describe the braking phase only; the actual stopping distance also includes the distance travelled during perception and reaction. Moreover, the tests were performed on dry asphalt with ABS disabled, so the numerical values should not be treated as universal safety limits or directly applied to wet, icy, higher-speed, or normal ABS-assisted driving conditions. The model does not separately quantify the influence of tread-depth loss; future studies will record tread depth at each service interval and explicitly update the model geometry accordingly. A further limitation concerns the idealized road boundary condition. The rigid and geometrically smooth road representation does not reproduce asphalt micro-deformation, viscoelastic response, surface texture, temperature dependence, or the multilayer structure of an actual pavement. Consequently, local tire–road contact pressures and stresses may differ from those occurring under field conditions, although the use of the same road model in all cases preserves the internal consistency of the comparative analysis. The practical conclusion is conservative: correct pressure, timely tire replacement, greater following distance, and speed adjustment to road conditions should be applied together.
6. Conclusions
This research developed and validated a simulation-driven framework for evaluating the effects of inflation pressure, vertical loading, and service ageing on tire dynamics and vehicle safety. By integrating vibration measurements, finite element analysis, and braking experiments, the proposed approach captured ageing-related changes in tire behaviour without requiring a highly detailed representation of every internal composite component.
The vibration analysis showed that the new and service-aged tires had comparable dominant resonance frequencies, including a fundamental response near 20 Hz, but differed in deformation velocity by approximately 9% at corresponding frequency points. This indicates that service exposure alters tire stiffness, damping, and elasticity even when the principal resonance frequencies remain relatively unchanged. The numerical results further demonstrated that decreasing inflation pressure increased tire deformation and reduces radial stiffness. These effects were more pronounced in the service-aged tire, whose maximum load response was approximately 6.0 kN, compared with approximately 6.5 kN for the new tire. The combination of ageing, underinflation, and excessive loading therefore represented the most critical condition, increasing the likelihood of structural degradation and tire failure.
The braking experiments confirmed the safety implications of these changes. For the new tire, reducing the inflation pressure from 2.413 to 1.689 bar increased the mean braking distance from 16.48 to 18.96 m, corresponding to an increase of 15.0%. For the service-aged tire, the mean braking distance increased from 17.16 to 20.13 m, or 17.3%. At every investigated inflation pressure, the service-aged tire produced a longer braking distance than the new tire. The numerical model reproduced the pressure-dependent trend, with relative differences from the experimental results ranging from approximately 6.0% to 9.4%, although its accuracy decreased at the lowest pressures. The service-aged braking predictions were obtained directly using the vibration-calibrated service-aged tire properties and were subsequently compared with the experimental braking measurements. Vehicle safety is also influenced by the interaction between tire dynamics and suspension behaviour. In particular, suspension-control performance affects dynamic tire loading, suspension deflection, and vehicle vibration response, as demonstrated in [39]. These coupled tire–suspension effects were outside the scope of the present study but should be considered in future vehicle-level investigations.
Overall, the findings show that tire inflation pressure and service ageing must be considered jointly when assessing tire performance and vehicle safety. Maintaining the manufacturer-recommended inflation pressure, avoiding loads beyond the tire’s rated capacity, regularly monitoring tire condition, and replacing aged tires in a timely manner can reduce braking distance and the risk of structural failure. Future research should therefore include additional tire types and ageing conditions, as well as experiments under wet or icy road conditions, higher speeds, variable temperatures, and ABS-assisted braking. The numerical framework should also be extended by coupling the tire model with a deformable multilayer pavement incorporating experimentally calibrated elastic or viscoelastic properties and measured surface texture. This extension would enable a more detailed evaluation of contact-patch geometry, local stress redistribution, and pavement-dependent tire behaviour.
Author Contributions
Conceptualization, M.K.; methodology, M.K., P.S. and M.S.; software, M.K., G.M. and M.D.; validation, M.K., P.S. and G.M.; formal analysis, M.K. and M.S.; investigation, M.K., M.D. and M.S.; resources, M.K., P.S. and M.S.; data curation, M.K., G.M. and M.D.; writing—original draft preparation, M.K., P.S. and M.S.; writing—review and editing, M.K., P.S. and G.M.; visualization, M.K., M.D. and M.S.; supervision, M.K., P.S. and M.S.; project administration, M.K.; funding acquisition, M.K. and M.S. All authors have read and agreed to the published version of the manuscript.
Funding
This research received no external funding.
Institutional Review Board Statement
Not applicable.
Informed Consent Statement
Not applicable.
Data Availability Statement
All data included in this research are available upon request from the corresponding author.
Acknowledgments
Mykola Karpenko gratefully acknowledges the Lithuanian Academy of Sciences for awarding the 2025 Young Scientists Scholarship to support the independent research cycle titled “Dynamics of automobiles and micromobility vehicles: the impact of infrastructure and traffic scenarios on mobility behaviour and traffic safety”.
Conflicts of Interest
The authors declare no conflicts of interest.
References
- Abohassan, A.; El-Basyouny, K.; Kwon, T. Exploring the associations between winter maintenance operations, weather variables, surface condition, and road safety: A path analysis approach. Accid. Anal. Prev. 2021, 163, 106448. [Google Scholar] [CrossRef] [Scilit] [PubMed]
- United Nations Economic Commission. Statistics of Road Traffic Accidents in Europe and North America; United Nations Publications (UNECE): Geneva, Switzerland, 2021; Volume LVI, 185p, Available online: https://unece.org/transport/publications/2021-statistics-road-traffic-accidents-europe-and-north-america (accessed on 31 July 2026).
- World Health Organization (WHO). European Regional Status Report on Road Safety 2019; CCBY-NC-SA3.0IGO; WHO Regional Office for Europe: Copenhagen, Denmark, 2026; 133p, Available online: https://apps.who.int/iris/handle/10665/336584 (accessed on 31 July 2026).
- European Commission. Road Safety Statistics 2025 in More Detail. European Commission Web-Page. 2025. Available online: https://transport.ec.europa.eu/background/road-safety-statistics-2025_en (accessed on 31 July 2026).
- Zhu, J.; Han, K.; Wang, S. Automobile tire life prediction based on image processing and machine learning technology. Adv. Mech. Eng. 2021, 13, 16878140211002727. [Google Scholar] [CrossRef] [Scilit]
- Sadeghi, P.; Goli, A. Investigating the impact of pavement condition and weather characteristics on road accidents (Review paper). Int. J. Crashworthiness 2024, 29, 973–989. [Google Scholar] [CrossRef] [Scilit]
- Yang, D.; Li, J.; Huang, C.; Li, K.; Lu, G.; Guo, K. A review of research on tire burst and vehicle stability control. Sci. Prog. 2024, 107, 00368504241272478. [Google Scholar] [CrossRef] [Scilit] [PubMed]
- Genovese, A.; Ruffini, M.; Ciampi, G.; Re, F.; Broggi, D. Enhancing wet braking performance: The impact of tire tread material viscoelastic properties and the influence of tread wear. Veh. Syst. Dyn. 2025, 2025, 1–29. [Google Scholar] [CrossRef] [Scilit]
- Ružinskas, A.; Giessler, M.; Gauterin, F.; Wiese, K.; Bogdevičius, M. Experimental investigation of tire performance on slush. Eksploat. Niezawodn.–Maint. Reliab. 2021, 23, 103–109. [Google Scholar] [CrossRef] [Scilit]
- Karpenko, M.; Prentkovskis, O.; Skačkauskas, P. Numerical simulation of vehicle tyre under various load conditions and its effect on road traffic safety. Promet–Traffic Transp. 2024, 36, 1–11. [Google Scholar] [CrossRef] [Scilit]
- Williams, D. The Evolution of the Tire. Treadwright—Environmentally Friendly Tires Blog. 2026. Available online: https://www.treadwright.com/blogs/treadwright-blog/the-history-of-tires (accessed on 31 July 2026).
- Li, T. Influencing Parameters on Tire–Pavement Interaction Noise: Review, Experiments, and Design Considerations. Designs 2018, 2, 38. [Google Scholar] [CrossRef] [Scilit]
- Brown, S.; Vanlaar, W.; Robertson, R. Winter tires: A review of research on effectiveness and use. In Traffic Injury Research Foundation (TIRF) Report; Traffic Injury Research Foundation: Ottawa, Canada, 2012; 50p, Available online: https://www.drivesmartbc.ca/equipment/resource-winter-tires-review-research-effectiveness-and-use (accessed on 31 July 2026).
- Lorenčič, V. The Effect of Tire Age and Anti-Lock Braking System on the Coefficient of Friction and Braking Distance. Sustainability 2023, 15, 6945. [Google Scholar] [CrossRef] [Scilit]
- Stabile, P.; Mastinu, G.; Gobbi, M.; Bardini, P. Tire aging: A state-of-the-art review. Eng. Sci. Technol. An. Int. J. 2025, 69, 102101. [Google Scholar] [CrossRef] [Scilit]
- Chen, K.; Yeh, C. Preventing tire blowout accidents: A perspective on factors affecting drivers’ intention to adopt tire pressure monitoring system. Safety 2018, 4, 16. [Google Scholar] [CrossRef] [Scilit]
- Kowalski, S. Simulation of the Impact of Tyre Damage on Vehicle Travel Safety. Vehicles 2026, 8, 7. [Google Scholar] [CrossRef] [Scilit]
- Yang, Z.; Zhang, C.; Li, G.; Xu, H. Analysis of the Impact of Different Road Conditions on Accident Severity at Highway-Rail Grade Crossings Based on Explainable Machine Learning. Symmetry 2025, 17, 147. [Google Scholar] [CrossRef] [Scilit]
- TNO Report. Study on Some Safety-Related Aspects of Tyre Use; Publication Office of the European Union: Luxembourg, 2014; 193p. [Google Scholar] [CrossRef] [PubMed]
- Sassi, S.; Sassi, A. Destabilising effect of tyre burst on vehicle’s dynamics. Int. J. Veh. Syst. Model. Test. 2015, 10, 185–202. [Google Scholar] [CrossRef] [Scilit]
- Balderstone, P.; Livadeas, A.; Wilson-Law, A. Tyre Ageing: Its effect on material properties and structural integrity. In TRL Progect Report PPR904; Department for Transport: London, UK, 2019; 219p. Available online: https://assets.publishing.service.gov.uk/media/5d00ec9de5274a3cc2b749e6/tyre-ageing-its-effect-on-material-properties-and-structural-integrity.pdf (accessed on 31 July 2026).
- Stokłosa, J.; Bartnik, M. Influence of tire pressure on the vehicle braking distance. Arch. Automot. Eng.—Arch. Motoryz. 2022, 97, 60–73. [Google Scholar] [CrossRef] [Scilit]
- Wang, W.; Yan, S.; Zhao, S. Experimental verification and finite element modelling of radial truck tire under static loading. J. Reinf. Plast. Compos. 2013, 32, 490–498. [Google Scholar] [CrossRef] [Scilit]
- Gonera, J.; Szymczak, T. Analysis of the influence of tyre pressure changes on vehicle operating parameters. Eksploat. I Niezawodn.–Maint. Reliab. 2026, 28, 1–16. [Google Scholar] [CrossRef] [Scilit]
- Bogdevičius, M.; Karpenko, M.; Bogdevičius, P. Determination of rheological model coefficients of pipeline composite material layers based on spectrum analysis and optimization. J. Theor. Appl. Mech. 2021, 59, 265–278. [Google Scholar] [CrossRef] [Scilit] [PubMed]
- Baranowski, P.; Malachowski, J.; Mazurkiewicz, L. Numerical and experimental testing of vehicle tyre under impulse loading conditions. Int. J. Mech. Sci. 2016, 106, 346–356. [Google Scholar] [CrossRef] [Scilit]
- Mujdeci, A.; Rodriguez, V.M.; Maqbool, H.; Amadeo, A.; Grasso, M. Advances in numerical modelling of tyre fatigue performance: A review. J. Mater. Sci. Mater. Eng. 2025, 20, 105. [Google Scholar] [CrossRef] [Scilit] [PubMed]
- Jones, R. Mechanics of Composite Materials; CRC Press: Boca Raton, FL, USA, 2014; 538p. [Google Scholar] [CrossRef] [Scilit]
- Helnwein, P.; Liu, C.; Meschke, G.; Mang, H. A new 3-D finite element model for cord-reinforced rubber composites—Application to analysis of automobile tires. Finite Elem. Anal. Des. 1993, 14, 1–16. [Google Scholar] [CrossRef] [Scilit]
- Vossoughi, M.; Ayatollahi, S.; Towhidi, M.; Ketabchi, F. On summary measure analysis of linear trend repeated measures data: Performance comparison with two competing methods. BMC Med. Res. Methodol. 2012, 12, 33. [Google Scholar] [CrossRef] [Scilit] [PubMed]
- Karpenko, M.; Nugaras, J. Vibration damping characteristics of the cork-based composite material in line to frequency analysis. J. Theor. Appl. Mech. 2022, 60, 593–602. [Google Scholar] [CrossRef] [Scilit] [PubMed]
- Newmark, N. A Method of Computation for Structural Dynamics. ASCE J. Eng. Mech. Div. 1959, 85, 67–94. [Google Scholar] [CrossRef] [Scilit]
- Hashamdar, H.; Ibrahim, Z.; Jameel, M. Finite element analysis of nonlinear structures with Newmark method. Int. J. Phys. Sci. 2011, 6, 1395–1403. [Google Scholar] [CrossRef]
- Lopes, B.; Arruda, M.; Almeida-Fernandes, L.; Castro, L.; Silvestre, N.; Correia, J. Assessment of mesh dependency in the numerical simulation of compact tension tests for orthotropic materials. Compos. Part C Open Access 2020, 1, 100006. [Google Scholar] [CrossRef] [Scilit]
- ASTM E2341/E2341M-05(2014); Standard Test Method for Determining the Stopping Distance Number by Initial Speed and Stopping Distance at Traffic Incident Sites. ASTM International: West Conshohocken, PA, USA, 2014.
- Danilevičius, A.; Karpenko, M.; Křivánek, V. Research on the noise pollution from different vehicle categories in the urban area. Transport 2023, 38, 1–11. [Google Scholar] [CrossRef] [Scilit]
- Mark, H.; Workman, J. Chapter 74—Limitations in Analytical Accuracy: Part 3—Comparing Test Results for Analytical Uncertainty. In Chemometrics in Spectroscopy, 2nd ed.; Academic Press: Cambridge, MA, USA, 2018; pp. 501–505. [Google Scholar] [CrossRef] [Scilit]
- Liu, X.; Cao, Q.; Wang, H.; Chen, J.; Huang, X. Evaluation of vehicle braking performance on wet pavement surface using an integrated tire-vehicle modeling approach. Transp. Res. Rec. 2019, 2673, 295–307. [Google Scholar] [CrossRef] [Scilit]
- Yang, Y.; Liu, C.; Chen, L.; Zhang, X. Phase deviation of semi-active suspension control and its compensation with inertial suspension. Acta Mech. Sin. 2024, 40, 523367. [Google Scholar] [CrossRef] [Scilit]
- Willmot, C.; Matsuura, K. Advantages of the mean absolute error (MAE) over the root mean square error (RMSE) in assessing average model performance. Clim. Res. 2005, 30, 79–82. [Google Scholar] [CrossRef] [Scilit]
- Chai, T.; Draxler, R. Root mean square error (RMSE) or mean absolute error (MAE)?—Arguments against avoiding RMSE in the literature. Geosci. Model Dev. 2014, 7, 1247–1250. [Google Scholar] [CrossRef] [Scilit]
- Pearson, K. Determination of the Coefficient of Correlation. Science 1909, 30, 23–25. [Google Scholar] [CrossRef] [Scilit] [PubMed]
- Bland, J.; Altman, D. Statistical methods for assessing agreement between two methods of clinical measurement. Lancet 1986, 8, 307–310. [Google Scholar] [CrossRef] [Scilit] [PubMed]

Disclaimer/Publisher’s Note: The statements, opinions and data contained in all publications are solely those of the individual author(s) and contributor(s) and not of MDPI and/or the editor(s). MDPI and/or the editor(s) disclaim responsibility for any injury to people or property resulting from any ideas, methods, instructions or products referred to in the content. |
© 2026 by the authors. Licensee MDPI, Basel, Switzerland. This article is an open access article distributed under the terms and conditions of the Creative Commons Attribution (CC BY) license.