


Abstract
In this paper, a fault diagnosis method based on temperature rise detection is proposed for power converters in switched reluctance motor drive systems used in electrical transportation equipment. First, the total power losses of all power devices are calculated and recorded under different operating conditions in both healthy and faulty states. A finite-element electrothermal model is then established to characterize the relationship between fault-induced power-loss redistribution and variations in the temperature rise of the converter devices. Based on the power-loss analysis, temperature rise is used as a key characteristic, and a corresponding fault diagnosis method is proposed. To account for the influence of operating conditions on the diagnostic criterion, three independent backpropagation neural network (BPNN) models are developed to predict fault-specific temperature-rise thresholds using rotor speed, load torque, and ambient temperature as inputs. During diagnosis, the real-time temperature evolution of the power diodes is compared with the selected thresholds to detect power converter faults. Finally, experimental results demonstrate the validity of the proposed fault diagnosis method.
1. Introduction
In recent years, electric machines have attracted increasing attention for use in electric vehicles (EVs) [1,2], aerospace systems [3], electric traction systems [4], and other electric transportation equipment. The switched reluctance motor (SRM) offers advantages including a simple structure, high fault tolerance, and excellent dynamic response. Consequently, SRMs have considerable potential for use in electric transportation applications that require high reliability [2,3,4,5,6].
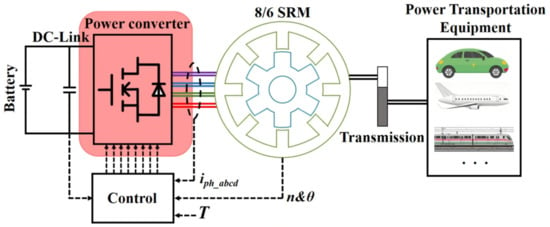
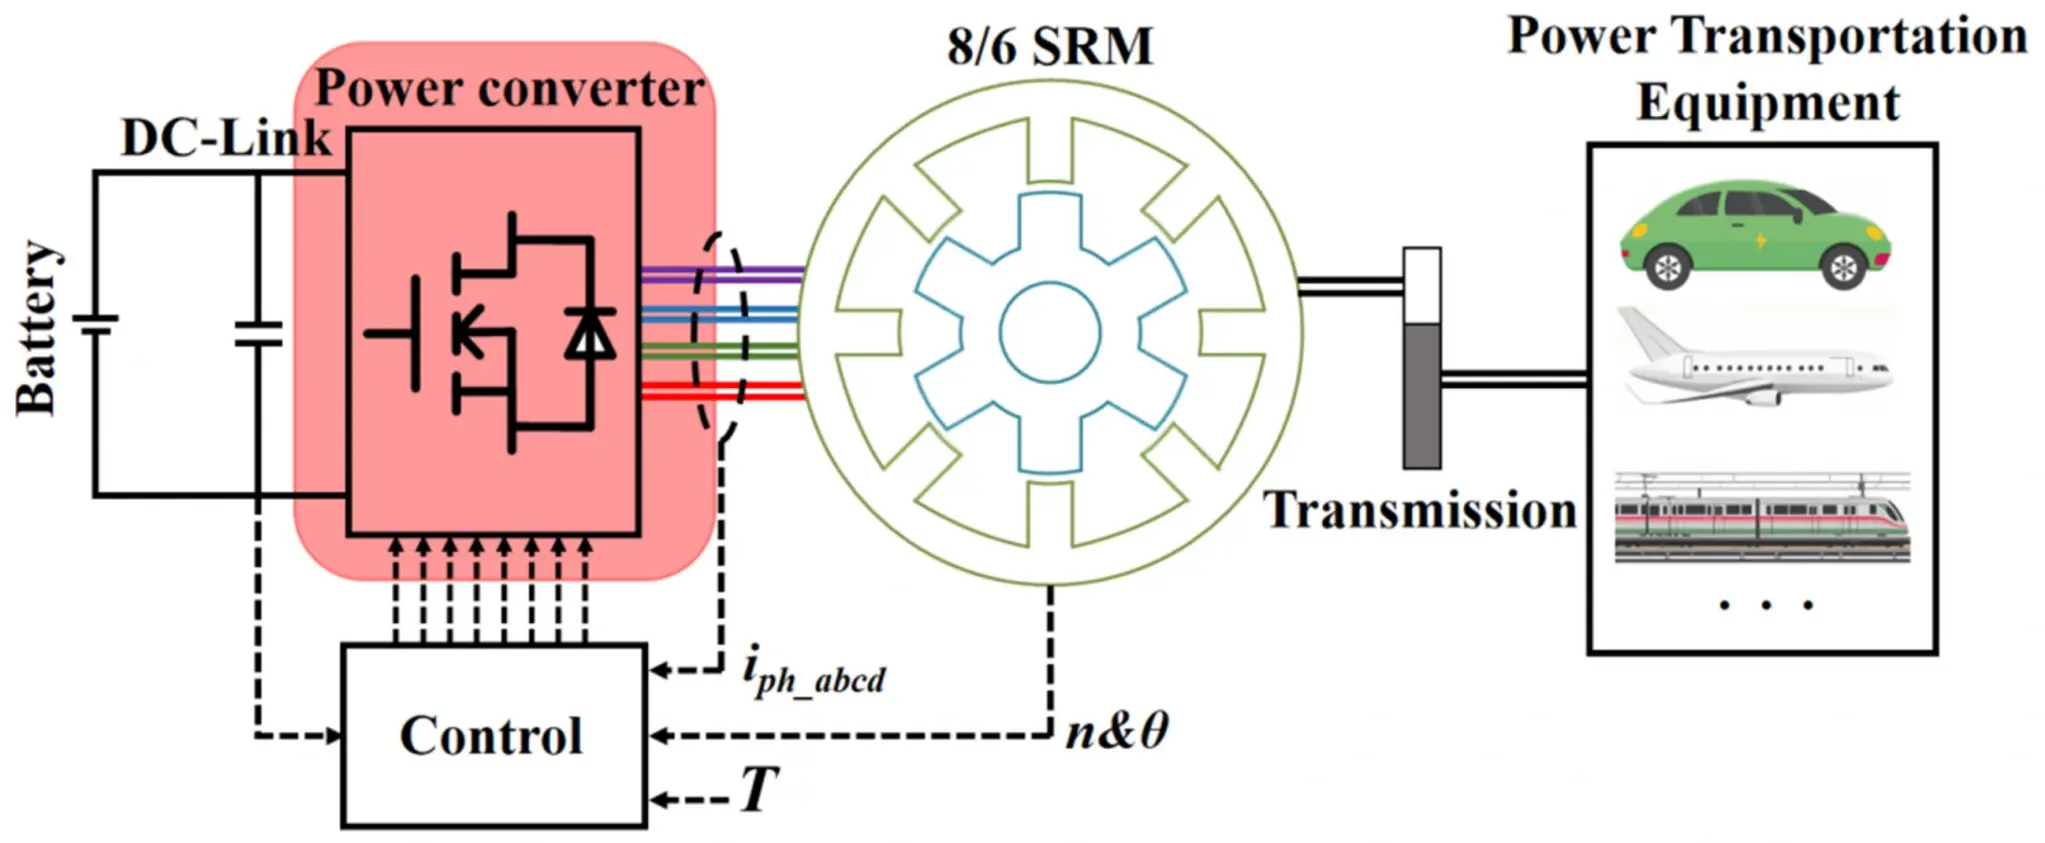
Figure 1 illustrates an electric drive system for transportation applications based on a switched reluctance motor (SRM), in which an 8/6 SRM is supplied by a battery pack through a power converter [7]. The power converter is a critical component of a switched reluctance motor drive (SRD) and is essential for reliable operation [7,8]. However, if an open-circuit or short-circuit fault occurs in a converter power transistor, the affected phase may be lost or subjected to overcurrent. Both fault types can seriously degrade operating performance and may cause further damage to the entire system [9,10]. Therefore, investigating fault diagnosis from multiple perspectives and detecting faults at an early stage are important for improving the reliability of the SRD system.
Figure 1.
SRM-based electric drive system for transportation equipment.
Most existing methods diagnose faults by analyzing and comparing changes in current characteristics before and after a fault occurs. In [11], fault types and locations are identified by detecting variations in bus current coefficients under normal and faulty operating conditions. However, this approach is limited to specific control modes, and current reconstruction complicates the diagnostic process. In [12], faults are diagnosed by reconstructing the measured signals from current sensors and calculating the slope of the phase current. Nevertheless, this method cannot detect open-circuit faults in position transistors, simultaneous open-circuit faults in the chopper and position transistors within the same phase, and similar cases. The midpoint current spectral analysis method proposed in [13] identifies open-circuit faults and locates faulty positions, but it requires an additional current sensor and two additional power transistors. In [14], faults are detected by monitoring phase currents that are already available for drive control; however, the method requires the storage of sampled data and multiple strokes to detect and locate faults. In [15], open-circuit and short-circuit faults in power transistors are diagnosed by calculating current vectors and analyzing their trajectories, but identifying the faulty phase remains difficult.
The fault diagnosis methods described above rely heavily on accurate transient-current detection. However, current sensors may themselves fail, potentially compromising diagnostic reliability. In addition, switched reluctance motors (SRMs) often operate under complex and harsh conditions. Sudden changes in load or rotor speed can cause rapid phase current fluctuations and may lead to misdiagnosis by current-based diagnostic systems. Selecting a fault characteristic with high discriminability and reliability is therefore critical for power-converter fault diagnosis.
A comprehensive comparison of these methods is provided in Table 1.
Table 1.
Comparison of the above fault diagnosis methods.
Although current-based methods have been widely studied, the thermal behavior of converter power devices has received considerably less attention in the fault diagnosis of switched reluctance motor (SRM) drives. In particular, the relationship between fault-induced power-loss redistribution and the resulting temperature rise of the associated freewheeling diodes remains insufficiently understood. Furthermore, a fixed temperature threshold may be inadequate under varying rotor speed, load torque, and ambient temperature conditions. A diagnostic approach that integrates the physical thermal response of the converter with operating-condition-dependent threshold prediction is therefore required. In this framework, finite element modeling (FEM) and backpropagation neural network (BPNN) models serve as supporting tools, whereas the core scientific contribution is the relationship established among the fault mechanism, diode temperature response, adaptive diagnostic threshold, and faulty-phase localization.
This study focuses on an asymmetric half-bridge power converter used in a four-phase switched reluctance motor (SRM). The objective is not simply to combine a finite-element model with a neural network, but to establish a fault-specific electrothermal diagnostic relationship linking converter power loss, diode temperature-rise variations, operating conditions, and faulty-phase localization. Under different transistor fault conditions, changes in the current conduction path alter the distribution of power losses among converter devices and produce distinguishable temperature-rise patterns in the corresponding freewheeling diodes. Based on this physical mechanism, the finite-element model characterizes fault-related thermal responses, while backpropagation neural network (BPNN) models predict the corresponding fault temperature thresholds at different rotor speeds, load torques, and ambient temperatures. The predicted thresholds are then combined with monitored diode temperature variations to identify the investigated fault types and faulty phases. Short-circuit faults can be localized to the corresponding transistor, whereas open-circuit faults can be localized to the faulty phase.
Motivation and Main Contributions
Unlike conventional approaches that rely on transient-current features or fixed diagnostic thresholds, the proposed method uses the temperature-rise characteristics of power diodes and estimates operating-condition-dependent fault thresholds from the rotor speed, load torque, and ambient temperature. The diagnostic thresholds can therefore be adjusted adaptively as the operating conditions vary.
The main contributions of this paper are summarized as follows:
- A fault-specific, temperature-rise-based diagnostic framework is proposed for the asymmetric half-bridge power converter in an SRM. The framework uses the thermal response of the converter’s freewheeling diodes as a fault-sensitive indicator, thereby reducing reliance on transient-current characteristics under the investigated operating conditions.
- A simplified electrothermal finite-element model is developed to characterize the relationship between fault-induced power-loss redistribution and the resulting temperature-rise variations in converter devices. The model establishes the physical basis for distinguishing the thermal behavior of the healthy state from that of the three investigated transistor fault conditions.
- Three independent fault-specific BPNN models, each with a common 3-9-1 architecture, are developed to approximate the nonlinear mapping from rotor speed, load torque, and ambient temperature to the fault temperature threshold for each investigated fault type. The BPNN models therefore provide operating-condition-dependent thresholds rather than a single fixed threshold.
The remainder of this paper is organized as follows: Section 2 analyzes the power loss of the power converter; Section 3 describes the finite element modeling approach for the power converter; Section 4 presents the fault diagnosis method based on temperature-rise monitoring; Section 5 validates the proposed method experimentally; and Section 6 presents the conclusions.
2. Power Loss Analysis of Power Converters
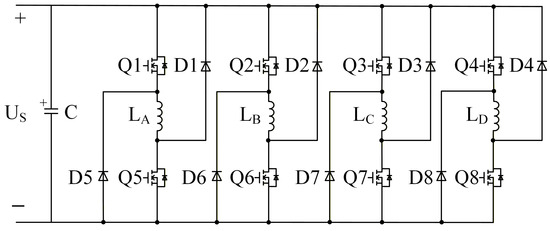
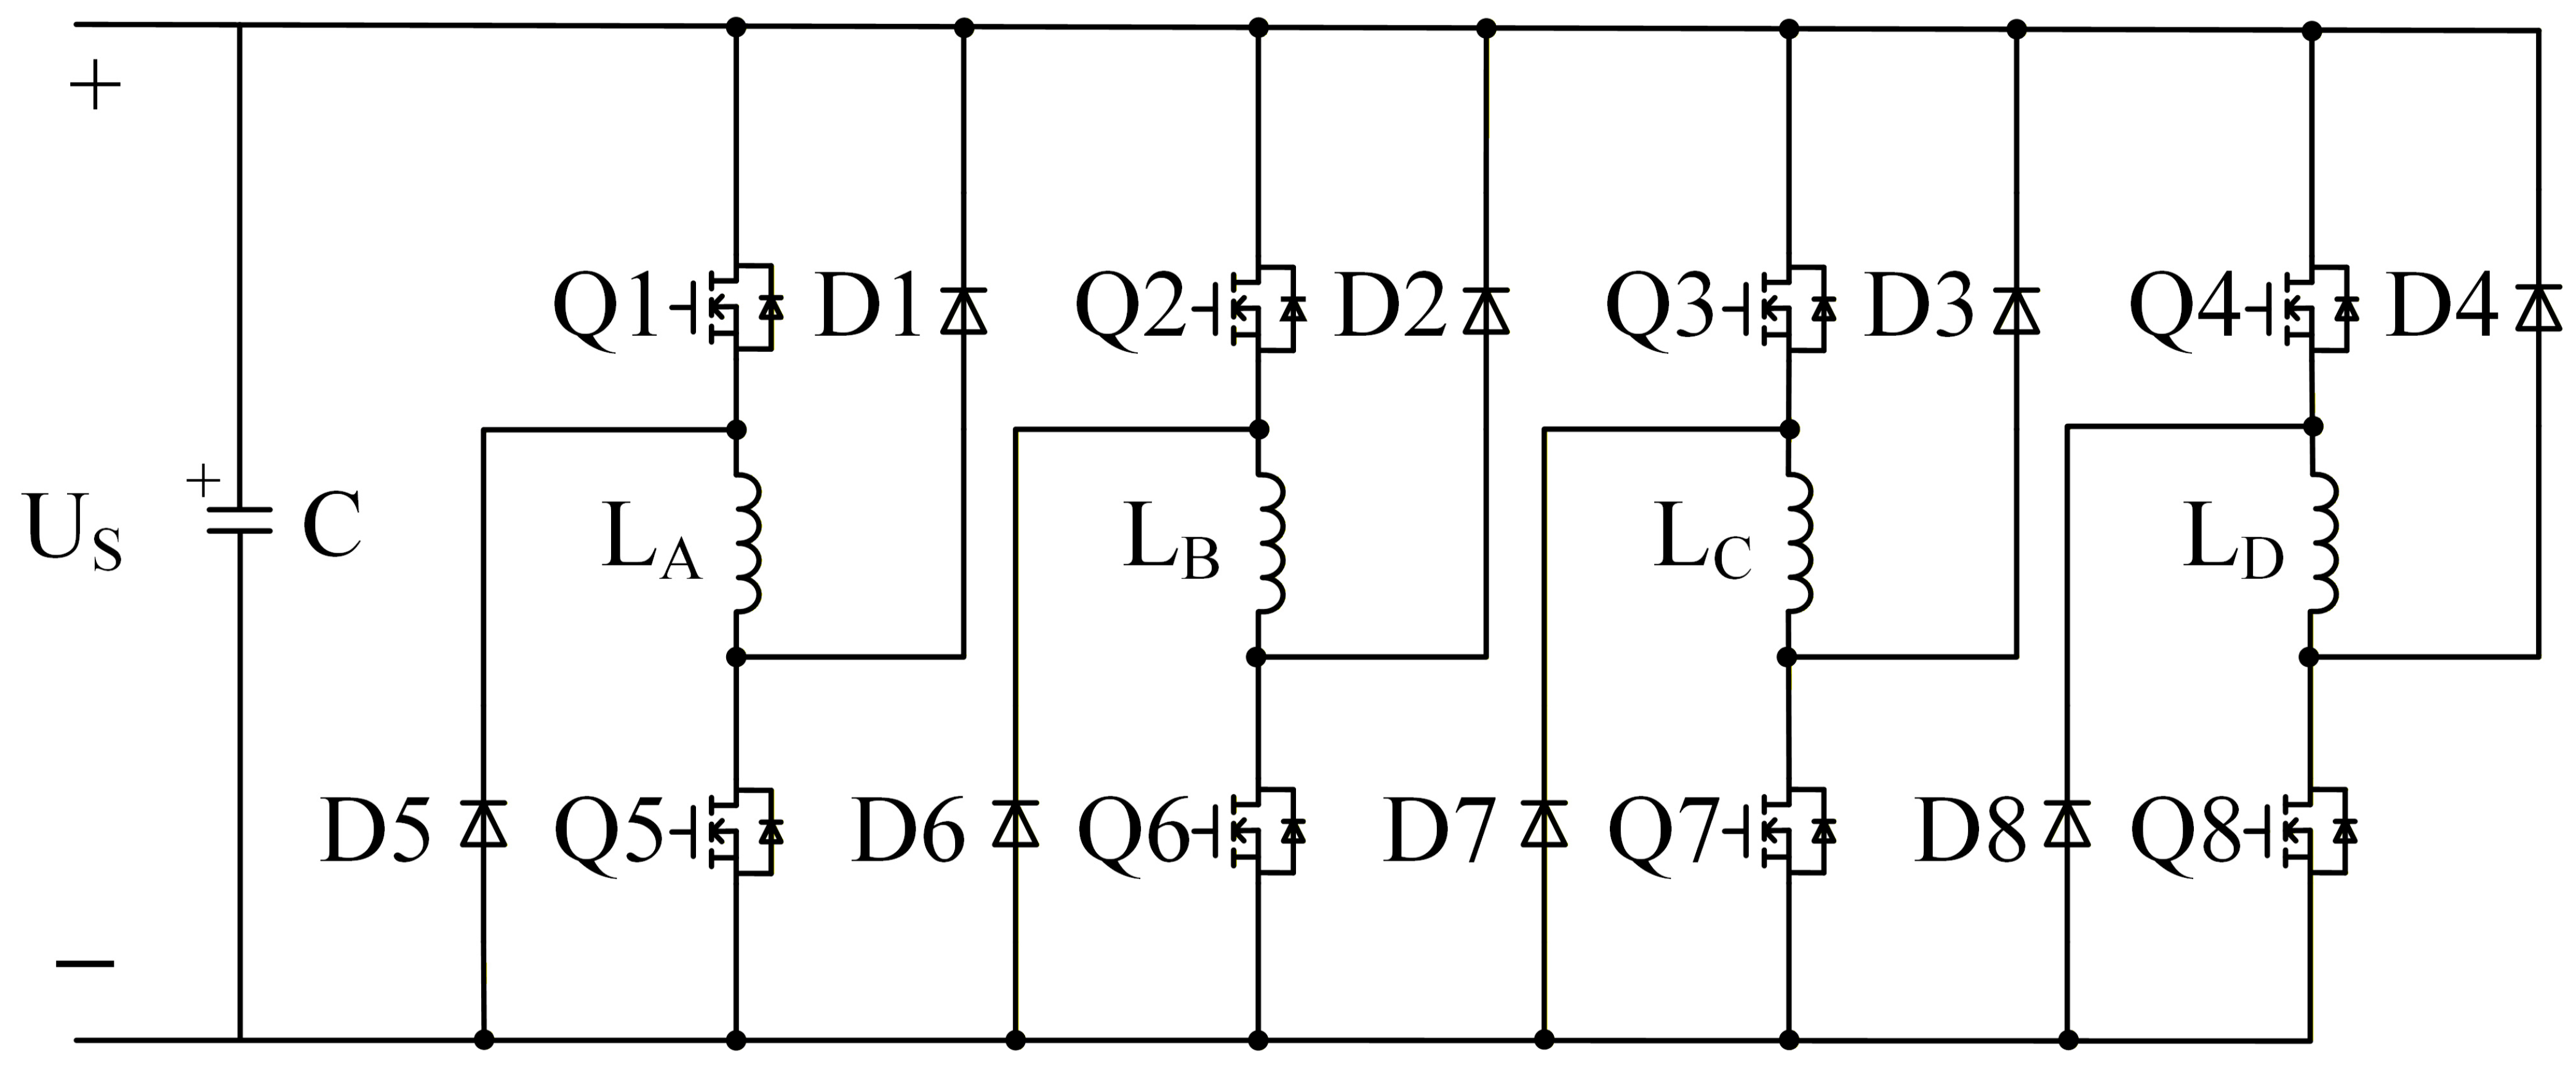
Using a four-phase SRM as the research prototype, this paper presents the topology of its asymmetric half-bridge power converter in Figure 2. As shown in Figure 2, the controller uses a current chopping control strategy: during motor excitation, the bottom transistors remain on, while the top transistors perform the chopping operation. Specifically, Q1–Q4 serve as choppers, with D5–D8 serving as the down freewheeling diodes; Q5–Q8 are position transistors, while D1–D4 are the up freewheeling diodes.
Figure 2.
Asymmetric half-bridge converter.
Common faults in each phase bridge arm of a power converter include open-circuit and short-circuit faults in power transistors and freewheeling diodes. Because power transistors have a higher failure rate than power diodes, this paper focuses exclusively on diagnosing open-circuit and short-circuit faults in power transistors.
Converter power losses are primarily attributable to power switching transistors and diodes, whose conduction and switching losses dominate the total power loss. The average conduction power loss of a single power MOSFET is calculated using Equation (1):
where Pcon_Q, Tph, tcon_Q, id, and Ron represent the average conduction loss of the power transistor, the switching period, the conduction duration, the drain current, and the on-resistance, respectively.
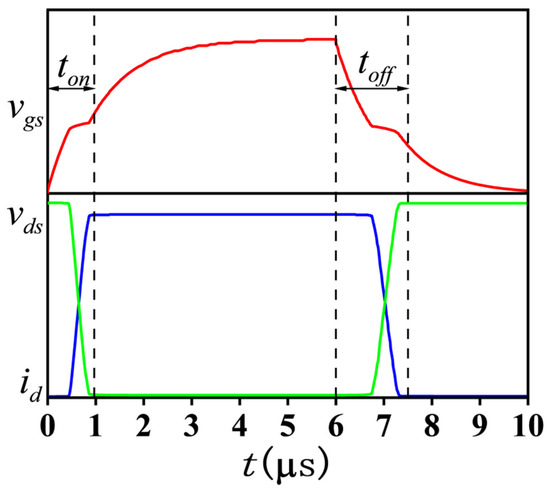
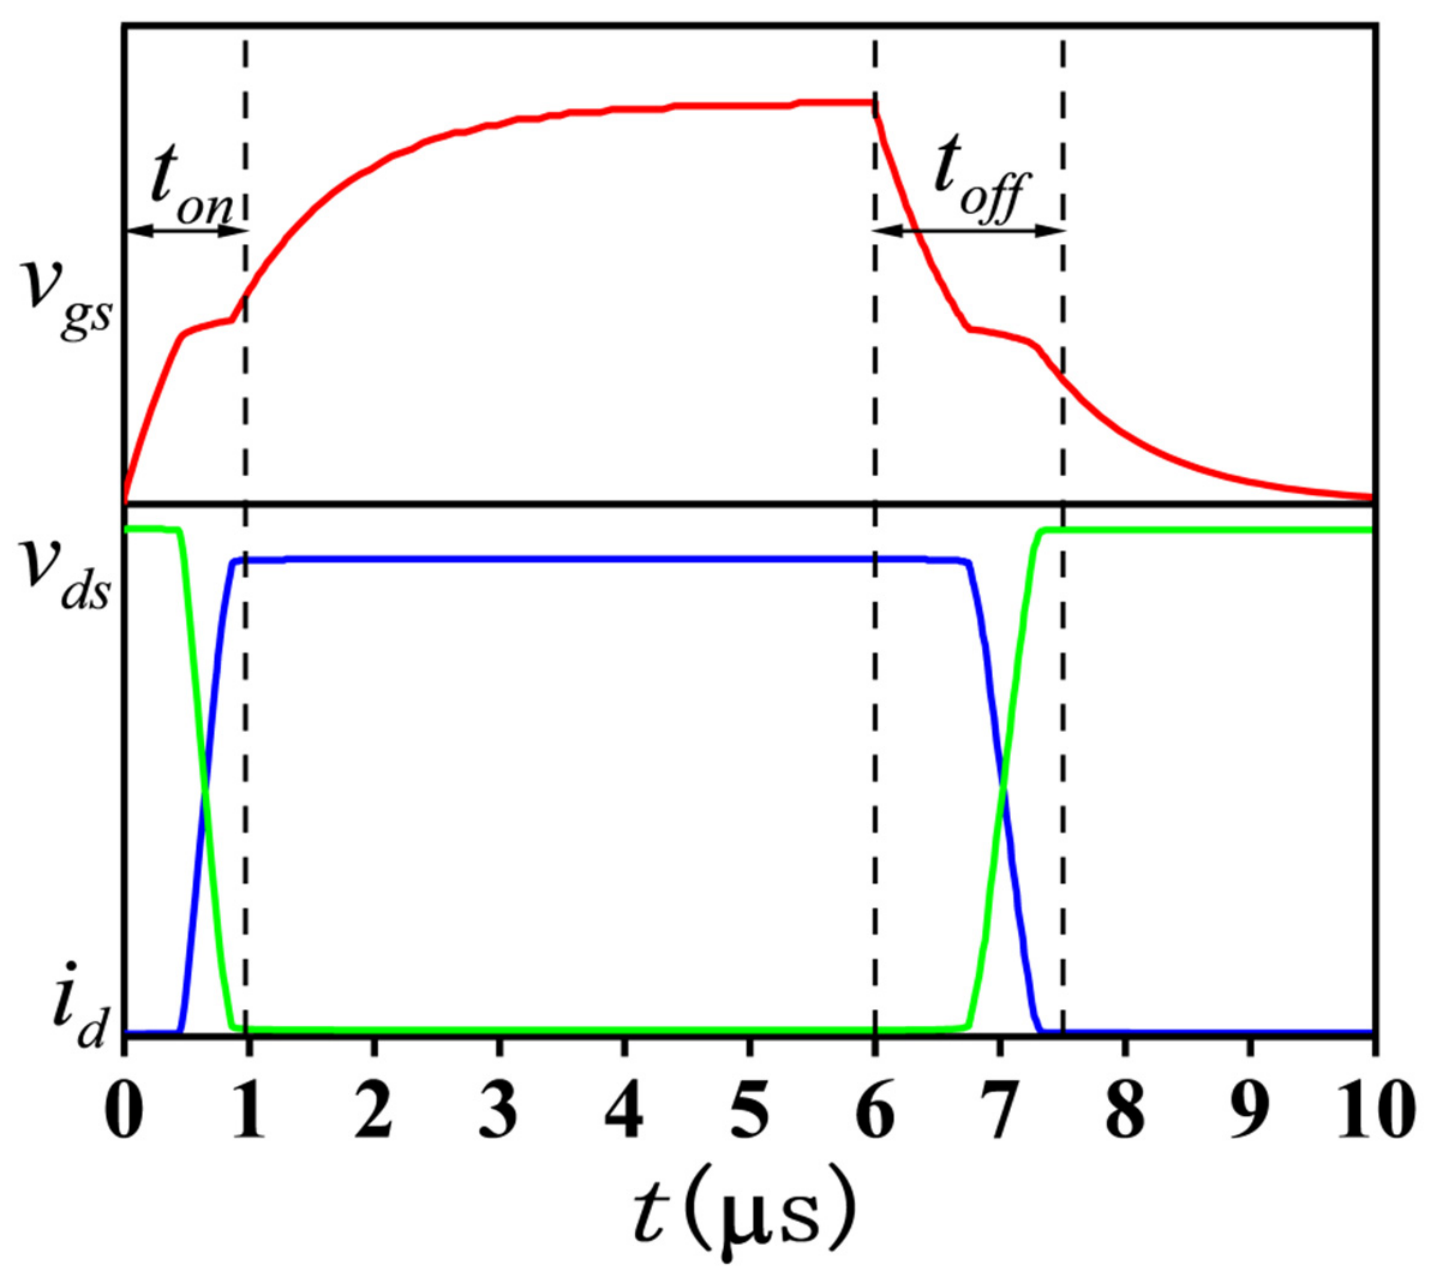
The switching process of the MOSFET is shown in Figure 3. The red curve represents gate-source voltage vGS, the blue curve is drain-source voltage vDS, and the green one denotes drain current id. The dashed lines mark ton and toff, which are the turn-on and turn-off transition intervals adopted to calculate switching loss energy. The integral term over the switching transition interval represents the energy loss generated in a single switching action, namely the turn-on energy loss and turn-off energy loss . Dividing this single-transition energy loss by the switching period yields the average switching power loss over a complete switching cycle, as expressed in Equations (2) and (3), respectively:
where and denote the energy losses during a single turn-on and turn-off transition of the MOSFET, respectively. and are the average turn-on and turn-off power losses of the transistor within one switching cycle.
Figure 3.
Transient switching process of the MOSFET.
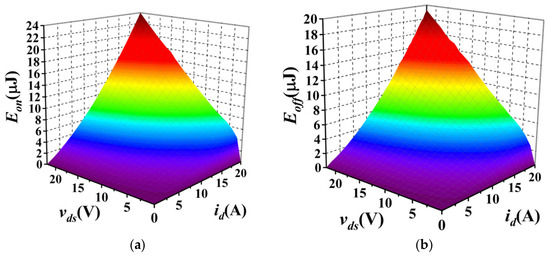
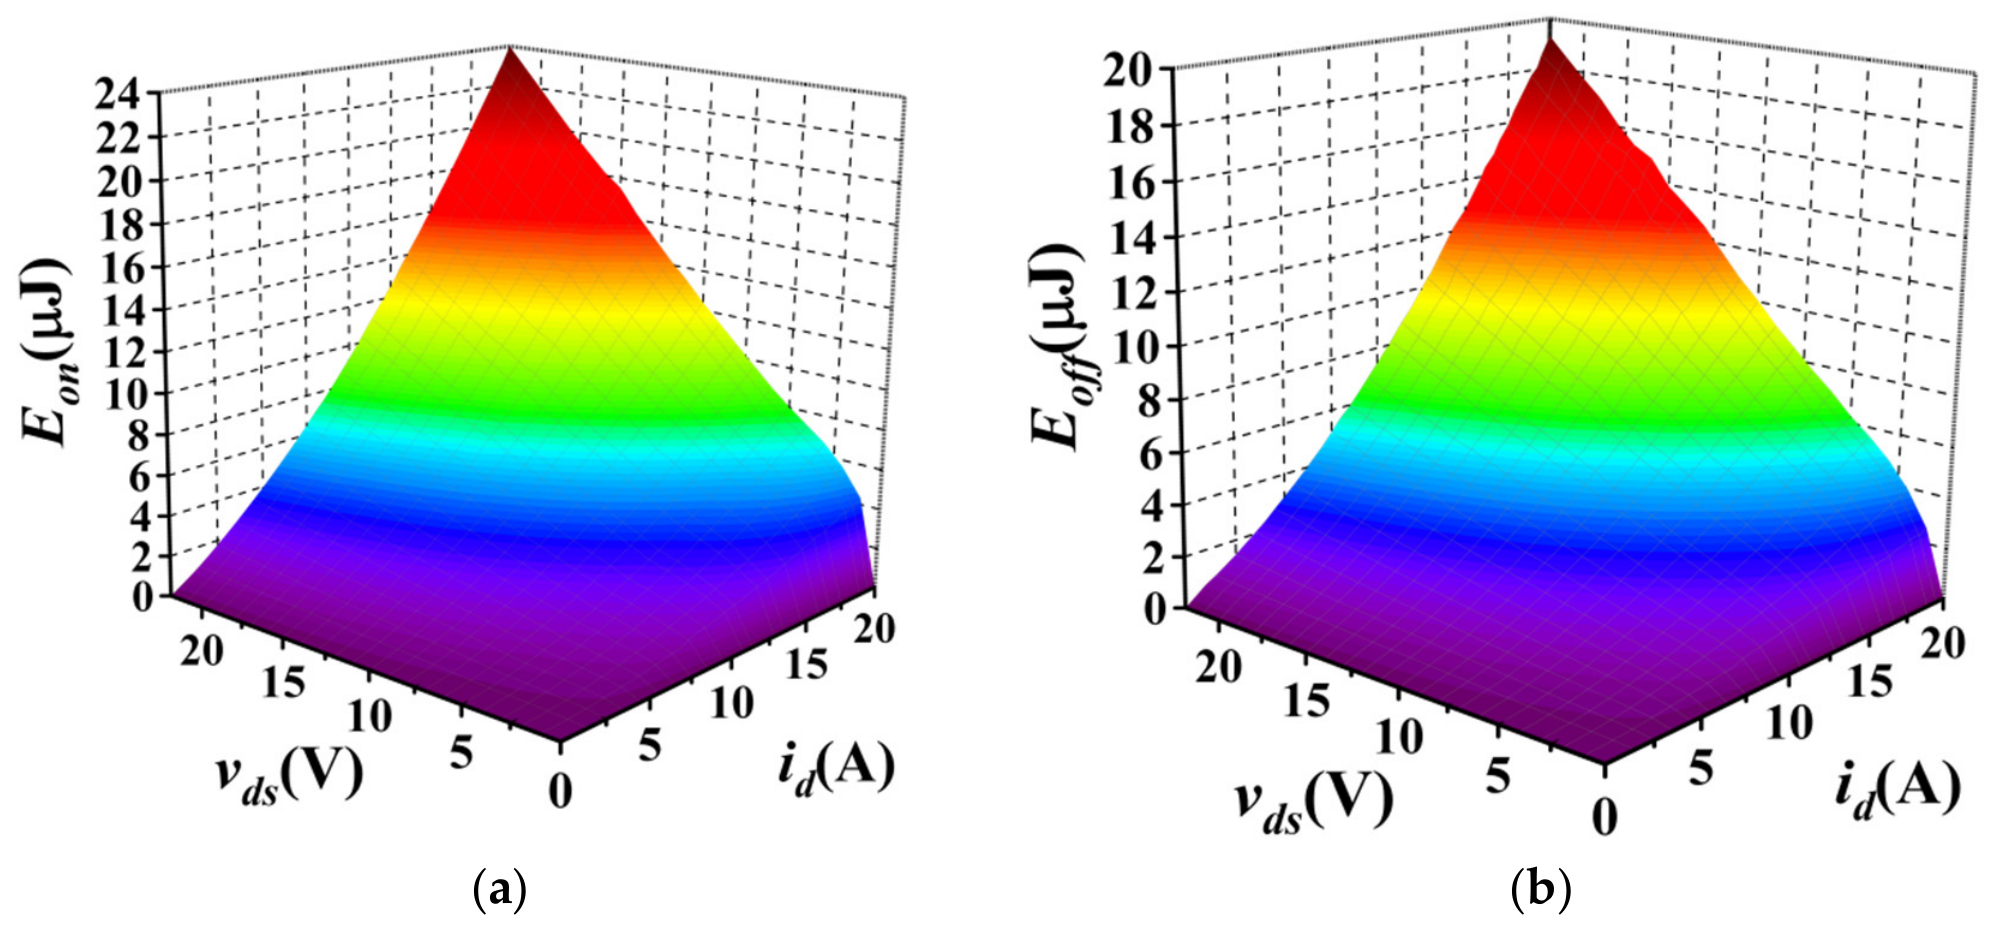
In this study, the IRFP4688 MOSFET was selected as the device under test. A standard test circuit was built in the LTspice simulation environment to measure turn-on and turn-off energy losses under various current and voltage conditions. The measured results are presented in Figure 4.
Figure 4.
Power loss of the IRFP4688 MOSFET during a single switching cycle: (a) turn-on process; (b) turn-off process.
The power losses of diodes are also primarily attributable to conduction and switching losses. The average conduction loss of a power diode is determined using Equation (4):
where Pcon_D, Tph, tcon_D, vF, and ir represent the average conduction loss, the operating period, the conduction duration, the diode voltage drop, and the current flowing through the diode, respectively.
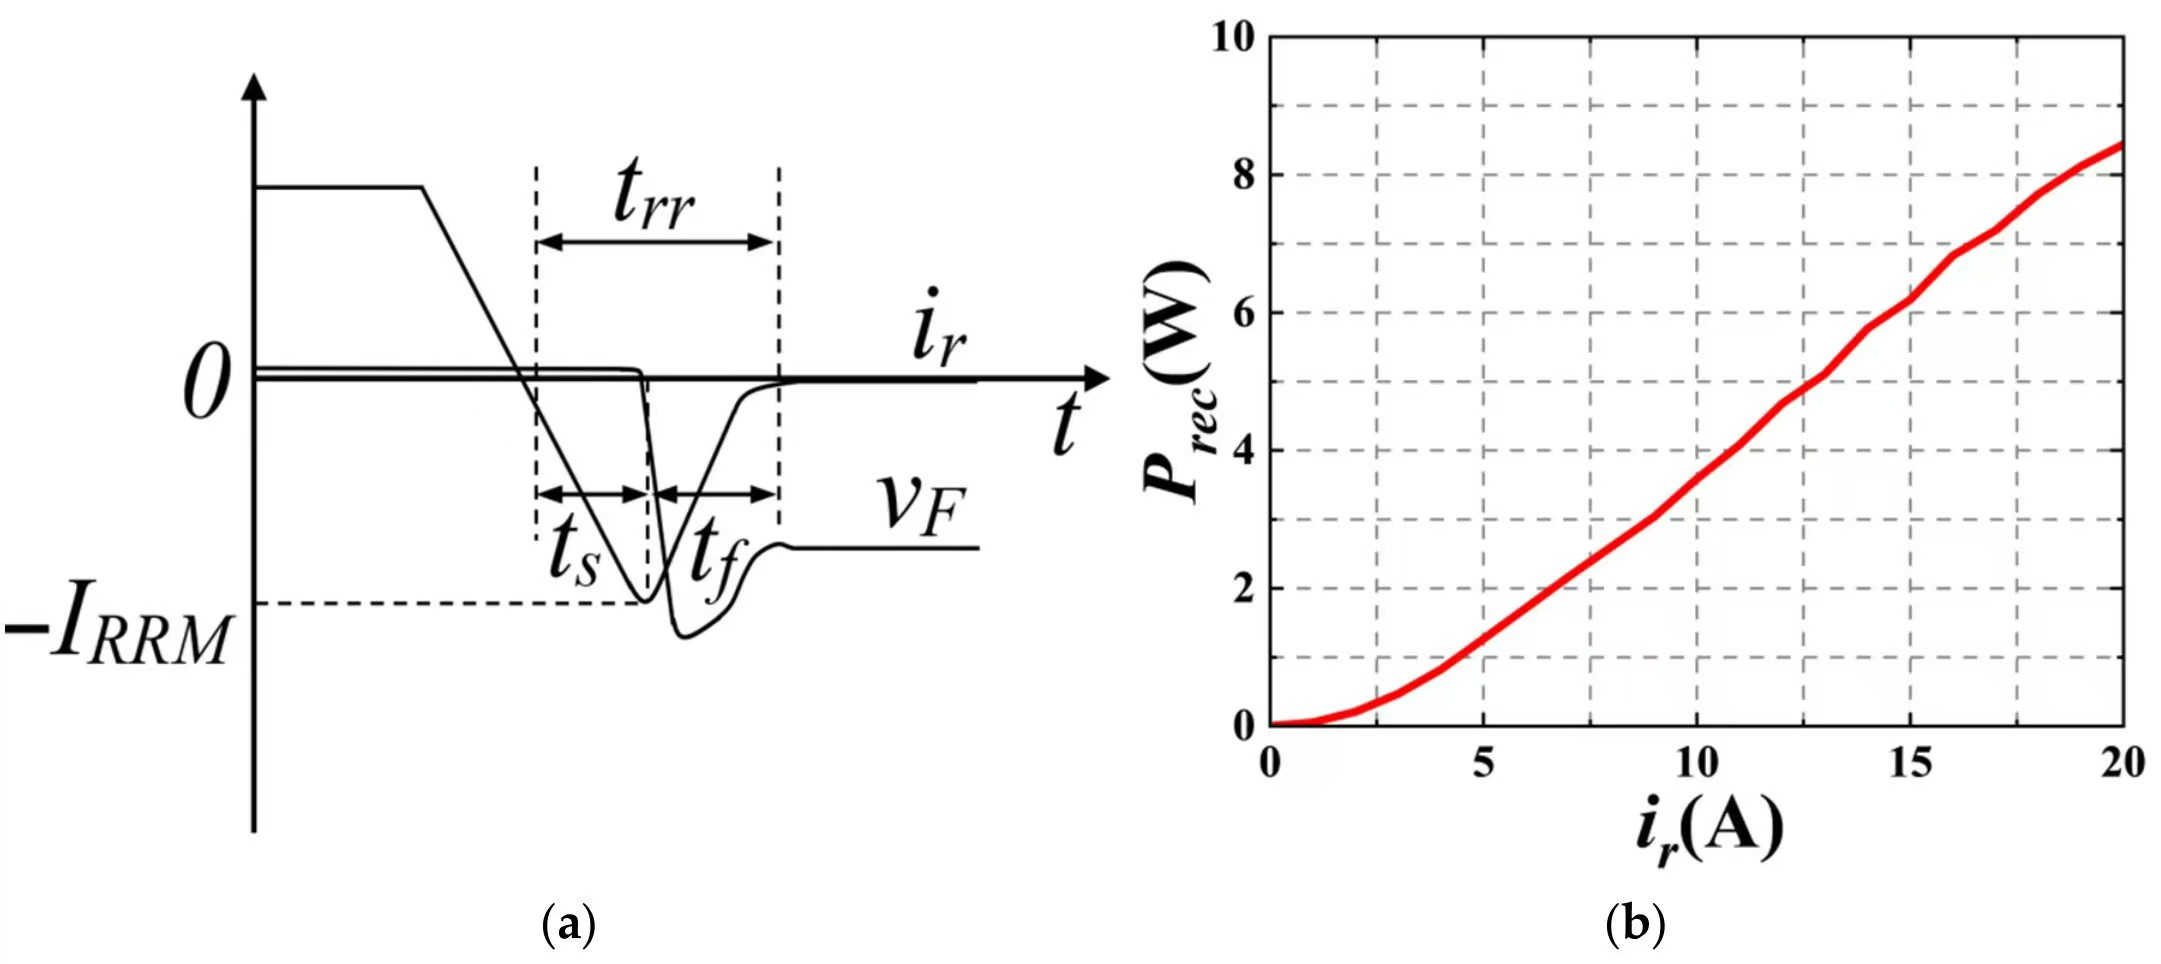
In diode switching-loss analysis, turn-on losses are generally negligible compared with turn-off losses [13]. As shown in Figure 5a, the turn-off transient of a power diode comprises two distinct stages. During the first stage, in which the diode voltage remains nearly unchanged, the turn-off loss caused by reverse recovery can be determined using Equation (5):
where Prec, trr and Erec represent the average turn-off loss power of the diode, the reverse recovery time of the diode, and the reverse recovery energy of the diode, respectively.
Figure 5.
Reverse recovery characteristics of a power diode. (a) Reverse recovery waveform. (b) Table of the average turn-off loss power.
Because the reverse recovery time trr of the diode is extremely short, its average turn-off loss power can be obtained from the average turn-off loss table shown in Figure 5b.
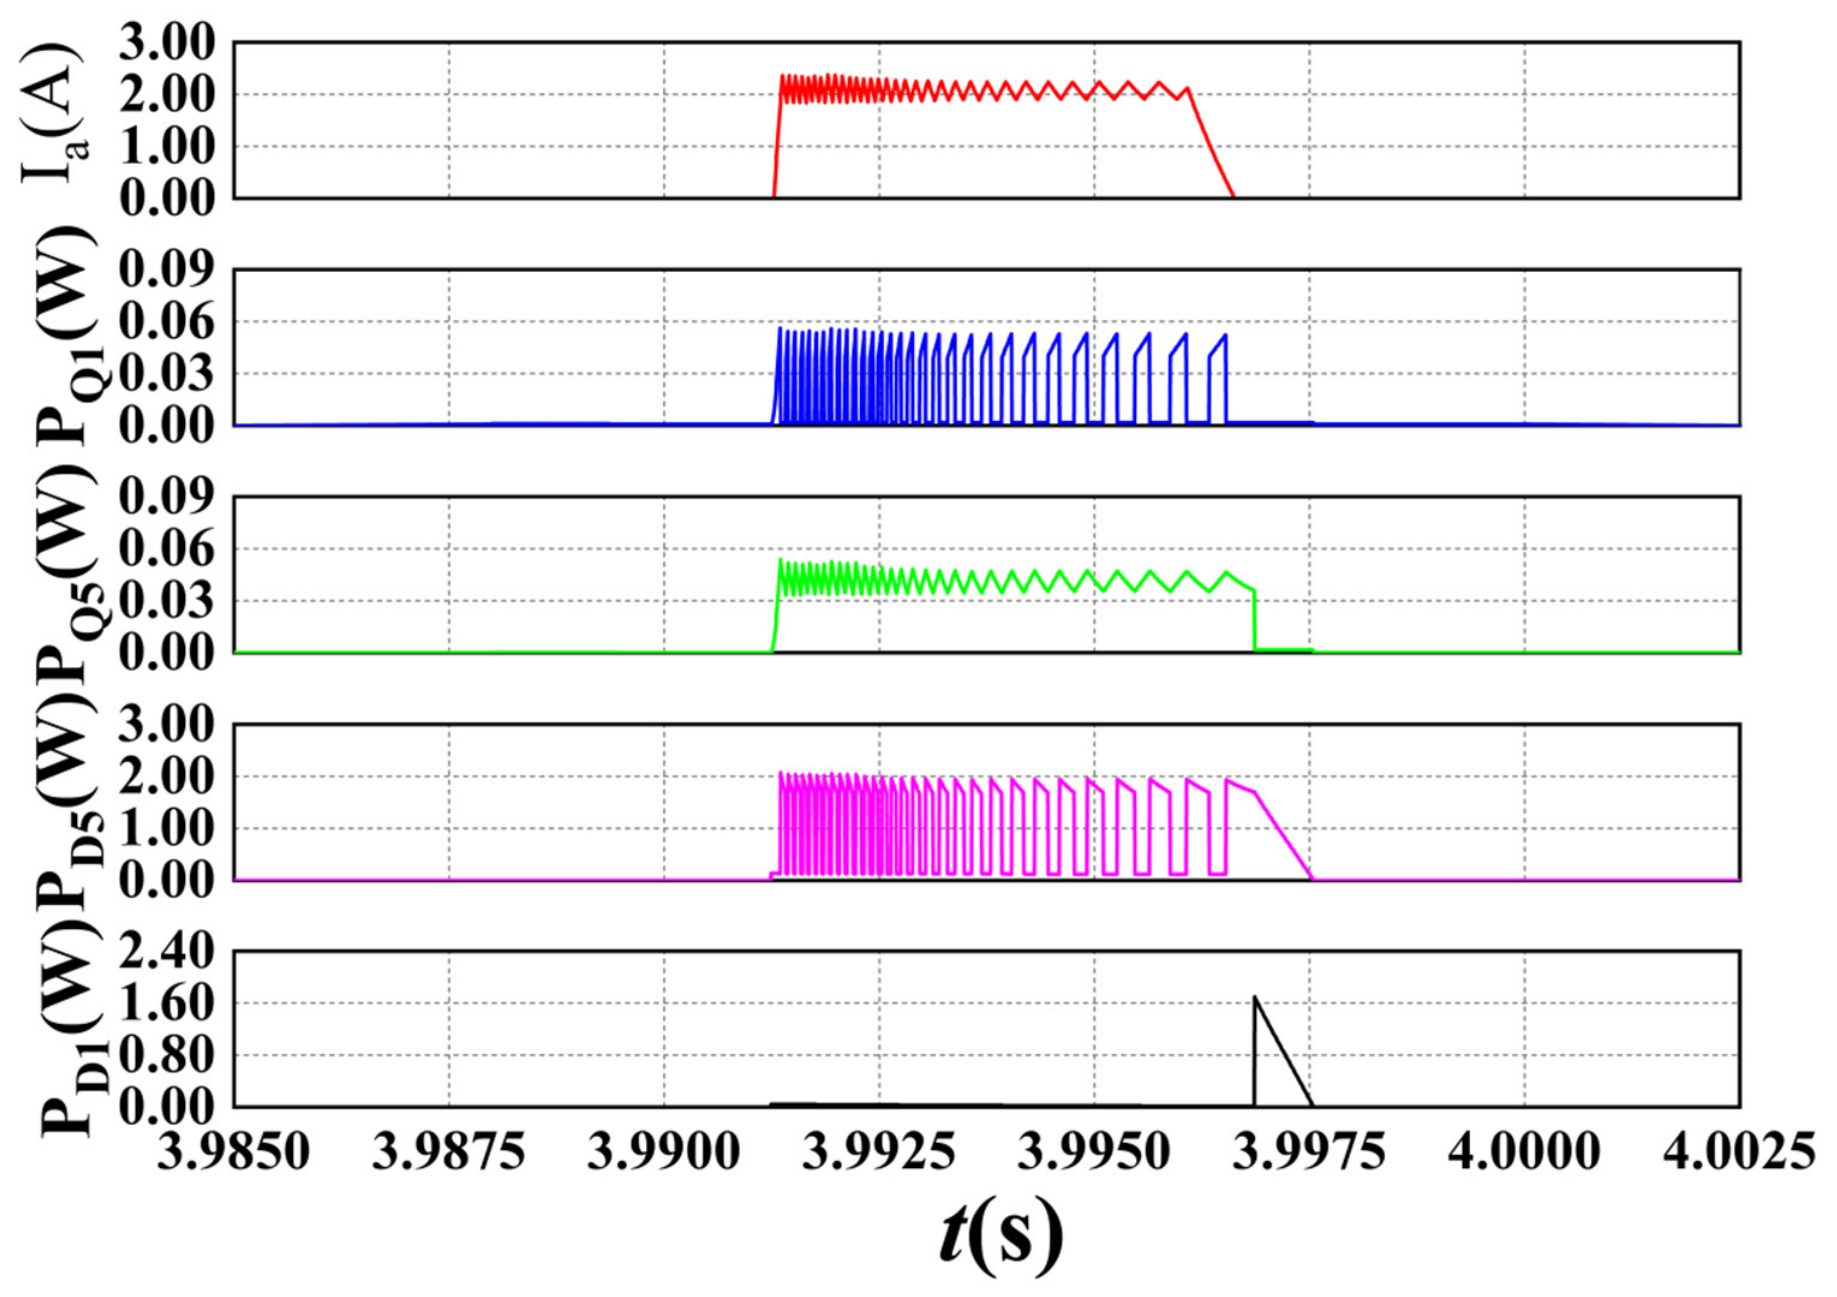
Based on the experimental prototype simulation model developed in MATLAB R2023b, the instantaneous loss characteristics of the phase-A power transistors were obtained using the simulation parameters listed in Table 2. The corresponding results are presented in Figure 6.
Table 2.
Simulation parameters.
Figure 6.
Transient power loss of devices in phase-A.
The simulation results in Figure 6 indicate that the loss characteristics of power devices differ considerably among current chopping control modes. For the phase-A devices, Q1 switches frequently, and its switching losses far exceed its conduction losses. In contrast, the conduction losses of Q5 are considerably higher than its switching losses. The voltage across D5 alternates rapidly between positive and negative values within a single operating cycle. D1 conducts freewheeling current only at the end of the cycle; consequently, its conduction losses are substantially lower than its reverse recovery losses.
3. Thermal Modeling of the Power Converter
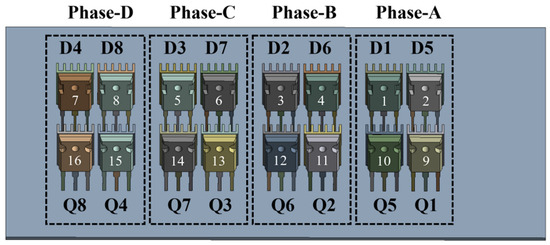
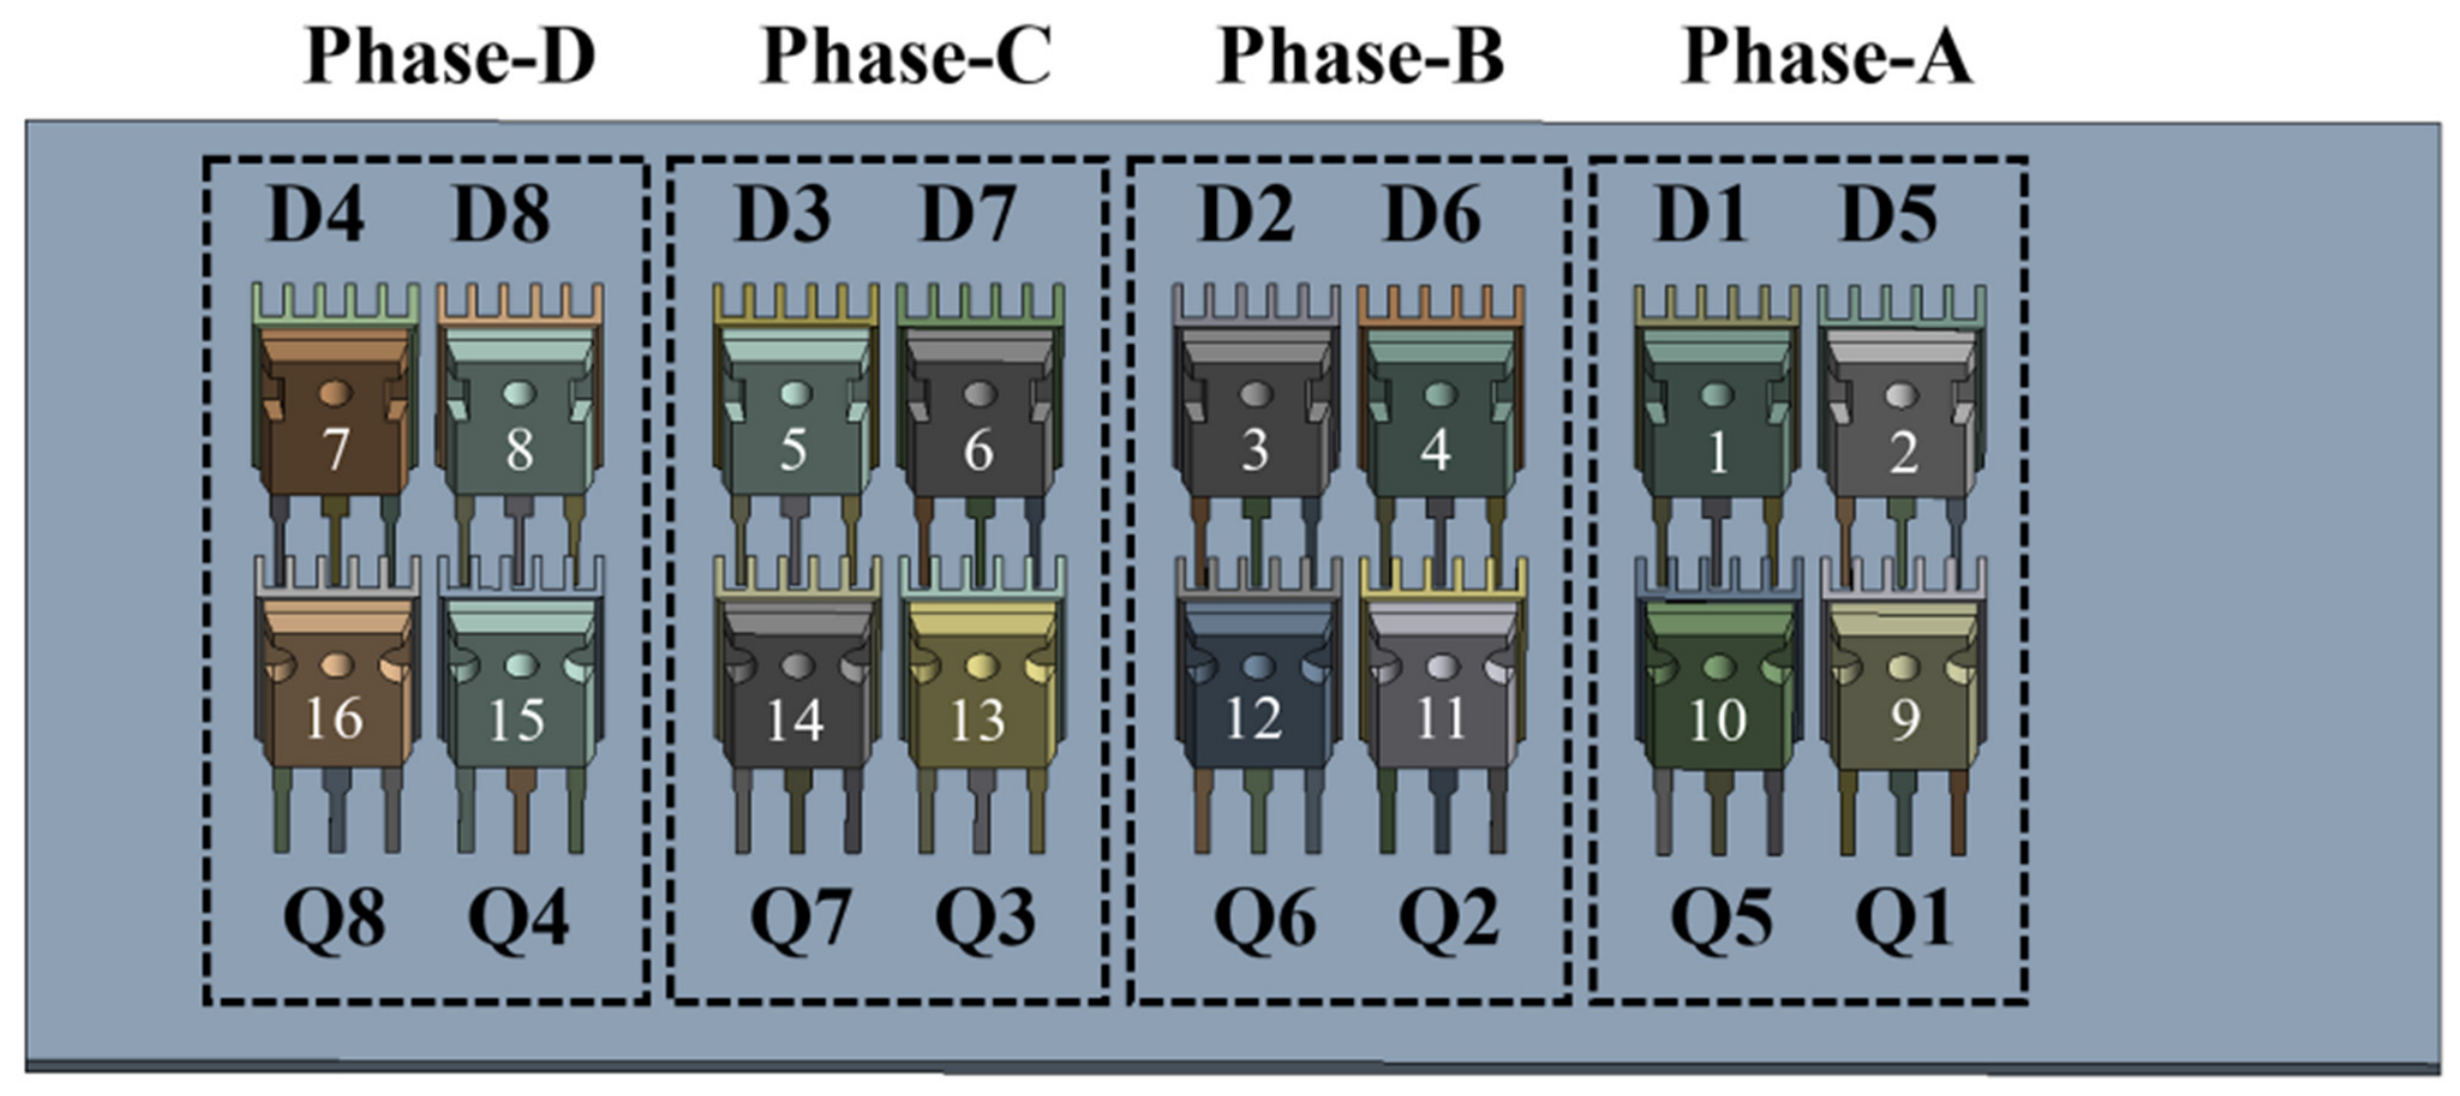
In a conventional power converter, as illustrated in Figure 7, the numbers from D1 to Q8 on each device denote the serial numbers of power semiconductor devices. Most heat generated during operation is conducted through the device base and a thermally conductive insulating spacer to the heat sink. The heat is then dissipated to the surrounding air by convection and radiation from the heat-sink fins. The remaining heat in the device is released directly from its surfaces to the air by convection and radiation.
Figure 7.
FEM of the four-phase asymmetric half-bridge converter for the SRM.
In this study, power converter faults are diagnosed using temperature-rise data obtained from the power-device housings. To simplify the thermal simulation model without compromising simulation accuracy, the following reasonable simplifications were applied [16,17,18,19,20]:
(1) The internal multilayer structure of the MOSFET, including the chip solder layer, DBC packaging layer, and substrate solder layer, was combined into an equivalent solder layer, as illustrated in Figure 8.
Figure 8.
Layers of the 3-D FEM model of the MOSFET.
(2) The power electronic device was modeled as a rectangular prism composed of a single material, and the thermal conductivity of this equivalent rectangular prism was calculated using Equation (6):
where Rthijc is the thermal resistance from the bottom case to the chip of the i-th device, li is the thickness of the device, and Ai is the area of the bottom surface of the device. The simplified simulation model is shown in Figure 8.
Homogenizing the internal multilayer structure neglects local temperature gradients within the device. However, because the proposed diagnostic method uses only the external housing temperature rather than the internal chip temperature, this simplification has little effect on the steady-state temperature rise of the device case while substantially reducing the mesh count and computational burden.
Based on the assumptions described above, a steady-state thermal finite element model of the power converter was developed. The geometric parameters and simulation environment parameters are provided in Table 3 and Table 4, respectively. According to the official device datasheets, the junction-to-case thermal resistance is 0.5 °C/W for the power diode and 0.29 °C/W for the IRFP4688 MOSFET. Both devices have dimensions of 20 mm × 16 mm × 5 mm. Equation (6) gives equivalent thermal conductivities of 54 W/(m·°C) for the MOSFET and 32 W/(m·°C) for the power diode. The junction-to-case thermal resistances were obtained directly from the official manufacturer datasheets, and the equivalent thermal conductivities were then derived using the standard thermal-resistance formulation. For the PCB, heat sink, and thermal grease, thermal conductivities were assigned based on typical material parameters reported in the literature. Because the convective heat-transfer coefficient and surface emissivity listed in Table 4 are not provided in device datasheets, their initial values were selected with reference to relevant thermal simulation studies of power electronics. Because the present study did not reserve a separate experimental dataset for FEM validation, the same experimental data were used to assess the agreement between the calibrated FEM results and the measurements. Therefore, this comparison should be regarded as a calibration and model–experiment agreement assessment rather than an independent validation. For the thermal simulation, a geometric model was constructed using the parameters in Table 3 and imported into finite element simulation software. A steady-state thermal analysis was performed at a constant ambient temperature of 27 °C. The convective heat-transfer coefficients and thermal emissivity values of the heat sink and power devices were set as specified in Table 4.
Table 3.
Material properties and geometric dimensions.
Table 4.
Boundary conditions for the power converter.
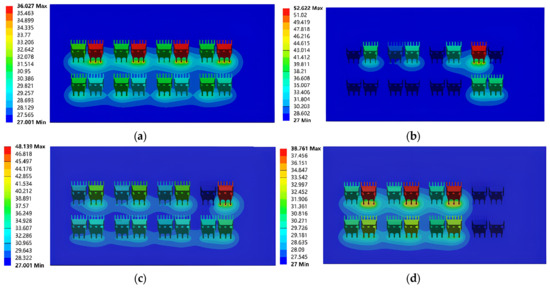
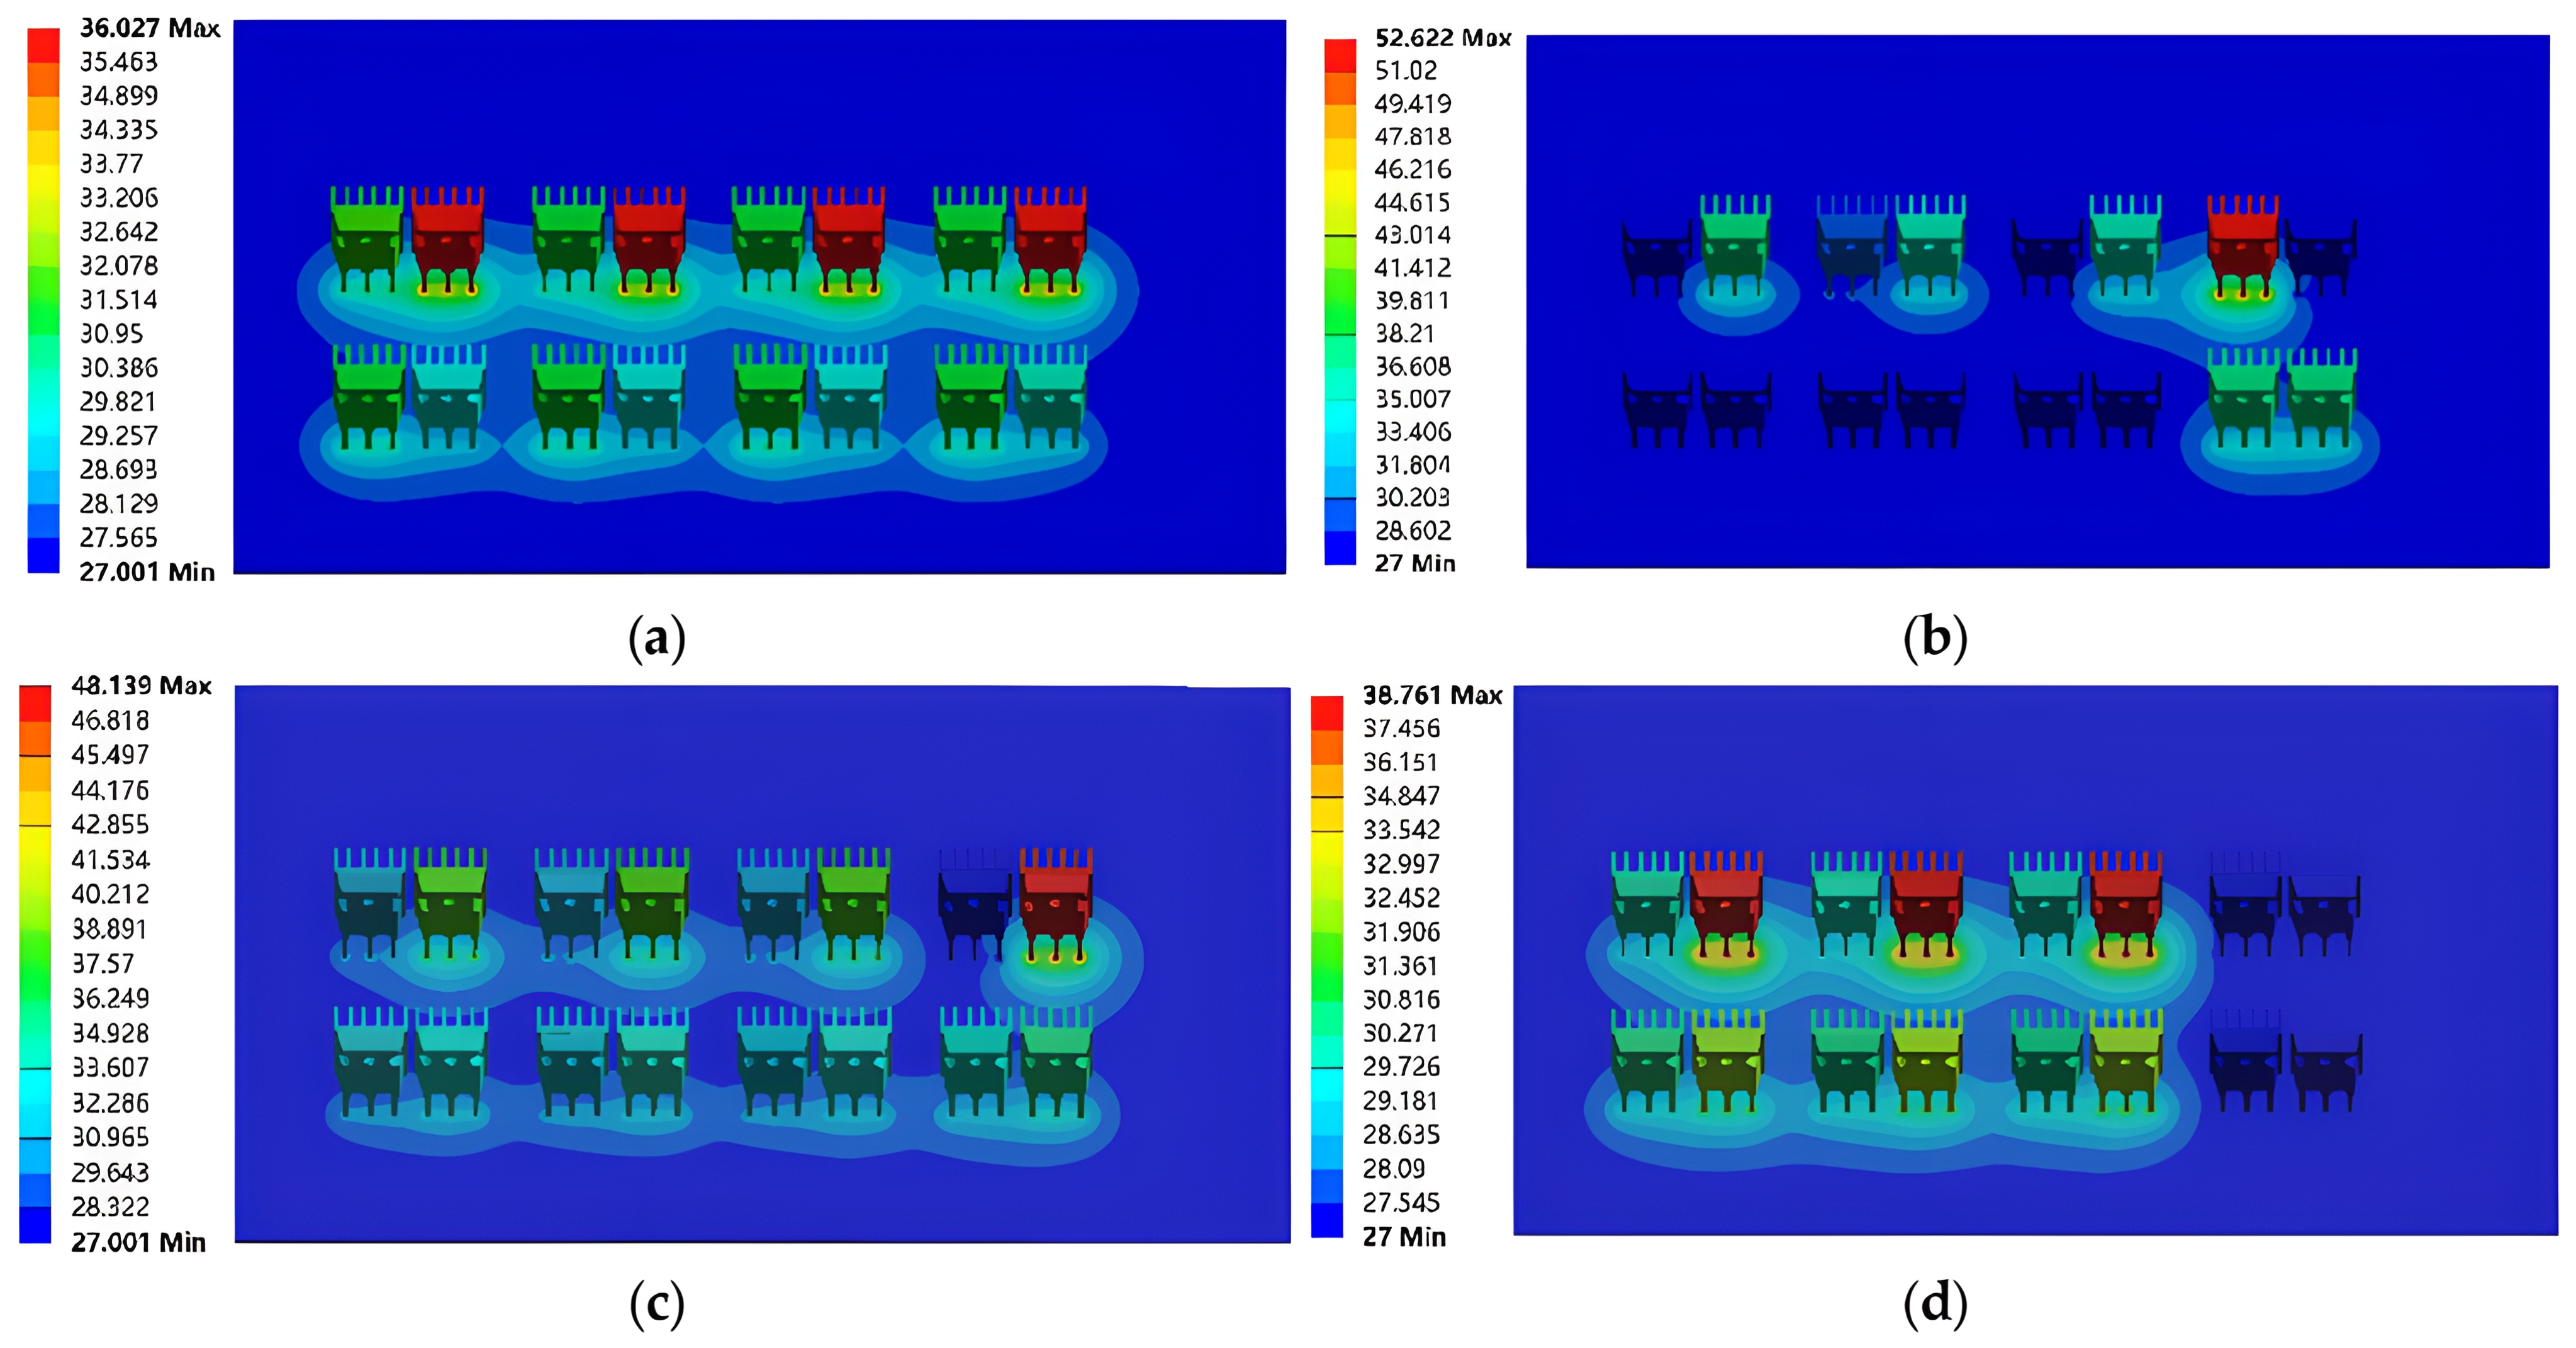
The established finite element model was used to obtain converter temperature distribution contours under normal operation and various fault conditions, as illustrated in Figure 9. The simulation results show that a short circuit in the phase-A chopper switch increases the temperature of the phase-A power transistor. Under closed-loop speed control, the currents in the remaining healthy phases decrease slightly, causing a corresponding reduction in power-transistor temperature relative to normal operation. A short-circuit fault in the phase-A position transistor increases the temperature of the DOWN freewheeling diode. When an open-circuit fault occurs in the phase-A chopper, the faulty phase cannot be excited properly, and its phase current falls to zero; consequently, the temperatures of the power devices in the faulty phase do not increase. The closed-loop speed control compensates for the total output torque by increasing the phase currents in the remaining healthy phases, which raises the temperatures of the power devices in those phases.
Figure 9.
Temperature-distribution contours of the power converter. (a) Normal state. (b) Chopper short-circuit fault. (c) Position transistor short-circuit fault. (d) Chopper open-circuit fault.
4. Fault Diagnosis Method Based on Temperature-Rise Monitoring
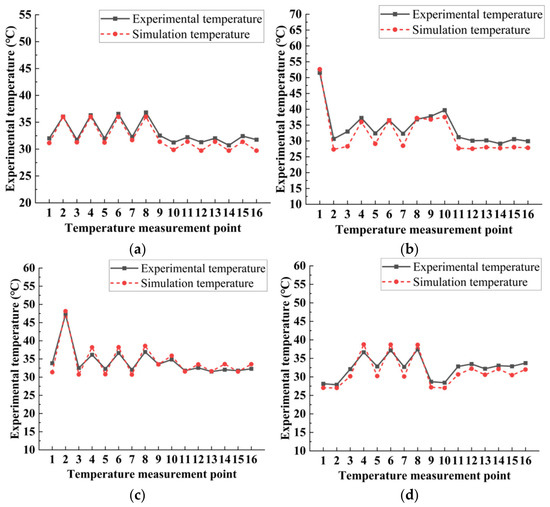
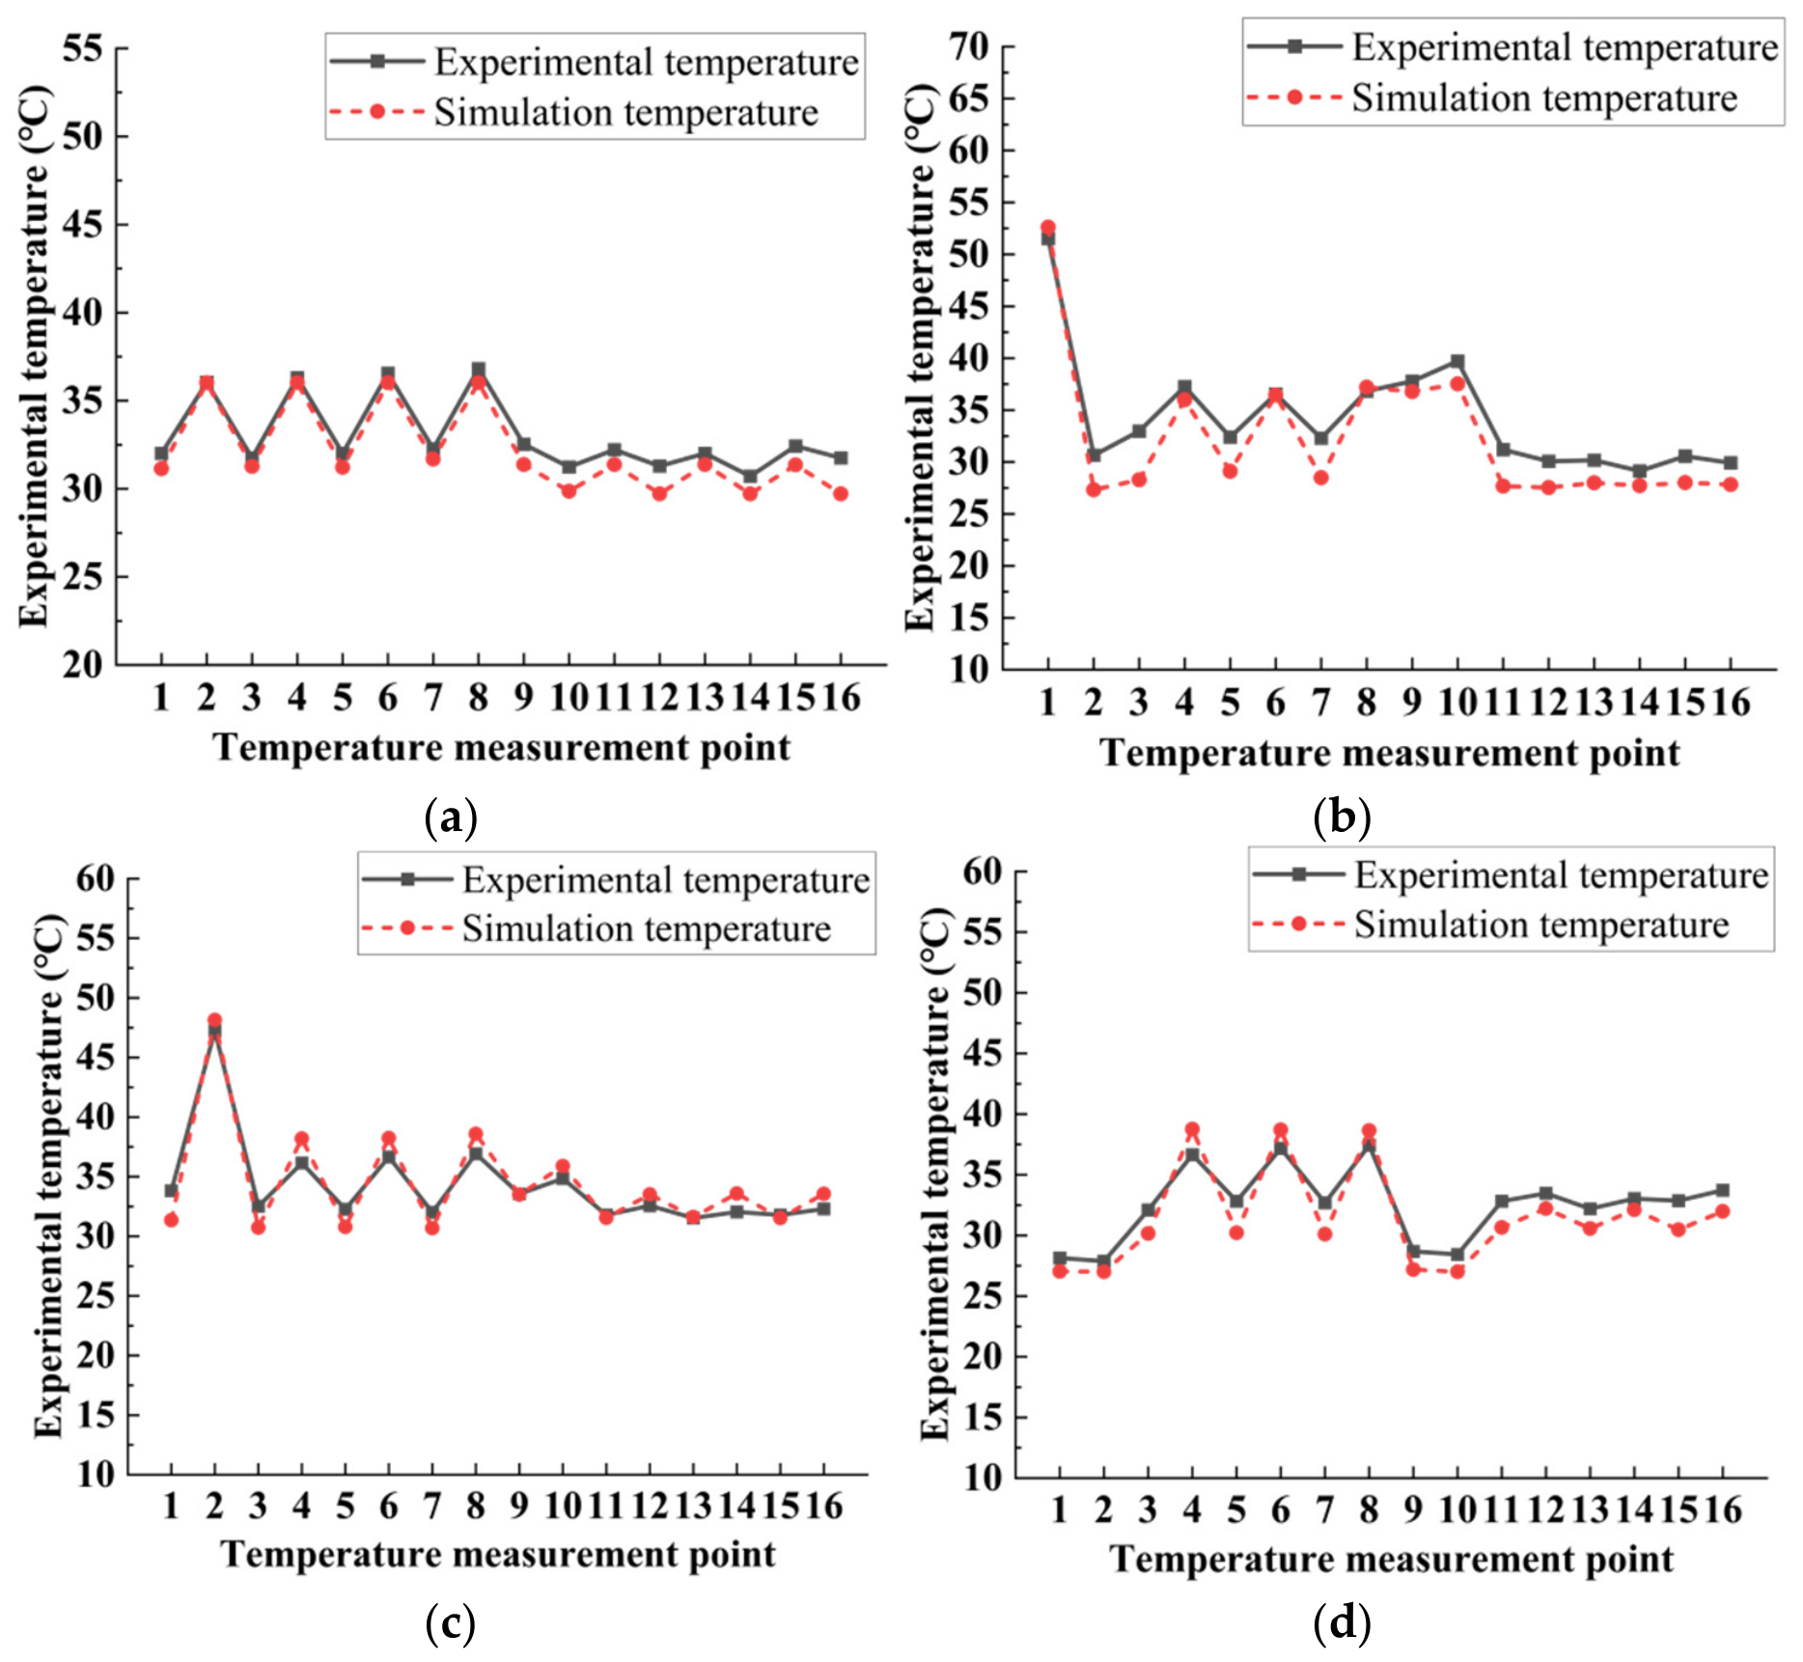
To calibrate the thermal boundary parameters and assess the agreement between the thermal model and the experimental measurements, temperature data were collected from the switched reluctance motor (SRM) prototype under no-load operation at 800 r/min. The measured temperatures were compared with the corresponding FEM results, as shown in Figure 10. These boundary parameters were calibrated by comparing the simulated housing temperatures with the experimental measurements obtained under the operating conditions shown in Figure 10. The experimental data shown in Figure 10 were used both to calibrate the convective heat-transfer coefficient and surface emissivity and to quantify the agreement of the resulting calibrated model. No independent experimental dataset was available for a separate FEM validation.
Figure 10.
Calibration and model–experiment agreement assessment of the FEM thermal model. (a) Normal state. (b) Chopper transistor short-circuit fault. (c) Position transistor short-circuit fault. (d) Chopper transistor open-circuit fault.
The mean relative deviation (MRD) between the simulated and measured temperature responses was calculated for each operating condition. The MRD values were 4.2%, 3.2%, 2.0%, and 4.5% for the normal condition, chopper transistor short-circuit fault, position transistor short-circuit fault, and chopper transistor open-circuit fault, respectively. The overall mean relative deviation was 3.5%. These results indicate that the calibrated FEM model reproduced the main temperature trends and relative temperature variations observed in the tested cases. However, because the same data were involved in parameter calibration and agreement assessment, these results do not constitute independent FEM validation.
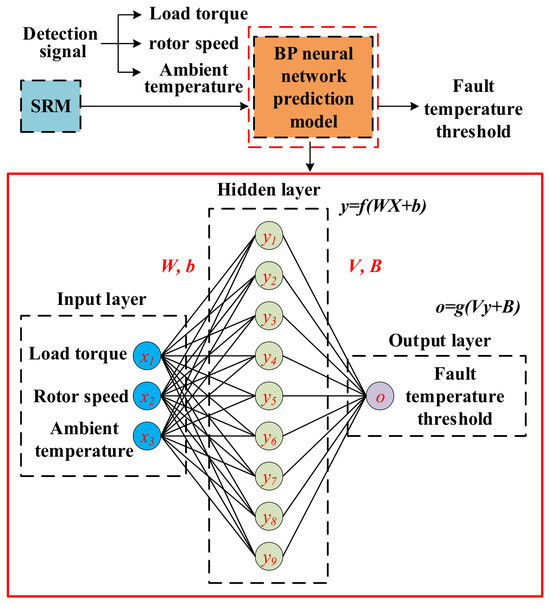
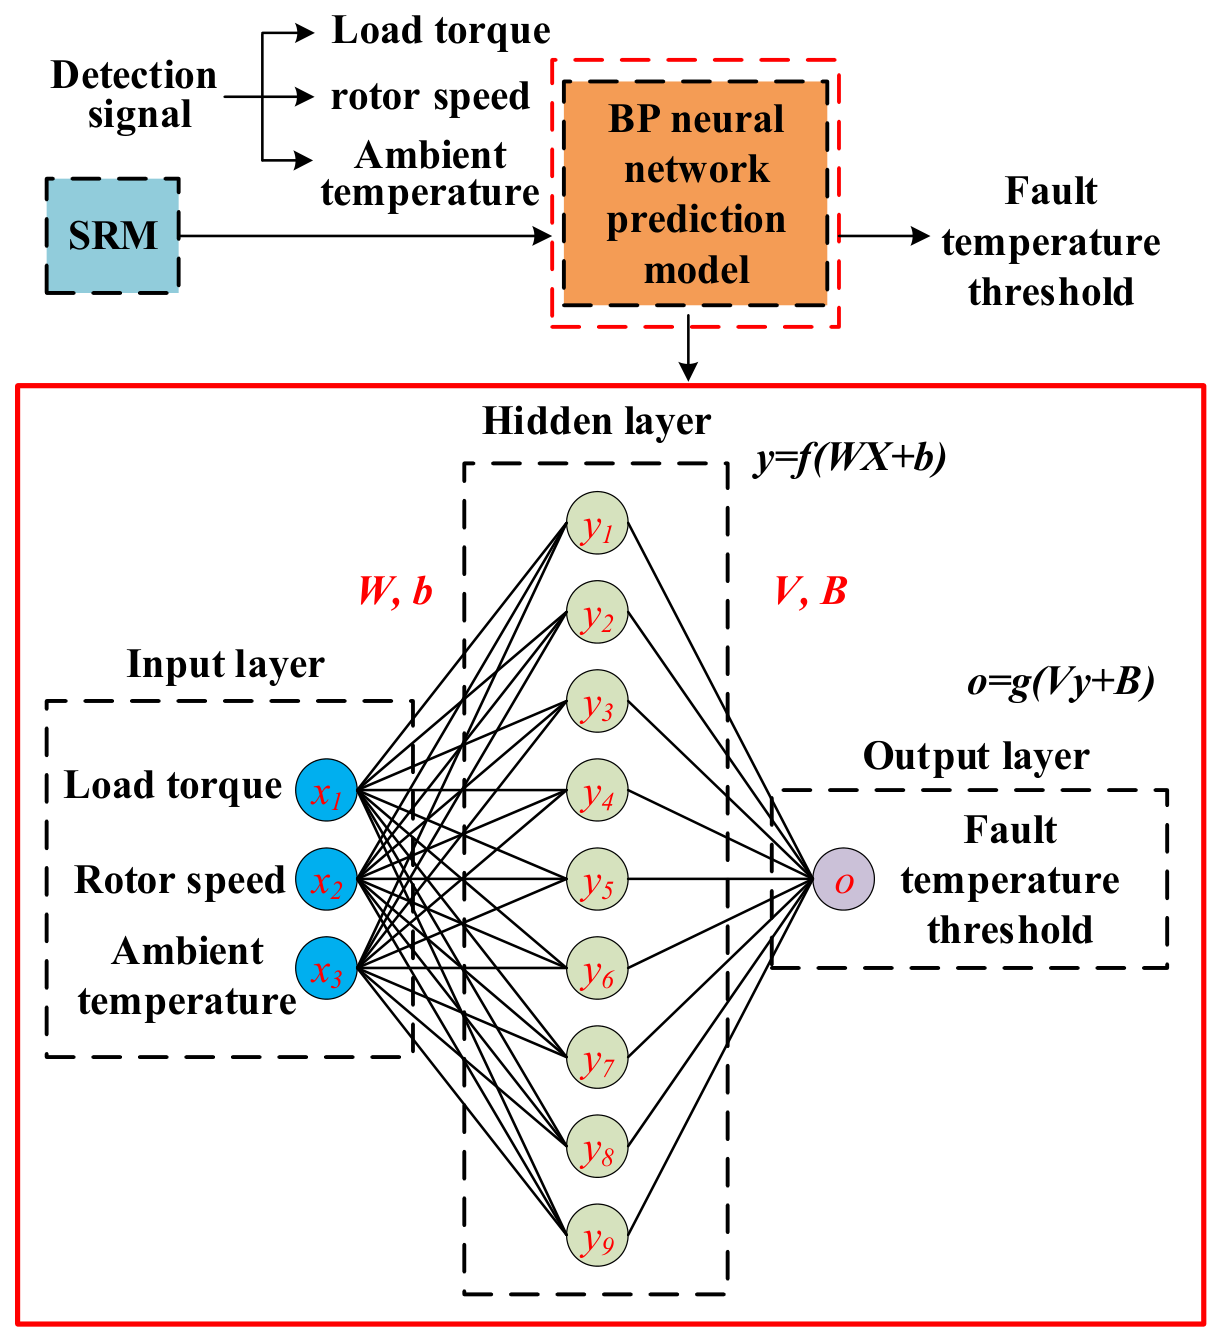
To obtain temperature-difference thresholds for the different fault cases, three fault-specific backpropagation neural network (BPNN) models were developed to predict fault-induced temperature-rise-variation thresholds for the monitored power diodes under various operating conditions. The models were based on results from the finite element thermal model [21,22,23,24,25] and corresponded to a chopper transistor short-circuit fault, a position transistor short-circuit fault, and a chopper transistor open-circuit fault. All three models used the same 3-9-1 architecture, as illustrated in Figure 11.
Figure 11.
BPNN model for predicting the fault temperature thresholds.
As shown in Figure 11, each BPNN model contains an input layer with three neurons corresponding to load torque, rotor speed, and ambient temperature; a hidden layer with nine neurons; and an output layer with one neuron representing the fault-induced temperature-rise-variation threshold for the corresponding fault type. The models were trained using gradient descent. The number of hidden-layer neurons was selected using preliminary comparative experiments and empirical BPNN design rules, for which several architectures with different numbers of hidden-layer neurons were evaluated. Too few hidden-layer neurons prevented the network from adequately characterizing the nonlinear relationship among load torque, rotor speed, ambient temperature, and the fault temperature threshold. Conversely, too many neurons produced only marginal improvements in prediction accuracy while increasing training complexity and the risk of overfitting. Nine hidden-layer neurons were therefore selected as a trade-off between predictive performance and model complexity. Gradient descent was selected because the threshold prediction problem is a low-dimensional regression task with three input variables and one output variable. After data normalization, the method provided stable convergence and low computational cost for the given dataset and was therefore suitable for training the BPNN-based temperature threshold prediction model.
The training procedure was as follows:
(1) Randomly input sample data into the neural network, denoted as the matrix X, where X = [x1, x2, xi, xn].
(2) Initialize network weights and biases: The weight from the input layer to the hidden layer is W, the bias is b, and the activation function is f(W, b); the weight from the hidden layer to the output layer is V, the bias is B, and the activation function is g(V, B).
(3) Calculate the hidden-layer output values: y = f(WX + b).
(4) Calculate the output-layer values: o = g(Vy + B).
(5) Compare the predicted output values with the expected values. If the error is within a reasonable range, the training process is complete; otherwise, iteratively update the weights and biases until the output error meets the accuracy requirements.
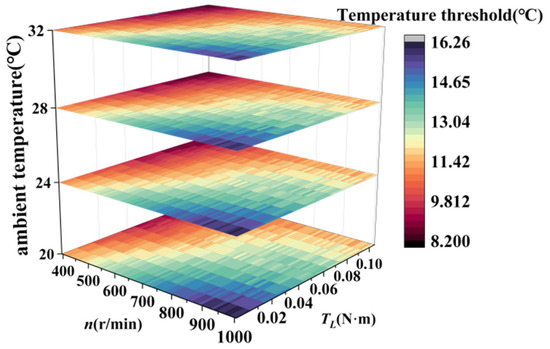
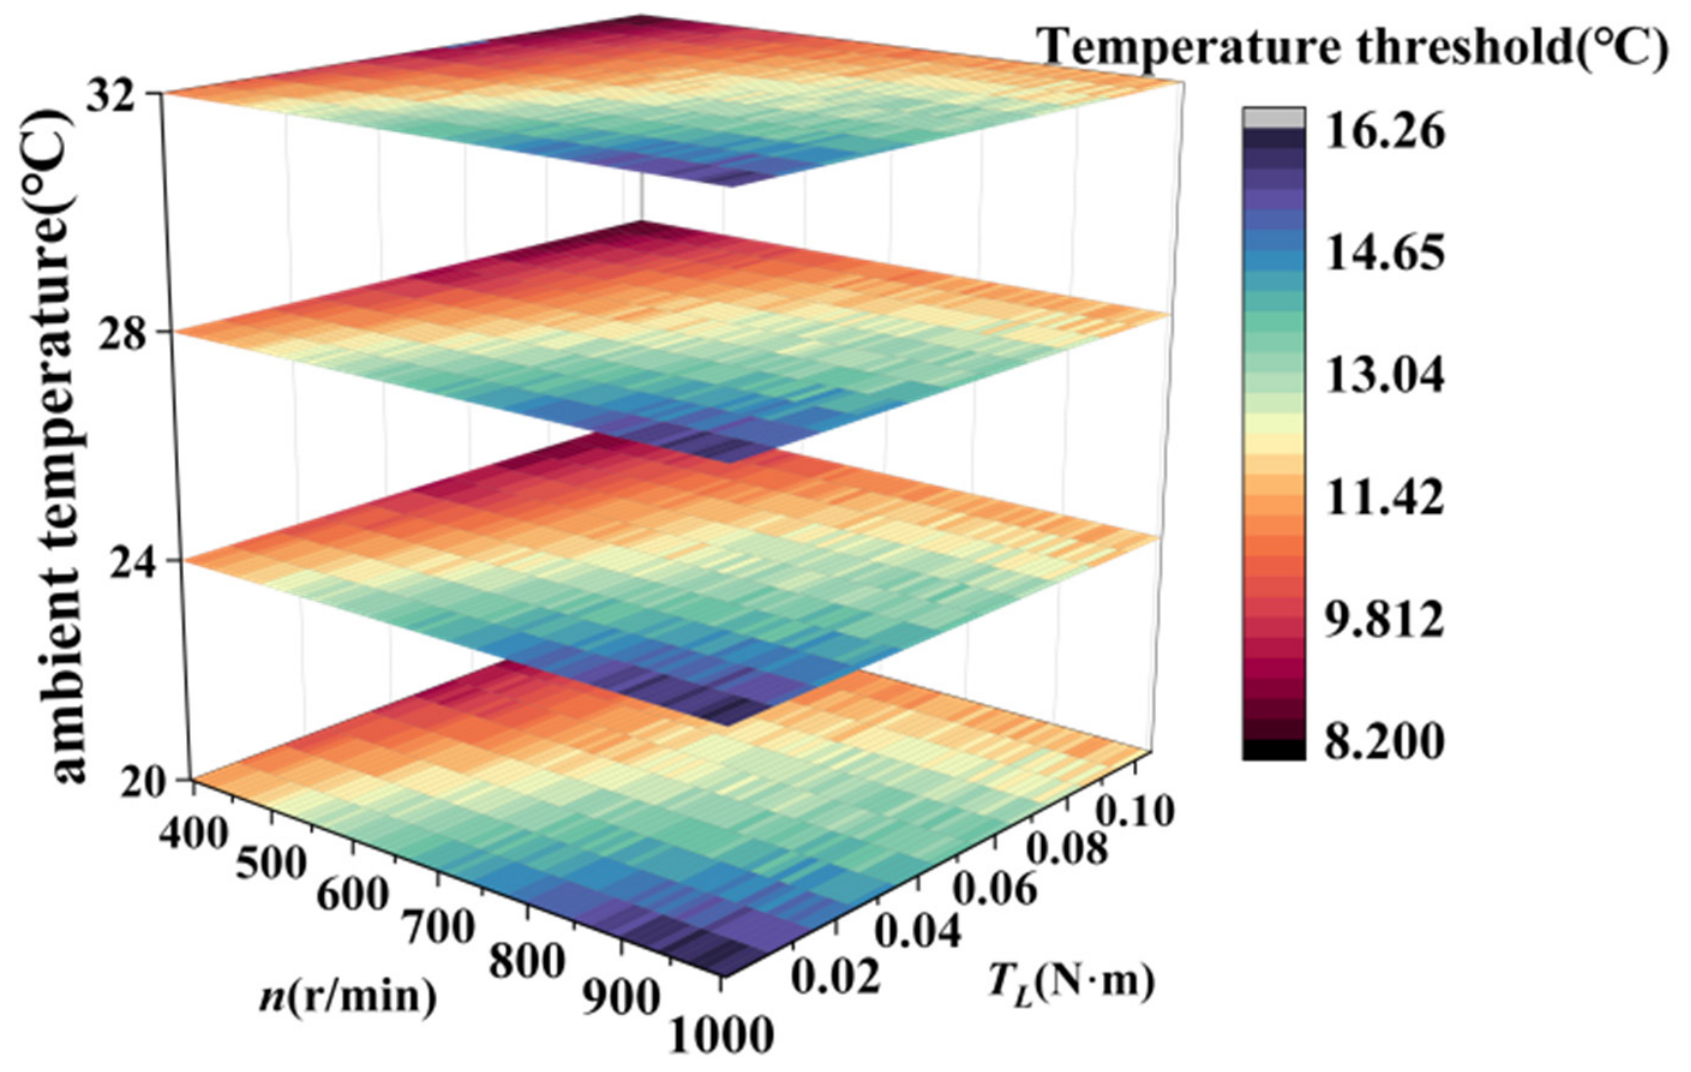
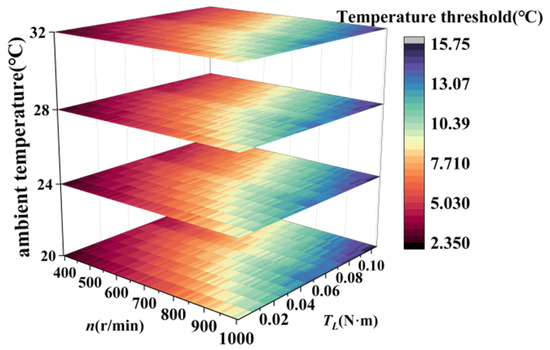
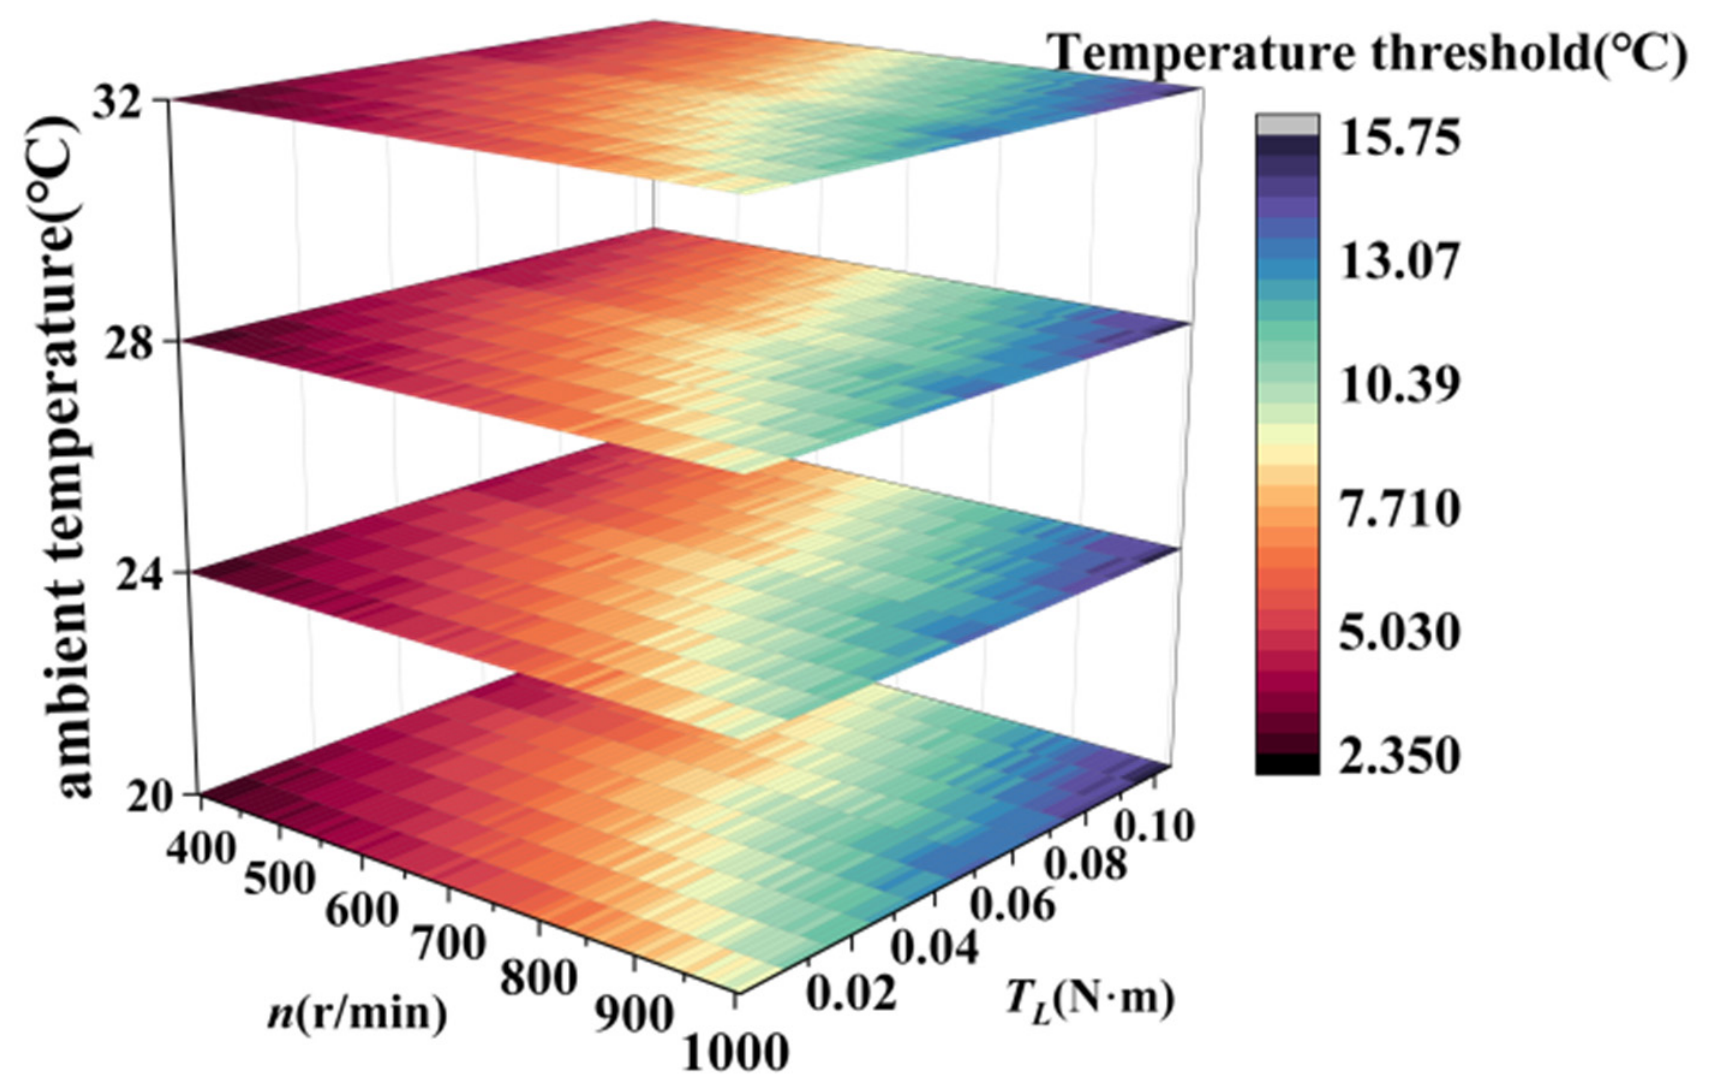
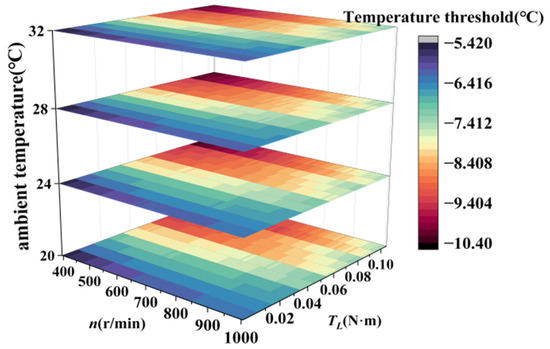
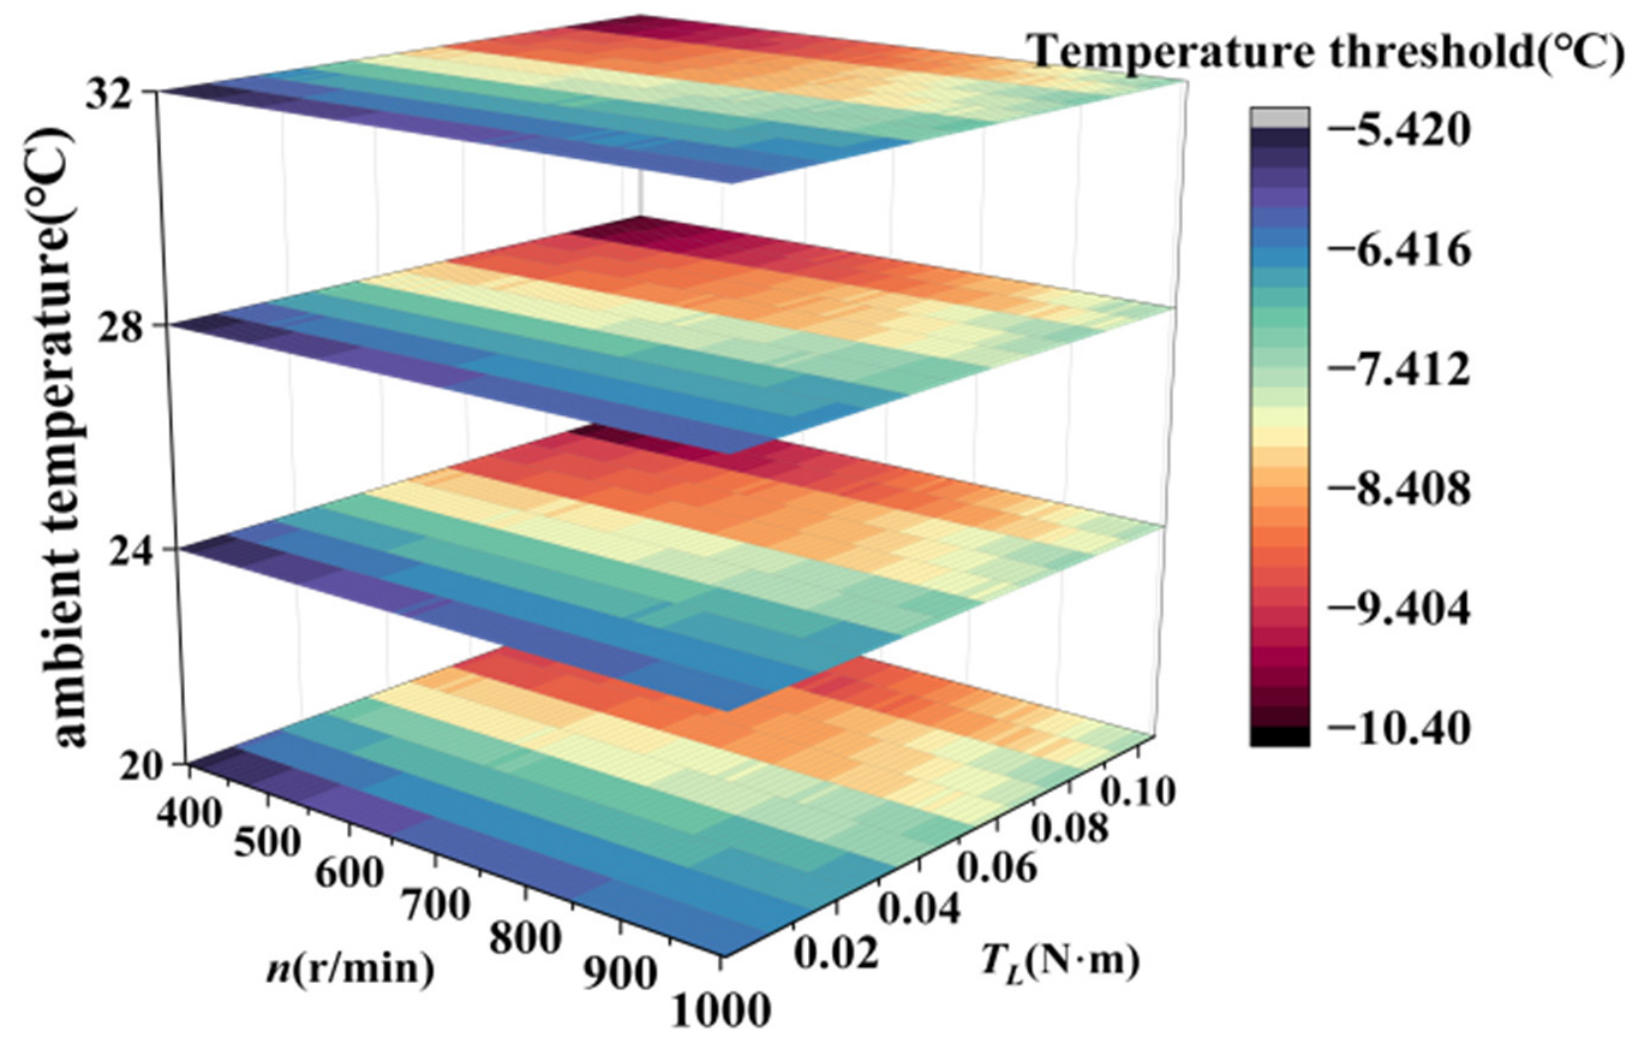
In this study, 1344 sets of simulation data covering different combinations of the three influencing factors were selected as BPNN samples; 1294 sets were used for training and 50 sets for testing. On the test data, the trained model achieved a mean absolute error (MAE) of 0.018 and a correlation coefficient of 0.996. The quality and representativeness of the samples were ensured in three ways. First, the FEM-based thermal model used to generate the samples was experimentally validated under normal and representative fault conditions, as shown in Figure 10. The close agreement between simulated and measured temperature variations confirms the physical fidelity of the generated samples. Second, samples were generated by systematically varying rotor speed, load torque, and ambient temperature across the investigated operating range. The resulting sample set covers all operating conditions considered in this study and supports reliable interpolation by the trained BPNN within this range. Third, all input and output data were normalized before training to eliminate the effects of different variable scales and improve convergence. The low MAE and high correlation coefficient on the test set further confirm the prediction accuracy of the trained model for unseen samples within the investigated operating range. Prediction performance may, however, deteriorate when operating conditions fall outside the range of the training data. The MAE represents the average absolute deviation between the predicted and target thresholds; the value of 0.018 indicates a small average prediction error after data normalization and shows that the BPNN can accurately approximate the nonlinear relationship between the operating conditions and the fault temperature threshold. The correlation coefficient of 0.996 indicates strong linear agreement between the predicted and target threshold values, with the predicted thresholds following the target threshold trends across different rotor speeds, load torques, and ambient temperatures. The trained BPNN therefore provides satisfactory predictions over the investigated operating range and can supply operating-condition-dependent diagnostic thresholds. The well-trained BPNN model was then used to predict the temperature thresholds for different fault types and influencing factors. For rotor speeds of 400 to 1000 r/min and load torques of 0 to 0.1 N·m, heat maps of the fault temperature thresholds at four ambient temperatures are presented in Figure 12, Figure 13 and Figure 14.
Figure 12.
Heat map of the chopper short-circuit fault temperature threshold.
Figure 13.
Heat map of the position transistor short-circuit fault temperature threshold.
Figure 14.
Heat map of the chopper open-circuit fault temperature threshold.
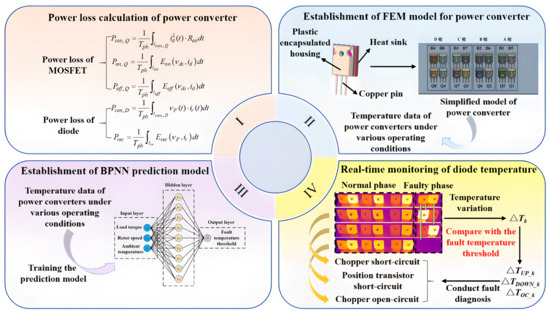
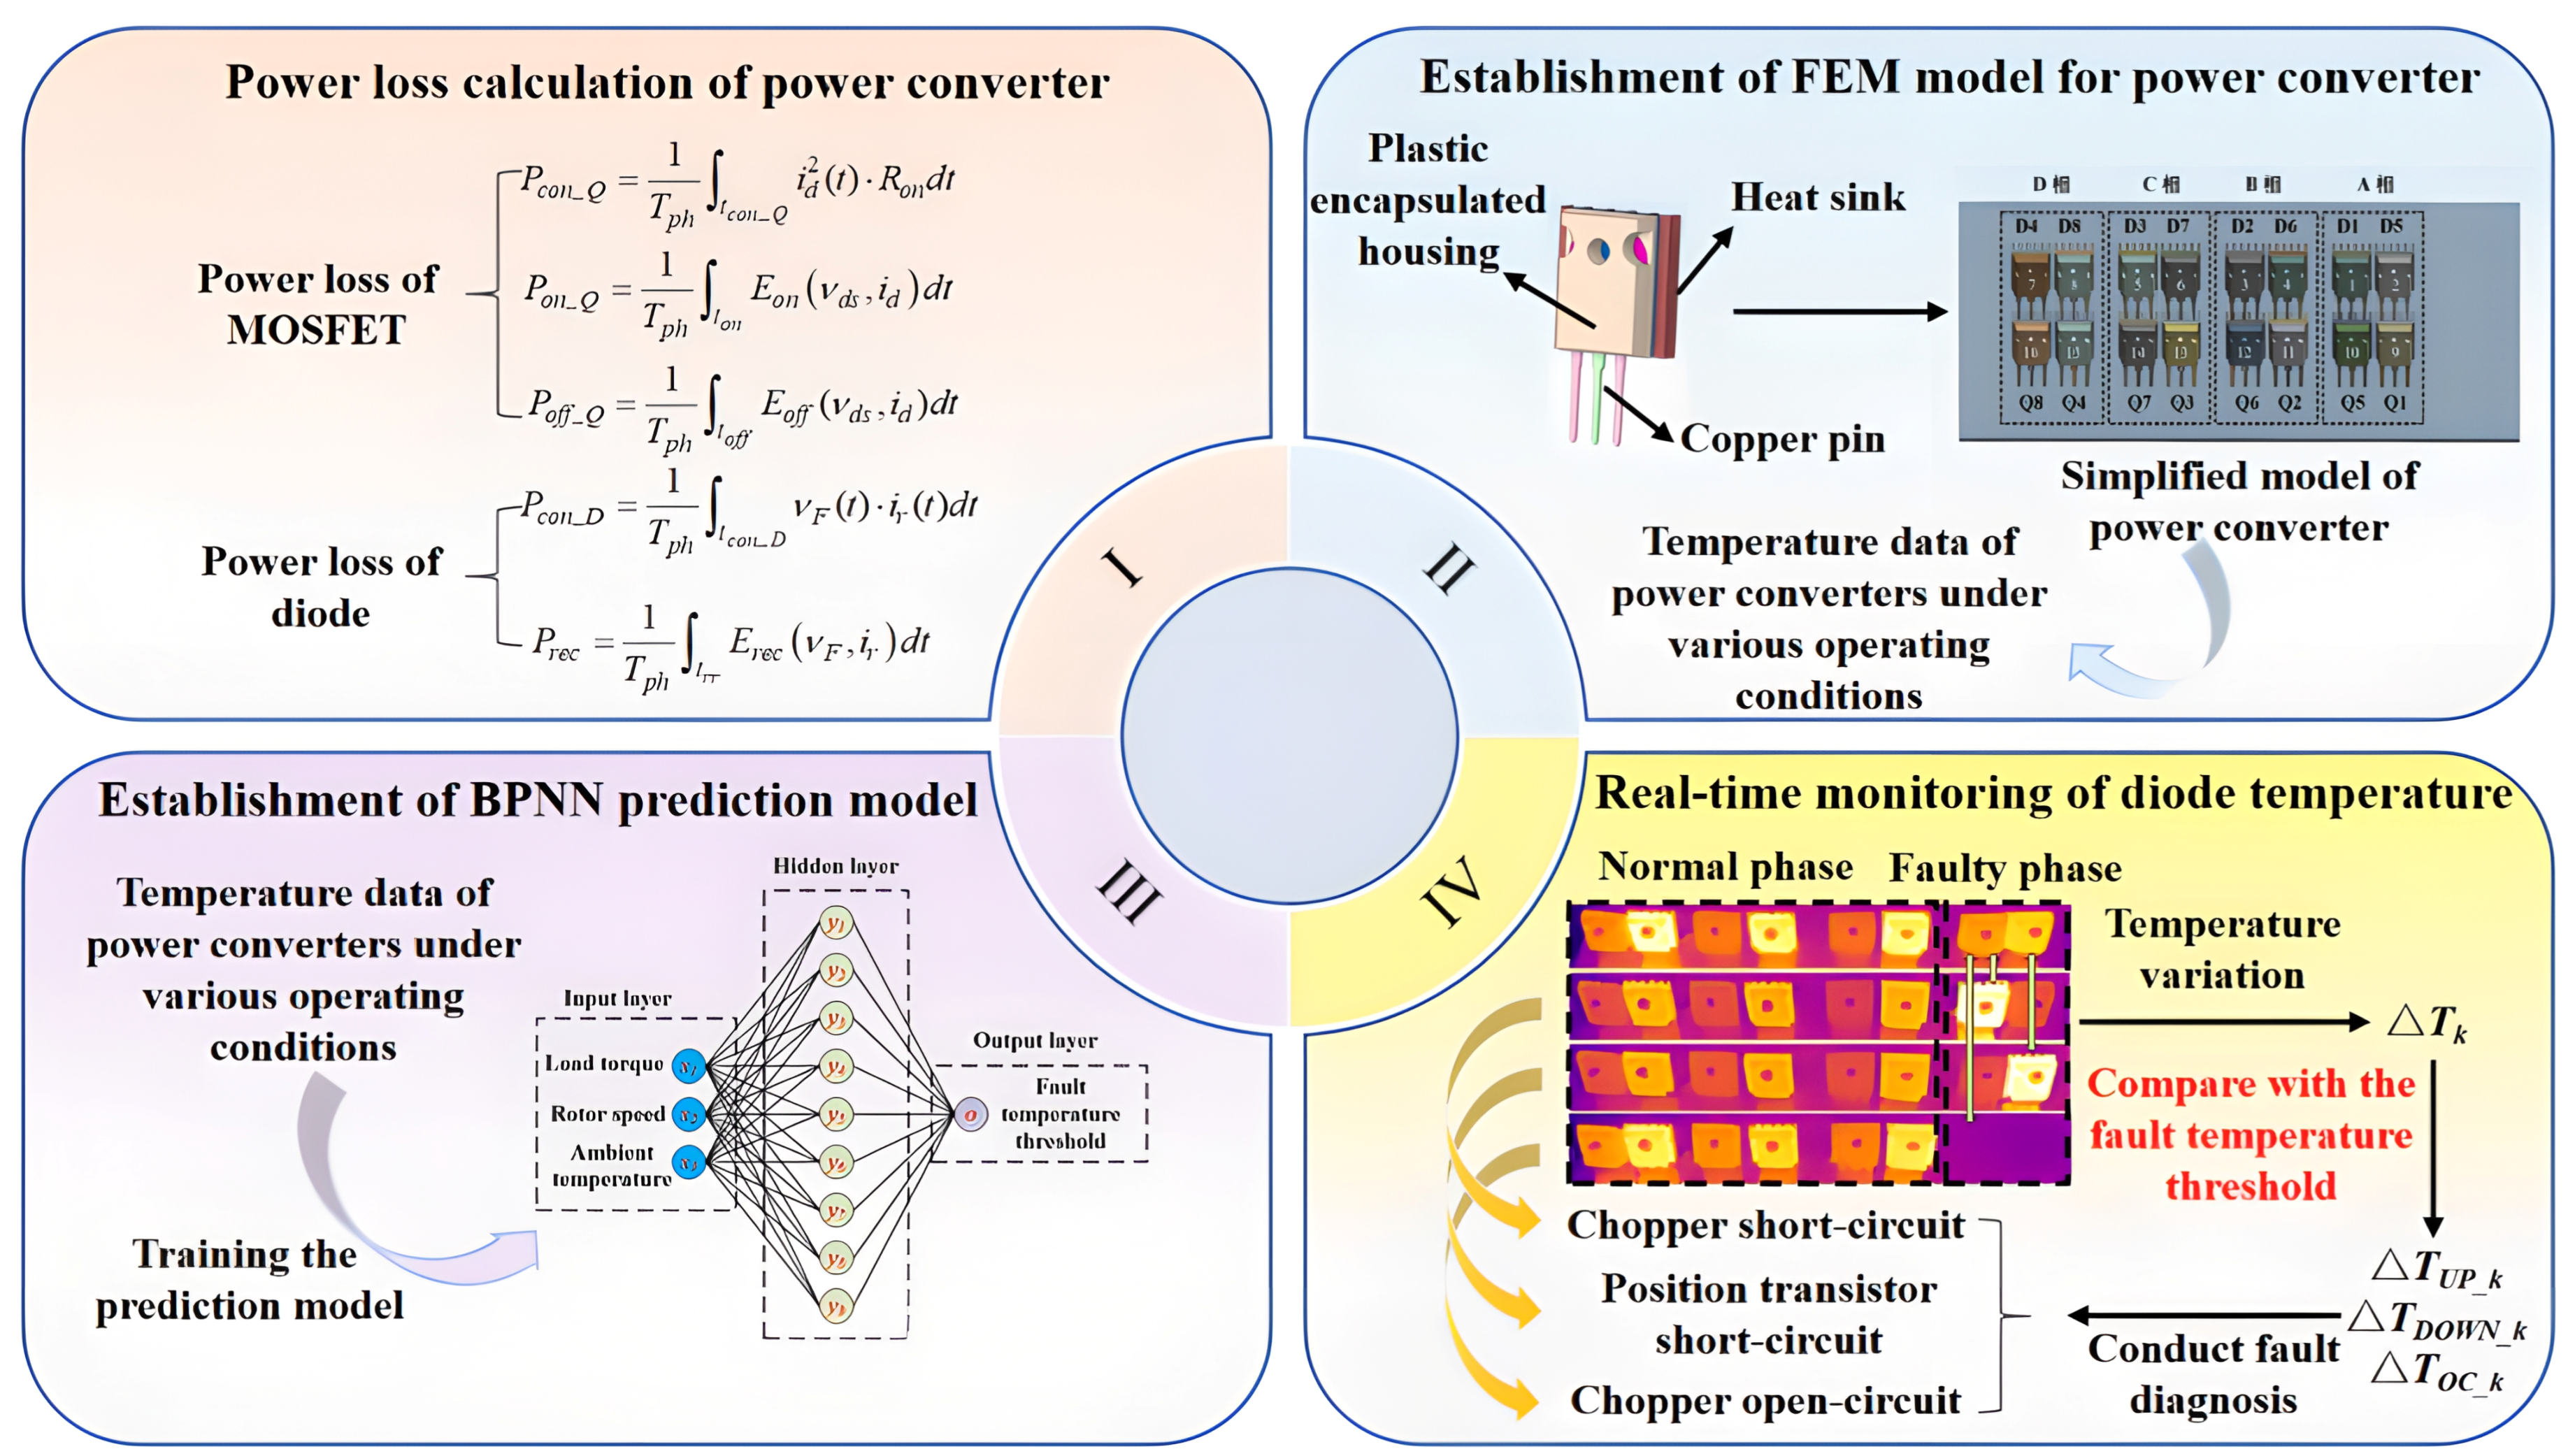
This paper proposes a novel fault diagnosis method that uses power diode temperature variations and the temperature thresholds predicted by the BPNN. The schematic diagram of the proposed diagnostic procedure is illustrated in Figure 15.
Figure 15.
Schematic diagram of the proposed fault diagnosis method.
- Stage I: Power Loss Calculation for the Power Converter
The power losses of the power converter are calculated first. Mathematical models are established separately for the power losses of the MOSFETs and diodes. The conduction, turn-on, and turn-off losses of the MOSFETs and the conduction and reverse recovery losses of the diodes are calculated using the corresponding integral formulas to quantify the thermal losses generated by the power devices during operation. The calculated power-loss values are used as heat-source inputs and provide the thermal loads for the subsequent finite element thermal simulation.
- Stage II: Establishment of the FEM Model for the Power Converter
Using the power-loss heat sources obtained in Stage I as inputs, a three-dimensional solid model of the power devices is constructed from their actual geometries, including the plastic-encapsulated housings, copper pins, and heat sinks. The components are then assembled into a simplified model of the four-phase power converter. The calculated power losses are applied to the finite element model for thermal simulations under various operating conditions. The simulated power converter temperatures under these conditions form the sample dataset used to train the neural network model.
- Stage III: Establishment of the BPNN Prediction Model
The multi-condition temperature dataset obtained from Stage II simulation is adopted to construct the BPNN prediction model. Load torque, rotor speed and ambient temperature are selected as the input variables of the BP neural network, while the steady-state BPNN-predicted baseline temperature threshold is set as the model output. The network is trained with sample data to establish the nonlinear mapping relationship between the operating conditions of the converter and the BPNN-predicted baseline temperature threshold. The BPNN-predicted baseline temperature threshold is defined as:
where denotes the steady-state temperature of the device under fault conditions, and represents the steady-state temperature of the device under normal operating conditions with identical working parameters. On the basis of the reference temperature difference, three sets of fault diagnosis thresholds are further defined: , and are the upward-trend threshold, downward-trend threshold and open-circuit-fault decision threshold for phase-k, respectively.
where α is the scaling coefficients.
The final decision thresholds are obtained by multiplying the BPNN-predicted reference temperature differences by predefined scaling coefficients α.αwas manually selected within the range of 0.6–0.8 as an engineering parameter before the experimental evaluation. The purpose of introducing α < 1 was to set the decision threshold below the predicted steady-state fault temperature difference, thereby enabling an earlier fault indication. The range of 0.6–0.8 was selected empirically to provide a practical tradeoff between early warning and resistance to normal thermal fluctuations and measurement uncertainty. A smaller coefficient produces an earlier but more sensitive alarm, whereas a larger coefficient produces a more conservative but later alarm. The selected coefficients were kept fixed for all experimental cases and were not tuned using the experimental results reported in this study. It should be noted that the range of 0.6–0.8 is a prototype-specific engineering setting rather than a universally optimal range.
Compared with the full steady-state reference temperature difference used as the decision boundary, the scaled threshold can be reached before the device temperature difference approaches its steady-state fault value. The proposed method therefore does not require the device temperature to reach thermal steady state before fault diagnosis begins.
- Stage IV: Real-Time Monitoring and Fault Diagnosis of Diode Temperature
For the hardware monitoring scheme, temperature sensors are mounted on the plastic shell of freewheeling diodes, and the system collects temperature data every 2 s. The real-time temperature difference is obtained by comparing the measured temperatures of devices in the normal phase and the faulty phase , which is defined as
where Tmon,k is the real-time monitored temperature of the k−th-phase diode, and Tnor,k denotes its steady-state baseline temperature under the identical healthy operating condition. The real-time temperature difference is compared with the scaled thresholds , and . Combined with corresponding judgment intervals, three typical faults, namely chopper short-circuit, position transistor short-circuit and chopper open-circuit, can be identified. Benefiting from the threshold reduction to 60–80% of the reference value, the system can trigger fault judgment without waiting for the device temperature to reach the steady-state fault temperature difference, thereby realizing effective detection of the early transient fault process.
Online fault diagnosis proceeds as follows:
(1) The system monitors the current operating conditions in real time and collects key operating parameters such as rotor speed, load torque, and ambient temperature.
(2) The trained prediction model is used to obtain the temperature thresholds for different fault conditions based on the actual operating conditions of the motor.
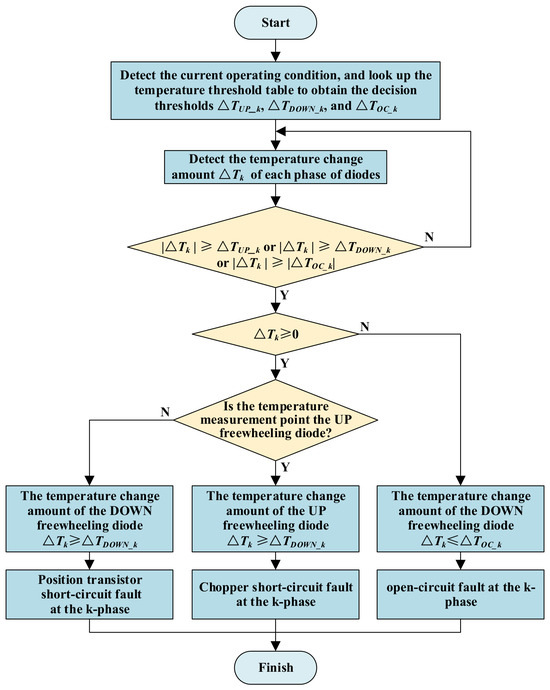
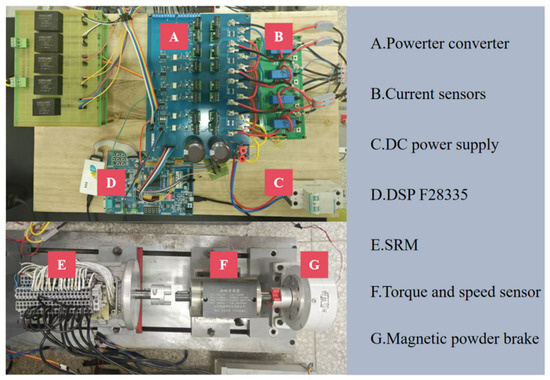
(3) The fault monitoring system monitors and records the temperature change ΔTk of each phase diode in real time, initiates the fault-determination procedure, and applies the decision logic shown in Figure 16.
Figure 16.
Fault diagnosis flowchart.
The detailed fault decision and localization logic is illustrated in Figure 16. This approach enables component-level identification of short-circuit faults in chopper transistors and position transistors, whereas open-circuit faults can be localized only to the faulty phase. The measured temperature variation of each monitored diode is compared with the corresponding fault-specific threshold generated by the BPNN. The fault type is determined from the monitored diode and the direction of threshold violation, while the faulty phase is identified as the phase with an abnormal temperature variation. If none of the fault criteria is met, the converter is considered to be operating normally, and monitoring continues.
5. Experimental Verification
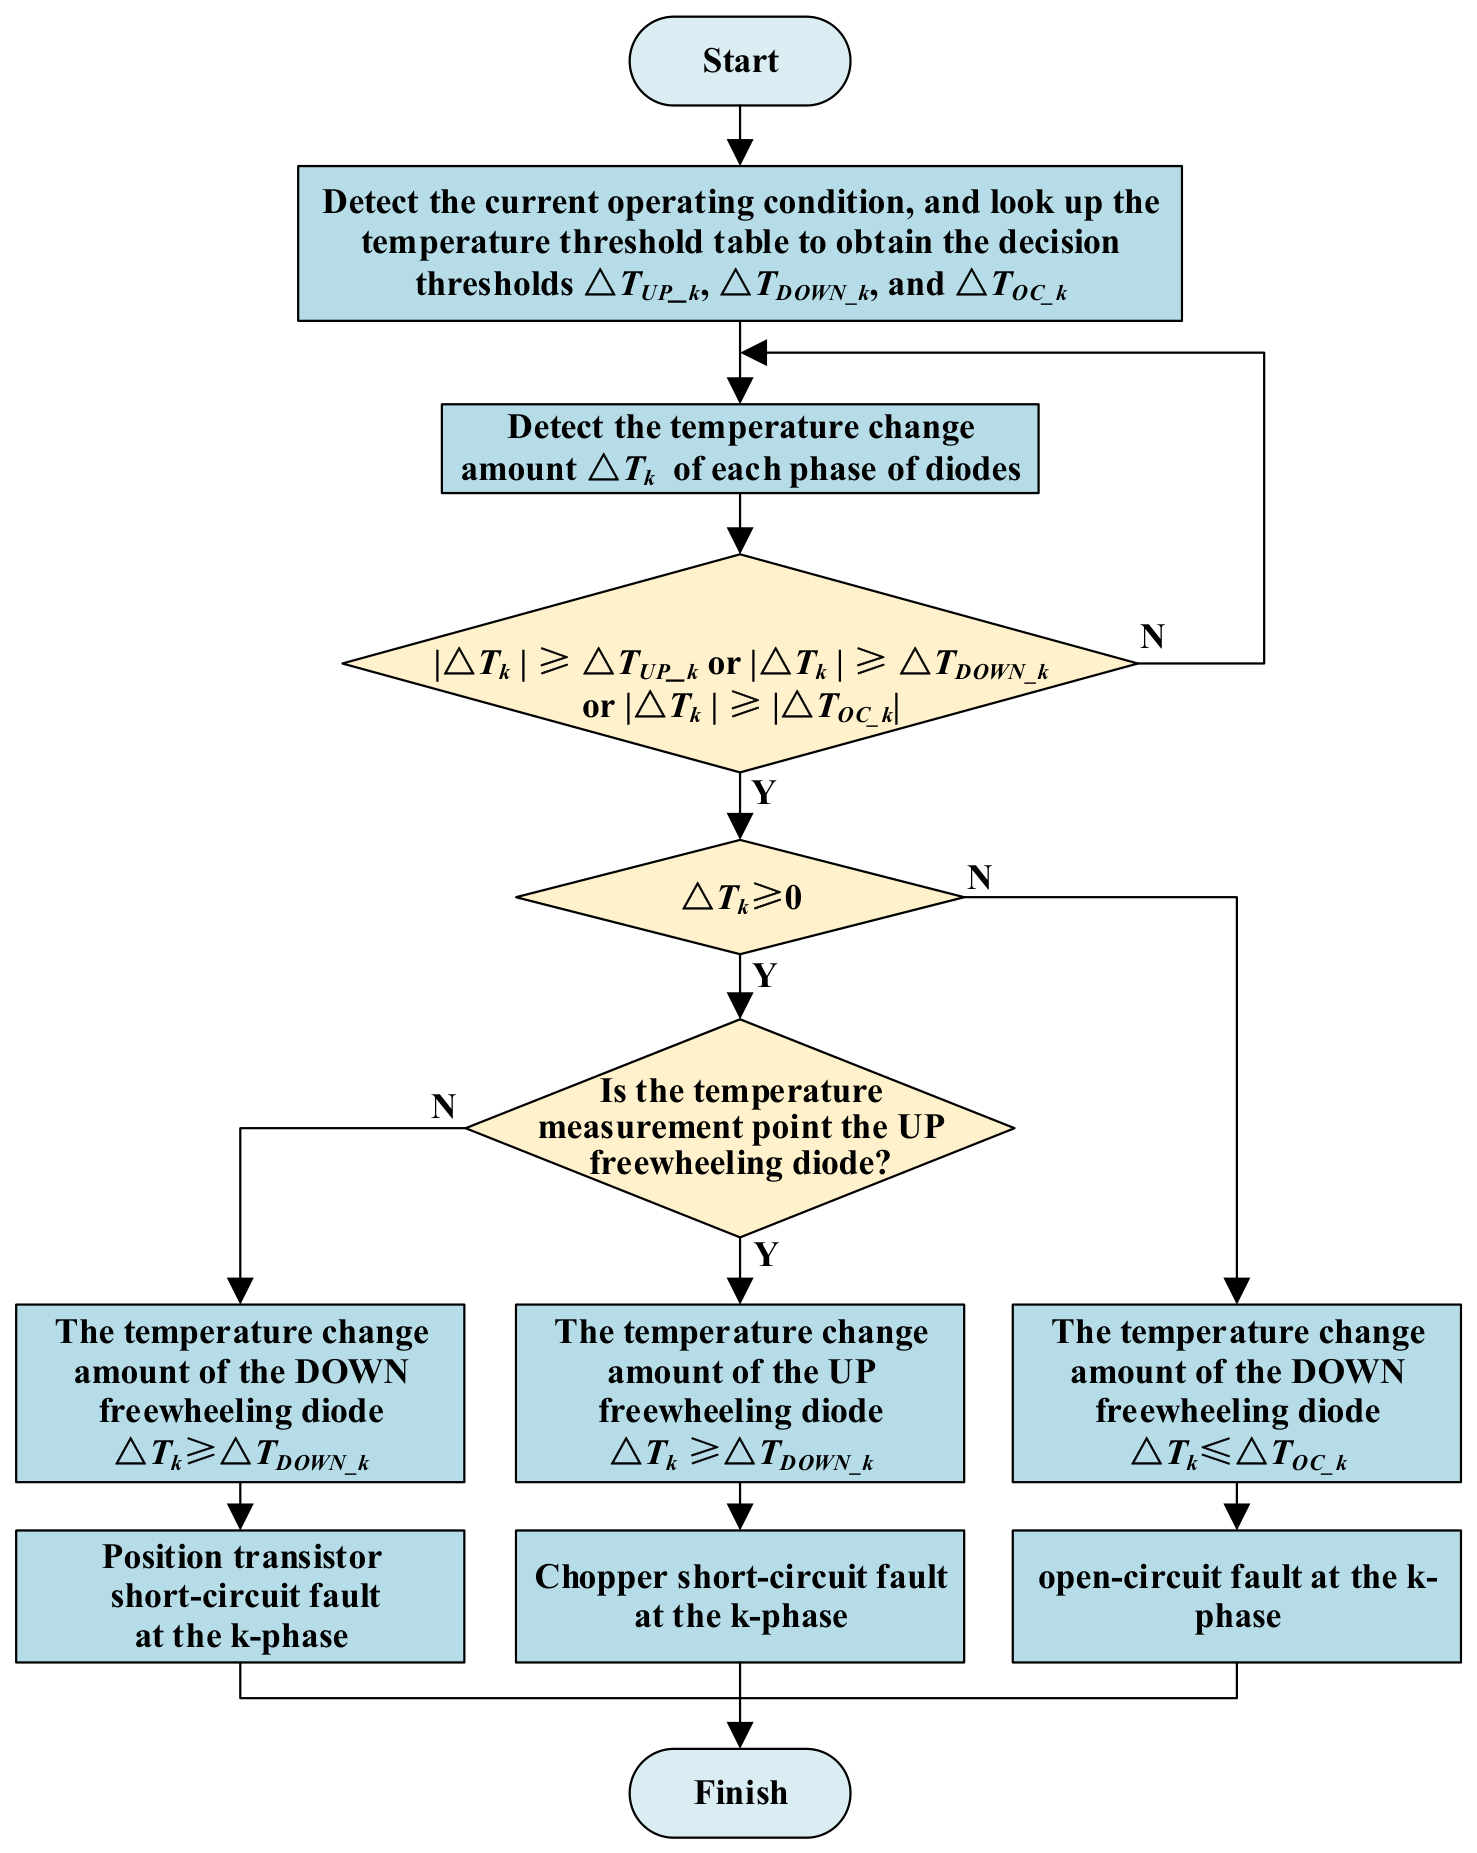
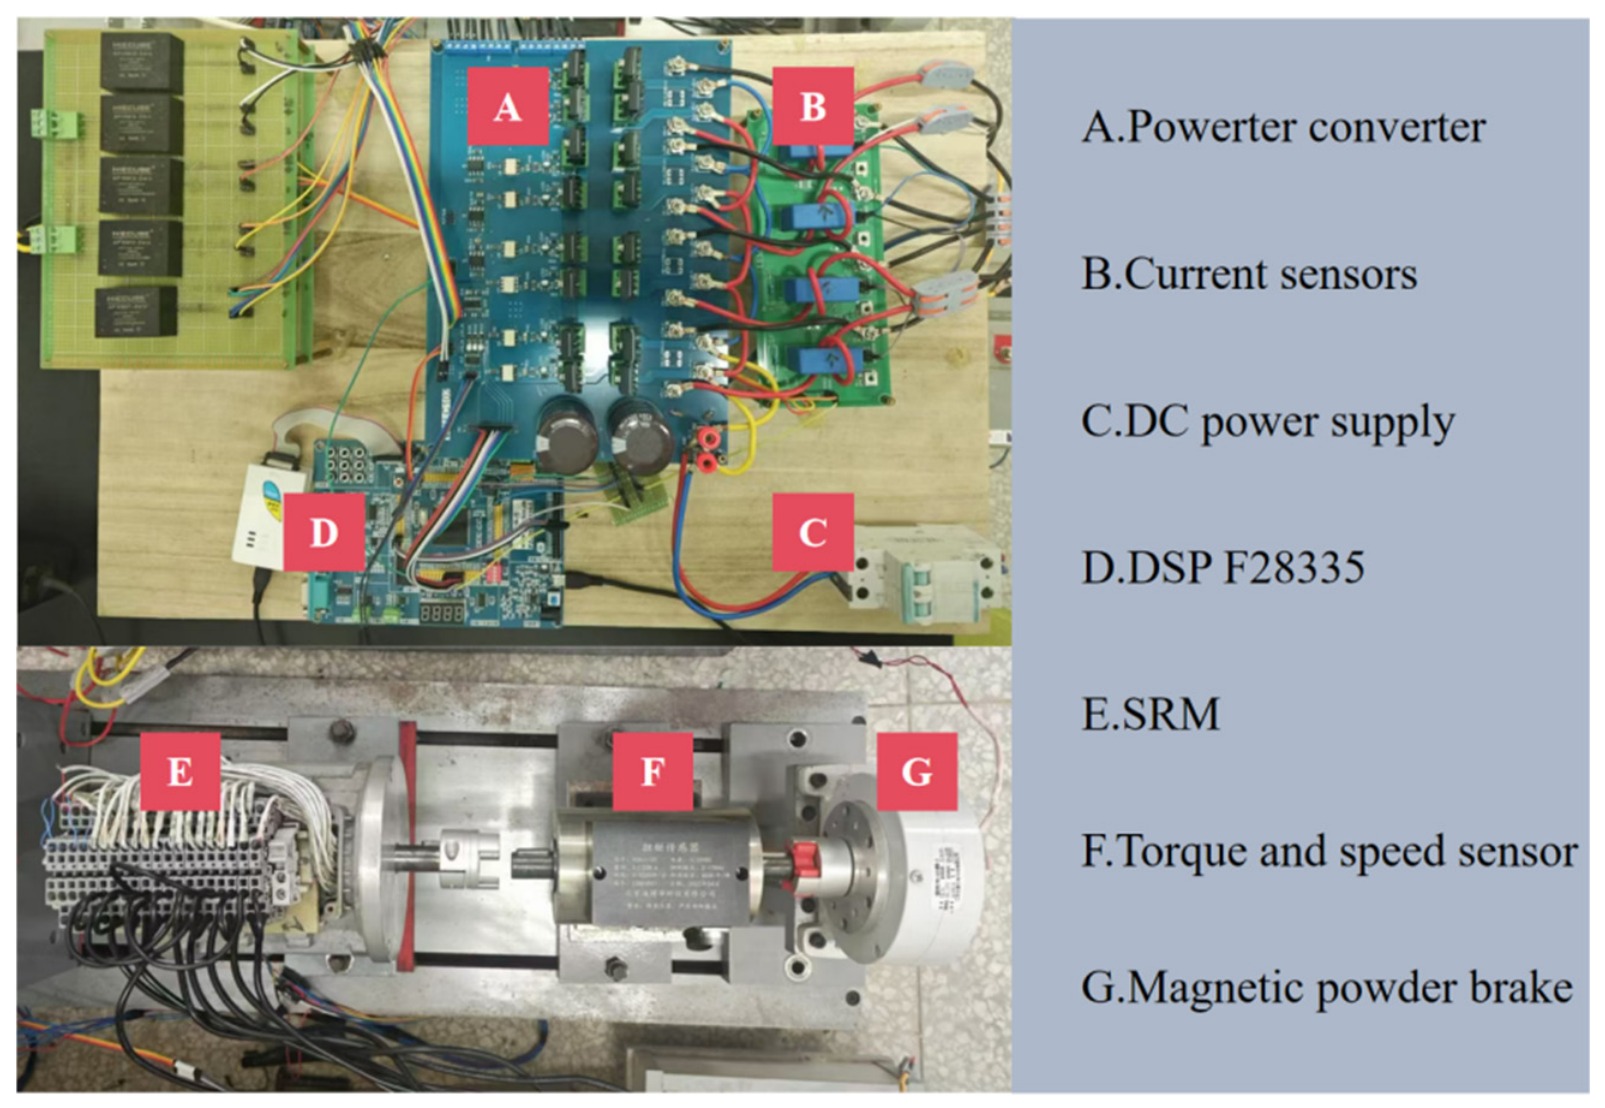
To validate the temperature-rise-based fault diagnosis method proposed in this paper, experiments were conducted on a four-phase 8/6 SRM prototype. The physical experimental setup is shown in Figure 17, and the key experimental parameters of the SRM are summarized in Table 5.
Figure 17.
Experimental platform.
Table 5.
Experimental parameters.
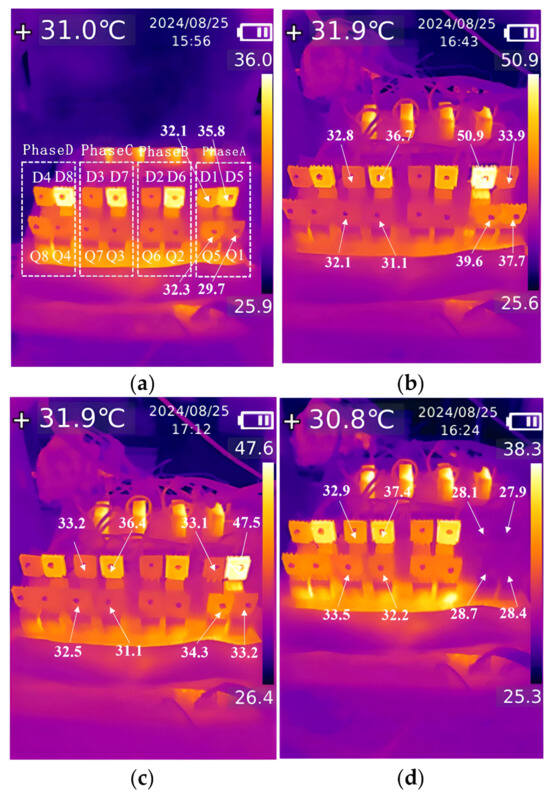
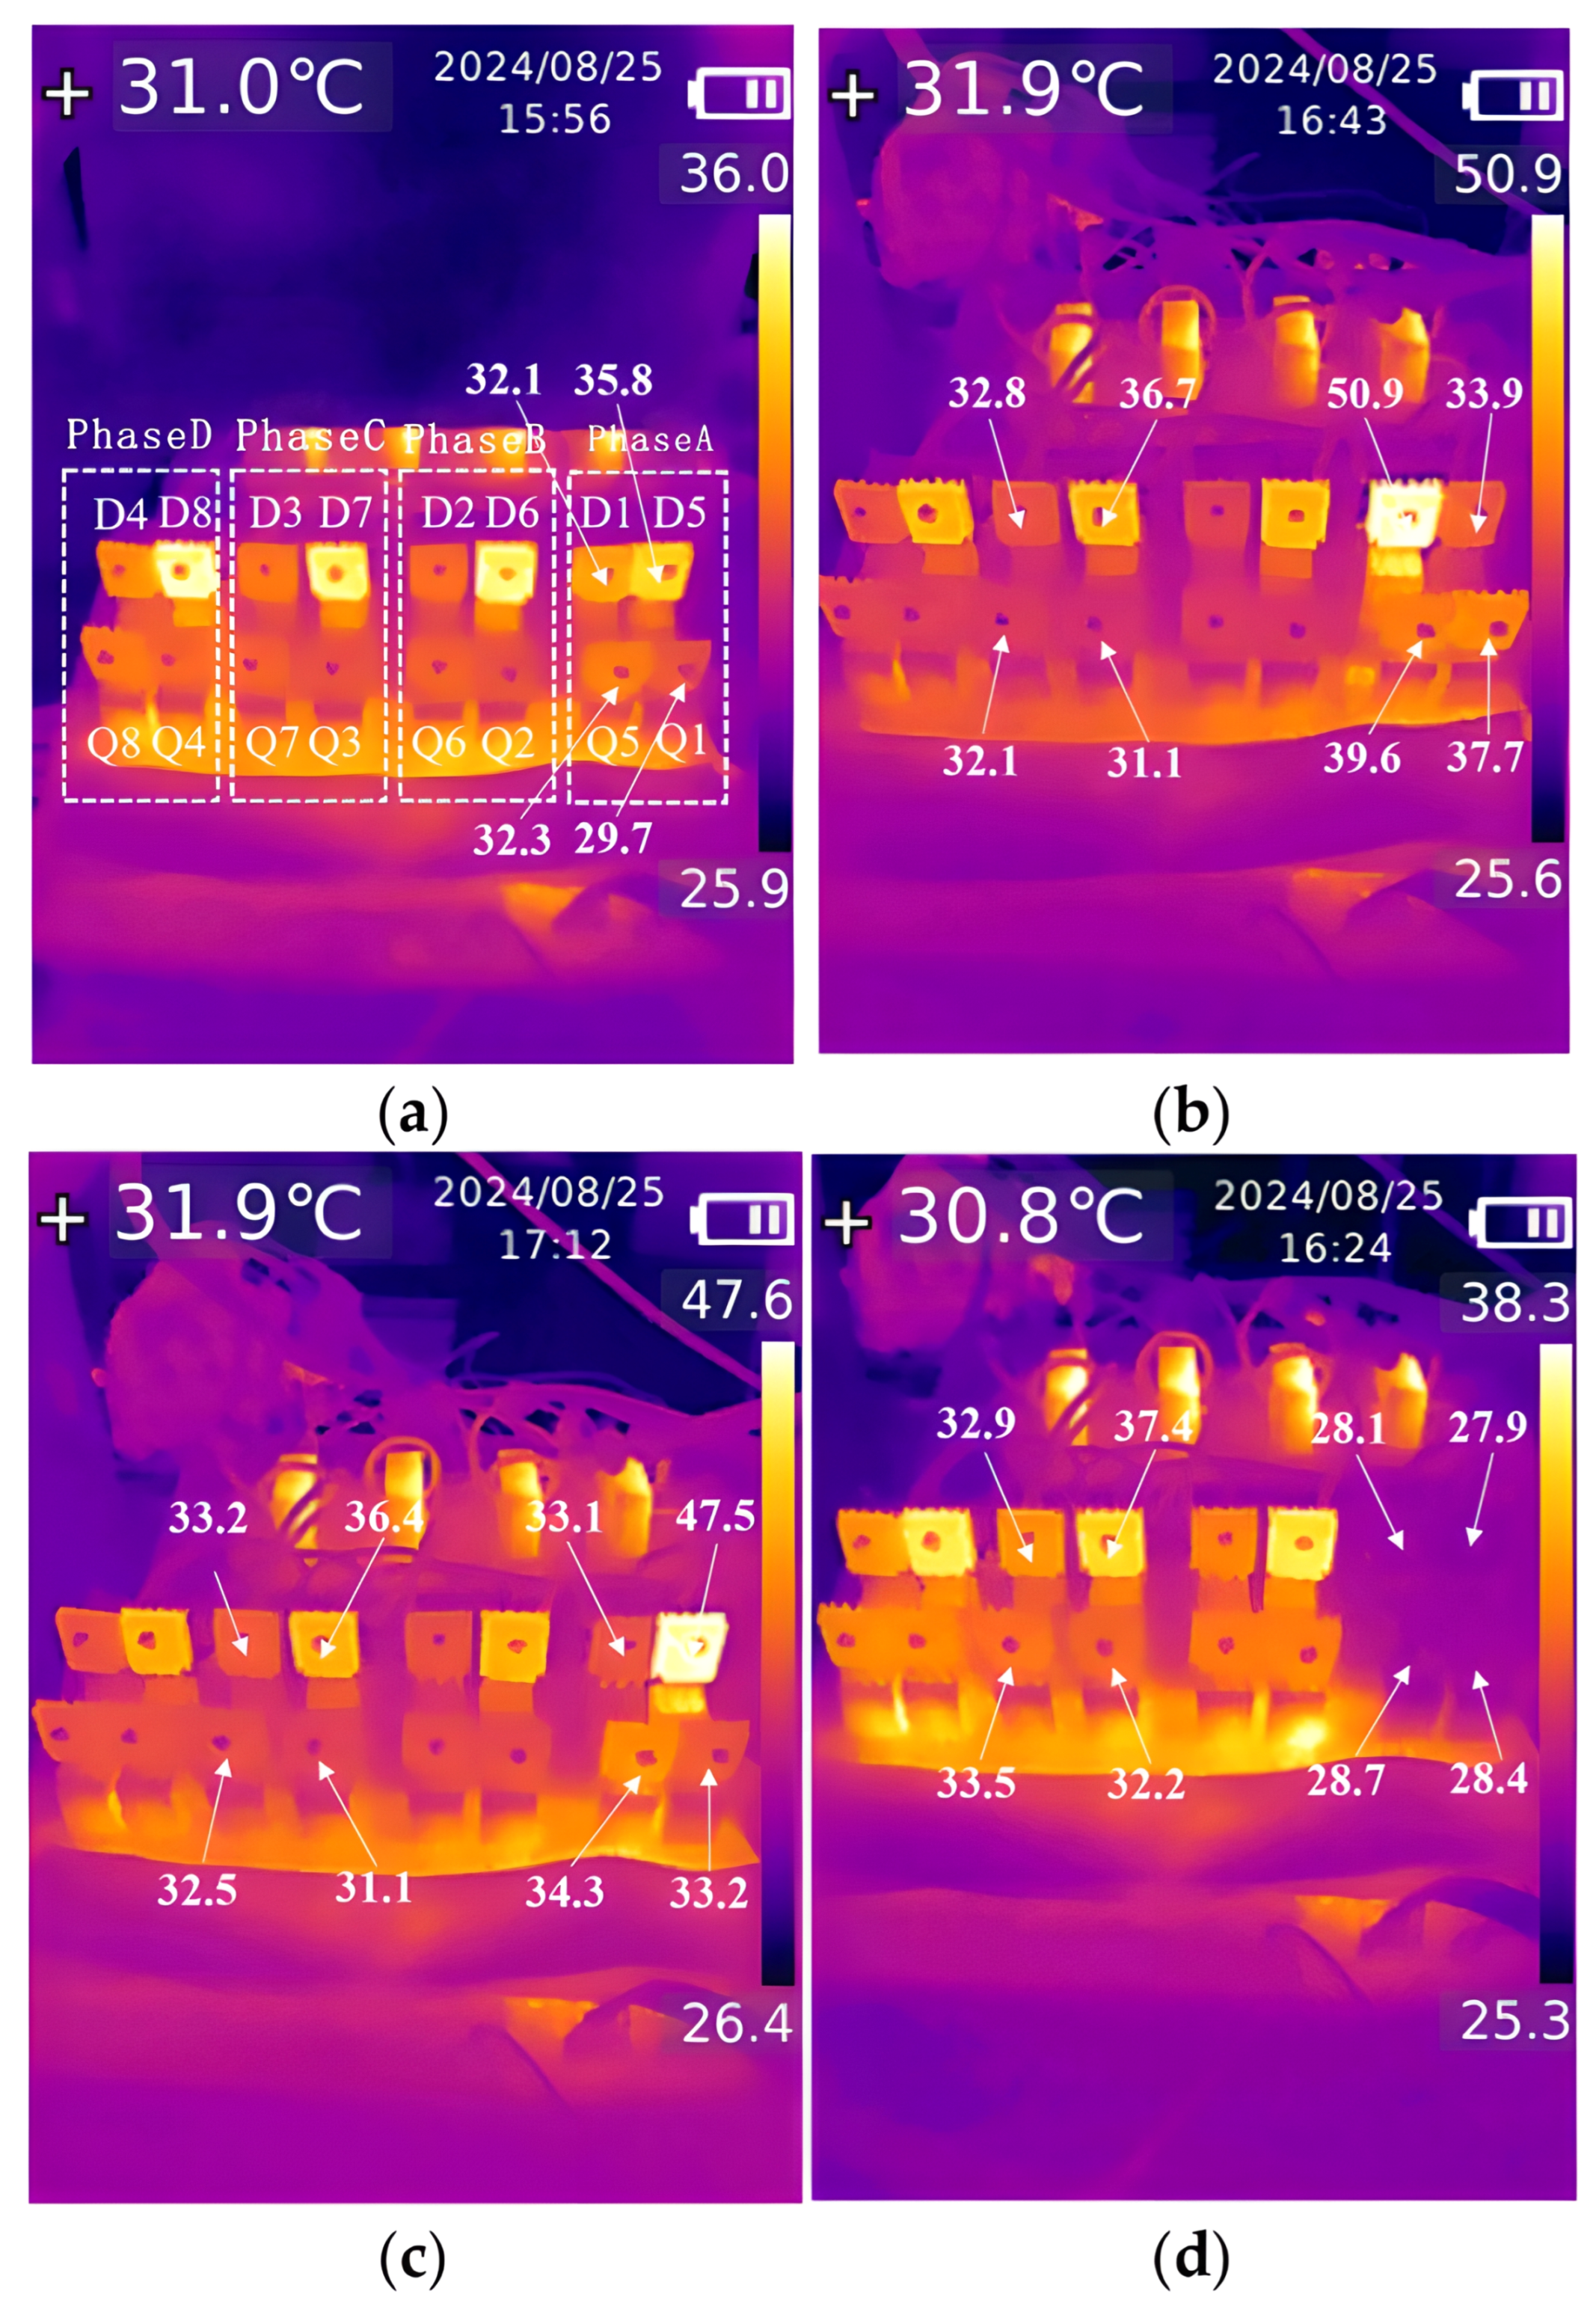
Four typical operating conditions were simulated: normal operation, a chopper short-circuit fault, a position transistor short-circuit fault, and a chopper open-circuit fault. All fault simulations were performed under the same operating conditions: an ambient temperature of 27 °C, a rotor speed of 800 r/min, and no load torque. The resulting temperature distributions of the power converter are presented in Figure 18.
Figure 18.
Infrared temperatures of the asymmetric half-bridge converter. (a) Normal state. (b) Chopper short-circuit fault. (c) Position transistor short-circuit fault. (d) Chopper open-circuit fault.
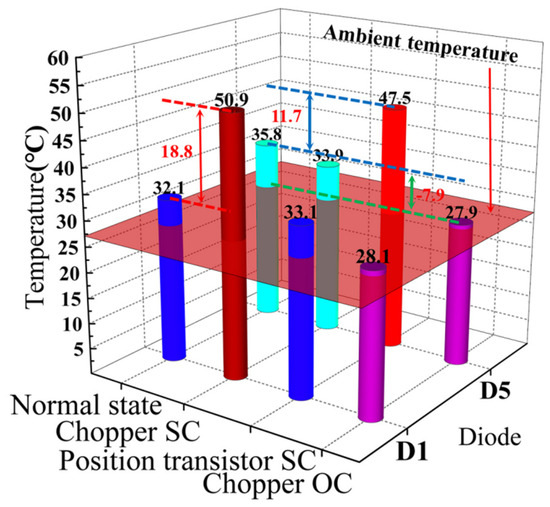
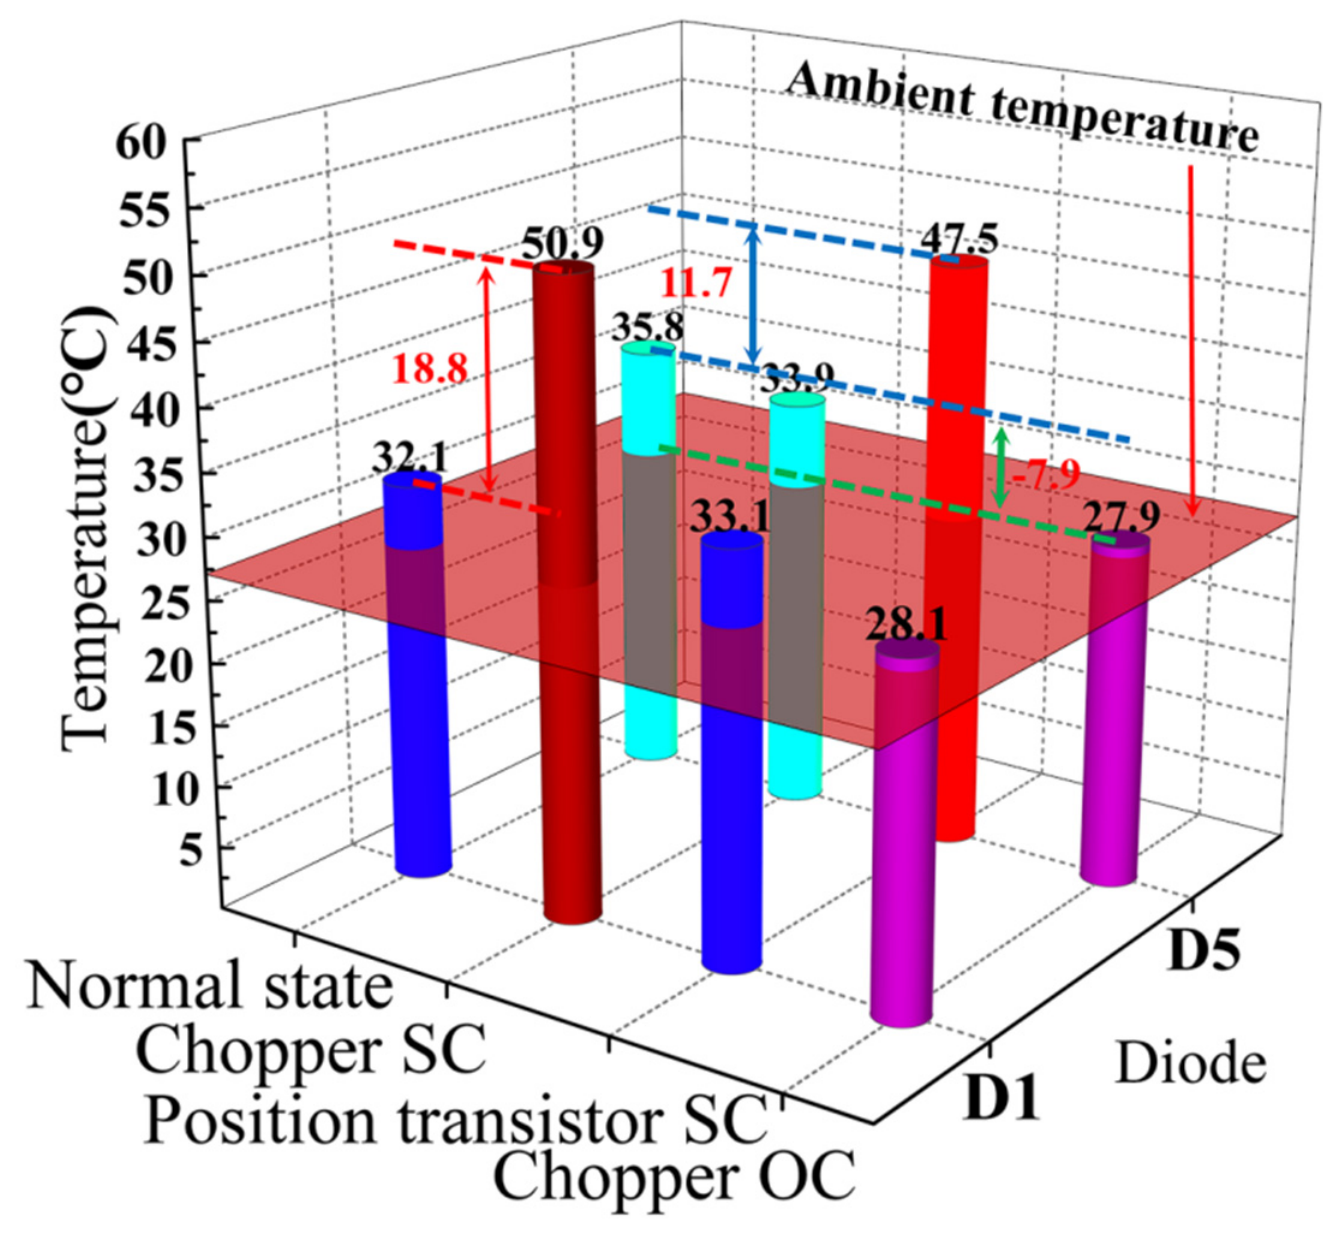
As shown in Figure 18a,b, when a short-circuit fault occurs in the phase-A chopper, the temperature rise of the UP freewheeling diode D1 is 23.9 °C, compared with only 5.1 °C under normal operating conditions. The corresponding temperature change ΔT1 as the device transitions from the normal to the faulty state is 18.8 °C. According to the fault temperature threshold table, the threshold for the UP freewheeling diode is 13.77 °C. A short-circuit fault in the phase-A chopper transistor Q1 can therefore be identified. Similarly, as shown in Figure 18c, when a short-circuit fault occurs in the phase-A position transistor, the temperature rise of the phase-A DOWN freewheeling diode D5 is 20.5 °C, compared with 8.8 °C under normal operating conditions. The resulting temperature change ΔT2 is 11.7 °C, which exceeds the DOWN freewheeling diode fault temperature threshold of 8.69 °C and indicates a short-circuit fault in the phase-A position transistor Q5. As shown in Figure 18d, when an open-circuit fault occurs in the phase-A chopper, the temperature rise of the phase-A DOWN freewheeling diode D5 is only 0.9 °C, substantially lower than the normal-operating temperature rise of 8.8 °C. The temperature change ΔT3 is −7.9 °C, which is below the open-circuit fault temperature threshold of −6.16 °C; consequently, an open-circuit fault has occurred in the phase-A. Because the measured temperature feature does not uniquely distinguish the two transistor positions within the phase, the method does not identify which specific component causes the open-circuit fault.
Figure 19 presents the diode temperature-rise data under different fault conditions. The temperature rises of the diodes in the faulty phase vary substantially, confirming the feasibility of the proposed power converter fault diagnosis method based on diode temperature rise.
Figure 19.
Comparison of temperature rise of upper freewheeling diode D1 and lower freewheeling diode D5 under normal operation and three transistor fault conditions. Each color bar corresponds to one operating state: blue bars—normal state; red bars—chopper transistor short-circuit fault; cyan bars—position transistor short-circuit fault; magenta bars—chopper transistor open-circuit fault.
To further validate the accuracy of the diagnostic approach, the temperature rises of the phase-A devices were measured at different ambient temperatures, rotor speeds, and load torques. The experimental results are summarized in Table 6. Because a short-circuit fault in a power transistor causes extremely high phase currents, the experiments were limited to a load torque not exceeding 0.1 N·m and a rotor speed below 1000 r/min. To distinguish the thermal behavior of the upper and lower freewheeling diodes in phase-A, they are labeled “UP” and “DOWN”, respectively.
Table 6.
Experimental results under different influencing factors.
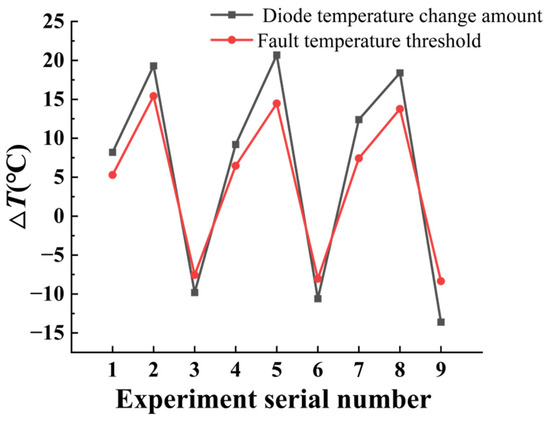
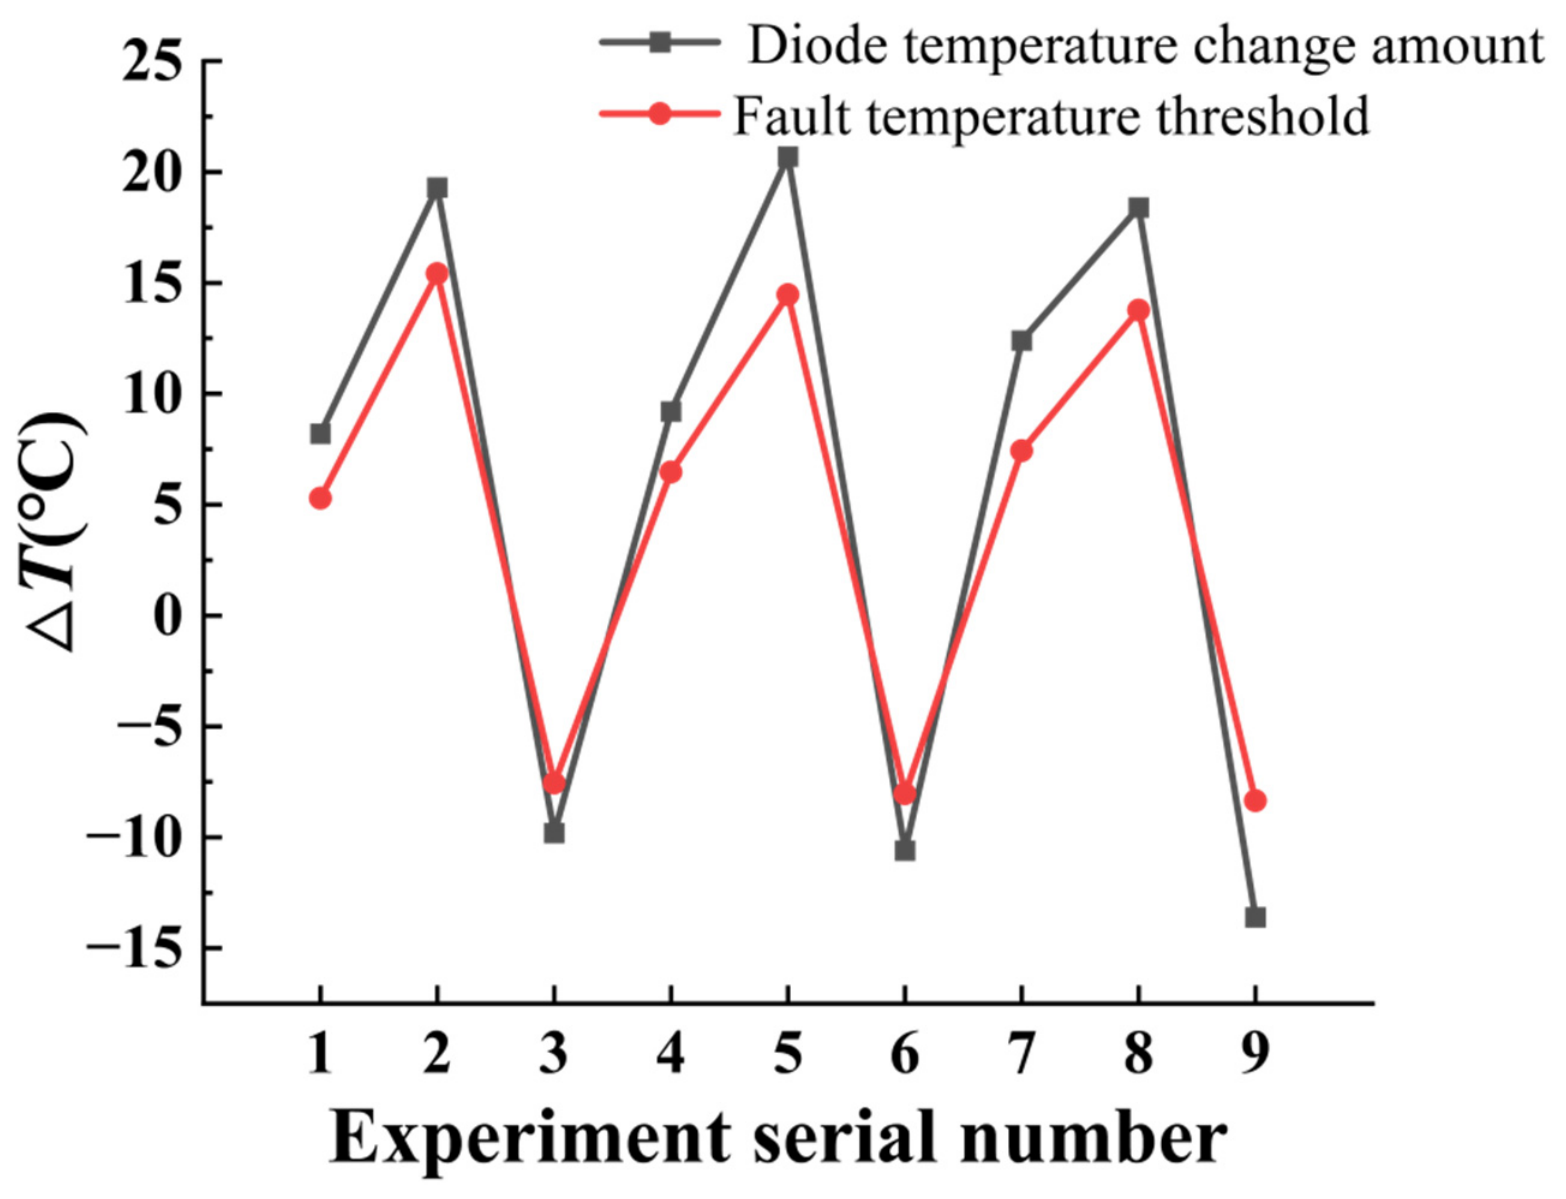
Figure 20 compares the experimentally measured diode temperature changes with the fault temperature thresholds predicted by the BPNN. To quantify the diagnostic margin, the absolute measured temperature variations and the corresponding predicted thresholds were compared across all nine experimental cases. The average absolute temperature variation was 13.58 °C, and the average absolute threshold was 9.64 °C. The predicted thresholds therefore represented approximately 70.4% of the measured temperature variations, with a range of 59.9–79.8%.
Figure 20.
Comparison of the predicted thresholds with the experimental results.
The mean diagnostic margin was 3.94 °C, and the individual margins ranged from 2.24 °C to 6.24 °C. For position-transistor short-circuit faults, the average measured temperature change was 9.93 °C, while the average threshold was 6.40 °C, yielding a mean margin of 3.54 °C. For chopper transistor short-circuit faults, the corresponding values were 19.47 °C and 14.55 °C, respectively, producing an average margin of 4.92 °C. For chopper transistor open-circuit faults, the mean absolute temperature variation was 11.33 °C, while the average absolute threshold was 7.98 °C, resulting in a mean decision margin of 3.35 °C.
All nine experimentally tested fault cases satisfied the corresponding threshold criteria, yielding a 100% success rate for both fault detection and fault-type classification within the investigated experimental set. These results demonstrate that, under the tested operating conditions, the BPNN thresholds provide sufficient separation between the measured fault-induced temperature variations and the decision boundaries.
6. Conclusions
This paper investigated single-phase short-circuit and open-circuit faults in the power transistors of an asymmetric half-bridge power converter used in switched reluctance motors (SRMs), with emphasis on their effects on system operating states and converter temperature-rise characteristics. A temperature-field-based fault diagnosis method was proposed for the SRM power converter. The method uses a backpropagation neural network (BPNN) to predict fault temperature thresholds under varying operating conditions. By comparing real-time power-diode temperature variations with these thresholds, the method can locate short-circuit faults in chopper transistors and position transistors and identify the faulty phase for open-circuit faults. However, the method cannot further distinguish whether an open-circuit fault originates in the chopper transistor or the position transistor. The experimental results show that, after a fault occurs, the strategy can accurately and rapidly diagnose the fault type and determine its location. The main contributions are as follows:
(1) The proposed method does not require the devices to reach thermal steady state, enabling fault diagnosis at an early stage and thereby significantly improving diagnostic efficiency.
(2) During actual motor operation, sudden load changes or rotor speed fluctuations can cause substantial variations in phase current. In contrast to these rapidly varying current signals, diode temperature changes more gradually. Because the corresponding fault temperature thresholds can be updated adaptively as the load and rotor speed change, the proposed diagnostic approach demonstrates robustness and reliability.
(3) Conventional current-based fault diagnosis methods for power converters are susceptible to high-frequency noise and severe current fluctuations, which may reduce diagnostic accuracy or cause misdiagnosis. The proposed method avoids complex analysis of pre-fault and post-fault current signals and requires no additional current or voltage sensors, thereby reducing detection costs.
Despite the promising results, the proposed method has several limitations. First, the present study addresses only single-phase faults; diagnostic performance under simultaneous multi-phase fault conditions has not been examined and requires further investigation. Furthermore, for transistor open-circuit faults, the proposed method can identify only the faulty phase and cannot determine whether the fault occurs in the chopper transistor or the position transistor. Second, the fault types considered are limited to open-circuit and short-circuit faults in power transistors; power diode faults are outside the scope of this work. Third, the BPNN threshold prediction models were trained within a specific operating envelope (rotor speed: 400–1000 r/min; load torque: 0–0.1 N·m; ambient temperature: 18–27 °C), and extrapolation beyond this range may reduce prediction accuracy. Fourth, because of the constraints of the experimental setup, only nine groups of test samples were collected, precluding a comprehensive statistical evaluation of diagnostic performance. Additional samples will be collected in future work to enable quantitative analysis of the algorithm’s effectiveness. Fifth, the proposed method requires temperature sensors attached to the power diodes, which introduces additional hardware costs and installation constraints in space-limited applications. Future research will extend the method to broader operating conditions, multiple simultaneous faults, and diode fault scenarios and will include sufficient experimental validation for robust statistical analysis.
Author Contributions
Conceptualization, X.W., Z.Z. and Q.W.; methodology, X.W. and Z.Z.; software, X.W. and Z.Z.; validation, X.W., Z.Z., Q.W. and Y.D.; formal analysis, Z.Z., X.W. and Q.W.; investigation, Z.Z. and X.W.; resources, Q.W. and Y.D.; data curation, Z.Z. and X.W.; writing—original draft preparation, X.W. and Q.W.; writing—review and editing, X.W. and Z.Z.; visualization, Z.Z. and X.W.; supervision, Y.D. (Corresponding Author); project administration, Q.W. and Y.D.; funding acquisition, Q.W. All authors have read and agreed to the published version of the manuscript.
Funding
This work was supported in part by the Natural Science Foundation of Jiangxi Province under Grant 20252BAC240680.
Institutional Review Board Statement
Not applicable.
Informed Consent Statement
Not applicable.
Data Availability Statement
The data that support the findings of this study are available from the corresponding author upon reasonable request.
Conflicts of Interest
The authors declare that they have no actual or potential conflicts of interest. Mr. Zhijie Zhang’s affiliation with State Grid Jiangxi Yingtan Power Supply Company is provided for identification purposes only. The company was not involved in this research and did not provide research funding, technical support, materials, or other resources for the study.
References
- Ehsani, M.; Singh, K.V.; Bansal, H.O.; Mehrjardi, R.T. State of the Art and Trends in Electric and Hybrid Electric Vehicles. Proc. IEEE 2021, 109, 967–984. [Google Scholar] [CrossRef] [Scilit]
- Bilgin, B.; Howey, B.; Callegaro, A.D.; Liang, J.; Kordic, M.; Taylor, J.; Emadi, A. Making the Case for Switched Reluctance Motors for Propulsion Applications. IEEE Trans. Veh. Technol. 2020, 69, 7172–7186. [Google Scholar] [CrossRef] [Scilit]
- Apostolidou, N.; Papanikolaou, N. Active Power Control of Switched Reluctance Generator in More Electric Aircraft. IEEE Trans. Veh. Technol. 2021, 70, 12604–12616. [Google Scholar] [CrossRef] [Scilit]
- Murty, V.S.; Jain, S.; Ojha, A. Linear switched reluctance motor for traction propulsion system using configuration of electric locomotive. Mechatronics 2023, 89, 102916. [Google Scholar] [CrossRef] [Scilit]
- Feng, L.; Sun, X.; Bramerdorfer, G.; Zhu, Z.; Cai, Y.; Diao, K.; Chen, L. A review on control techniques of switched reluctance motors for performance improvement. Renew. Sustain. Energy Rev. 2024, 199, 114454. [Google Scholar] [CrossRef] [Scilit]
- Sun, X.; Zhu, Y.; Cai, Y.; Yao, M.; Sun, Y.; Lei, G. Optimized-Sector-Based Model Predictive Torque Control with Sliding Mode Controller for Switched Reluctance Motor. IEEE Trans. Energy Convers. 2024, 39, 379–388. [Google Scholar] [CrossRef] [Scilit]
- Gaafar, M.A.; Abdelmaksoud, A.; Orabi, M.; Chen, H.; Dardeer, M. Switched Reluctance Motor Converters for Electric Vehicles Applications: Comparative Review. IEEE Trans. Transp. Electrif. 2023, 9, 3526–3544. [Google Scholar] [CrossRef] [Scilit]
- Li, S.; Zhang, S.; Habetler, T.G.; Harley, R.G. Modeling, Design Optimization, and Applications of Switched Reluctance Machines—A Review. IEEE Trans. Ind. Appl. 2019, 55, 2660–2681. [Google Scholar] [CrossRef] [Scilit]
- Xu, S.; Chen, H.; Yang, J.; Dong, F. Performance Evaluation and Reliability Enhancement of Switched Reluctance Drive System by a Novel Integrated Power Converter. IEEE Trans. Power Electron. 2019, 34, 11090–11102. [Google Scholar] [CrossRef] [Scilit]
- Ali, N.; Wang, Q.; Gao, Q.; Ma, K. Diagnosis of Multicomponent Faults in SRM Drives Based on Auxiliary Current Reconstruction Under Soft-Switching Operation. IEEE Trans. Ind. Electron. 2024, 71, 2265–2276. [Google Scholar] [CrossRef] [Scilit]
- Sun, X.; Wen, Y.; Han, S.; Lei, G. Fault Diagnosis of Power Converter for Switched Reluctance Motors Based on Current Reconstruction Scheme. IEEE Trans. Transp. Electrif. 2025, 11, 4169–4178. [Google Scholar] [CrossRef] [Scilit]
- Fang, C.; Chen, H.; Torkaman, H.; Anuchin, A.; Li, X. Fault Diagnosis for Power Transistors in a Converter of Switched Reluctance Motors Based on Current Features. IEEE Sens. J. 2022, 22, 1414–1423. [Google Scholar] [CrossRef] [Scilit]
- Guan, M.; Liu, C.; Liu, P.; Sun, X. Fault Diagnosis Scheme for Open-Circuit Fault in N+2 Converter of Six-Phase SRM Using Midpoint Current Spectrum Analysis. IEEE Access 2022, 10, 105983–105992. [Google Scholar] [CrossRef] [Scilit]
- Marques, J.F.; Estima, J.O.; Gameiro, N.S.; Cardoso, A.J.M. A New Diagnostic Technique for Real-Time Diagnosis of Power Converter Faults in Switched Reluctance Motor Drives. IEEE Trans. Ind. Appl. 2014, 50, 1854–1860. [Google Scholar] [CrossRef] [Scilit]
- Ro, H.S.; Kim, D.H.; Jeong, H.G.; Lee, K.B. Tolerant Control for Power Transistor Faults in Switched Reluctance Motor Drives. IEEE Trans. Ind. Appl. 2015, 51, 3187–3197. [Google Scholar] [CrossRef] [Scilit]
- Niu, H.; Lorenz, R.D. Sensing Power MOSFET Junction Temperature Using Gate Drive Turn-On Current Transient Properties. IEEE Trans. Ind. Appl. 2016, 52, 1677–1687. [Google Scholar] [CrossRef] [Scilit]
- Chen, H.; Yang, J.; Xu, S. Electrothermal-Based Junction Temperature Estimation Model for Converter of Switched Reluctance Motor Drive System. IEEE Trans. Ind. Electron. 2020, 67, 874–883. [Google Scholar] [CrossRef] [Scilit]
- Zhang, Q.; Zhang, P. An Online Junction Temperature Monitoring Method for SiC MOSFETs Based on a Novel Gate Conduction Model. IEEE Trans. Power Electron. 2021, 36, 11087–11096. [Google Scholar] [CrossRef] [Scilit]
- Wen, H.; Li, X.; Zhang, F.; Qu, Z.; Jiang, Y.; Luo, N.; Wang, G.; Wang, X.; Liu, W.; Cui, M.; et al. Junction Temperature Extraction for Silicon Carbide Power Devices: A Comprehensive Review. IEEE Trans. Power Electron. 2025, 40, 3090–3111. [Google Scholar] [CrossRef] [Scilit]
- Chen, H.; Xu, S.; Cui, S. Reliability Evaluation for Power Converter of SRM on Fault-Tolerance Capability and Thermal Stress. IEEE Trans. Ind. Electron. 2021, 68, 1749–1758. [Google Scholar] [CrossRef] [Scilit]
- Yan, P.; Shang, S.; Zhang, C.; Yin, N.; Zhang, X.; Yang, G.; Zhang, Z.; Sun, Q. Research on the Processing of Coal Mine Water Source Data by Optimizing BP Neural Network Algorithm With Sparrow Search Algorithm. IEEE Access 2021, 9, 108718–108730. [Google Scholar] [CrossRef] [Scilit]
- Sheng, Z.; Wang, D.; Fu, J.; Hu, J. A Computationally Efficient Spatial Online Temperature Prediction Method for PM Machines. IEEE Trans. Ind. Electron. 2022, 69, 10904–10914. [Google Scholar] [CrossRef] [Scilit]
- Wang, C.; Wang, A. Torque Characteristic Modeling of Switched Reluctance Motor Based on BP Neural Network Optimized by Improved Sparrow Search Algorithm. In Proceedings of the 2022 IEEE International Conference on Power Systems and Electrical Technology (PSET), 13–15 October 2022; IEEE: New York, NY, USA, 2022; pp. 41–45. [Google Scholar]
- Zhang, M.W.; Li, W.L.; Tang, H.Y. Demagnetization Fault Diagnosis of the Permanent Magnet Motor for Electric Vehicles Based on Temperature Characteristic Quantity. IEEE Trans. Transp. Electrif. 2023, 9, 759–770. [Google Scholar] [CrossRef] [Scilit]
- Hey, J.; Malloy, A.C.; Martinez-Botas, R.; Lampérth, M. Online Monitoring of Electromagnetic Losses in an Electric Motor Indirectly Through Temperature Measurement. IEEE Trans. Energy Convers. 2016, 31, 1347–1355. [Google Scholar] [CrossRef] [Scilit]



Disclaimer/Publisher’s Note: The statements, opinions and data contained in all publications are solely those of the individual author(s) and contributor(s) and not of MDPI and/or the editor(s). MDPI and/or the editor(s) disclaim responsibility for any injury to people or property resulting from any ideas, methods, instructions or products referred to in the content. |
© 2026 by the authors. Licensee MDPI, Basel, Switzerland. This article is an open access article distributed under the terms and conditions of the Creative Commons Attribution (CC BY) license.