


Abstract
Variable-speed operation of scroll compressors is a prevailing trend for energy saving in refrigeration systems; however, complex electromagnetic excitation induces prominent vibration and noise, yet its dominant timing, spatial distribution, and action mechanism remain unclear. An electromagnetic–structural–acoustic sequential coupling model of a scroll compressor is established and validated at three speeds (3600–6600 rpm), and a dominance identification method integrating harmonic–modal matching, variational mode decomposition, and electromagnetic correlation identification is proposed. Predicted frequencies agree well with experiments; even-order harmonics migrate linearly with speed, with harmonic–modal matching exceeding 80% at low and medium speeds. At 5400 rpm, the 24th-order harmonic (2160 Hz) coincides with mode 2 (2162 Hz), causing resonance and a threefold amplitude increase. At low and medium speeds, vibration dominance indices range between 0.68 and 0.75, while noise dominance indices decrease from 0.55 to 0.48, dropping to 0.35 and 0.28 at 6600 rpm, indicating noise source transition. Vibration at S1 through S4 shows spatial variation, and far-field noise at F1 through F4 is non-uniform. These findings clarify how electromagnetic excitation dominates the vibration and noise of scroll compressors, providing a theoretical basis for speed-segmented and zone-specific noise source identification and control.
1. Introduction
Scroll compressors, a class of positive displacement compressors known for their energy efficiency, structural simplicity, and favorable safety profile, have been increasingly adopted in air conditioning and medical refrigeration systems in recent years. However, with the widespread adoption of variable-frequency technology, variable-speed operation has become the mainstream approach for energy saving in refrigeration systems, yet whole-machine vibration and noise radiation problems induced by complex electromagnetic excitation under variable-speed conditions are becoming increasingly prominent. The noise produced by scroll compressors can be broadly classified into mechanical noise, aerodynamic noise, and electromagnetic noise. Among these, electromagnetic noise is primarily caused by the magnetic flux waves and electromagnetic imbalance generated by the built-in motor. To date, researchers worldwide have conducted extensive studies on the electromagnetic and vibration characteristics of electric motor bodies. However, investigations that couple electromagnetic excitation with the structural response of a complete scroll compressor remain relatively scarce, and the extent to which electromagnetic noise dominates and its spatial distribution characteristics under variable-speed conditions are still unclear.
As recently reviewed by Soresini et al. [1], the noise and vibration of permanent magnet synchronous motors (PMSMs) have been extensively investigated, spanning electromagnetic force computation, structural dynamic modeling, and acoustic radiation prediction. The electromagnetic forces are generated by the permanent magnet field, the armature reaction field, and their interaction with the stator slots; the temporal and spatial orders of the radial electromagnetic force harmonics are closely related to the pole–slot combination [2,3]. Using finite element analysis and the Maxwell stress tensor method, the electromagnetic force density can be quantified, revealing that low-order spatial harmonics are prone to induce significant vibration [4]. In parallel, reduced-order analytical multiphysics methodologies, which further incorporate tooth modulation and tangential excitation effects typically neglected in conventional analytical models, have been developed for fast vibroacoustic prediction at the predesign stage [5]. Yao et al. [6] employed a rapid prediction method to analyze the electromagnetic force harmonics of a 9-slot/6-pole PMSM, demonstrated that harmonics at even multiples of the electrical frequency dominate the vibration, and successfully mitigated the vibration amplitude without compromising torque or efficiency. Hong et al. [7] investigated the combined effects of tangential and radial forces in PMSMs, proposed that tangential forces can influence radial vibration via the force translation principle, and verified that tangential forces attenuate vibration at certain frequencies. Furthermore, for ultra-high-speed switched reluctance motors [8] and drum washing machine motors [9], acoustic models can be constructed to identify the electromagnetic force harmonic components and predict the resulting vibration and noise. Moreover, for motor vibration suppression, inverter-driven operation introduces current harmonics that affect the electromagnetic force characteristics [10]; in particular, space vector pulse width modulation-based voltage-source inverters generate sideband harmonic currents near the carrier frequency and its multiples, which induce additional electromagnetic force waves and deteriorate the vibration and noise performance [11]. Strategies include active vibration cancellation through online harmonic current injection to adjust the harmonic amplitude and phase [12], and reduction in electromagnetic force harmonics by optimizing the pole-arc coefficient, stator tooth shape, or adopting dual three-phase windings [13], as well as introducing auxiliary grooves to weaken the main excitation forces in fractional-slot concentrated-winding machines [14]. Research on an ultra-high-speed bearing-less PMSM [15] has shown that the suspension windings have a relatively minor influence on electromagnetic noise, whereas rotor eccentricity introduces sideband harmonics. These studies have laid a theoretical foundation for the characterization and suppression of electromagnetic excitation in motors. However, they have predominantly focused on the vibration response of the motor body under free-state or standard boundary conditions, and the analytical approaches rely on equivalent simplified stator structures, without addressing the modulation effect of coupled structures, such as the motor and the housing, within a complete scroll compressor on the transmission of electromagnetic excitation.
In terms of research on overall compressor noise, existing work has primarily focused on aerodynamic and mechanical noise sources. The noise of centrifugal compressors is primarily generated by airflow pulsation and blade rotation effects, becoming particularly pronounced at the blade-passing frequency [16]. In scroll compressors, by contrast, the noise is associated with the scroll dynamics, gas forces, and valve plate motion. Song et al. [17] used signal demodulation to analyze the modulation characteristics under a condenser blockage fault and found that the vibration signals intensified at the shaft frequency and slot harmonics; Wang et al. [18] employed a multibody dynamics model to reveal the effect of gas forces on the housing vibration. For electric scroll compressors, Kim and Ha [19] identified the major noise bands of 600–800 Hz, 4000–5000 Hz, and 10 kHz through hammer modal testing and noise measurements, demonstrating that the inverter carrier frequency, the discharge clearance, and the housing structure play important roles in different frequency bands of the radiated noise. The noise of screw compressors is predominantly aerodynamic, exhibiting a broad frequency band with peaks typically occurring in the low-to-medium frequency range [20,21]. The sound pressure level of the housing at different frequencies and the corresponding variation patterns have been analyzed through simulations and experimental measurements. In rotary vane compressors, the noise is governed by the combined effects of mechanical contact and airflow pulsation, and the radiated noise reaches its maximum near the discharge port [22]. Through experimental measurements and numerical simulations, these studies have identified the noise sources and spectral characteristics of various compressor types. For compressor vibration and noise control, structural improvements such as replacing reed valves with circular valves can reduce impact noise [23]; installing acoustic enclosures or sound barriers can effectively block noise transmission [24]. Multiphysics coupled simulations, such as acoustic–structure coupled models, can predict the housing-radiated noise [25], whereas active control techniques, such as current shaping, can effectively suppress compressor vibration [26]. In addition, recent advances in nonlinear vibration systems have revealed complex dynamic behaviors of electromechanical coupled structures, such as bifurcation and coexisting attractors in vibration-based energy systems [27], and nonlinear magneto-elastic coupling has been shown to significantly affect the natural frequencies of cylindrical shells in air-gap magnetic fields [28], suggesting that nonlinear effects may also play a role in the vibration responses of hermetic compressors under electromagnetic excitation. Shou et al. [29] investigated a variable-frequency-driven SPMSM for compressor applications and suppressed electromagnetic noise by coordinating the switching frequency with the structural natural frequencies; however, the analysis was confined to the standalone motor and did not extend to the coupled vibration of the complete scroll compressor across variable-speed operation. Overall, these studies have primarily treated electromagnetic excitation as a secondary factor, while lacking a systematic analysis of the modal matching relationships with the overall structure. In particular, experimental identification studies on compressors are incapable of forward prediction of electromagnetic excitation. Beyond this, existing research has mostly been conducted under rated or single operating conditions, failing to reveal the migration patterns of electromagnetic excitation frequencies and orders under variable-speed conditions. Blind source separation techniques have also been applied to decompose motor noise into electromagnetic, aerodynamic, and switching-frequency components with quantified variance contribution rates [30], yet such data-driven approaches rely on extensive measurements and offer no predictive capability at the design stage. Lastly, a unified method for quantitatively assessing the relative dominance of electromagnetic vibration is still absent. Therefore, the electromagnetic multi-field coupling vibration and noise characteristics of a scroll compressor under variable operating conditions remain a critical issue that has yet to be fully resolved.
To address the aforementioned research gaps, the main contributions of this paper are as follows:
1. A variable-speed electromagnetic multi-field coupling simulation model of a scroll compressor is established, enabling the transmission of electromagnetic excitation to the structural vibration and noise radiation of the complete machine, thereby overcoming the limitation of existing studies that focus predominantly on the motor body or a single rotational speed.
2. The matching law between the spatiotemporal orders of electromagnetic force waves and the structural modes of the scroll compressor is revealed, elucidating the physical mechanism by which electromagnetic harmonics amplify vibration through structural resonance at specific rotational speeds, as well as the spatial non-uniformity of the complete machine under electromagnetic excitation.
3. An identification method for electromagnetic frequency characteristics based on comparison between simulation predictions and experimental measurements is proposed, enabling quantitative estimation of the dominance of electromagnetic vibration under variable-speed conditions and offering a new approach for separating electromagnetic noise from other noise sources.
The remainder of this paper is organized as follows: Section 2 describes the theory of electromagnetic excitation and vibration transmission in a scroll compressor; Section 3 introduces the multi-field coupling simulation method and the experimental test scheme; Section 4 provides a comparative analysis of the vibration and noise results of the compressor under variable-speed conditions and verifies the effectiveness of the electromagnetic frequency identification and contribution trend method; and Section 5 concludes the paper.
2. Excitation and Vibration Transmission Mechanism in Scroll Compressors
2.1. Structure, Principle, and Motor Parameters of Scroll Compressor
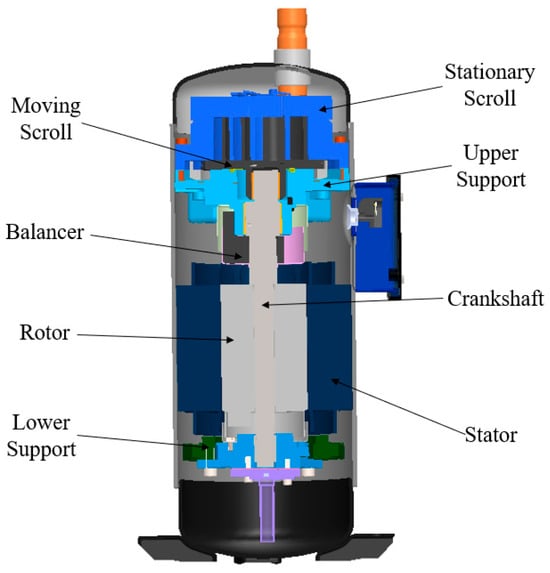
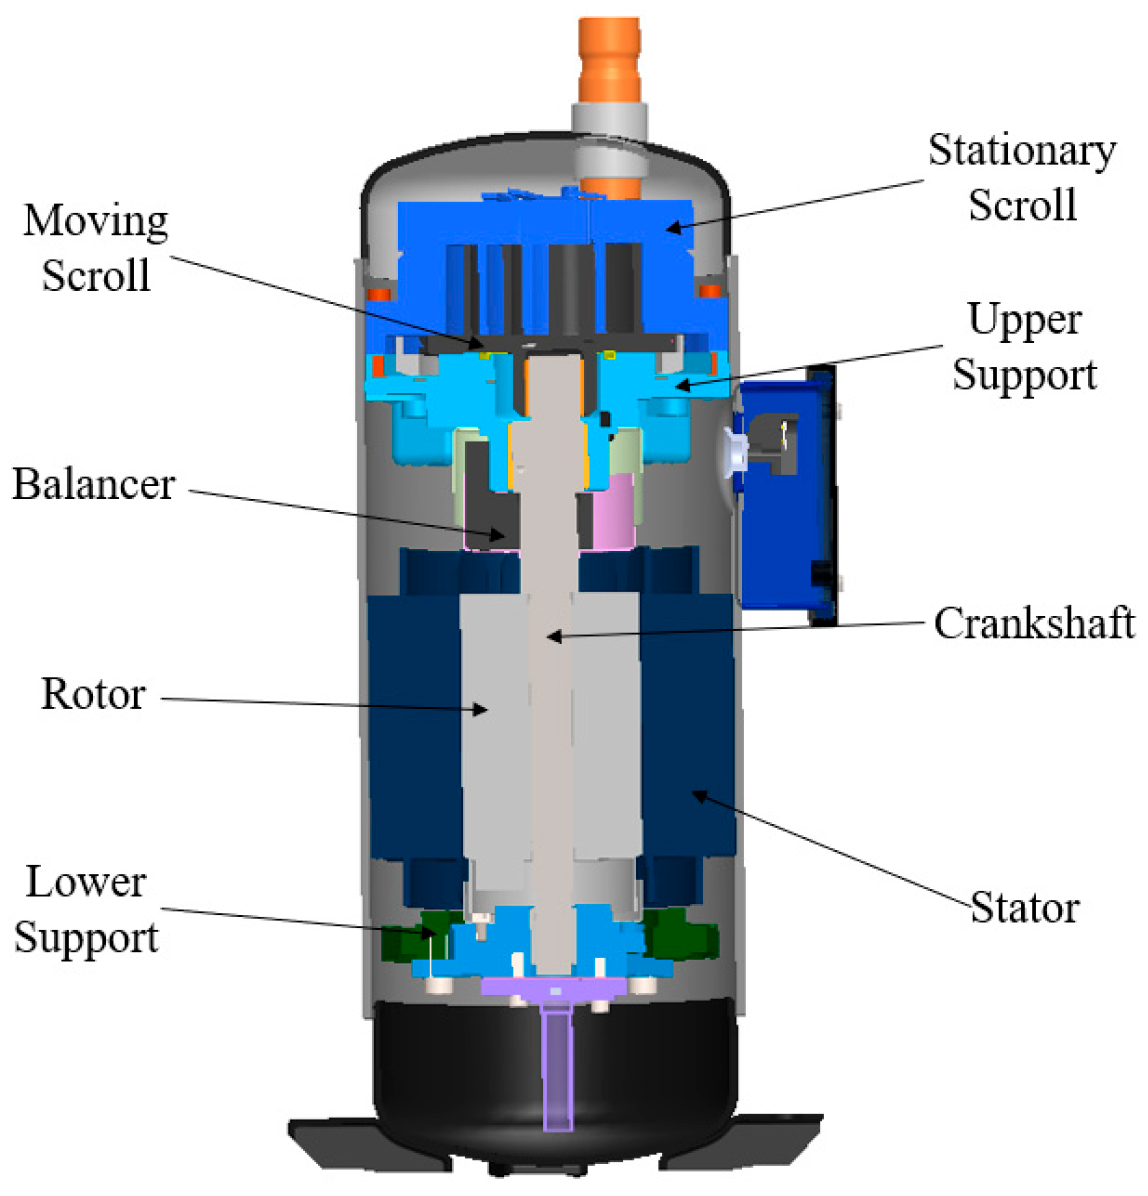
The scroll compressor is a third-generation, high-efficiency positive-displacement compressor that follows reciprocating, rotary, and screw compressors. It features few components, a simple and compact structure, small size, light weight, high efficiency, and high reliability. The geometric model of the scroll compressor under investigation is shown in Figure 1. Its main structure includes orbiting and fixed scrolls, upper and lower supports, a crankshaft, counterweights, a motor stator and rotor, and the compressor housing; all components are enclosed within the housing. The orbiting and fixed scrolls are eccentrically arranged and mesh with each other at a 180° phase offset in the upper part, forming the compression chambers. The motor, which consists of a stator, a rotor, and winding coils, is located in the middle-lower part. The upper end of the crankshaft is fitted with a bushing to drive the orbiting scroll, its middle-lower part is interference-fitted with the motor rotor, and its lower end rests on the lower support. The main motor parameters are summarized in Table 1.
Figure 1.
Structural diagram of the scroll compressor.
Table 1.
Main parameters of the interior permanent magnet motor.
The scroll compressor under investigation integrates an electric motor and a scroll compression mechanism. During operation, the motor rotor drives the crankshaft, which in turn drives the orbiting scroll to complete the suction, compression, and discharge cycle of the refrigerant. Meanwhile, the magnetic field interactions within the motor generate electromagnetic forces that are transmitted to the compressor housing through the stator core, thereby inducing structural vibration and sound radiation. The generation mechanism and transmission characteristics of these electromagnetic forces are elaborated in Section 2.2 and Section 2.3, respectively.
2.2. Mechanism and Frequency Characteristics of Electromagnetic Force
The permanent magnet synchronous motor, which serves as the core drive unit of the scroll compressor, generates electromagnetic vibration and noise during operation primarily due to the radial electromagnetic force acting on the stator core. According to electromagnetic field theory, the surface force density in a medium can be calculated using the Maxwell stress tensor. For the magnetic field in the air gap, the radial electromagnetic force density acting on the inner surface of the stator core is expressed as:
where is the vacuum permeability, is the radial component of the air-gap flux density, and is the tangential component.
The air-gap magnetic field of the motor is not an ideal sinusoidal wave; rather, it results from the superposition of the magnetic field generated by the rotor permanent magnets and the armature reaction field produced by the stator winding currents:
Due to factors such as structural variations in scroll compressor motors and the influence of drive control, and contain harmonic components with different spatial and temporal orders and frequencies. Substituting (2) into (1) yields:
The above equation reveals the three primary sources of the radial electromagnetic force wave: the force wave arising from the self-interaction of the permanent magnet field, the force wave arising from the self-interaction of the armature reaction field, and the force wave generated by the mutual modulation between the permanent magnet field and the armature reaction field.
Furthermore, the spatial order and frequency of the electromagnetic force wave are determined by the harmonic components of the interacting magnetic fields. The dominant spatial orders and frequencies of the resulting radial force wave are given by:
where is the number of pole pairs; is the harmonic order of the rotor magnetic field, and in addition to the fundamental component , a series of spatial harmonic components also exist; is the harmonic order of the stator magnetic field, which describes the spatial harmonic components in the armature reaction field, excluding the main field, after current is applied to the stator windings. is the radial electromagnetic force frequency; is the switching frequency; low-order force waves can readily cause global structural deformation, leading to significant noise radiation.
For the 9-slot/6-pole fractional-slot concentrated-winding motor investigated in this study, the pole–slot combination governs the spatial order distribution of the electromagnetic force wave. According to (4) and (5), the harmonic order of the permanent magnet field is (k = 0, 1, 2 …) and that of the armature reaction field is (m = 0, 1, 2 …). Therefore, the dominant spatial orders of the radial force wave, denoted by , are predominantly the 0th, 3rd, and 6th orders.
2.3. Transmission and Path of Vibration and Noise
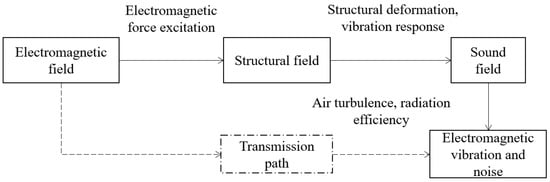
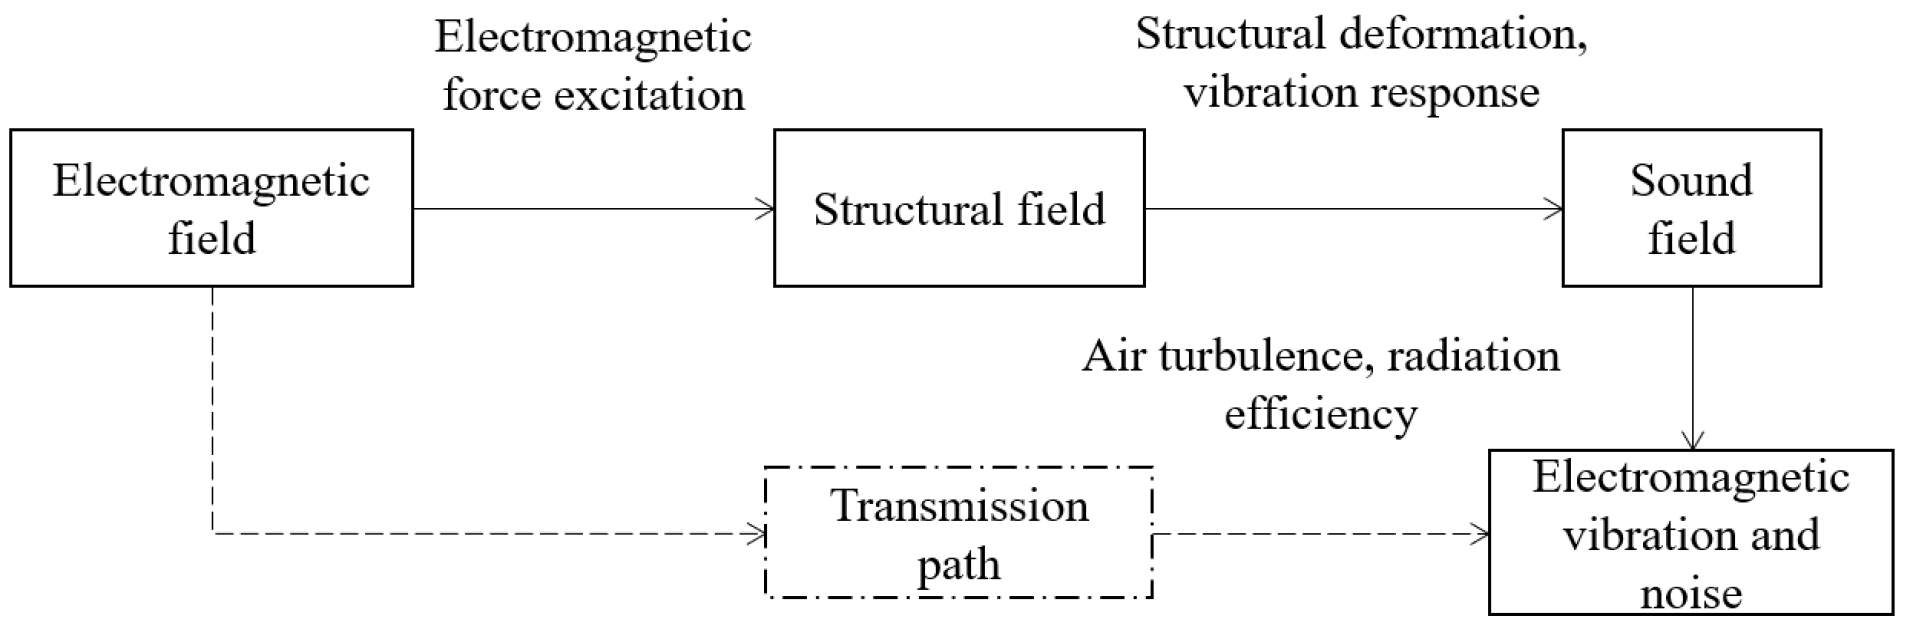
The electromagnetic forces in a scroll compressor act on the stator core, inducing structural vibrations that are transmitted to the entire unit via the housing and support frame, and are ultimately radiated as airborne noise. As illustrated in Figure 2, the transmission path is as follows: electromagnetic field, structural vibration, and acoustic radiation; more specifically, electromagnetic force fluctuations, stator deformation, housing vibration, and airborne sound pressure. In Figure 2, the solid lines denote the main field-coupling chain, while the dashed lines indicate the transmission-path contribution to the overall electromagnetic vibration and noise. The coupling between the structural natural frequencies and the electromagnetic force frequencies can induce resonance, thereby intensifying the vibration and noise levels.
Figure 2.
Flow diagram of electromagnetic vibration and noise transmission.
The surface vibration of the scroll compressor housing is the direct cause of the final radiated noise. The relationship between the radiated sound power and the vibration power of the housing surface is given by:
where is the radiated sound power of the surface, is the vibration power of the surface, and is the sound radiation efficiency. In turn, the vibration power of the surface is given by:
where is the air density, is the speed of sound, is the characteristic impedance of air, is the vibrating surface area, and is the spatial mean of the mean-square particle velocity. Substituting Equation (7) into Equation (6) above yields:
The acoustic radiation efficiency is the key parameter linking vibration and noise. It is a dimensionless quantity that characterizes the efficiency of converting structural vibration into sound energy and depends primarily on the vibration frequency and the housing mode shape. Typically, the radiation efficiency is low at low frequencies and high at high frequencies; moreover, even for the same vibration velocity, the radiation capability can vary substantially among different mode shapes.
3. Simulation Methodology and Experimental Equipment
To elucidate the coupling mechanism among the electromagnetic, structural, and acoustic fields, a multiphysics coupled simulation model of the scroll compressor is developed in this study, where the electromagnetic, structural, and acoustic calculations are performed sequentially. In consideration of computational efficiency and the primary research focus, the model temporarily disregards aerodynamic excitation and other factors, concentrating on the vibration transmission characteristics within the electromagnetically dominant frequency bands. This model is intended to provide a qualitative trend reference and modal matching analysis, serving as a supplementary comparison for the electromagnetic characteristics under experimental conditions rather than a precisely accurate amplitude prediction.
Meanwhile, experimental verification is carried out based on the established electromagnetic coupling simulation and its corresponding results. The experimental measurement equipment included vibration sensors coupled with a Siemens data acquisition unit, and a noise microphone array. The vibration and noise measurements were conducted in a full anechoic chamber. The anechoic chamber had a background noise level of 16.5 dB and a cut-off frequency of 63.5 Hz. The measurement point arrangement complied with the ISO 3745:2012 standard [31].
3.1. Electromagnetic Field Simulation and Vibration and Noise Prediction
This section sequentially solves the electromagnetic, structural, and acoustic fields using the Maxwell, Mechanical, and Acoustics modules of ANSYS 2022 R1. Specifically, the electromagnetic field is solved by the Maxwell module using a transient magnetic field solver. The time step is set according to the electrical period at each rotational speed: one electrical period is divided into 120 steps, corresponding to 4.63 × 10⁻⁵ s, 3.09 × 10⁻⁵ s, and 2.53 × 10⁻⁵ s at 3600, 5400, and 6600 rpm, respectively. The Mechanical module is used for structural harmonic response analysis based on the mode superposition method, and the Acoustics module is applied to acoustic radiation calculation via the boundary element method.
Table 2 presents the main material properties of the compressor model. In the simulation, the winding region is simplified as an equivalent homogeneous copper material, and the permanent magnets are radially magnetized and assumed to have an ideally uniform distribution. The eddy current effect in the stator core is neglected in the electromagnetic force calculation. In the structural field, weld seams and local stiffness variations in the housing are neglected, and the properties of the air medium in the acoustic field are set under standard atmospheric conditions (25 °C, 1 atm).
Table 2.
Summary of material properties of the scroll compressor.
In addition, for the electromagnetic field, a flux-parallel boundary condition is imposed on the outer surface of the stator, and the rotor is set to rotate at a prescribed speed. In the structural field, the stator is bonded to the inner surface of the housing, and axial displacement constraints are applied to the winding ends to prevent rigid-body motion. In the acoustic field, the vibration velocity on the outer surface of the housing is taken as the boundary condition, and an acoustic radiation surface is placed 1 m away from the housing surface to extract the sound pressure level spectrum.
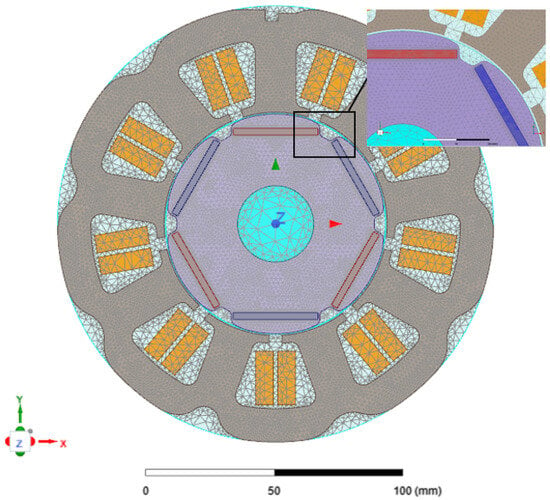
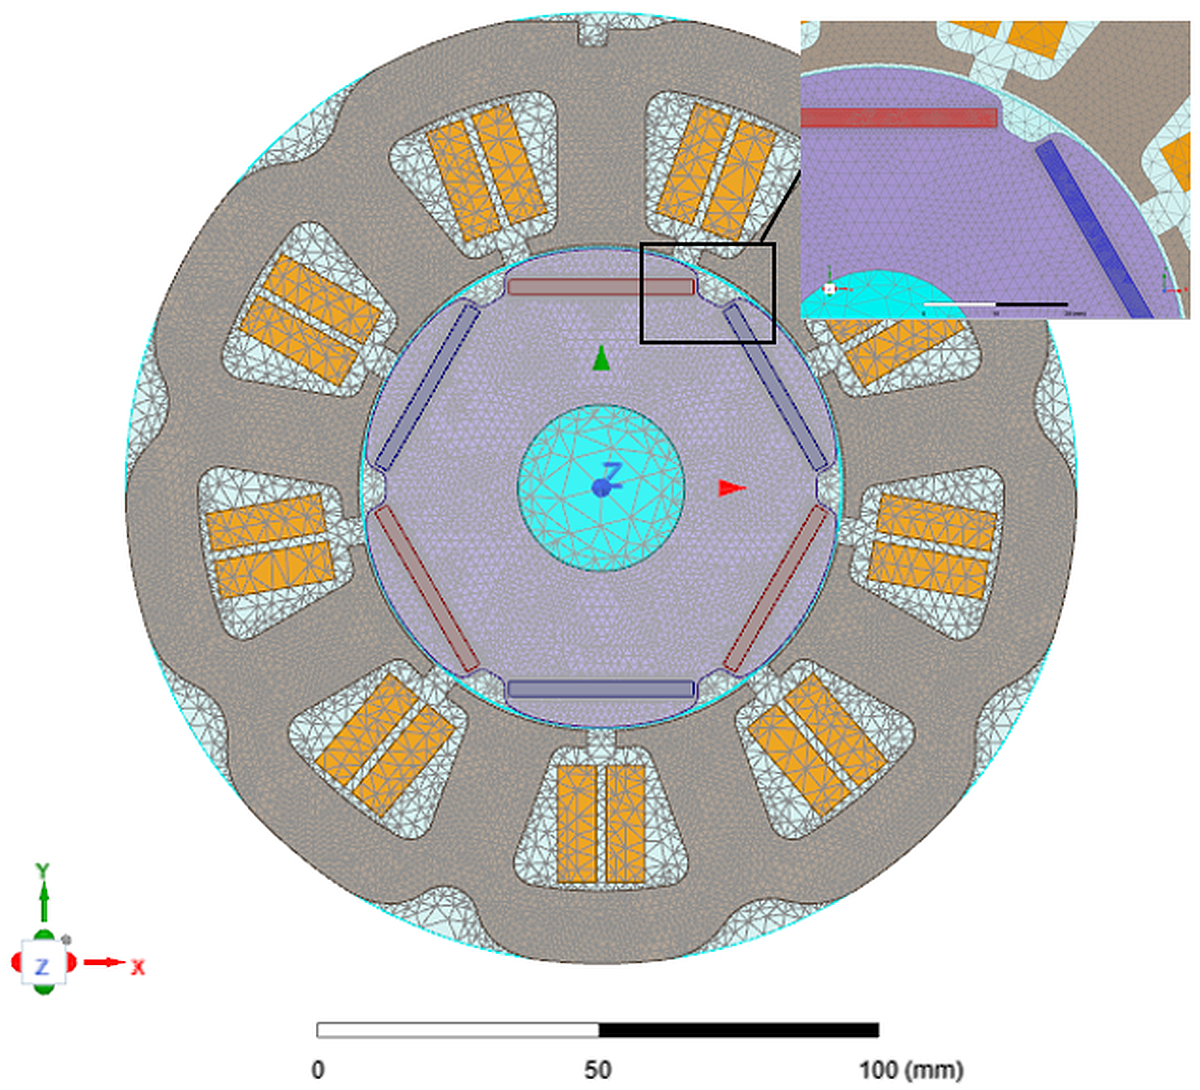
A transient model of the interior permanent magnet motor was constructed using electromagnetic simulation software, with the material properties, winding excitations, and motion conditions assigned according to Table 1 and Table 2. The simulation yields the time-domain and spatial distribution of the air-gap flux density, which is represented as the radial electromagnetic force density. The dominant frequency components and spatial orders are then extracted through fast Fourier transform (FFT) analysis. Figure 3 shows the two-dimensional mesh of the motor, where the stator core, rotor core, permanent magnets, and windings are distinguished by gray, purple, orange, and red/blue colors, respectively, and a 0.5 mm mesh size is used to refine the air-gap region.
Figure 3.
Mesh model of the motor.
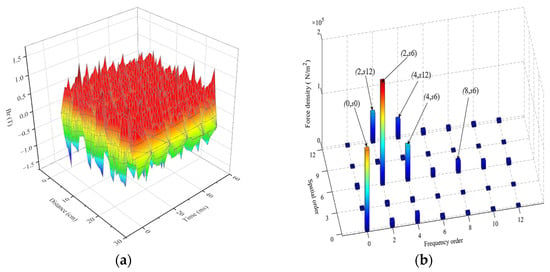
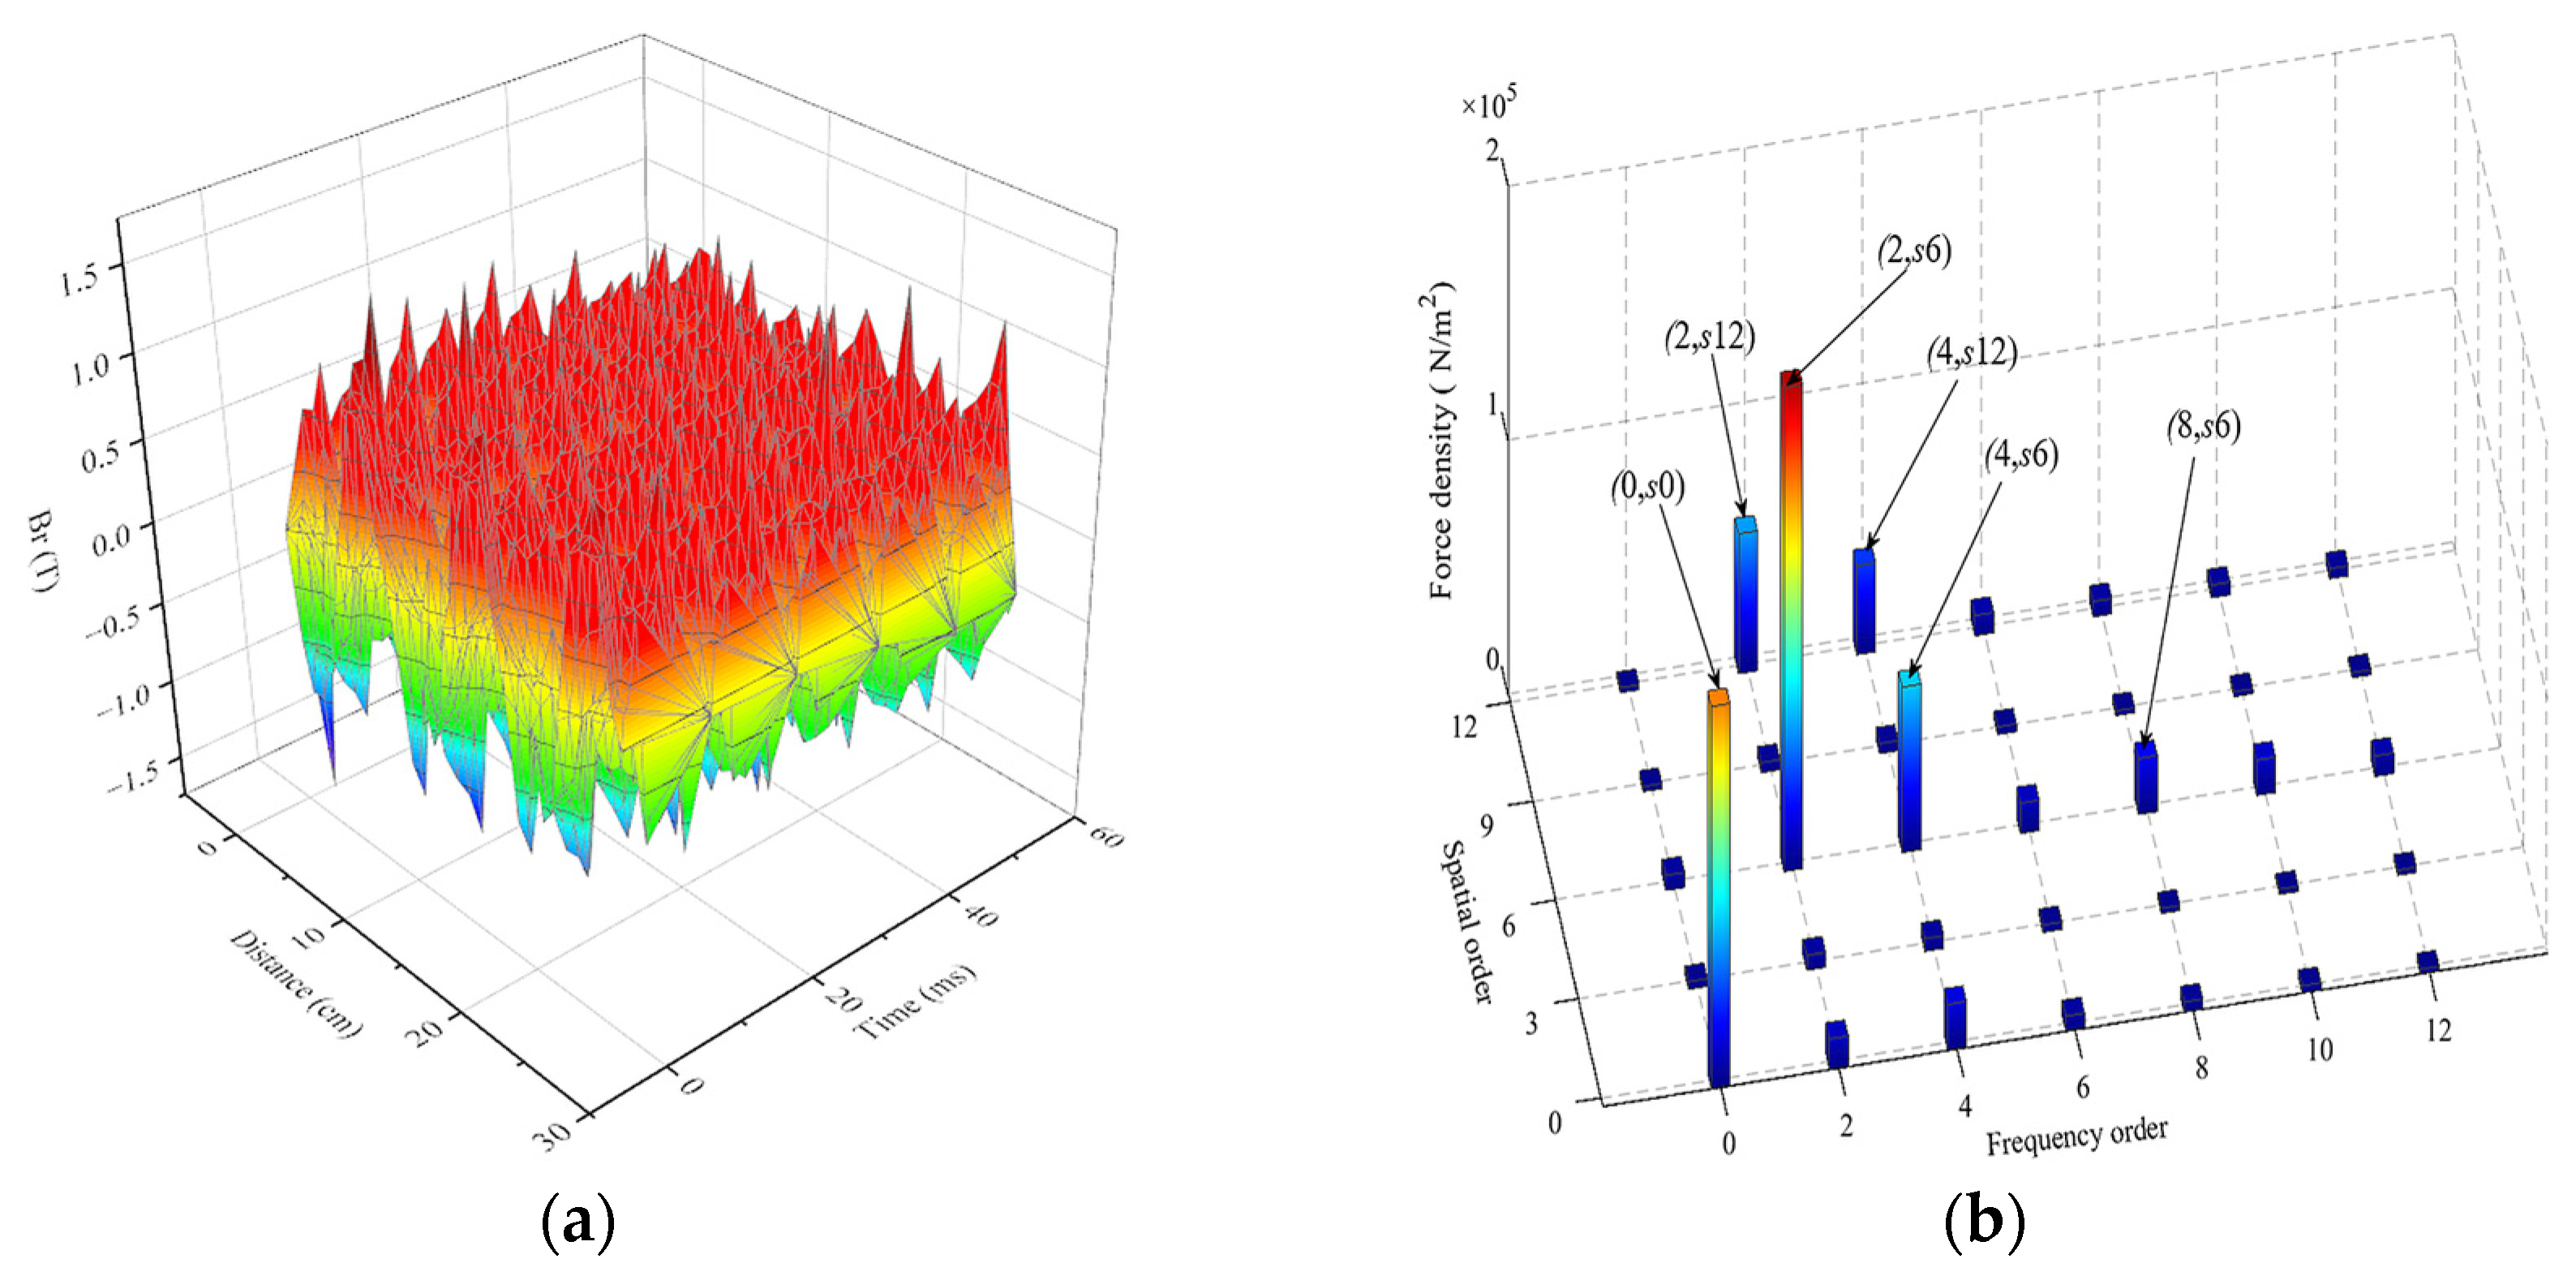
Illustrated in Figure 4a is the spatiotemporal distribution of the air-gap flux density. Spatially, a nine-period slot modulation pattern is observed, and temporally, pronounced harmonic pulsations are evident. The amplitude of the magnetic flux density fluctuates around 1.5 T, and its non-sinusoidal distribution indicates the presence of high-order harmonic components. These harmonics are transformed into radial electromagnetic forces through the Maxwell stress tensor, serving as the primary excitation source of vibration. The spatiotemporal two-dimensional FFT decomposition of the electromagnetic radial force density in the air gap is presented in Figure 4b. Here, the component with frequency and spatial order (0, s0) is a static bias component that does not induce dynamic vibration. In contrast, the harmonic components with frequency order 2 and spatial orders 6 (2, s6) and 12 (2, s12) contribute significantly to the force amplitude. Meanwhile, notable spatial components of orders 6 and 12 are also present at frequency orders 4 and 8. Collectively, the simulated magnetic flux density and harmonic distributions in Figure 4 and Figure 5 are consistent with the theoretical characteristics of the motor under study.
Figure 4.
Characteristics of the electromagnetic excitation source: (a) spatiotemporal distribution of radial air-gap flux density; (b) spatiotemporal harmonic order distribution of the electromagnetic force density.
Figure 5.
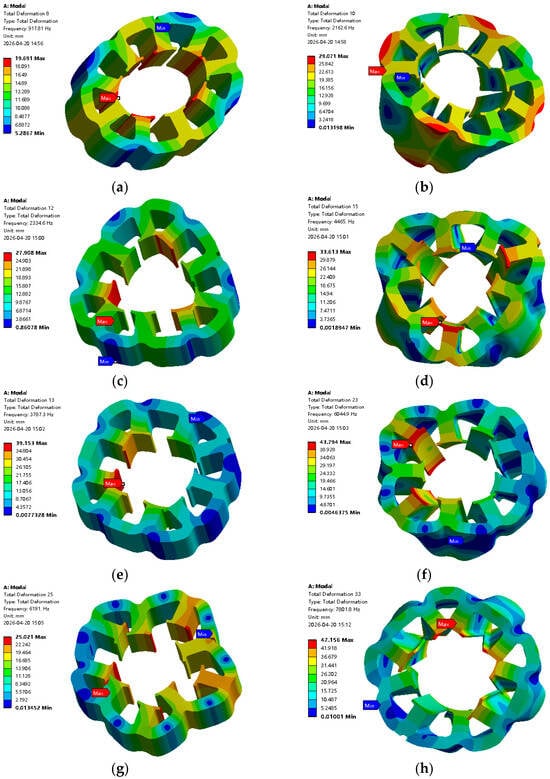
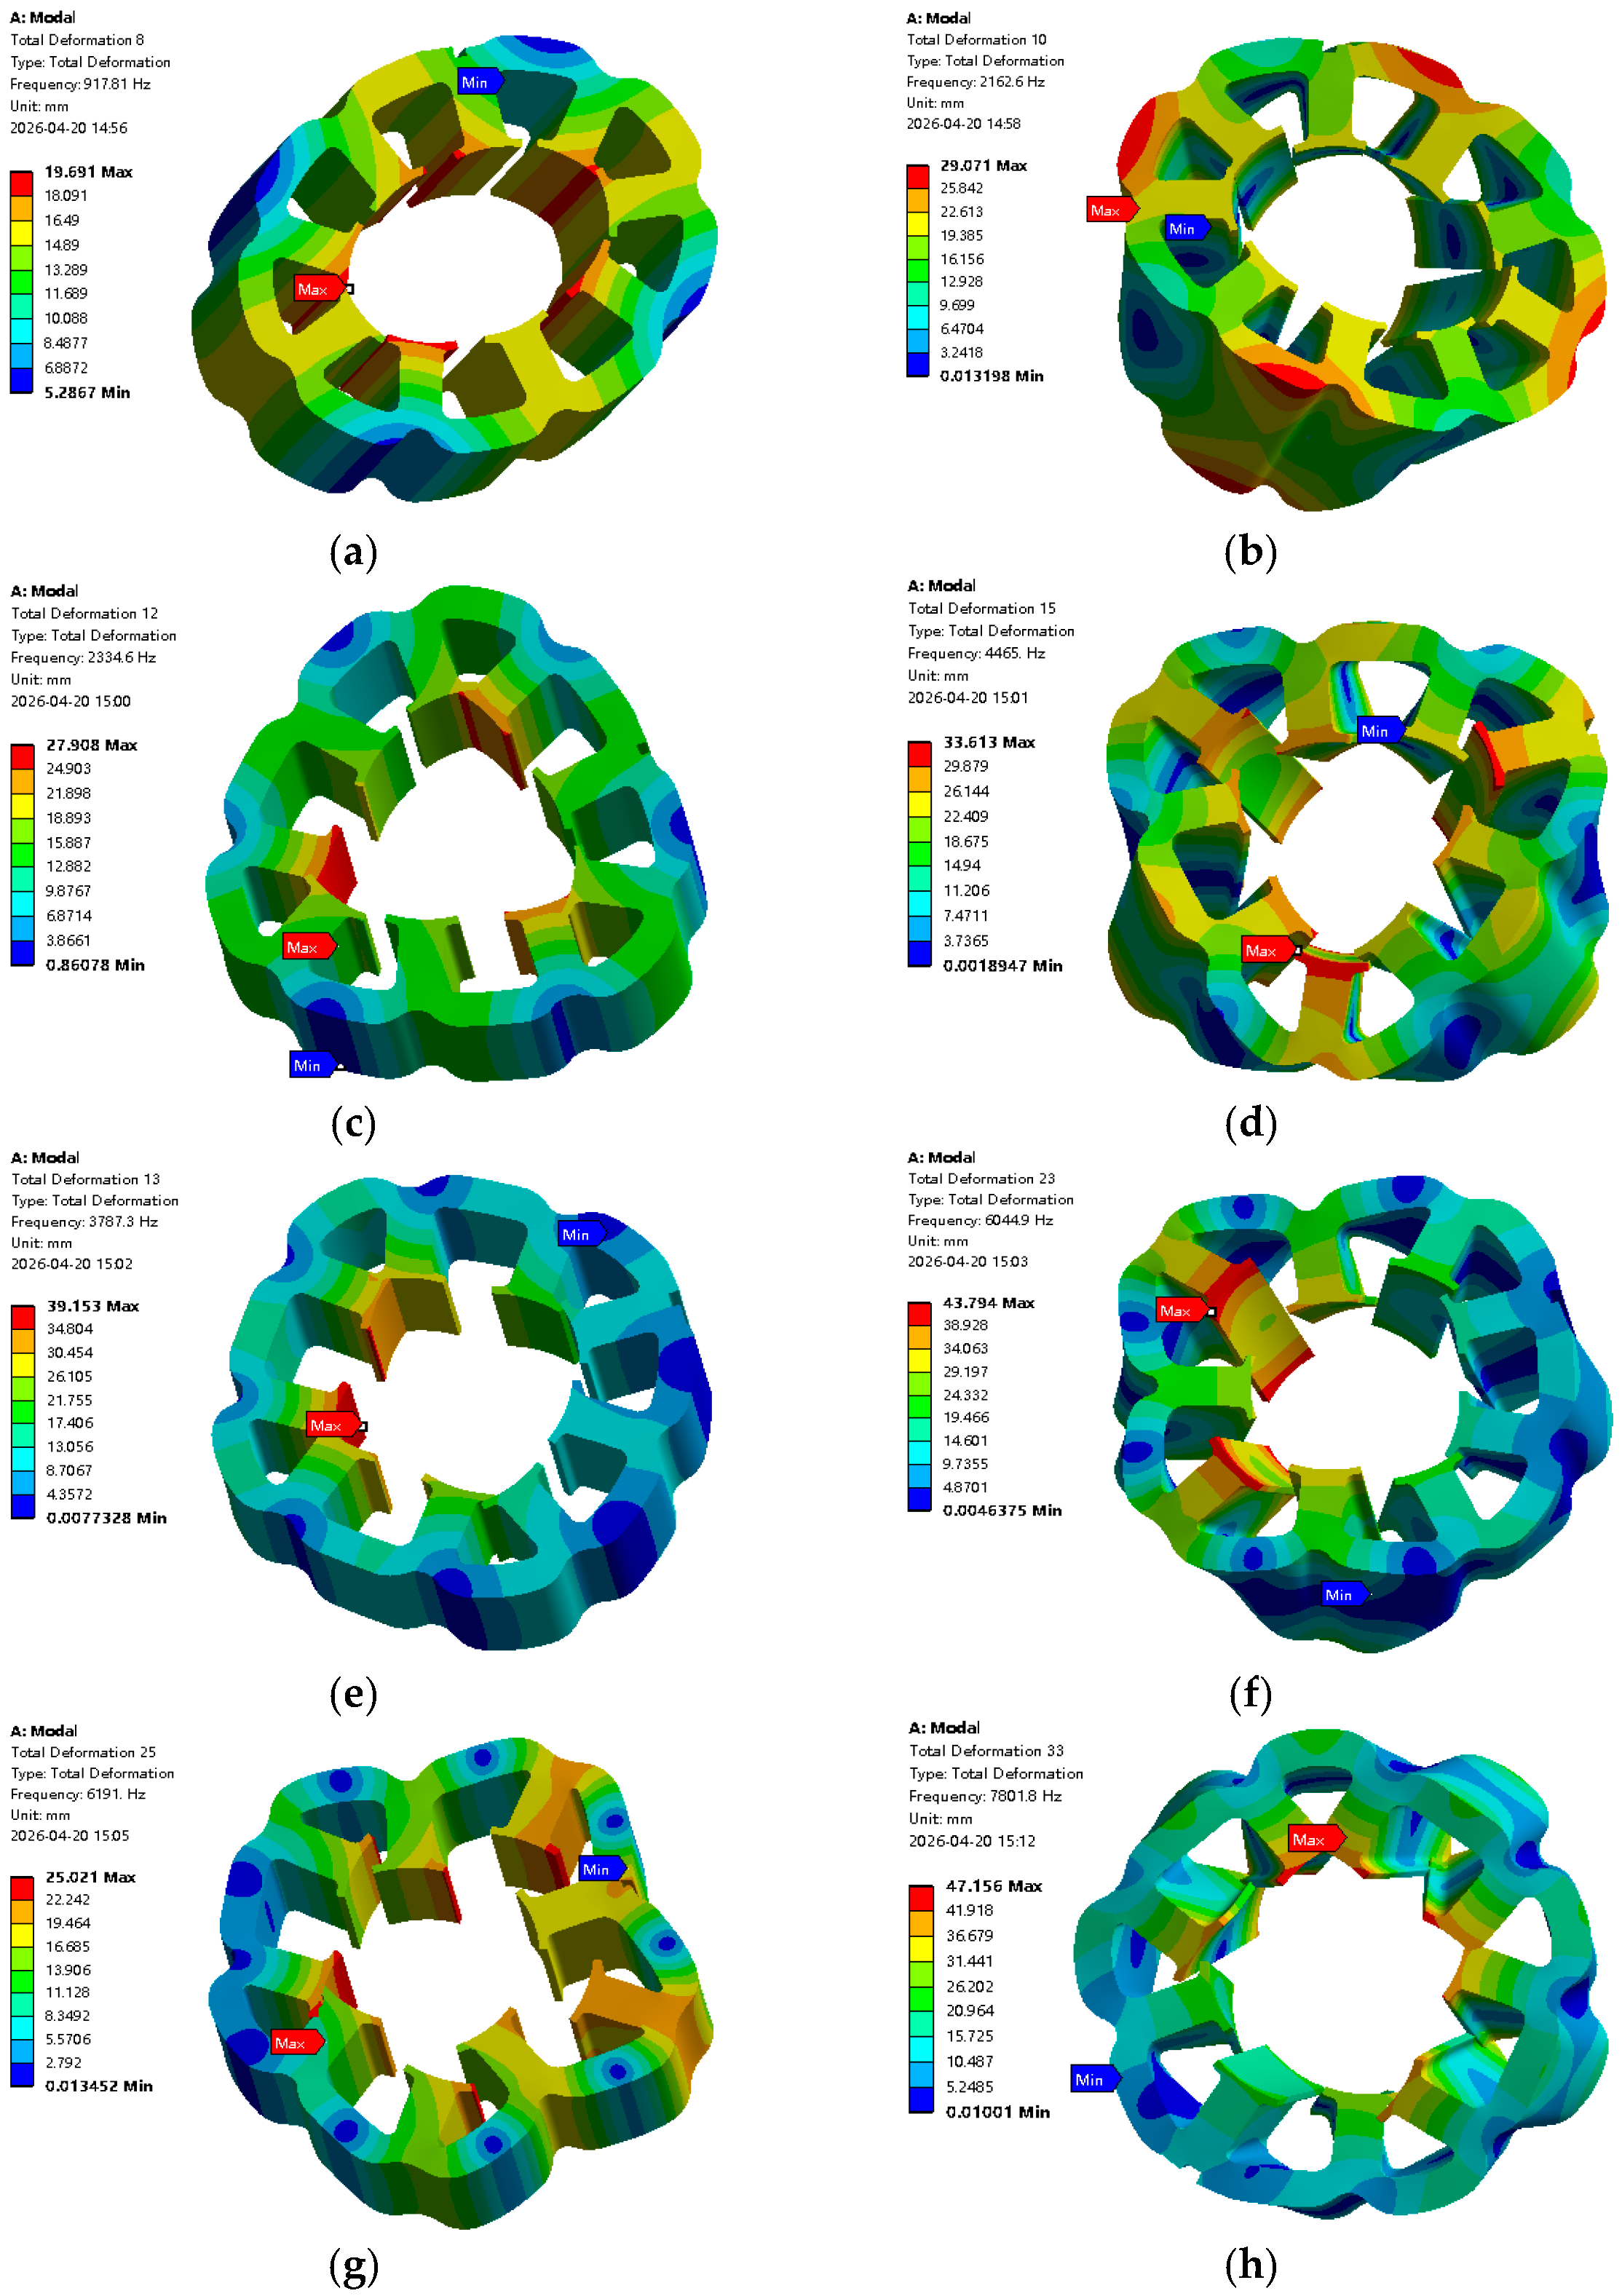
Mode shape diagram of the stator assembly model: (a) m = 2, n = 0; (b) m = 2, n = 1; (c) m = 3, n = 0; (d) m = 3, n = 1; (e) m = 4, n = 0; (f) m = 4, n = 1; (g) m = 5, n = 0; (h) m = 5, n = 1.
Figure 5 presents the structural modes of the stator assembly, where m denotes the radial modal order, n = 0 indicates axial in-phase vibration, and n = 1 indicates axial out-of-phase vibration.
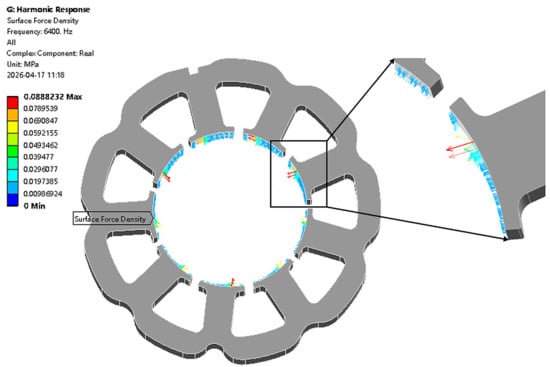
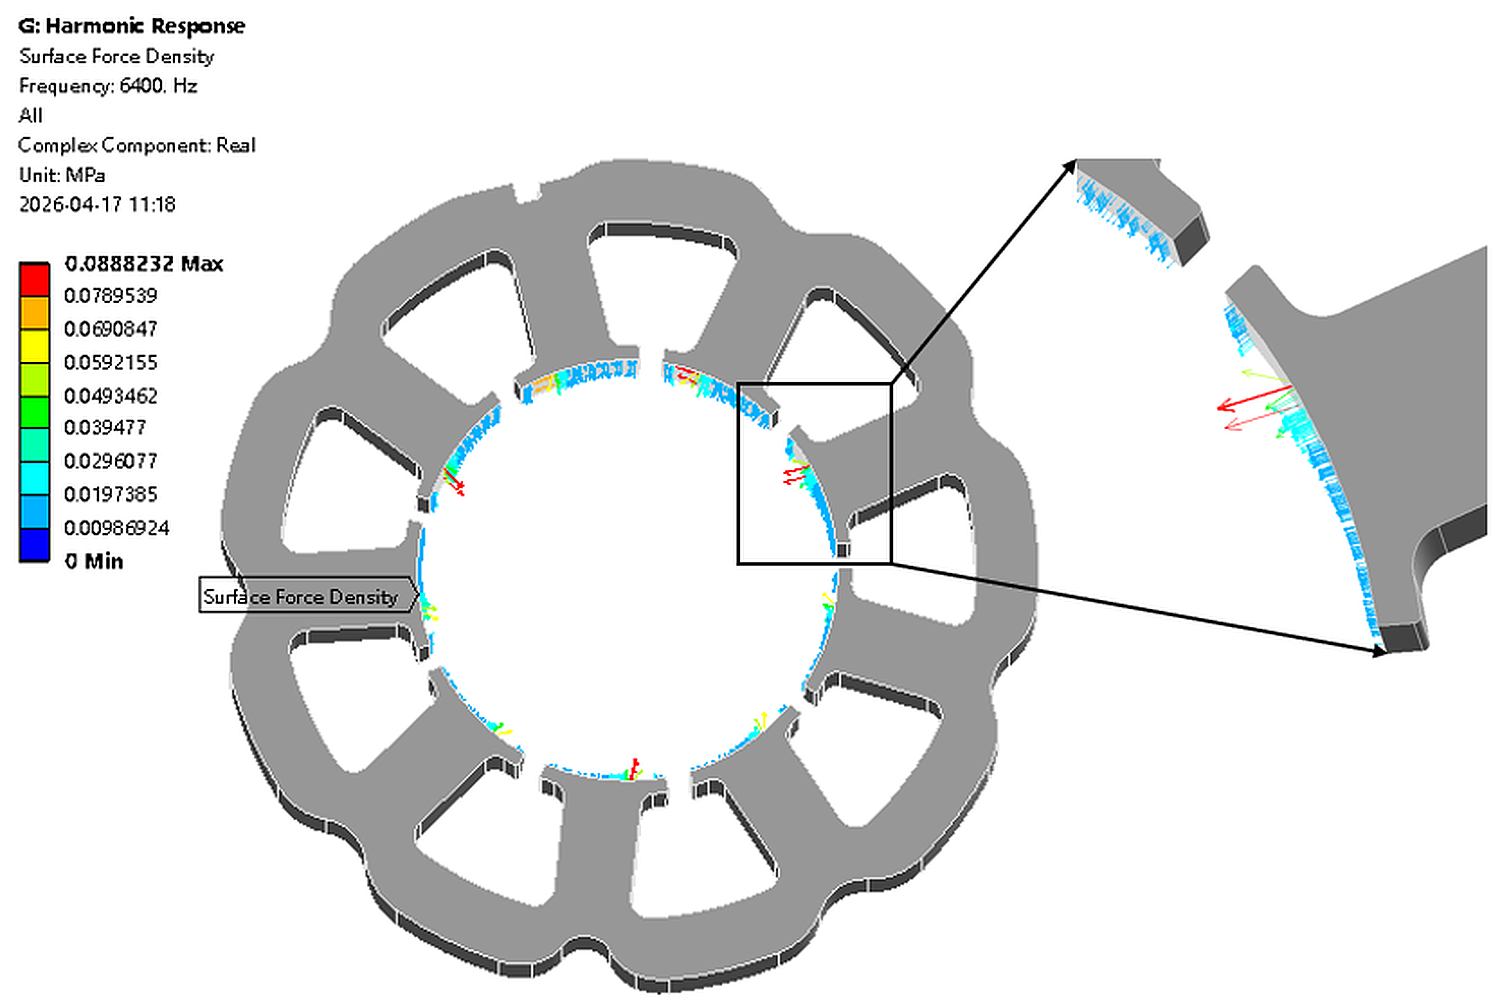
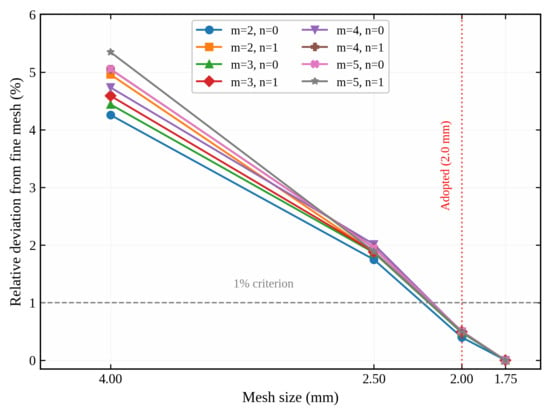
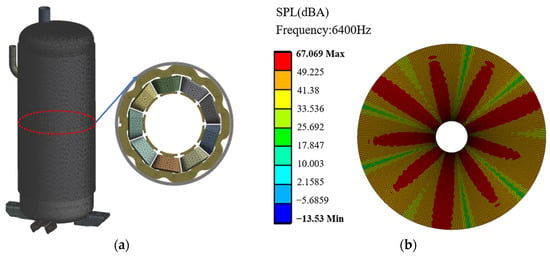
As shown in Figure 6, the electromagnetic nodal force density obtained from the electromagnetic field calculation is mapped onto the structural mesh of the stator teeth, and harmonic response analysis is performed in the software’s response module using the mode superposition method. In the structural field simulation, the housing material is set as Q235B steel, the winding material as copper wire, and the silicon steel lamination material as specified in Table 1. The degrees of freedom at the bottom of the support feet are constrained. A mesh independence study was conducted at four mesh sizes (4.0, 2.5, 2.0, and 1.75 mm) to examine the natural frequencies of the first several modes (m = 2–5, n = 0, 1), as shown in Figure 7. The vertical axis of Figure 7 shows the relative deviation of the natural frequency with respect to the finest mesh (1.75 mm). At the adopted mesh (2.0 mm), the deviations are below 1% for all modes. Accordingly, a mesh consisting of second-order tetrahedral elements with an element size of 2.0 mm, 1.06 million nodes, and 0.66 million elements is adopted for all subsequent structural and acoustic simulations. Based on this model, the vibration acceleration response on the compressor housing surface over the frequency range of 0–6400 Hz is calculated and extracted, as shown in Figure 8a.
Figure 6.
Schematic diagram of electromagnetic force density mapping onto the structural nodes.
Figure 7.
Mesh independence verification of natural frequencies.
Figure 8.
Vibration response extraction and sound field prediction: (a) schematic diagram of the stator assembly mesh and vibration response extraction; (b) A-weighted sound pressure level distribution in the sound field at 1 m.
Based on the vibration response results, an acoustic boundary element calculation is conducted using the software’s acoustic module, the acoustic field mesh consists of approximately 1.23 million nodes and 0.286 million elements, where the air medium properties are specified (25 °C, 1 atm), and the sound pressure level spectrum at a distance of 1 m from the compressor housing surface is computed. Figure 8b shows the A-weighted sound pressure level distribution at a distance of 1 m from the scroll compressor housing, where the sound pressure level ranges from −13.53 dB(A) to 67.069 dB(A). The sound pressure level distribution is positively correlated with the vibration acceleration response on the housing surface, confirming that structural vibration is the dominant excitation source of the noise radiated by the housing.
3.2. Test Equipment and Operating Conditions
As shown in Table 3, the compressor noise measurement was carried out using a Brüel & Kjær (B&K) 9712 acoustic camera (Brüel & Kjær, Nærum, Denmark) equipped with 30 Type 4959 microphones; the sensor array operated over a frequency range of 140 Hz to 20 kHz with a frequency resolution of 1 Hz, and the measurement frequency range was set to 140–6400 Hz. Vibration measurements were carried out using a Simcenter SCM2E01 data acquisition system (Siemens, Munich, Germany) coupled with Donghua 1A312E triaxial accelerometers (Donghua, Taizhou, China), with the acceleration data presented in g (1 g ≈ 9.8 m/s2).
Table 3.
Test instruments and equipment.
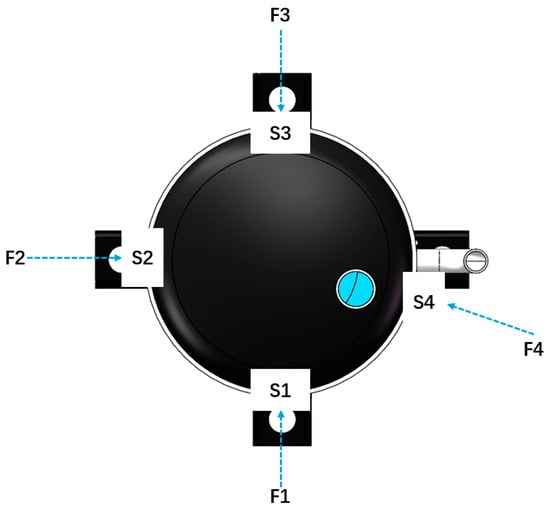
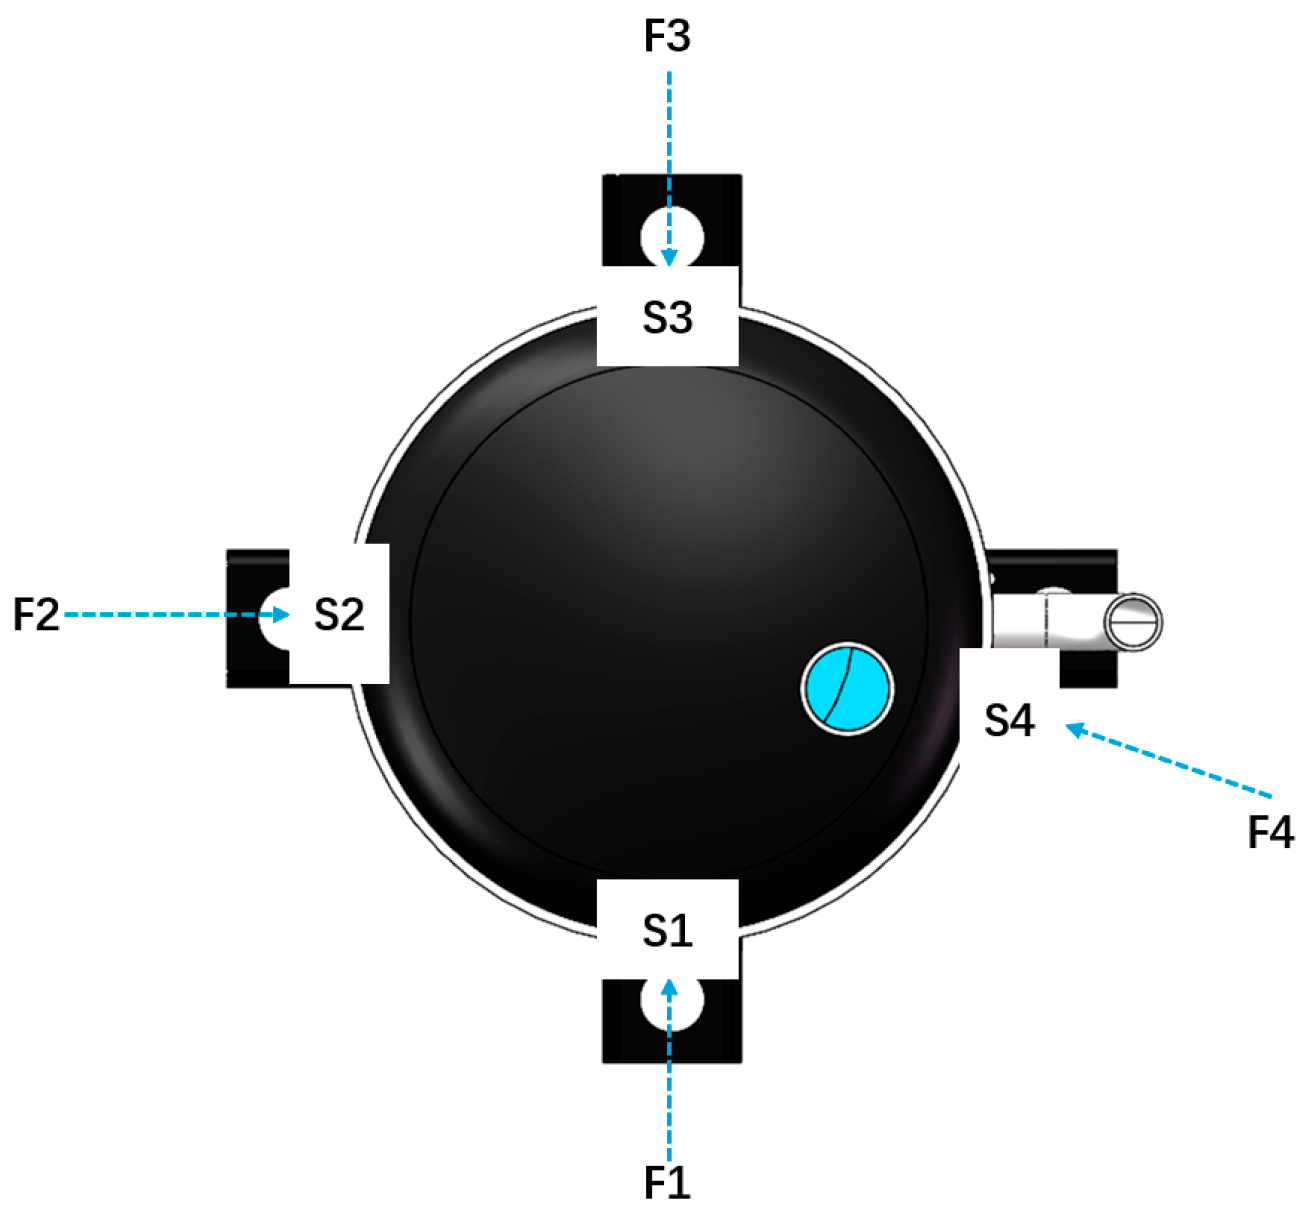
Vibration at four measurement points (S1, S2, S3, and S4) on the scroll compressor housing was measured using accelerometers under different operating conditions. Meanwhile, acoustic camera measurements were conducted under the same operating conditions for four selected test planes (F1, F2, F3, and F4); the layout of the vibration measurement points and the distribution of the noise test planes are shown in Figure 9.
Figure 9.
Distribution of vibration measurement points and noise test planes on the compressor.
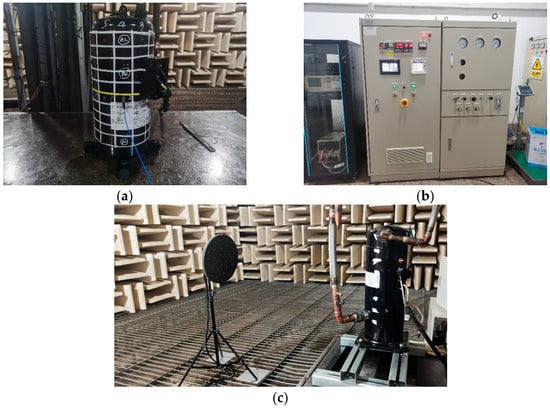
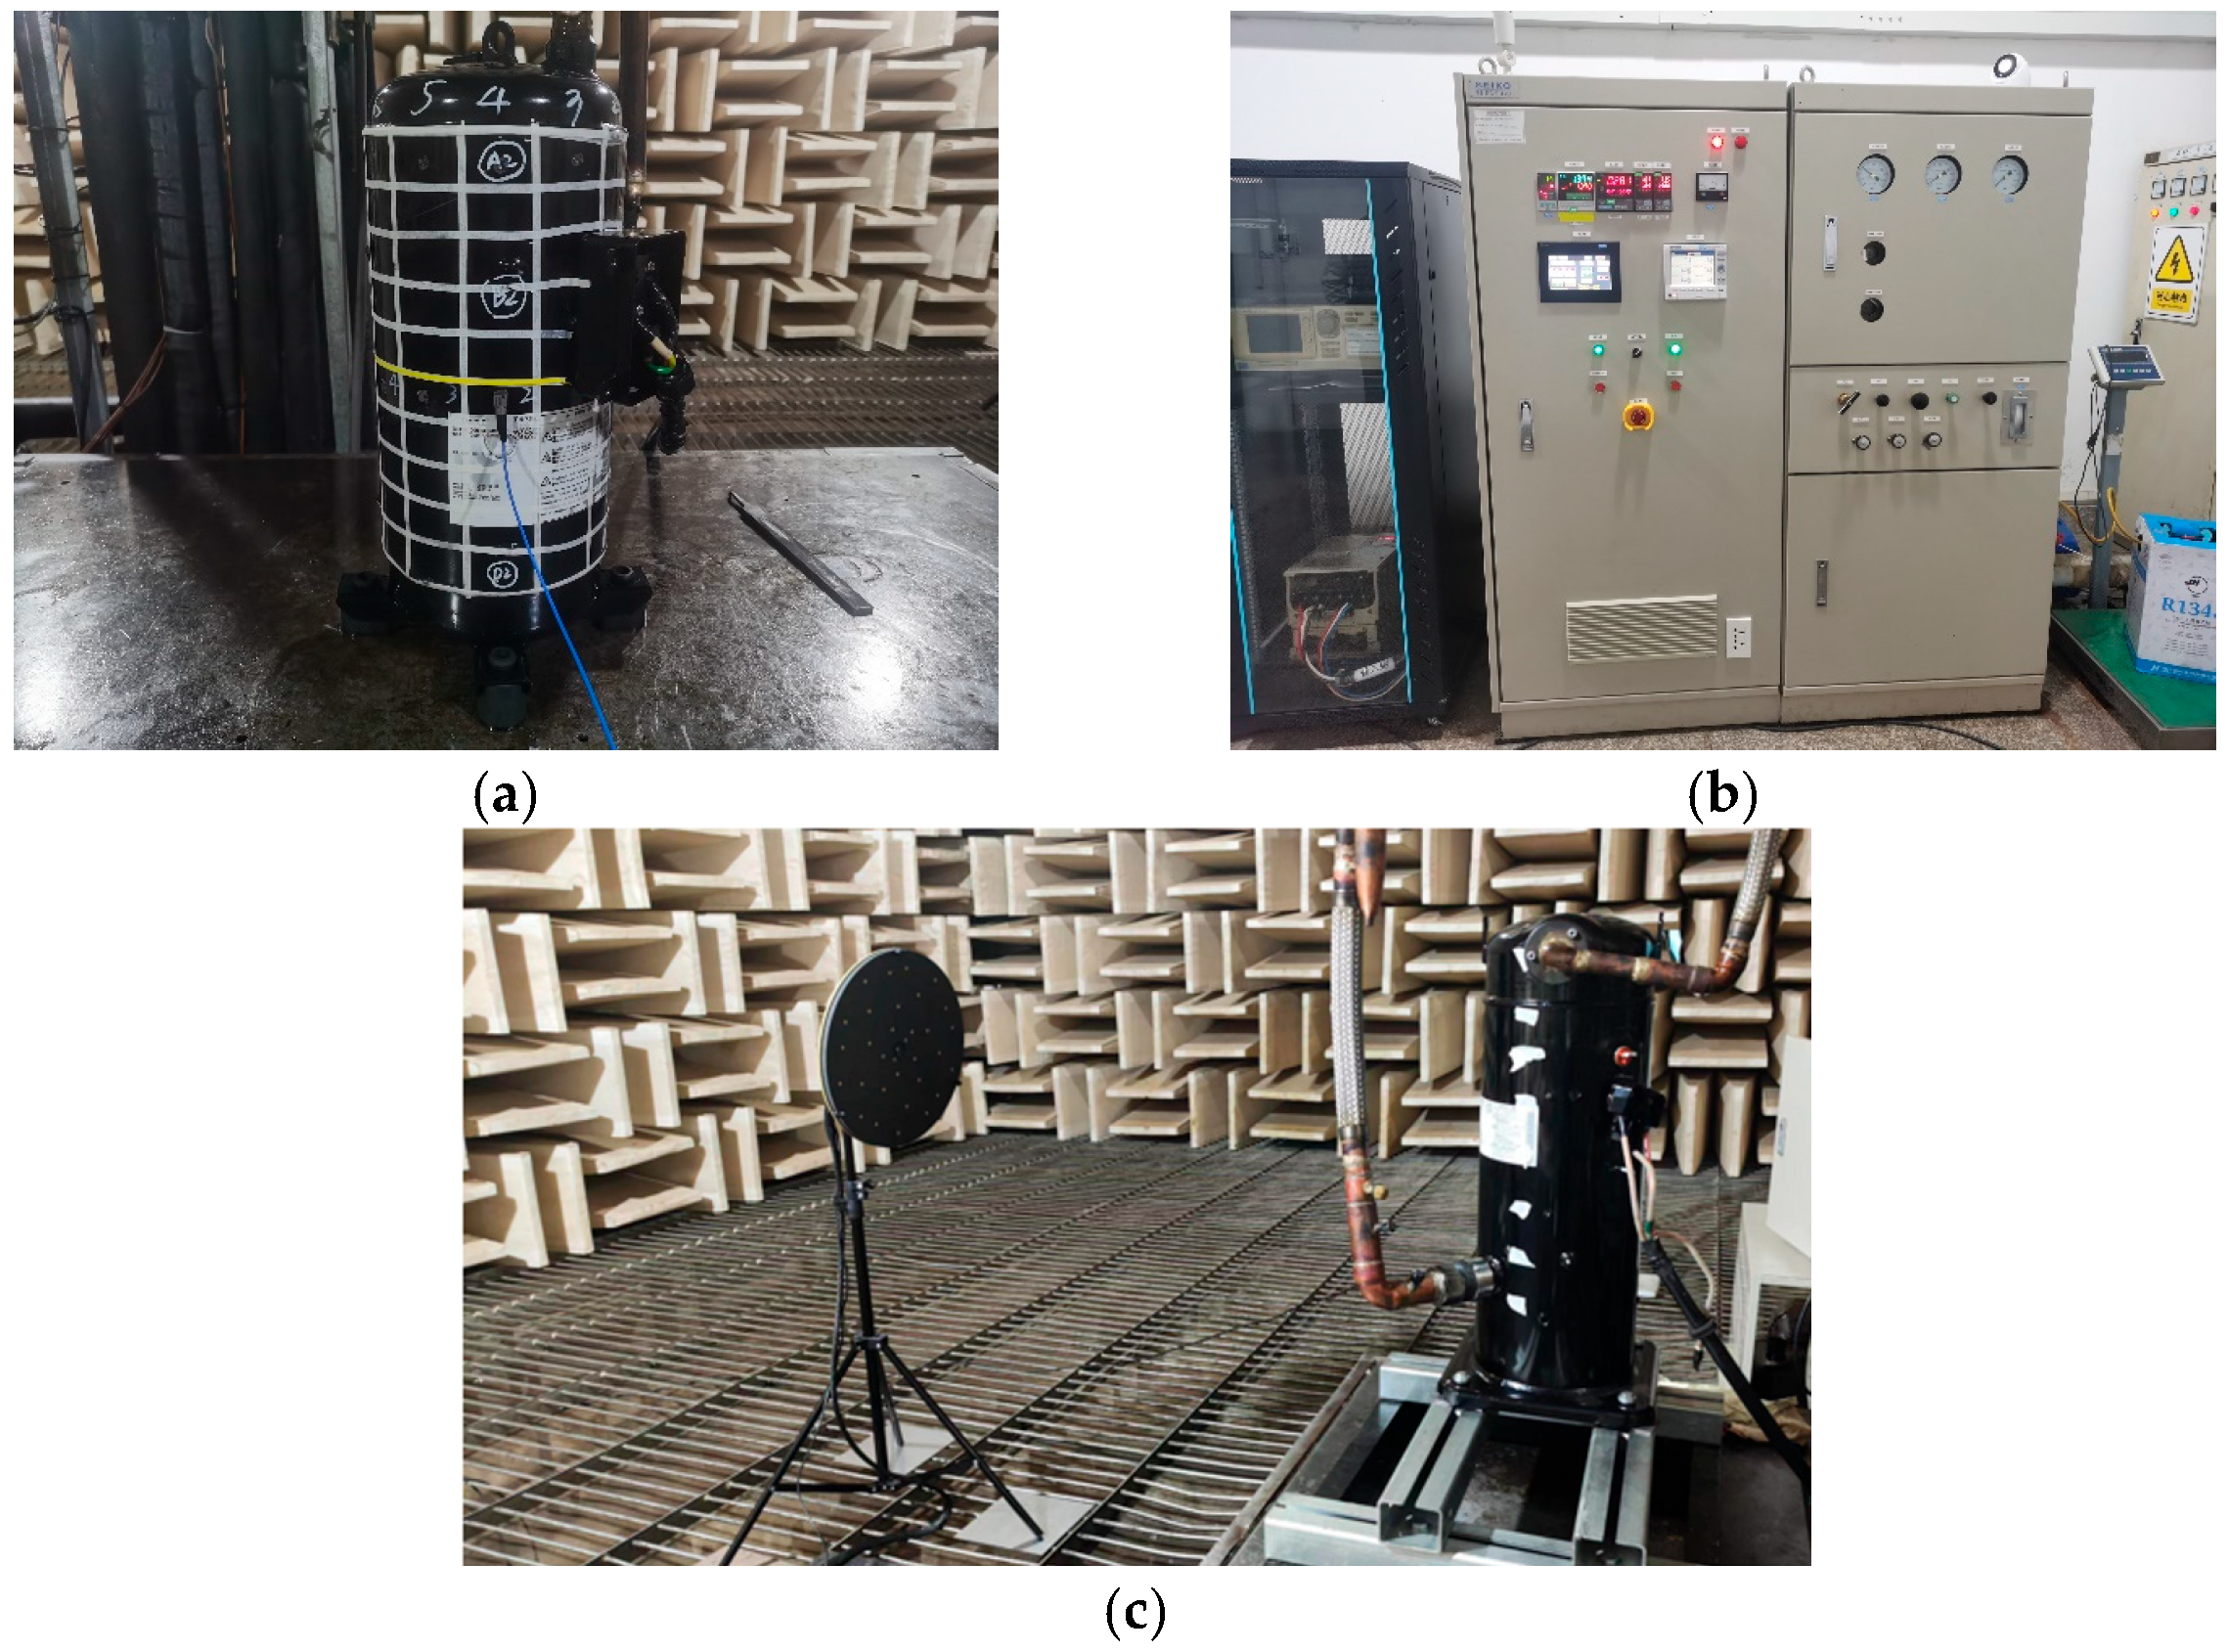
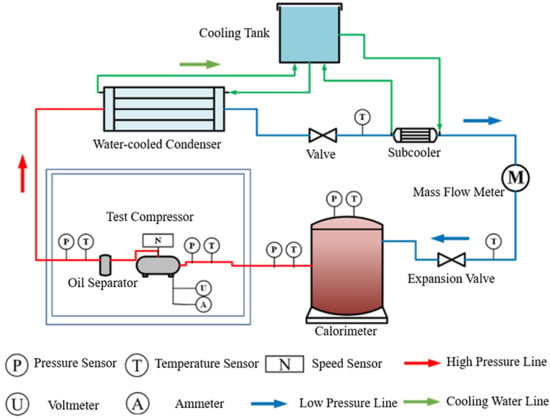
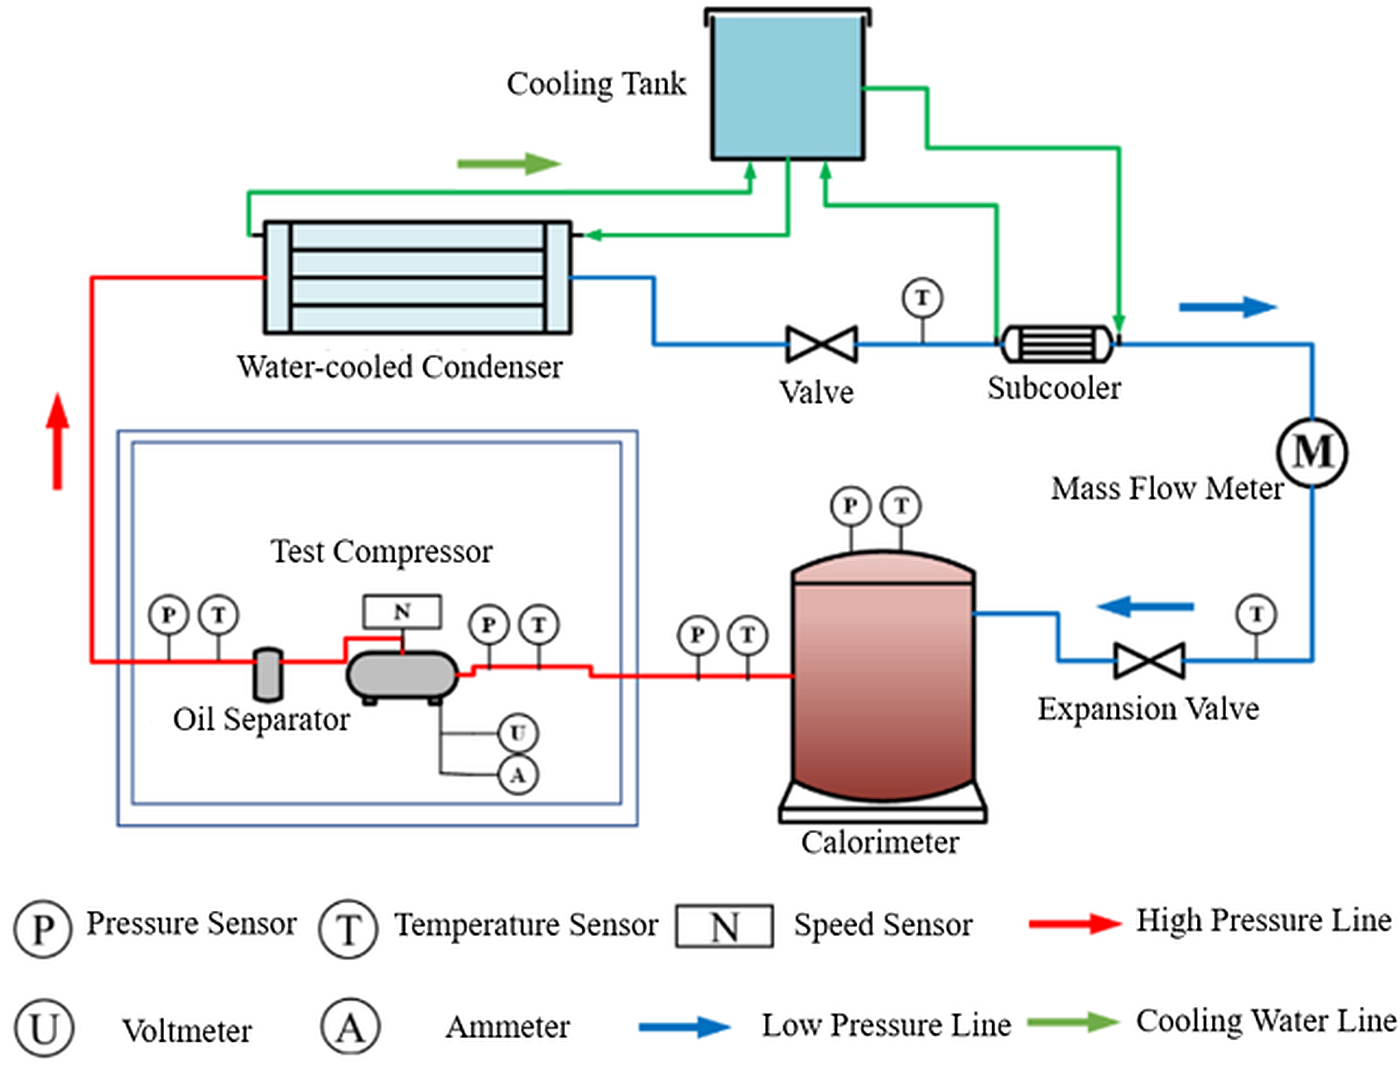
For the scroll compressor under test, using the operating conditions listed in Table 4 above, three rotational speeds of 3600 rpm, 5400 rpm, and 6600 rpm were selected under the same test condition, and a sampling frequency of 6.4 kHz was adopted for both the vibration and noise measurement equipment. The layout of the vibration and noise test equipment is shown in Figure 10, where Figure 10a illustrates the positioning of the vibration sensors, Figure 10b the operating condition control panel, and Figure 10c the distribution of the noise measurement equipment. Figure 11 presents a schematic diagram of the compressor performance test bench.
Table 4.
Test condition settings.
Figure 10.
Vibration and noise testing of the scroll compressor: (a) layout of the vibration sensors; (b) operating condition control panel; (c) layout of the noise measurement equipment.
Figure 11.
Schematic of the scroll compressor performance test bench.
4. Results and Discussion
This section presents a comparative analysis of the vibration and noise spectra. Using both experimental and simulation data, the spectral features of the scroll compressor’s vibration and noise under varying operating conditions are compared, and the contribution of electromagnetic excitation is evaluated.
4.1. Vibration Results Analysis and Comparison
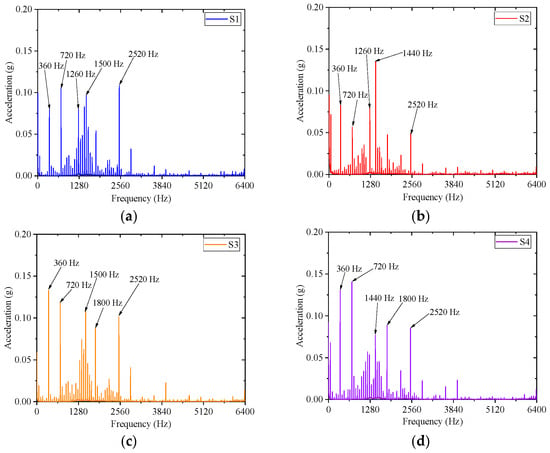
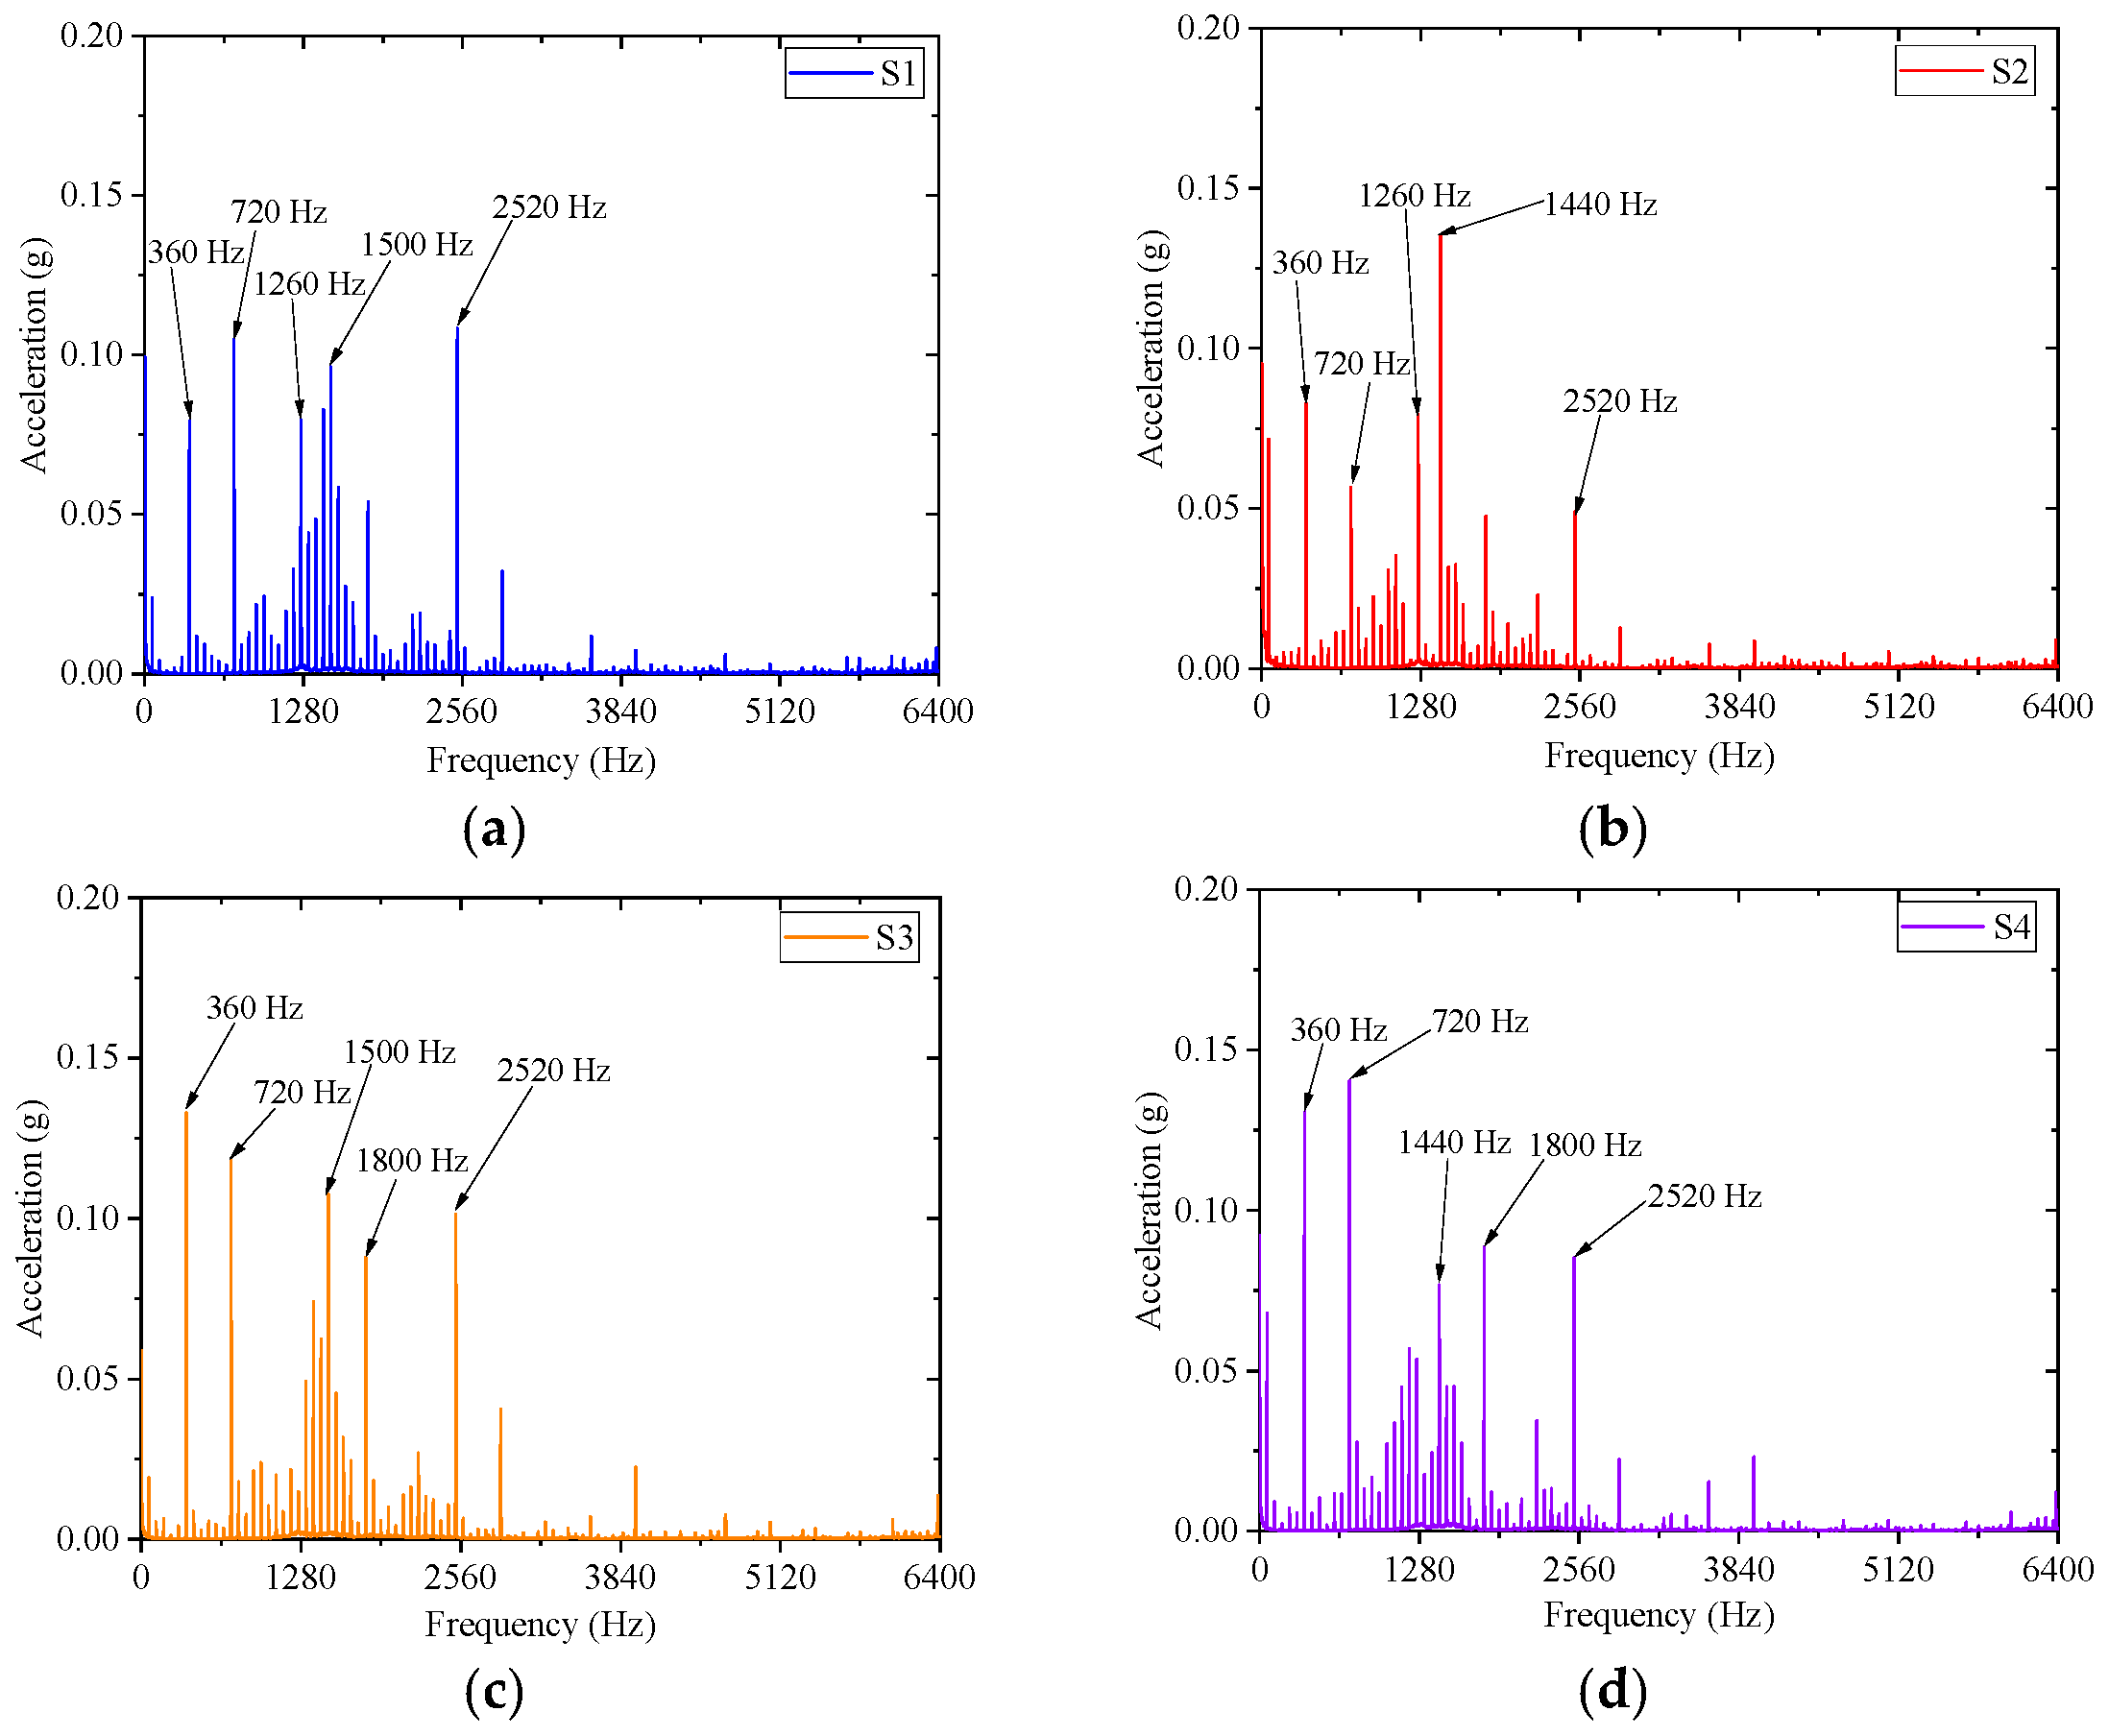
At 3600 rpm, the vibration acceleration spectra measured at four housing points (S1–S4) under steady-state operation are plotted in Figure 12. As shown, the vibration energy is predominantly concentrated in the low-frequency range of 0–3 kHz, with the major peak frequencies all occurring at integer multiples of 60 Hz, including 360 Hz (6f), 720 Hz (12f), 1440 Hz (24f), and 2520 Hz (42f). The spectral patterns at all measurement points are fairly consistent, indicating that the electromagnetic excitation acts as a spatially distributed source rather than in the form of localized impacts, while the amplitude differences arise from the geometric asymmetry of the housing and local modal responses.
Figure 12.
Vibration acceleration spectra at four measurement points (3600 rpm): (a) S1; (b) S2; (c) S3; (d) S4.
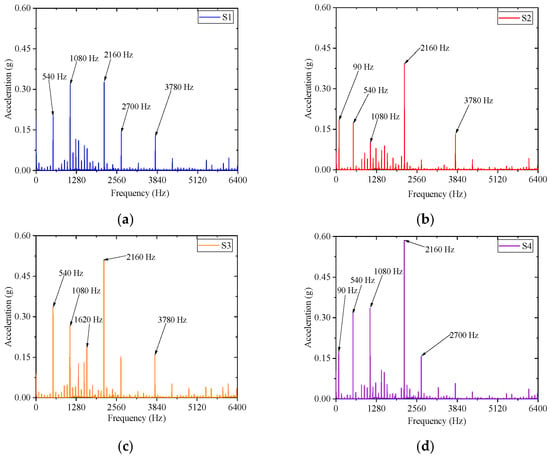
Upon increasing the rotational speed to 5400 rpm (f = 90 Hz), the vibration spectra at the four measurement points are depicted in Figure 13. Compared with the 3600 rpm condition, the electromagnetic harmonic frequencies shift accordingly, and the dominant peaks remain concentrated at 6f, 12f, 24f, and 42f, which is consistent with the electromagnetic frequency characteristics. As the rotational speed increases, the vibration amplitudes rise substantially, with the overall level being approximately three times that observed under the condition shown in Figure 12. At measurement points S2, S3, and S4, the vibration amplitude component at 2160 Hz (24f) becomes the dominant peak, which closely coincides with the second-order structural mode at 2162 Hz (Figure 5). This modal coincidence indicates that the structural asymmetry of the actual compressor breaks the orthogonality between the electromagnetic force wave and the structural modes, so that the mode at this frequency is indirectly excited.
Figure 13.
Vibration acceleration spectra at four measurement points (5400 rpm): (a) S1; (b) S2; (c) S3; (d) S4.
Meanwhile, a component at 3780 Hz appeared at S1, S2, and S3, forming a secondary resonance with the 4th-order mode at 3787.3 Hz. The simultaneous excitation of two structural modes within the bandwidth of the electromagnetic harmonic significantly amplifies the vibration energy at this rotational speed. Notably, peaks appeared at S2 and S4 at 90 Hz, which can likely be attributed to increased torque ripple. Under this condition, the spectral shapes at the various measurement points remained markedly different, indicating that the spatial modulation effect of the housing structural response under electromagnetic excitation is speed-dependent.
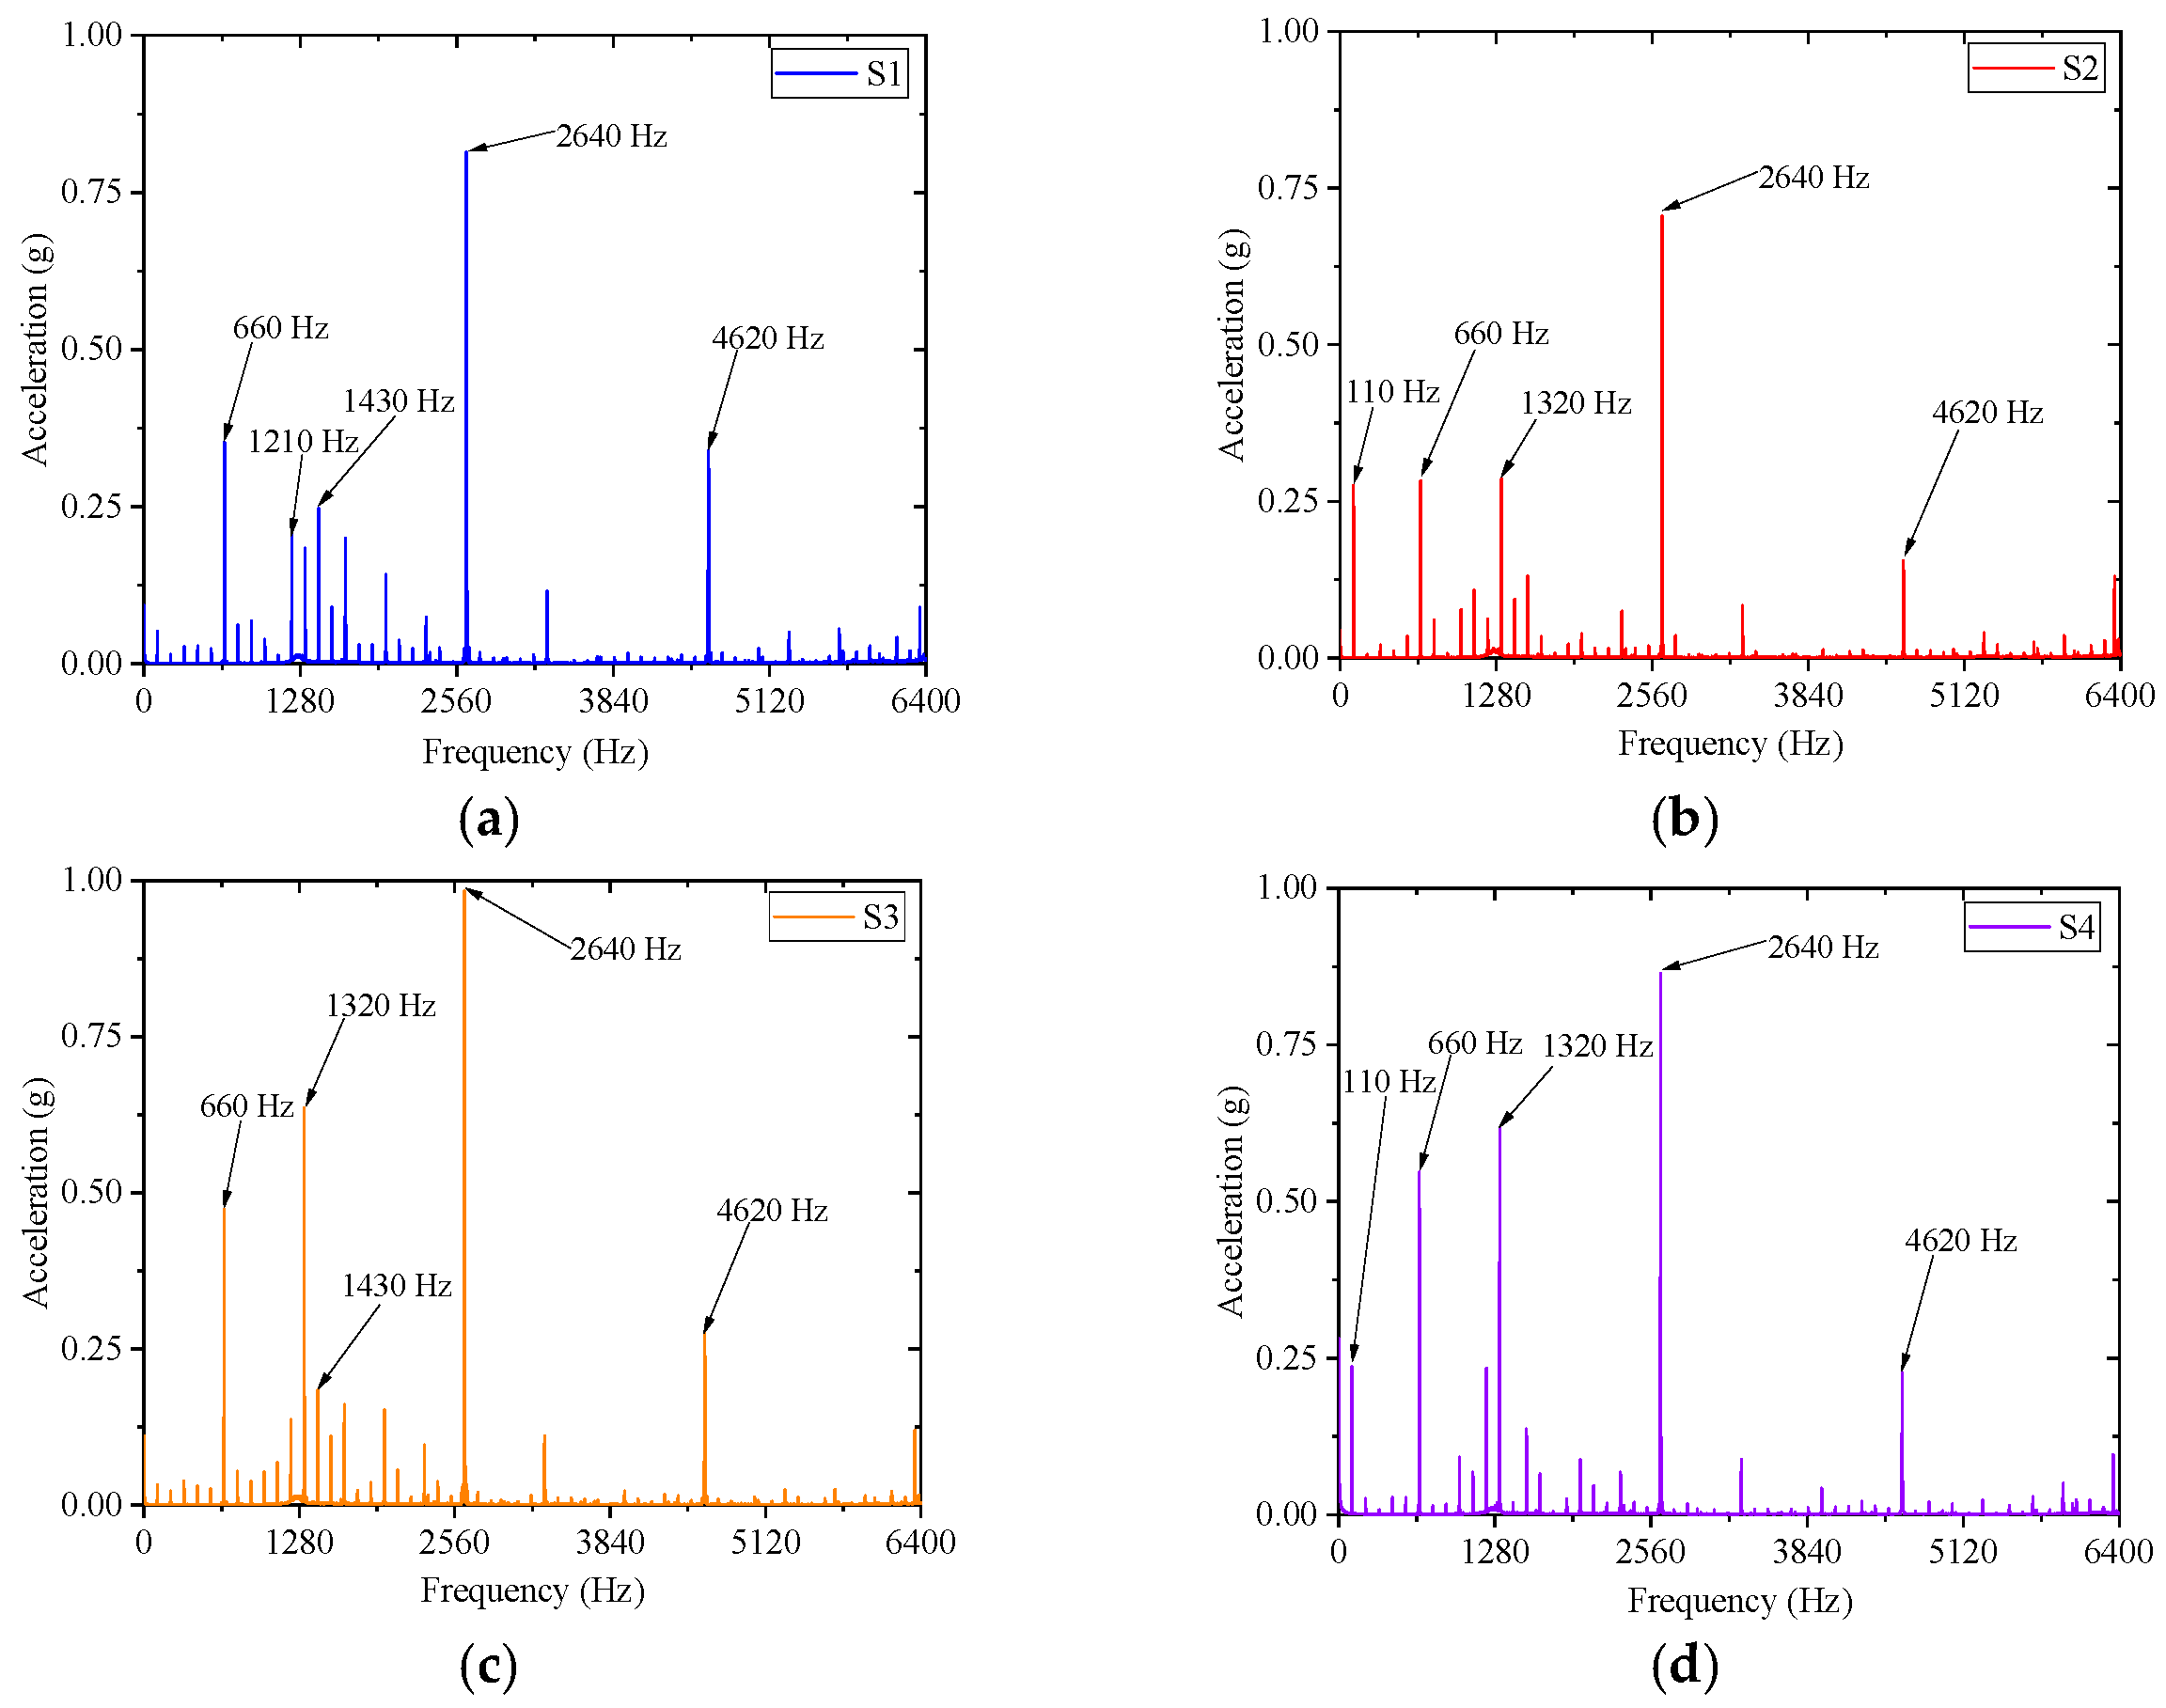
A further rise in rotational speed to 6600 rpm (f = 110 Hz) yields the vibration spectra at the four measurement points shown in Figure 14. The spectra at the four measurement points exhibit a pronounced single-frequency dominance at 2640 Hz (24f), with a maximum acceleration of approximately 1 g (1 g ≈ 9.8 m/s2), which is five times the value at 3600 rpm. Unlike the multi-peak competition characteristic observed at 5400 rpm, the 24f harmonic at 6600 rpm suppresses other frequency components. The non-monotonic evolution of the spectral characteristics with rotational speed indicates that the enhancement of electromagnetic-to-structural coupling in the scroll compressor does not intensify linearly; rather, it is governed by the speed-dependent matching relationship between electromagnetic force frequencies and structural modal frequencies.
Figure 14.
Vibration acceleration spectra at four measurement points (6600 rpm): (a) S1; (b) S2; (c) S3; (d) S4.
To comprehensively evaluate the overall vibration level of the scroll compressor housing in the motor region, the vibration accelerations measured at points S1–S4 are subjected to energy averaging. The average acceleration at each frequency is calculated using Equation (9):
where is the acceleration amplitude at the i-th measurement point and frequency f. This root mean square (RMS) method, while accounting for the spatial distribution of vibration energy among the measurement points, effectively prevents the situation in which simple arithmetic averaging would allow low-amplitude values to mask high-vibration regions.
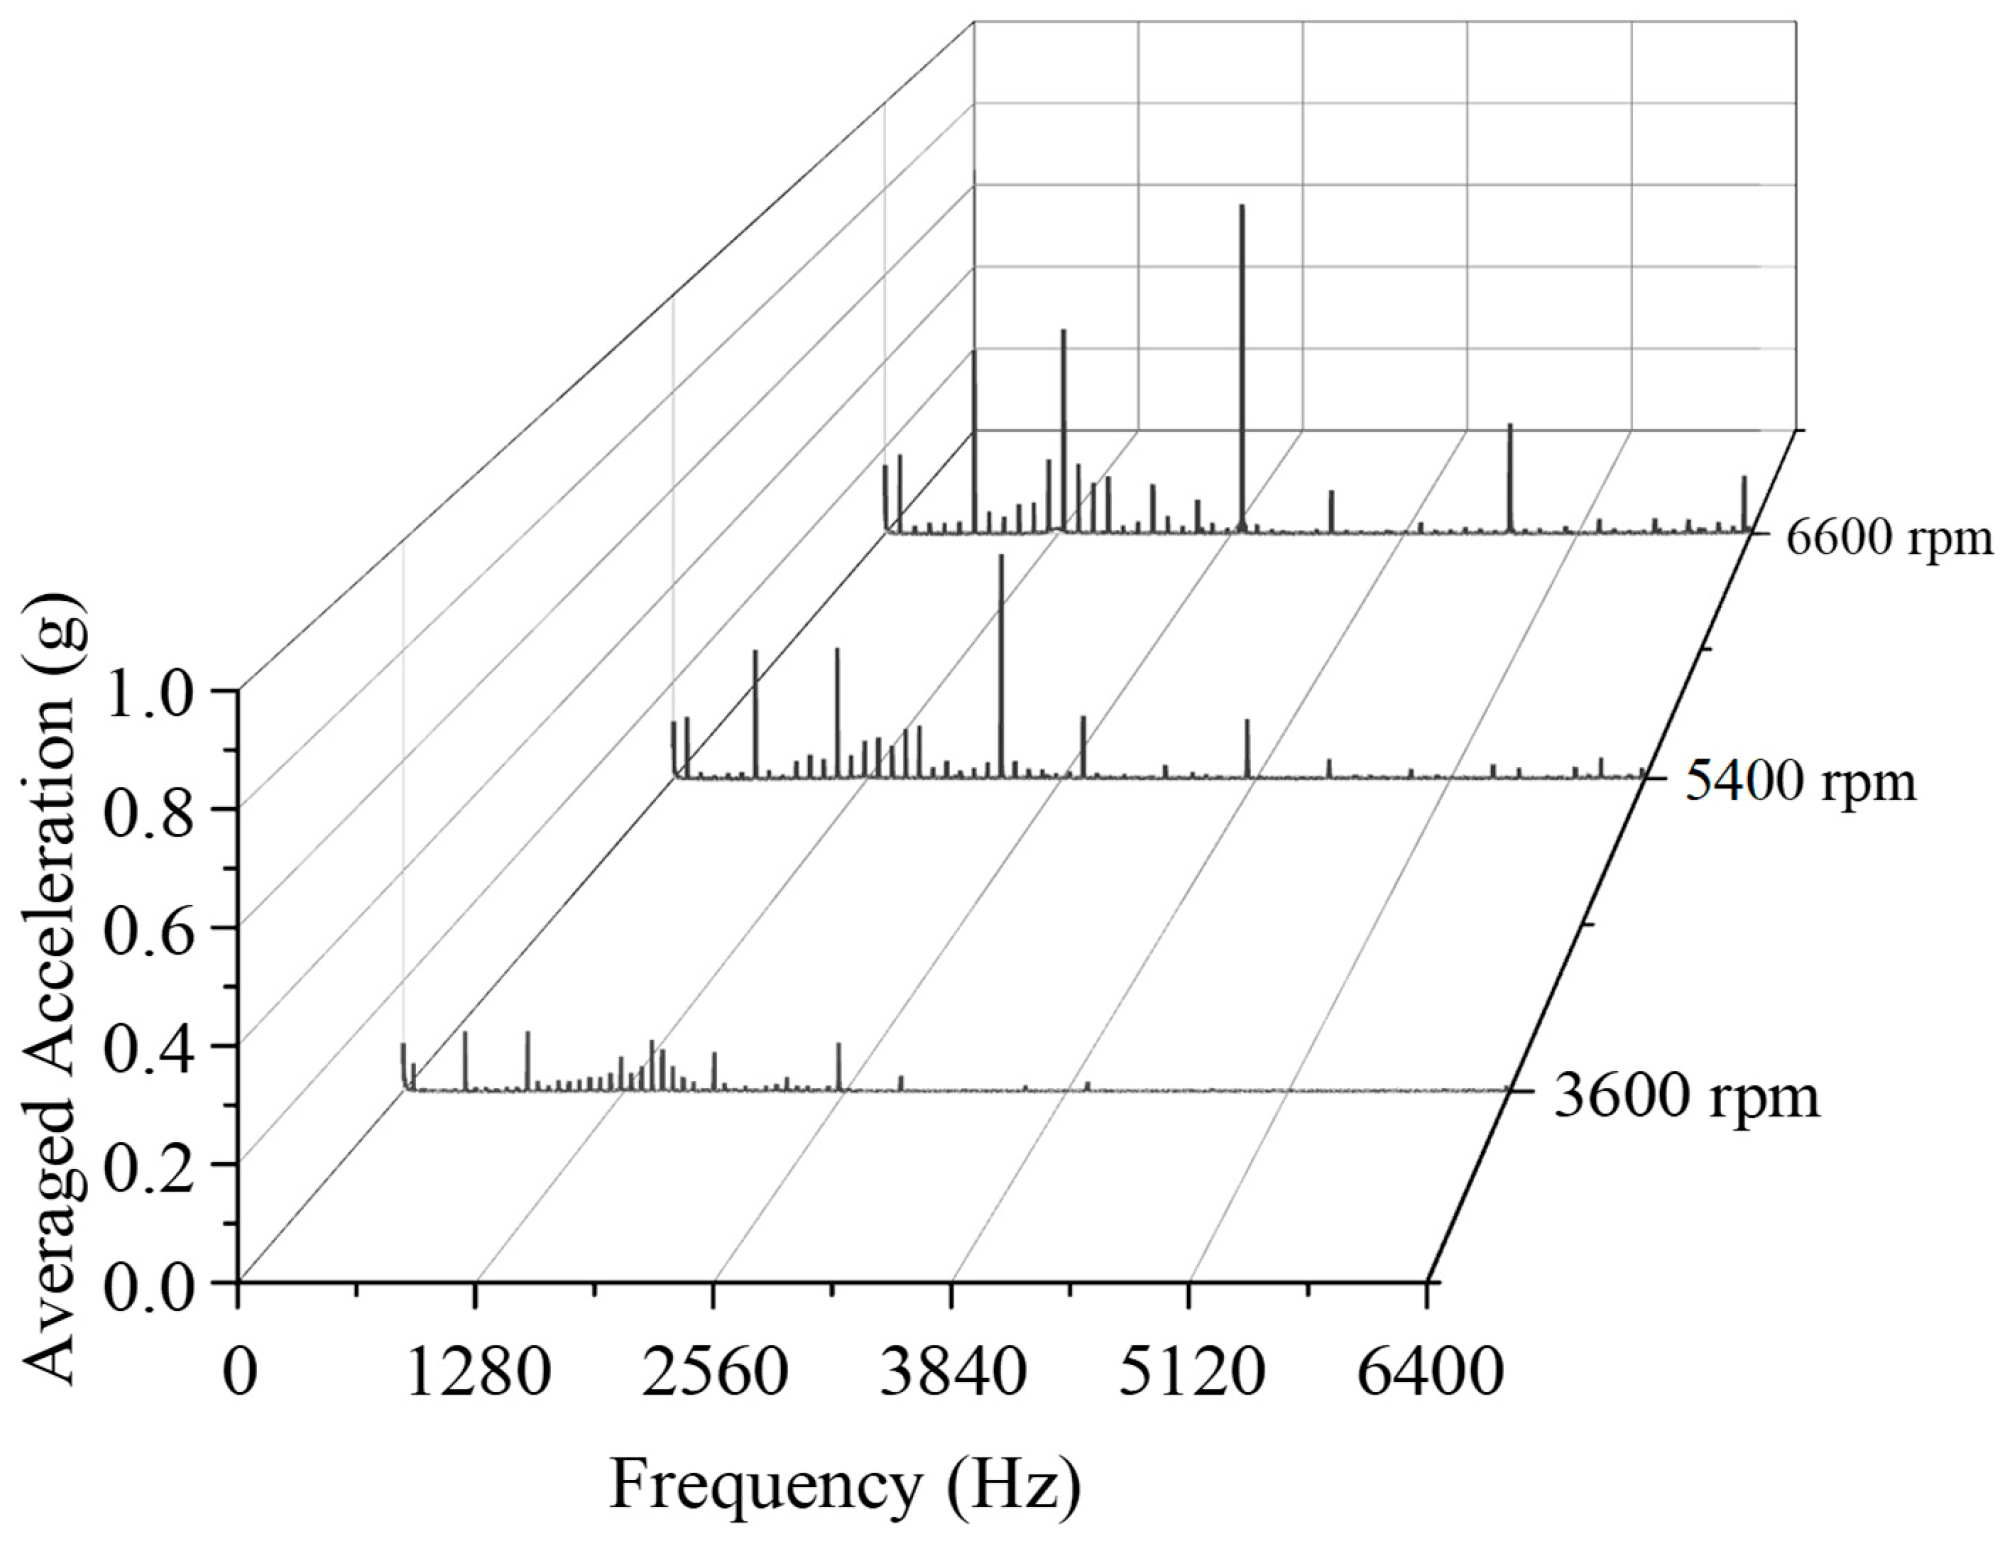
The RMS energy-averaged spectrum across the four measurement points in Figure 15 reveals two key findings. First, as the rotational speed increases, the overall vibration acceleration at the housing measurement points also rises significantly. Under energy averaging, the electromagnetic harmonic orders 6f, 12f, 24f, and 42f undergo a linear frequency shift with rotational speed, confirming the conservation of harmonic orders under variable-speed conditions—a fundamental characteristic that distinguishes electromagnetic excitation from aerodynamic noise. Second, the energy-averaged processing effectively smooths out abnormal amplitude fluctuations caused by local modal differences, such as the 1440 Hz component at measurement point S2 under the 3600 rpm condition, thereby better representing the overall vibration level of the housing at the compressor motor location.
Figure 15.
Average vibration spectra of the measurement points under different rotational speeds (four-point RMS energy average).
Meanwhile, despite the presence of non-electromagnetic components such as 1500 Hz (25f) and 2700 Hz (30f), as well as interference from the 1f rotational frequency, electromagnetic harmonics remain the dominant energy contributor under all three operating conditions. Notably, the 24f electromagnetic harmonic contributed a relatively low amplitude of about 0.1 g at 3600 rpm, whereas it was amplified to over 0.4 g at 5400 rpm and over 0.8 g at 6600 rpm. This quantitatively confirms the speed-dependent modal excitation effect.
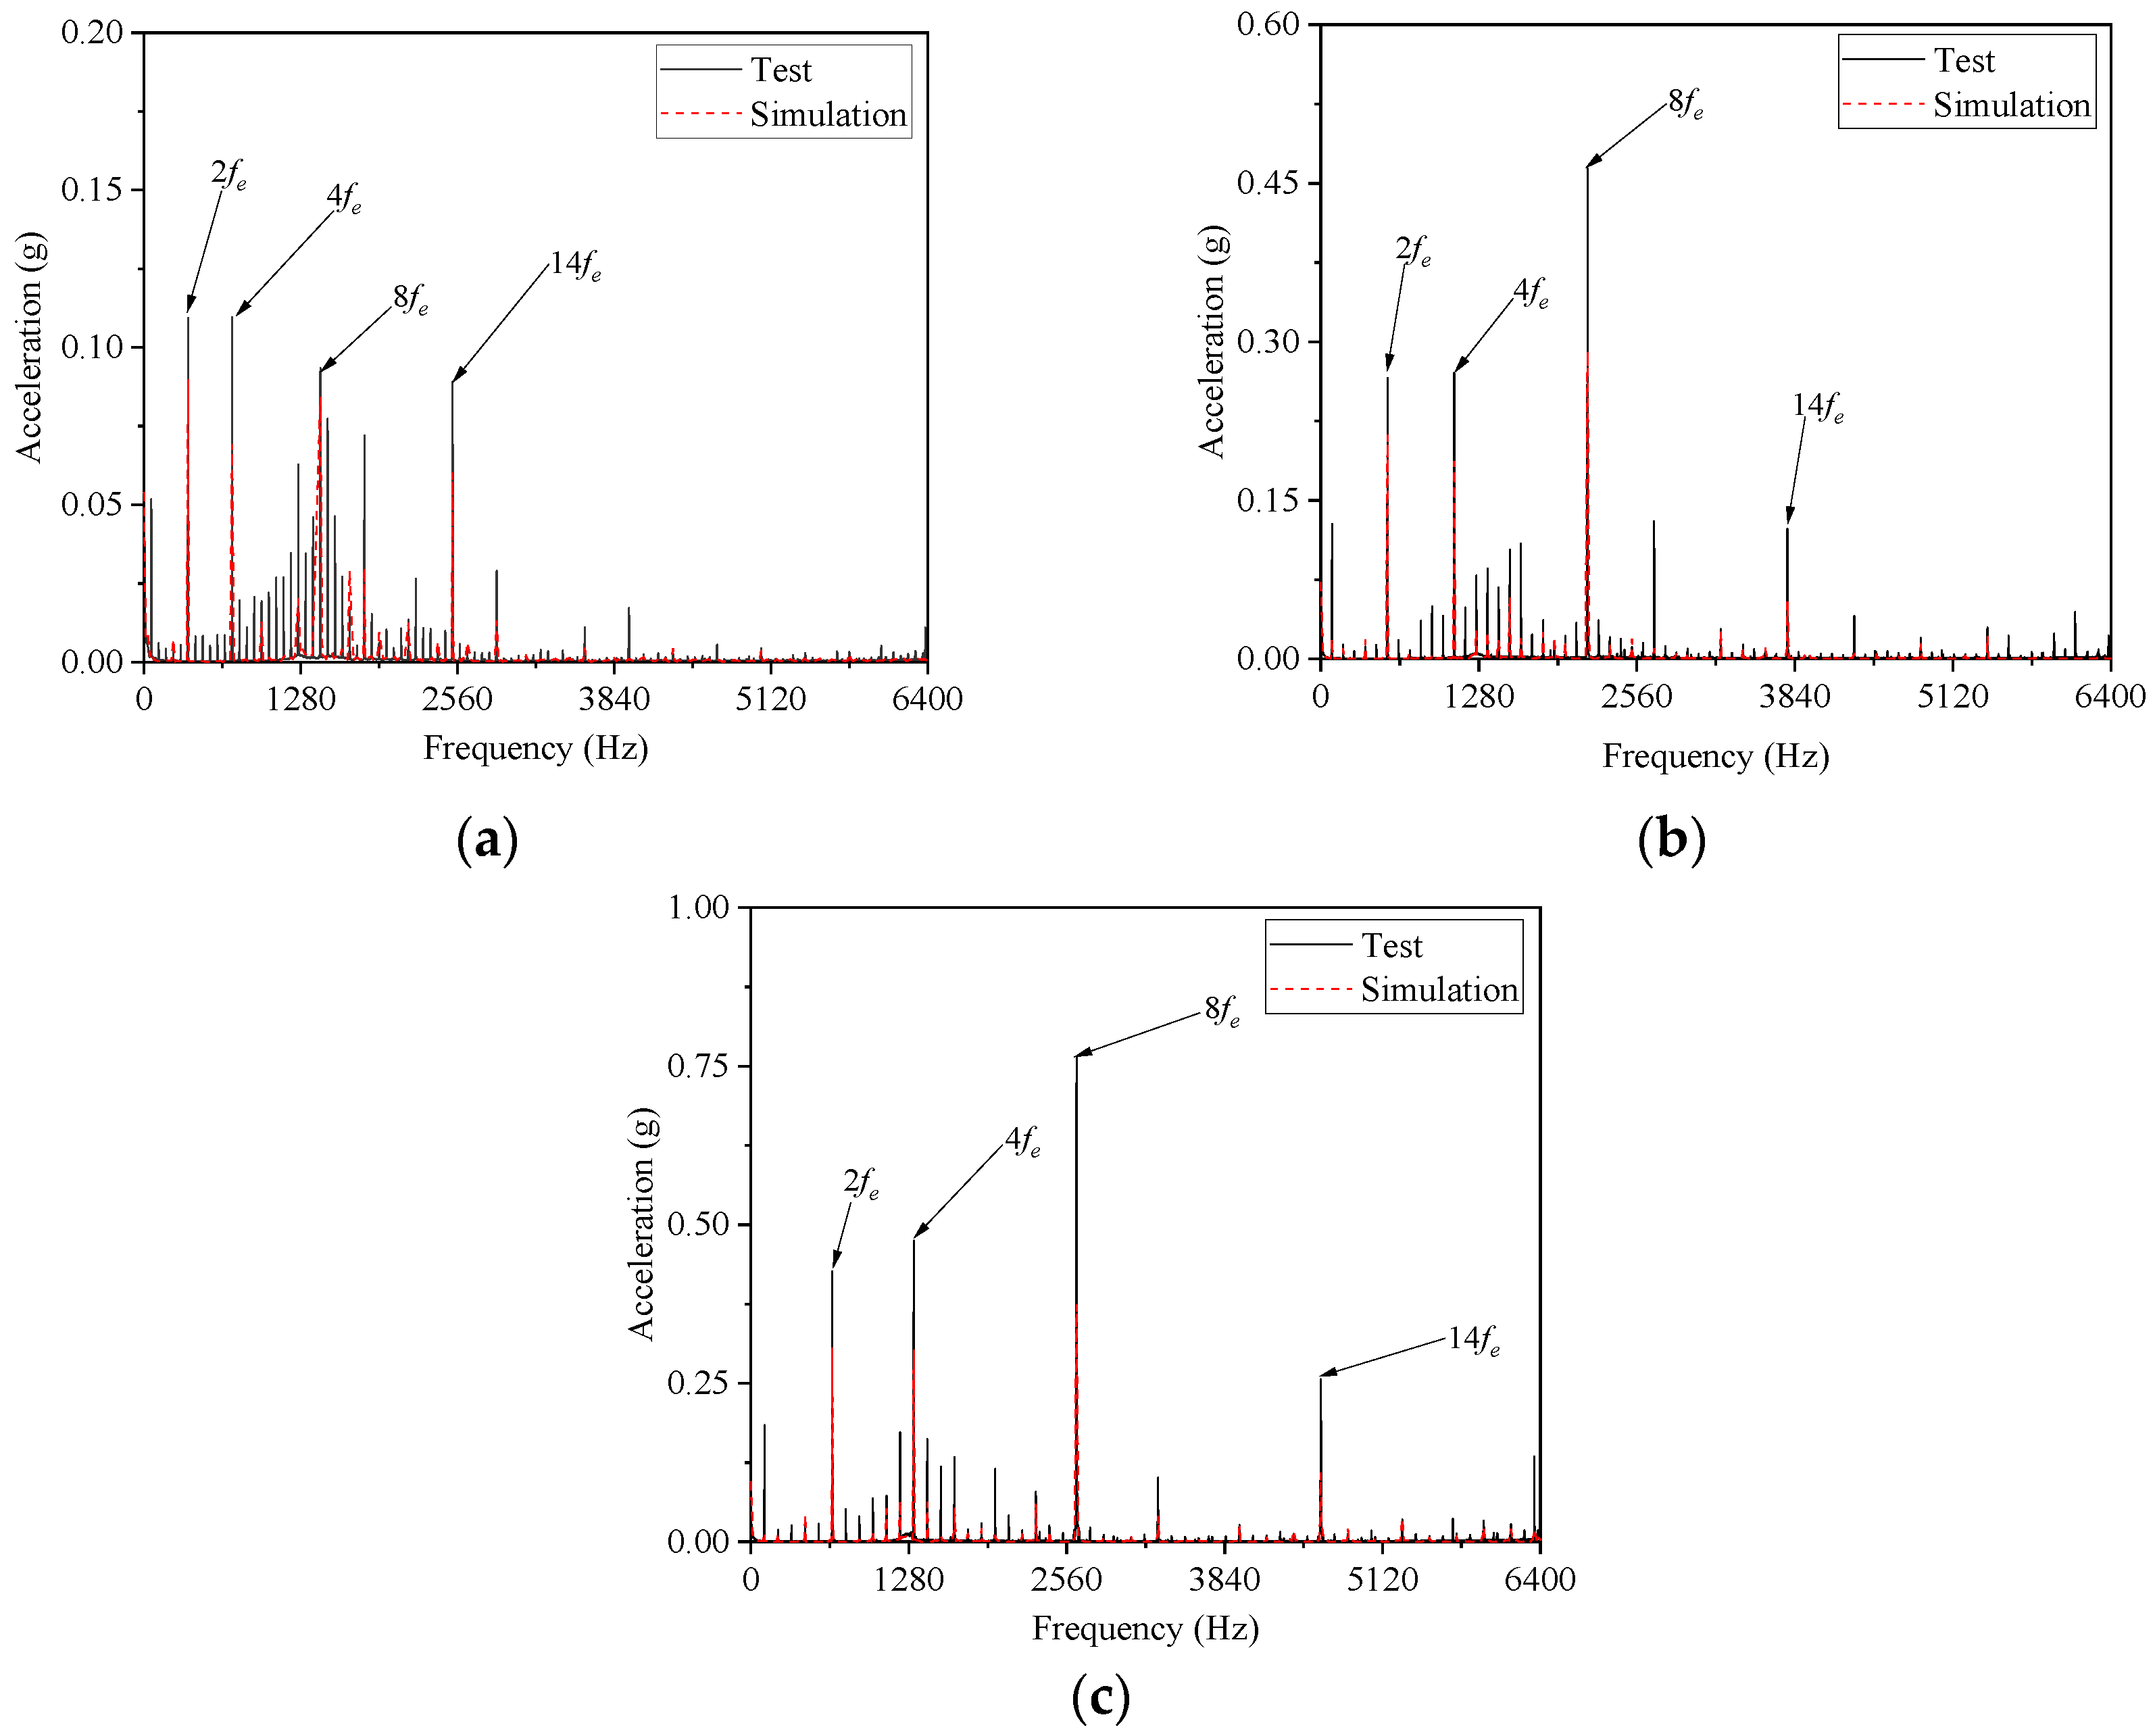
As shown in the comparative spectra of Figure 16, a comparison between the simulated housing accelerations extracted at various rotational speeds and the RMS energy-averaged experimental results reveals that the simulation predicts electromagnetic harmonic frequencies at 2fe, 4fe, 8fe, and 14fe (where fe is the electrical frequency, and f denotes the fundamental mechanical frequency with fe = 3f), and the amplitude trends are in reasonable agreement. Meanwhile, the experimental results contain peaks in the low-frequency range and at certain high frequencies that are not captured by the simulation, indicating that other non-electromagnetic components are indeed present. These deviations are attributed to aerodynamic and mechanical excitation sources, and they do not compromise the validity of the model.
Figure 16.
Comparison of vibration spectra between simulation and experiment: (a) 3600 rpm; (b) 5400 rpm; (c) 6600 rpm.
4.2. Noise Results Analysis and Comparison
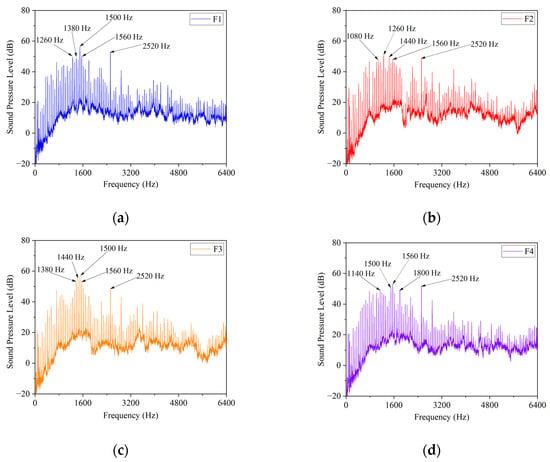
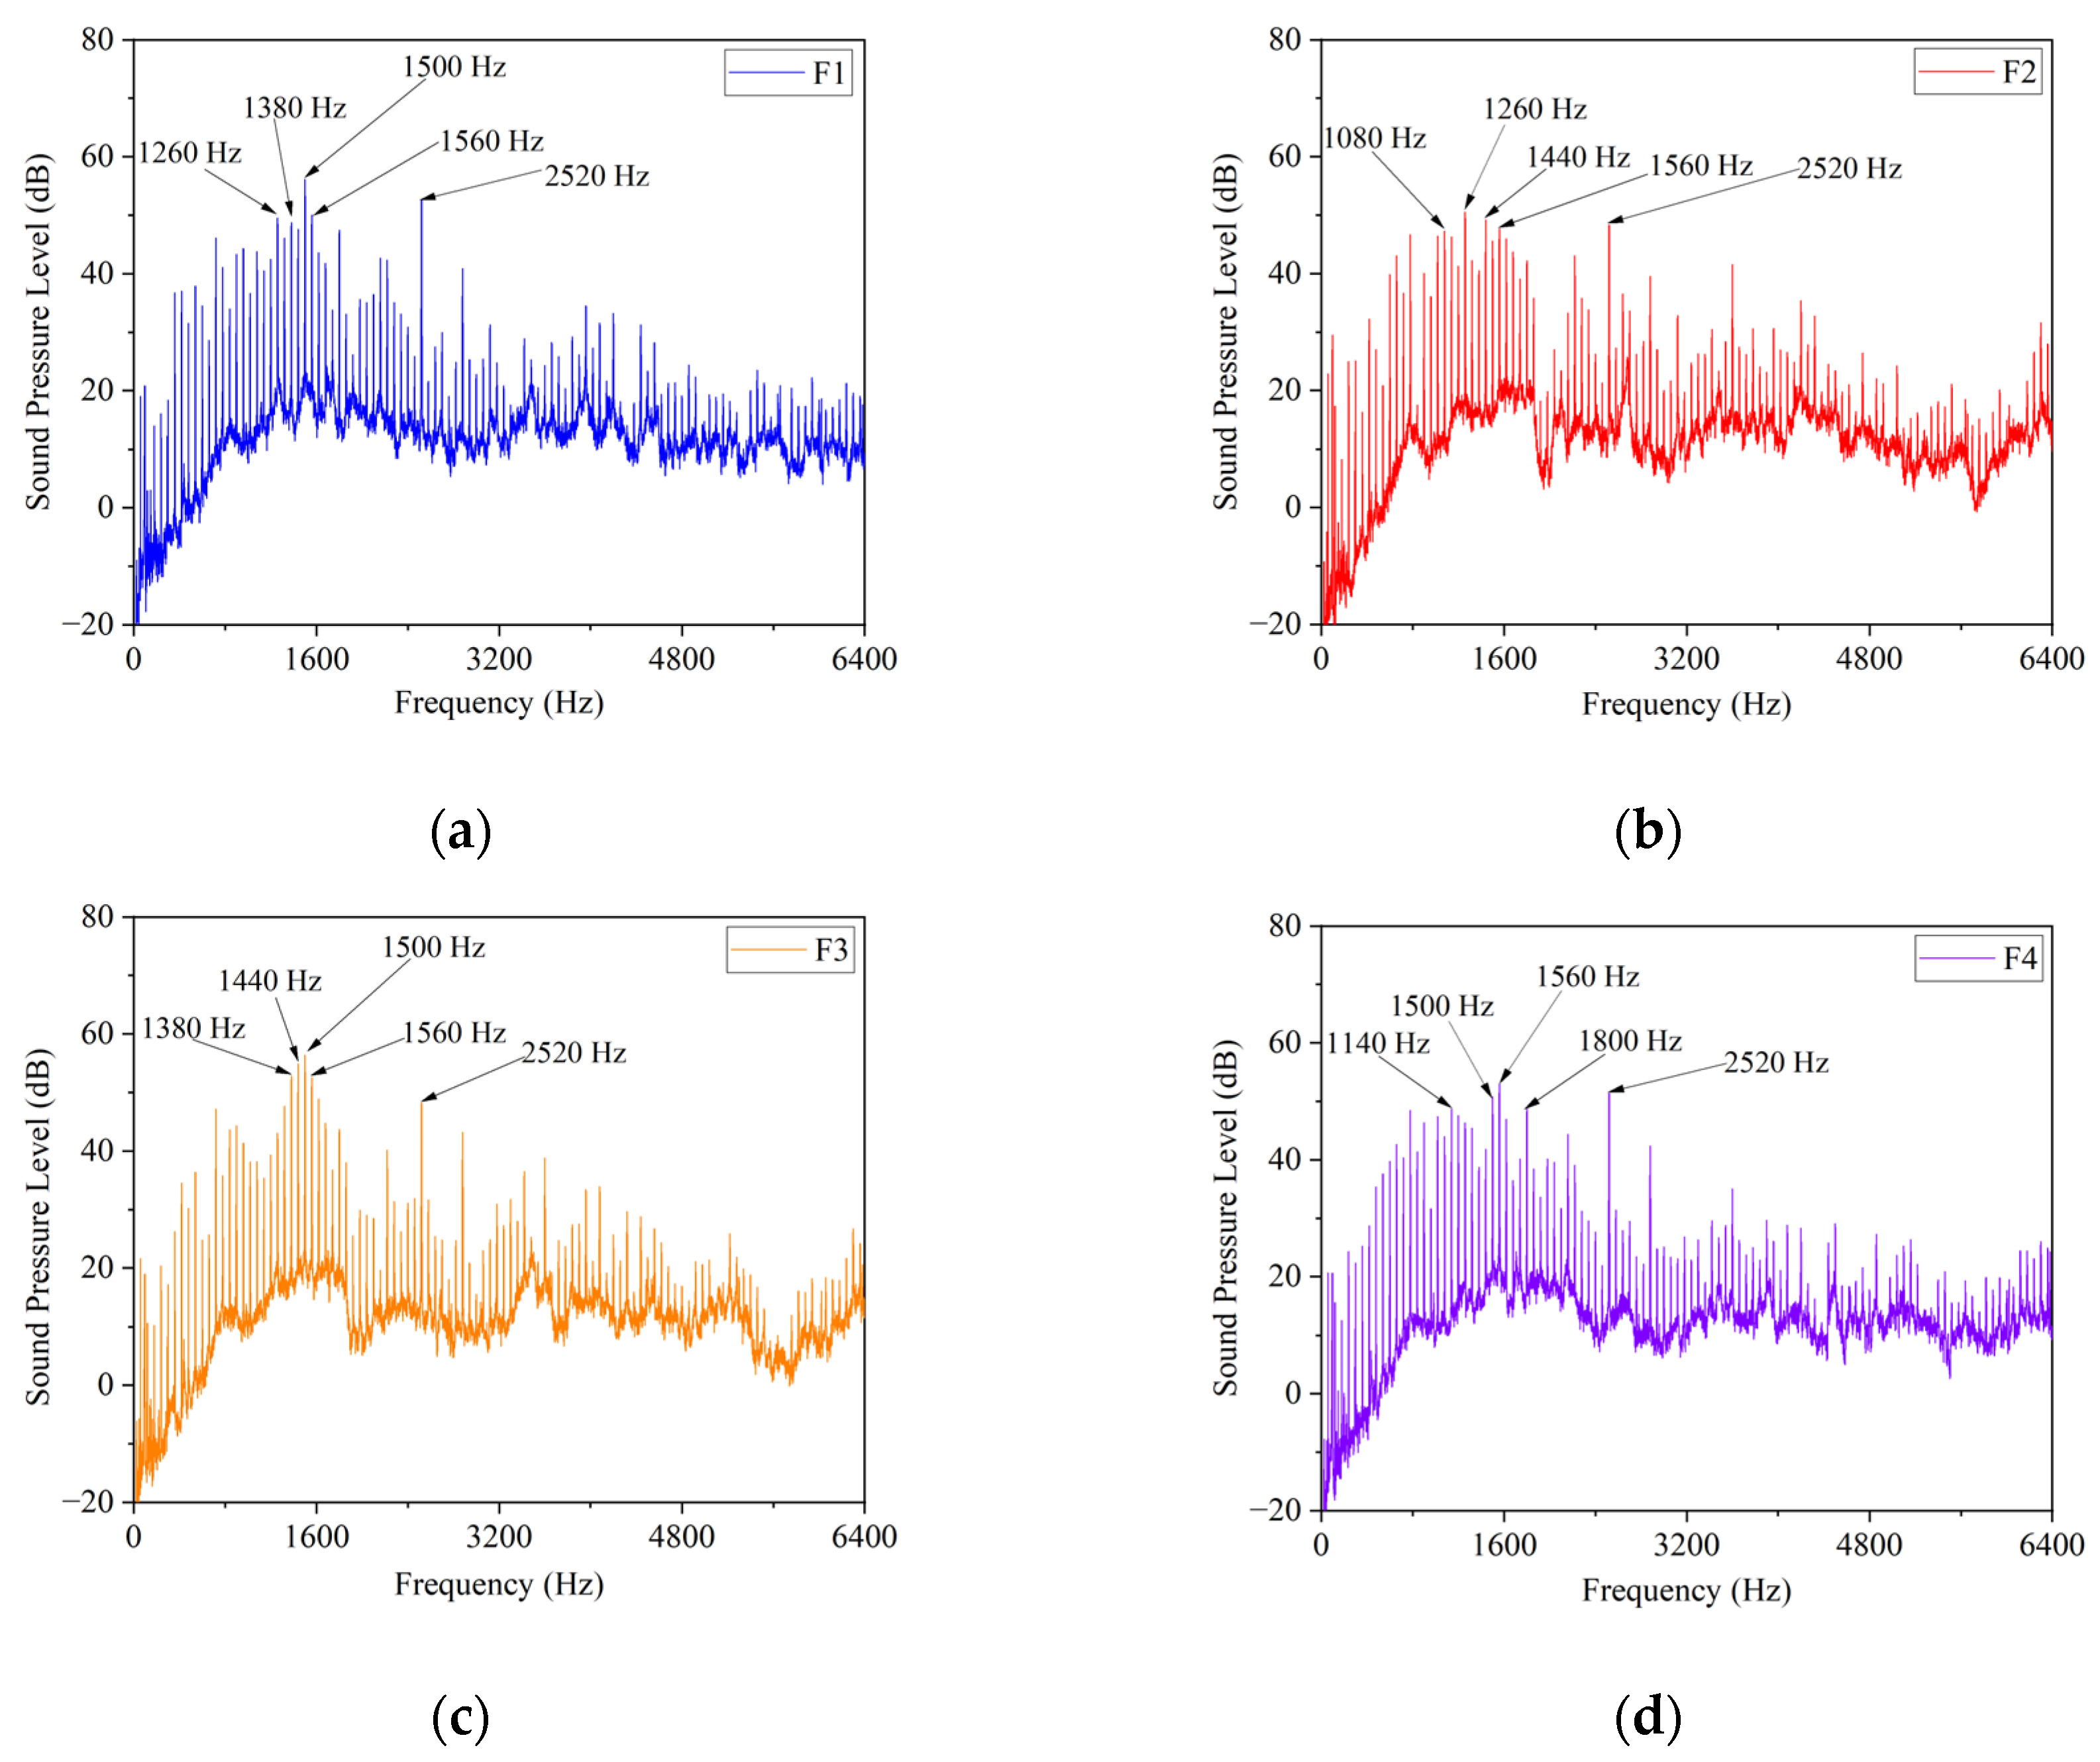
Corresponding to the vibration characteristics, the sound pressure level spectra of the four measurement planes at 3600 rpm are plotted in Figure 17. As shown in the figure, a pair of frequency components at 1500 Hz (25f) and 1560 Hz (26f) appears in all four measurement planes, separated by just one rotational frequency, and forms a globally dominant pair of closely spaced peaks. In plane F3, a slot passing frequency harmonic appears at 1440 Hz (24f), accompanied by sidebands such as 1620 Hz (27f). In plane F4, higher-order harmonics at 1800 Hz (30f) and 2520 Hz (42f) are present. The sideband distribution of these non-fundamental electromagnetic frequencies indicates that the electromagnetic force waves exhibit spatially non-uniform radiation characteristics. The distribution of sidebands around integer multiples of the fundamental electromagnetic frequency (6f), such as 1080 Hz (18f) observed on measurement surface F2 and 1260 Hz (21f) on F1, further confirms the path dependence of electromagnetic excitation transmitted to the discharge end through the housing structure. The spectral differences among different measurement surfaces reflect the selective amplification of electromagnetic force waves by local housing modes.
Figure 17.
Sound pressure level spectra of four measurement planes at 3600 rpm: (a) F1; (b) F2; (c) F3; (d) F4.
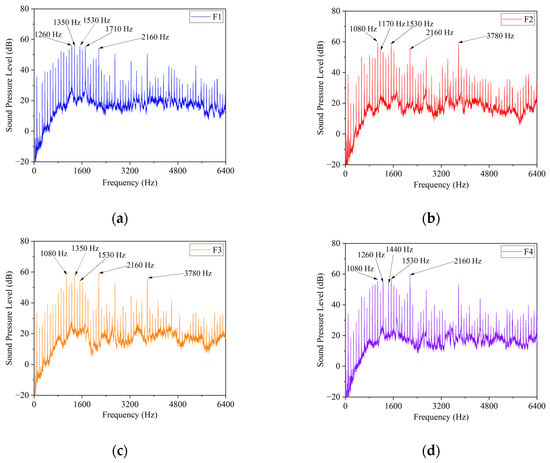
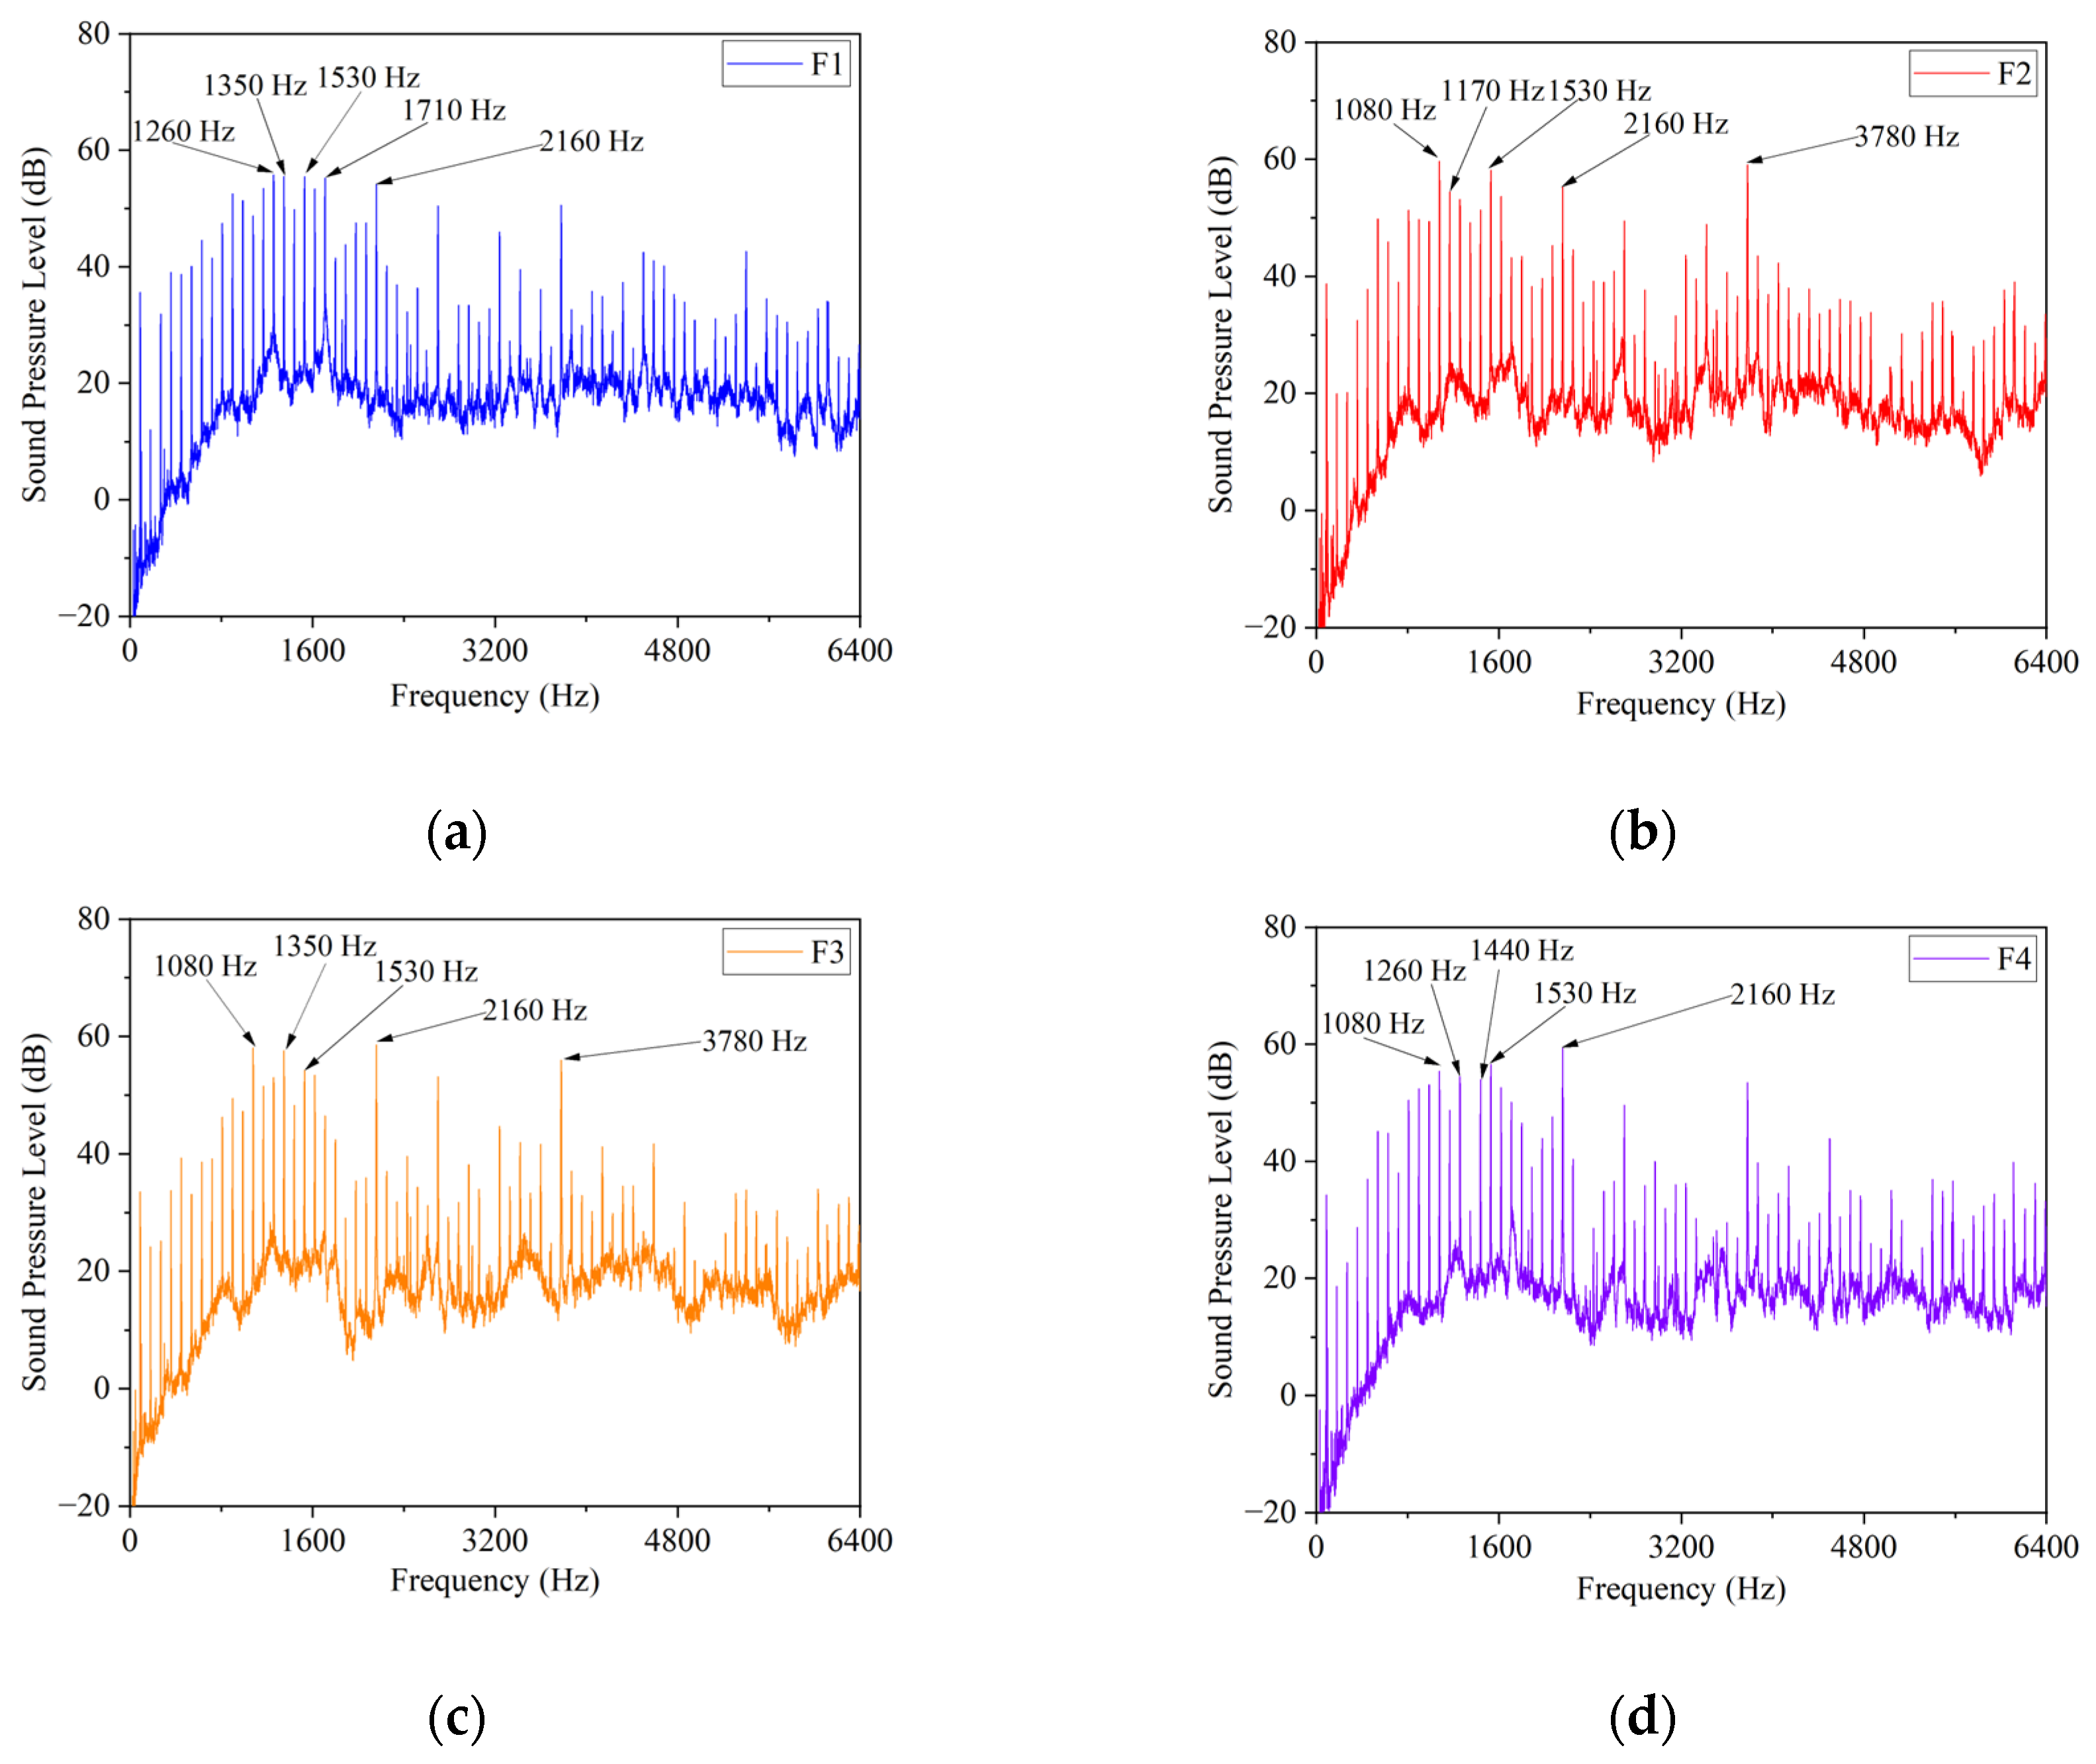
Upon increasing the rotational speed to 5400 rpm, the sound pressure level spectra of the four measurement planes are depicted in Figure 18, revealing a shift in the dominant peaks and an extension toward higher frequencies. In contrast to the closely spaced double peaks observed in the previous operating condition, the 1530 Hz (17f) component appears in all four measurement planes under this condition, with a sound pressure level of approximately 60 dB. The 2160 Hz (24f) component, a slot harmonic, evolved from a localized feature at measurement planes F2 and F3 at 3600 rpm to a full-coverage phenomenon across all four planes, accompanied by a corresponding increase in sound pressure level of approximately 3 dB, indicating that as the rotational speed increases, the electromagnetic excitation energy undergoes a transition from local modal excitation to global structural response. In the high-frequency region, the 3780 Hz (42f) component exhibits a significantly contributing radiated peak at measurement planes F2 and F3, reflecting the linear conservation relationship between electromagnetic harmonic frequencies and rotational speed; that is, the electromagnetic harmonic frequency increases synchronously by a factor of 1.5 with the rotational speed. Meanwhile, in the low-frequency range, the spectral distribution becomes sparser as the rotational speed increases, and the sideband features of the electromagnetic fundamental wave appear around 1080 Hz (12f) at measurement planes F2, F3, and F4. This evolution from local dominance to global coverage indicates that, as the rotational speed increases, the matching range between the spatial orders of electromagnetic force waves and the housing modes broadens, causing the vibration energy to spread from localized resonance points across the entire housing surface.
Figure 18.
Sound pressure level spectra of four measurement planes at 5400 rpm: (a) F1; (b) F2; (c) F3; (d) F4.
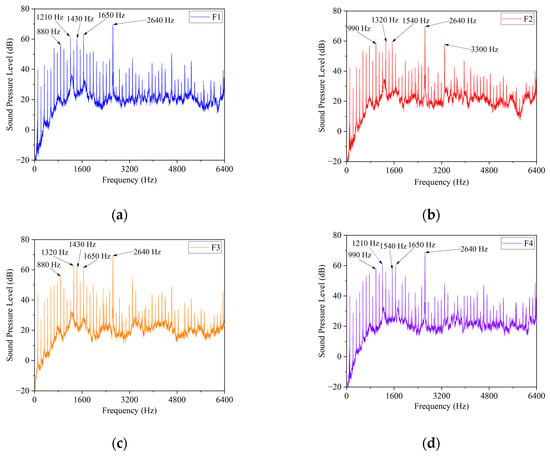
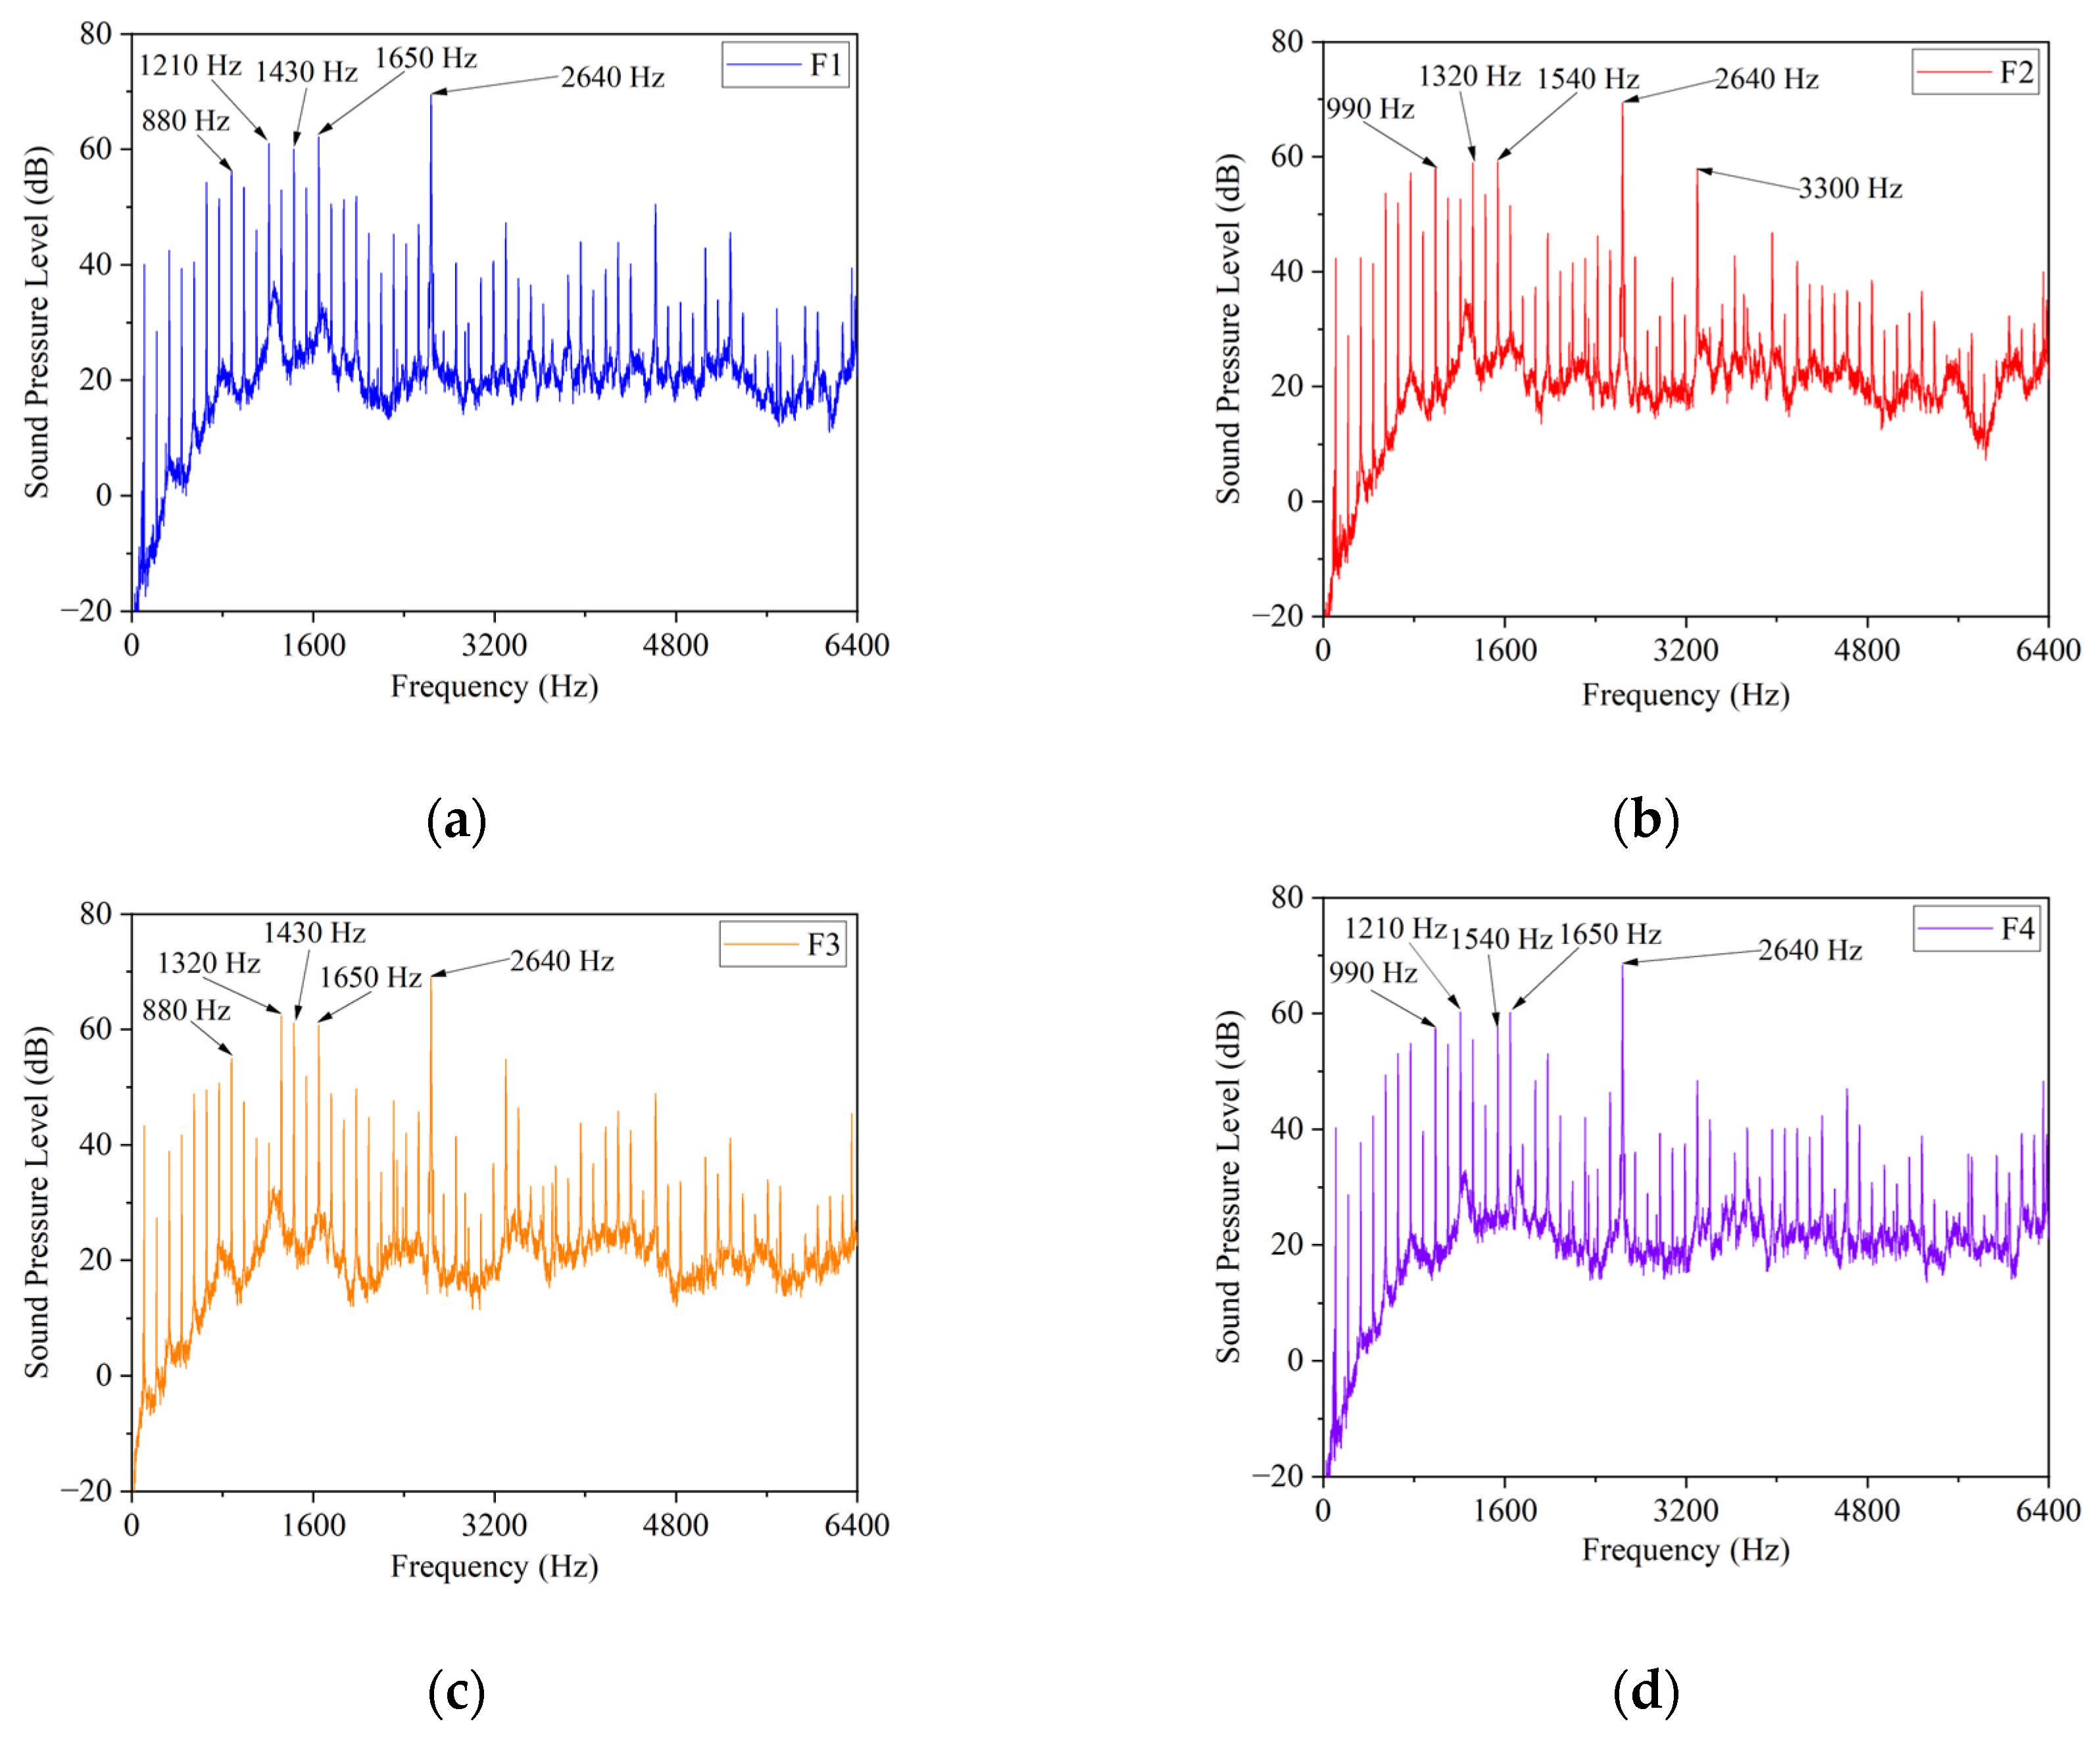
A further rise in rotational speed to 6600 rpm yields the sound pressure level spectra shown in Figure 19. Under this operating condition, the 2640 Hz (24f) slot harmonic exhibits the same characteristic as that at 5400 rpm, appearing in the spectra of all four measurement planes and forming an absolutely dominant peak that suppresses other frequency components. In the low-frequency range, dominant frequency components appear at 990 Hz (9f) and 880 Hz (8f), while in the high-frequency range, the 3300 Hz (30f) component observed at measurement plane F2. This single-frequency absolute dominance stands in stark contrast with the multi-peak competition characteristic observed at 5400 rpm and is consistent with the vibration spectra in Figure 14, indicating that under the 6600 rpm condition, the 24f electromagnetic harmonic has reached a strong resonance matching condition with the structural modes of the housing. Meanwhile, the spectral patterns at the four measurement surfaces tend to converge, and the spatial distribution differences are significantly reduced compared with the previous operating condition, indicating that as the rotational speed increases, the dominant frequency of electromagnetic excitation gradually converges to a specific mode, and the housing response shifts from multi-modal competition to single-mode resonance control.
Figure 19.
Sound pressure level spectra of four measurement planes at 6600 rpm: (a) F1; (b) F2; (c) F3; (d) F4.
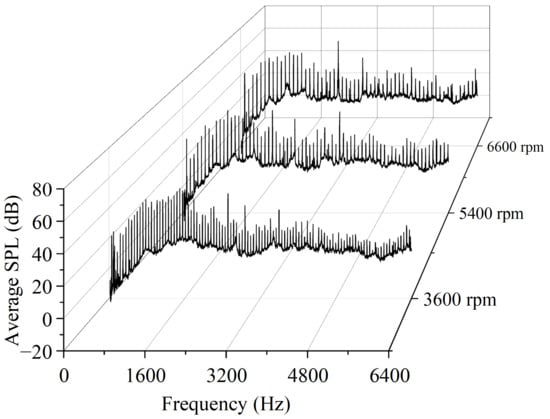
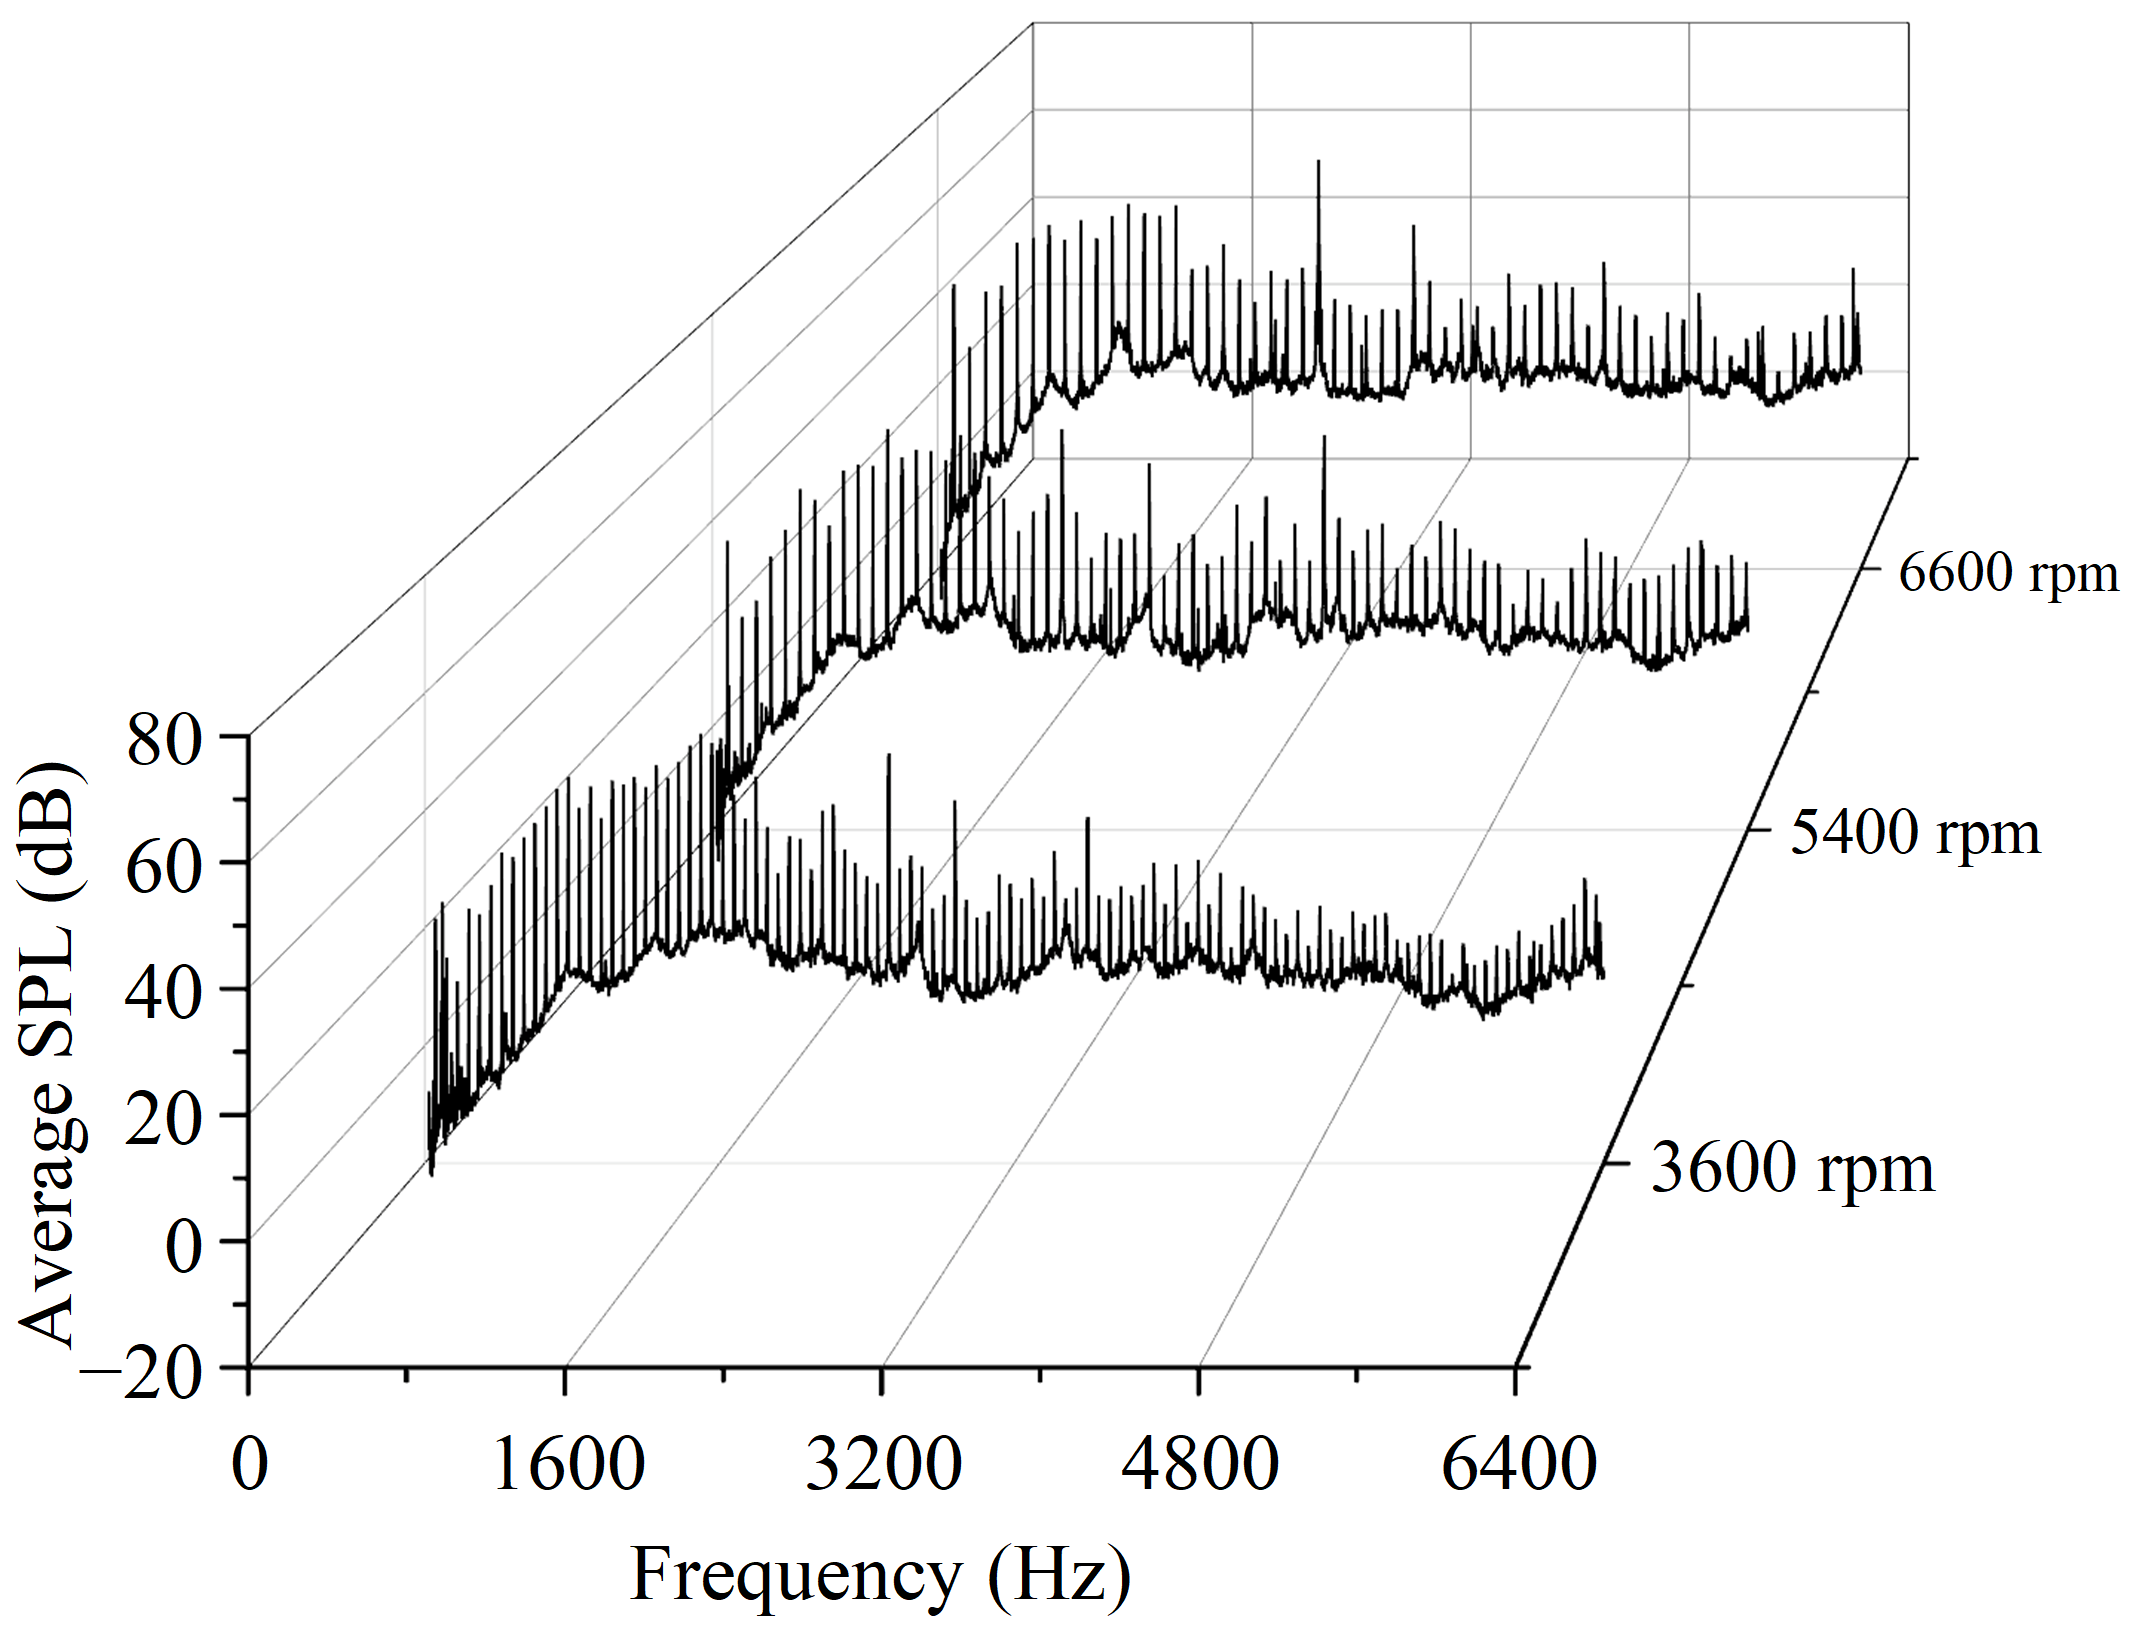
Similarly, to evaluate the overall noise level of the scroll compressor, Figure 20 adopts a logarithmic-domain averaging of the acoustic energy from the four measurement planes, as opposed to the RMS averaging used for vibration acceleration. The average sound pressure level (SPL) at each frequency point and operating speed is computed using Equation (10):
where is the sound pressure level at the i-th measurement plane and frequency f.
Figure 20.
Average sound pressure level spectra of the compressor at different rotational speeds (four-plane acoustic energy average).
By averaging the acoustic energy in the logarithmic domain, this method better aligns with the inherently nonlinear superposition of sound intensity and thus provides a more representative measure of the compressor’s overall noise level.
In contrast to the discrete peak characteristics of the vibration acceleration spectra in Figure 15, the sound pressure level spectra in Figure 20 exhibit a broadband continuous distribution. This difference arises from the frequency-dependent radiation efficiency of the housing structure; specifically, the housing acts as an inefficient radiator in the low-frequency range, causing vibration energy to concentrate at discrete electromagnetic harmonics, whereas the acoustic energy is spread over a broader frequency band. Both the vibration and the sound pressure level increase with rotational speed; however, the logarithmic compression of the averaged sound pressure level visually masks the actual amplification of the radiated acoustic energy. These findings reveal a fundamental distinction between the vibration and noise characteristics of the scroll compressor: vibration retains discrete electromagnetic harmonic features, whereas noise exhibits broadband behavior due to the modal radiation characteristics of the housing.
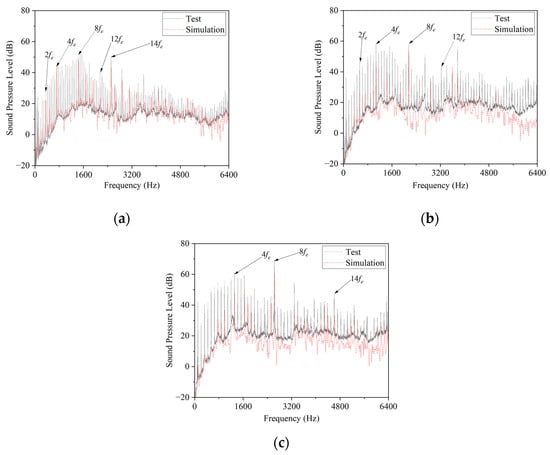
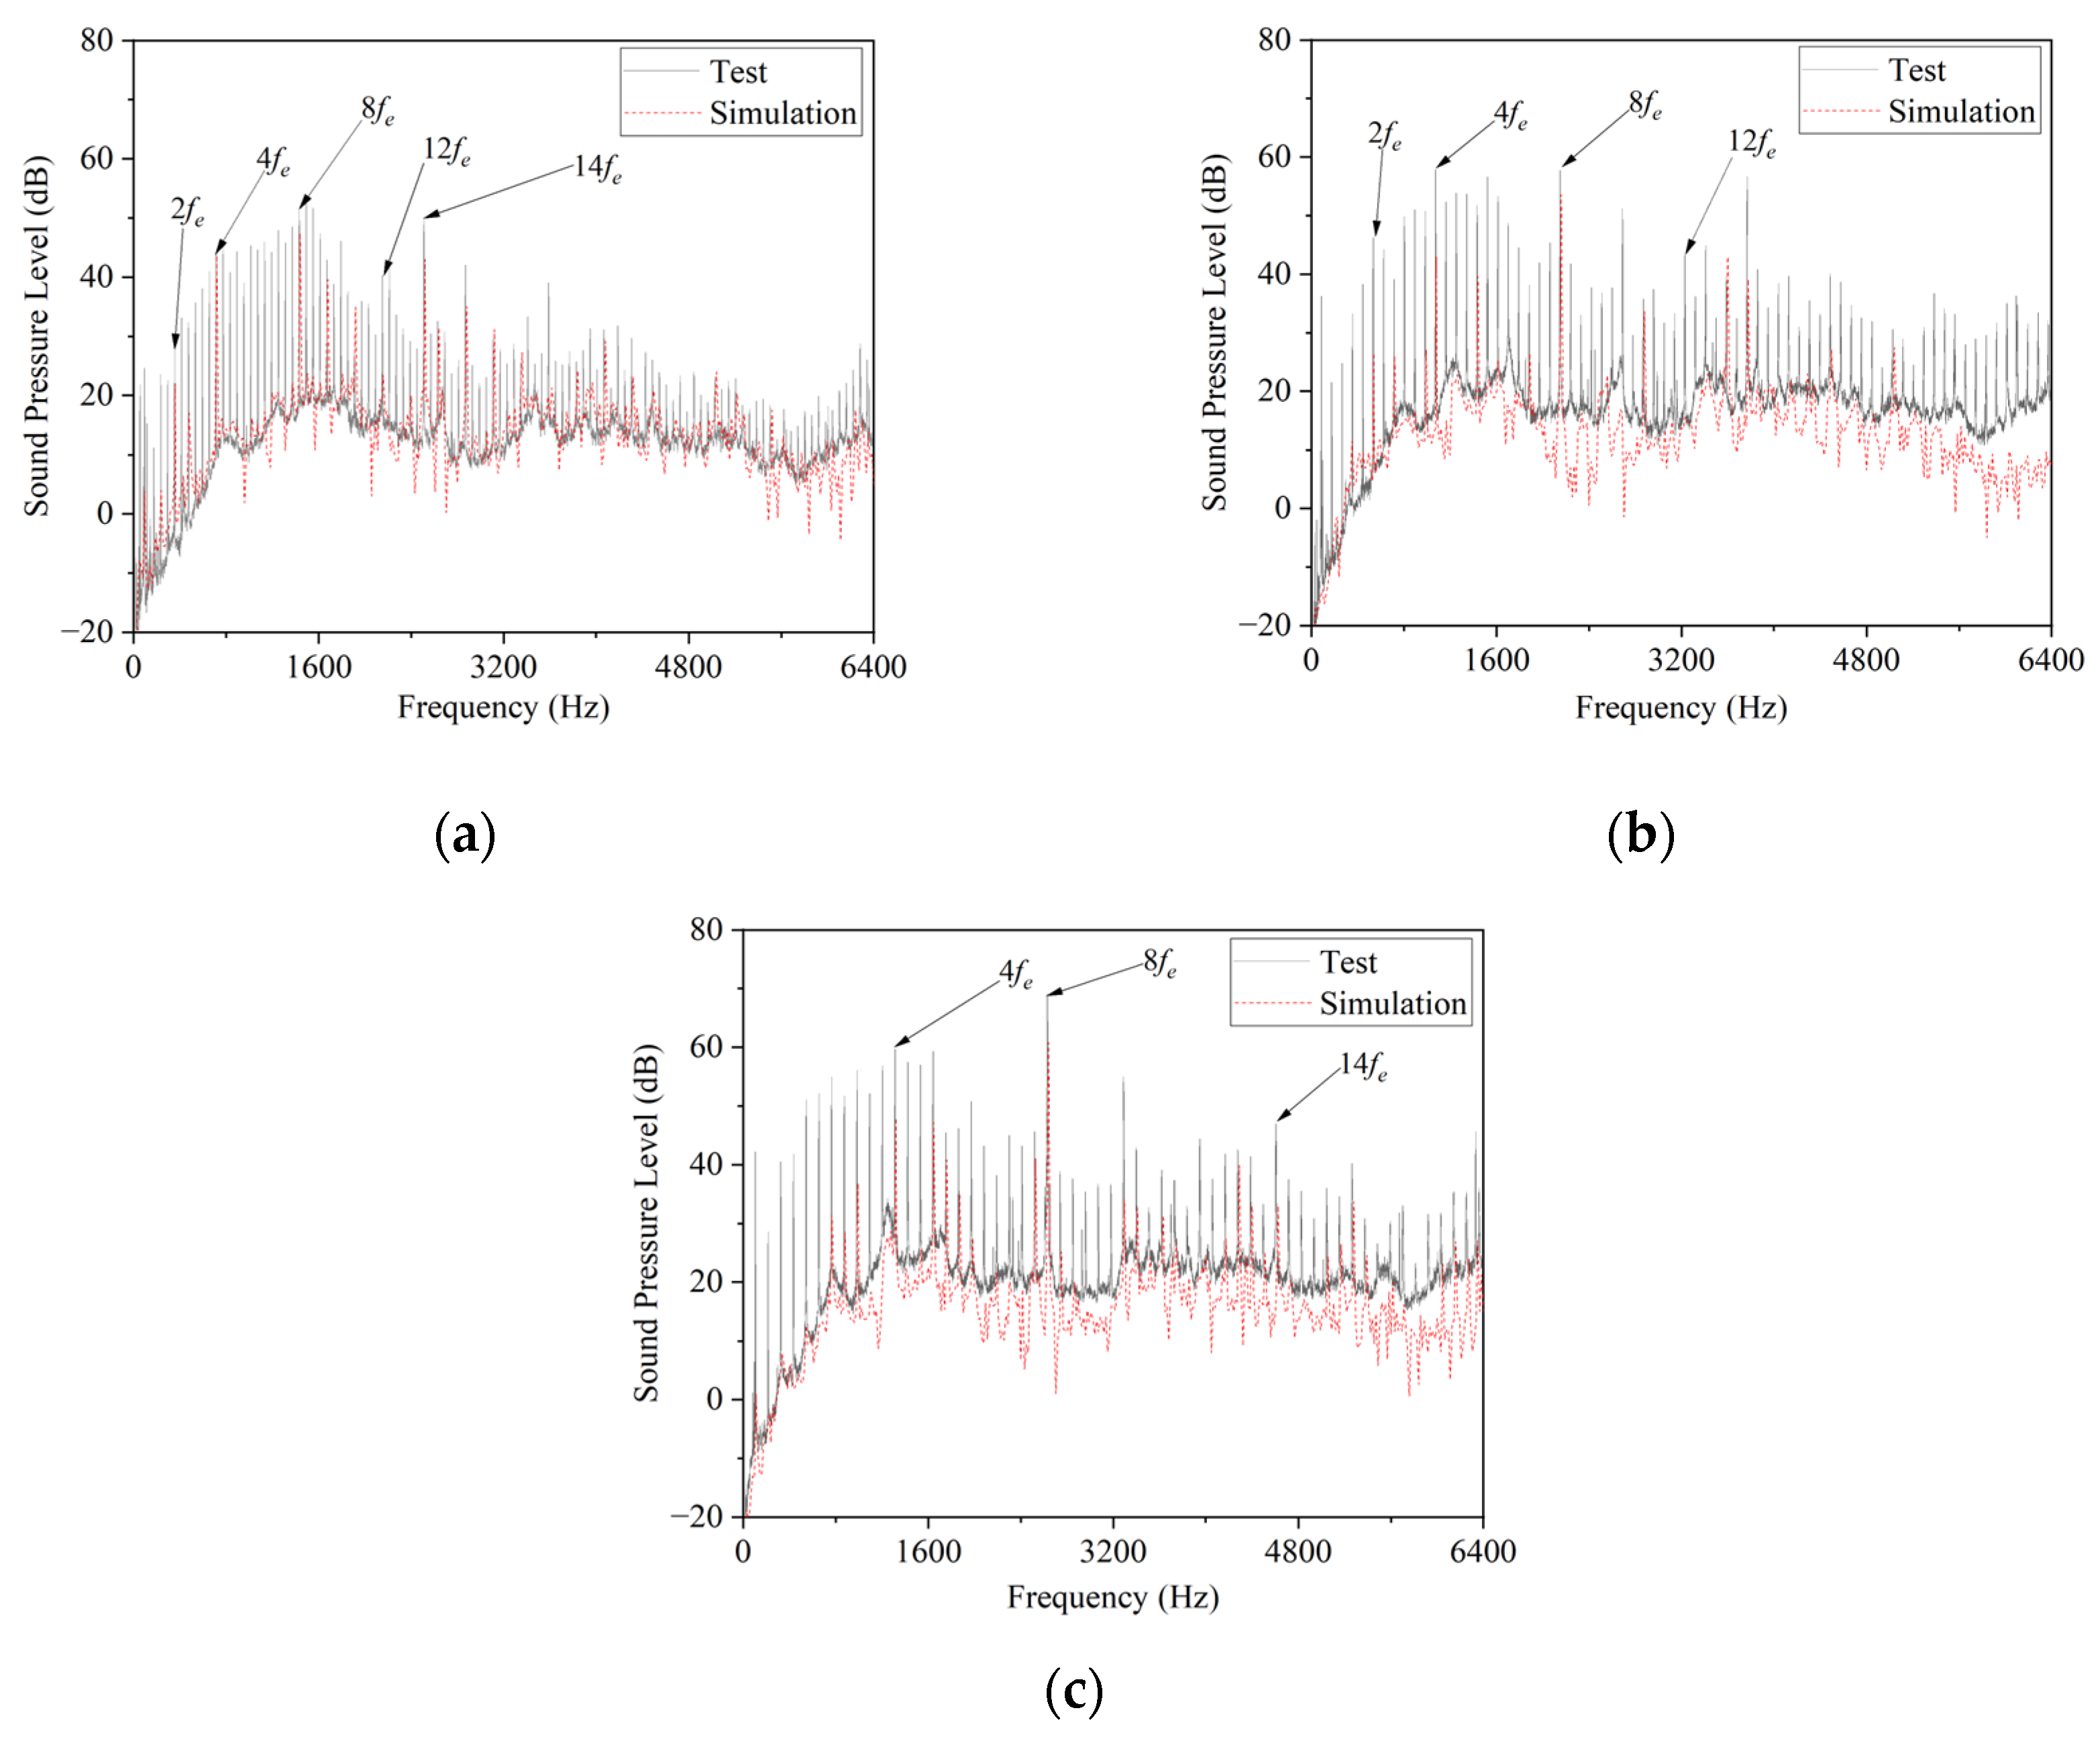
For validation of the coupled electromagnetic-acoustic model, a quantitative comparison between the simulated and experimental noise spectra is provided in Figure 21. The comparative experimental data were extracted from the acoustic energy-averaged spectra at the three rotational speeds shown in Figure 20. Comparison of Figure 16 and Figure 21 reveals that electromagnetic force harmonics such as 4fe and 8fe appear as prominent peaks in both the vibration and noise spectra. As the rotational speed increases from 3600 to 6600 rpm, higher-order harmonics such as 8fe and 12fe become more prominent in the vibration spectra, whereas the noise remains dominated by the 4fe peak, indicating that the response efficiency of structural acoustic radiation to electromagnetic force waves of different spatial orders differs markedly. The dominant peak frequencies obtained from the simulation agree well with the experimental results, confirming that the model can effectively predict the electromagnetic vibration and noise characteristics under variable-speed conditions. However, discrepancies in certain frequency bands indicate that the influence of other coupling effects cannot be overlooked.
Figure 21.
Comparison of noise spectra between simulation and experiment: (a) 3600 rpm; (b) 5400 rpm; (c) 6600 rpm.
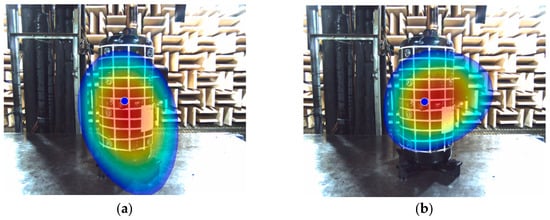
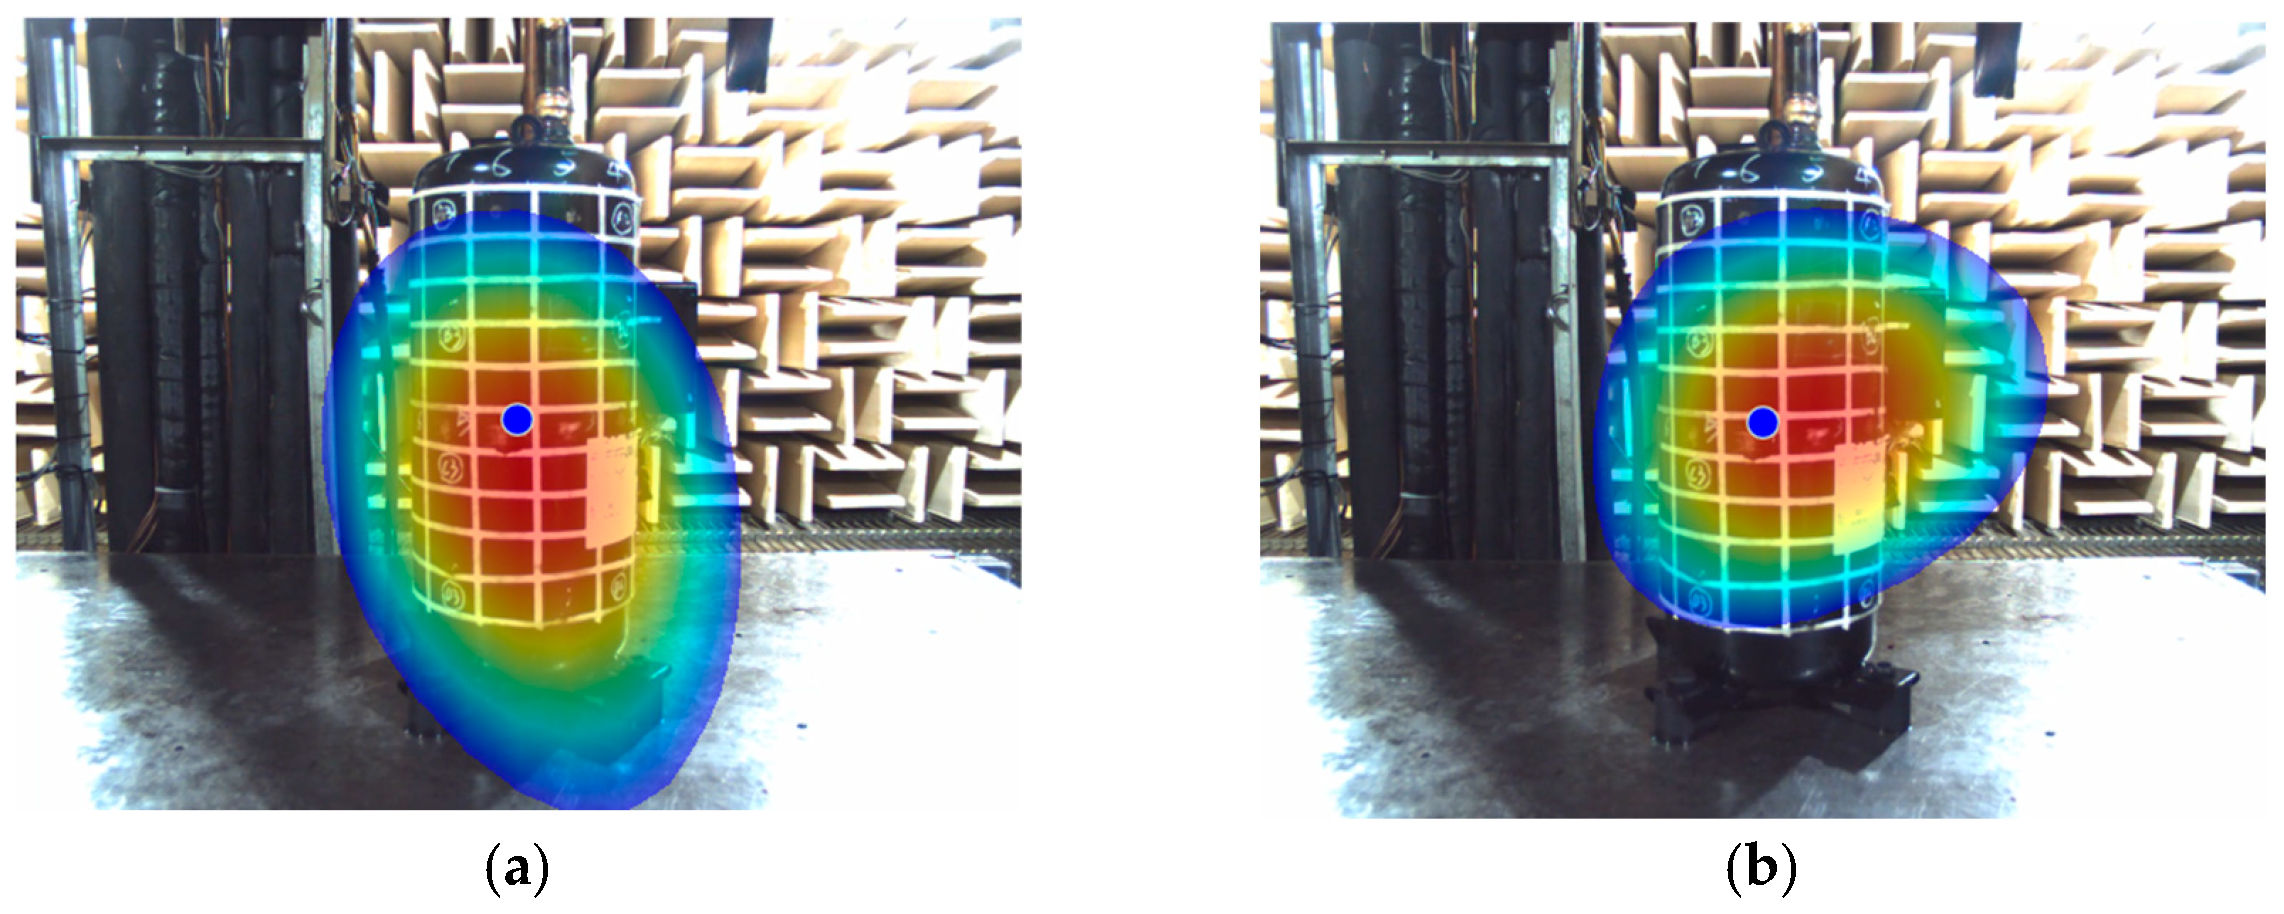
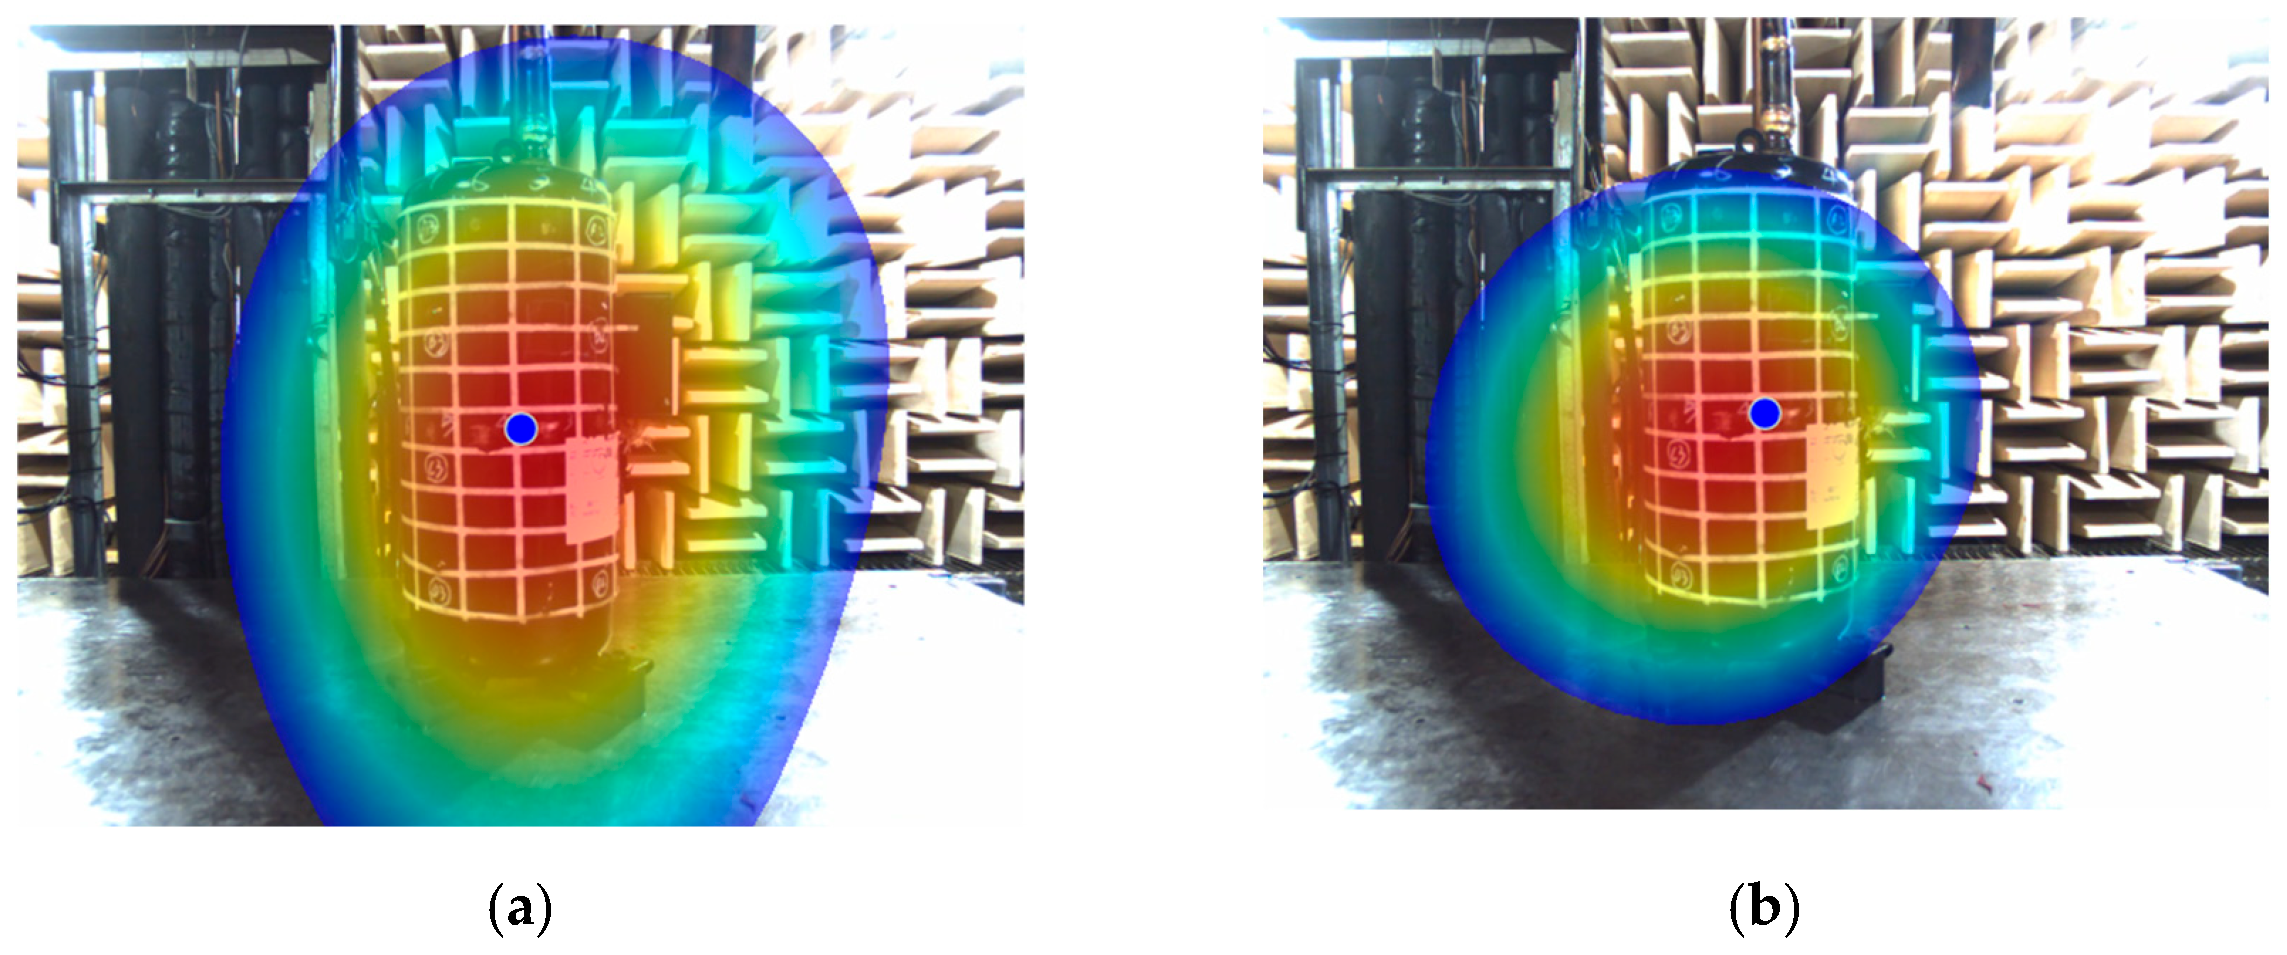
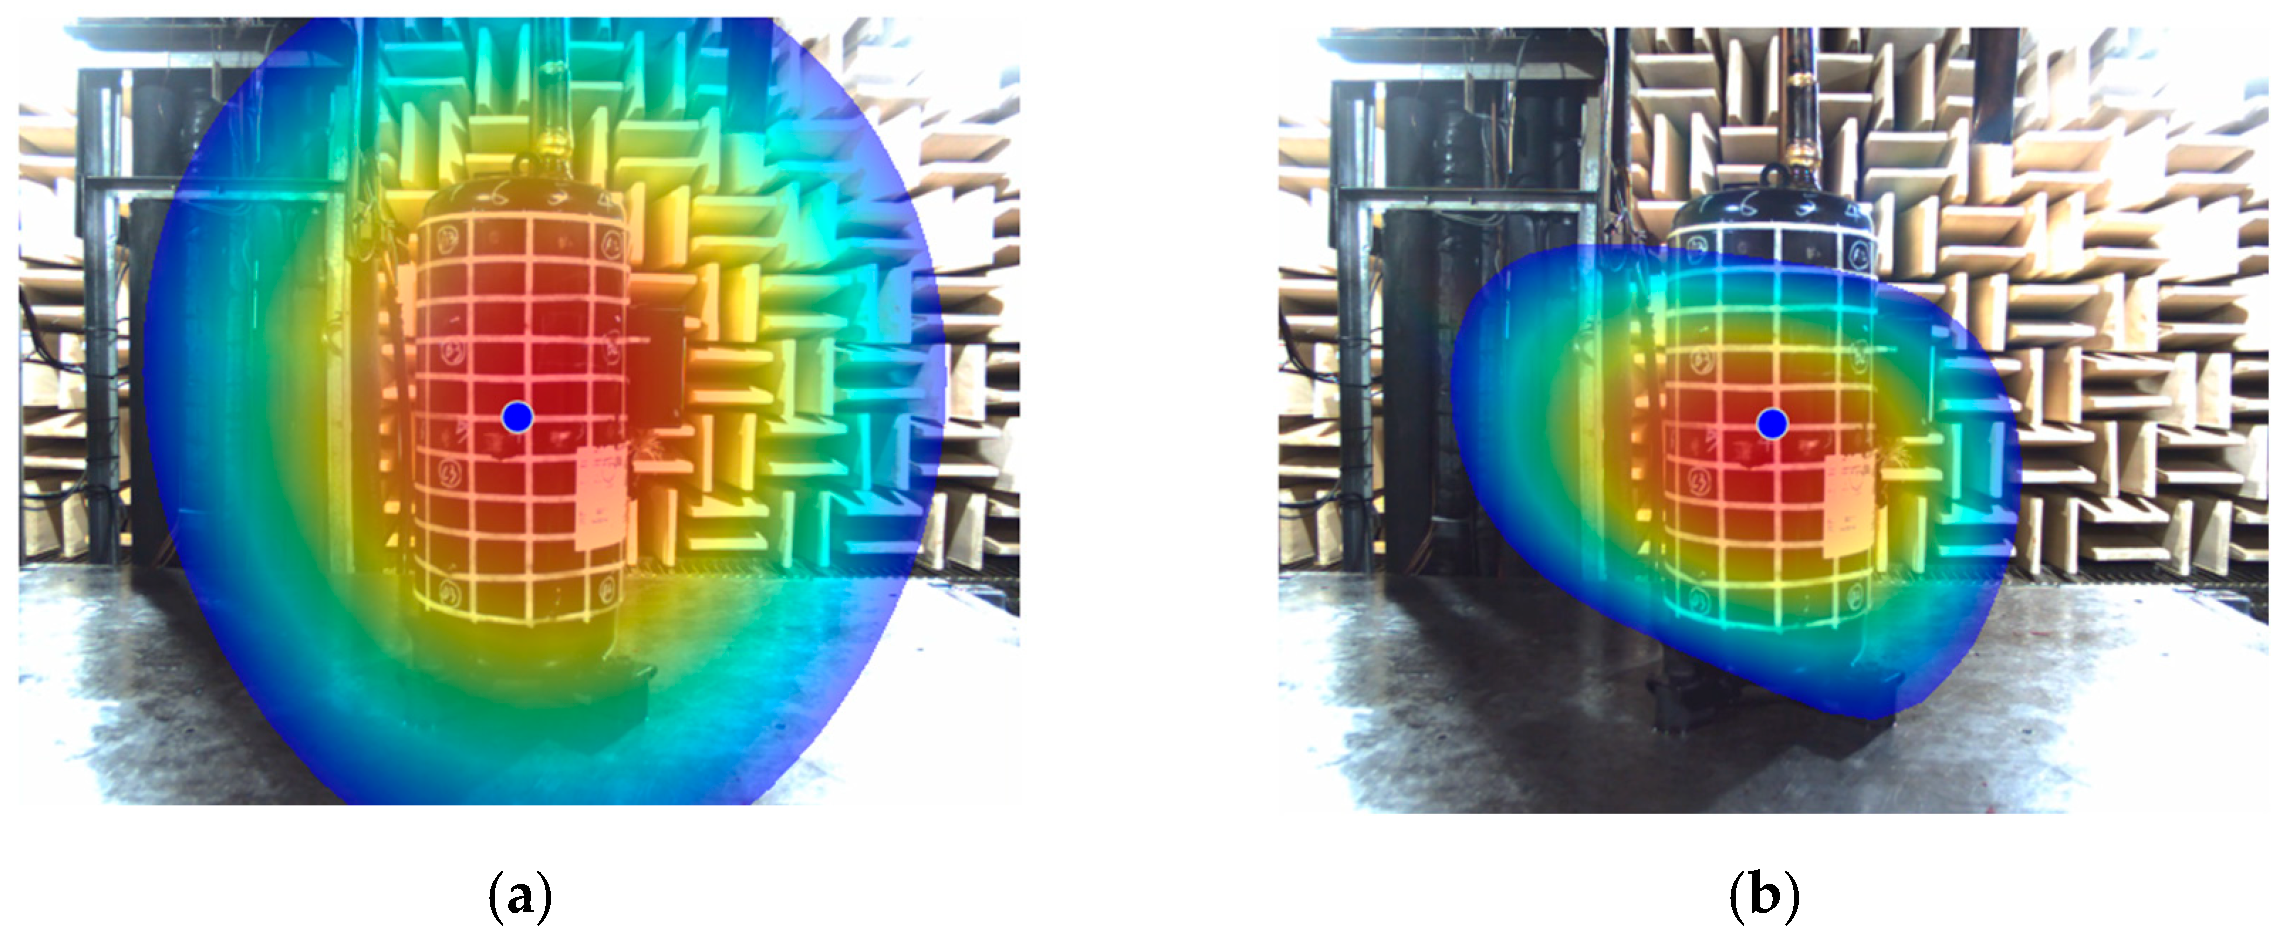
Subsequently, the noise contour maps at the three rotational speeds, with sound source localization performed on measurement plane F1, are shown in Figure 22, Figure 23 and Figure 24. Based on the simulation-experiment comparison and the localization contour analysis, it is found that the electromagnetic frequency contour points consistently appear at the stator and housing assembly of the scroll compressor motor, indicating that the spatial distribution of the noise contours at each speed coincides with the position of the electromagnetic excitation source.
Figure 22.
Noise contour maps of measurement plane F1 of the scroll compressor at 3600 rpm: (a) 1260 Hz; (b) 2520 Hz.
Figure 23.
Noise contour maps of measurement plane F1 of the scroll compressor at 5400 rpm: (a) 1440 Hz; (b) 2160 Hz.
Figure 24.
Noise contour maps of measurement plane F1 of the scroll compressor at 6600 rpm: (a) 1540 Hz; (b) 2640 Hz.
The summary in Table 5 clearly illustrates the contributions of the key frequency points identified in the preceding speed-specific analysis. The key frequency points obtained from vibration measurement points S1–S4 and their RMS average correspond closely with those derived from noise measurement planes F1–F4 and the average SPL. Comparison between vibration and noise reveals that the vibration spectra retain the low-frequency fundamental electromagnetic components, whereas the noise spectra are dominated by mid-to-high frequencies, reflecting the low sound radiation efficiency of the housing at low frequencies. Corresponding to Equations (6)–(8), although the low-frequency electromagnetic fundamental induces relatively large structural vibration, its radiation efficiency is weak due to the low frequency; in contrast, mid-to-high frequency harmonics, despite having relatively smaller structural vibration amplitudes, exhibit high radiation efficiency and therefore dominate the noise spectrum. Additionally, as the rotational speed increases, broadband components from other noise sources are mixed in and subsequently amplified through the housing modes, giving rise to characteristic spectra. This frequency separation between vibration and noise indicates that the housing not only transmits electromagnetic excitation but also reshapes the spectral characteristics of the noise through its modal radiation properties.
Table 5.
Summary of key frequency points at different measurement points (planes) under various operating conditions.
4.3. Electromagnetic Harmonic Migration and Modal Matching Analysis
To reveal the evolution of electromagnetic excitation under variable-speed conditions, we normalize the dominant peak frequencies in the measured spectra from three operating conditions to electrical frequency orders, compare them with the main force wave orders extracted from electromagnetic simulations, and analyze the order conservation and modal matching characteristics of the electromagnetic harmonics. Meanwhile, using the characteristic frequencies of electromagnetic force waves established via simulation, electromagnetic feature points at different rotational speeds are extracted by frequency comparison. Spatial-order and modal-order matching are then introduced as a second criterion to compute the harmonic matching degree.
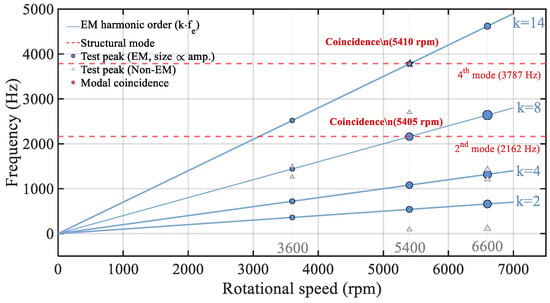
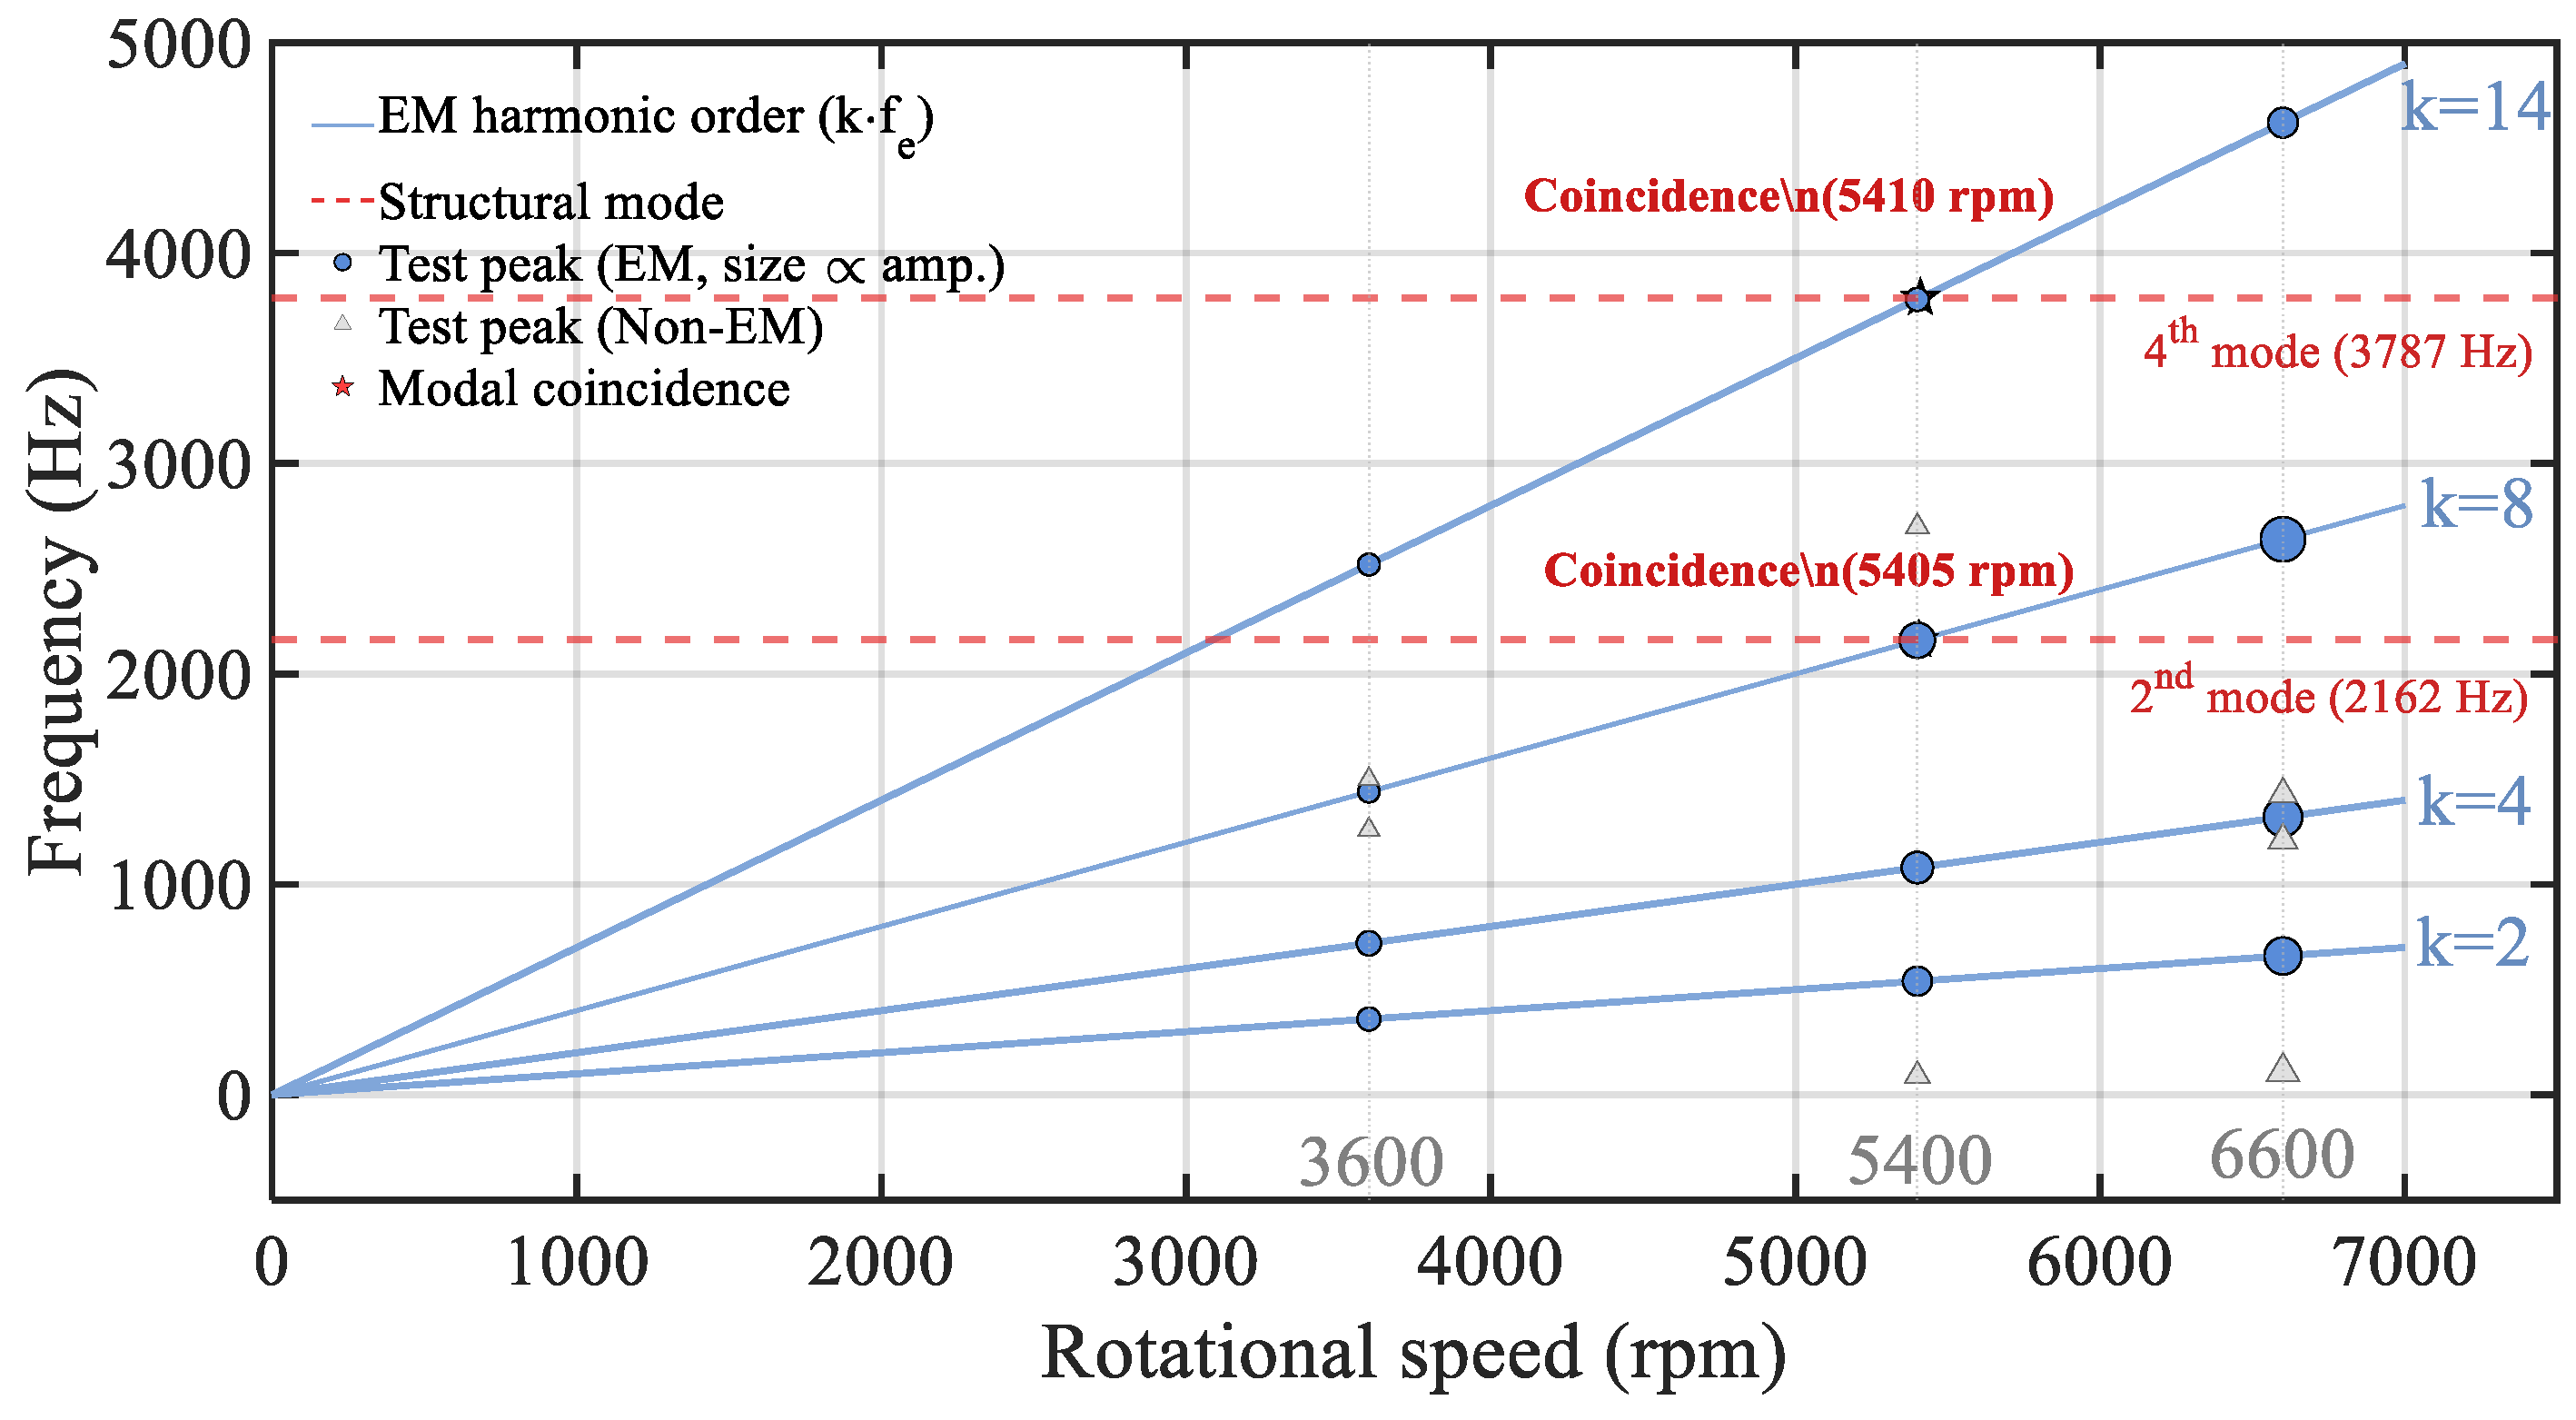
The distribution of dominant peak orders for vibration and noise across the three rotational speeds is shown in Figure 25. Even multiples of the electrical frequency order—specifically the 2nd, 4th, 8th, and 14th orders—persist stably at all three speeds and shift linearly with the rotational speed. The significantly amplified frequencies at each rotational speed are further compared with the modal frequencies of the stator assembly. At 5400 rpm, the 24th-order harmonic at 2160 Hz closely coincides with the 2nd-order mode of the stator assembly at 2162 Hz; the measured housing vibration amplitude is approximately three times that at 3600 rpm for the same harmonic order (1440 Hz), with peaks appearing simultaneously at all four measurement points, clearly exhibiting modal resonance amplification. At 6600 rpm, the 24th-order harmonic at 2640 Hz deviates from the 2nd-order mode; although it remains the dominant peak in the spectrum, no resonance amplification occurs, and the overall amplitude increase tends to level off. Additionally, at 3600 rpm, the 42nd-order harmonic at 2520 Hz is close to the 4th-order mode at 2537 Hz, resulting in secondary amplification at measurement points S1 and S4.
Figure 25.
Electromagnetic Harmonic–Structural Mode Campbell Diagram.
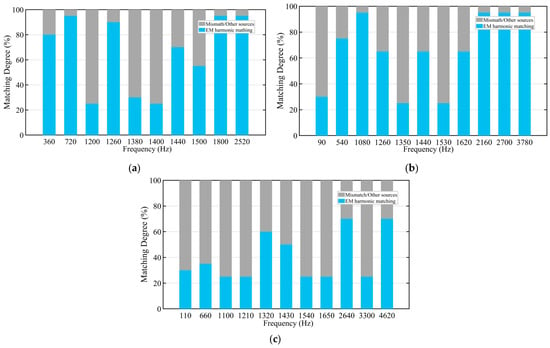
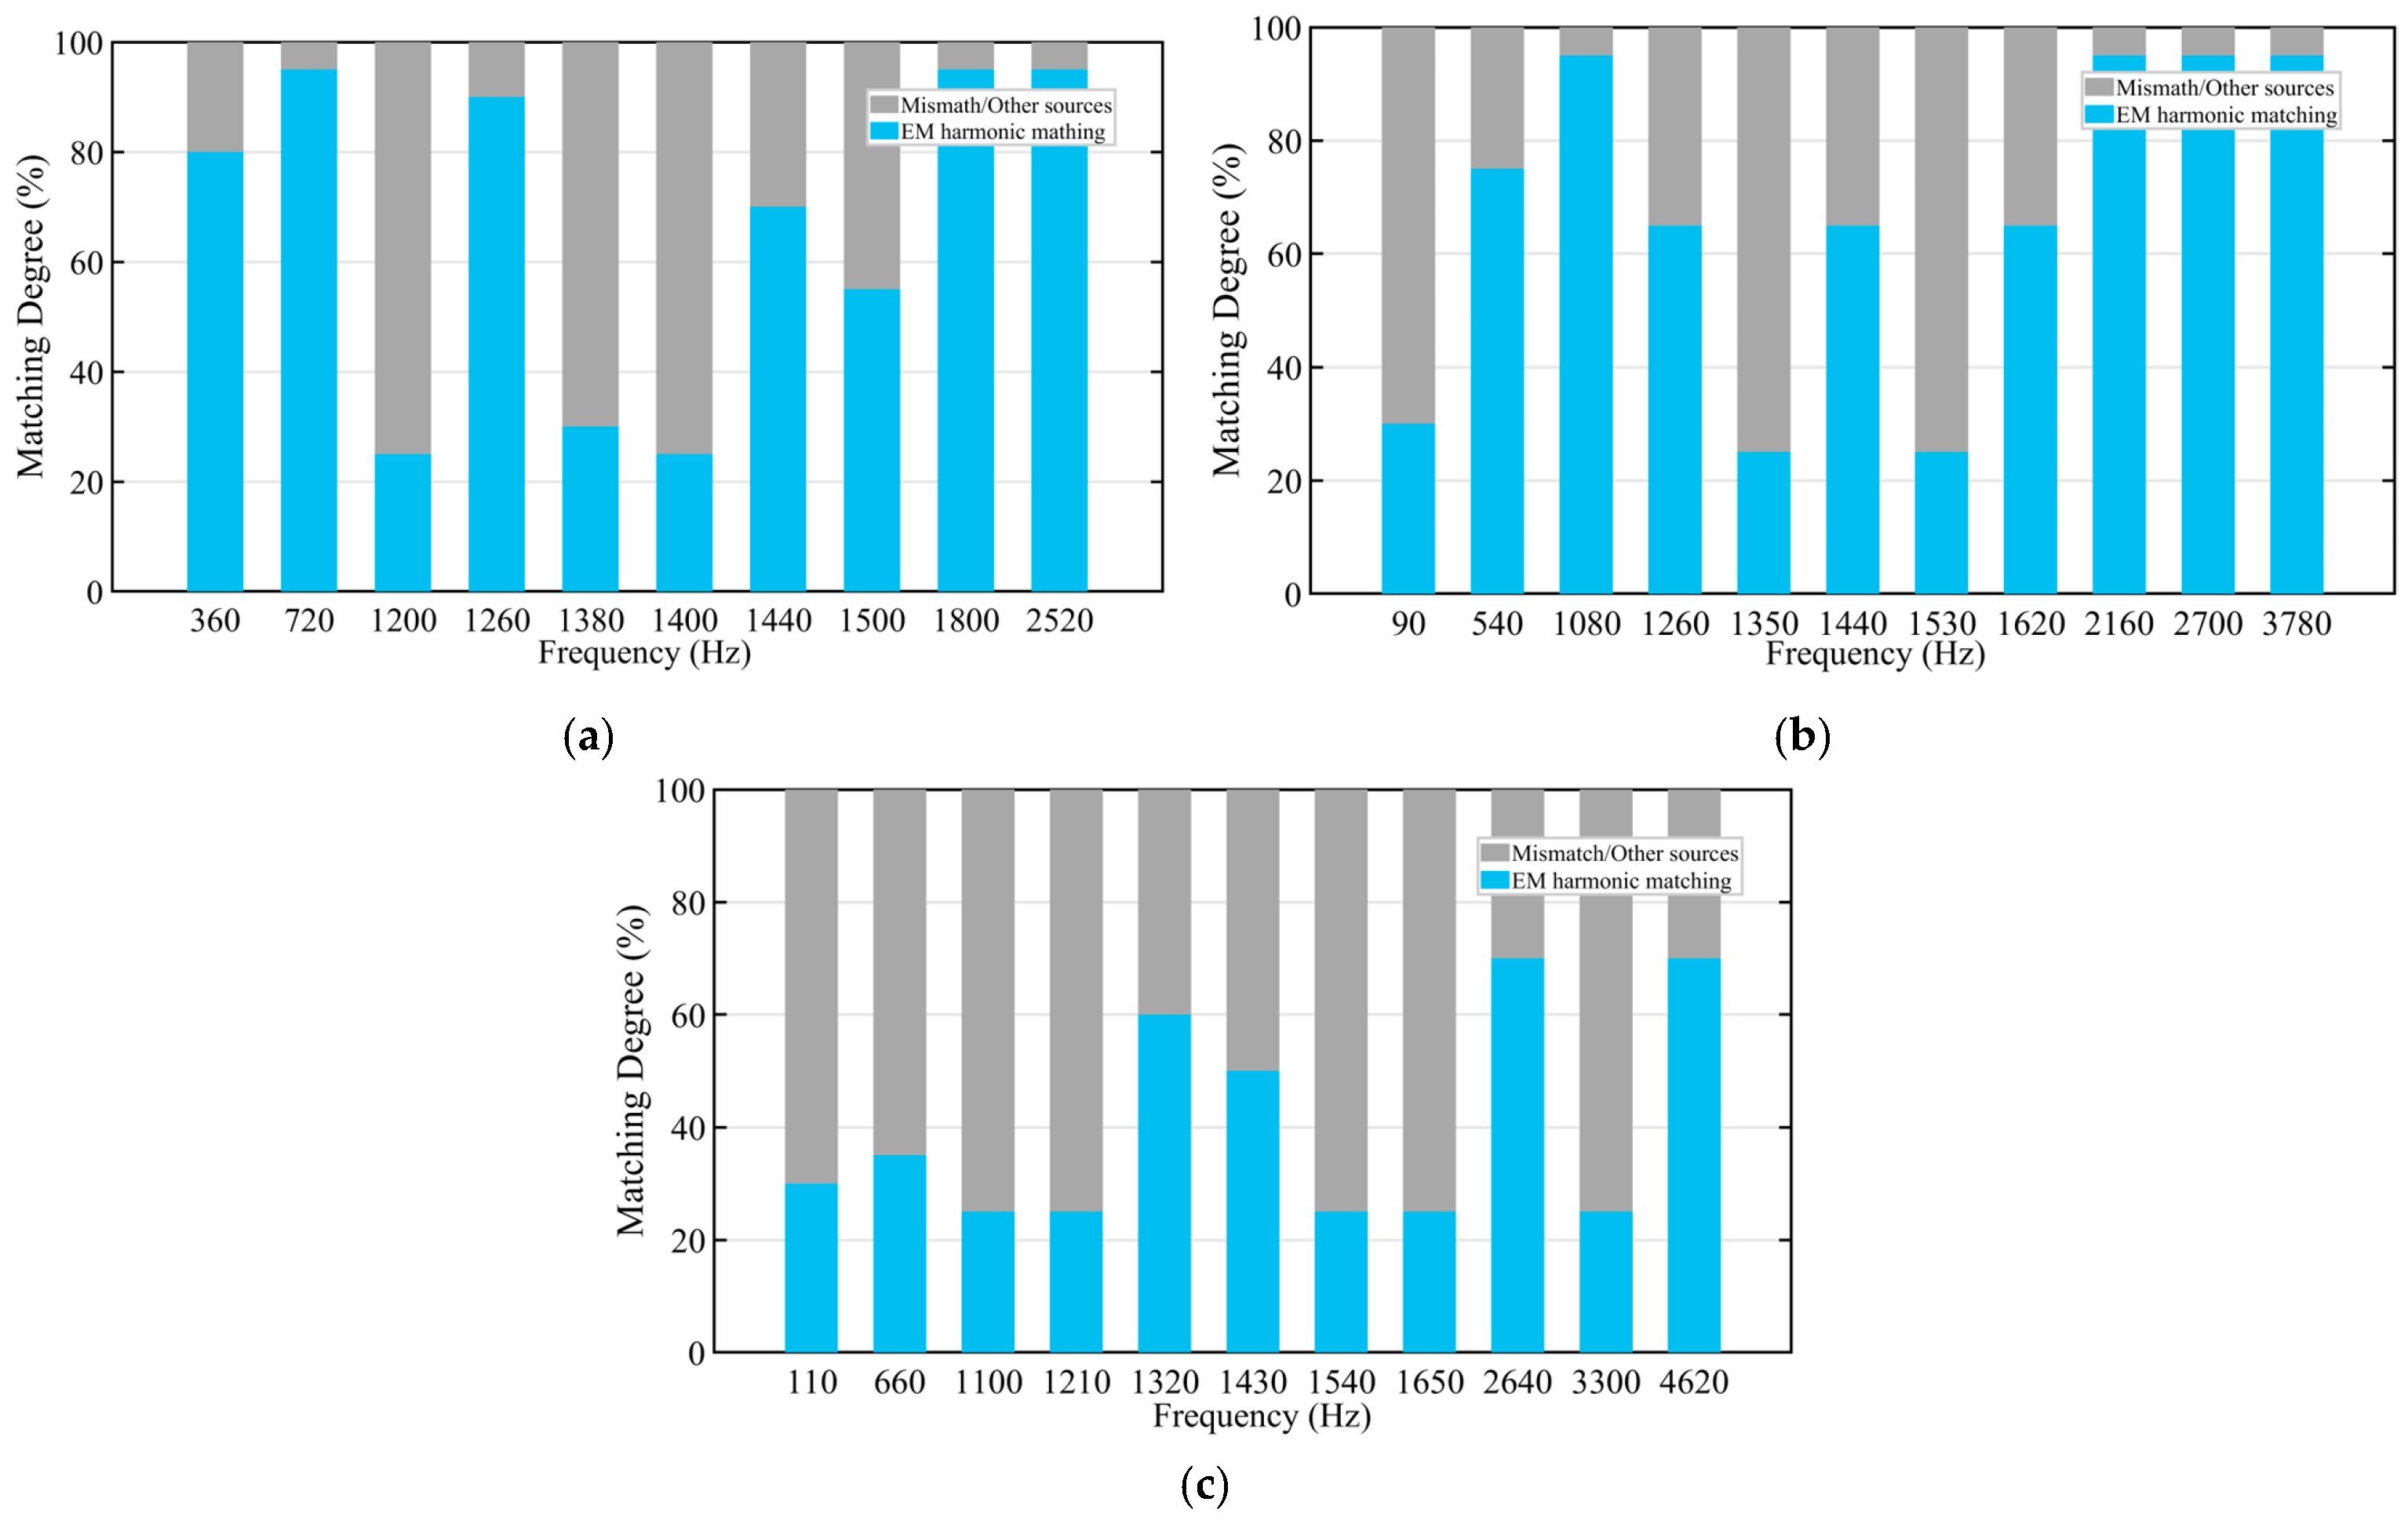
The harmonic matching degrees under the 3600 rpm condition are illustrated in Figure 26a. At the electromagnetic characteristic frequencies of 360 Hz (6f), 720 Hz (12f), 1260 Hz, 1800 Hz, and 2520 Hz, the matching degrees reach 80–95%, indicating that the vibration and noise at these frequencies are primarily contributed by electromagnetic force waves. In contrast, the matching degrees at 1200 Hz, 1380 Hz, and 1400 Hz are about 25%, suggesting that their peaks predominantly originate from aerodynamic or mechanical excitations. Upon increasing the rotational speed to 5400 rpm, the corresponding matching degrees are shown in Figure 26b. The matching degrees of electromagnetic harmonic frequencies such as 1080 Hz (12f), 2160 Hz (24f), 2700 Hz (30f), and 3780 Hz (42f) exceed 90%. Compared with the 3600 rpm case, the overall matching degree is improved and the high-matching frequency band is broadened because, as the rotational speed increases, the electromagnetic harmonic frequencies shift to higher frequencies, resulting in more intersections with structural modes and causing more frequency components to fall within the electromagnetic dominance region. However, the matching degrees at 90 Hz, 1350 Hz, and 1530 Hz remain below 30%, while those at 1260 Hz and 1440 Hz are at moderate levels, suggesting the presence of coupling effects between electromagnetic excitation and other excitations under this rotational speed. A further rise in speed to 6600 rpm yields the matching degree distribution depicted in Figure 26c. The matching degrees of high-frequency electromagnetic harmonics such as 2640 Hz, 3300 Hz, and 4620 Hz reach approximately 70%, which are lower than those under medium- and low-speed conditions. This decline is not attributed to weakened electromagnetic excitation; rather, it occurs because the relative contributions of aerodynamic noise and gas pressure pulsation increase significantly with rising rotational speed, thereby diluting the electromagnetic proportion of the total energy. In the low-frequency range, except for 1320 Hz (12f), the matching degrees are generally below 35%, indicating that the electromagnetic excitation energy shifts to higher frequencies and its relative dominance becomes more pronounced as the rotational speed increases. This demonstrates that electromagnetic energy indeed migrates to higher frequencies, yet the overall noise sources of the machine have already transitioned from electromagnetic dominance to competition among electromagnetic and other sources.
Figure 26.
Harmonic Matching Degree at Characteristic Frequencies under Variable Speeds: (a) 3600 rpm; (b) 5400 rpm; (c) 6600 rpm.
The above analysis demonstrates that the speed sensitivity of electromagnetic noise in the scroll compressor depends not only on the electromagnetic force amplitude, but more critically on the degree of alignment between the electromagnetic harmonic frequencies and the structural modes. When even-order electromagnetic force waves fall within the resonance bandwidth of the low-order stator modes, the vibration response of the housing is significantly amplified; conversely, even when electromagnetic forces are present, the response remains relatively moderate if the frequencies are distant from the modes.
4.4. Electromagnetic Contribution Trend Analysis
The aforementioned harmonic migration and modal matching analysis has identified the dominant electromagnetic (EM) frequency components under variable-speed operation and the conditions for their resonant amplification. However, the measured spectra also contain non-electromagnetic contributions, such as odd-order harmonics and a broadband background. To quantitatively assess the relative dominance of electromagnetic excitation in the overall machine response, it is necessary to establish a source separation method capable of distinguishing between electromagnetic and non-electromagnetic contributions.
Conventional single-spectrum comparison methods are inadequate for addressing harmonic overlap and background noise interference under variable-speed conditions. Based on the electromagnetic harmonic frequencies and modal amplification characteristics identified in Section 4.3, a method for discriminating electromagnetically dominant frequency bands is proposed. This method integrates simulation-based pre-screening with experimental spectrum matching to estimate the degree of dominance of electromagnetic excitation in the overall machine response at various rotational speeds:
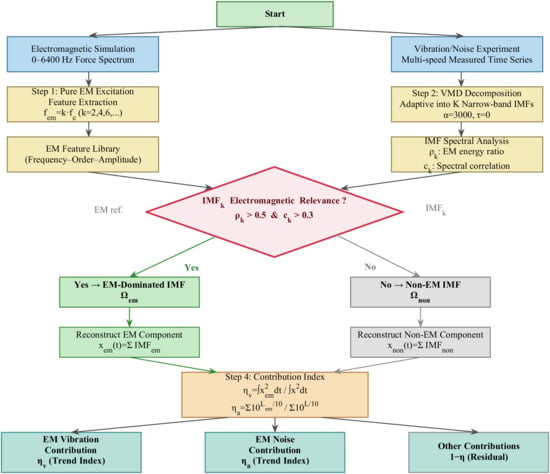
(1) Through electromagnetic field simulations, the dominant electromagnetic force wave frequencies within the 0–6400 Hz range, along with their corresponding frequency order k and spatial order r, are extracted to establish a three-dimensional electromagnetic feature database , which comprises frequency, order, and amplitude information. This characteristic library not only provides a priori knowledge of the frequency positions of electromagnetic harmonics but also embodies the physical constraints inherent in the matching relationships between spatial orders and structural modes.
(2) Variational Mode Decomposition (VMD) is performed on the measured vibration and noise signals, yielding K narrow-band intrinsic mode functions. Subsequently, spectral analysis is conducted on each mode functions to extract the peak frequencies and to compute the corresponding energy proportions and spectral correlation coefficients relative to the electromagnetic feature database. Where the variables are defined as:
denotes the time-domain sequence of the k-th modal component; is the number of sampling points; represents the raw vibration acceleration or sound pressure signal; is the Power Spectral Density of the k-th mode; is the reference spectrum adopted for modal validity screening or electromagnetic harmonic matching identification; and are the mean values of the corresponding spectra.
(3) The intrinsic mode function (IMF) components identified as electromagnetically dominated are reconstructed to derive the electromagnetic excitation components. The electromagnetic vibration contribution rate is defined as the ratio of the mean square value of the electromagnetic component to the total signal energy, whereas the electromagnetic noise contribution rate is defined as the ratio of the sound power level of the electromagnetic component to the total sound power level, namely:
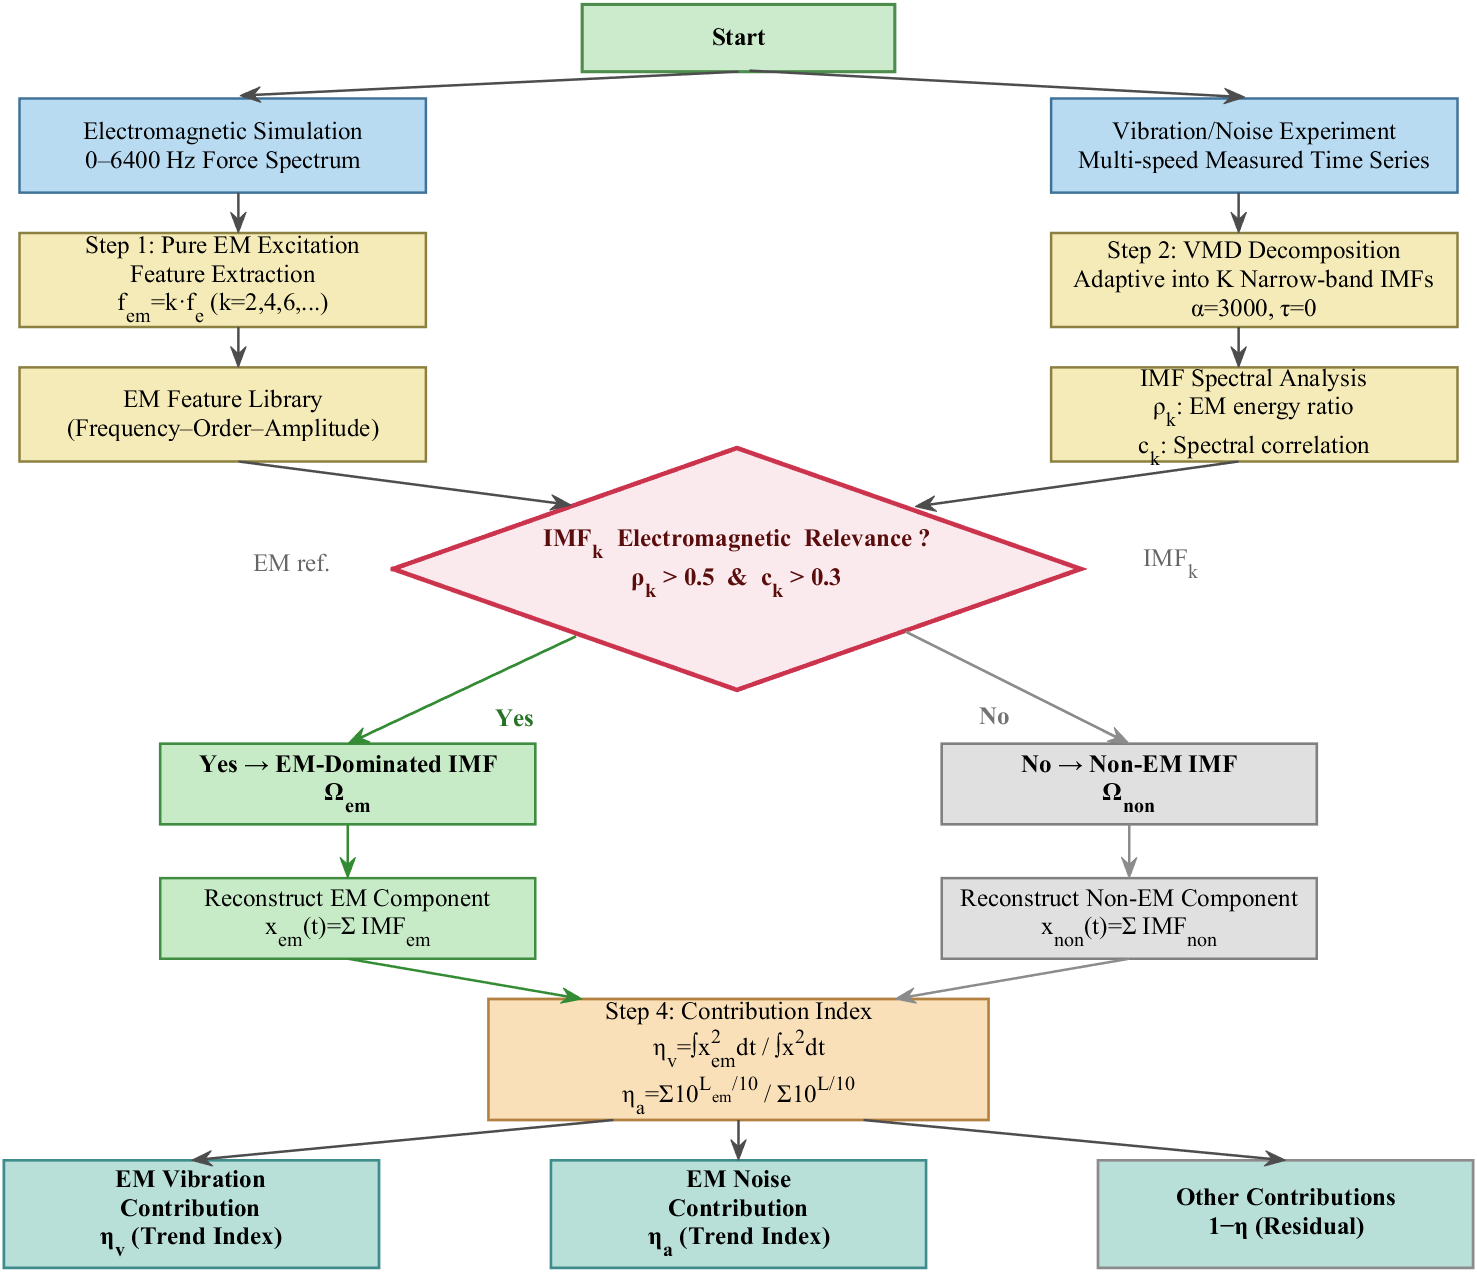
It should be noted that the two identification thresholds and in Figure 27 are not chosen subjectively but are co-determined by physical significance and simulation calibration. Specifically, mandates that the energy concentration of the IMF at the electromagnetic characteristic frequency exceeds 50%, ensuring that the electromagnetic excitation energy is absolutely dominant within this narrow-band component. Meanwhile, ensures that the spectral morphology of the IMF exhibits a statistically significant correlation with the harmonic distribution of the electromagnetic force waves, a boundary condition that has been widely adopted in the field of rotating machinery vibration source identification. Furthermore, by applying the proposed algorithm to a numerically synthesized force spectrum containing only electromagnetic excitation, all electromagnetically relevant IMFs are found to satisfy the aforementioned threshold conditions, thereby validating the rationality of this set of thresholds. Additionally, sensitivity analysis reveals that the identification results for electromagnetically dominant frequencies remain stable when and demonstrating that the selected thresholds possess favorable robustness.
Figure 27.
Flowchart for identifying electromagnetic contribution features.
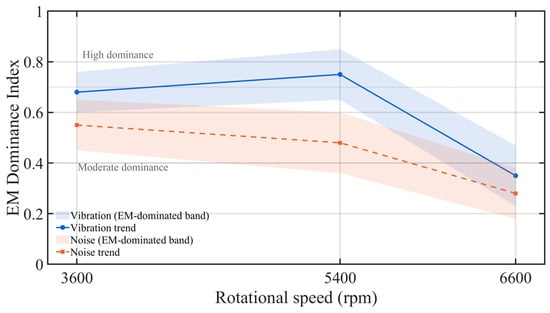
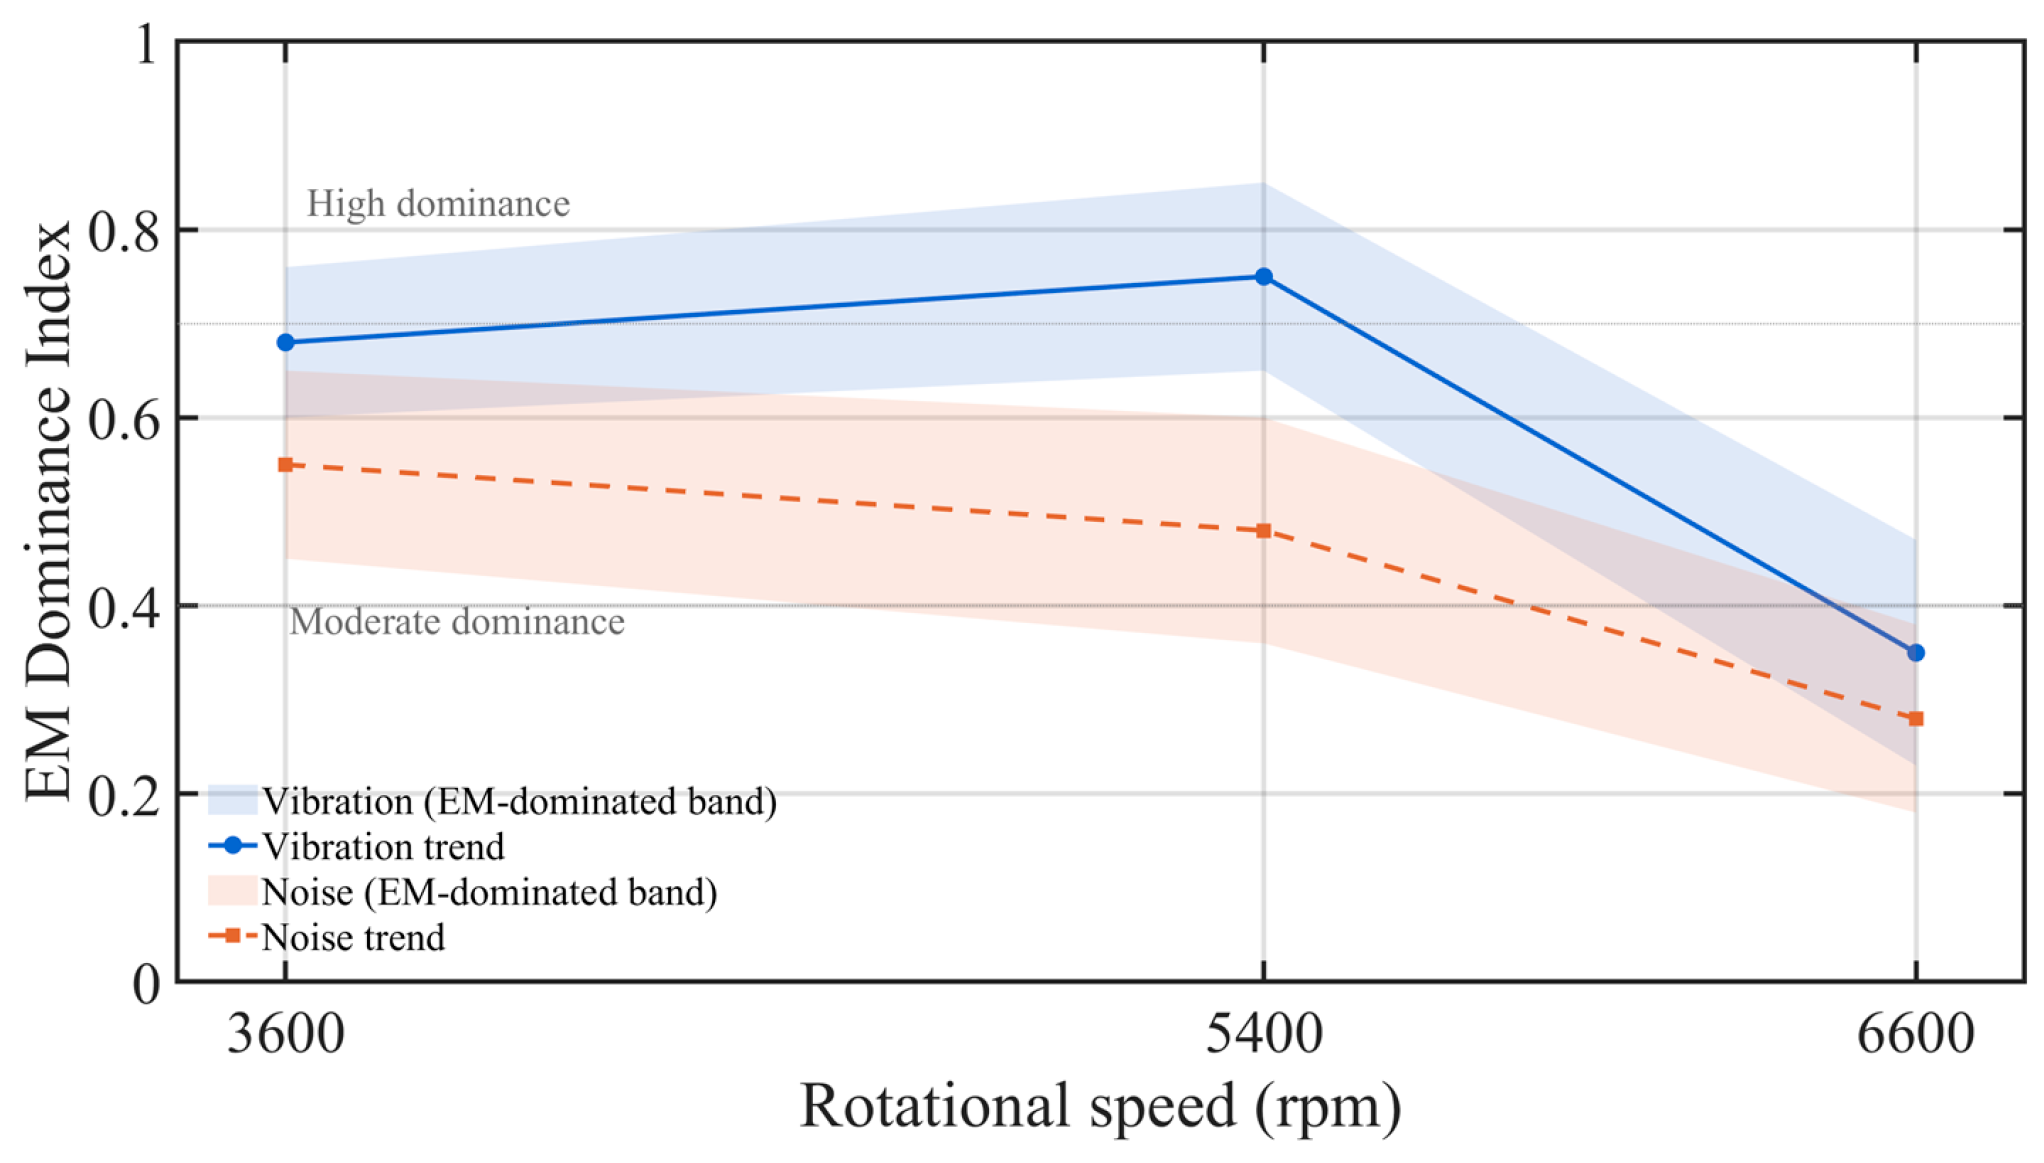
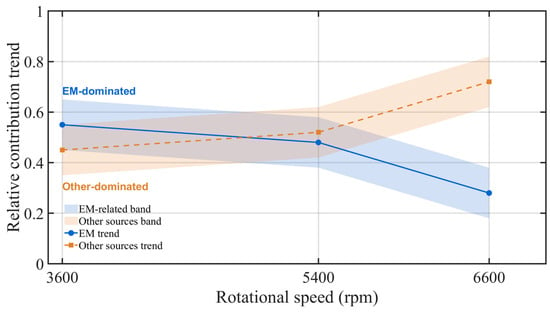
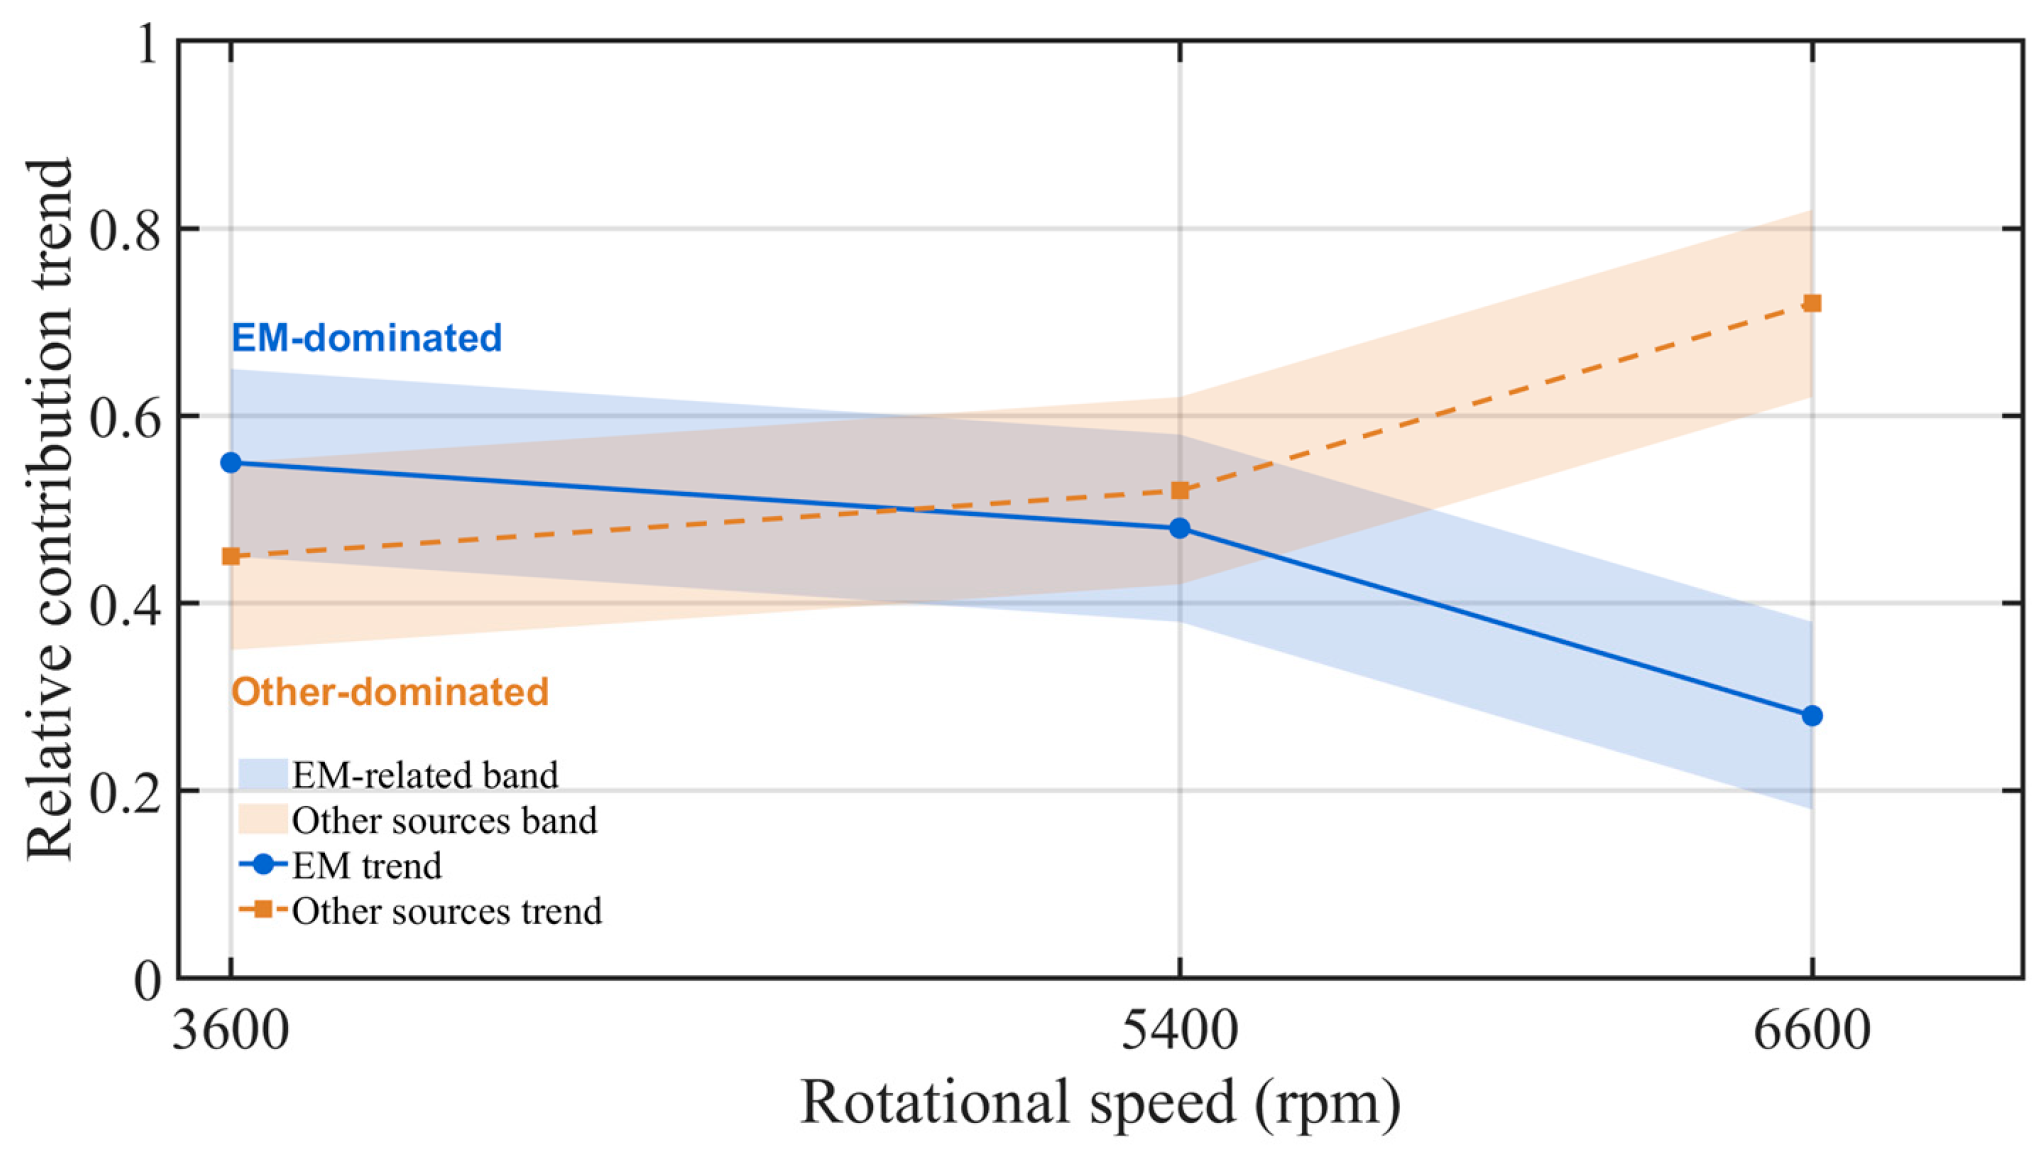
Based on the aforementioned mode decomposition and electromagnetic correlation identification algorithm, the variable-speed electromagnetic dominance trends are obtained, as shown in Figure 28 and Figure 29. In the 3600–5400 rpm range, the vibration electromagnetic dominance index rises from approximately 0.68 to 0.75 and then drops sharply to 0.35 at 6600 rpm, whereas the noise electromagnetic dominance index gradually decreases from 0.55 to 0.48 and further to 0.28, displaying an overall stable-then-declining trend with the vibration electromagnetic dominance remaining higher than the noise counterpart. Meanwhile, Figure 29 further reveals a qualitative pattern of noise source transition: at 3600 rpm, electromagnetic noise is roughly dominant; at 5400 rpm, electromagnetic and other noise sources contribute comparably; and at 6600 rpm, the proportion of electromagnetic noise decreases while that of other sources increases, indicating that as the speed rises, non-electromagnetic excitations such as fluid pulsation and discharge noise inside the compressor gradually intensify, leading to a continuous weakening of the relative dominance of electromagnetic noise. Together, the two figures demonstrate a speed-dependent characteristic under variable operating conditions, namely that electromagnetic excitation contributes strongly at low-to-medium speeds and weakly dominates at high speeds.
Figure 28.
Trend of electromagnetic vibration and noise contribution under variable speed conditions.
Figure 29.
Qualitative Trend of Noise Source Transition with Speed.
4.5. Discussion
The proposed electromagnetic–structural–acoustic coupling framework enables the design-stage prediction of vibration and noise in scroll compressors, providing direct guidance for switching-frequency selection and for avoiding the matching between electromagnetic force harmonics and structural modes. Furthermore, the quantitative contribution trends of electromagnetic excitation under variable-speed conditions have been separated via the proposed VMD–harmonic matching method, offering a direct basis for prioritizing noise control strategies across different speed intervals. Nevertheless, several limitations should be noted. First, aerodynamic excitation from the refrigerant flow was excluded from the present model. For scroll compressors, aerodynamic noise is mainly associated with discharge pulsation and valve motion; within the tested speed range (3600–6600 rpm), the dominance analysis in Section 4.4 indicates that electromagnetic excitation serves as the primary contributor at the identified characteristic peak frequencies, justifying this simplification. However, at higher operating speeds, the aerodynamic contribution may grow and couple with the electromagnetic excitation, and its exclusion could underestimate the high-frequency noise components. Future work will incorporate computational fluid dynamics (CFD)-based aerodynamic excitation into the coupling framework and extend the analysis to a wider speed range.
5. Conclusions
Focusing on the electromagnetic excitation mechanisms in the vibration and noise of scroll compressors under variable-speed conditions, this study establishes an electromagnetic–structural–acoustic sequential coupling model, validated by experiments at 3600, 5400, and 6600 rpm, and proposes a dominance-identification method based on variational mode decomposition and an electromagnetic correlation criterion. Such a framework extends electromagnetic–structural–acoustic coupling analysis from the motor body to the whole-machine structure of a scroll compressor and quantitatively assesses the speed-dependent dominance of electromagnetic excitation, in response to the aforementioned research gaps. The main conclusions are as follows.
At the level of electromagnetic force wave generation, the spatiotemporal harmonic distribution of electromagnetic force waves and their transmission to the housing vibration were elucidated. For the 9-slot, 6-pole fractional-slot concentrated winding motor examined, the electromagnetic force wave exhibits a spatial distribution dominated by the 0th-order mode, with the 3rd and 6th orders constituting the lowest non-zero spatial orders, while the temporal harmonics are predominantly even multiples such as 2, 4, 8, and 14. These simulated electromagnetic characteristic frequencies (2fe, 4fe, 8fe, and 14fe, where fe denotes the electrical frequency) agree well with the dominant frequencies in the experimental spectra and constitute the main spectral components of the casing vibration and radiated noise. Notably, 8fe constitutes the dominant spectral peak across the entire speed range, whereas 14fe—arising from the interaction between the 13th harmonic of the permanent magnet field and the 11th harmonic of the armature field—is consistently present at all speeds and thus serves as a characteristic frequency for identifying electromagnetic excitation.
At the harmonic–modal matching level, an evaluation method for the matching degree between electromagnetic harmonics and structural modes is proposed, and the resulting resonance amplification mechanism is revealed. The even-order harmonics exist stably at all three speeds and shift linearly with speed, with the matching degree of the dominant electromagnetic characteristic frequencies exceeds 80% at low-to-medium speeds. When the harmonic frequencies fall within the resonance bandwidth of structural modes, the casing vibration is significantly amplified. For instance, at 5400 rpm, the 24th harmonic (2160 Hz, i.e., 8fe) closely coincides with the second-order mode of the stator assembly (2162 Hz), and the measured casing vibration amplitude is approximately three times that of the same order at 3600 rpm. At 6600 rpm, this harmonic order deviates from the mode; although it remains the dominant peak, no resonance amplification occurs, and the amplitude increase tends to level off.
At the level of electromagnetic dominance evaluation, a quantitative method for assessing electromagnetic dominance is developed and its speed dependence as well as the spatial modulation effect of the housing are uncovered. At low-to-medium speeds (3600–5400 rpm), the electromagnetic dominance index for vibration ranges between 0.68 and 0.75, while that for noise decreases from 0.55 to 0.48, indicating strong electromagnetic predominance. As the speed increases to 6600 rpm, the two indices drop to 0.35 and 0.28, respectively, and the contributions from non-electromagnetic sources such as aerodynamic and mechanical excitations become more prominent, signifying a clear transition in the overall noise sources. Meanwhile, after the electromagnetic excitation is transmitted through the asymmetric structure and internal support paths of the compressor to the complete machine, the vibration spectra at different measurement points on the casing (S1–S4) exhibit a pronounced spatial modulation effect, and the far-field noise (F1–F4) displays a non-uniform radiation distribution, with stronger high-frequency noise radiation at complex interfaces such as the discharge end. Although a single global average analysis can capture the overall trend of the complete machine, it may mask local amplitude anomalies and radiation dead zones.
From a practical perspective, the proposed framework provides design-stage tools for low-noise scroll compressor development: it enables noise-control efforts to be allocated by operating range, helps avoid resonance-prone speeds, and suggests candidate locations for targeted damping or reinforcement (e.g., near the discharge end). Future work will account for the aerodynamic excitation of the refrigerant flow in the coupling framework and validate the methodology on compressors of different capacities and under varied load conditions.
Author Contributions
Conceptualization, Z.W. and S.L.; methodology, Z.W.; software, S.L.; validation, Z.W., S.L. and W.F.; formal analysis, S.L.; investigation, S.L.; resources, Z.W.; data curation, S.L.; writing—original draft preparation, S.L.; writing—review and editing, Z.W.; visualization, W.F.; supervision, W.F.; project administration, X.W.; funding acquisition, X.W. All authors have read and agreed to the published version of the manuscript.
Funding
This research was funded by the Joint Program of the Liaoning Provincial Science and Technology: Plan (Key Research and Development Program Project), grant number 2025JH2/101800357.
Data Availability Statement
All the data used in this article are included in the article itself and in the references.
Acknowledgments
We would like to thank all those who contributed to the experiments and manuscript preparation in this study. AI tools (e.g., DeepSeek V4) were used for language polishing, grammar checking, and formatting assistance during manuscript preparation. All scientific content, data analysis, and conclusions were independently verified by the authors.
Conflicts of Interest
The authors declare no conflicts of interest.
References
- Soresini, F.; Barri, D.; Ballo, F.; Gobbi, M.; Mastinu, G. Noise and Vibration Modeling of Permanent Magnet Synchronous Motors: A Review. IEEE Trans. Transp. Electrif. 2024, 10, 8728–8745. [Google Scholar] [CrossRef] [Scilit]
- Cho, S.; Jeon, K.; Kim, C.-W. Vibration analysis of electric motors considering rotating rotor structure using flexible multibody dynamics-electromagnetic-structural vibration coupled analysis. J. Comput. Des. Eng. 2023, 10, 578–588. [Google Scholar] [CrossRef] [Scilit]
- Park, C.-S.; Kim, J.-H.; Park, S.-H.; Lim, M.-S. Effect of Electromagnetic Force Caused by PMSM on the Vibration/Noise of Reciprocating Compressors. IEEE Access 2023, 11, 56324–56335. [Google Scholar] [CrossRef] [Scilit]
- Ji, J.; Zhou, Y.; Tao, T.; Li, Z.; Zhao, W. Armature MMF Reconfiguration Method of Six-Phase Integral-Slot PMSMs for Zero-Order Vibration Reduction Under Open-Circuit Faults. IEEE Trans. Transp. Electrif. 2024, 10, 421–431. [Google Scholar] [CrossRef] [Scilit]
- Andreou, P.; Hajjaj, A.Z.; Mohammadpour, M.; Theodossiades, S. Analytical Multiphysics Methodology to Predict Vibroacoustics in PMSMs Combining Tangential Electromagnetic Excitation and Tooth Modulation Effects. IEEE Trans. Transp. Electrif. 2024, 10, 5997–6009. [Google Scholar] [CrossRef] [Scilit]
- Yao, L.; Shen, J.-X.; Wang, Y.; Shi, D. Fast Prediction and Staged Optimization of Electromagnetic Vibration in Permanent Magnet Synchronous Motor. IEEE Trans. Ind. Electron. 2024, 71, 115–125. [Google Scholar] [CrossRef] [Scilit]
- Hong, J.; Zhao, K.; Gui, L.; Cao, J. A Comprehensive Investigation of Tangential Force and Radial Force in PM Motor. IEEE Trans. Ind. Electron. 2024, 71, 16286–16296. [Google Scholar] [CrossRef] [Scilit]
- Gong, C.; Li, S.; Habetler, T.; Zhou, P. Acoustic Modeling and Prediction of Ultrahigh-Speed Switched Reluctance Machines Based on Multiphysics Finite Element Analysis. IEEE Trans. Ind. Appl. 2021, 57, 198–207. [Google Scholar] [CrossRef] [Scilit]
- Kim, S.; Pak, M.; Kim, Y.-j.; Lee, H. Motor noise source identification and tub vibration prediction in a drum washing machine. Appl. Acoust. 2023, 210, 109434. [Google Scholar] [CrossRef] [Scilit]
- Park, C.-S.; Kim, J.-H.; Park, S.-H.; Yoon, Y.-D.; Lim, M.-S. Multi-Physics Characteristics of PMSM for Compressor According to Driving Mode Considering PWM Frequency. IEEE Access 2022, 10, 114490–114500. [Google Scholar] [CrossRef] [Scilit]
- Yan, R.; Wang, D.; Wang, C.; Miao, W.; Wang, X. Analytical Approach and Experimental Validation of Sideband Electromagnetic Vibration and Noise in PMSM Drive With Voltage-Source Inverter by SVPWM Technique. IEEE Trans. Magn. 2025, 61, 8200206. [Google Scholar] [CrossRef] [Scilit]
- Kang, L.; Xia, J.; Su, H.; Li, Z.; Liu, S. Online Control Strategy for Radial Vibration Suppression of PMSM by Multiharmonic Current Injection Method. IEEE Trans. Ind. Electron. 2022, 69, 8692–8704. [Google Scholar] [CrossRef] [Scilit]
- Zhou, X.; Zhu, X.; Xiang, Z.; Fan, D.; Xu, L.; Zhu, T. Harmonic-Oriented Design and Vibration Characteristic Suppression for Interior Permanent Magnet Motors. IEEE Trans. Ind. Electron. 2024, 71, 1246–1256. [Google Scholar] [CrossRef] [Scilit]
- Shen, Q.; Cheng, J.; Guo, D.; Yang, T. Analysis and Suppression of Electromagnetic Vibration Noise of Fractional-Slot Concentrated-Windings Interior PMSMs. IEEE Trans. Transp. Electrif. 2024, 10, 5270–5281. [Google Scholar] [CrossRef] [Scilit]
- Wang, X.; Li, N.; Yu, T.; Li, T. Study on the Effect of Suspension Windings on the Electromagnetic Vibration and Noise of Ultra-high-Speed Bearingless Permanent Magnet Synchronous Motor for Air Compressor. IEEJ Trans. Electr. Electron. Eng. 2023, 18, 129–138. [Google Scholar] [CrossRef] [Scilit]
- Mao, Y.; Fan, C.; Zhang, Z.; Song, S.; Xu, C. Control of noise generated from centrifugal refrigeration compressor. Mech. Syst. Signal Process. 2021, 152, 107466. [Google Scholar] [CrossRef] [Scilit]
- Song, Y.; Ma, Q.; Zhang, T.; Li, F.; Yu, Y. Research on vibration and noise characteristics of scroll compressor with condenser blockage fault based on signal demodulation. Int. J. Refrig. 2023, 154, 9–18. [Google Scholar] [CrossRef] [Scilit]
- Wang, C.; Wang, Z.; Yan, W.; Li, H.; Yang, C. Study on Characteristics of the Vibration and Noise of High-Power Scroll Compressor. Shock Vib. 2021, 2021, 5953133. [Google Scholar] [CrossRef] [Scilit]
- Kim, C.; Ha, N. A Study on the Vibration and Noise Reduction of Scrolling-Type Electric Compressor for Electric Vehicles. World Electr. Veh. J. 2025, 16, 126. [Google Scholar] [CrossRef] [Scilit]
- Liu, D.; Feng, Y.; Jia, J.; Si, P.; Feng, Y. The noise spectral characteristics and noise reduction schemes of screw air-source heat pump: A case study. Build. Simul. 2024, 17, 53–70. [Google Scholar] [CrossRef] [Scilit]
- He, Y.; Xiao, C.; Zhang, W.; Wang, K. Study of noise and structural characteristics of twin-screw air compressor based on multi-physical field coupling. Sci. Rep. 2023, 13, 20879. [Google Scholar] [CrossRef] [Scilit] [PubMed]
- Hu, X.; He, Z.; Yang, J.; Tao, P.; Hu, L.; Sun, S. Prediction and experimental study of radiated noise of rotating vane compressor under compound effects of multiple sources excitations. Int. J. Refrig. 2022, 142, 19–26. [Google Scholar] [CrossRef] [Scilit]
- Zhang, W.; Li, B.; Yan, W.; Wang, Z.; Yang, X.; Li, H.; Chen, J.; Xu, J. Research on the influence of check valve on noise performance of variable frequency scroll refrigeration compressor. Int. J. Aeroacoust. 2023, 22, 261–277. [Google Scholar] [CrossRef] [Scilit]
- Wu, J.; Ma, Y.; Xia, Z.; Zhang, H.; Pan, X.; Xie, J. Experimental investigation on the vibration characteristics of the compressor in the outdoor unit of a household air conditioner. Proc. Inst. Mech. Eng. Part E J. Process Mech. Eng. 2026, 240, 66–73. [Google Scholar] [CrossRef] [Scilit]
- Son, Y.; Choi, J.; Lee, S. Noise radiation analysis of the hermetic reciprocating compressor by considering acoustic-structure interaction. J. Mech. Sci. Technol. 2023, 37, 607–615. [Google Scholar] [CrossRef] [Scilit]
- Thielecke, A.; Brovia, S.P.; Huebel, J.; Gaenzle, D.; Herbst, J.; Becker, S. Active electric machine control to reduce compressor noise in heat pumps. Appl. Acoust. 2023, 213, 109601. [Google Scholar] [CrossRef] [Scilit]
- Liu, W.; Kang, X.; Cai, G.; Li, K.; Ma, S.; Wang, X.; Xia, G. Nonlinear dynamics of Self-oscillation piezoelectric energy harvesting system based on liquid crystal elastomers. Thin-Walled Struct. 2026, 231, 115386. [Google Scholar] [CrossRef] [Scilit]
- Hu, Y.; Feng, J.; Yang, T. Nonlinear Dynamical Modeling and Free Vibration of Functionally Graded Cylindrical Shell in Air-gap Magnetic and Thermal Fields. Thin-Walled Struct. 2024, 199, 111787. [Google Scholar] [CrossRef] [Scilit]
- Shou, J.; Ma, J.; Zhang, Z.; Qiu, L.; Xu, B.; Luo, C.; Li, B.; Fang, Y. Vibration and Noise Optimization of Variable-Frequency-Driven SPMSM Used in Compressor Based on Electromagnetic Analysis and Modal Characteristics. Energies 2022, 15, 7474. [Google Scholar] [CrossRef] [Scilit]
- Wang, Z.; Gu, Y.; Chen, C.; Wang, L.; Sun, X. Induction Motor Noise Source Separation and Identification Based on Adaptive Scale-Space Mode Extraction. Machines 2023, 11, 449. [Google Scholar] [CrossRef] [Scilit]
- Standard’s ISO 3745:2012; Acoustics—Determination of Sound Power Levels and Sound Energy Levels of Noise Sources Using Sound Pressure—Precision Methods for Anechoic Rooms and Hemi-Anechoic Rooms. ISO: Geneva, Switzerland, 2012.

Disclaimer/Publisher’s Note: The statements, opinions and data contained in all publications are solely those of the individual author(s) and contributor(s) and not of MDPI and/or the editor(s). MDPI and/or the editor(s) disclaim responsibility for any injury to people or property resulting from any ideas, methods, instructions or products referred to in the content. |
© 2026 by the authors. Licensee MDPI, Basel, Switzerland. This article is an open access article distributed under the terms and conditions of the Creative Commons Attribution (CC BY) license.