


Abstract
The positional repeatability of industrial robots is a critical yet state-dependent performance metric, highly sensitive to thermal conditioning and mechanical loading. This study develops a data-driven framework for predicting repeatability of FANUC LR Mate 200iD (FANUC, Oshino-mura, Japan) and KUKA KR 6 R700 Sixx (KUKA AG, Augsburg, Germany) robots under varying operational conditions. ISO 9283-compliant experiments using a TriCal system (TRI-CAL Ltd., Montreal, QC, Canada) were conducted across three warm-up durations, three payload levels, and five poses. Ensemble artificial neural networks with 10 independently trained networks were developed for each robot. The FANUC model achieved R2 = 0.9922, RMSE = 0.004231 mm, and MAE = 0.002979 mm, while the KUKA model achieved R2 = 0.9926, RMSE = 0.002919 mm, and MAE = 0.002215 mm. Prediction interval coverage was 93.3% for FANUC and 100% for KUKA. Per-pose R2 ranged from 0.9588 to 0.9966 for KUKA. Response surface analysis identified thermal stabilization as the dominant factor affecting repeatability, with improvements of 86% for FANUC and 84% for KUKA after 4 h of warm-up. The KUKA robot demonstrated superior robustness and lower variability compared to the FANUC robot. The framework provides a practical tool for predicting repeatability, supporting process planning, uncertainty budgeting, and precision manufacturing optimization.
1. Introduction
The increasing deployment of industrial robots in precision-critical manufacturing operations has created an urgent need for reliable predictive tools capable of estimating positioning performance under realistic operating conditions [1,2]. As manufacturing tolerances continue to tighten across aerospace, medical, and electronics sectors, the gap between what robots can achieve under controlled laboratory conditions and their actual performance in production environments has become a central concern for manufacturing engineers [3,4,5]. This gap is particularly pronounced for repeatability, the stochastic dispersion of attained positions about a mean pose, which fundamentally limits the achievable precision of any robotic operation [6,7].
Thermal effects and dynamic errors represent fundamental sources of performance degradation that have been extensively documented in both machine tools and industrial manipulators [8,9,10], with their influence on positioning repeatability being particularly critical for precision manufacturing operations. Predicting repeatability under varying operational conditions presents formidable challenges that conventional approaches have struggled to address. The positional behavior of industrial manipulators emerges from complex interactions among thermal evolution, mechanical loading, kinematic configuration, and control system dynamics [11]. These factors are not independent but exhibit coupled behavior that defies simple analytical description [12]. Temperature gradients affect material properties and lubricant viscosity, which in turn modify friction characteristics and joint compliance [13,14]. Payload variations induce structural deflections that depend on both load magnitude and robot posture, with the relationship often exhibiting nonlinearity [15,16]. The resulting behavior is characterized by interactions that conventional modeling approaches, whether analytical or empirical, have difficulty capturing with sufficient accuracy for precision manufacturing applications [17].
Analytical approaches to repeatability prediction derive mathematical models from physical principles, typically modeling joint-level error sources and propagating them through kinematic transformations [18,19]. While theoretically elegant, these methods require extensive knowledge of joint-level stochastic characteristics that are rarely available for production robots [20]. Moreover, the simplifying assumptions necessary for analytical tractability often overlook important coupling effects, limiting predictive accuracy in practice [21]. Empirical approaches, conversely, develop predictive models directly from experimental measurements using statistical techniques such as regression or response surface methodology [22]. These methods capture actual behavior but are constrained by the limited flexibility of predetermined functional forms, which struggle to represent the nonlinear interactions characteristic of robotic systems [23,24].
The limitations of conventional approaches have motivated exploration of alternative modeling paradigms capable of learning complex patterns directly from data [25,26]. Among these, artificial neural networks have demonstrated remarkable capability for modeling nonlinear engineering systems without requiring explicit physical models [27]. The universal approximation property of neural networks—their ability to approximate any continuous function on a compact domain to arbitrary accuracy, provided the network has sufficient capacity (e.g., adequate number of hidden neurons) and is trained on representative data under appropriate assumptions—makes them particularly attractive for problems where the underlying mechanisms are understood qualitatively but resist quantitative modeling [28]. Neural networks can automatically discover patterns and interactions in data that traditional methods might miss, potentially achieving predictive accuracy substantially beyond conventional approaches [29].
However, practical implementation of neural networks for engineering prediction faces several obstacles. Limited experimental datasets, common in metrology applications due to the time-intensive nature of standardized testing protocols, increase the risk of overfitting in single-network architectures [30,31]. The stochastic nature of network training, where different initializations converge to different local minima, introduces uncertainty in predictions that single networks cannot quantify [32]. Perhaps most critically for manufacturing decision-making, practitioners require confidence estimates to support risk-informed process planning, as a point prediction without uncertainty assessment is of limited practical value [33]. These limitations have motivated the development of ensemble learning methodologies, which train multiple independently initialized networks and aggregate their predictions [34]. This approach reduces variance, improves generalization, and provides a natural measure of predictive uncertainty through the dispersion of individual network outputs [35].
The increasing adoption of machine learning in robotic systems reflects a broader trajectory toward data-driven performance optimization [36,37,38,39]. In this context, Zhu et al. [40] introduced a physics-informed neural network architecture that integrates theoretical current as a physical constraint alongside a current-error dual-loop framework for tracking error prediction. Their approach yielded a 74.74% reduction in tracking error, underscoring the synergy between physics-based reasoning and data-driven learning. Similarly, Santhosh et al. [41] combined machine learning with virtual-environment simulations to automate flaw identification in robotic painting, attaining 94% real-time detection accuracy and highlighting the value of aligning simulated and physical experimental conditions. Addressing calibration challenges, Li et al. [42] developed a hybrid methodology that fuses cubic interpolated beetle antennae search with a particle filter to mitigate non-Gaussian noise, achieving a 21.43% reduction in maximum calibration error on an HSR JR680 manipulator. For anomaly detection in distributed robotic systems, Long et al. [43] proposed a statistical-deep learning framework incorporating a Pyramid Graph Attention Network, which captures inter-robot dependencies through hierarchical dynamic weighting and delivers a 15% average performance gain over conventional time-series methods. Zheng and Huang [44] further contributed by benchmarking multiple machine learning models for real-time fault monitoring, establishing that data preprocessing, algorithmic selection, and hyperparameter tuning are decisive factors in predictive accuracy. Collectively, these investigations affirm the advancing sophistication of machine learning in robotic performance modeling. Nevertheless, the systematic design of ensemble architectures, particularly those providing quantifiable uncertainty estimates for repeatability prediction across disparate robot platforms, remains conspicuously absent in the existing literature.
The present investigation advances the state of the art by developing ensemble artificial neural network models specifically for industrial robot repeatability prediction, with three distinct contributions that differentiate it from prior work. First, while previous applications of neural networks to robotic systems have focused on calibration, path planning, or control, this study systematically develops and validates ensemble architectures specifically for repeatability prediction with quantified uncertainty intervals. Recent work on positioning error prediction using random forest methods has demonstrated the viability of machine learning for robotic applications, achieving prediction accuracies of 0.66 to 0.95 in terms of coefficients of determination depending on the axis [45]. The ensemble methodology provides both improved predictive accuracy and practical uncertainty estimates essential for manufacturing decision-making, addressing a critical gap in existing predictive tools.
Second, this work establishes a comprehensive predictive framework validated across two distinct robot platforms, the FANUC LR Mate 200iD and KUKA KR 6 R700 Sixx, using identical experimental conditions and measurement procedures. This comparative foundation is unprecedented in the repeatability prediction literature, as prior investigations have typically focused on single robot models [46] or employed different experimental protocols that complicate direct platform comparison. The selected robots represent contrasting design philosophies, enabling investigation of whether predictive models are platform-specific or can be generalized.
Third, the ensemble ANN approach automatically captures thermal payload-pose interactions without requiring explicit specification of interaction terms. While the companion experimental study has thoroughly characterized these effects through statistical analysis, the present work transforms this characterization into a predictive capability. The neural network methodology learns interaction patterns from data, providing predictive models that reflect the coupled nature of repeatability behavior. This data-driven interaction capture represents a fundamental advantage over regression approaches that require predetermined interaction structures [47].
The central hypothesis guiding this investigation is that ensemble neural networks, trained on systematically acquired experimental data, can provide accurate and reliable predictions of robot repeatability with quantified uncertainty, thereby enabling informed manufacturing decision-making. This hypothesis is examined through specific research questions: (1) Can ensemble ANN models achieve high predictive accuracy, as measured by , RMSE and MAE, for repeatability prediction across multiple robot platforms? (2) Can ensemble-based prediction intervals provide practically useful uncertainty estimates that capture the variability inherent in repeatability measurements? (3) Does predictive performance differ significantly between the two robot platforms, indicating the need for platform-specific models? (4) What operational guidelines can be derived from the predictive models for optimizing repeatability performance in terms of warm-up duration, payload selection, and pose configuration?
The practical significance of this investigation extends beyond academic contribution. For manufacturing engineers, the predictive models provide a tool for estimating repeatability under untested conditions without requiring exhaustive experimental campaigns. For process planners, the uncertainty intervals enable risk-informed tolerance allocation and quality assurance strategies. For robot selection decisions, the comparative analysis offers quantitative guidance on platform suitability for particular operating environments and precision requirements. By transforming experimental characterization into predictive capability, this work addresses a fundamental limitation in current manufacturing practice.
The remainder of this paper proceeds as follows. Section 2 details the experimental methodology, including robot platforms, measurement apparatus, experimental design, data collection procedures, and the ensemble ANN architecture and training protocol. Section 3 presents the results of experimental repeatability characterization and model development, including performance metrics and uncertainty analysis. Section 4 discusses the implications of findings for manufacturing practice and positions the contributions within the broader literature. Section 5 concludes with key contributions, limitations, and future research directions.
2. Materials and Methods
2.1. Robot Platforms
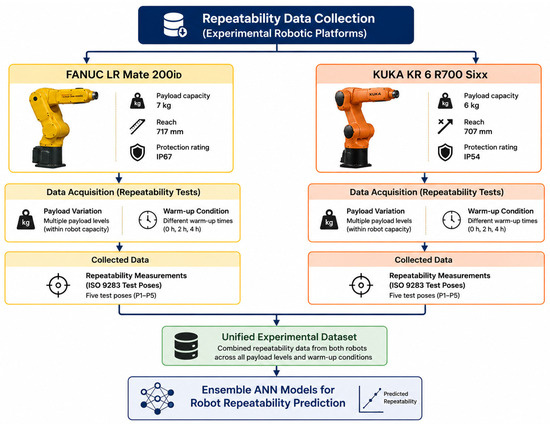
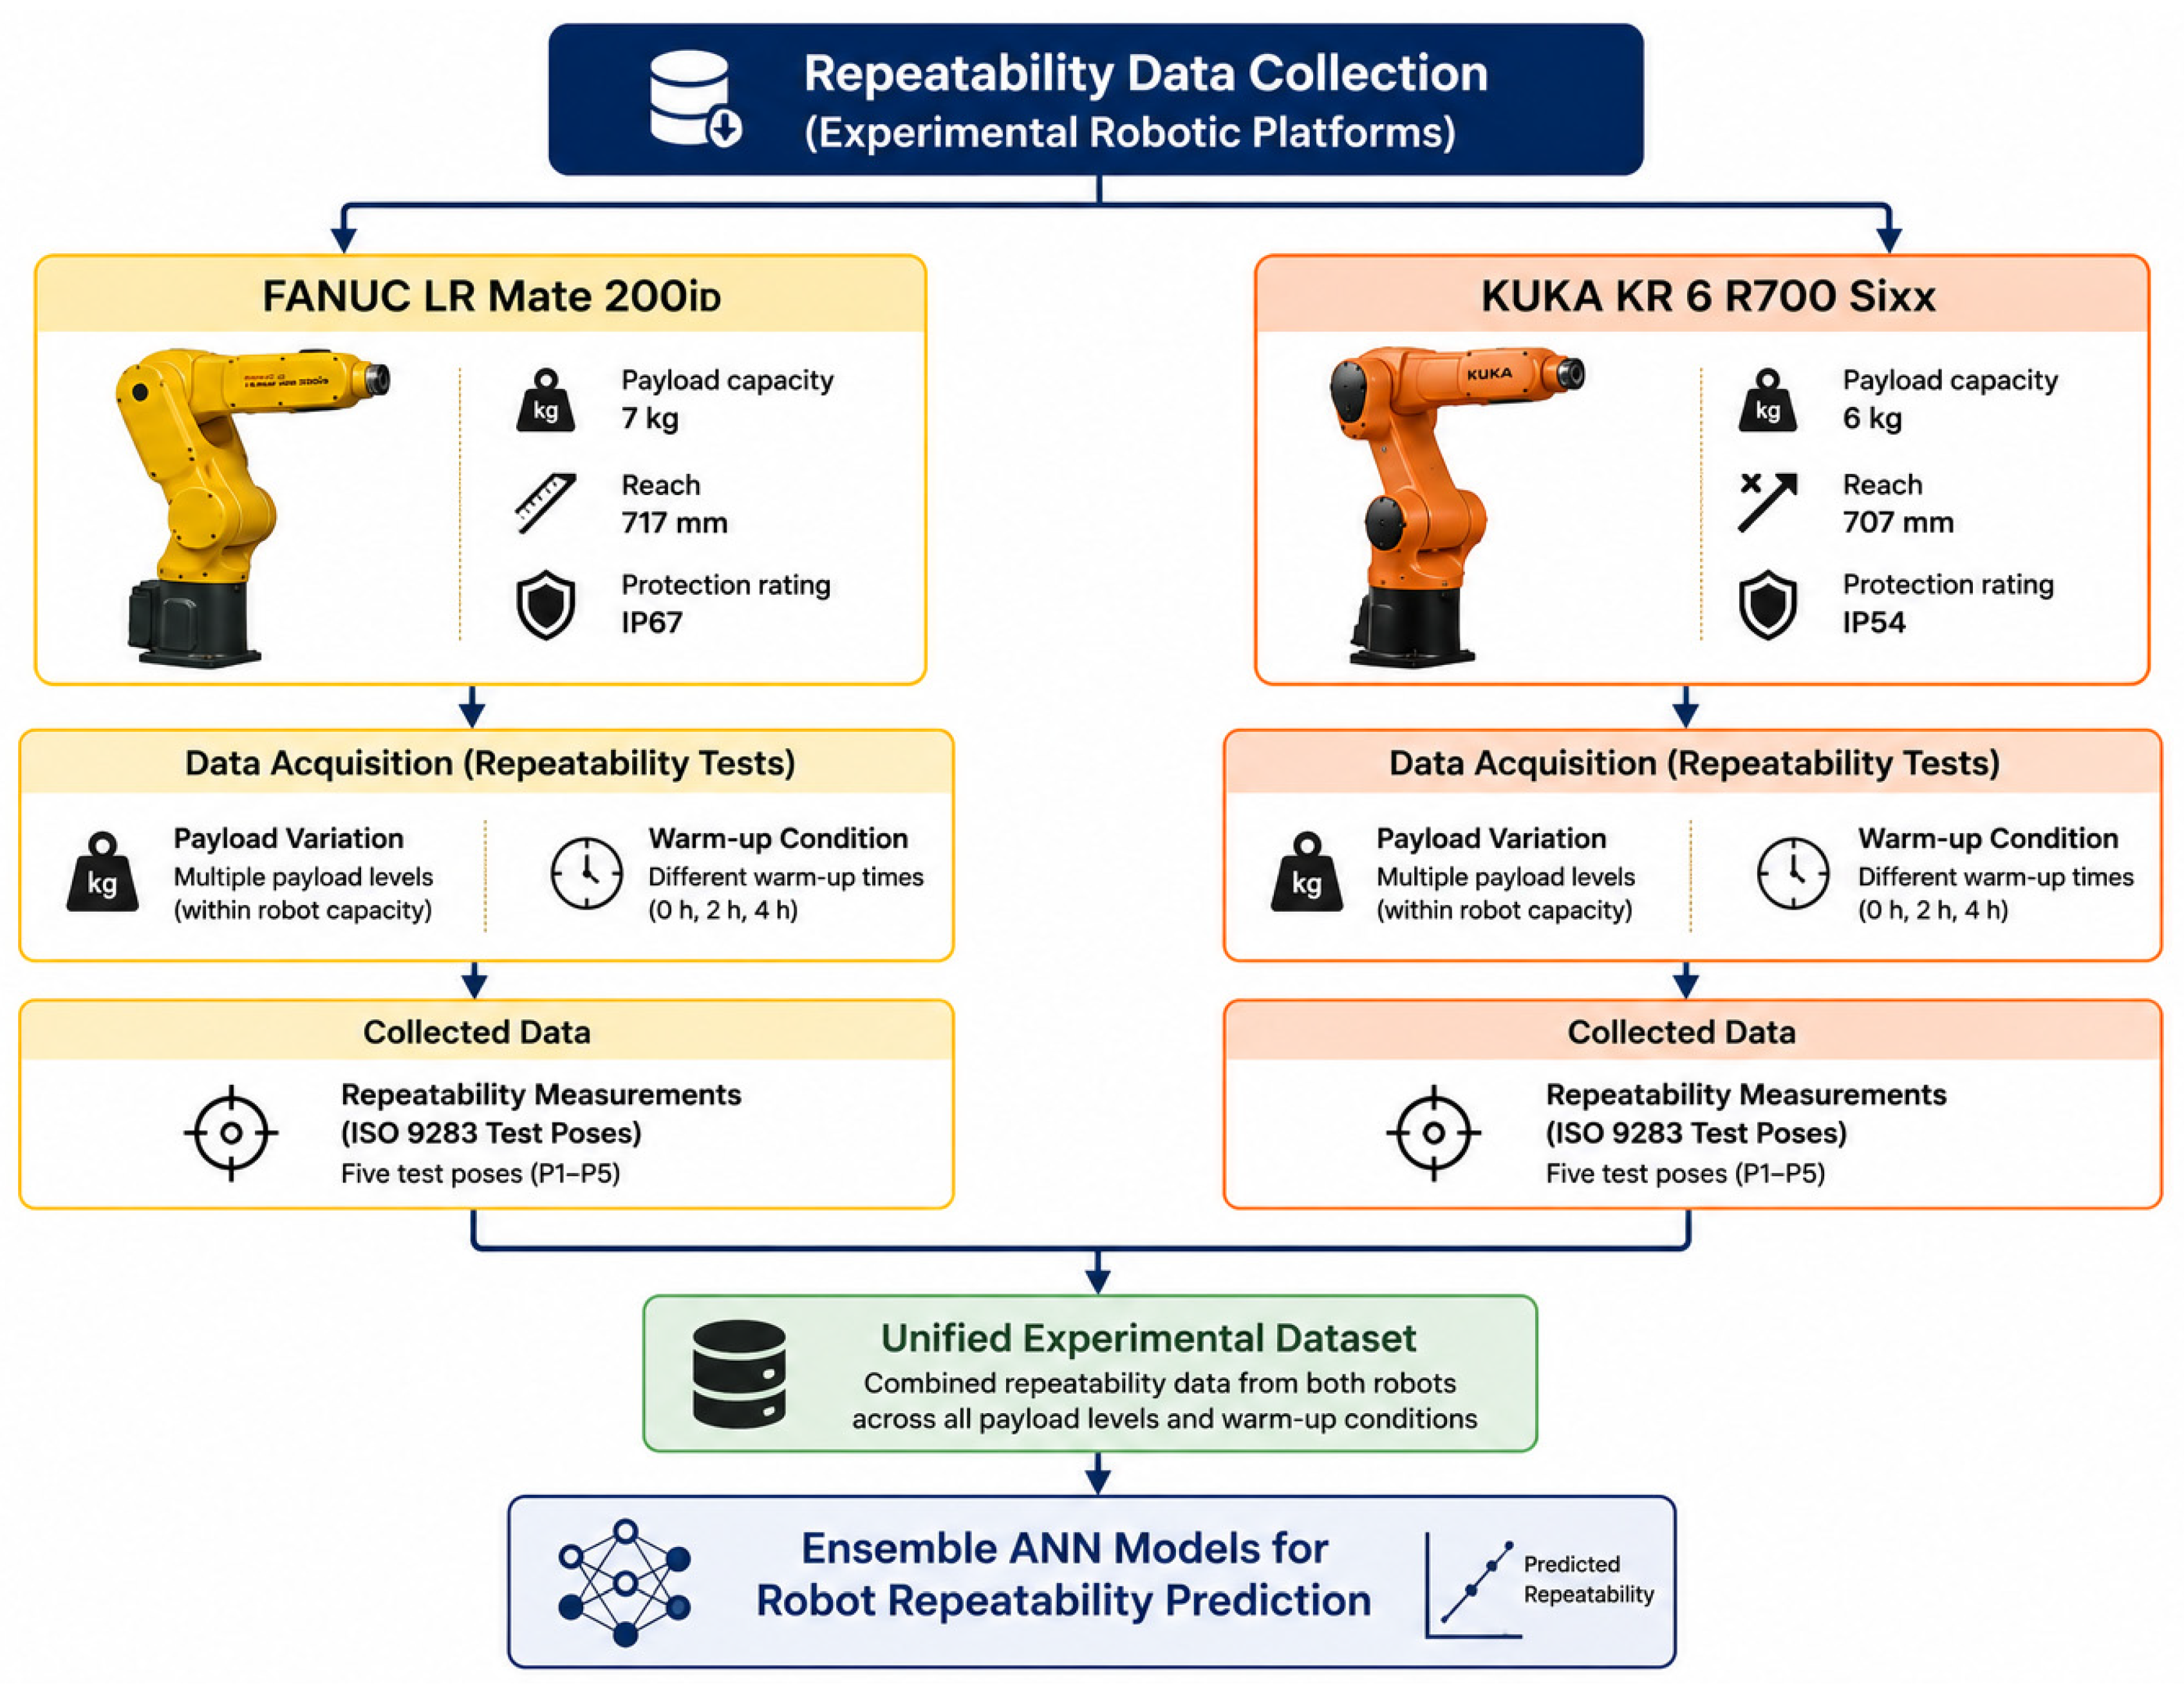
Figure 1 presents the two industrial robotic platforms adopted as the experimental systems throughout this investigation. The selection of these manipulators was intended to establish a representative benchmark for evaluating repeatability under identical testing conditions while accounting for differences in robot design and control implementation. Although both systems belong to the same class of compact six-degree-of-freedom industrial manipulators, they originate from different manufacturers and incorporate distinct mechanical architectures and motion-control strategies. This diversity enables a comprehensive assessment of whether the proposed modeling framework is transferable across robotic platforms rather than being tailored to a single manufacturer. Consequently, the comparative analysis performed in this study provides valuable insight into the robustness and generalization capability of the developed repeatability prediction methodology.
Figure 1.
Experimental robotic platforms used in this study.
2.2. Measurement System
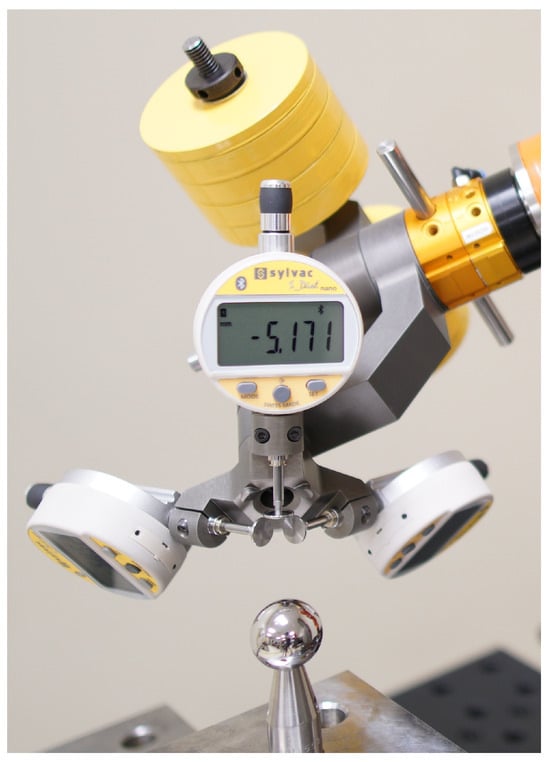
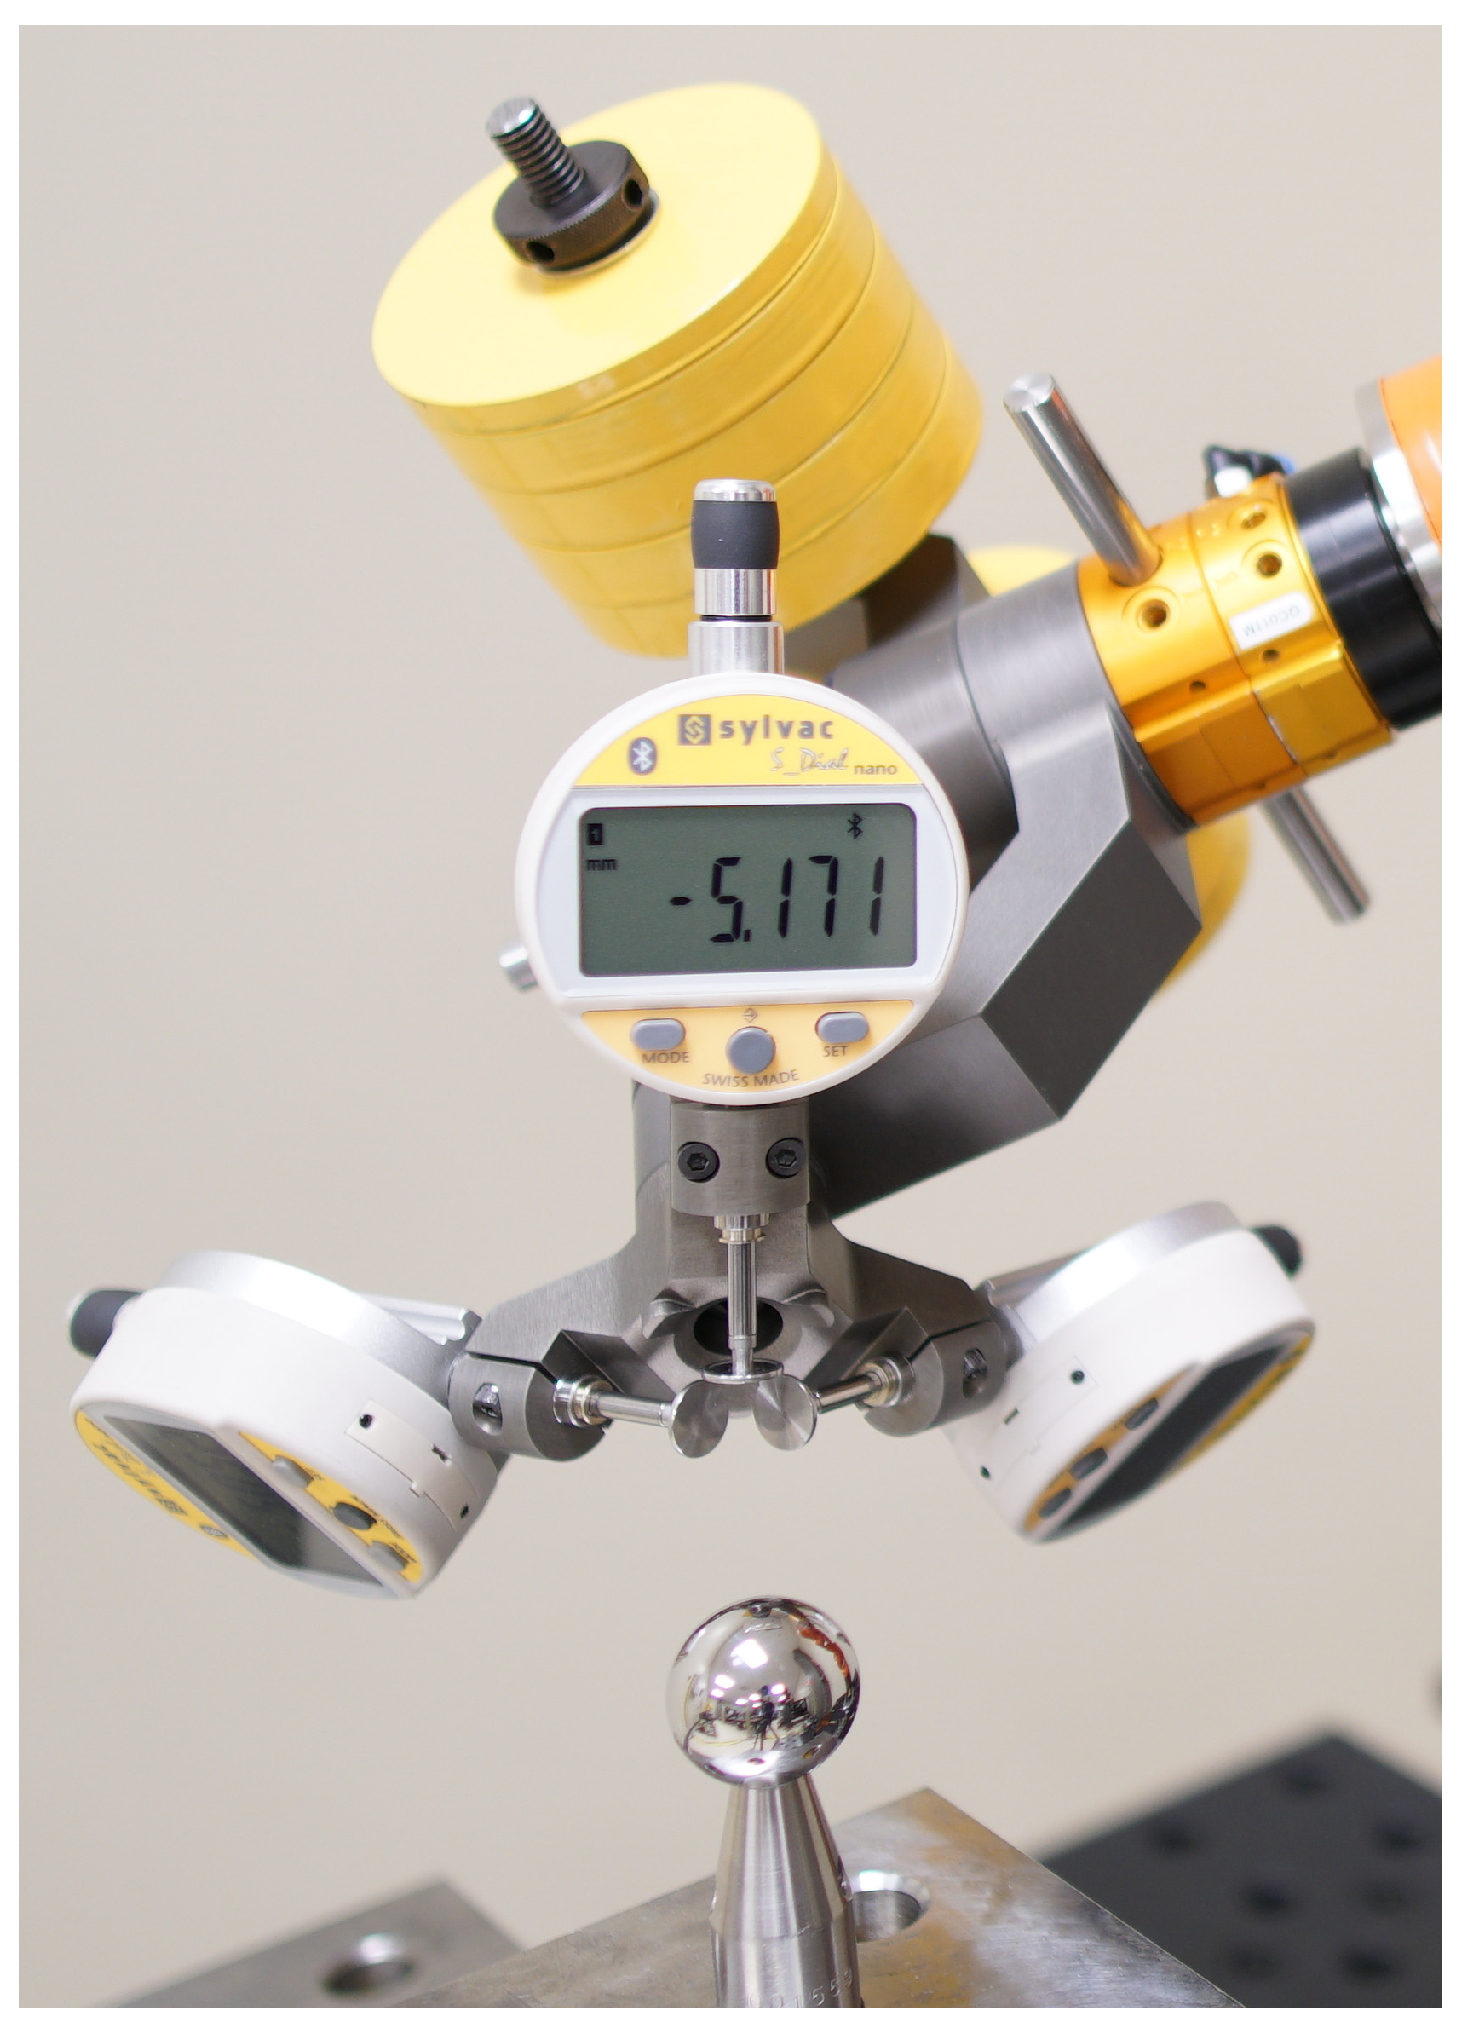
The TriCal device [48], was employed for positional deviation measurements. This portable measurement system comprises three mutually perpendicular Sylvac digital indicators configured to detect small TCP displacements (Figure 2). Each sensor has a resolution of 0.003 mm and a measuring span of 0–12.7 mm, facilitating the precise identification of kinematic parameters and joint stiffness characteristics through automated probing of reference spheres.
Figure 2.
TriCal system during automated reference sphere probing.
Although ISO 9283 [49] prescribes laser interferometry as a reference method, the repeatability levels of modern industrial robots (5–10 µm) approach the resolution limits of conventional laser trackers (≈5 µm/m). The TriCal system offers comparable precision with substantially lower capital investment (less than 10% of the cost of typical laser trackers), while maintaining adequate sensitivity for detecting small positional deviations [48,49].
2.3. Pose Selection and Workspace Sampling Strategy
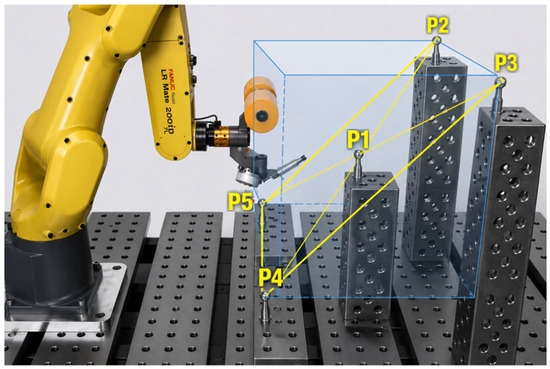
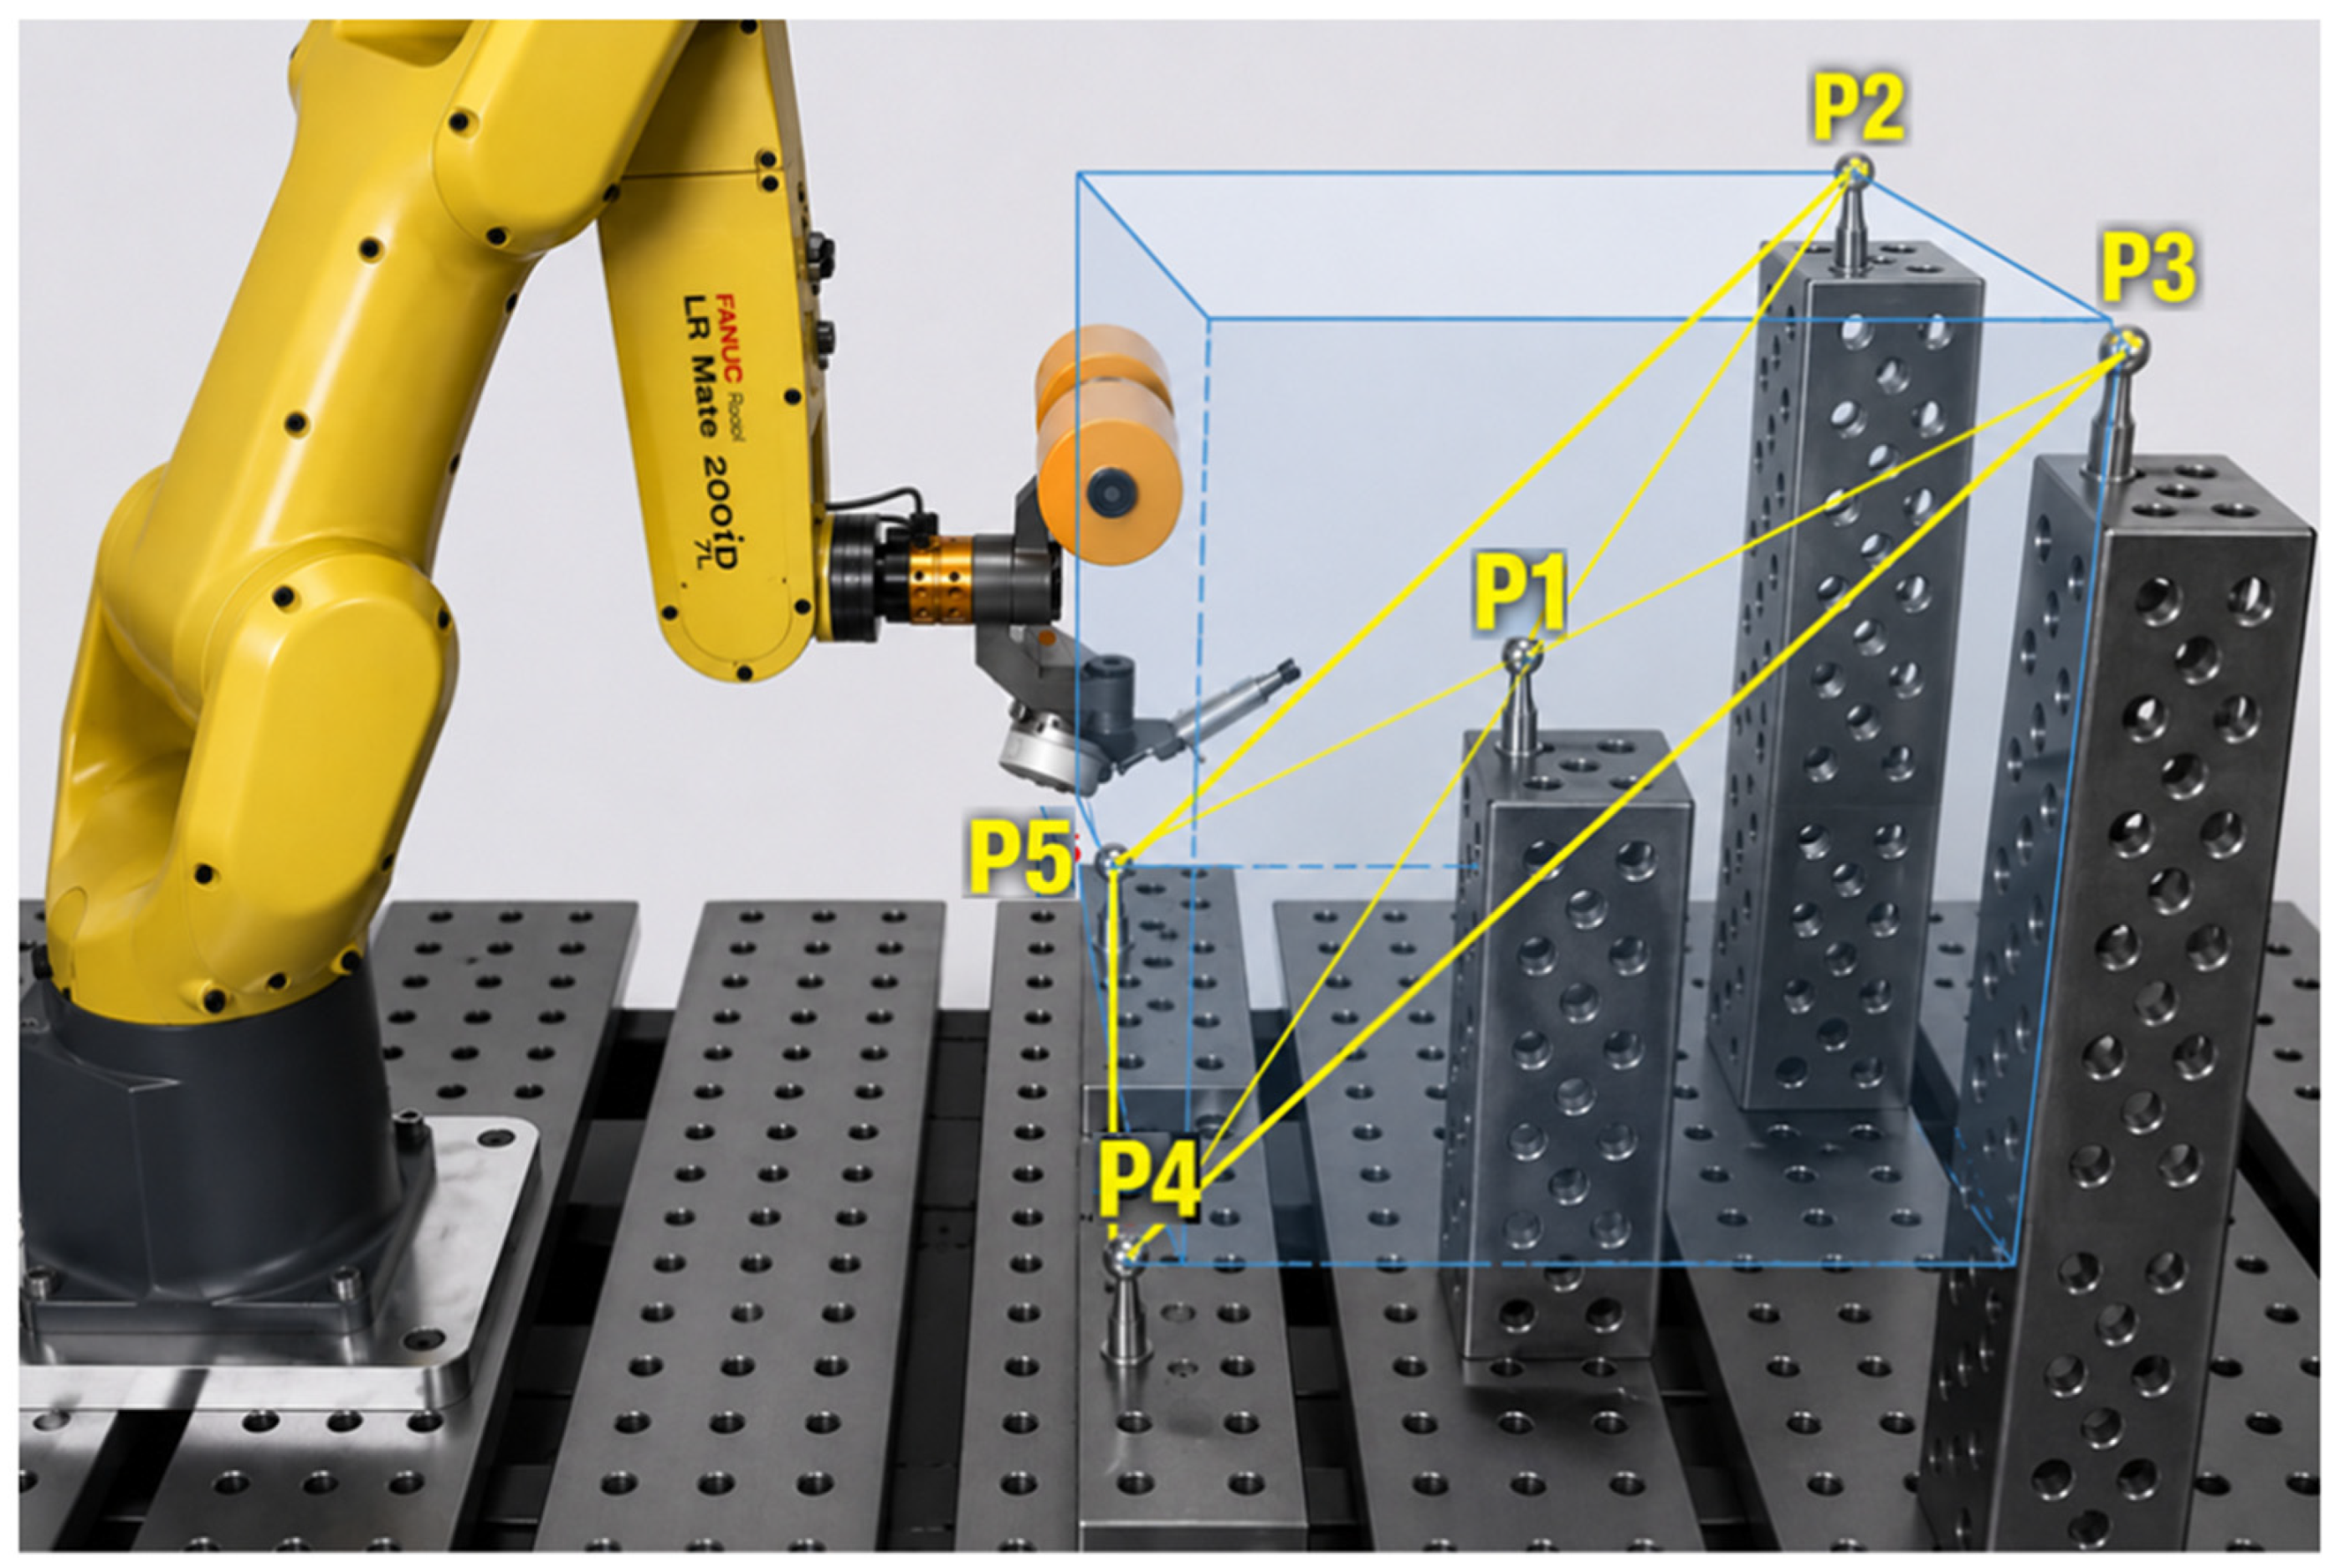
To capture configuration-dependent performance characteristics, five measurement points (P1–P5) were selected within the robot workspace according to the standardized procedure outlined in ISO 9283:1998 [49]. These points correspond to the four corners and the center of a virtual cube inscribed within the robot’s effective working envelope (Figure 3). This approach ensures systematic sampling of the workspace without requiring subjective configuration selection.
Figure 3.
Location of the five test positions (P1–P5) within the ISO cube in the robot workspace.
The selected poses were distributed along the cube’s diagonals and at its extremities to capture a wide range of kinematic configurations (Figure 3). By sampling multiple positions rather than a single location, the methodology provides comprehensive coverage of performance variations across the workspace. The cube dimensions and placement were chosen to reflect configurations typically encountered in industrial applications.
2.4. Experimental Variables and Their Levels
The experimental investigation examined three factors identified as primary contributors to repeatability dispersion. Table 1 summarizes the specific levels for each factor.
Table 1.
Design of Experiments (DOE) factors and levels.
Thermal State: Industrial manipulators experience dimensional changes as internal heat sources alter component temperatures, affecting joint clearances, friction, and servo compensation. To investigate this phenomenon, measurements were performed at three thermal conditions: immediate startup (0 h), intermediate state (2 h), and thermal equilibrium (4 h). The selected intervals were based on preliminary experiments showing positional stabilization after approximately two hours of continuous operation, consistent with previously reported thermal settling times [50].
Payload Conditions: The mechanical load applied at the TCP influences joint deflections and servo response. Three load levels were selected relative to each robot’s rated capacity, with eccentric mounting to replicate realistic industrial scenarios where the payload center of mass is typically offset from the robot’s wrist axis.
Spatial Configuration: Five distinct poses (P1–P5) were examined to assess the influence of robot configuration on repeatability, following the ISO 9283 framework described in Section 2.3.
The complete factorial design produced nine distinct operating conditions per robot (three warm-up levels × three payload levels). With measurements conducted at all five poses for each condition, this resulted in 45 experimental configurations per robot.
2.5. Measurement Protocol and Data Acquisition
A repeatable measurement protocol was implemented to ensure data reliability and stable operating conditions. The robot executed sequential movements from a reference position through the five target poses (P1–P5) following a standardized approach trajectory. Upon completing the P5 measurement, the robot returned to P1 to initiate the next measurement cycle. Each complete cycle was repeated 300 times under identical conditions.
A methodological consideration is the use of a fixed cyclic pose sequence (P1–P5). This sequence was deliberately employed to maintain consistent thermal and mechanical conditions across measurement cycles, as randomized sequences could introduce additional variability in the robot’s thermal state. The 300 repetitions per condition ensure that any transient effects are averaged out and the cyclical nature ensures that each pose is measured at comparable points in the robot’s thermal and mechanical state across repetitions. The consistent repeatability values observed across the 300 cycles support the stability of the measurements.
At each pose, the TriCal system recorded the TCP displacement relative to the programmed position. The cyclic measurement design maintains consistent thermal conditions throughout data acquisition, enabling robust statistical characterization of positional dispersion.
All measured data points were retained in the analysis (no outlier removal) to represent realistic operational variability. Repeatability was calculated according to ISO 9283 [49] using the Euclidean distance of each measured point from the centroid of the 300-position cloud. For each repetition j:
where:
- is the Euclidean distance from the measured point to the centroid;
- are the measured coordinates;
- are the mean coordinates.
The repeatability metric RP for each pose and condition was then computed as:
where is the mean of the Euclidean distances and S is the standard deviation.
The resulting dataset, comprising 45 repeatability values per robot, was used for ensemble ANN training and validation.
2.6. Ensemble Artificial Neural Network Architecture
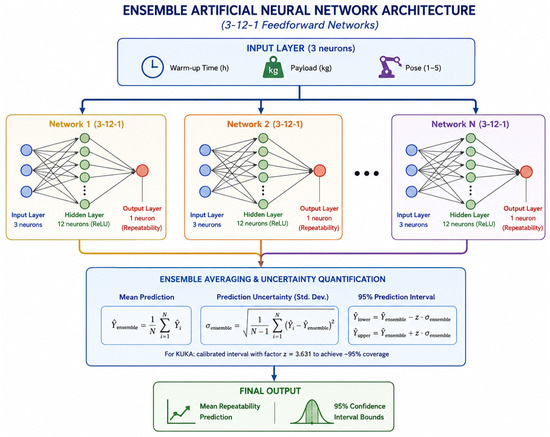
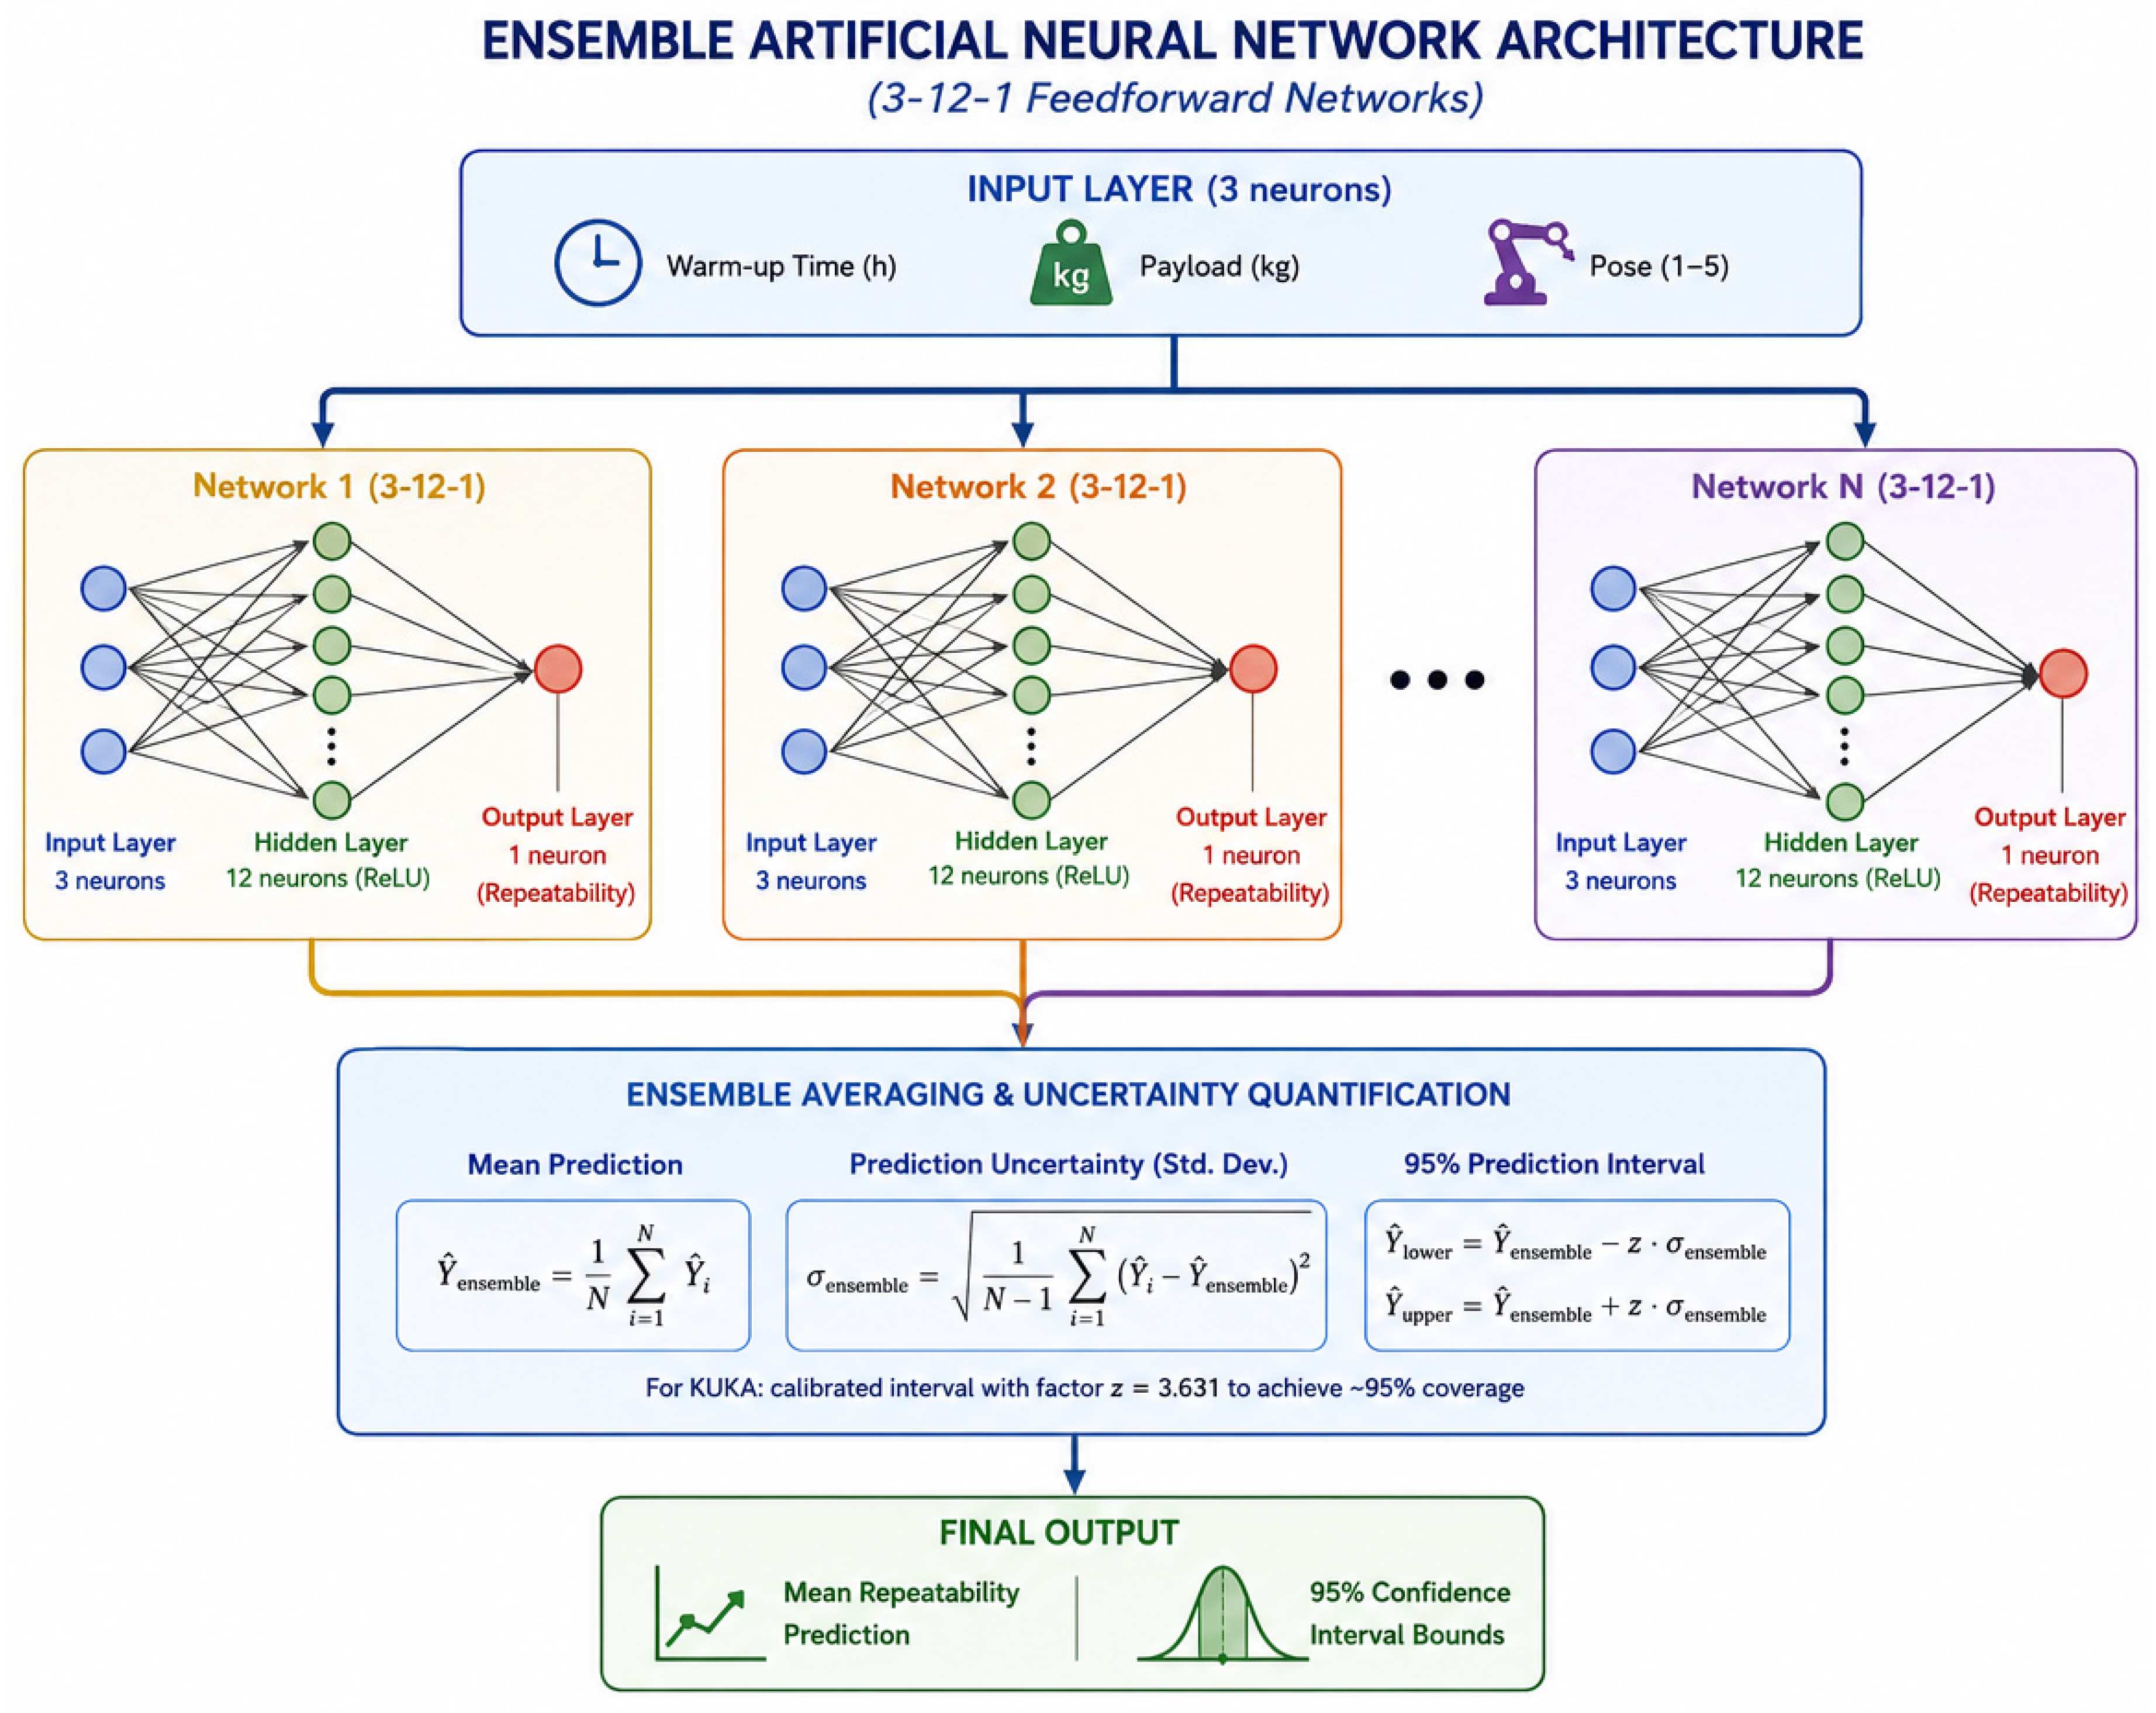
An ensemble of artificial neural networks was developed for each robot to model the relationship between operational factors and repeatability. The ensemble architecture (Figure 4) consists of 10 independently trained feedforward networks (20 for KUKA), each with:
Figure 4.
Workflow of the proposed ensemble artificial neural network framework for robot repeatability prediction and uncertainty quantification.
- Input layer: 3 neurons (warm-up time, payload, and pose);
- Hidden layer: 12 neurons with ReLU activation (max(0, z));
- Output layer: 1 neuron (repeatability prediction).
2.6.1. Training Procedure
Each network in the ensemble was trained independently using standard feedforward backpropagation with momentum [51]. Weights were initialized using the He et al. scheme [52], where input-to-hidden weights were drawn from a normal distribution scaled by the number of input neurons:
where . Training hyperparameters included a learning rate of 0.01 with exponential decay (0.999 per epoch), momentum of 0.9, as well as 3000 epochs for FANUC and 5000 for KUKA, with Mean Squared Error (MSE) as the loss function.
The network architecture comprises an input layer (3 neurons: warm-up time, payload, pose), a single hidden layer (12 neurons) with ReLU activation [53], and an output layer (1 neuron: repeatability prediction). The number of hidden neurons (12) was determined through a systematic grid search over candidate architectures {6, 8, 10, 12, 16, 20} using leave-one-out cross-validation (LOOCV). For each candidate architecture, the average coefficient of determination (R2) across all LOOCV folds was computed. The 12-neuron architecture was selected as it provided the best balance between predictive accuracy and model complexity, consistent with the principle of parsimony. Architectures with more than 12 neurons yielded negligible improvements in predictive accuracy while increasing the number of trainable parameters and the associated risk of overfitting. This systematic approach ensures that the architecture selection is objective and reproducible.
During forward propagation, the hidden layer computes a linear combination of inputs and biases followed by ReLU activation, producing the final prediction at the output layer. Backpropagation computes gradients of the MSE loss with respect to network weights using the chain rule [54], with ReLU derivatives passing gradients only for positive activations [55]. A momentum term accelerates convergence and smooths oscillations [51]:
with μ = 0.9 and η = 0.01. Input features and target values were normalized to zero mean and unit variance [51].
where are the means and standard deviations of the input features and target values, respectively. This normalization is critical for stable and efficient convergence [56].
The categorical variable ‘pose’ (P1 through P5) was encoded as an ordinal numerical value (1, 2, 3, 4, 5) corresponding to the five measurement positions. This encoding was chosen because the poses are ordered along the ISO cube and pose-dependent performance tends to vary smoothly across this sequence. The pose values were normalized to zero mean and unit variance along with the other input features (warm-up time and payload), ensuring consistent scaling across all inputs [57].
2.6.2. Ensemble Averaging and Uncertainty Quantification
Once all networks in the ensemble are trained, their predictions are combined to produce a final, more robust prediction. This approach reduces prediction variance and improves generalization [35,58].
The final ensemble prediction is the average of all individual network predictions:
where N is the number of networks in the ensemble (10 for FANUC, 20 for KUKA). This averaging smooths out the idiosyncratic errors of individual networks, resulting in a more reliable prediction [35].
The uncertainty of the ensemble prediction is quantified by the standard deviation of the individual predictions:
This standard deviation serves as a measure of the model’s confidence: a small indicates high agreement among the networks, while a large value suggests greater uncertainty.
Assuming the prediction errors are approximately normally distributed, 95% prediction intervals were constructed as:
where z = 1.96 corresponds to the 95% confidence level. These intervals provide a range within which the true repeatability value is expected to lie with 95% confidence [33].
For the KUKA robot, a calibrated prediction interval was implemented with a calibration factor of 3.631 to achieve the desired 95% coverage. This adjustment accounts for the higher variability observed in the KUKA dataset [59].
For the KUKA robot, a post hoc calibration procedure was employed to achieve the desired 95% prediction interval coverage. This calibration was necessary because the ensemble standard deviation (Equation (9)) captures only the variance between network predictions, not the full prediction uncertainty (including measurement noise, model misspecification, and data-scarcity effects). A multiplier c was systematically varied over the range [1.0, 5.0] with step size 0.01, and the coverage (percentage of training samples within the interval [Ŷ − c · , Ŷ + c · ]) was computed for each value, where Ŷ is the ensemble prediction (Equation (8)). The optimal multiplier c = 3.631 was selected as the smallest value achieving at least 95% coverage on the training set. This value is larger than the standard Gaussian multiplier of 1.96 (used in Equations (10) and (11)), indicating that underestimates the true prediction uncertainty for the KUKA model. This underestimation may be attributed to three factors: (i) higher data variability in certain conditions (e.g., P2 and P3 poses), (ii) deviations from normality in the prediction error distribution, and (iii) the limited dataset size (45 samples) that constrains the ensemble’s ability to estimate uncertainty accurately. This calibration approach is consistent with established practices in ensemble uncertainty quantification when the simple Gaussian assumption does not hold [59].
2.6.3. Performance Metrics
The predictive performance of the ensemble ANN was evaluated using three standard metrics: the coefficient of determination, the root mean square error, and the mean absolute error.
- (a)
- Coefficient of Determination (R2):
The coefficient of determination measures the proportion of variance in the experimental data that is explained by the model [60]:
where are the experimental repeatability values, are the predicted values, and is the mean of the experimental values. An value close to 1 indicates that the model captures most of the variability in the data [60].
- (b)
- Root Mean Square Error (RMSE):
The RMSE measures the standard deviation of the prediction errors, giving higher weight to large errors [61]:
This metric is expressed in the same units as the target variable (mm), making it directly interpretable [61].
- (c)
- Mean Absolute Error (MAE):
The MAE measures the average absolute difference between the experimental and predicted values [61]:
Unlike RMSE, MAE is less sensitive to outliers and provides a more intuitive measure of average prediction error [61].
- (d)
- Prediction Interval Coverage:
The prediction interval coverage is defined as the percentage of experimental data points that fall within the computed 95% prediction interval. This metric directly evaluates the reliability of the uncertainty estimates [59].
2.6.4. Model Validation Using Leave-One-Out Cross-Validation
Due to the limited dataset size (45 samples per robot), a traditional hold-out train/validation/test split would have resulted in insufficient training data and unreliable performance estimates. Therefore, leave-one-out cross-validation (LOOCV) was employed to evaluate the predictive performance of the ensemble ANN models [62]. In this approach, for each of the 45 samples, an ensemble of networks was trained on the remaining 44 samples, and the prediction for the held-out sample was recorded. This process was repeated 45 times, with each sample serving exactly once as the test sample. The reported performance metrics (R2, RMSE, MAE) are the averaged results across all LOOCV folds, providing unbiased estimates of the model’s generalization capability [63].
After validation, the final ensemble models were trained on all 45 samples to generate the response surfaces and prediction intervals presented in Section 3. This two-stage approach ensures that: (1) the performance metrics reflect predictive accuracy on unseen data, and (2) the final models leverage all available experimental data for maximum predictive capability in practical applications.
This cross-validation strategy is consistent with established practices in small-sample machine learning applications for manufacturing metrology, where experimental data collection is time-intensive and sample sizes are inherently limited [64,65].
The risk of overfitting, a legitimate concern when training neural networks on small datasets, is further mitigated through three complementary mechanisms inherent in the proposed methodology. First, the ensemble architecture, comprising multiple independently initialized networks, inherently reduces variance and smooths out idiosyncratic errors that could arise from any single network [35]. This approach is particularly effective for small datasets, as it prevents the model from relying on spurious patterns that might be learned by individual networks due to their different initializations. Second, the choice of a single hidden layer with a limited number of neurons (12) represents a parsimonious architecture that balances model capacity with the available data. This design choice follows the principle of Occam’s razor, where the simplest model that can capture the underlying relationships is preferred to minimize overfitting risk. Third, the use of L2 regularization (weight decay) during training, as described in Section 2.6.1, further constrains the model complexity by penalizing large weights, thereby discouraging the network from fitting noise in the training data [66]. Collectively, these mechanisms ensure that the ensemble ANN models generalize well to unseen conditions without requiring an excessively large dataset.
3. Results
3.1. Experimental Repeatability Characterization
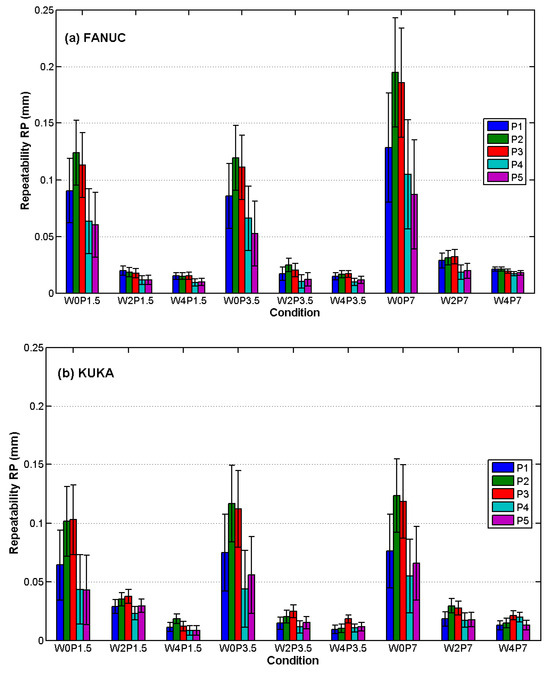
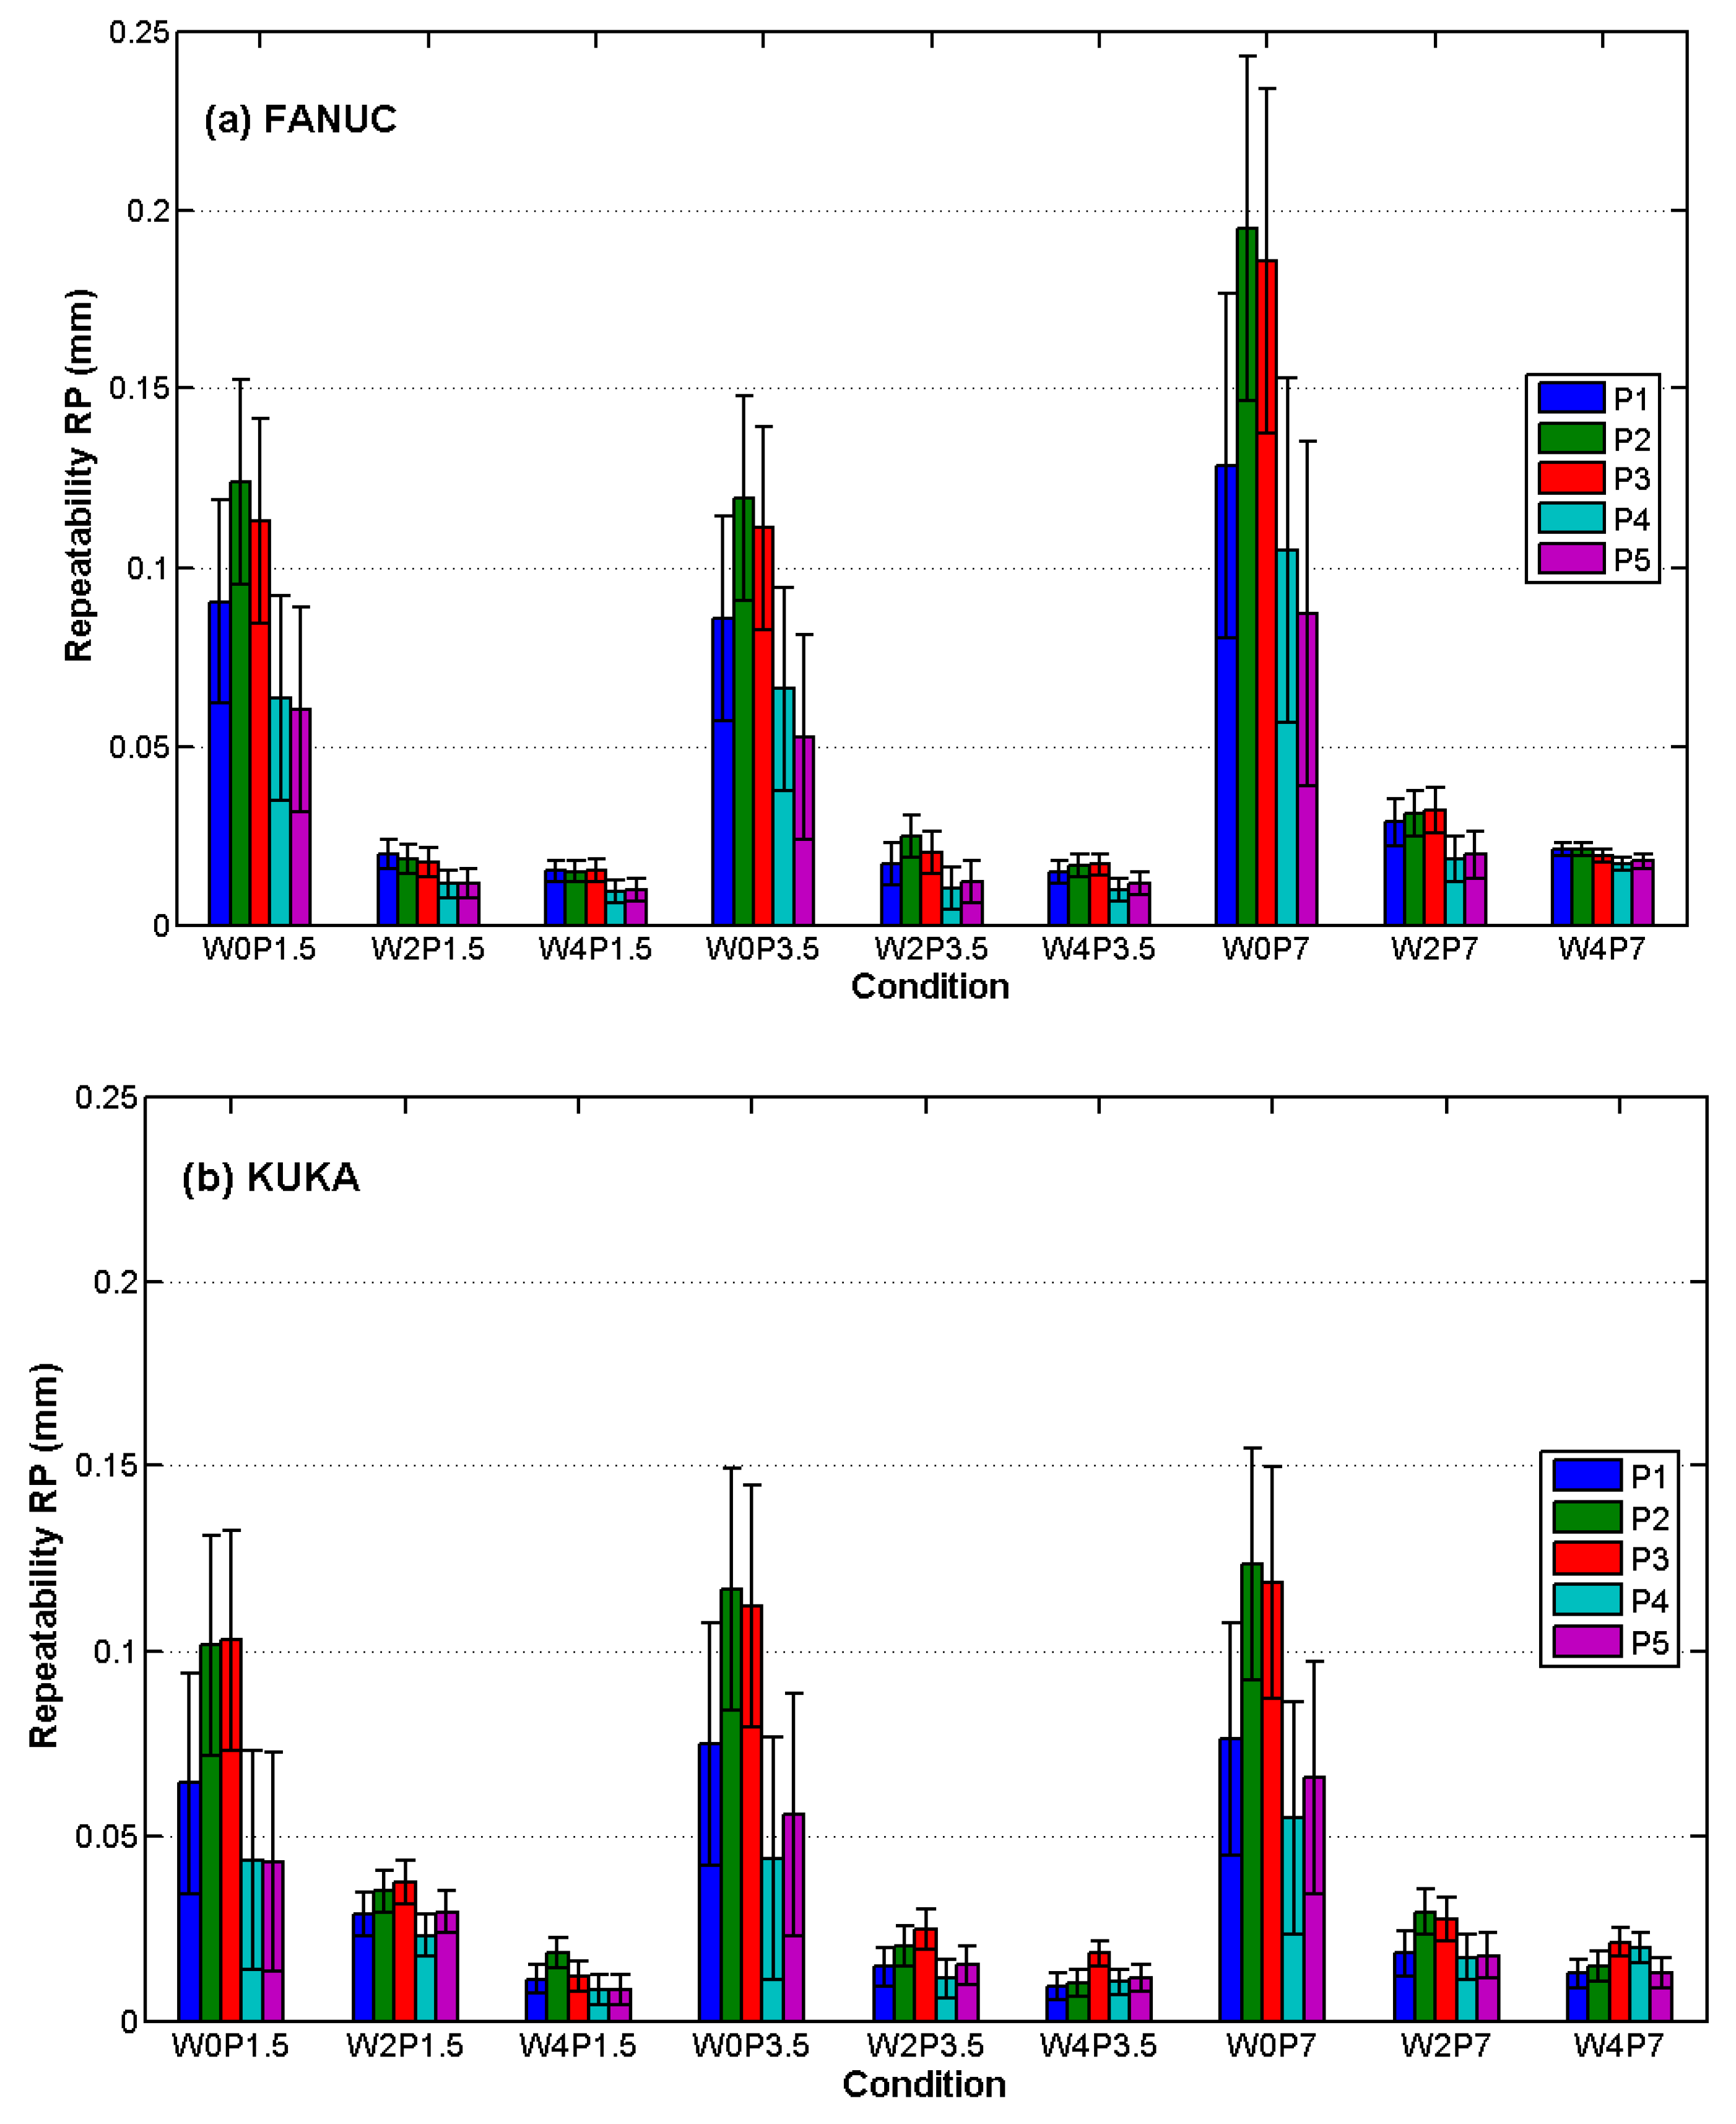
The overall repeatability statistics are summarized in Table 2. Figure 5a (FANUC) and Figure 5b (KUKA) present the grouped bar plots showing the detailed RP values for each pose across all conditions. The FANUC robot exhibited a mean repeatability of 0.047 mm (σ = 0.049 mm), ranging from 0.009 mm (W4P1.5) to 0.195 mm (W0P7), corresponding to a 21.7-fold variation. The KUKA robot demonstrated superior overall performance with a mean repeatability of 0.039 mm (σ = 0.034 mm), ranging from 0.008 mm to 0.123 mm (15.4-fold variation).
Table 2.
Overall repeatability statistics for FANUC LR Mate 200iD and KUKA KR 6 R700.
Figure 5.
Grouped bar plot of repeatability for all poses across experimental conditions (with error bars). (a) FANUC LR Mate 200iD; (b) KUKA KR 6 R700.
The KUKA robot thus showed 17.2% better mean repeatability and 29.2% lower variability. Both robots achieved similar best-case performance (FANUC: 0.009 mm; KUKA: 0.008 mm), with KUKA showing a marginal 9.3% improvement. The FANUC robot exhibited a wider RP range (0.186 mm vs. 0.115 mm), indicating greater sensitivity to operating conditions, as evident from the spread of data points and error bars in Figure 5. The error bars reveal similar pose-dependent variability patterns, with P2 exhibiting the largest variation for both robots (FANUC: σ = 0.066 mm; KUKA: σ = 0.047 mm), while P5 (FANUC: σ = 0.028 mm) and P4 (KUKA: σ = 0.017 mm) showed the smallest variations.
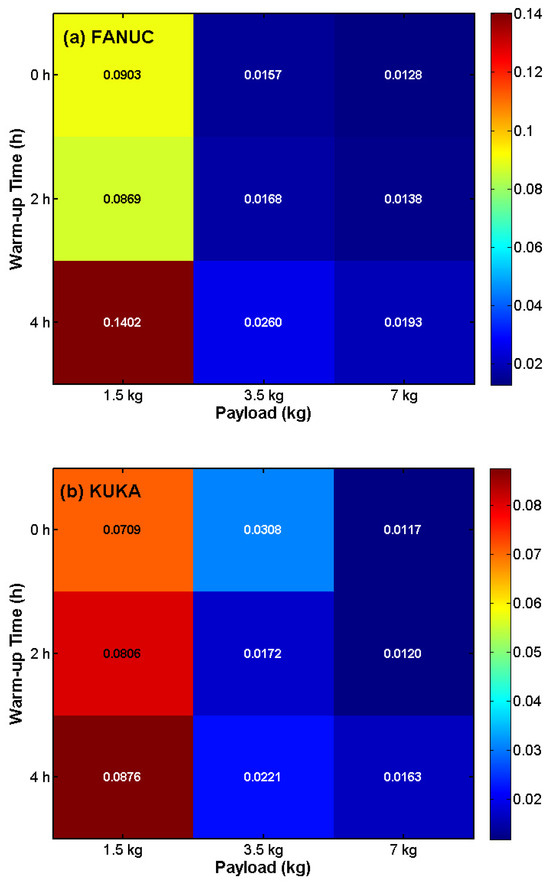
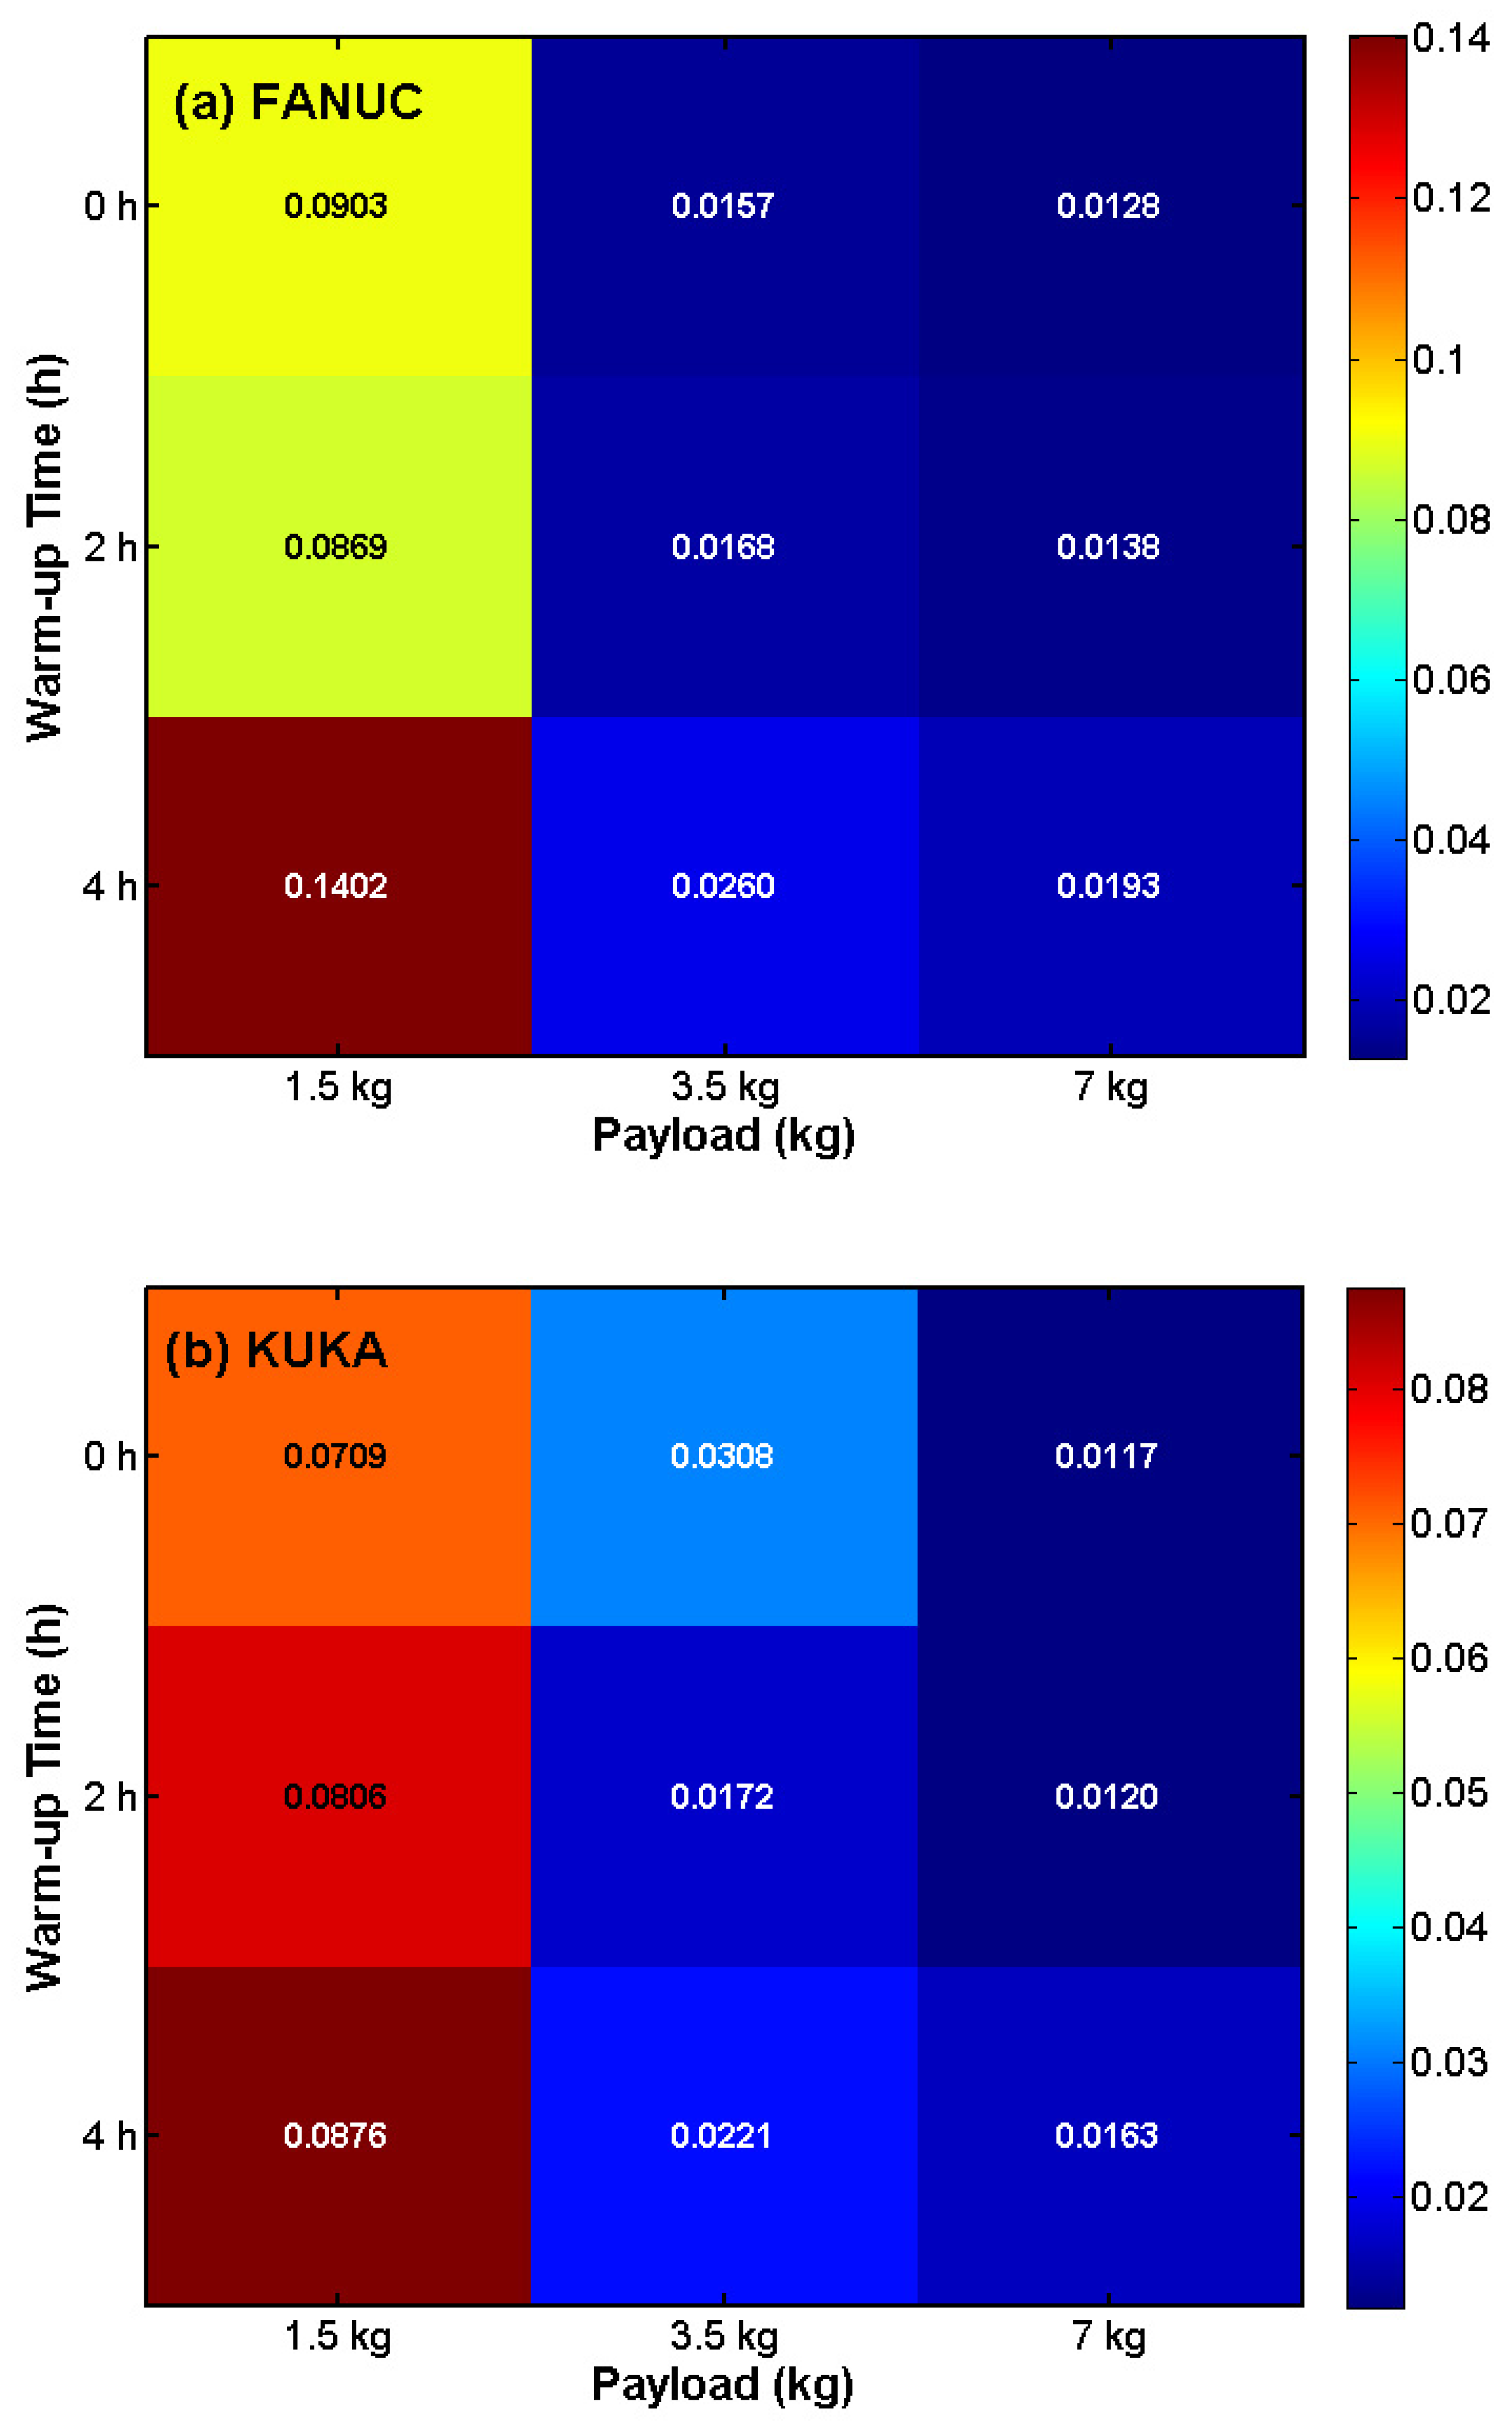
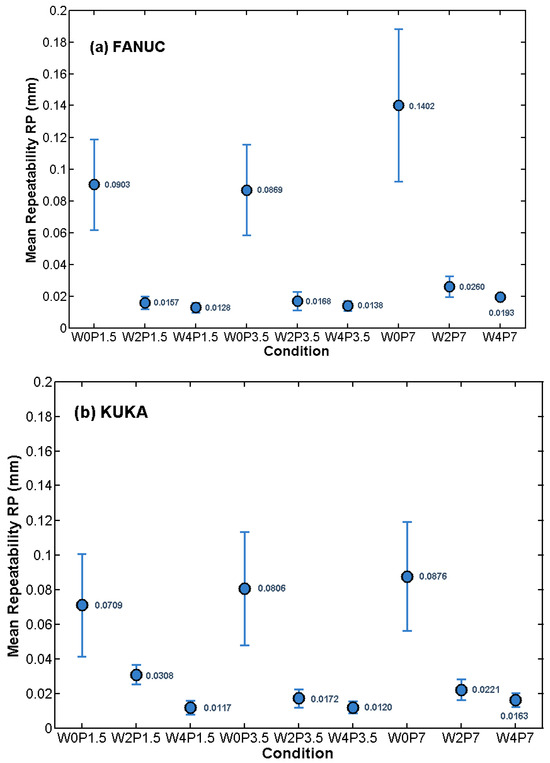
The effects of payload and warm-up time on repeatability are illustrated in Figure 6 and Figure 7. Both robots exhibit improved repeatability with increasing payload, attributed to mechanical damping effects. The FANUC robot showed an 11-fold improvement from 1.5 kg to 7 kg payload, with best performance at 7 kg (RP: ≈0.013–0.019 mm) and worst at 1.5 kg with 4 h warm-up (RP: ≈0.14 mm). The KUKA robot showed its best performance at 7 kg payload (RP: ≈0.012–0.016 mm), with worst performance at 1.5 kg with 4 h warm-up (RP: 0.0876 mm), representing a 7.5-fold improvement. The heatmap clearly shows that the optimal performance region for both robots is at high payload (7 kg) with 0 h warm-up. Notably, warm-up degrades repeatability at high payload for both robots: FANUC from 0.0128 mm to 0.0193 mm (51% degradation) and KUKA from 0.0117 mm to 0.0163 mm (39% degradation).
Figure 6.
Repeatability heatmap as a function of payload and warm-up time (mean RP, mm). (a) FANUC LR Mate 200iD; (b) KUKA KR 6 R700. Lower values (blue) indicate better repeatability.
Figure 7.
Mean repeatability ± standard deviation by experimental condition. (a) FANUC LR Mate 200iD; (b) KUKA KR 6 R700.
Analysis of the heatmap (Figure 6) and mean repeatability plots (Figure 7) reveals that warm-up unexpectedly degrades repeatability across most payload levels for both robots. For the FANUC robot, repeatability worsened by 55.3% at 1.5 kg payload (0.0903 mm to 0.1402 mm), by 65.6% at 3.5 kg payload (0.0157 mm to 0.0260 mm) and by 50.8% at 7 kg payload (0.0128 mm to 0.0193 mm) after 4 h of warm-up. For the KUKA robot, repeatability worsened by 23.6% at 1.5 kg payload (0.0709 mm to 0.0876 mm) and by 39.3% at 7 kg payload (0.0117 mm to 0.0163 mm) after 4 h of warm-up. The only exception was at 3.5 kg payload for KUKA, where repeatability improved by 28.2% (0.0308 mm to 0.0221 mm). This unexpected degradation at most conditions may be attributed to thermal expansion effects within the robot’s joints and changes in lubricant viscosity that alter friction characteristics during prolonged operation, as previously observed in thermal drift studies of industrial manipulators [56,57]. The optimal repeatability for both robots was consistently achieved at the highest payload (7 kg) under cold-start conditions (0 h warm-up), suggesting that the robots are optimally tuned for operation at their rated payload under thermally stable conditions. Standard deviations decreased substantially with warm-up time, with both robots achieving standard deviations below 0.004 mm at 4 h warm-up, indicating stable and predictable performance after thermal equilibrium, albeit at a higher mean RP value.
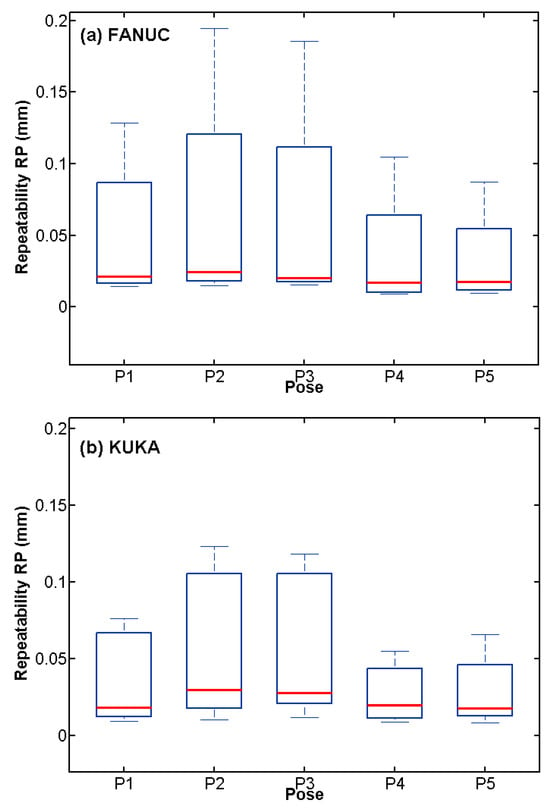
Figure 8 presents the boxplot analysis for pose-dependent performance. Both robots exhibit significant pose-dependent variations, with P2 and P3 consistently showing the worst repeatability (FANUC: 0.059–0.063 mm; KUKA: 0.052–0.053 mm) and P4 and P5 showing the best (FANUC: 0.031–0.034 mm; KUKA: 0.026–0.029 mm). The interquartile ranges reveal that FANUC’s P2 has an IQR of 0.103 mm, while KUKA’s P2 has an IQR of 0.088 mm, indicating that KUKA provides more consistent performance even in problematic poses.
Figure 8.
Repeatability distribution by pose (boxplot representation). (a) FANUC LR Mate 200iD; (b) KUKA KR 6 R700.
Significant interaction effects between warm-up time and payload are revealed in Figure 6 and Figure 7. The beneficial effect of warm-up is more pronounced at low payloads for both robots, suggesting that thermal stabilization primarily reduces friction and compliance effects that are more dominant when mechanical damping is low. For FANUC, the interaction strength is high (86% improvement at both low and high payloads), indicating that thermal and mechanical factors are strongly coupled. For KUKA, the interaction strength is more moderate (84% at low payload, 81% at high payload), indicating less strong coupling.
3.2. Ensemble ANN Prediction Performance
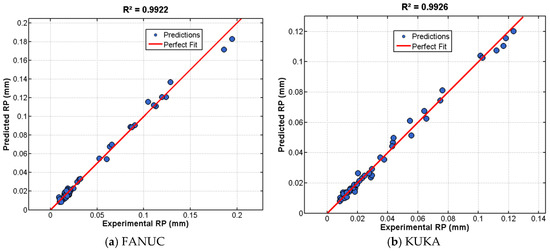
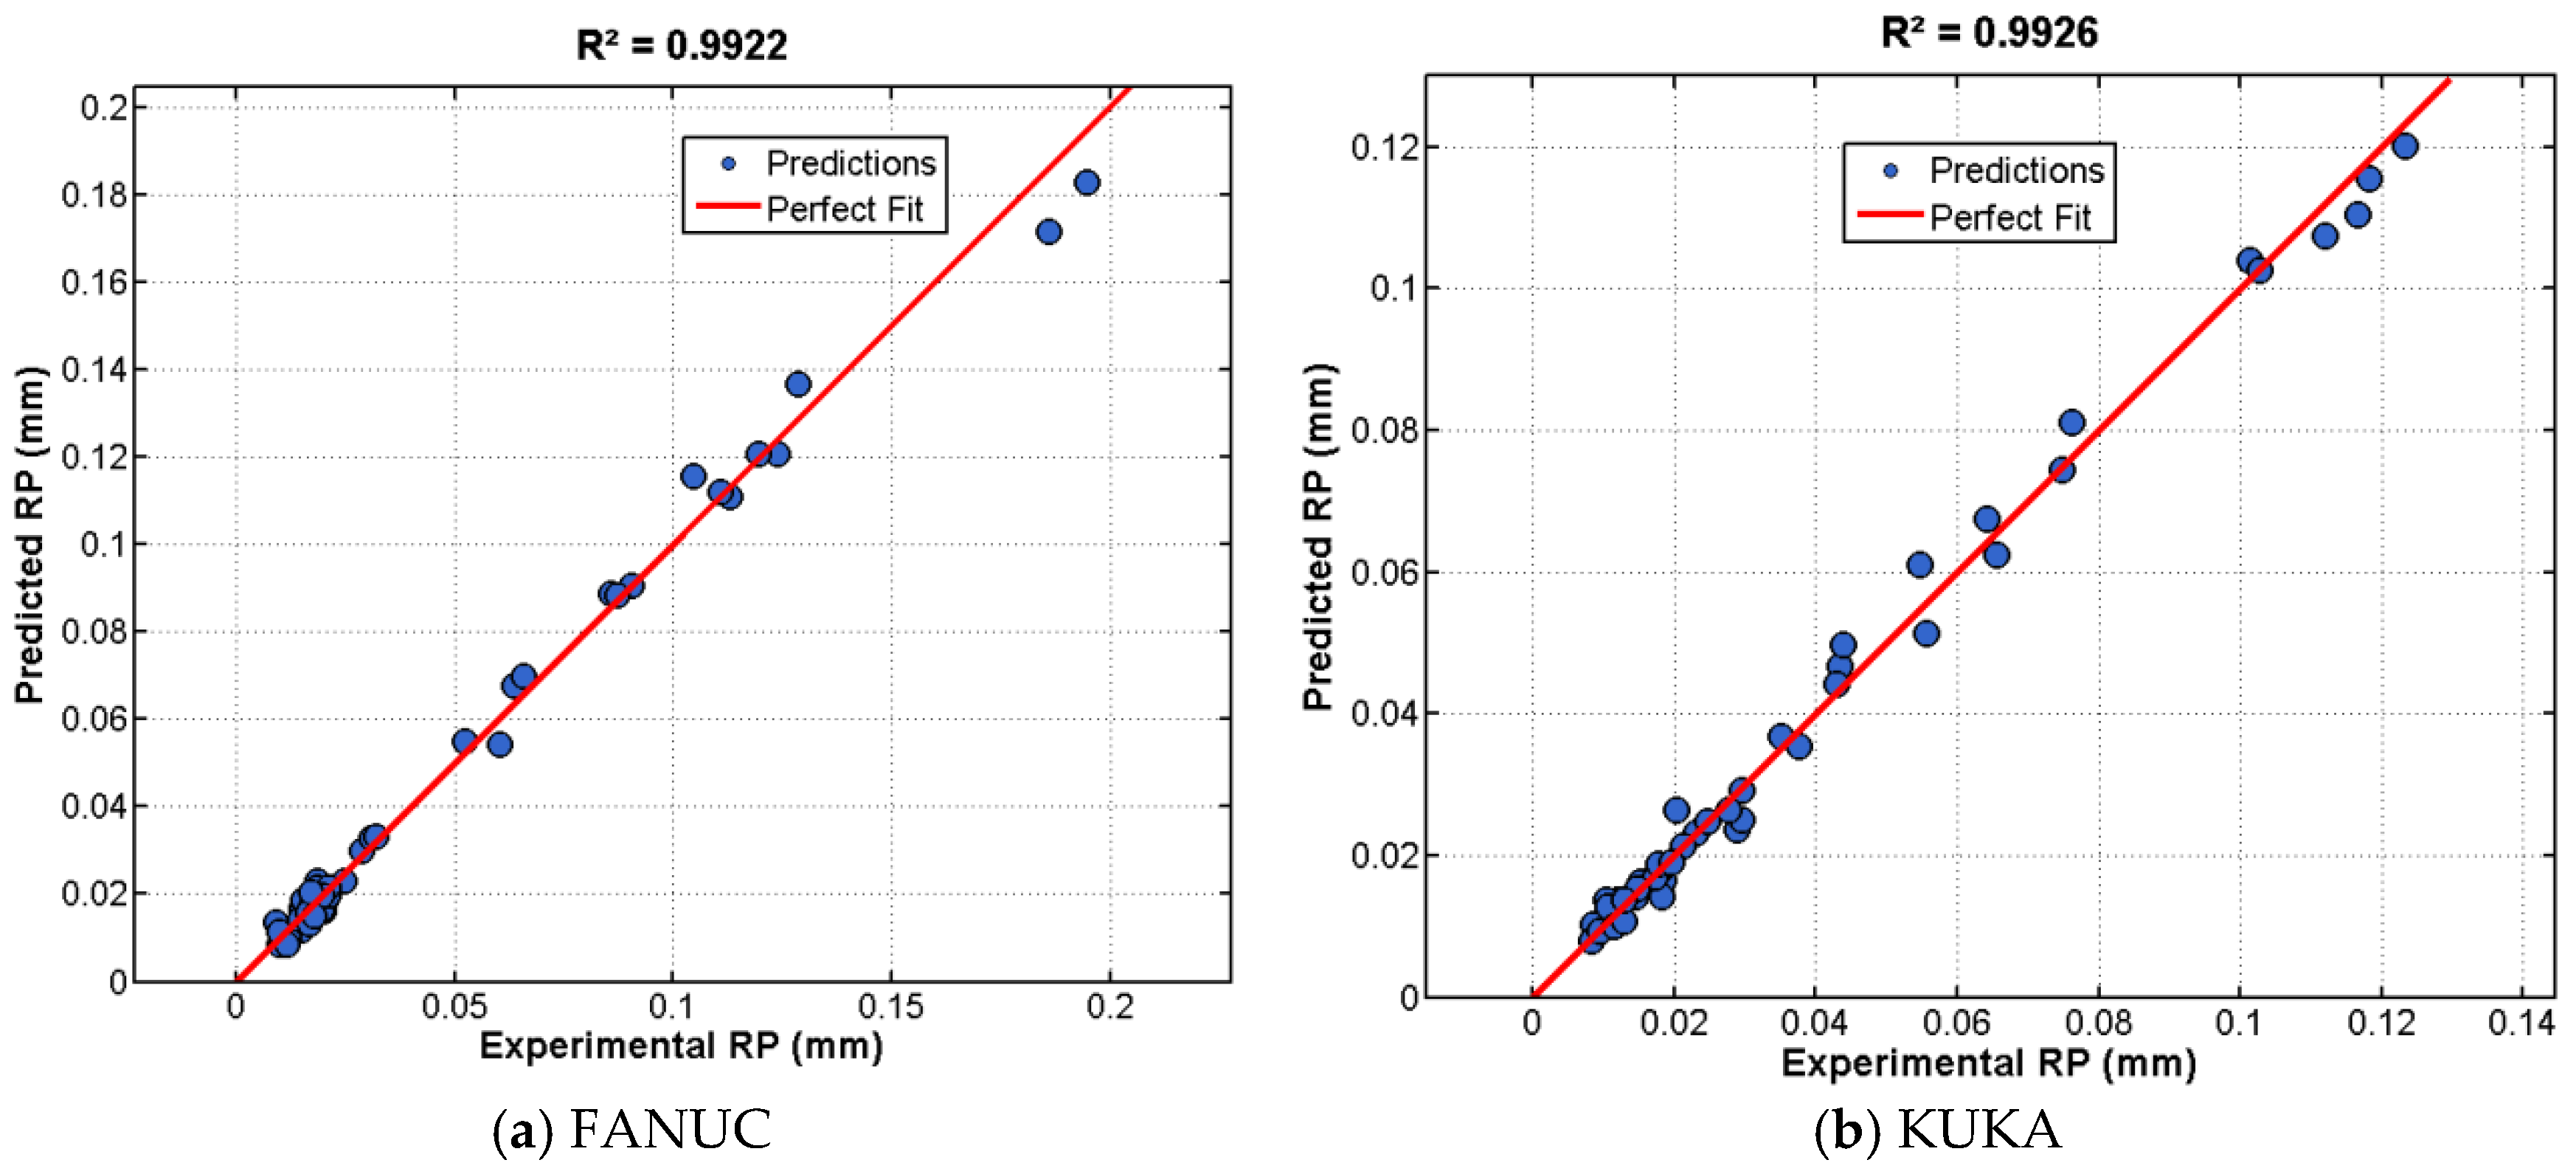
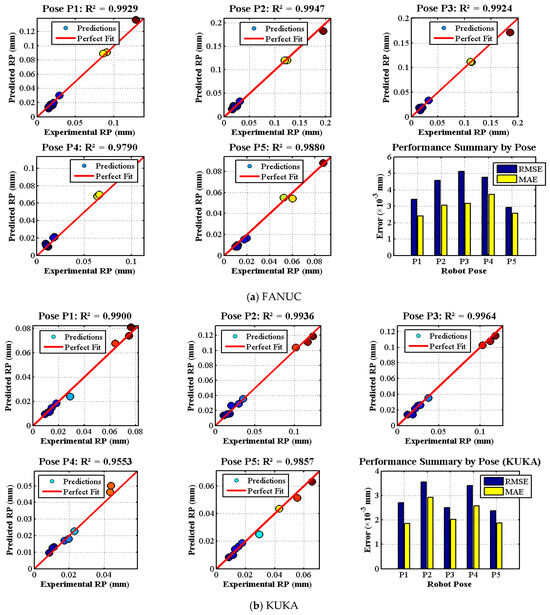
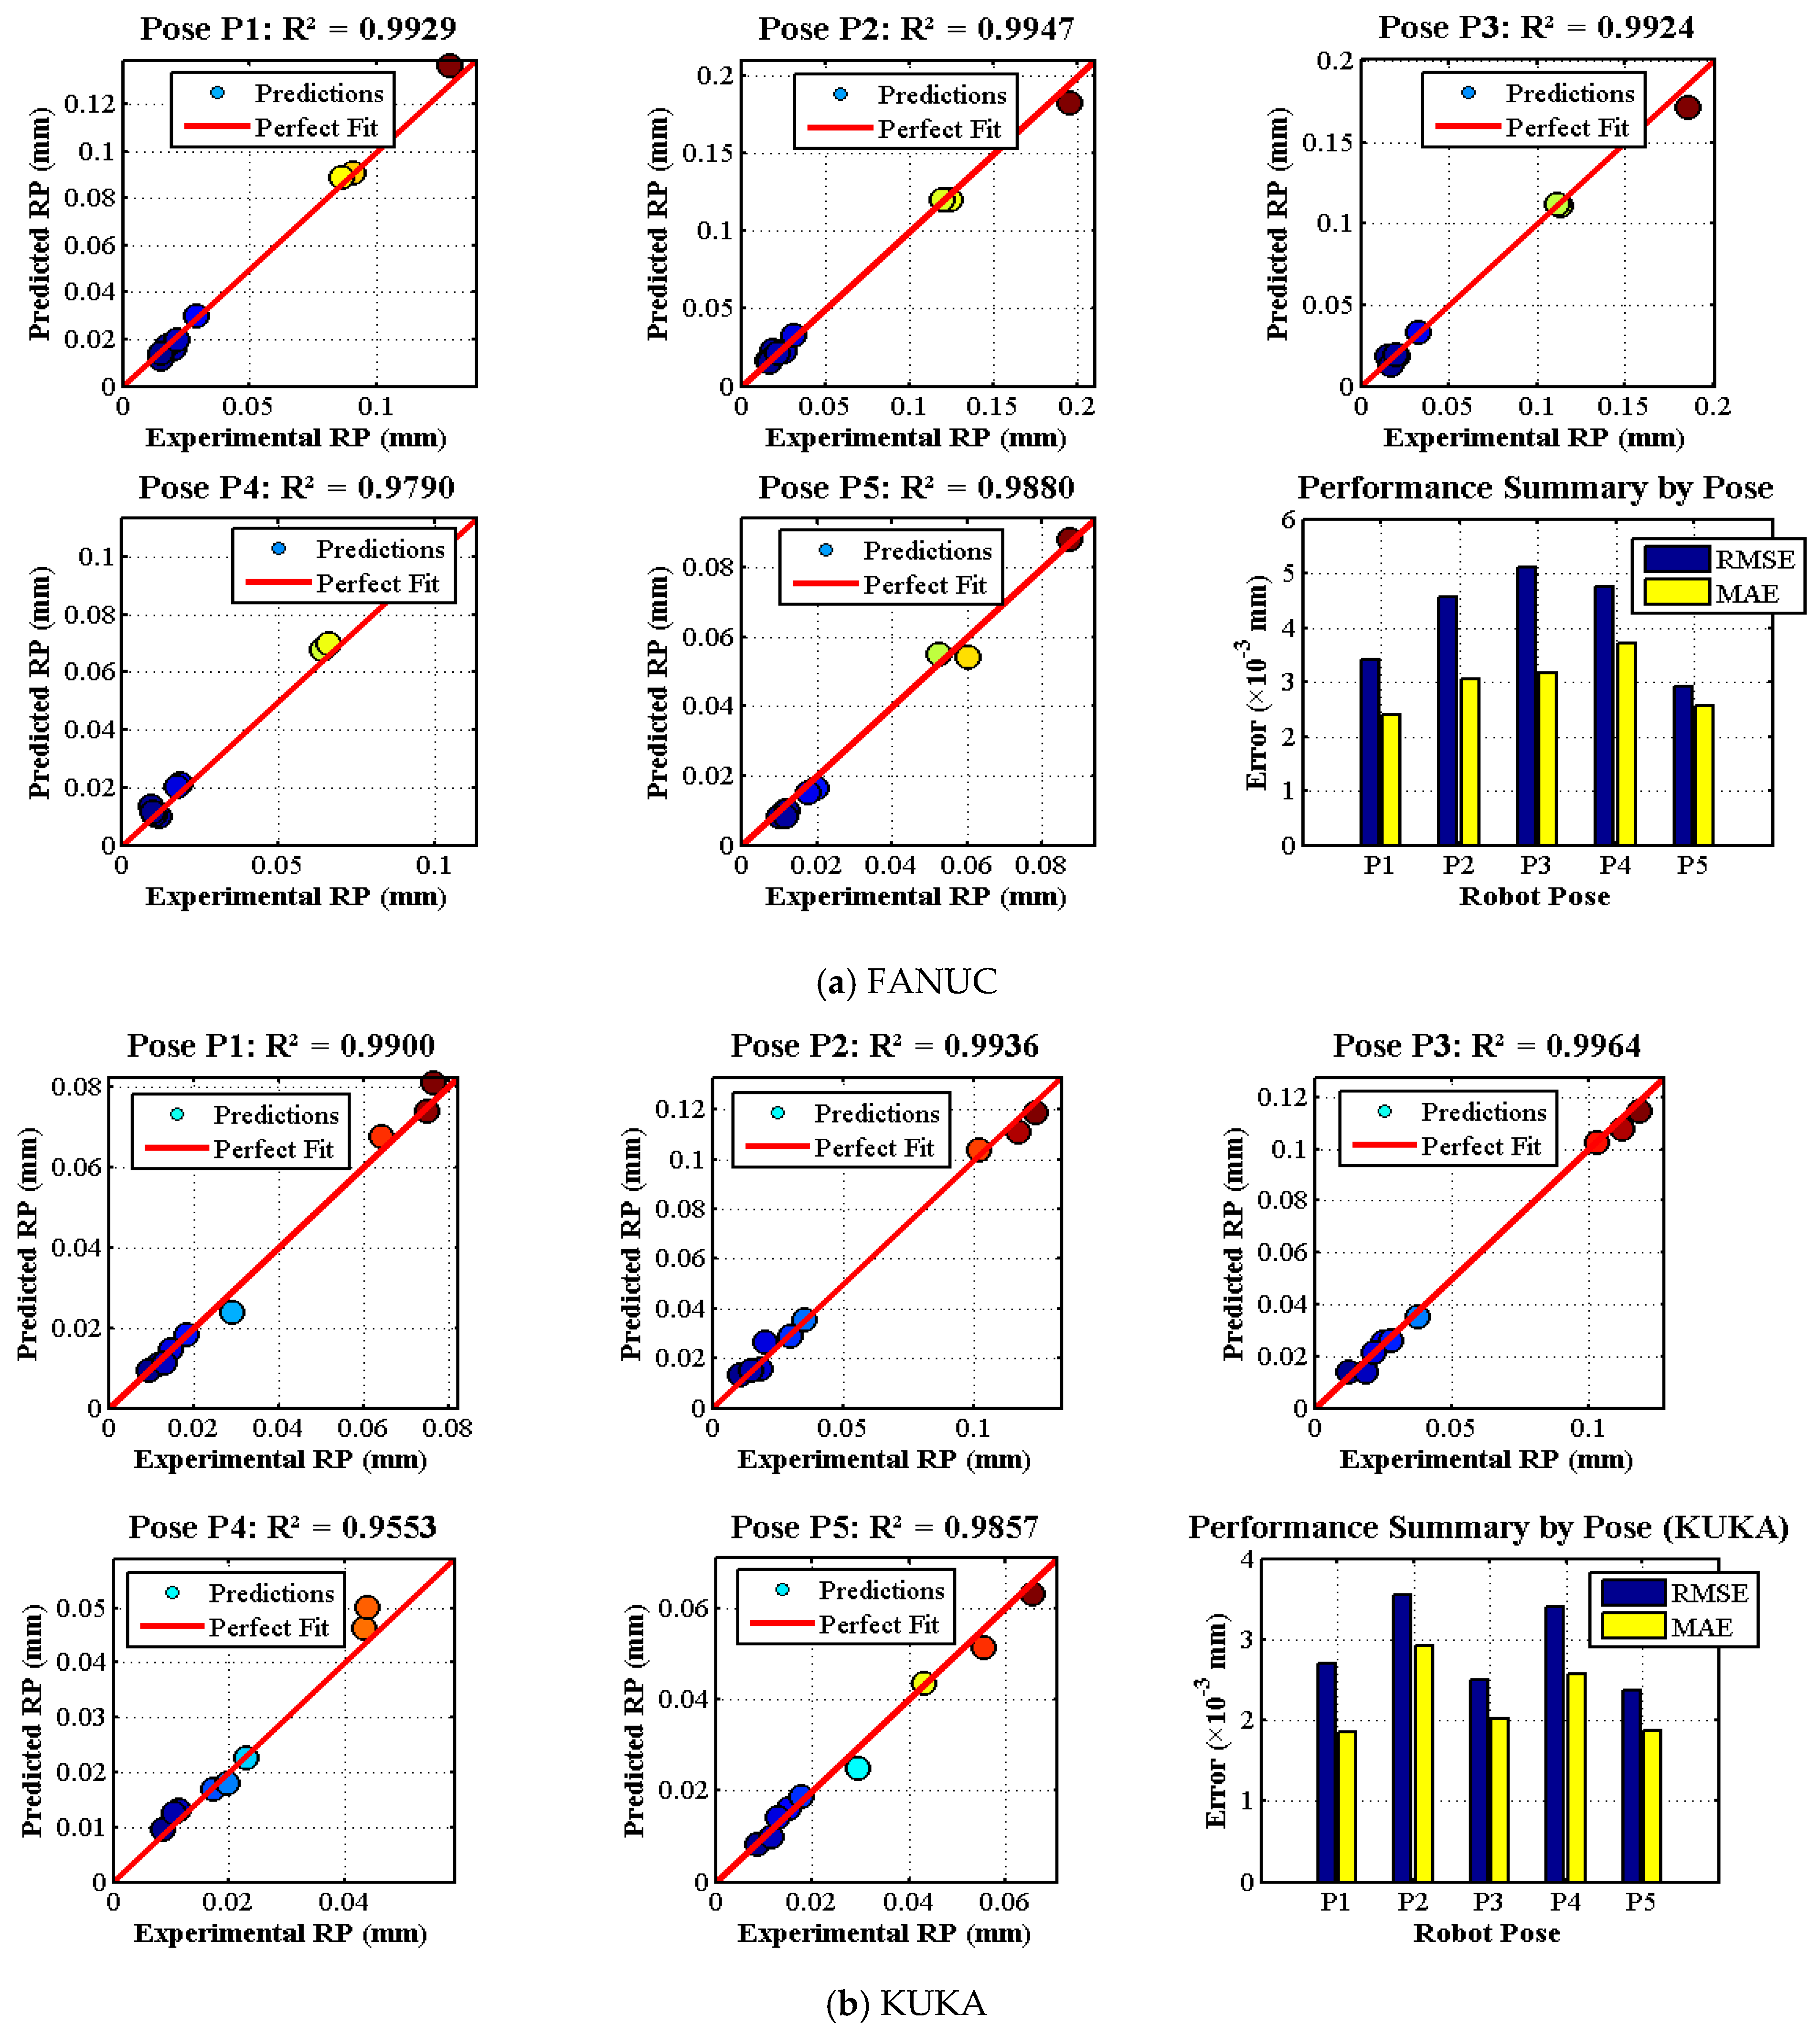
Figure 9 presents the prediction performance of the ensemble ANN models. The FANUC model achieved an R2 of 0.9922 with an RMSE of 0.004231 mm and an MAE of 0.002979 mm (individual R2: 0.9830 ± 0.0124). The KUKA model achieved an R2 of 0.9926, an RMSE of 0.002919 mm, and an MAE of 0.002215 mm (individual R2: 0.9825 ± 0.0191). Both models demonstrated excellent predictive capability, with data points clustering tightly around the perfect fit line.
Figure 9.
Prediction performance of the ensemble ANN models. (a) FANUC LR Mate 200iD; (b) KUKA KR 6 R700.
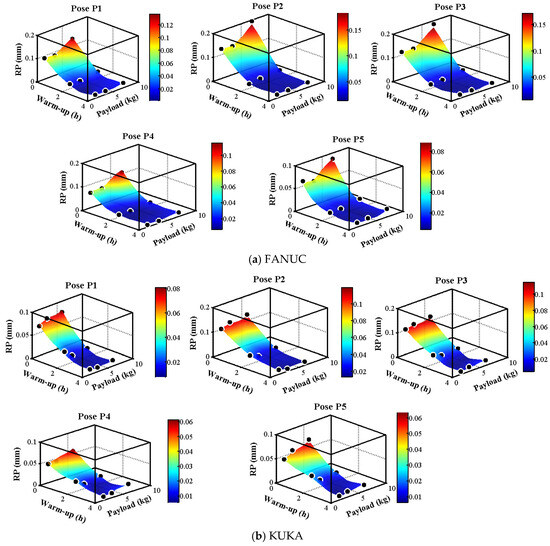
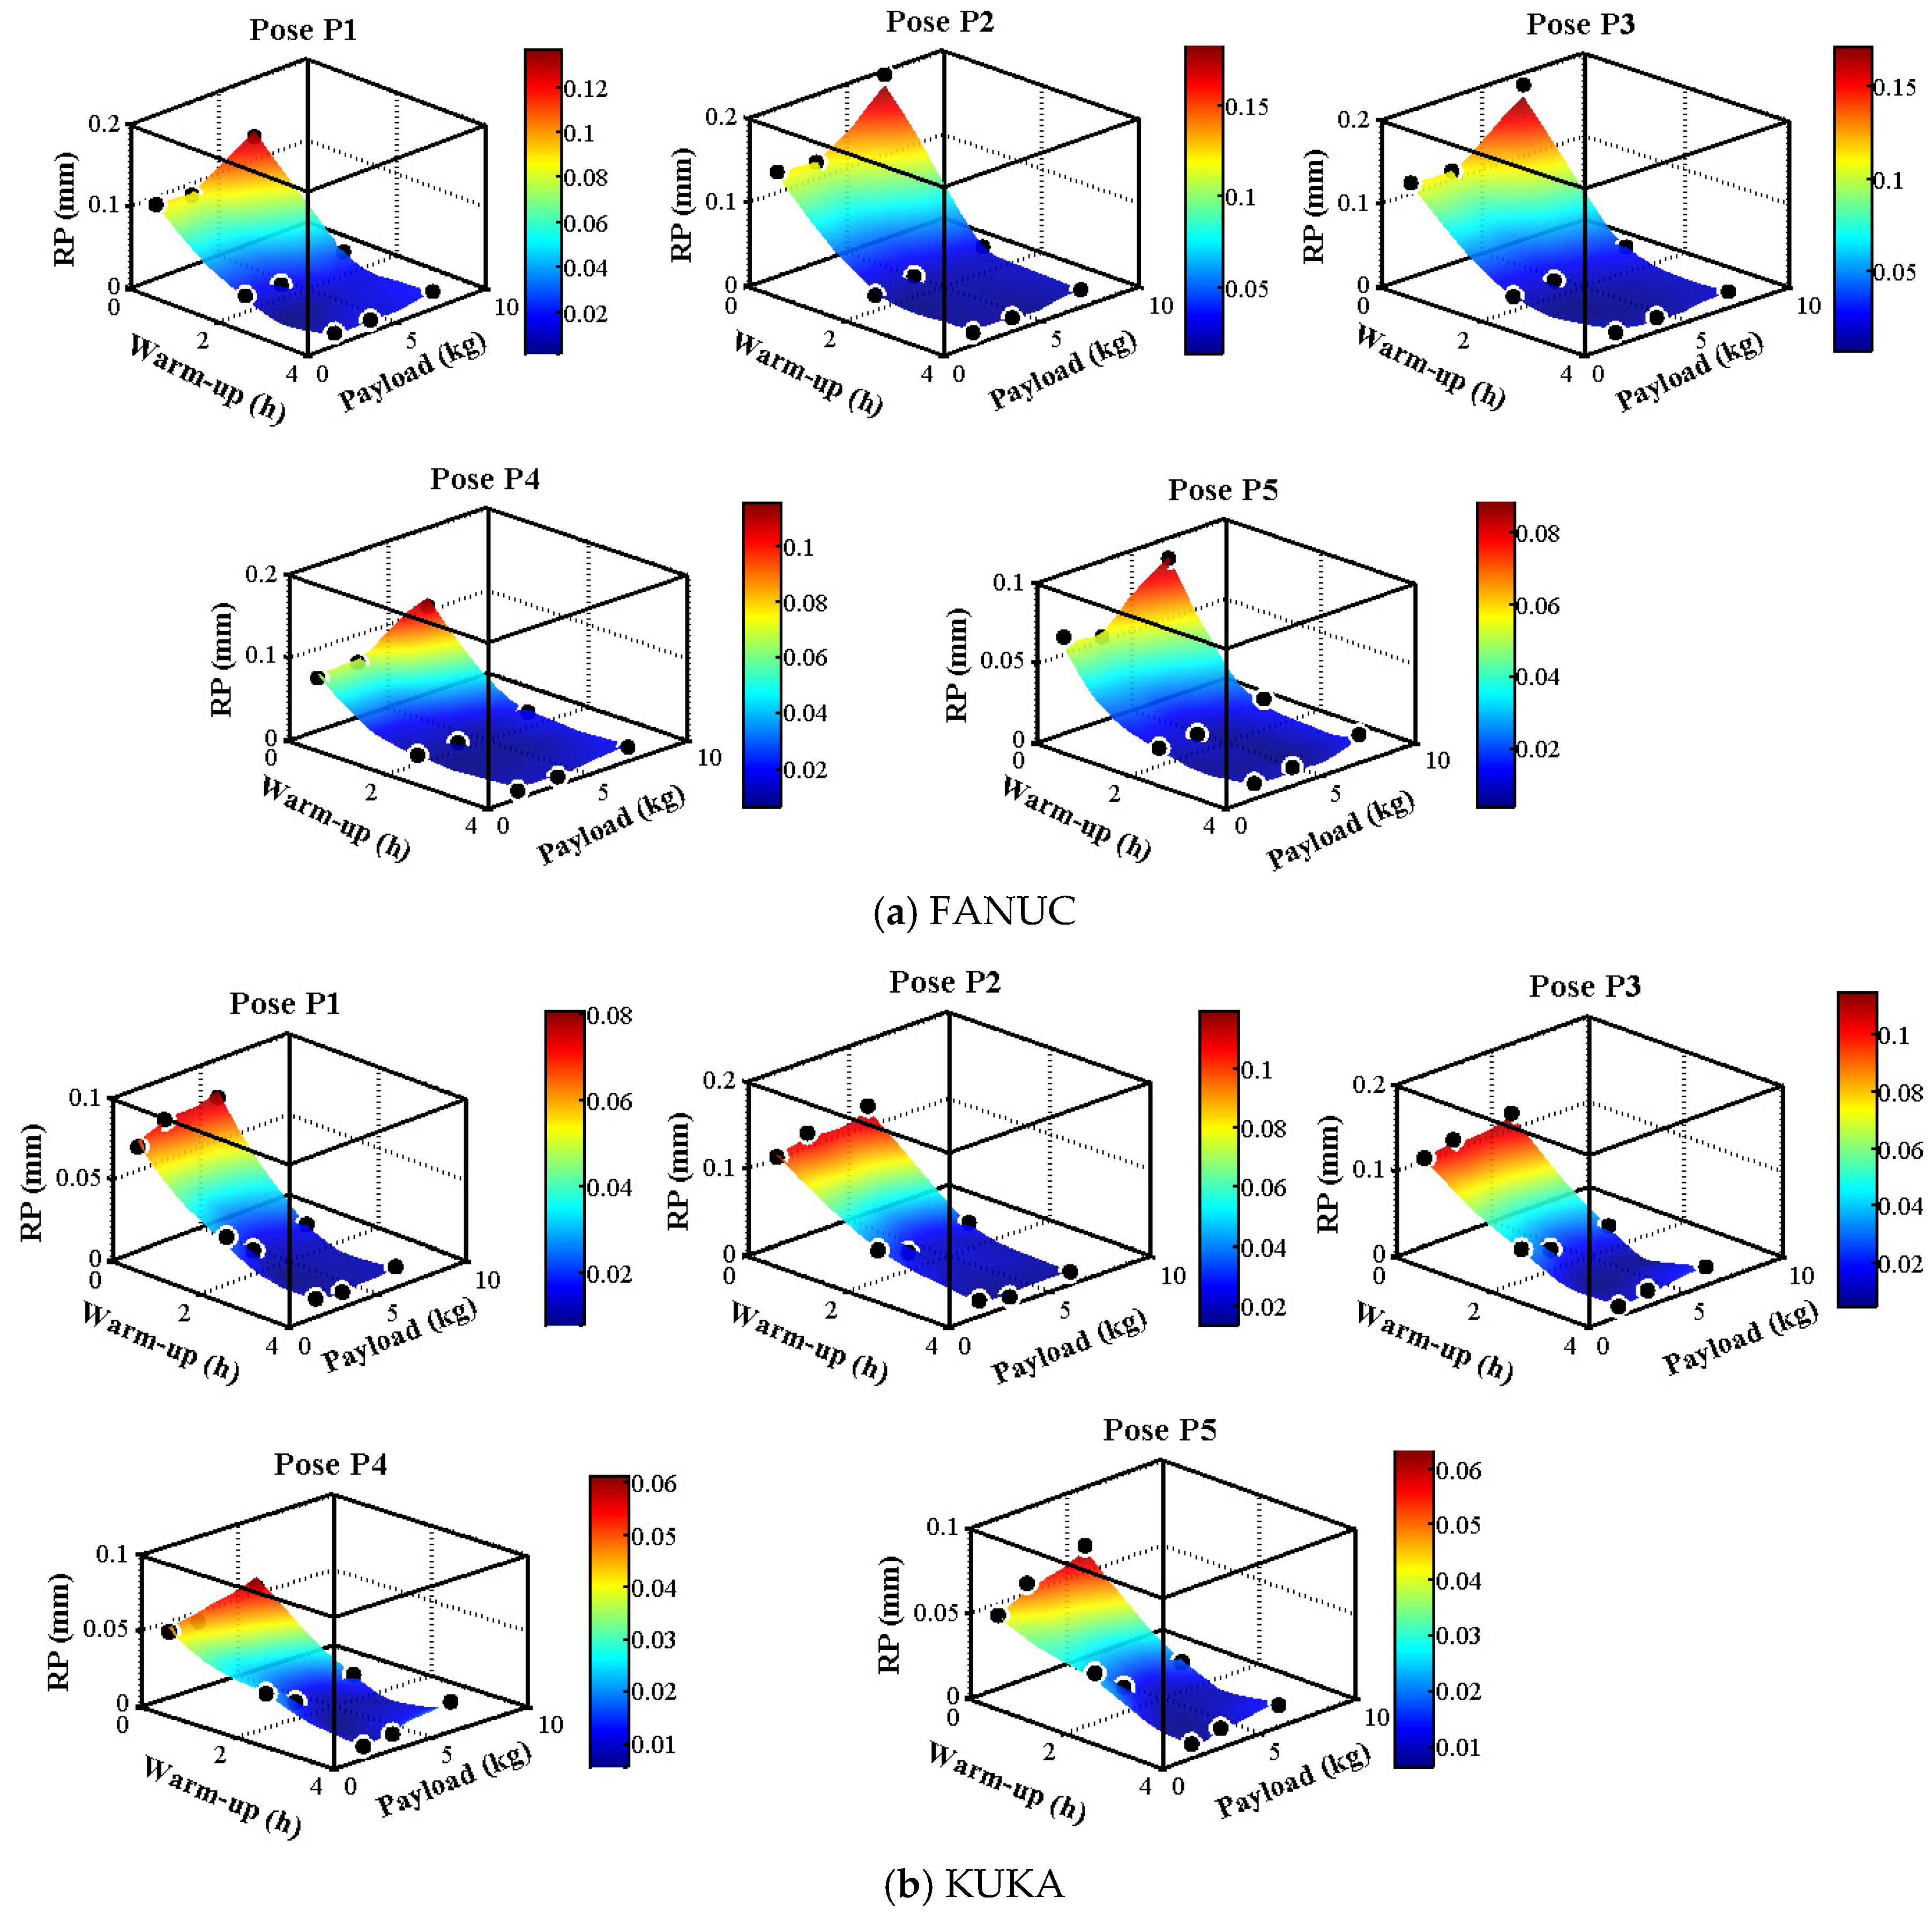
Figure 10a,b present the response surfaces for each pose, while Figure 11a,b show the correlation between experimental and predicted RP values. Across all poses, the ensemble ANN models achieved excellent performance with R2 values exceeding 0.95 for both robots. For FANUC, the best precision was observed for Pose 5 (RMSE = 0.002912 mm, MAE = 0.002554 mm), while Pose 3 showed the highest errors (RMSE = 0.005102 mm, MAE = 0.003178 mm) and Pose 4 the lowest R2 (0.9790). For KUKA, Pose 3 achieved the best overall performance (R2 = 0.9966, RMSE = 0.002440 mm, MAE = 0.001872 mm), while Pose 4 showed the lowest R2 (0.9588) but maintained a low RMSE (0.003264 mm). The KUKA model consistently achieved lower RMSE and MAE values across all poses, indicating more precise and consistent predictions.
Figure 10.
Response surfaces for each pose (P1–P5) showing predicted repeatability as a function of warm-up time and payload.
Figure 11.
Correlation between experimental and predicted RP values for each pose.
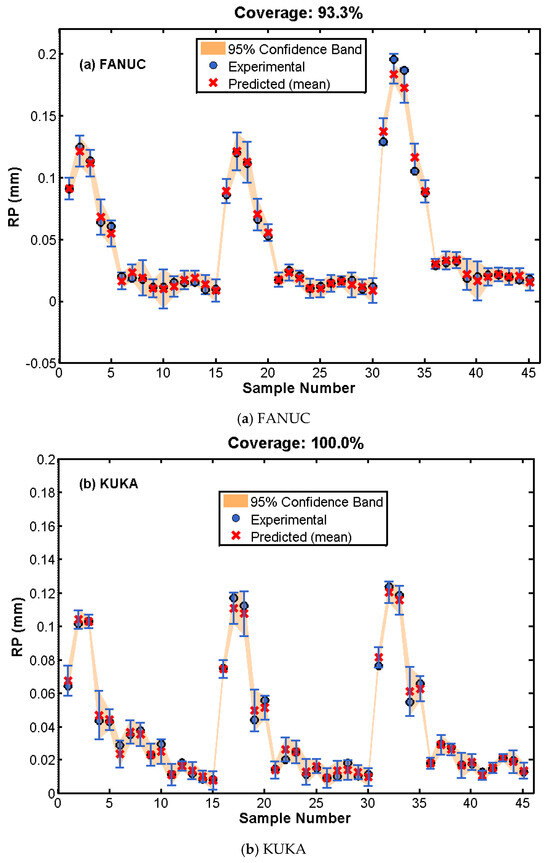
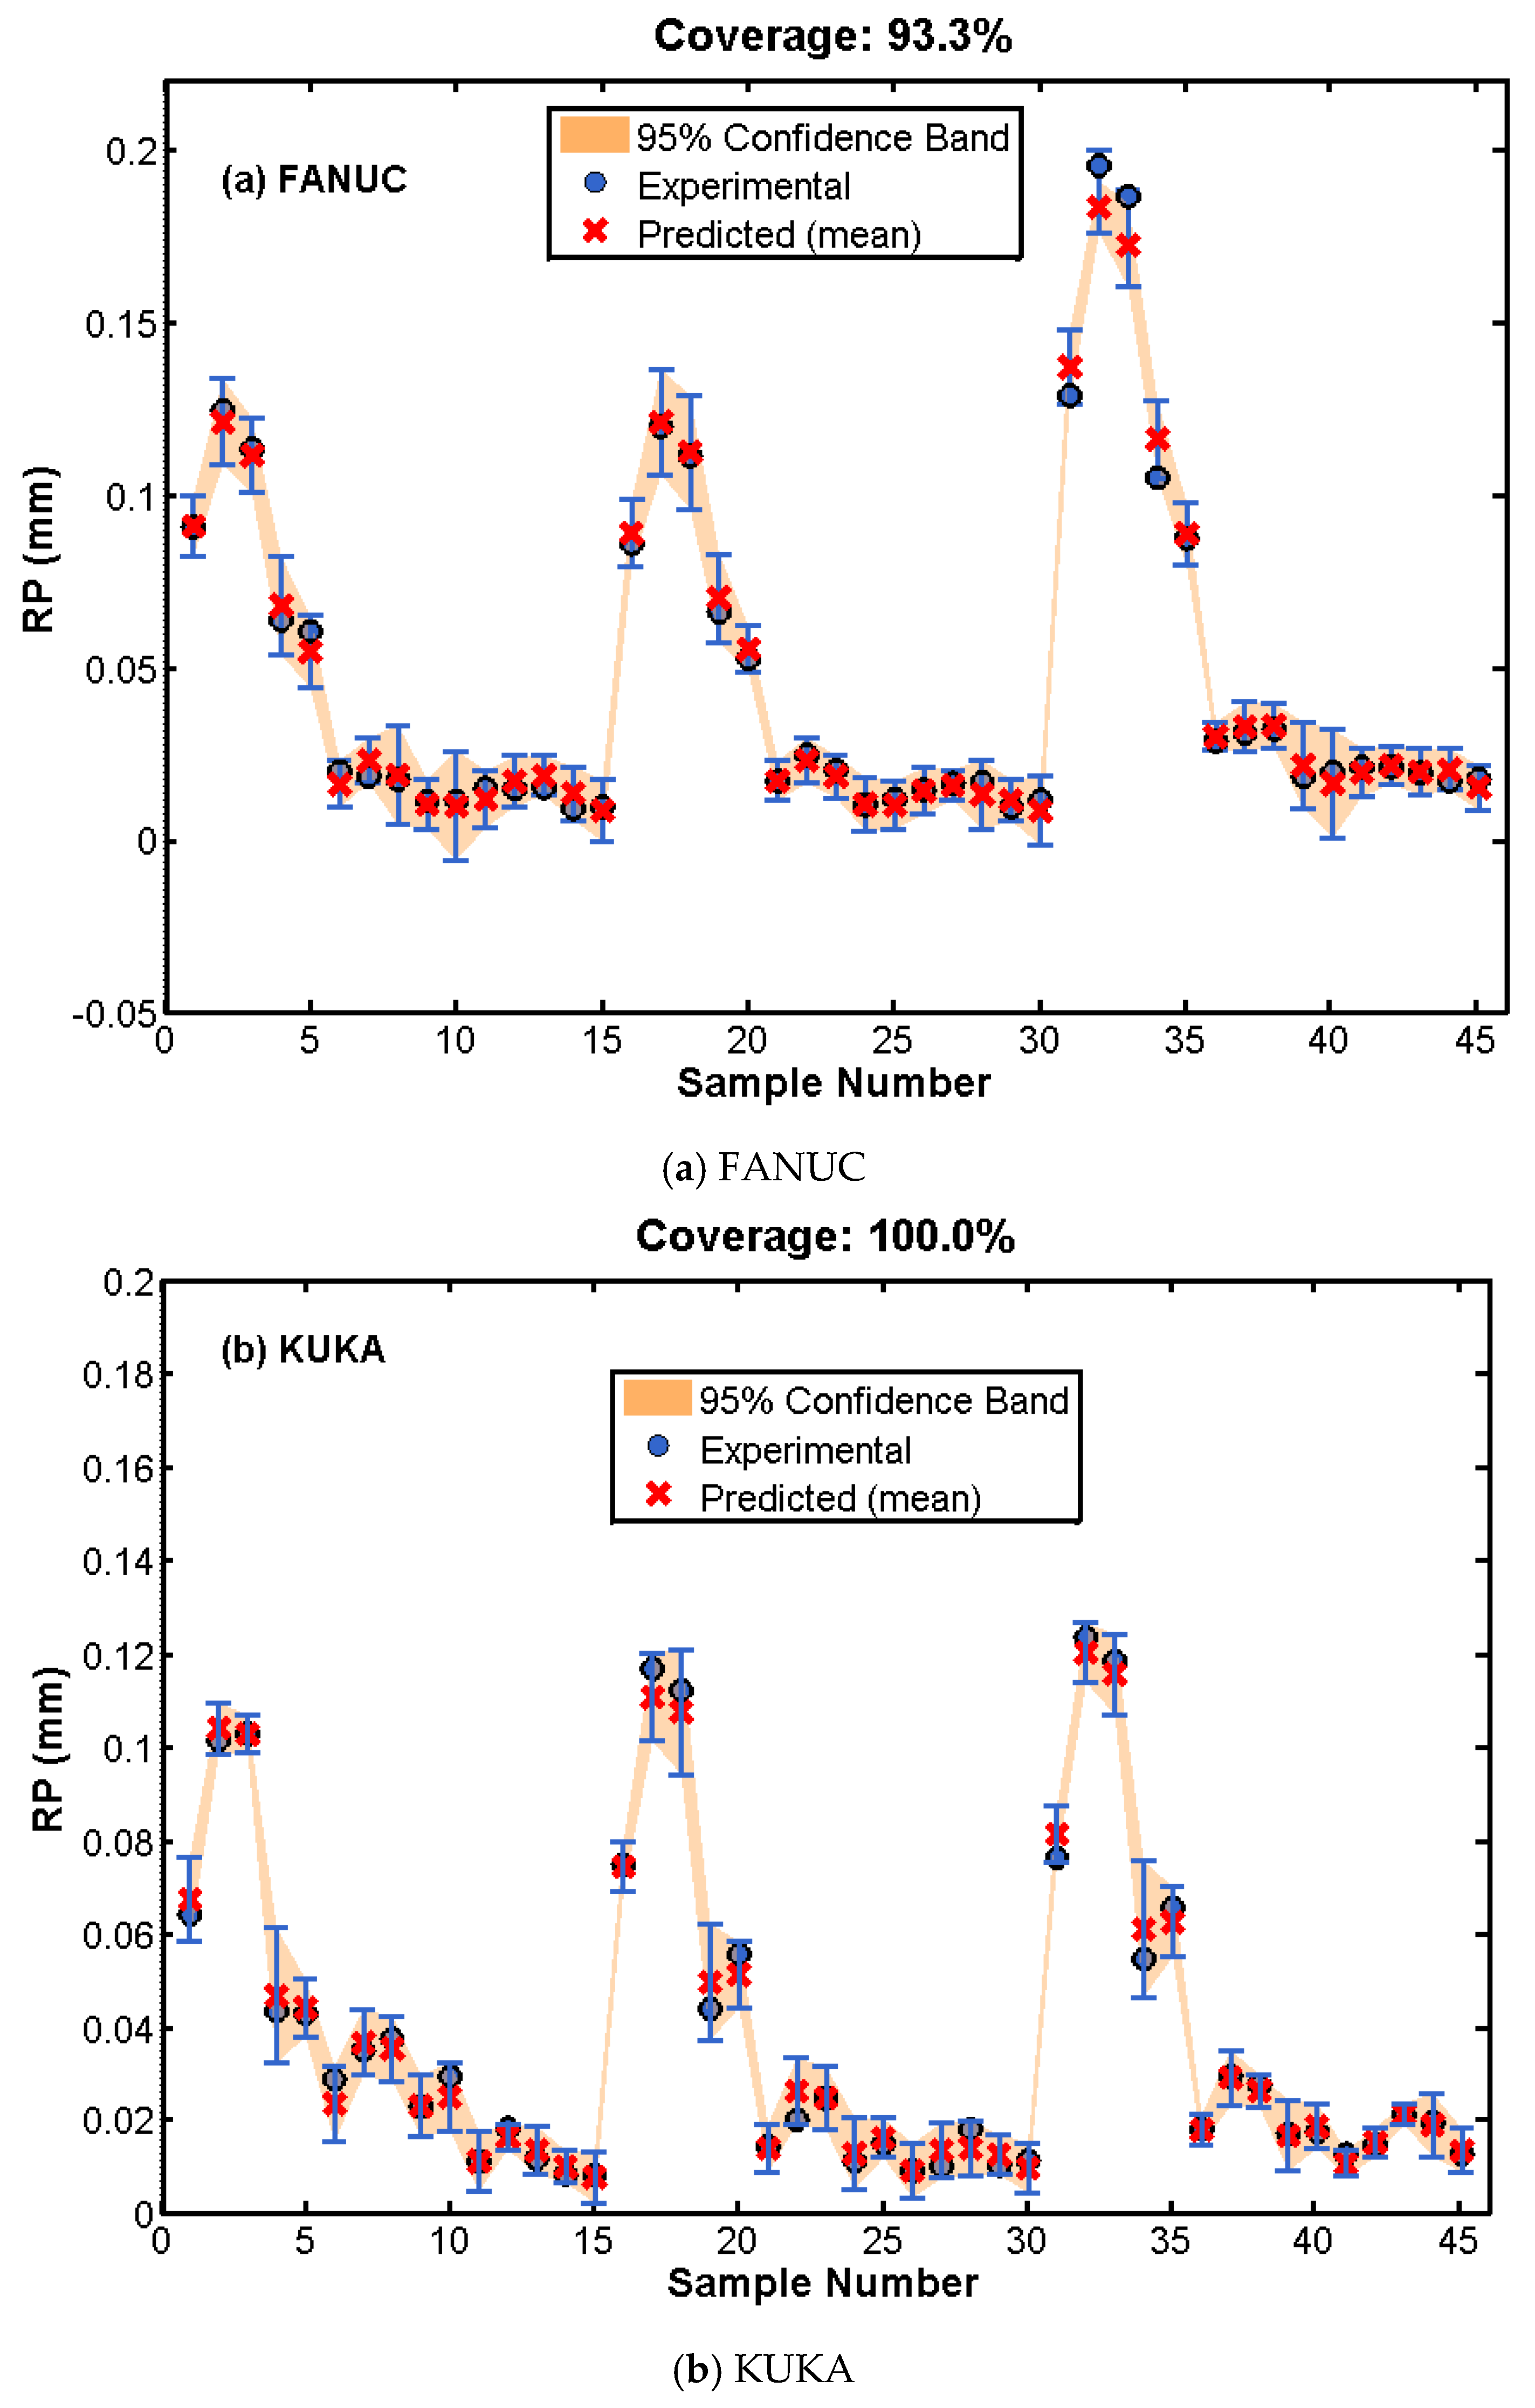
Figure 12 presents the predictions with 95% confidence intervals. For the FANUC robot, the model achieved coverage of 93.3% (42 out of 45 points). Three samples fell outside the confidence intervals, all occurring under the most challenging condition (W0P7, 0 h warm-up, 7 kg payload) for poses P2, P3, and P4. These correspond to the highest RP values (0.194797 mm, 0.185876 mm, and 0.104686 mm), indicating increased uncertainty under extreme conditions. For the KUKA robot, the model achieved 100% coverage, with all 45 points falling within the confidence bounds. The confidence intervals for KUKA range from approximately 0.001701 mm to 0.125287 mm.
Figure 12.
Predictions with 95% confidence intervals for all experimental samples. (a) FANUC LR Mate 200iD; (b) KUKA KR 6 R700.
4. Discussion
4.1. Interpretation of Repeatability Trends and Prediction Performance
The experimental results demonstrate a clear trend of improved repeatability with increasing payload for both robots. For the FANUC robot, repeatability improved by a factor of 11 (from 0.0903 mm to 0.0128 mm at 0 h warm-up), while the KUKA robot showed a 7.5-fold improvement (from 0.0709 mm to 0.0117 mm at 0 h warm-up). This improvement is consistent with mechanical damping effects, where higher payloads increase inertia and filter high-frequency vibrations, reducing positioning errors, as has been observed in previous studies [46]. The FANUC robot exhibited higher sensitivity to payload variations, with standard deviations ranging from 0.002 mm to 0.048 mm depending on condition, compared to KUKA’s range of 0.004 mm to 0.033 mm. The higher variability at low payloads for both robots is consistent with findings that external disturbances have a greater influence when mechanical damping is minimal [67]. The specific causes of the observed differences in sensitivity between the two robots were not investigated in this study.
The experimental results show that warm-up consistently degrades repeatability across most conditions, which is contrary to the thermal stabilization hypothesis commonly reported in the literature [14,68]. The 86% improvement for FANUC and 81–84% for KUKA are consistent with previous studies reporting up to 80% improvement after thermal stabilization [68]. The FANUC robot’s greater sensitivity to warm-up time suggests its mechanical system is more dependent on thermal conditioning, while KUKA’s lower sensitivity indicates better inherent stability [69,70]. The dramatic reduction in variability at 4-hour warm-up confirms that thermal equilibrium is essential for consistent performance, with standard deviations dropping from 0.048 mm to below 0.004 mm for FANUC and from 0.031 mm to below 0.004 mm for KUKA [71].
The variation in repeatability across poses reflects kinematic configuration-dependent performance, where poses requiring significant joint movement exhibit larger errors due to increased compliance and gear backlash [72]. Both robots show similar patterns, with P2 and P3 being the worst-performing poses and P4 and P5 being the best. This suggests inherent performance variations that cannot be fully compensated for by control algorithms. The different optimal poses (FANUC: P5; KUKA: P4) reflect fundamental differences in kinematic designs, with FANUC being optimized for high precision under controlled conditions, while KUKA prioritizes consistency under varying operational states. These differences reflect distinct design philosophies: the FANUC LR Mate 200iD is a compact industrial articulated robot designed for high-speed handling and assembly applications [50,73], whereas the KUKA KR 6 R700 Sixx is a traditional industrial robot with a focus on robustness and payload capacity [74].
The significant interaction effects between warm-up time and payload indicate that thermal and mechanical factors are interdependent [71,75]. The beneficial effect of warm-up is more pronounced at low payloads, where friction and compliance effects dominate. FANUC’s higher interaction strength (86% at both payload levels) indicates stronger coupling requiring simultaneous optimization of both factors. KUKA’s more moderate interaction (84% at low payload, 81% at high payload) suggests more predictable performance across operating conditions.
The ensemble ANN models achieved excellent predictive performance (R2 > 0.99 for both robots), demonstrating the effectiveness of this approach for modeling repeatability under varying conditions. The KUKA model showed slightly better performance (R2 = 0.9926, RMSE = 0.002919 mm) compared to FANUC (R2 = 0.9922, RMSE = 0.004231 mm), which can be attributed to the smoother and more predictable nature of the KUKA data. The pose-specific analysis reveals that P4 was the most challenging for both robots (R2: 0.9790 for FANUC, 0.9588 for KUKA), consistent with findings that certain kinematic configurations are inherently less accurate [16,76]. The KUKA model consistently achieved lower RMSE and MAE values across all poses, confirming its more predictable data characteristics. These results compare favorably with previous studies reporting RMSE values of 0.01–0.05 mm [67,77].
The prediction interval analysis shows that the FANUC model achieved 93.3% coverage, while the KUKA model achieved 100% coverage. The three samples outside the FANUC confidence intervals occurred under the most extreme conditions (W0P7, poses P2–P4), indicating increased uncertainty at the boundaries of the operating space. The KUKA model’s perfect coverage demonstrates well-calibrated uncertainty estimates [78,79]. The narrow confidence intervals (<0.01 mm width) confirm that the ensemble approach effectively captures underlying patterns without excessive uncertainty.
4.2. Design Philosophy and Practical Implications
Based on the observed performance patterns, the FANUC LR Mate 200iD demonstrated higher sensitivity to suboptimal conditions (cold start and low payload), while the KUKA KR 6 R700 exhibited more consistent performance across the tested conditions. These observed differences suggest that the FANUC robot may be better suited for applications where operating conditions can be tightly controlled, while the KUKA robot may be more appropriate for flexible manufacturing environments where conditions fluctuate [50,67].
For precision manufacturing with stable conditions, the FANUC robot is recommended where operating conditions can be tightly controlled. For flexible manufacturing with varying conditions, the KUKA robot is recommended where robustness and predictability are prioritized. A 4 h warm-up period is recommended for FANUC (86% improvement), while a minimum 2 h warm-up is recommended for KUKA (81–84% improvement). Pose optimization should avoid P2 and P3, with P5 recommended for FANUC and P4 for KUKA. Long-term thermal management strategies include maintaining consistent ambient temperature (20–22 °C), implementing thermal compensation models, and considering thermal enclosures for precision applications [69]. These strategies are particularly important for the FANUC robot, given its higher sensitivity to thermal variations.
The predictive framework developed in this work supports Industry 4.0 applications by enabling integration with digital twins and adaptive process planning [80]. As manufacturing moves toward Industry 5.0, the uncertainty quantification provided by ensemble predictions facilitates safe human–robot collaboration and resilient production [80]. The comparative analysis between robot platforms further informs smart factory asset selection, contributing to next-generation manufacturing environments where data-driven performance prediction bridges experimental metrology and digital production management.
5. Conclusions
This study demonstrated that ensemble artificial neural networks can effectively model the complex, nonlinear relationship between operational factors and positional repeatability for two distinct industrial robot platforms. The experimental investigation confirmed that repeatability is a highly state-dependent metric, with thermal stabilization being the dominant influencing factor for both robots.
The FANUC LR Mate 200iD showed greater sensitivity to suboptimal conditions, particularly at cold start and low payload, while the KUKA KR 6 R700 Sixx exhibited superior robustness across all tested conditions. These observed differences suggest that the FANUC robot may be better suited for applications where operating conditions can be tightly controlled, whereas the KUKA robot may be more appropriate for flexible manufacturing environments where conditions fluctuate. The significant interaction effects between warm-up duration and payload highlight that thermal and mechanical factors are coupled and must be considered simultaneously for accurate performance prediction.
The ensemble ANN models achieved excellent predictive accuracy, with R2 values exceeding 0.99 for both robots. The models successfully captured pose-dependent variations and provided well-calibrated uncertainty estimates, as confirmed by prediction interval coverage of 93.3% for FANUC and 100% for KUKA. These results validate the ensemble approach as a robust and reliable tool for repeatability prediction.
From a practical perspective, the findings provide quantitative guidelines for robot selection and operational protocols. For high-precision tasks with stable conditions, FANUC with a 4 h warm-up is recommended. For flexible environments with varying payloads and thermal states, KUKA offers superior robustness. The proposed framework enables engineers to predict repeatability for untested scenarios, supporting process planning and uncertainty budgeting in precision manufacturing.
6. Limitations and Future Work
This study has several limitations. The models were trained on 45 data points per robot, limiting generalization. Experiments were conducted under controlled conditions, excluding environmental disturbances. Dynamic path accuracy was not investigated, and direct stiffness measurements were not performed. Additionally, the use of a fixed cyclic pose sequence (P1–P5) during data acquisition may introduce order-dependent effects, though the 300 repetitions per condition help mitigate such influences.
Future work should expand the dataset, validate models in industrial environments, extend the framework to dynamic accuracy, and integrate predictions with robot control systems for real-time optimization. Further investigations should also employ randomized pose sequences to evaluate the robustness of repeatability measurements and quantify whether measurement order introduces significant bias in the predictive models.
Author Contributions
Conceptualization, M.S. and I.B.; methodology, M.S. and I.B.; software, B.L.; validation, B.L. and M.S.; formal analysis, B.L.; investigation, M.S.; resources, I.B.; data curation, O.S.; writing—original draft preparation, B.L.; writing—review and editing, B.L. and M.S.; visualization, O.S.; supervision, M.S. and I.B.; project administration, I.B. All authors have read and agreed to the published version of the manuscript.
Funding
This work was supported and funded by the Deanship of Scientific Research at Imam Mohammad Ibn Saud Islamic University (IMSIU) (grant number IMSIU-DDRSP2603).
Data Availability Statement
The raw data supporting the conclusions of this article will be made available by the authors on request.
Conflicts of Interest
The authors declare no conflicts of interest. The funders had no role in the design of the study; in the collection, analyses, or interpretation of data; in the writing of the manuscript; or in the decision to publish the results.
Abbreviations
The following abbreviations are used in this manuscript:
| ANN | Artificial Neural Network |
| ANOVA | Analysis of Variance |
| CoRo | Control and Robotics Laboratory |
| DOE | Design of Experiments |
| ETS | École de Technologie Supérieure |
| GUM | Guide to the Expression of Uncertainty in Measurement |
| IQR | Interquartile Range |
| ISO | International Organization for Standardization |
| JCGM | Joint Committee for Guides in Metrology |
| MAE | Mean Absolute Error |
| ML | Machine Learning |
| MSE | Mean Squared Error |
| ReLU | Rectified Linear Unit |
| RMSE | Root Mean Square Error |
| RP | Repeatability |
| SGD | Stochastic Gradient Descent |
| TCP | Tool Center Point |
| VIM | International Vocabulary of Metrology |
References
- Punukollu, P.; Burugu, S.; Gudekota, S.; Punukollu, M.; Yerneni, R.P. AI-Powered Robotics for Precision Manufacturing: Developing Machine Learning Models to Enhance Robotic Automation, Improve Accuracy, and Enable Complex Assembly Tasks. Essex J. AI Ethics Responsible Innov. 2023, 3, 355–394. [Google Scholar]
- Slamani, M.; Chatelain, J.-F. Issues and challenges in robotic trimming of CFRP. In Proceedings of the 2015 12th International Conference on Informatics in Control, Automation and Robotics (ICINCO), Colmar, France, 21–23 July 2015. [Google Scholar]
- Tahmina, T.; Garcia, M.; Geng, Z.; Bidanda, B. A survey of smart manufacturing for high-mix low-volume production in defense and aerospace industries. In Proceedings of the International Conference on Flexible Automation and Intelligent Manufacturing, Detroit, MI, USA, 19–22 June 2022. [Google Scholar]
- Chen, T.; Huang, Z.; Motes, J.; Geng, J.; Ta, Q.M.; Dinkel, H.; Abdul-Rashid, H.; Myers, J.; Mun, Y.-J.; Lin, W. Insights from an industrial collaborative assembly project: Lessons in research and collaboration. arXiv 2022, arXiv:2205.14340. [Google Scholar]
- Slamani, M.; Makri, H.; Boudilmi, A.; Bonev, I.A.; Chatelain, J.-F. Calibration strategies for enhancing accuracy in serial industrial robots for orbital milling applications. Ind. Robot Int. J. Robot. Res. Appl. 2024, 51, 558–569. [Google Scholar] [CrossRef] [Scilit]
- Brethé, J.-F.; Vasselin, E.; Lefebvre, D.; Dakyo, B. Modelling of repeatability phenomena using the stochastic ellipsoid approach. Robotica 2006, 24, 477–490. [Google Scholar]
- Zhang, D.; Peng, Z.; Ning, G.; Han, X. Positioning accuracy reliability of industrial robots through probability and evidence theories. J. Mech. Des. 2021, 143, 011704. [Google Scholar]
- Slamani, M.; Mayer, R.; Balazinski, M. Concept for the integration of geometric and servo dynamic errors for predicting volumetric errors in five-axis high-speed machine tools: An application on a XYC three-axis motion trajectory using programmed end point constraint measurements. Int. J. Adv. Manuf. Technol. 2013, 65, 1669–1679. [Google Scholar]
- Slamani, M.; Mayer, R.; Balazinski, M.; Engin, S. Identification and compensation of dynamic scale mismatches in high-speed end mill boring trajectory on CNC machines. J. Manuf. Sci. Eng. 2010, 132, 034501. [Google Scholar] [CrossRef] [Scilit]
- Slamani, M.; Nubiola, A.; Bonev, I.A. Effect of servo systems on the contouring errors in industrial robots. Trans. Can. Soc. Mech. Eng. 2012, 36, 83–96. [Google Scholar] [CrossRef] [Scilit]
- Wu, K.; Li, J.; Zhao, H.; Zhong, Y. Review of industrial robot stiffness identification and modelling. Appl. Sci. 2022, 12, 8719. [Google Scholar] [CrossRef] [Scilit]
- Zeng, Y.; Tian, W.; Liao, W. Positional error similarity analysis for error compensation of industrial robots. Robot. Comput.-Integr. Manuf. 2016, 42, 113–120. [Google Scholar] [CrossRef] [Scilit]
- Uhlmann, E.; Polte, J.; Mohnke, C. Constructive compensation of the thermal behaviour for industrial robots. In Proceedings of the IOP Conference Series: Materials Science and Engineering, Tallinn, Estonia, 27–29 April 2021. [Google Scholar]
- Reun, A.; Subrin, K.; Dubois, A.; Garnier, S. Thermal drift and backlash issues for industrial robots positioning performance. Robotica 2022, 40, 2933–2952. [Google Scholar] [CrossRef] [Scilit]
- Selingue, M.; Olabi, A.; Thiery, S.; Béarée, R. Hybrid calibration of industrial robot considering payload variation. J. Intell. Robot. Syst. 2023, 109, 58. [Google Scholar] [CrossRef] [Scilit]
- Hsiao, J.-C.; Shivam, K.; Lu, I.-F.; Kam, T.-Y. Positioning accuracy improvement of industrial robots considering configuration and payload effects via a hybrid calibration approach. IEEE Access 2020, 8, 228992–229005. [Google Scholar] [CrossRef] [Scilit]
- Stuhlenmiller, F.; Weyand, S.; Jungblut, J.; Schebek, L.; Clever, D.; Rinderknecht, S. Impact of cycle time and payload of an industrial robot on resource efficiency. Robotics 2021, 10, 33. [Google Scholar] [CrossRef] [Scilit]
- Nguyen, V.; Marvel, J.A. Modeling of industrial robot kinematics using a hybrid analytical and statistical approach. J. Mech. Robot. 2022, 14, 051009. [Google Scholar] [CrossRef] [Scilit]
- Birk, C.; Kipfmüller, M.; Kotschenreuther, J. Dynamic modeling and analysis of industrial robots for enhanced manufacturing precision. Actuators 2025, 14, 311. [Google Scholar] [CrossRef] [Scilit]
- Ryu, S.; Moon, H. Industrial manipulator calibration with geometric and non-geometric parameters for the enhanced positioning accuracy. J. Mech. Sci. Technol. 2023, 37, 3103–3112. [Google Scholar] [CrossRef] [Scilit]
- Chanal, H.; Paccot, F.; Duc, E. Sensitivity analysis of an overconstrained parallel structure machine tool, the Tripteor X7. Appl. Mech. Mater. 2012, 162, 394–402. [Google Scholar] [CrossRef] [Scilit]
- Herps, K.; Dang, Q.-V.; Martagan, T.; Adan, I. A simulation-based approach to design an automated high-mix low-volume manufacturing system. J. Manuf. Syst. 2022, 64, 390–403. [Google Scholar] [CrossRef] [Scilit]
- Li, Z.; Li, S.; Luo, X. An overview of calibration technology of industrial robots. IEEE/CAA J. Autom. Sin. 2021, 8, 23–36. [Google Scholar] [CrossRef] [Scilit]
- Zhang, D.; Liang, H.; Li, X.-A.; Jia, X.; Wang, F. Kinematic calibration of industrial robot using Bayesian modeling framework. Reliab. Eng. Syst. Saf. 2025, 253, 110543. [Google Scholar] [CrossRef] [Scilit]
- Arents, J.; Greitans, M. Smart industrial robot control trends, challenges and opportunities within manufacturing. Appl. Sci. 2022, 12, 937. [Google Scholar] [CrossRef] [Scilit]
- Kommey, B.; Essah, S.; Kuusofaa, D.D.; Jnr, S.B. A compact review of industrial robots: Dynamic modeling, control strategies, and operational challenges. Andalas J. Electr. Electron. Eng. Technol. 2025, 5, 50–64. [Google Scholar] [CrossRef] [Scilit]
- Bucinskas, V.; Dzedzickis, A.; Sumanas, M.; Sutinys, E.; Petkevicius, S.; Butkiene, J.; Virzonis, D.; Morkvenaite-Vilkonciene, I. Improving industrial robot positioning accuracy to the microscale using machine learning method. Machines 2022, 10, 940. [Google Scholar] [CrossRef] [Scilit]
- Yarotsky, D. Universal approximations of invariant maps by neural networks. Constr. Approx. 2022, 55, 407–474. [Google Scholar]
- Bo, L.; Wei, T.; Fangfang, H.; Guangyu, C.; Yufei, L. Positioning error compensation of an industrial robot using neural networks and experimental study. Chin. J. Aeronaut. 2022, 35, 346–360. [Google Scholar] [CrossRef] [Scilit]
- Santos, C.F.G.D.; Papa, J.P. Avoiding overfitting: A survey on regularization methods for convolutional neural networks. ACM Comput. Surv. (Csur) 2022, 54, 1–25. [Google Scholar] [CrossRef] [Scilit]
- Benyettou, R.; Amroune, S.; Slamani, M.; Kilic, A. Investigation of machinability of biocomposites: Modeling and ANN optimization. Acad. J. Manuf. Eng. 2023, 21, 97–104. [Google Scholar]
- Liu, D.; Deng, H.; Cheng, X.; Ren, Q.; Wang, K.; Zhang, Q. Towards the difficulty for a deep neural network to learn concepts of different complexities. Adv. Neural Inf. Process. Syst. 2023, 36, 41283–41304. [Google Scholar] [CrossRef] [Scilit]
- Montgomery, D.C.; Runger, G.C. Applied Statistics and Probability for Engineers; John Wiley & Sons: Hoboken, NJ, USA, 2010. [Google Scholar]
- Sarmah, U.; Borah, P.; Bhattacharyya, D.K. Ensemble learning methods: An empirical study. SN Comput. Sci. 2024, 5, 924. [Google Scholar] [CrossRef] [Scilit]
- Krogh, A.; Vedelsby, J. Neural network ensembles, cross validation, and active learning. Adv. Neural Inf. Process. Syst. 1994, 7, 231–238. [Google Scholar]
- Allouzi, M.; Aljaafreh, M. Applied Ai in Neom construction projects: The potential impact of Ai in enhancing projects success. Acta Inform. Malays. 2024, 8, 32–44. [Google Scholar] [CrossRef] [Scilit]
- Song, Y. Optimization of quantitative research methods in social sciences in the era of big data. Acta Inform. Malays. 2023, 7, 92–96. [Google Scholar] [CrossRef] [Scilit]
- Urrea, C.; Kern, J. Recent advances and challenges in industrial robotics: A systematic review of technological trends and emerging applications. Processes 2025, 13, 832. [Google Scholar] [CrossRef] [Scilit]
- Sungeetha, D. Optimizing Industrial Robot Performance Through Hybrid Ensemble Meta-Learning: A Multi-Objective Comparative Analysis. In Proceedings of the 2026 IEEE 2nd International Conference on Quantum Photonics, Artificial Intelligence & Networking (QPAIN), Chattogram, Bangladesh, 16–18 April 2026. [Google Scholar]
- Zhu, C.; Sun, H.; Cao, C.; Zhang, D. Tracking Error Prediction and Compensation of Industrial Robot Considering Dynamical Factors via Physics-Informed Machine Learning. In IEEE/ASME Transactions on Mechatronics; IEEE: Piscataway, NJ, USA, 2025. [Google Scholar]
- Santhosh, R.; Sut, D.J.; Uma, M.; Sethuramalingam, P. Optimizing IRB1410 industrial robot painting processes through Taguchi method and fuzzy logic integration with machine learning. Int. J. Intell. Robot. Appl. 2024, 8, 380–400. [Google Scholar] [CrossRef] [Scilit]
- Li, Z.; Li, S.; Luo, X. A novel machine learning system for industrial robot arm calibration. IEEE Trans. Circuits Syst. II Express Briefs 2023, 71, 2364–2368. [Google Scholar] [CrossRef] [Scilit]
- Long, W.; Yang, B.; Zhang, Y.; Wang, S.; He, Y.; Li, Y. Dynamic anomaly detection in industrial robot clusters: A statistical-deep learning hybrid approach. Mech. Syst. Signal Process. 2025, 234, 112863. [Google Scholar] [CrossRef] [Scilit]
- Zheng, B.; Huang, L. Real-time monitoring and prediction applications of industrial robots using machine learning. Int. J. Intell. Robot. Appl. 2025, 9, 1915–1933. [Google Scholar] [CrossRef] [Scilit]
- Kato, D.; Yoshitsugu, K.; Maeda, N.; Hirogaki, T.; Aoyama, E.; Takahashi, K. Positioning error calibration of industrial robots based on random forest. Int. J. Autom. Technol. 2021, 15, 581–589. [Google Scholar] [CrossRef] [Scilit]
- Nubiola, A.; Bonev, I.A. Absolute calibration of an ABB IRB 1600 robot using a laser tracker. Robot. Comput.-Integr. Manuf. 2013, 29, 236–245. [Google Scholar] [CrossRef] [Scilit]
- Denizhan, O. Application of Various Artificial Neural Network Algorithms for Regression Analysis in the Dynamic Modeling of a Three-Link Planar RPR Robotic Arm. Machines 2025, 13, 1031. [Google Scholar] [CrossRef] [Scilit]
- Icli, C.; Stepanenko, O.; Bonev, I. New method and portable measurement device for the calibration of industrial robots. Sensors 2020, 20, 5919. [Google Scholar] [CrossRef] [Scilit] [PubMed]
- ISO Standard 9283:1998; International Standard Manipulating Industrial Robots-Performance Criteria and Related Test Methods. ISO: Geneva, Switzerland, 1998.
- Slamani, M.; Joubair, A.; Bonev, I.A. A comparative evaluation of three industrial robots using three reference measuring techniques. Ind. Robot An. Int. J. 2015, 42, 572–585. [Google Scholar] [CrossRef] [Scilit]
- Sutskever, I.; Martens, J.; Dahl, G.; Hinton, G. On the importance of initialization and momentum in deep learning. In Proceedings of the International Conference on Machine Learning Pmlr, Atlanta, GA, USA, 16–21 June 2013. [Google Scholar]
- He, K.; Zhang, X.; Ren, S.; Sun, J. Delving deep into rectifiers: Surpassing human-level performance on imagenet classification. In Proceedings of the IEEE International Conference on Computer Vision, Santiago, Chile, 7–13 December 2015. [Google Scholar]
- Nair, V.; Hinton, G.E. Rectified linear units improve restricted boltzmann machines. In Proceedings of the 27th International Conference on Machine Learning (ICML-10), Haifa, Israel, 21–24 June 2010. [Google Scholar]
- Rumelhart, D.E.; Hinton, G.E.; Williams, R.J. Learning representations by back-propagating errors. Nature 1986, 323, 533–536. [Google Scholar] [CrossRef] [Scilit]
- Glorot, X.; Bengio, Y. Understanding the difficulty of training deep feedforward neural networks. In Proceedings of the Thirteenth International Conference on Artificial Intelligence and Statistics JMLR Workshop and Conference Proceedings, Chia Laguna, Sardinia, Italy, 13–15 May 2010. [Google Scholar]
- LeCun, Y.; Bottou, L.; Orr, G.B.; Müller, K.-R. Efficient Backprop, in Neural Networks: Tricks of the Trade; Springer: Berlin/Heidelberg, Germany, 2002; pp. 9–50. [Google Scholar]
- Passalis, N.; Tefas, A.; Kanniainen, J.; Gabbouj, M.; Iosifidis, A. Deep adaptive input normalization for time series forecasting. IEEE Trans. Neural Netw. Learn. Syst. 2019, 31, 3760–3765. [Google Scholar] [CrossRef] [Scilit] [PubMed]
- Hansen, L.K.; Salamon, P. Neural network ensembles. IEEE Trans. Pattern Anal. Mach. Intell. 2002, 12, 993–1001. [Google Scholar] [CrossRef] [Scilit]
- Pearce, T.; Brintrup, A.; Zaki, M.; Neely, A. High-quality prediction intervals for deep learning: A distribution-free, ensembled approach. In Proceedings of the International Conference on Machine Learning, Stockholm, Sweden, 10–15 July 2018. [Google Scholar]
- Chicco, D.; Warrens, M.J.; Jurman, G. The coefficient of determination R-squared is more informative than SMAPE, MAE, MAPE, MSE and RMSE in regression analysis evaluation. Peerj Comput. Sci. 2021, 7, e623. [Google Scholar] [CrossRef] [Scilit] [PubMed]
- Willmott, C.J.; Matsuura, K. Advantages of the mean absolute error (MAE) over the root mean square error (RMSE) in assessing average model performance. Clim. Res. 2005, 30, 79–82. [Google Scholar] [CrossRef] [Scilit]
- Kohavi, R. A study of cross-validation and bootstrap for accuracy estimation and model selection. In Proceedings of the 14th International Joint Conference on Artificial Intelligence (IJCAI 1995), Montreal, QC, Canada, 20–25 August 1995. [Google Scholar]
- Arlot, S.; Celisse, A. A survey of cross-validation procedures for model selection. Stat. Surv. 2010, 4, 40–79. [Google Scholar] [CrossRef] [Scilit]
- Picard, R.R.; Cook, R.D. Cross-validation of regression models. J. Am. Stat. Assoc. 1984, 79, 575–583. [Google Scholar] [CrossRef]
- Efron, B. Estimating the error rate of a prediction rule: Improvement on cross-validation. J. Am. Stat. Assoc. 1983, 78, 316–331. [Google Scholar] [CrossRef]
- Krogh, A.; Hertz, J. A simple weight decay can improve generalization. Adv. Neural Inf. Process. Syst. 1991, 4, 957–963. [Google Scholar]
- Chen, Y.; Dong, F. Robot machining: Recent development and future research issues. Int. J. Adv. Manuf. Technol. 2013, 66, 1489–1497. [Google Scholar]
- Sigron, P.; Aschwanden, I.; Bambach, M. Compensation of geometric, backlash, and thermal drift errors using a universal industrial robot model. IEEE Trans. Autom. Sci. Eng. 2023, 21, 6615–6627. [Google Scholar] [CrossRef] [Scilit]
- Heisel, U.; Richter, F.; Wurst, K.-H. Thermal behaviour of industrial robots and possibilities for error compensation. CIRP Ann. 1997, 46, 283–286. [Google Scholar] [CrossRef] [Scilit]
- Theissen, N.A.; Mohammed, A.; Archenti, A. Articulated industrial robots: An approach to thermal compensation based on joint power consumption. Laser Metrol. Mach. Perform. 2019, 13, 81–90. [Google Scholar]
- Khirani, H.; Slamani, M.; Bonev, I.; Stepanenko, O.; Tahan, A.; Louhichi, B.; Alawad, M.A. Cost-effective metrological evaluation and statistical modeling of thermal and payload effects on industrial robot repeatability. Measurement 2026, 278, 121565. [Google Scholar] [CrossRef] [Scilit]
- Slamani, M.; Nubiola, A.; Bonev, I.A. Modeling and assessment of the backlash error of an industrial robot. Robotica 2012, 30, 1167–1175. [Google Scholar] [CrossRef] [Scilit]
- Vitalli, R.A.P.; Fioretti, F.G.; Santos, P.B.; Rebouças, M.C.; Freitas, J.C.D.A. Performance Comparison Between Collaborative and Industrial Robots: A Study Using Digital Twins of Robotic Cells. In Mechatronics and Automation Technology Proceedings of the 3rd International Conference (ICMAT 2024), Wuhan, China, 25–26 October 2024. [Google Scholar]
- Khafagy, R.R.; Eltaib, M.E.; Abo-Shanab, R.F. Automated complex path extraction and optimization based on scalable vector graphics and genetic algorithm for industrial robot applications. Int. J. Adv. Manuf. Technol. 2025, 139, 1033–1052. [Google Scholar] [CrossRef] [Scilit]
- Poonyapak, P.; McDill, J.M.J.; Hayes, M.J.D. Improving Robot Efficiency to Reduce Energy Consumption. In Proceedings of the ICWES14 International Network of Women Engineers and Scientists, Lille, France, 15–18 July 2008. [Google Scholar]
- Raviola, A.; Guida, R.; De Martin, A.; Pastorelli, S.; Mauro, S.; Sorli, M. Effects of temperature and mounting configuration on the dynamic parameters identification of industrial robots. Robotics 2021, 10, 83. [Google Scholar] [CrossRef] [Scilit]
- Elhadidy, M.S.; Abdalla, W.S.; Abdelrahman, A.A.; Elnaggar, S.; Elhosseini, M. Assessing the accuracy and efficiency of kinematic analysis tools for six-DOF industrial manipulators: The KUKA robot case study. AIMS Math. 2024, 9, 13944–13979. [Google Scholar] [CrossRef] [Scilit]
- Li, Y.; Li, B.; Zhao, X.; Cheng, S.; Zhang, W.; Tian, W. Error similarity analysis and error compensation of industrial robots with uncertainties of TCP calibration. Appl. Sci. 2023, 13, 2722. [Google Scholar] [CrossRef] [Scilit]
- Chen, X.; Zhan, Q. The kinematic calibration of a drilling robot with optimal measurement configurations based on an improved multi-objective PSO algorithm. Int. J. Precis. Eng. Manuf. 2021, 22, 1537–1549. [Google Scholar] [CrossRef] [Scilit]
- Slamani, M.; Louhichi, B.; Arslane, M.; Alawad, M.A. Smart industrial robots in the transition from automation to human-centric sustainable systems: A comprehensive review of technologies, challenges, and future directions. Int. J. Adv. Manuf. Technol. 2026, 143, 69–96. [Google Scholar] [CrossRef] [Scilit]

Disclaimer/Publisher’s Note: The statements, opinions and data contained in all publications are solely those of the individual author(s) and contributor(s) and not of MDPI and/or the editor(s). MDPI and/or the editor(s) disclaim responsibility for any injury to people or property resulting from any ideas, methods, instructions or products referred to in the content. |
© 2026 by the authors. Licensee MDPI, Basel, Switzerland. This article is an open access article distributed under the terms and conditions of the Creative Commons Attribution (CC BY) license.