


Abstract
Sensorimotor rhythms (SMR) are widely employed in brain–machine interface applications, although their reliable detection during overt upper-limb movements remains challenging because of motion artifacts and concurrent peripheral activity. This study investigated whether SMR modulation can be decoded during elbow flexion and extension performed under active and resistive conditions resembling robot-assisted rehabilitation, with and without voluntary modulation. Nine healthy participants executed four experimental conditions while electroencephalography (EEG), electromyography (EMG), and inertial measurement unit (IMU) signals were synchronously acquired. EEG data were analyzed using a filter bank common spatial pattern (FBCSP)-based classification pipeline, whereas EMG signals were used to estimate exerted force. Subjective workload was evaluated through the NASA-TLX questionnaire. Classification accuracies generally exceeded the theoretical chance level, reaching average values above 73% ± 14% and above 80% ± 12% when discriminating voluntary SMR modulation independently of movement type. Only a few individual cases were at or below the theoretical chance level. EMG analyses confirmed higher force production during resistive tasks, while event-related desynchronization/synchronization analyses revealed distinct cortical modulations in the and bands, indicating the presence of task-related cortical modulation underlying the decoded features. These findings demonstrate the feasibility of detecting SMR modulation during overt upper-limb movements and support the potential of the proposed framework for future adaptive robot-assisted rehabilitation systems, where movement resistance could be modulated according to real-time neural activity.
1. Introduction
Effective neurorehabilitation relies on two key requirements: intensive exercise and engagement of the patient [1,2]. To address the former, the development of minimally supervised robot-based rehabilitation systems is underway to deliver safe, repetitive, and high-intensity exercises, especially for the upper limb [3,4,5]. To address the latter requirement, patient involvement has become a growing focus in the development of rehabilitation strategies [6]. Notably, patients’ engagement is an essential requirement to stimulate neuroplasticity and either promote motor recovery after a stroke or slow down the progression of degenerative diseases [2,7].
Robotic rehabilitation can be delivered through modalities [8]: in passive mode, the movement is entirely driven by the robot, in active mode it is initiated by the user, active-assistive mode provides support when user effort is insufficient, while the resistive mode challenges the user by applying opposing force. A promising solution in the direction of volitional participation is the use of brain–computer interfaces (BCIs) based on motor imagery, which allow patients to interact with robotic devices through their neural signals, thereby fostering volitional control over the rehabilitation exercises [9,10,11,12].
While these systems represent a significant step toward effective neurorehabilitation, in most implementations motor imagery serves primarily to initiate the movement. After that, the exoskeleton predominantly operates in passive mode [6,13], or it relies on paradigms beyond motor imagery to improve on-line control [14,15,16].
Numerous studies explored the detection of movement intention or assessed user’s mental engagement during rest-to-movement transitions [17,18,19,20], but relatively few investigated protocols in which users are required to actively maintain kinesthetic imagery throughout the execution phase [21,22] or examined approaches that rely on input signals other than electroencephalographic (EEG) activity [23]. This represents a critical gap in the rehabilitation field, as voluntarily modulating sensorimotor rhythms (SMR) during movement execution would enhance volitional control and promote more effective motor learning [23].
The possibility to dynamically adjust both resistance and assistance levels according to the individual’s performance is a well-documented and widely acknowledged requirement expressed by therapists [24,25,26]. Although BCI-based rehabilitation has been widely investigated in passive and assistive modalities [18], the application of BCIs within resistive training remains largely unexplored. No study has systematically assessed the feasibility of detecting voluntary sensorimotor rhythm modulation during active and resistive movement modes using EEG. This constitutes a research gap, given that resistive training promotes superior motor recovery compared to purely assistive protocols [8].
For these reasons, investigating the feasibility of measuring SMR during overt movements is of particular interest, as this information could potentially be used in the future to adjust the level of robotic assistance or resistance [27]. A well-recognized challenge in BCIs based on spontaneous brain activity is the variability in classification performance across users, which can lead to unstable or delayed control responses [28,29]. Such variability poses a limitation for their reliable use in real-world rehabilitation scenarios, where consistent decoding of user intent is essential to ensure effective interaction with assistive or robotic devices [30,31]. In this perspective, adapting the resistance level based on real-time detection of SMR could represent a promising strategy to design more flexible and inclusive rehabilitation systems [32]. Individuals showing lower SMR detectability would still benefit from reduced resistance, enabling them to complete the exercises effectively, whereas higher-performing users could be presented with increased resistance to promote engagement and enhance motor learning [8]. This approach could, therefore, contribute to the development of adaptive robotic protocols capable of personalizing both the cognitive and physical workload according to individual capabilities [11].
In this context, the primary objective of this study was to assess whether SMR can be effectively detected during upper-limb movement execution particularly when participants are actively engaged in the task. To this end, a system for the synchronized acquisition of multiple biosignals, including EEG and electromyography (EMG) as well as inertial measurement unit data (IMU), was developed, and an experimental campaign was conducted to investigate differences in these signals in the presence or absence of SMR voluntary modulation, as well as across active and resistive movement conditions for two movement types: elbow flexion and extension.
The article is organized as follows: Section 2 presents the acquisition system, the experimental protocol, the experimental setup and the analyses performed, Section 3 reports the corresponding numerical results, and Section 4 discusses the results focusing on open issues and next steps. The study was conducted on healthy participants and was intended to provide an initial proof of concept before future validation in robot-assisted rehabilitation scenarios involving clinical populations.
2. Methods
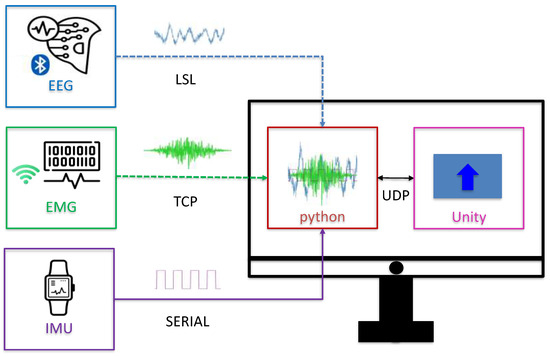
The proposed system is shown in Figure 1.
Figure 1.
Diagram of the system with implementation choices per block and communication between them. Adopted abbreviations: Lab Streaming Layer (LSL), Transmission Control Protocol (TCP), User Datagram Protocol (UDP).
The following signals were synchronously acquired via a Python script:
- EEG signals, transmitted via Bluetooth and received through the Lab Streaming Layer protocol;
- EMG signals, recorded from the right bicep, transmitted via Wi-Fi and received through the Transmission Control Protocol;
- IMU signals, collected via a sensor positioned on the participant’s wrist and connected via serial communication.
A custom script was developed in a custom manner for synchronous multimodal acquisition, with separate threads used to collect EEG, EMG, and IMU data in parallel. The biosignals were also synchronized with trials timing. The graphical interface was developed in Unity. It delivered visual instructions to the participant regarding both the type of movement to perform and the execution timing. Timing was controlled by Unity, which communicated with the Python 3.12 (Python Software Foundation, Wilmington, DE, USA) script via the User Datagram Protocol. Both environments ran on the same hardware. This event-based messaging system allowed the Unity application to trigger events such as trial start, stimulus cues, and run end, enabling temporal alignment across all recorded modalities.
2.1. Experimental Protocol
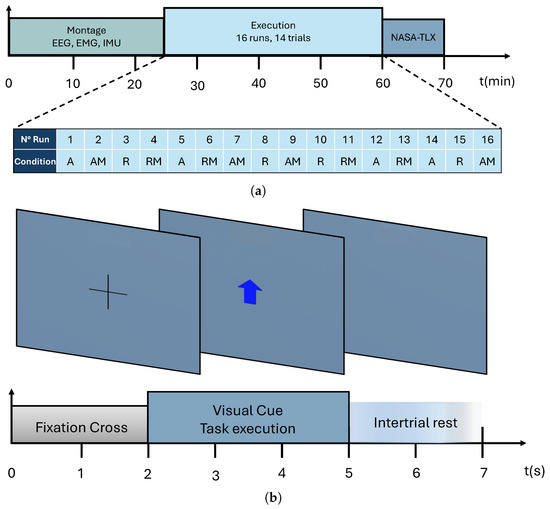
Figure 2 illustrates the timing of the experimental protocol for each phase, including system montage, task execution, and administration of the NASA-TLX questionnaire. The total duration of a single experiment was approximately 70 min. Participants performed a series of elbow flexion and extension movements, while wearing the EEG, EMG and IMU devices, in two conditions: active and resistive. A 1.4 kg dumbbell was used to apply resistance to the movement. The load was selected based on preliminary experiments to provide a consistent increase in physical effort while remaining comfortable and sustainable by all participants throughout the experimental session.
Figure 2.
Experimental protocol overview. The top panel illustrates the timing from montage to execution and final questionnaire. The middle panel details the specific tasks performed under different run types (A: active, AM: active with SMR voluntary modulation, R: resistive, RM: resistive with SMR voluntary modulation). The bottom panel shows the timing of a single trial. (a) Experimental protocol overview from montage to execution and final questionnaire. (b) Detailed timing of tasks and single-trial structure under different run types (A: active, AM: active with SMR voluntary modulation, R: resistive, RM: resistive with SMR voluntary modulation).
For each movement condition, participants were instructed to perform the task under two mental states:
- without voluntarily modulating SMR, where the user just executed the movement;
- with SMR voluntary modulation, where participants were asked to mentally focus on the kinesthetic sensation of muscle contraction, joints rotation and to visualize the limb movement in their mind during the actual execution of the task.
All participants received standardized instructions on how to voluntarily modulate SMR through kinesthetic imagery. Specifically, they were first instructed to focus on the sensation associated with muscle contraction during elbow flexion and extension, then to mentally rehearse this sensation through kinesthetic imagery, and finally to perform such voluntary SMR modulation concurrently with the movement when required by the protocol. No formal assessment of the participants’ initial ability to perform the task was conducted. Four runs were executed per combination of movement condition and mental state, resulting in a total of 16 runs recorded per participant. Each run was composed of 14 trials (7 flexions alternated with 7 extensions), thus, totaling 28 × 4 trials per type of movements for each movement condition and mental state. The sequence of runs was randomized with the constraint of no consecutive runs with same movement modality, but the same run sequence was used for all participants. The random sequence is reported in the middle of Figure 2.
The timing of each trial is represented at the bottom of Figure 2. At the beginning, a fixation cross appeared for 2 s to guide in keeping the eyes in a steady position, then a cue indicating the task to perform appeared for 3 s during which participants were required to perform the overt movement. Finally, a short pause of random duration between 1 s to 2 s was presented to mitigate automatic movement initiation across consecutive trials.
At the end of the experiment, each participant completed a NASA Task Load Index (NASA-TLX) questionnaire [33] to assess the perceived physical and cognitive workload across the different run types: active (A), resistive (R), active with SMR voluntary modulation (AM) and resistive with SMR voluntary modulation (RM).
2.2. Experimental Setup
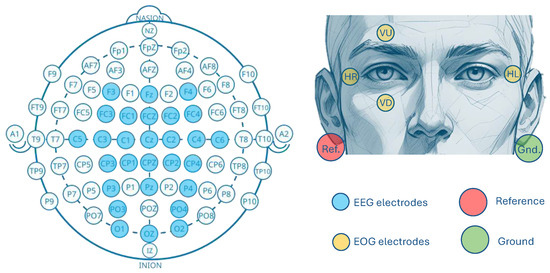
For the EEG recording, an actiCAP with 28 electrodes (Brain Products GmbH, Gilching, Germany) was used [34]. The electrodes were arranged according to the 10–10 international system in the following positions: F3, Fz, F4, FC3, FC1, FCz, FC2, FC4, C3, C1, Cz, C2, C4, CP3, CP1, CPz, CP2, CP4, P3, Pz, P4, PO3, PO4, O1, Oz, O2. Four additional electrodes were placed to record electrooculographic activity as reported in Figure 3. The reference electrode was positioned on the left earlobe, and the ground electrode on the right earlobe. The reference and ground electrodes were placed on the earlobes with clip electrodes. EEG signals were recorded at 250 and amplified using the LiveAmp system by Brain Products (Brain Products GmbH, Gilching, Germany) [34].
Figure 3.
Custom electrode configuration with 28 EEG electrodes in blue within the 10–10 standard locations, and four electrooculographic (EOG) electrodes placed above and below the right eye (VU and VD) and at the outer canthi of the left and right eyes (HL and HR). Part of the image was generated using AI and does not represent a real participant.
EMG signals were recorded using HD-sEMG equipment (OT Bioelettronica, Turin Italy) with a sampling rate of 2000 . The signals were amplified [35] with the sessantaquattro+ system [36]. The device was positioned on the participant’s back and secured with an adjustable strap, while a reference electrode was placed on the left scapula. To ensure optimal signal conductivity, the electrode area was prepared with a dermabrasive gel and cleaned with ethyl alcohol. An electrode matrix of 32 electrodes (1 diameter), was arranged in an 8 × 4 grid with an inter-electrode distance of 1 . The matrix was positioned on the right biceps brachii, while the triceps was not monitored to keep the acquisition setup as streamlined as possible with a view to future applications. It was placed on the line between the medial acromion and the fossa cubit at 1/3 from the fossa cubit.
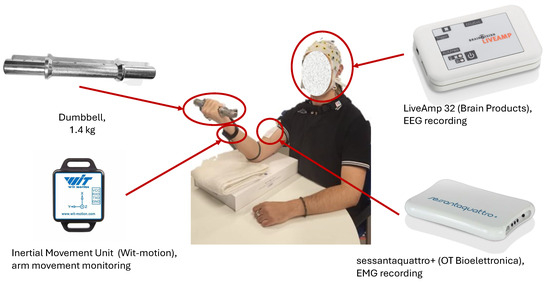
Finally, an IMU from WIT Motion [37] was used to monitor the movement of the arm. The device sample rate was 100 . The device was positioned on the right wrist of the participant. The overall montage is shown in Figure 4, where the picture of a participant was taken during an experiment with the resistive movement.
Figure 4.
The system worn by a participant taking part in the experiments, with all of the adopted devices highlighted.
2.3. Data Analysis
For each signal, a different pre-processing strategy was applied:
- EEG signals were band-pass filtered run-by-run in the 0.1 to 100.0 range, along with a notch filter at 50 to eliminate power line interference. Filtering was performed using a state-variable filter applied sample-by-sample to preserve the temporal structure of the signals. Subsequently, ocular artifacts registered with electrooculographic channels were removed using an H-infinity adaptive filtering approach [38]. After that, channels that exceeded the threshold of 200 μV were discarded, with an average of approximately two channels removed per participant.
- EMG signals were pre-processed using an adaptive template subtraction filter [39]. The procedure included band-pass filtering in the 10 to 500 range, as well as notch filtering at 50 and its harmonics up to 500 to remove power line interference. Cardiac artifacts were subsequently suppressed through an adaptive removal method consisting of: (1) QRS detection, (2) construction of an electrocardiogram template by averaging detected complexes, (3) low-pass filtering to minimize residual noise, and (4) subtraction of the template from the EMG signal.
- IMU data were resampled to match the sample rate of either the EEG or EMG signals, depending on the performed analysis. Among the six-channel available information (acceleration and angle referred to the three axes), acceleration along the y-axis was identified as the most representative indicator of arm movement.
The pipeline used to classify different EEG signals offline was based on the filter bank common spatial pattern approach [40] for feature extraction, followed by feature selection using the minimal redundancy-maximal relevance criterion [41] and a linear discriminant analysis classifier. EEG data were filtered into four non-overlapping frequency bands (8–12 , 12–18 , 18–28 , 28–40 ) with Chebyshev type II band-pass filters [42]. These data were then segmented using a -wide sliding window with a shift. The analysis window was evaluated over the SMR interval, from to . All the EEG epochs related to the same time interval (with respect to the trial timing) were processed by the proposed classification pipeline. During the test phase, each EEG epoch was projected using the spatial filters learned during the training phase, and the log-variances of the projected signals were computed as features [40,42,43].
For each window and number of selected features (ranging from 5 to 48), the mean classification accuracy and standard deviation were computed using repeated 5-fold cross-validation performed at the trial level [44]. In each repetition, trials were exclusively assigned to either the training or the test set, thereby preventing data leakage between the two sets. The resulting cross-validation accuracy was then used to compare the different time windows and the configuration yielding the highest mean classification accuracy was retained for the subsequent analyses. Only windows entirely contained within the movement interval, identified from IMU recordings, were considered.
This pipeline takes inspiration from a previous work, where it was particularly efficient in distinguishing SMR associated with motor imagery versus rest [43]. Moreover, the rationale behind the non-standard frequency band partitioning was to favor real-time control by adopting lighter filtering without compromising performance. Indeed, this same approach was already adopted by the winners of the BCI race associated with the Cybathlon Challenges 2023 [42], other than recently exploited in a self-paced BCI [43].
To evaluate the significance of SMR-related activation, binary classification was first performed for comparing A versus AM, R versus RM, A versus R and AM versus RM. Additionally, to evaluate the overall capacity to detect SMR regardless of the specific movement, a further classification was carried out by merging movement types (i.e., aggregating elbow flexion and extension) and focusing on detecting the presence or absence of SMR. To assess whether the observed classification performances exceeded chance level, the analytical approach proposed in [45] was adopted. Specifically, for the single-condition binary classifications ( independent trials), the statistical chance threshold results 63% with a significance . For the aggregated task classification ( independent trials), the corresponding threshold is 59% at the same significance level.
The elbow flexion and extension conditions were aggregated to assess whether the proposed EEG-based pipeline could distinguish SMR associated with movement conditions characterized by different levels of physical effort, independently of the specific motor task. This analysis represents a first step toward potential future applications in adaptive rehabilitation, where identifying whether SMR is associated with an active or a resistive condition may provide useful information to support adaptive robotic assistance strategies.
To investigate the effect of fatigue during the experimental session, two additional analyses were conducted. For mental fatigue, a temporal trend of the Theta/Beta Ratio (TBR) on channel Fz was evaluated [46]. For each participant, TBR values were first log-normalized with respect to the first run (A) to reduce inter-subject variability. Group-level comparisons were then made by comparing the average TBR of the first four runs with that of the last four runs (runs 13–16), ensuring that the compared groups contained the same experimental conditions. Muscular fatigue was investigated through a temporal trend of the median frequency (MDF) [47] of the EMG power spectrum, a commonly adopted spectral indicator of muscle fatigue. For each participant, the mean MDF of each run was obtained by averaging the channel-wise MDF values. MDF values were then log-normalized with respect to the first active (A) and the first resistive (R) run to reduce inter-subject variability. Group-level comparisons were performed separately for the active (A + AM) and resistive (R + RM) conditions by comparing the average normalized MDF values of the first two and the last two repetitions of each movement modality. In both analyses, a Wilcoxon signed-rank test was carried out to understand whether any fatigue affected performance over time.
As for the EMG processing, signals were first segmented into trials by detecting the onset of each movement using IMU data. For each trial, a 3 segment starting from the movement onset was extracted. The EMG signals were then full-wave rectified and low-pass filtered at 5 to compute the envelope for each channel [48]. Finally, the envelopes were averaged across channels to obtain a single representative EMG amplitude (μV) for each trial. Inter-participants comparison was enabled by normalizing EMG amplitudes to a participant-specific baseline, thus, reducing variability due to physiological and acquisition-related factors like skin impedance, electrode placement and muscle morphology. For each participant and movement type, the baseline was the mean EMG amplitude across all trials of the active condition (A). The trials of each experimental condition were then expressed as the percentage variation relative to the baseline [49], namely
where is the mean EMG amplitude of the considered trial. The normalized trial-level values were pooled across participants to provide the EMG distributions across the experimental conditions.
Group-level statistical differences across conditions were assessed using pairwise comparisons among the eight condition pairs, namely A versus AM, R versus RM, A versus R, and AM versus RM for elbow flexion and extension, respectively. To ensure the robustness and interpretability of the findings, the following complementary metrics were computed for each test:
- the effect size derived from the test Z-statistic and the number of pairs (subjects) N, interpreted according to Cohen’s thresholds (: small, : medium, ≥0.5: large);
- the 95% confidence intervals (CI) for the median differences, estimated via 2000 bootstrap iterations;
- the statistical power , computed to assess sample sensitivity.
Significance was set at . In addition to the normalized group-level analysis, a complementary subject-level analysis was performed on the raw mean EMG envelope to assess within-participant differences in muscle activation across the experimental conditions. Since all conditions were performed by the same participants, paired comparisons were adopted. Differences between conditions were evaluated using the Wilcoxon signed-rank test, a non-parametric test suitable for repeated-measures data. To account for multiple comparisons, the resulting p-values were adjusted using the Holm–Bonferroni correction procedure.
Finally, the mean and standard deviation scores for each NASA-TLX item were calculated to provide a representation of the perceived mental and physical workload of the participants in each run types (A, AM, R, and RM).
The questionnaire evaluates six workload dimensions, namely Mental, Physical, Temporal, Performance, Effort, and Frustration. Statistical differences among the four run types were assessed separately for each NASA-TLX dimension using the non-parametric Friedman test. Effect sizes were quantified using Kendall’s coefficient of concordance (W). Whenever a significant global effect was observed, post-hoc pairwise comparisons were performed using the Wilcoxon signed-rank test with false discovery rate (FDR) correction for multiple comparisons. Statistical significance was set at .
2.4. Participants
Twelve able-bodied participants took part in the experiments. However, the reported results are based on data from nine participants (S01–S09). One participant was excluded due to excessive noise in the sensorimotor EEG channels, while EMG recordings for two additional participants were incomplete due to interruptions during the experiment. While excluding excessively noisy EEG data appears rather common to preserve the overall quality of a dataset, the missing samples in EMG data were led back to a local malfunctioning that had to be isolated. Also given this exclusion rate, a sensitivity analysis was performed using G*Power 3.1 considering the Wilcoxon signed-rank test. Assuming a two-tailed significance level of 0.05, a statistical power of 0.80, and the available sample size of nine participants, the minimum detectable effect size was 1.10. Therefore, the present study was primarily powered to detect large within-subject effects, whereas smaller effects may not have reached statistical significance. The final group includes four females and five males with normal or corrected-to-normal vision and no reported motor impairment. They were aged 27 ± 3 years (mean and standard deviation). Informed consent was obtained from all the participants prior to their inclusion in the study. All the experiments were carried out in accordance with the Declaration of Helsinki and approved by the Office of Responsible Research at Miguel Hernández University of Elche (Spain), under reference number DIS.JAP.09.21, on 20/10/2022.
3. Results
Table 1 summarizes the cross-validation mean accuracies and corresponding standard deviations for each participant, evaluated separately for the two movement classes (elbow flexion and elbow extension) across the four run types. The last row reports the mean performance across participants, ranging from a minimum of 73% ± 14% for R versus RM in elbow flexion to a maximum of 80% ± 12% for AM versus RM in elbow extension. The best-performing participant was S05, with an accuracy of 91% ± 9%, while the lowest performance was observed in S01, with 62% ± 14% in the R versus RM condition during elbow flexion.
Table 1.
Classification accuracies evaluated using cross-validation. For each participant, the mean and standard deviation of accuracies were calculated across the four run types for each movement classes.
In terms of fatigue, the comparison between the average TBR measured during the first four runs and the last four runs revealed no statistically significant differences (Wilcoxon signed-rank test, ). Similarly, the normalized MDF showed no significant differences between the early and late stages of the experiment for either the active (A + AM) or the resistive (R + RM) conditions (Wilcoxon signed-rank test, ). These findings indicate that neither mental nor muscular fatigue exhibited a relevant temporal trend throughout the experimental session. Consequently, no temporal effect related to task progression was observed, and all runs were pooled for the subsequent analyses regardless of their acquisition order.
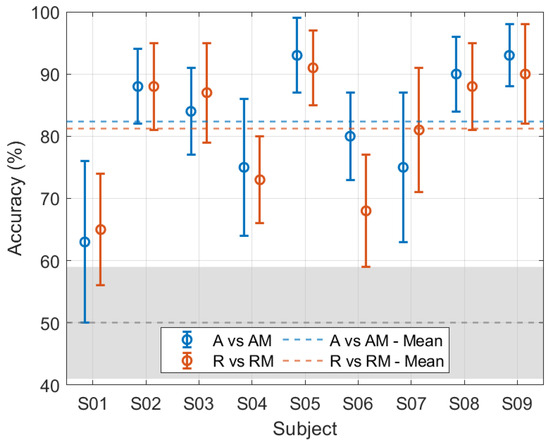
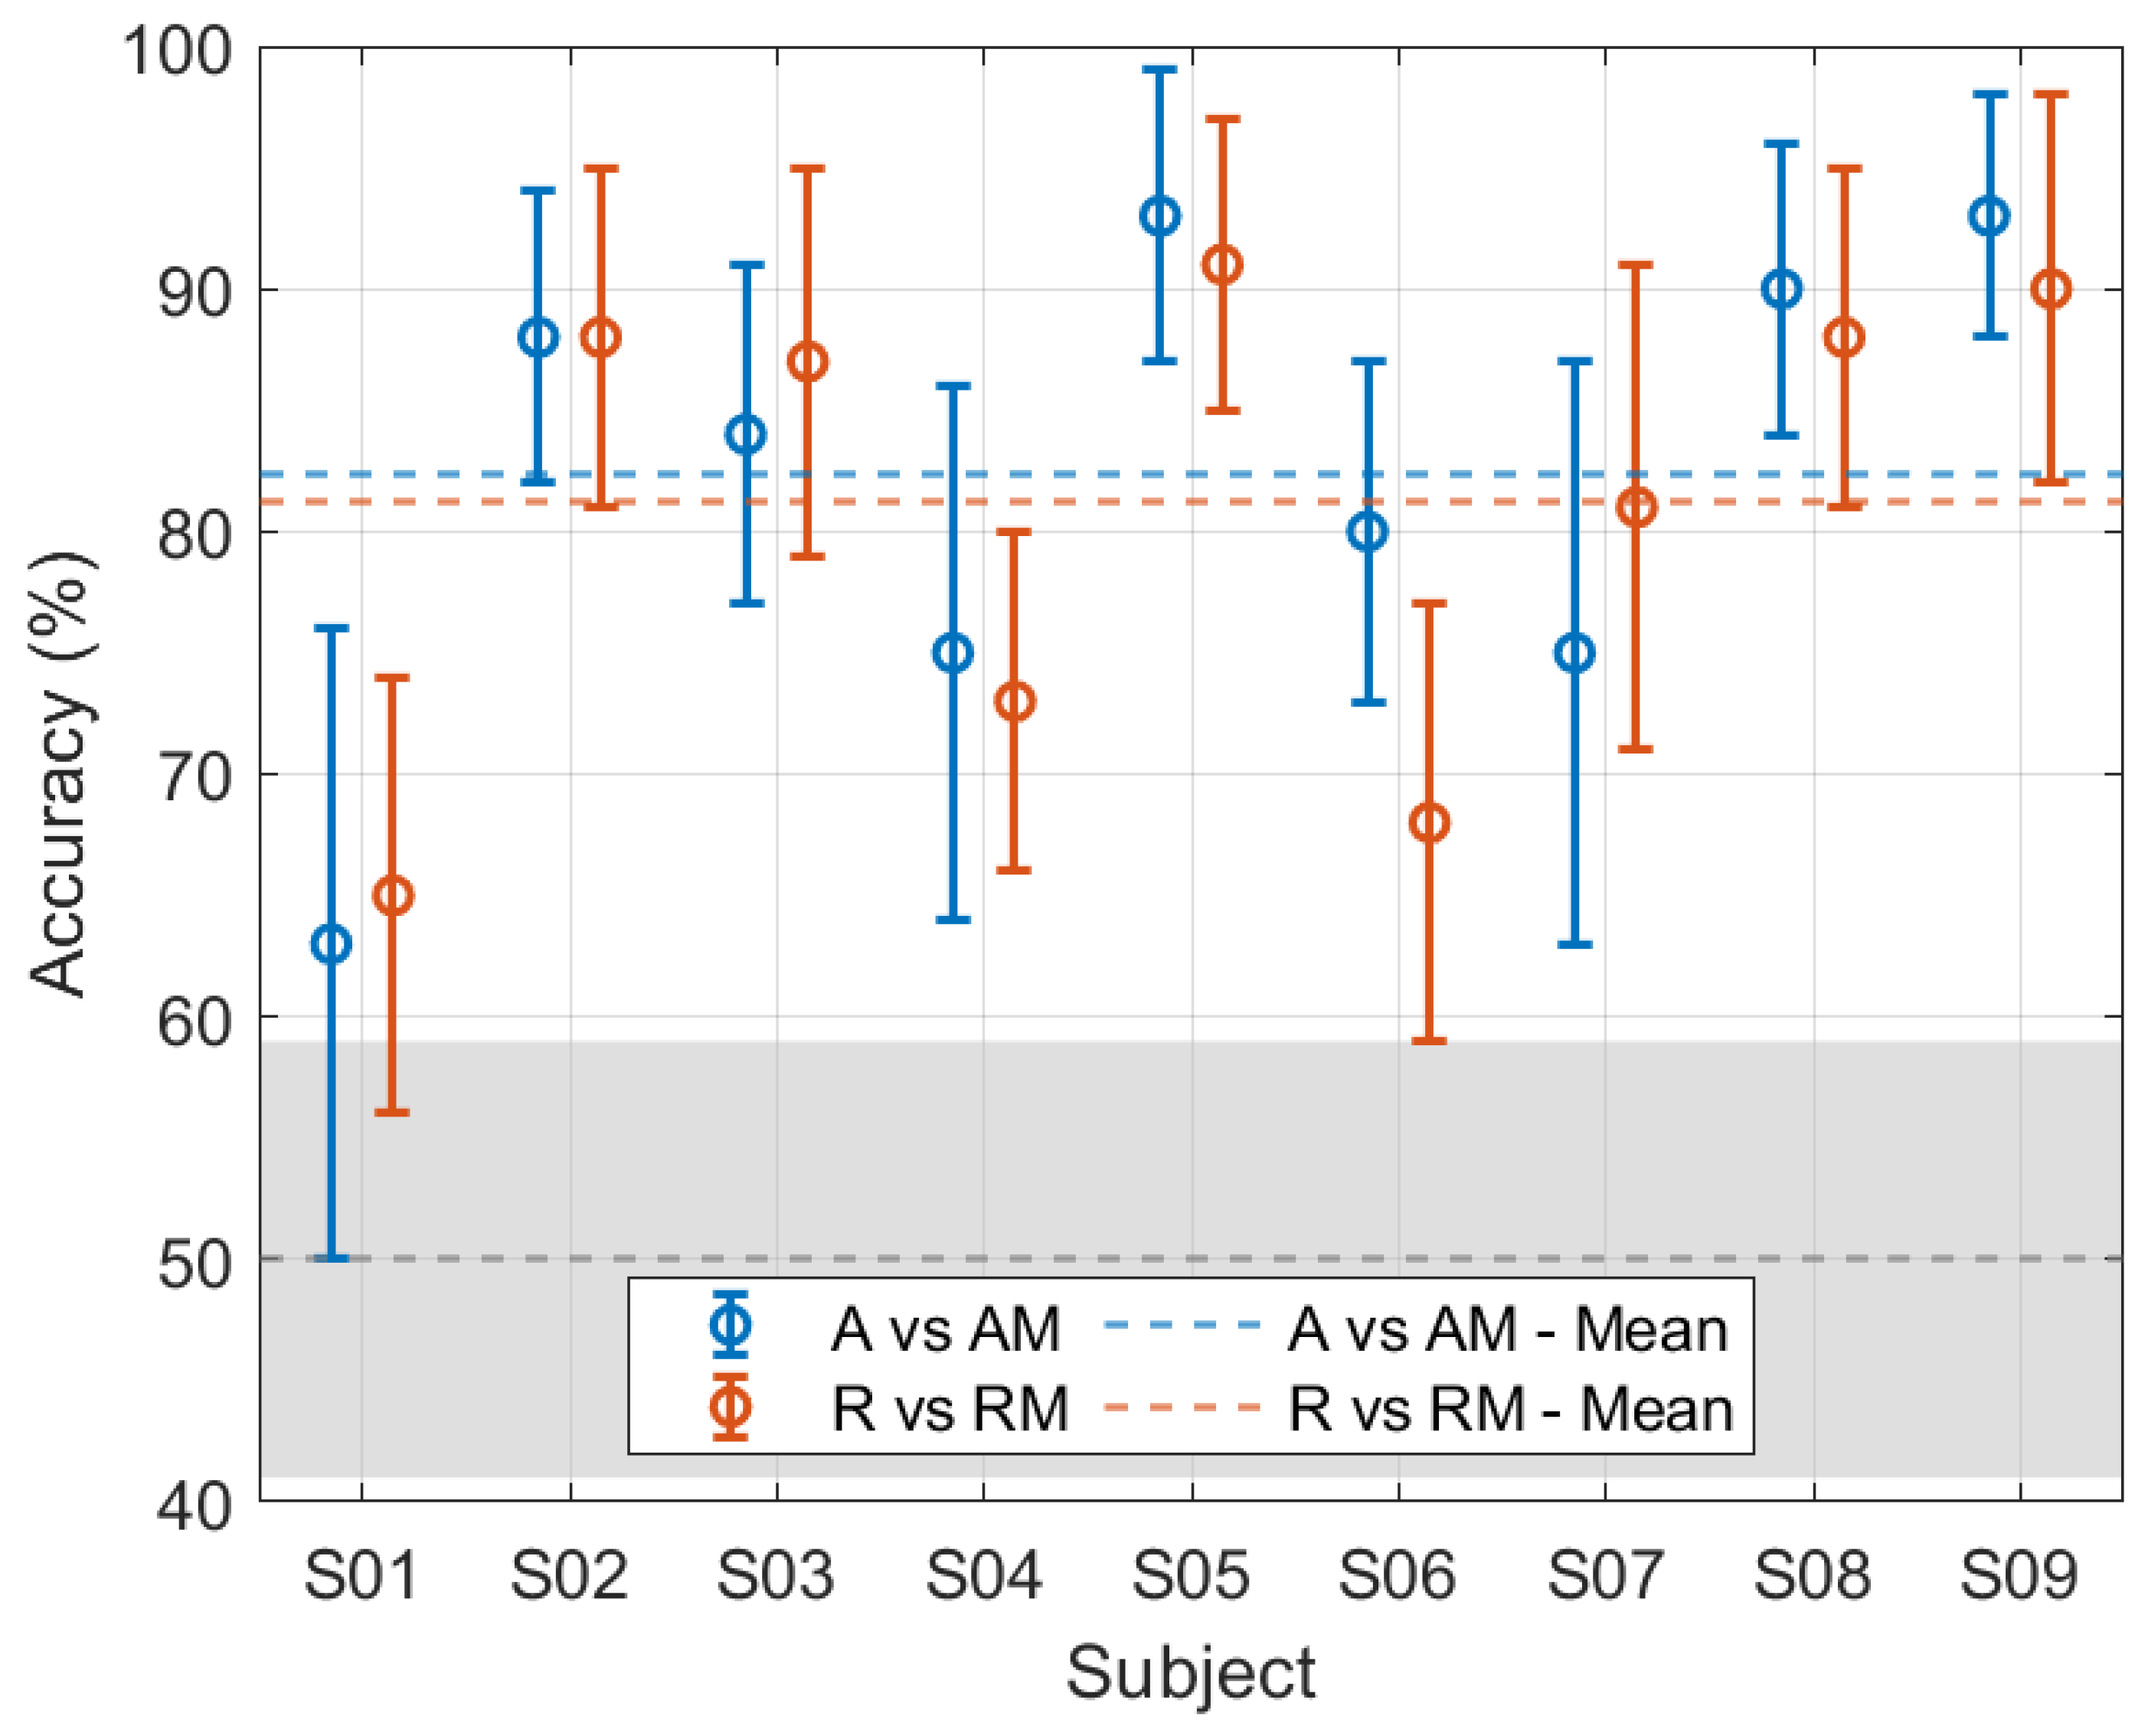
The ability of the pipeline to discriminate SMR regardless of the type of performed movement (flexion or extension) is reported in Figure 5. The plot shows the mean accuracy with bars representing the corresponding standard deviation for each participant, with the classification results of A versus AM shown in blue and R versus RM in orange. It is worth noting that all participants performed well above chance level, with averages over participants above 80%. Participant S01 exhibited the lowest classification performance. However, the mean accuracy remained above the theoretical chance level.
Figure 5.
Classification accuracies obtained for each participant in cross-validation in order to distinguish SMR independently from the type of movement (elbow flexion and extension). The grey bounded line identifies the chance level distribution with its upper limb at 59%.
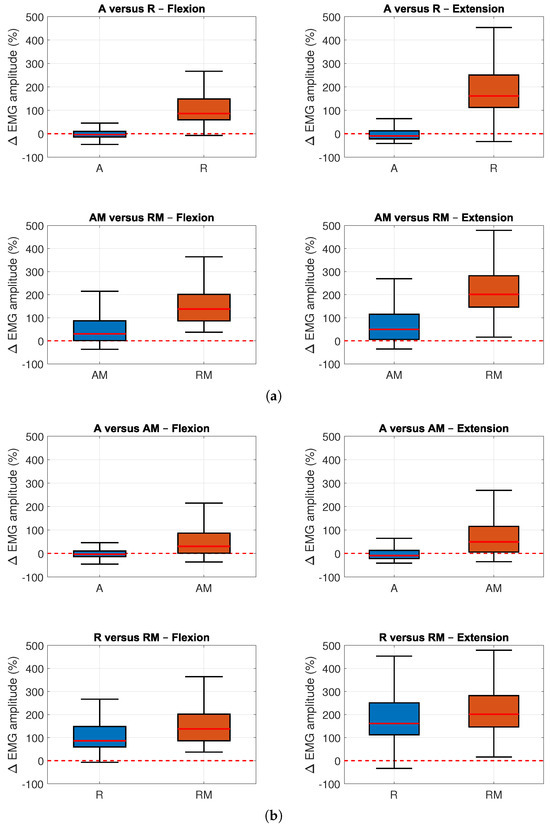
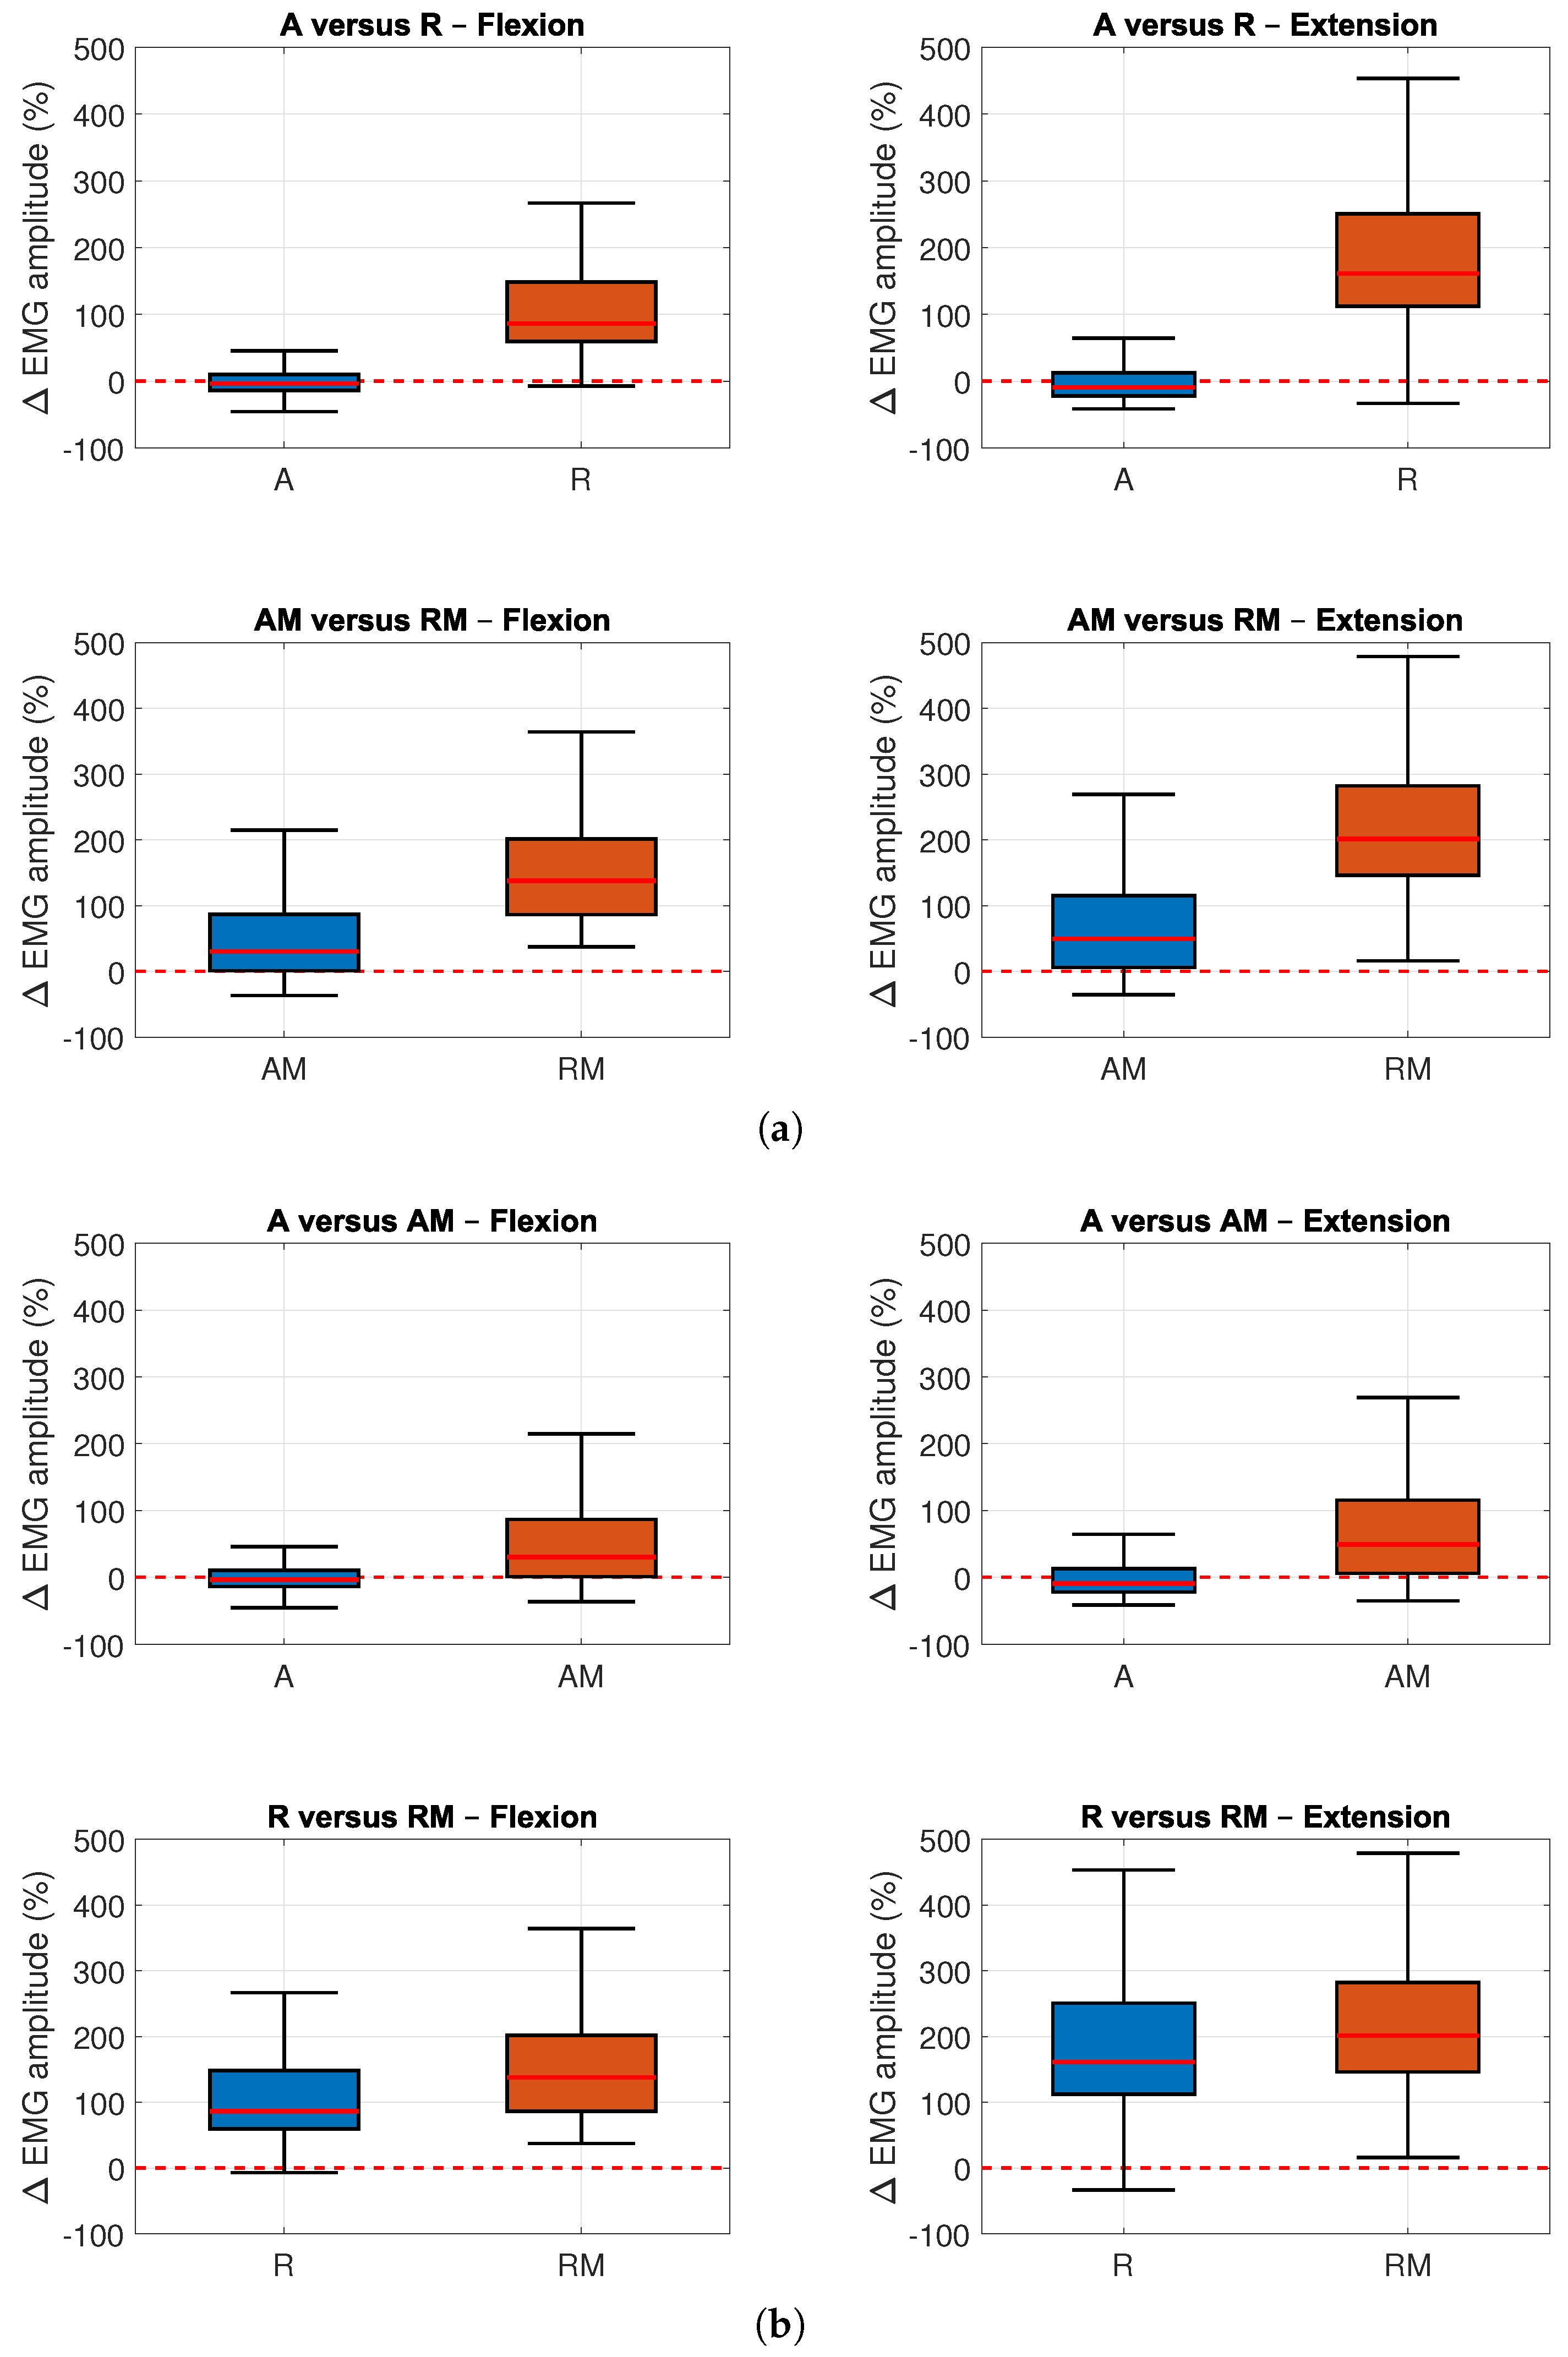
Figure 6 introduces the EMG analysis by reporting the baseline-normalized EMG amplitudes () across the four experimental conditions, separately for elbow flexion and extension. Figure 6a compares the active and resistive conditions in absence and presence of voluntary SMR modulation. In both movement types, the resistive conditions (R and RM) exhibit a clear upward shift of the EMG distributions with respect to the corresponding active conditions (A and AM). Figure 6b compares the conditions performed without and with voluntary SMR modulation. The upper row reports the comparison between A and AM, whereas the lower row reports R and RM. A slight increase in EMG activity can be observed during voluntary SMR modulation in the active condition (A versus AM), while the distributions corresponding to the resistive conditions (R versus RM) largely overlap. The statistical analysis confirmed these observations:
Figure 6.
Comparison () across the experimental conditions. Boxplots show the distribution of trial-level percentage variations relative to the participant-specific baseline. (a) Baseline-normalized EMG amplitudes () for active (blue) and resistive (orange) conditions without (top) and with (bottom) voluntary SMR modulation, for elbow flexion (left) and extension (right). Boxplots represent the distribution of trial-level values. The red dashed line indicates zero variation relative to the participant-specific baseline. (b) Baseline-normalized EMG amplitudes () for movements without (blue) and with (orange) voluntary SMR modulation during the active (top) and resistive (bottom) conditions, for elbow flexion (left) and extension (right). Boxplots represent the distribution of trial-level values.
- A versus R: Significant differences were observed for both flexion (, , CI: , ) and extension (, , CI: , ).
- AM versus RM: Significant differences were observed for both flexion (, , CI: , ) and extension (, , CI: , ).
- A versus AM: Significant differences were observed for both flexion (, , CI: , ) and extension (, , CI: , ).
- R versus RM: No significant differences were observed for either flexion (, , CI: , ) or extension (, , CI: , ).
Table 2 lists, for every possible comparison at subject level in terms of raw EMG envelope, the p-values, color-coded as follows: red for p ≥ 0.05, yellow for 0.01 ≤ p < 0.05, light green for 0.001 ≤ p < 0.01, and dark green for p < 0.001. The corresponding subject-level EMG envelope distribution plots are provided in the Supplementary Materials (Figure S1). While the comparisons between A versus R and AM versus RM consistently revealed statistically significant differences, the comparison between A versus AM and R versus RM conditions showed a more heterogeneous pattern. Only for participants S01 and S02 no statistically significant differences could be detected in any of the cases.
Table 2.
Statistical significance of differences among the experimental conditions obtained through paired comparisons using the Wilcoxon signed-rank test with Holm–Bonferroni correction for multiple comparisons. Corrected p-values are color-coded as follows: red for p ≥ 0.05, yellow for 0.01 ≤ p < 0.05, light green for 0.001 ≤ p < 0.01, and dark green for p < 0.001.
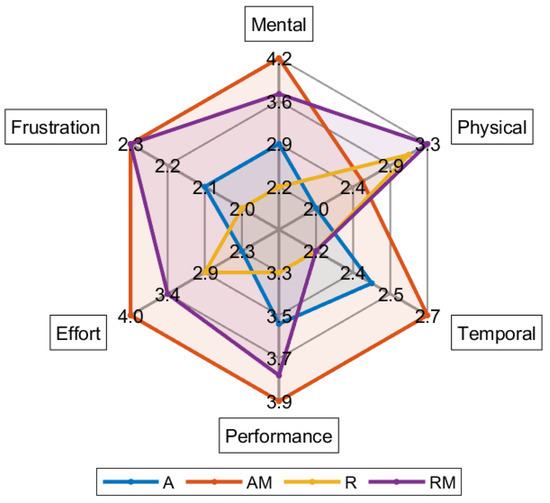
In Figure 7, a spider plot reports the average perception of mental and physical workload of the participants during the four run types: A in blue, AM in orange, R in yellow, and RM in violet. For all items, AM shows the highest mean values, except for the Physical dimension, where the maximum value (3.3) is reached in both RM and R. It is worth noting that for the other items the difference between AM and RM is smaller, whereas A and R remain more confined toward the center of the plot. For further details, Table 3 reports the mean values together with the corresponding standard deviations for each item and run type.
Figure 7.
Spider plot representing the perception of mental and physical workload during the four movement condition: A in blue, AM in orange, R in yellow, RM in violet.
Table 3.
Mean and standard deviation to the answer of the NASA-TLX questionnaire.
The statistical analysis revealed a significant global effect across conditions for the Mental, Physical, and Effort scales. Specifically, Mental showed a significant global variation with a large effect size (), while Physical also exhibited a significant global effect with a large effect size (). Similarly, Effort showed a significant global variation, corresponding to a moderate effect size (). Conversely, no statistically significant global differences were observed for Temporal, Performance, or Frustration. Following the global analysis, post-hoc pairwise comparisons revealed significant differences in the Mental scale for the comparisons A versus AM, R versus RM, and AM versus R. For the Effort scale, the pairwise analysis identified a single significant difference between the two active conditions (A versus AM), suggesting a higher perceived energetic cost when performing SMR modulation. In contrast, although the Friedman test revealed a significant global effect for Physical, none of the pairwise comparisons remained statistically significant after FDR correction.
4. Discussion
The results suggest the feasibility of detecting SMR during movement execution of the upper limb under both active and resistive conditions through EEG. The results reported in Table 1 indicate that the proposed pipeline is capable of reliably discriminating SMR across participants and movement types, with mean accuracies exceeding 73%. Furthermore, Figure 5 illustrates the robustness of the pipeline in discriminating SMR regardless of the type of movement performed. In this case, mean accuracies exceed 80% for both the A versus AM and R versus RM comparisons. The remarkable differences among participants suggest that the proposed approach is affected by the well-known inter-subject variability of EEG-based BCI systems. Such variability may arise from differences in neurophysiological patterns, signal quality, attention, motivation, spatial abilities, cognitive profile, and user engagement [50].
These results confirm the feasibility to classify both SMR and movement conditions, associated with distinct levels of physical effort from the EEG, which is highly relevant for applications in robotic rehabilitation. It is worth also remarking that the pipeline effectively detects brain activity because of the capability of distinguishing voluntary SMR modulation and no SMR modulation from EEG, independently from the movement type. The reported performances were obtained using the identified optimal window. Although such a window introduces an inherent latency that may limit its direct application to closed-loop control, previous work demonstrated its suitability for online applications [51], providing a favorable trade-off between decoding accuracy and responsiveness also in a self-paced scenario [43]. Nevertheless, future work should focus on reducing the analysis window duration and further optimizing the computational pipeline to minimize system latency while preserving decoding performance, thereby facilitating online closed-loop control.
The analysis of EMG signals in terms of exerted force confirmed that participants generally exerted higher force during resistive conditions (R versus A, RM versus AM), as expected due to the presence of the dumbbell. When comparing conditions with and without SMR modulation (A versus AM, R versus RM), the difference was less pronounced. However, statistical analysis revealed a significant increase in muscle activation only for the A versus AM comparison, whereas the corresponding effect under resistive conditions (R versus RM) did not reach statistical significance, suggesting that the contribution of voluntary SMR modulation is mitigated by the external load. Statistical analyses (Table 2) confirmed that force differences were consistently significant for comparisons involving load (A versus R, AM versus RM) at subject level, whereas the remaining comparisons between SMR-related conditions showed a more heterogeneous pattern. Nonetheless, only participants S01 and S02 exhibited no statistically significant differences, pointing out an inter-subject variability in muscle activation.
At first glance, these findings could raise concerns that classification performance might be just driven, at least partially, by peripheral artifacts rather than by cortical correlates of SMR activity. To address this issue, we further examined participant S02, for whom no statistically significant differences in force were detected between A versus AM and R versus RM run types, while classification accuracies consistently exceeded 70%.
To investigate whether the classification performance observed for participant S02 could be associated with cortical SMR modulation despite the absence of significant EMG differences, an evaluation of event-related desynchronization/synchronization (ERD/ERS) patterns was executed [52]. This analysis was included as an illustrative case rather than a group-wide neurophysiological assessment. The analysis aimed at quantifying the differences between movement conditions, hypothesizing that SMR modulation can have a brain pattern behavior similar to motor preparation and motor imagery [53]. Specifically, EEG signals were run-wise band-pass filtered in the range (8 to 13 ) and time-locked to the movement onset, as identified through IMU data, in order to highlight possible desynchronization due to the SMR overlapped mental activity. The reference period for computing the relative power changes was set from 0.5 to 2.0 of each trial. Similarly, EEG signals were run-wise filtered in the range (16 to 30 ) and trials were time-locked to the movement offset, also identified using IMU data, to assess potential synchronization effects at the end of the movement.
where:
- is the average power over trials during task;
- is the average power over trials during the baseline reference period from 0.5 to 2.0 .
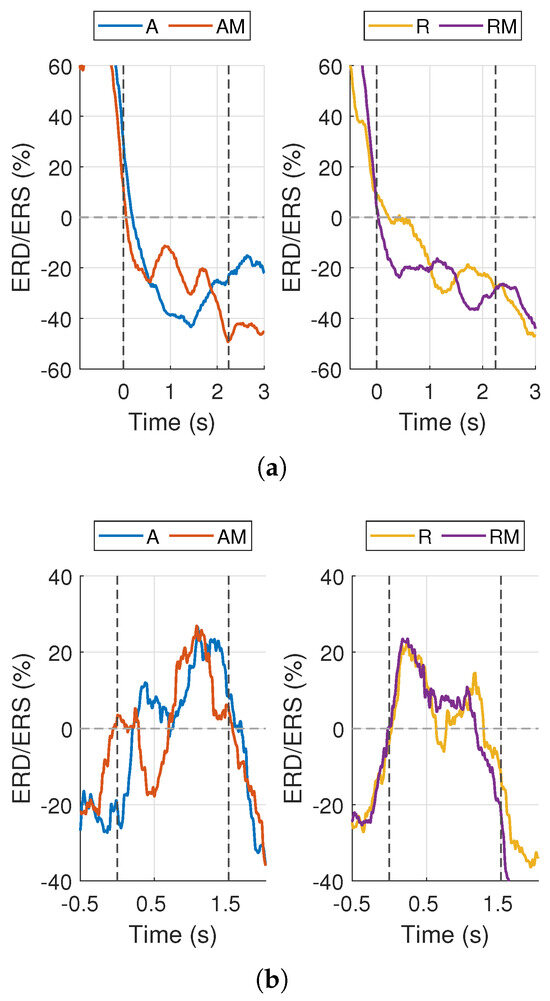
Figure 8 shows a clear ERD in the band at the onset of the movement, as well as a rebound ERS in the band at its termination. Comparable temporal dynamics are observed across all conditions. However, the AM and RM run types exhibit more pronounced negative peaks, particularly in the band and over channel C3. This pattern suggests a stronger desynchronization of SMR during voluntary SMR modulation, consistent with increased cortical engagement in these conditions [52]. These observations indicate that differences associated with voluntary SMR modulation can remain visible despite the ERD/ERS dynamics inherently induced by overt movement.
Figure 8.
Comparison of ERD/ERS dynamics between A vs. AM and R vs. RM for participant S02. Results are shown for channels C3, in the band on the left, in the band on the right. In the band, time zero marks movement onset (vertical dashed line) and the second vertical line marks the average movement offset time. In the band, zero corresponds to movement stop (vertical dashed line), and the second vertical line marks the average onset of the following trial. (a) band. (b) band.
Consequently, even in the absence of statistically significant EMG differences, the ERD/ERS analysis revealed clear modulations in the and bands, suggesting that SMR modulation can contribute to the observed classification performance, in addition to possible differences in muscular activation. However, this evidence should be regarded as qualitative and not as a group-level demonstration. ERD/ERS was indeed calculated for other subjects too, but related results are not relevant for the present discussion, rather for preliminary checking measured data. The interested reader could however derive those thanks to the shared experimental data.
The NASA-TLX results further support the neurophysiological findings by highlighting the distinct contributions of SMR modulation and external resistance to the perceived workload. Voluntary SMR modulation significantly increased perceived mental workload, confirming that simultaneously performing the motor task and regulating cortical activity requires additional cognitive resources. A similar trend was observed for the Effort scale, where the significant difference between the A and AM conditions indicates that participants perceived voluntary SMR modulation as requiring greater overall effort, even in the absence of external resistance. This finding suggests that the additional mental engagement associated with SMR regulation contributes to the overall perception of task effort. Conversely, the resistive conditions yielded the highest Physical ratings, consistent with the greater muscular activation observed in the EMG analysis. The lack of significant post-hoc differences after FDR correction suggests that the increase in perceived physical demand was distributed across conditions and may have been partially masked by the limited sample size. Finally, the absence of significant differences in Temporal, Performance, and Frustration indicates that neither SMR modulation nor the introduction of external resistance adversely affected participants’ perception of task duration, success, or frustration.
Although participants’ responses indicated a higher cognitive rather than physical workload during SMR modulation, force analyses revealed that increased cognitive engagement was associated with greater muscular activation. Future work should extend these analyses to a larger cohort and consider the use of a robotic manipulator to better standardize the execution conditions and minimize variability across participants. Nonetheless, statistically significant differences among experimental conditions could already be observed in the present study with the number of participants involved, implying that no further experiments were necessary for the purposes of the present proof-of-concept study. Meanwhile, the relatively limited number of trials per condition was chosen to mitigate the fatigue, which could have adversely affected the observations. In future evolutions of the system, the adopted machine learning model could also be replaced by trainingless deep learning approaches, but a loss of interpretability in the model’s decisions will have to be considered.
5. Conclusions
This study demonstrated the feasibility of detecting voluntary SMR modulation during the execution of upper-limb movements, both under active and resistive conditions, using EEG signals. The classification pipeline consistently achieved accuracies above chance level, confirming that SMR-related neural activity can be reliably distinguished even when overlapping with overt motor execution. Importantly, the results indicate that such detection is not merely driven by peripheral artifacts, but reflects genuine cortical correlates in the sensorimotor area, as further supported by ERD/ERS analyses.
These findings address a critical gap in the neurorehabilitation field, where most motor imagery-based BCI applications have been limited to initiating passive robot-driven movements. In contrast, the ability to dynamically discriminate SMR during ongoing execution opens the way for adaptive strategies in robotic rehabilitation. Specifically, the present findings provide an initial proof of feasibility for future investigations on EEG-driven adaptive robotic rehabilitation. Further studies involving online validation, integration with robotic devices, and evaluation in clinical populations are required before translating the proposed approach into real-world rehabilitation scenarios.
EMG analysis revealed that resistive conditions naturally elicited higher exerted force due to the presence of the dumbbell. Since EMG recordings were restricted to the biceps brachii, the activity of the triceps brachii was not investigated. While this may provide additional insights into the neuromuscular response during the elbow extension, the choice is motivated by future developments requiring a straightforward setup. Interestingly, voluntary SMR modulation was associated with increased muscular activation during the active condition, suggesting that this condition promoted force production. Under resistive conditions, however, this effect was no longer statistically detectable, likely because the muscular activation induced by the external load dominated the EMG response.
To investigate the contribution of peripheral activity to the observed classification performance, participant S02 was analyzed because no statistically significant differences in muscular activation were detected between the compared conditions. Nevertheless, the proposed pipeline still achieved classification performance above chance level, and the ERD/ERS analysis revealed clear cortical modulations in the and bands. This suggests that the pipeline can successfully detect voluntary SMR modulation even in the absence of measurable differences in muscular activation, although this evidence should be regarded as qualitative and not as a group-level demonstration.
Finally, subjective workload assessments revealed that voluntarily modulating SMR was perceived as cognitively more demanding, while resistive conditions increased physical effort. These findings emphasize the importance of jointly considering neural and muscular responses when designing SMR-based protocols.
In summary, this work confirms the potential of EEG-based classification to detect SMR-related activity and discriminate movement conditions associated with distinct levels of physical effort. Such capability is highly relevant for robotic rehabilitation, where the integration of neural and biomechanical information may support the development of more adaptive and personalized interventions.
Future work should extend this analysis to a larger cohort and employ robotic manipulators to better standardize experimental conditions. Robotic rehabilitation devices would indeed improve the subject-specific adaptation, as the same absolute load may correspond to different relative effort levels across participants. Other studies could, therefore, investigate individualized resistance levels, for instance based on each participant’s maximum voluntary contraction. Moreover, online testing of the proposed pipeline is needed to assess its effectiveness in real-world applications and to compare its performance against alternative approaches that may provide improved robustness in closed-loop rehabilitation scenarios.
Supplementary Materials
The following supporting information can be downloaded at: https://www.mdpi.com/article/10.3390/machines14080855/s1, Figure S1: Subject-level comparison of EMG envelope distributions across the experimental conditions. Panel (a) compares active and resistive movements without and with voluntary SMR modulation. Panel (b) compares movements performed without and with voluntary SMR modulation under active and resistive conditions.
Author Contributions
Conceptualization, F.G., M.O., A.E. and E.I.; methodology, F.G., M.O., A.E. and E.I.; software, F.G., M.O., A.E. and E.I.; validation, F.G., M.O. and A.E.; formal analysis, F.G.; investigation, F.G.; resources, M.O., E.I., P.A. and J.M.A.; data curation, F.G., M.O. and A.E.; writing—original draft preparation, F.G.; writing—review and editing, M.O., A.E., E.I., P.A. and J.M.A.; visualization, F.G.; supervision, M.O., A.E., E.I., P.A. and J.M.A.; project administration, M.O. and J.M.A.; funding acquisition, M.O., P.A. and J.M.A. All authors have read and agreed to the published version of the manuscript.
Funding
This work was financially supported by Italian Ministry for Universities and Research (MUR) through the project “AGE-IT—Ageing Well in an ageing society: A novel public-private alliance to generate socioeconomic, biomedical and technological solutions for an inclusive Italian ageing society (Spoke: Ageing and clinical practice)”, PNRR PE15, CUP E63C22002050006. This publication is part of grants PID2021-124111OB-C31 and PID2024-156759OB-C31, funded both by MICIU/AEI/10.13039/501100011033 and by ERDF, EU.
Data Availability Statement
The dataset generated and analyzed during the current study is publicly available on Mendeley Data at the following https://doi.org/10.17632/zmrbzpnggr.
Acknowledgments
The authors gratefully acknowledge Vicente Quiles for his contribution to the development of the code used for the synchronized data acquisition, as well as all the volunteers who participated in the experiments.
Conflicts of Interest
The authors declare that they have no known competing financial interests or personal relationships that could have appeared to influence the work reported in this paper. During the preparation of this work the authors used ChatGPT-5.6 (OpenAI, GPT-4) in order to improve the readability and language of the manuscript and for creating a human face used in Figure 3. After using this tool/service, the authors reviewed and edited the content as needed and take full responsibility for the content of the published article.
References
- Tacchino, G.; Gandolla, M.; Coelli, S.; Barbieri, R.; Pedrocchi, A.; Bianchi, A.M. EEG analysis during active and assisted repetitive movements: Evidence for differences in neural engagement. IEEE Trans. Neural Syst. Rehabil. Eng. 2016, 25, 761–771. [Google Scholar] [PubMed]
- Nielsen, J.B.; Willerslev-Olsen, M.; Christiansen, L.; Lundbye-Jensen, J.; Lorentzen, J. Science-based neurorehabilitation: Recommendations for neurorehabilitation from basic science. J. Mot. Behav. 2015, 47, 7–17. [Google Scholar] [CrossRef] [Scilit] [PubMed]
- Arya, K.N.; Pandian, S.; Verma, R.; Garg, R. Movement therapy induced neural reorganization and motor recovery in stroke: A review. J. Bodyw. Mov. Ther. 2011, 15, 528–537. [Google Scholar] [CrossRef] [Scilit] [PubMed]
- Veerbeek, J.M.; Langbroek-Amersfoort, A.C.; Van Wegen, E.E.; Meskers, C.G.; Kwakkel, G. Effects of robot-assisted therapy for the upper limb after stroke: A systematic review and meta-analysis. Neurorehabilit. Neural Repair 2017, 31, 107–121. [Google Scholar]
- Garcia, G.F.; Gonçalves, R.S.; Carbone, G. A review of wrist rehabilitation robots and highlights needed for new devices. Machines 2024, 12, 315. [Google Scholar] [CrossRef] [Scilit]
- Blank, A.A.; French, J.A.; Pehlivan, A.U.; O’Malley, M.K. Current trends in robot-assisted upper-limb stroke rehabilitation: Promoting patient engagement in therapy. Curr. Phys. Med. Rehabil. Rep. 2014, 2, 184–195. [Google Scholar] [CrossRef] [Scilit] [PubMed]
- Gandolfi, M.; Valè, N.; Dimitrova, E.K.; Mazzoleni, S.; Battini, E.; Benedetti, M.D.; Gajofatto, A.; Ferraro, F.; Castelli, M.; Camin, M.; et al. Effects of high-intensity robot-assisted hand training on upper limb recovery and muscle activity in individuals with multiple sclerosis: A randomized, controlled, single-blinded trial. Front. Neurol. 2018, 9, 905. [Google Scholar] [CrossRef] [Scilit] [PubMed]
- Jeon, S.Y.; Ki, M.; Shin, J.H. Resistive versus active assisted robotic training for the upper limb after a stroke: A randomized controlled study. Ann. Phys. Rehabil. Med. 2024, 67, 101789. [Google Scholar] [CrossRef] [Scilit] [PubMed]
- Daly, J.J.; Huggins, J.E. Brain-computer interface: Current and emerging rehabilitation applications. Arch. Phys. Med. Rehabil. 2015, 96, S1–S7. [Google Scholar] [CrossRef] [Scilit] [PubMed]
- Al-Quraishi, M.S.; Elamvazuthi, I.; Daud, S.A.; Parasuraman, S.; Borboni, A. EEG-based control for upper and lower limb exoskeletons and prostheses: A systematic review. Sensors 2018, 18, 3342. [Google Scholar] [CrossRef] [Scilit] [PubMed]
- Boukhennoufa, I.; Zhai, X.; Utti, V.; Jackson, J.; McDonald-Maier, K.D. Wearable sensors and machine learning in post-stroke rehabilitation assessment: A systematic review. Biomed. Signal Process. Control 2022, 71, 103197. [Google Scholar] [CrossRef] [Scilit]
- Gharabaghi, A. What turns assistive into restorative brain-machine interfaces? Front. Neurosci. 2016, 10, 456. [Google Scholar] [CrossRef] [Scilit] [PubMed]
- Bundy, D.T.; Souders, L.; Baranyai, K.; Leonard, L.; Schalk, G.; Coker, R.; Moran, D.W.; Huskey, T.; Leuthardt, E.C. Contralesional brain–computer interface control of a powered exoskeleton for motor recovery in chronic stroke survivors. Stroke 2017, 48, 1908–1915. [Google Scholar] [CrossRef] [Scilit] [PubMed]
- Cheng, L.; Li, D.; Yu, G.; Zhang, Z.; Yu, S. Robotic arm control system based on brain-muscle mixed signals. Biomed. Signal Process. Control 2022, 77, 103754. [Google Scholar] [CrossRef] [Scilit]
- Mahmoodi, M.; Makkiabadi, B.; Mahmoudi, M.; Sanei, S. A new method for accurate detection of movement intention from single channel EEG for online BCI. Comput. Methods Programs Biomed. Update 2021, 1, 100027. [Google Scholar] [CrossRef] [Scilit]
- Wang, F.; Wen, Y.; Bi, J.; Li, H.; Sun, J. A portable SSVEP-BCI system for rehabilitation exoskeleton in augmented reality environment. Biomed. Signal Process. Control 2023, 83, 104664. [Google Scholar] [CrossRef] [Scilit]
- Park, W.; Kwon, G.H.; Kim, D.H.; Kim, Y.H.; Kim, S.P.; Kim, L. Assessment of cognitive engagement in stroke patients from single-trial EEG during motor rehabilitation. IEEE Trans. Neural Syst. Rehabil. Eng. 2014, 23, 351–362. [Google Scholar] [CrossRef] [Scilit] [PubMed]
- Ghosh, S.; Yadav, R.K.; Soni, S.; Giri, S.; Muthukrishnan, S.P.; Kumar, L.; Bhasin, S.; Roy, S. Decoding the brain-machine interaction for upper limb assistive technologies: Advances and challenges. Front. Hum. Neurosci. 2025, 19, 1532783. [Google Scholar] [CrossRef] [Scilit] [PubMed]
- Sumner, J.; Lim, H.W.; Chong, L.S.; Bundele, A.; Mukhopadhyay, A.; Kayambu, G. Artificial intelligence in physical rehabilitation: A systematic review. Artif. Intell. Med. 2023, 146, 102693. [Google Scholar] [CrossRef] [Scilit] [PubMed]
- Mohseni, M.; Shalchyan, V.; Jochumsen, M.; Niazi, I.K. Upper limb complex movements decoding from pre-movement EEG signals using wavelet common spatial patterns. Comput. Methods Programs Biomed. 2020, 183, 105076. [Google Scholar] [CrossRef] [Scilit] [PubMed]
- Pérez-Velasco, S.; Marcos-Martínez, D.; Santamaría-Vázquez, E.; Martínez-Cagigal, V.; Hornero, R. Bridging motor execution and motor imagery BCI paradigms: An inter-task transfer learning approach. Biomed. Signal Process. Control 2025, 107, 107834. [Google Scholar] [CrossRef] [Scilit]
- Soriano-Segura, P.; Ortiz, M.; Iáñez, E.; Azorín, J.M. Design of a brain-machine interface for reducing false activations of a lower-limb exoskeleton based on error related potential. Comput. Methods Programs Biomed. 2024, 255, 108332. [Google Scholar] [CrossRef] [Scilit] [PubMed]
- Dodakian, L.; Stewart, J.C.; Cramer, S.C. Motor imagery during movement activates the brain more than movement alone after stroke: A pilot study. J. Rehabil. Med. 2014, 46, 843. [Google Scholar] [CrossRef] [Scilit] [PubMed]
- Lu, E.C.; Wang, R.H.; Hebert, D.; Boger, J.; Galea, M.P.; Mihailidis, A. The development of an upper limb stroke rehabilitation robot: Identification of clinical practices and design requirements through a survey of therapists. Disabil. Rehabil. Assist. Technol. 2011, 6, 420–431. [Google Scholar] [PubMed]
- van Dellen, F.; Aurich-Schuler, T.; Labruyère, R. Within-and between-therapist agreement on personalized parameters for robot-assisted gait therapy: The challenge of adjusting robotic assistance. J. Neuroeng. Rehabil. 2023, 20, 81. [Google Scholar] [CrossRef] [Scilit] [PubMed]
- Pitzalis, R.F.; Park, D.; Caldwell, D.G.; Berselli, G.; Ortiz, J. State of the art in wearable wrist exoskeletons part ii: A review of commercial and research devices. Machines 2023, 12, 21. [Google Scholar] [CrossRef] [Scilit]
- Batista, P.G.; Vieira, A.C.; Gaspar, P.D. Robotic Prostheses and Neuromuscular Interfaces: A Review of Design and Technological Trends. Machines 2025, 13, 804. [Google Scholar] [CrossRef] [Scilit]
- Khademi, Z.; Ebrahimi, F.; Kordy, H.M. A review of critical challenges in MI-BCI: From conventional to deep learning methods. J. Neurosci. Methods 2023, 383, 109736. [Google Scholar] [CrossRef] [Scilit] [PubMed]
- Guerrero-Mendez, C.D.; Blanco-Diaz, C.F.; Rivera-Flor, H.; Badue, C.; De Souza, A.F.; Delisle-Rodriguez, D.; Bastos-Filho, T.F. Enhancing complex upper-limb motor imagery discrimination through an incremental training strategy. Biomed. Signal Process. Control 2025, 99, 106837. [Google Scholar] [CrossRef] [Scilit]
- Vavoulis, A.; Figueiredo, P.; Vourvopoulos, A. A review of online classification performance in motor imagery-based brain–computer interfaces for stroke neurorehabilitation. Signals 2023, 4, 73–86. [Google Scholar] [CrossRef] [Scilit]
- Sun, Z.; Mu, A.; Qian, Y.; Sun, X. Bridging minds and limbs: Novel hybrid deep learning approach for low-cost EEG-based lower limb motor imagery classification. Biomed. Signal Process. Control 2026, 112, 108528. [Google Scholar] [CrossRef] [Scilit]
- Scherer, R.; Faller, J.; Friedrich, E.V.; Opisso, E.; Costa, U.; Kübler, A.; Müller-Putz, G.R. Individually adapted imagery improves brain-computer interface performance in end-users with disability. PLoS ONE 2015, 10, e0123727. [Google Scholar] [CrossRef] [Scilit] [PubMed]
- Hart, S.G.; Staveland, L.E. Development of NASA-TLX (Task Load Index): Results of empirical and theoretical research. In Advances in Psychology; Elsevier: Amsterdam, The Netherlands, 1988; Volume 52, pp. 139–183. [Google Scholar]
- Brain Products GmbH. LiveAmp [Hardware/Software]. 2025. Available online: https://www.brainproducts.com/ (accessed on 26 September 2025).
- Li, B.; Xu, G.; Pei, J.; Luo, D.; Li, H.; Du, C.; Zhang, K.; Zhang, S. Lower limb motion recognition based on surface electromyography decoding using S-transform energy concentration. Machines 2025, 13, 346. [Google Scholar] [CrossRef] [Scilit]
- Bioelettronica, O. Sessantaquattro+. 2024. Available online: https://otbioelettronica.it/en/sessantaquattro/ (accessed on 26 September 2025).
- WIT Motion. WT901BLECL BLE 9-Axis High-Precision Attitude Sensor IMU. 2025. Available online: https://www.wit-motion.com/WirelessInclinometer/52.html (accessed on 9 July 2025).
- Kilicarslan, A.; Grossman, R.G.; Contreras-Vidal, J.L. A robust adaptive denoising framework for real-time artifact removal in scalp EEG measurements. J. Neural Eng. 2016, 13, 026013. [Google Scholar] [CrossRef] [Scilit] [PubMed]
- Gracia, D.I.; Polo-Hortigüela, C.; Bayón-Calatayud, M.; Iáñez, E.; Ortiz, M.; Azorín, J.M. A Case Study for Removing Cardiac Artifacts from Non-Invasive Electrospinography Signals. In Proceedings of the 2024 IEEE International Conference on Metrology for eXtended Reality, Artificial Intelligence and Neural Engineering (MetroXRAINE), St Albans, UK, 21–23 October 2024; IEEE: New York, NY, USA, 2024; pp. 1147–1152. [Google Scholar]
- Ang, K.K.; Chin, Z.Y.; Wang, C.; Guan, C.; Zhang, H. Filter bank common spatial pattern algorithm on BCI competition IV datasets 2a and 2b. Front. Neurosci. 2012, 6, 39. [Google Scholar] [CrossRef] [Scilit] [PubMed]
- Pohjalainen, J.; Räsänen, O.; Kadioglu, S. Feature selection methods and their combinations in high-dimensional classification of speaker likability, intelligibility and personality traits. Comput. Speech Lang. 2015, 29, 145–171. [Google Scholar] [CrossRef] [Scilit]
- Korik, A.; McCreadie, K.; McShane, N.; Du Bois, N.; Khodadadzadeh, M.; Stow, J.; McElligott, J.; Carroll, Á.; Coyle, D. Competing at the Cybathlon championship for people with disabilities: Long-term motor imagery brain–computer interface training of a cybathlete who has tetraplegia. J. Neuroeng. Rehabil. 2022, 19, 95. [Google Scholar] [CrossRef] [Scilit] [PubMed]
- Arpaia, P.; Esposito, A.; Galasso, E.; Galdieri, F.; Natalizio, A. A wearable brain-computer interface to play an endless runner game by self-paced motor imagery. J. Neural Eng. 2025, 22, 026032. [Google Scholar] [CrossRef] [Scilit]
- Maxwell, A.E.; Warner, T.A.; Fang, F. Implementation of machine-learning classification in remote sensing: An applied review. Int. J. Remote Sens. 2018, 39, 2784–2817. [Google Scholar] [CrossRef] [Scilit]
- Müller-Putz, G.; Scherer, R.; Brunner, C.; Leeb, R.; Pfurtscheller, G. Better than random: A closer look on BCI results. Int. J. Bioelectromagn. 2008, 10, 52–55. [Google Scholar] [CrossRef] [Scilit]
- Tanaka, M.; Shigihara, Y.; Ishii, A.; Funakura, M.; Kanai, E.; Watanabe, Y. Effect of mental fatigue on the central nervous system: An electroencephalography study. Behav. Brain Funct. 2012, 8, 48. [Google Scholar] [CrossRef] [Scilit] [PubMed]
- De Luca, C.J. Myoelectrical manifestations of localized muscular fatigue in humans. Crit. Rev. Biomed. Eng. 1984, 11, 251–279. [Google Scholar] [PubMed]
- Hambly, M.J.; de Sousa, A.C.C.; Pizzolato, C. Comparison of filtering methods for real-time extraction of the volitional EMG component in electrically stimulated muscles. Biomed. Signal Process. Control 2024, 87, 105471. [Google Scholar] [CrossRef] [Scilit]
- Halaki, M.; Ginn, K. Normalization of EMG signals: To normalize or. In Computational Intelligence in Electromyography Analysis: A Perspective on Current Applications and Future Challenges; InTech: Loudon, UK, 2012; p. 175. [Google Scholar]
- Jeunet, C.; N’Kaoua, B.; Subramanian, S.; Hachet, M.; Lotte, F. Predicting mental imagery-based BCI performance from personality, cognitive profile and neurophysiological patterns. PLoS ONE 2015, 10, e0143962. [Google Scholar] [CrossRef] [Scilit] [PubMed]
- Arpaia, P.; Coyle, D.; Donnarumma, F.; Esposito, A.; Natalizio, A.; Parvis, M. Visual and haptic feedback in detecting motor imagery within a wearable brain–computer interface. Measurement 2023, 206, 112304. [Google Scholar] [CrossRef] [Scilit]
- Pfurtscheller, G.; Da Silva, F.L. Event-related EEG/MEG synchronization and desynchronization: Basic principles. Clin. Neurophysiol. 1999, 110, 1842–1857. [Google Scholar] [CrossRef] [Scilit] [PubMed]
- Jeon, Y.; Nam, C.S.; Kim, Y.J.; Whang, M.C. Event-related (De) synchronization (ERD/ERS) during motor imagery tasks: Implications for brain–computer interfaces. Int. J. Ind. Ergon. 2011, 41, 428–436. [Google Scholar] [CrossRef] [Scilit]

Disclaimer/Publisher’s Note: The statements, opinions and data contained in all publications are solely those of the individual author(s) and contributor(s) and not of MDPI and/or the editor(s). MDPI and/or the editor(s) disclaim responsibility for any injury to people or property resulting from any ideas, methods, instructions or products referred to in the content. |
© 2026 by the authors. Licensee MDPI, Basel, Switzerland. This article is an open access article distributed under the terms and conditions of the Creative Commons Attribution (CC BY) license.