


Abstract
The helicopter tail drive shaft is vulnerable to failure from projectile impacts during low-altitude flight. Stress wave-based inversion of impact parameters and quantitative damage assessment remain insufficiently explored. To address small-sample and nonlinear challenges, a framework based on stress wave characteristics and physics-guided hierarchical Gaussian process regression is proposed. Four key features, namely first-arrival wave trough amplitude, frequency standard deviation, ratio of low-frequency to high-frequency root mean square, and wavelet energy entropy, are extracted from transient signals to construct a hierarchical progressive architecture for damage mode discrimination, parameter inversion, and quantitative assessment. Perforation is identified using a wavelet energy entropy-based adaptive threshold. Incidence angle inversion is achieved by an adaptive composite kernel and Bayesian physical prior correction. Damage degree is assessed through residual learning guided by a physical prior surface mean function. Results show an incidence angle inversion root mean square error (RMSE) of 3.02°, with entry and exit hole equivalent failure area RMSEs of 13.32 mm2 and 12.98 mm2, respectively. The 95% prediction interval maintained reliable coverage across the validation samples. This framework provides a new method with both physical interpretability and uncertainty quantification for the assessment of impact damage in thin-walled tube structures.
1. Introduction
The tail drive shaft is the core component of the helicopter tail drive system. Its slender, thin-walled tubular structure and the absence of ballistic armor make it vulnerable to projectile impact from small arms during low-altitude flights. The penetration damage of the projectile will cause local stress concentration, which will lead to catastrophic consequences because of damage expansion [1,2]. Relevant standards require the tail drive shaft to operate for 30 min after being penetrated by a high-speed projectile, ensuring the helicopter can return safely or support mission decisions. This is an important requirement for battlefield survivability after a single projectile penetration [3,4]. Therefore, it is necessary to develop reliable monitoring and assessment methods covering damage mode discrimination, impact parameter inversion, and damage degree quantification.
Stress wave-based methods are used for structural health monitoring of thin-walled structures because they offer damage sensitivity and a long detection range [5]. Upon projectile impact on a structure, the stress wave signal carries information about both impact source position and local damage [6,7]. Lead zirconate titanate (PZT) piezoelectric sensors exhibit a broad frequency response and can be easily mounted on surfaces. They are used to acquire such impact stress wave signals [8,9]. These stress waves exhibit dispersion during propagation, with different frequency components propagating at different group velocities, resulting in a nonstationary response signal [10]. When stress waves encounter a boundary or a perforation damage, they are reflected and scattered, resulting in the signal received by the sensor containing a wealth of frequency information [11]. Perforation damage causes the high-frequency components of the stress wave to increase and its spectral width to broaden. Furthermore, there is a certain change law between the time-frequency characteristics of the stress wave signal and the impact parameters and the damage degree [12]. In contrast, non-penetrating impact damage that causes only dents primarily results in local changes in structural stiffness [13], without generating obvious high-frequency components. These physical mechanisms provide a theoretical basis for quantitative damage assessment based on the characteristics of impact stress waves.
The physical mechanisms described above provide a basis for impact parameter inversion and damage assessment. Their practical application is still limited by several factors. High-speed projectile impact experiments on thin-walled structures are costly and often unsuccessful. As a result, data on different damage conditions for model training are available [14,15]. Stress wave propagation in thin-walled tubes involves dispersion, multimodal coupling, and boundary reflections. A nonlinear relationship is therefore created between signal features and damage parameters. From signal acquisition to damage assessment, measurement errors and model uncertainties are propagated and amplified at each step. The confidence level required for engineering decisions cannot be provided by traditional methods [16]. Existing studies fall into two categories: physical modeling and data-driven approaches. The explicit dynamic finite element method has a clear physical basis. Yet high-speed impact simulation needs more time and is not suitable for real-time assessment [17]. Data-driven methods often use end-to-end neural networks. By directly relating sensor signal features to damage states, they avoid the complexity of inverse problem solving. Yet such models require large amounts of training data to prevent overfitting. Only point estimates are provided by a lot of traditional end-to-end models. Uncertainty cannot be measured, and their internal mechanisms are not transparent. These limitations restrict their use in small samples [18,19]. To address these limitations, recent studies have introduced wave propagation mechanisms or structural degradation laws as constraints into machine learning frameworks, which can improve the reliability of complex structure assessment and condition prediction under different working conditions [20,21,22,23]. For impact damage detection in thin-walled tubular structures such as tail drive shafts, vibration signal analysis is mainly adopted by existing studies. Damage events were identified by Zhang et al. [24] through analysis of axial trajectory changes based on impact-induced vibration signals. Panagiotopoulou et al. [25] distinguished between healthy and damaged states by using the estimated error of vibration acceleration signals before and after an impact, combined with a nonlinear autoregressive model. Qualitative identification of impact events is effectively achieved by these methods. Nevertheless, vibration signals mainly reflect the overall dynamic behavior of a structure. Their wavelength is usually larger than local damage such as bullet holes. The effective scattering and reflection cannot be excited at damage boundaries [5]. Most existing studies focus only on determining whether damage exists. In contrast, high-frequency stress waves generated by impact have shorter wavelengths. A stronger interaction with local damage regions is exhibited [26]. Gaussian process regression (GPR) has been applied in the damage detection of active excitation stress waves with small samples by virtue of its uncertainty quantification ability [27]. This purely data-driven model suffers from insufficient generalization. Physical-information Gaussian process regression by introducing prior knowledge can be used to solve small-sample, nonlinear inverse problems [28,29]. For example, Jones et al. [30] transformed geometric boundary conditions into covariance priors. Li et al. [31] incorporated the evolution laws of tool wear as constraints into the model. These strategies improved both physical consistency and prediction accuracy. For thin-walled tubular structures such as high-speed projectile impact tail drive shafts, accurate inversion of impact parameters and quantitative damage assessment remain difficult to achieve. Currently, there is no established framework based on stress wave characteristics and physics-guided hierarchical Gaussian process regression for comprehensively discriminating damage modes, inverting impact parameters, and quantitatively assessing damage degree.
To address these issues, a framework based on stress wave characteristics and physics-guided hierarchical Gaussian process regression is proposed in this paper. This framework extracts and statistically analyzes multidimensional features from the time-frequency domain and signal entropy, establishes a physical mapping among impact parameters, stress wave characteristics, and damage degree, and constructs a progressive architecture from mode discrimination and parameter inversion to quantitative assessment. Kernel ablation and multi-method comparison experiments are conducted to validate the proposed framework. The main contributions are as follows.
(1) Extraction of key stress wave features and construction of physical prior. Four physically meaningful features are extracted, including wavelet energy entropy, first-arrival wave trough amplitude, frequency standard deviation, and ratio of low-frequency to high-frequency root mean square values. Through two-dimensional rational function fitting, a nonlinear mapping surface is established between impact parameters, stress wave characteristics, and damage degree. This surface provides quantifiable physical prior knowledge for subsequent assessments.
(2) Adaptive composite kernel mechanism. To address the global smoothing trend and local fluctuations in stress wave signals, an adaptive composite kernel combining ARD-RBF and ARD-Matern(3/2) weighting is constructed. This mechanism ensures coverage of the prediction interval and improves the accuracy of parameter inversion and damage assessment.
(3) Physics-guided hierarchical assessment framework. The assessment process uses impact parameters as intermediate variables and is divided into three levels. The wavelet energy entropy adaptive thresholding is used to discriminate damage modes. Parameter inversion is performed by integrating composite kernels with physical prior Bayesian post-processing correction. Finally, a prior surface is used as a mean function to guide residual learning and achieve damage assessment. This architecture makes up for the lack of physical interpretation of traditional end-to-end models.
The remainder of this study is outlined as follows: Section 2 and Section 3 introduce the physical basis of the hierarchical progressive evaluation framework and the extraction of stress wave characteristics, respectively. The model construction and implementation of the proposed framework are described in Section 4. Section 5 validates its effectiveness through comparative experiments. Section 6 presents the conclusions.
2. Physical Understanding of Impacts and a Hierarchical Progressive Assessment Framework
High-speed projectile impact on a thin-walled tube is a complex physical process involving transient dynamics, stress wave propagation, and plastic deformation. Different impact parameters lead to different energy conversion paths. Part of the energy excites structural vibrations and generates outward-propagating stress waves. The remainder is dissipated through local elastoplastic deformation and crack propagation, leading to perforation damage [32]. The extracted stress wave characteristics and the final damage degree are parallel responses from the same physical source, i.e., the impact parameter. Directly mapping signal features to damage degree ignores the causal link in between, which makes the model uninterpretable. Based on this, this study introduces impact parameters as intermediate variables and constructs a hierarchical progressive assessment framework in Figure 1. This framework follows the causal sequence of the impact process and decomposes the end-to-end mapping into a physically meaningful hierarchical structure. Damage mode discrimination uses the broadband energy distribution of the impact stress wave to separate perforation from non-perforation. For perforation, the penetration involves material tearing and new hole boundary formation. This causes local scattering of the stress wave, spreads the signal energy over a wide frequency band, and raises the high-frequency components. Conversely, for non-perforation conditions, the overall structure remains continuous. The impact primarily induces macroscopic deformation and global vibration, concentrating the energy in the low-frequency range. Non-perforation damage triggers an immediate warning and terminates the process. In contrast, perforation damage proceeds to the inversion layer and quantitative damage assessment. In the impact parameter inversion layer, stress wave characteristics that follow physical laws are extracted and combined with impact localization information as input. The incidence angle is inverted under the prior constraint of physical forward evolution laws. In the damage degree assessment layer, the inverted impact parameters and localization information are used as inputs. Physical boundary constraints based on structural plastic deformation mechanisms are introduced to achieve quantitative assessment of the damage degree. The framework follows the physical causality in the process of impact damage assessment. The key feature extraction and quantitative assessment methods are detailed in Section 3 and Section 4.
Figure 1.
Schematic diagram of the hierarchical progressive assessment framework.
3. Acquisition and Feature Analysis of Impact-Induced Stress Waves
3.1. Acquisition of Impact-Induced Stress Wave Data and Quantification of Damage Geometry
To construct a dataset for extracting prior physical laws, as well as for training and validating a hierarchical progressive assessment framework, discrete data for typical impact conditions are generated using a controlled-variable approach in both simulated and experimental environments. The specific impact parameters, including the incidence angle and offset, are detailed in Section 3.1.1. An equivalent failure area (Sef) is used to quantitatively assess the damage degree. For the geometric morphology of perforation damage, this study proposes a comprehensive envelope principle. This involves establishing an equivalent envelope model for the bullet hole damage region that includes edge defects. Figure 2 illustrates that this envelope encompasses the central perforation, edge plastic curling, and extended cracks. Since plastic deformation and cracks easily induce local stress concentrations, this study includes them within the envelope to ensure a conservative assessment of structural safety. This principle is consistent in the feature extraction of simulation and experiment. Although previous studies have validated morphological simplification methods based on inscribed circles or ellipses [33], such methods carry the risk of underestimating actual damage. Thus, this study adopts different geometric simplification strategies based on the equivalent envelope model for various impact conditions. The equivalent failure area is calculated using the axial dimension (la) and circumferential dimension (lc) of the bullet hole, as labeled in Figure 2. For a normal impact without radial offset, the load is nearly axisymmetric. A circular model is adopted for the damage region. The equivalent radius R is set to the arithmetic mean of la/2 and lc/2 to reduce edge-tearing deviations. The equivalent failure area is Sef = , as illustrated by the envelope circle in Figure 2a,b. Under oblique impact or radial offset, local asymmetric contact induced by the oblique incidence of the projectile or the curvature of the tube results in an elliptical damage region. The equivalent failure area is determined using the area of the envelope ellipse, namely Sef = πab. Among these, a and b represent the major and minor semi-axes, respectively. For an oblique impact without a radial offset shown in Figure 2c, the major axis aligns with the axial direction, obtaining a = la/2 and b = lc/2. Furthermore, for an impact with a radial offset shown in Figure 2d, the damage ellipse is deflected laterally with the major axis aligning with the circumferential direction, resulting in a = lc/2 and b = la/2. A comparison of Figure 2a,b shows that under identical impact conditions, the exit hole damage is more severe than the entry hole damage. This is mainly because of the outward petal-shaped flanging formed when the projectile exits. For non-perforation damage modes, due to the structural material remaining continuous overall and without penetrating bullet holes, this paper does not quantify the equivalent failure area. It only performs rapid damage mode discrimination based on stress wave characteristics.
Figure 2.
Definition of equivalent failure models for perforation damage based on typical simulation morphologies: (a) entry hole and equivalent envelope circle under normal impact without radial offset; (b) exit hole and equivalent envelope circle under normal impact without radial offset; (c) entry hole and equivalent envelope ellipse under oblique impact without radial offset; (d) entry hole and equivalent envelope ellipse under radial offset.
3.1.1. Simulation Data Acquisition Method
A finite element model for high-speed impact analysis is established using the LS-DYNA explicit dynamics module. The horizontal shaft section of a helicopter tail drive shaft is taken as the study subject. This specimen is usually a 6061 thin-walled aluminum tube. Its outer diameter is 100 mm, wall thickness 2 mm, and length 1100 mm. The impactor is a 14.5 mm caliber projectile, with launch velocities ranging from 400 to 520 m/s. To efficiently obtain transient stress wave propagation and prevent end-face reflections, non-reflective boundary conditions together with fixed constraints are applied to both ends of the target tube. The target tube material is described using the Johnson-Cook constitutive and failure criteria, combined with the Grueneisen state equation. At the speeds considered in this study, the projectile is simplified as a rigid body [24,34]. Since the tangential velocity increment caused by shaft rotation is negligible compared to the high-speed projectile impact, the simulation model neglects rotational effects [2,24]. Previous studies have validated the reliability of the finite element model, with mesh and erosion contact parameters detailed in reference [12]. Figure 3 shows the finite element model of the projectile impacting the thin-walled tail shaft and its parameter definitions. The global rectangular coordinate system XYZ is established, and the projectile is incident horizontally along the X axis. By adjusting the relative position and orientation of the tail shaft and the projectile, different impact angles and offsets are simulated. Figure 3a illustrates that the impact angle () is the angle between the projectile axis and the normal to the tail shaft axis. At vertical orientation of the tail shaft, the normal line is horizontal, defining = 0° as a normal impact. During tail shaft tilt, > 0° represents an oblique impact. The axial offset (z) is the distance from the impact contact point along the tail shaft axis away from its central normal. The radial offset (r) is the horizontal distance along the Y-axis between the projectile’s central axis and the longitudinal symmetry plane of the tail shaft in Figure 3b. Key nodes SP1–SP7 are arranged along the axial and circumferential directions of the tail shaft to extract stress wave signals. Based on this model, 63 valid numerical simulation samples are obtained within incidence angles from 0° to 60° and radial offsets from 0 to 55.45 mm. These samples are classified into two categories by the damage patterns formed after projectile impact. Among them, 12 samples exhibiting indentation are classified as non-perforation data samples and used for threshold calibration of the damage mode discrimination layer. The remaining 51 samples represent typical perforation conditions with clear entry and exit holes, serving for subsequent parameter inversion and damage assessment. For quantitative evaluation, to ensure the stability of the physical prior surface fitting, 40 representative benchmark working conditions are selected to fit macroscopic physical trends. The remaining samples containing axial offsets and velocity variations are combined to collectively train the physics-guided Gaussian process regression model and learn the residual distribution.
Figure 3.
Simulation model and parameter definitions for projectile impact on the thin-walled tail drive shaft: (a) projected view on the X–Z plane; (b) projected view on the Y–Z plane.
3.1.2. Experimental Data Acquisition Method
Passive monitoring experiments based on PZT piezoelectric sensors are performed on a high-speed projectile impact loading platform to validate the proposed framework. The overall configuration of the experimental system and the principles of sensor acquisition are detailed in our previous study [35]. In the high-speed projectile impact test setup in Figure 4, both the thin-walled 6061 aluminum alloy tube and the 14.5 mm caliber projectile used are consistent with the simulation model. Impact velocity is set between 400 and 520 m/s. On the tube wall, PZT piezoelectric sensors are attached at positions the same as in the simulation. The data acquisition system sets a 20 MHz sampling rate. The tail shaft is installed in the target chamber and aligned. The desired impact angle and offset are set using the angle limit holes on the target mount. The projectile, sealing ring, notched diaphragm, and cylindrical piston are loaded into the second-stage pump tube in sequence. The pump tube is sealed and evacuated to reduce aerodynamic drag. Before launch, the projectile launch pressure is adjusted by the pressurization control system and the gas supply system. Low-pressure nitrogen gas at a pressure of no less than 0.1 MPa is injected into the first-stage pump tube. Next, high-pressure gas is injected into the high-pressure chamber, maintaining a pressure ratio of approximately 1:100 between the two. The pressure in the high-pressure chamber is set according to the required impact velocity. The high-pressure gas propels the cylindrical piston to rupture the notched diaphragm, ejecting the projectile from the second-stage pump tube at high speed. As the projectile passes through the 40 mm gap between the fixed magnetic rings, the dual-magnetic-ring velocity measurement system at the end of the second-stage pump tube records the time difference and triggers data acquisition. The actual impact velocity is calculated based on this time difference. After the projectile has completely penetrated the target tube, the data acquisition system completes the recording of the stress wave signal. A total of 13 validation data samples are obtained from this experiment, covering 11 typical perforations and 2 non-perforation surface dents. Based on the proposed hierarchical framework, the perforation samples are used as the test set to verify the accuracy of impact parameter inversion and damage assessment. The non-perforation samples are used to independently validate the damage mode discrimination thresholds.
Figure 4.
Experimental setup and perforation damage under high-speed projectile impact.
To visually illustrate the characteristics of impact-induced stress wave signals and the morphology of the impact holes, the simulated and experimental results for a typical perforation condition involving a normal impact with no radial offset are compared in Figure 5. This condition uses the same impact parameters and stress wave extraction positions, and amplitude normalization has been applied to both signal sets to facilitate waveform comparison. As shown in Figure 5, the stress wave signal exhibits transient features, and the first-arrival wave trough is clearly visible. The simulation and experimental results show good agreement in terms of the morphology of the entry and exit holes, as well as the first-arrival wave trough times and overall waveform shape. Some differences exist in local amplitude and high-frequency details, mainly due to boundary reflections and fluctuations in the sensor response sensitivity across different frequency bands.
Figure 5.
Time-domain signals of stress waves and bullet hole morphologies under typical perforation conditions: (a) simulated signal; (b) experimental signal; (c) simulated entry hole morphology; (d) experimental entry hole morphology; (e) simulated exit hole morphology; (f) experimental exit hole morphology.
3.2. Feature Analysis of Stress Waves and Extraction of Physical Mapping
This section calculates 39 potential features from multiple domains, including the time domain, frequency domain, and entropy. Key features that exhibit a mapping relationship with impact parameters and damage variables are selected through an evaluation of their physical sensitivity and correlation with impact parameters.
3.2.1. Wavelet Energy Entropy Feature for Damage Mode Discrimination
As discussed in Section 2, perforation damage generates high-frequency energy across a wide frequency band, whereas non-perforation damage concentrates its energy at low frequencies. Based on this physical difference, this section introduces wavelet energy entropy as the main discrimination feature. Through the comparison of different frequency bands, low-pass filtering from 0 to 400 kHz is applied to preserve the key frequency differences between the perforation and non-perforation signals while suppressing high-frequency noise and sensor resonance interference.
A wavelet decomposition with J = 5 levels is performed on the filtered signal x(t) to obtain the detail coefficients and the approximation coefficients of the Jth level. In this formulation, j = 1, 2, …, J, k represents the time shift index, and the length of the decomposition coefficients at the jth level is defined. The wavelet energy at each scale is calculated as follows:
The sum of the approximation energy and detail energy is the total signal energy:
The probability distribution of the energy in each frequency band relative to the total energy is denoted by . The wavelet energy entropy is then calculated as follows:
where Hwe is defined as a dimensionless index [36]. A higher entropy value indicates increased complexity in the frequency components of the impact-induced signal. Due to the broadband and nonstationary characteristics of the impact stress waves, the db4 wavelet is selected. This wavelet basis has compact support and a fourth-order vanishing moment. It captures transient wavefronts and reduces spectral leakage.
3.2.2. Extraction of Physically Interpretable Features for Parameter Inversion
Unlike the previous qualitative discrimination of damage modes, quantitative inversion requires the retention of comprehensive high-frequency information to reflect the continuous variation in the impact parameters. For this purpose, an 850 kHz low-pass filter is applied to filter the raw signal. This frequency band covers the effective response range of the PZT piezoelectric sensor. It preserves the high-frequency components related to the impact parameters and suppresses ultra-high-frequency noise. To reduce latency and system responses between the experiments and simulations, these three key features are individually calibrated. The calibration is performed using least-squares linear regression based on a limited number of paired simulation and experimental conditions. The experimental features are mapped to the simulation space and uniformly standardized using Z-scores. The calibrated experimental and simulation features reside in the same feature distribution space. This is the foundation for the direct application of Gaussian process regression models trained on simulation data to experimental data validation. The three extracted key features are defined below.
The first-arrival wave trough amplitude (A) is expressed in volts during the experiments and in pascals in the simulations. This feature typically reflects the magnitude of the initial impact energy under different impact parameters. To reduce aliasing interference from subsequent boundary reflections, A is defined as the minimum within the first dominant wave packet after the wave reaches the sensor.
The frequency standard deviation quantifies the energy dispersion of stress waves in the frequency domain. Under different impact parameters, the high-frequency components generated by perforation damage vary, widening the spectral bandwidth. By estimating the discrete one-sided power spectral density () with the periodogram method using a Hanning window, the frequency standard deviation is calculated as follows [37]:
where is the frequency value at the ith discrete frequency point, K is the total number of valid spectral lines, and is the center of gravity frequency of the signal:
The ratio of low-frequency to high-frequency root mean square values is a dimensionless index reflecting the energy contributions of the low-frequency and high-frequency components. The high-frequency components of the stress waves vary across different impact parameters. This variation typically causes this ratio to change accordingly. Because traditional absolute energy or energy ratio features involve squaring operations, high-frequency noise and local fluctuations within the experimental data are often amplified. This amplification typically leads to discrepancies between the feature distributions in the simulations and experiments. The index typically compensates for amplitude errors caused by sensor gain. It is not sensitive to high-frequency local fluctuations and reflects the energy trends of perforation damage well under different impact parameters. Following a five-level db4 wavelet decomposition, the superimposed signal is reconstructed by combining the low-frequency approximation component from the fifth level with the high-frequency detail components from levels one through five. The ratio of the time-domain root mean square values () of these two components is as follows:
where and are defined as the time-domain root mean square values of the low-frequency and high-frequency reconstructed signals, respectively.
3.2.3. Construction of Physical Mapping Surfaces from Stress Wave Features
To further quantify the mapping relationship between the stress wave features and the impact parameters, a nonlinear least-squares surface fitting using a two-dimensional rational function (Rational2D) is performed on the three key stress wave features. In this process, the impact parameters are adopted as independent variables based on the simulation data from typical perforation conditions. Figure 6 shows the prior mapping surfaces for the first-arrival wave trough amplitude, the frequency standard deviation, and the ratio of low-frequency to high-frequency root mean square values as they vary with the incidence angle and radial offset. As shown in Figure 6, all three stress wave features exhibit nonlinear relationships with impact parameters. Figure 6a shows the first-arrival wave trough amplitude surface with . This feature is highly sensitive to the incidence angle and radial offset. As the incidence angle and radial offset increase, the dispersion of impact energy and the lengthening of the propagation path lead to an overall decrease in amplitude. At small incidence angles or large offsets, certain local fluctuations appear in some feature points. This is due to the projectile’s impact point approaching the tube wall edge at large offsets, which alters the damage morphology and induces superimposed boundary reflections. These boundary factors cause more pronounced local fluctuations on the frequency standard deviation surface in Figure 6b, reducing its coefficient of determination to . High-angle impacts induce more high-frequency components, making this feature value increase with increasing incidence angle. As radial offset increases, the frequency standard deviation exhibits a non-monotonic trend of first increases and then decreases. Figure 6c shows the surface of the ratio of low-frequency to high-frequency root mean square values with . The proportion of high-frequency components increases at large incidence angles, leading to a decrease in this ratio. This ratio exhibits a trend of first decreasing and then increasing with increasing radial offset. At specific radial offsets, some feature points exhibit a certain degree of dispersion above and below the fitted surface. These nonlinear physical mapping relationships will serve as prior knowledge for model input and Bayesian post-processing correction in the Gaussian process regression inversion framework described in Section 4.
Figure 6.
Physical prior mapping surfaces of key stress wave features: (a) first-arrival wave trough amplitude; (b) frequency standard deviation; (c) ratio of low-frequency to high-frequency root mean square values.
4. Framework Based on Stress Wave Characteristics and Physics-Guided Hierarchical Gaussian Process Regression
4.1. Overall Implementation Architecture
Combining the understanding of impact physics from Section 2 with the stress wave features extracted in Section 3, this paper proposes a hierarchical and progressive algorithm architecture, as shown in Figure 7. This architecture first preprocesses the impact stress wave signal to extract four features, namely the wavelet energy entropy, the first-arrival wave trough amplitude, the frequency standard deviation, and the ratio of low-frequency to high-frequency root mean square values. The impact location is obtained using the localization method from previous work [35]. This gives the radial offset r and the axial offset z. This location information and the stress wave feature are then input into the hierarchical assessment layers. In the damage mode discrimination layer, wavelet energy entropy serves as the primary discriminant feature, coupled with an adaptive threshold. The threshold is set by Youden’s index based on the midpoint method or the receiver operating characteristic (ROC) curve. Perforation is thus separated from non-perforation. For a perforation case, the process goes on to parameter inversion and damage assessment. Non-perforation ends the process. The inversion layer adopts four inputs. These are the first-arrival wave trough amplitude, the frequency standard deviation, the ratio of low-frequency to high-frequency root mean square values, and the impact location information. A physics-guided adaptive composite kernel GPR-θ model is used. A prior mapping surface from two-dimensional rational function fitting is introduced for Bayesian post-processing correction. This gives the inverted incidence angle. The damage assessment layer inputs the inverted incident angle and impact location information into two separate GPR models, GPR-entry and GPR-exit. This layer adopts prior surfaces of the equivalent failure areas at the entry and exit holes fitted by two-dimensional rational functions. These prior surfaces, established under different impact parameters, act as fixed mean functions to guide the residual learning. Physical boundary constraints are applied at the output end. They dictate that the equivalent failure area at the exit hole (Sexit) must be greater than the equivalent failure area at the entry hole (Sentry).
Figure 7.
Flowchart of the framework based on stress wave characteristics and physics-guided hierarchical GPR.
4.2. Fundamentals of Gaussian Process Regression
A Gaussian process (GP) represents a distribution over the function f(x). For any finite collection of inputs, the evaluated function values conform to a joint Gaussian distribution. GPR is formulated as follows [38]:
where x is defined as the input feature vector, such as . is the mean function, typically set to the zero function. is the covariance (or kernel) function, which measures the proximity of two input vectors in the feature space.
A training set is provided. Within this set, the variable is defined as a matrix consisting of n d-dimensional input vectors, where d is the input feature dimension. The variable serves as the corresponding observed output vector. The observation model is assumed to be , with the noise terms being mutually independent and obeys the normal distribution . The observed outputs follow the joint distribution:
where K is an n × n covariance matrix with elements , I is the identity matrix, is the variance of the observation noise.
For a new input , the predicted distribution follows a Gaussian distribution. Its mean is mean and its variance is :
where is the covariance vector between the new input and train samples. Non-zero mean functions require adjustment of the equations.
4.3. Design of Physics-Guided Adaptive Composite Kernel
The prior mapping surfaces from Section 3.2.3 and Section 4.6 show a distinct nonlinear relationship among impact parameters, stress wave characteristics, and damage degree. This relationship combines overall smooth trends with local nonstationary fluctuations. The overall energy dissipation of the stress wave is continuous, but material tearing and cracks formed during perforation introduce non-stationary disturbances locally. As shown in Figure 5 above, the stress wave signal shows sudden transient characteristics, and the time domain waveform has obvious non-stationary fluctuations. The fitted surfaces in Figure 6 further indicate that the surface representing the amplitude characteristics is smooth and shows good global consistency, while the fitted surfaces for the frequency standard deviation and the ratio of low-frequency to high-frequency root mean square values exhibit distinct local fluctuations. Both the transient changes in the time domain signal and the local fluctuations in the characteristic surfaces reflect this physical phenomenon. It is difficult for a single kernel function to simultaneously capture both characteristics. The RBF kernel is infinitely differentiable, which is suitable for fitting the global smoothing trend but is not sensitive to local fluctuations. The Matern(3/2) kernel is only first-order differentiable, which adapts well to these local fluctuations, but its fitting of the global smoothing trend is not as good as the RBF kernel [39]. A unified, physics-guided adaptive composite kernel function is proposed for the three independent Gaussian process regression models within the inversion and assessment layers. This composite kernel function describes the evolutionary patterns at different scales through a weighted combination. The composite kernel function is defined as follows:
where x and are defined as any two input vectors. The weight coefficients and , which sum to 1, are determined adaptively by data-driven Bayesian optimization.
An automatic relevance determination structure (ARD) [40] is adopted by both the ARD-RBF kernel and the ARD-Matern(3/2) kernel. Through this structure, an independent length scale is assigned to each feature dimension. The importance of each dimension is thereby automatically learned based on differences in physical sensitivity. The mathematical expression for the ARD-RBF kernel is as follows:
where and are the mth components of vectors x and , respectively. is the signal variance that adjusts the overall amplitude of the kernel function. is the length-scale denoting the sensitivity of the mth input feature to output changes.
The corresponding ARD-Matern(3/2) kernel function form:
where d is the input feature dimension, which is configured differently across the various models. Three key stress wave features extracted during signal preprocessing, alongside the radial and axial offsets from impact localization, are used as inputs for the GPR-θ model within the inversion layer. The inverted incidence angle and the localization offsets are taken as inputs by the GPR-entry and GPR-exit models within the assessment layer.
4.4. Damage Mode Discrimination Based on Adaptive Thresholds of Wavelet Energy Entropy
As described in Section 3.2.1, wavelet energy entropy can quantitatively reflect the differences in frequency-domain energy distribution between perforation and non-perforation damage. Based on this physical separability, an adaptive thresholding determination method using wavelet energy entropy is constructed in this section. The simulated samples are classified into a non-perforation damage set Snon and a perforation damage set Sperf. The extreme feature values for these two distinct classes are defined as Hnon,max = max(Snon) and Hperf,min = min(Sperf). Based on the distribution of the dataset, the following criterion is used to adaptively determine the discrimination threshold (T). Under the condition where Hnon,max < Hperf,min, the two sample classes exhibit no overlap within the feature space. The median of this separation interval is established as the discrimination threshold T.
When Hnon,max ≥ Hperf,min, the feature distributions overlap, and the midpoint method cannot provide a unique classification boundary. Under this condition, the algorithm switches to the ROC curve-based optimization method, which assesses all candidate thresholds. It calculates the classification accuracy for each threshold and selects the one that maximizes the Youden index. This strategy does not rely on assumptions about data distribution and optimizes classification performance even when samples are imbalanced or distributions overlap. After establishing the final threshold T, we compare the measured wavelet energy entropy Hwe with T to distinguish the damage type. If perforation is discriminated, subsequent parameter inversion and quantitative assessment are performed. Otherwise, a qualitative warning is issued. In practice, T can be adaptively updated based on actual working condition data to ensure the robustness of the classification framework.
4.5. Impact Parameter Inversion Based on Physics-Prior Bayesian Correction
For conditions determined to be perforation damage, a GPR-θ model is constructed to invert the incidence angle. Three key stress wave features and two impact localization parameters are integrated to form the model inputs. The stress wave features consist of the first-arrival trough amplitude, the frequency standard deviation, and the ratio of low-frequency to high-frequency root mean square values. The impact localization parameters comprise the radial and axial offsets. The preliminarily inverted incidence angle is subsequently output by this model.
4.5.1. Bayesian Hyperparameter Optimization
Bayesian optimization is employed within the GPR-θ model to determine the hyperparameter set for the composite kernel function. Classical Gaussian processes typically maximize the log-marginal likelihood as their optimization objective [38], a data-driven Bayesian optimization framework is introduced to perform global optimization in the multidimensional parameter space [41]. The expected improvement is used as the acquisition function during the iterative search process. Candidate parameter combinations are assessed based on the output posterior distribution characteristics of the Gaussian process surrogate model. This mechanism ensures the selection of suitable hyperparameter combinations for subsequent inversion and damage assessment within a finite number of evaluations.
4.5.2. Bayesian Post-Processing Correction Based on Physics Priors
The forward physical relationship between stress wave characteristics and impact parameters is described by the Rational2D surface established in Section 3.2.3. Within the algorithmic framework, this relationship is introduced as prior knowledge to perform Bayesian calibration on the initial output of the GPR-θ model. Its main purpose is to use established physical laws to constrain the inversion errors in data-driven models. The GPR-θ model first outputs a preliminary inversion distribution of the incidence angle, which serves as the prior distribution. Candidate incidence angles are substituted into the Rational2D physical surface. The deviation between theoretical and measured stress wave characteristics is calculated, which forms a physical likelihood function. The prior and likelihood distributions are combined using the Bayesian theorem. This allows the model to account for data-driven predictions and physical prior information. The prior distribution is discretized in practical calculations to compute the product of the prior density and likelihood values for each candidate incidence angle. The posterior distribution is obtained after normalization, and its mean is taken as the corrected incidence angle inversion value. The aforementioned physical surface is fitted within a typical range of incidence angles and radial offsets. The constraint effectiveness of the physical prior decreases when practical test conditions deviate from these boundaries. Performing the calibration with still a fixed noise level under these deviating conditions restricts the adaptability of the GPR-θ model. An adaptive correction strategy that adapts based on the degree of deviation from the working condition is introduced to address this limitation. The adaptive noise variance in the physical likelihood function is constructed as the spatial distance function of the input feature vector deviating from the reference boundary.
where is the noise level under reference working conditions, which corresponds to the typical working conditions during surface fitting. is the penalty coefficient, and is the spatial distance between the current input feature vector x and the reference working conditions , considers the effects of axial offset changes on the model. To ensure that the model has adaptability under different impact conditions, the noise variance is introduced into the product of probability densities. Thus, constructing the physical likelihood function.
where is the observed value of the cth feature, and is the corresponding Rational2D surface function for that feature. As the test conditions approach the reference conditions, the distance d approaches zero, and the variance of the observation noise decreases accordingly. At this point, the physical likelihood constraint plays a dominant role. As the test conditions deviate significantly from the reference boundary or measured signals exhibit abnormal drift due to sensor coupling degradation, the observation noise variance increases. Thus, the weight of the physical likelihood constraint is reduced, and the model automatically switches to purely data-driven GPR-θ inference.
The value for the Rational2D surface fitting of the first-arrival trough amplitude reaches 0.988, but the other features show clear local fluctuations. A joint multi-feature likelihood would force these fluctuations into the posterior inference, introducing cumulative bias and degrading the uncertainty estimates. This study uses only the amplitude feature to construct the physical likelihood constraint, with the specific parameters shown in Table 1. The frequency standard deviation and the ratio of low-frequency to high-frequency root mean square values are instead preserved as input features to the data-driven GPR-θ prior, where the ARD composite kernel adaptively weights their contributions based on individual length scales. The final posterior distribution is obtained by combining this prior with the single-feature likelihood:
where is the prior distribution provided by the GPR-θ model. Discrete grid integration is adopted to calculate the mathematical expectation of the posterior distribution for the impact angle given in Equation (17), which is defined as the Bayesian-corrected mean . The prior mean preliminary obtained from the GPR-θ model is applied as an upper bound. The final posterior mean is set to . This prevents the amplification of boundary errors while preserving the correction capability for large-angle conditions.
Table 1.
Rational2D surface fitting parameters for stress wave features and damage areas.
4.6. Damage Degree Assessment Fusing Physics Mean Prior and Residual Learning
The inverted incident angle and the projectile offset are used as inputs. A Gaussian process regression framework that fuses a physical mean prior with composite kernel residual compensation is established to assess the equivalent failure areas of the entry and exit holes.
4.6.1. Mechanisms of Physics Mean Prior and Residual Learning
The macroscopic trends in the equivalent failure area for impact damage are determined by the incidence angle and the radial offset r. A physical prior mean function is obtained by fitting a Rational2D surface to the simulation data using nonlinear least squares:
Figure 8 presents the Rational2D-fitted surfaces of the equivalent failure areas for the entry and exit holes. The coefficients of determination are 0.968 and 0.993, and the parameters are detailed in Table 1. As shown in Figure 8, the equivalent failure area rises with increasing incidence angle and radial offset. At large incidence angles, the effective path of the projectile through the tube wall lengthens. This intensifies the damage caused by the perforation. Under radial offset conditions close to the tube wall edge, cracks at the edges of the perforation are more likely to propagate axially and circumferentially. This coupling of large angles and large offsets results in a more pronounced nonlinearity in the equivalent failure area of the exit hole, with the damage becoming more severe. This is attributed to the more severe curling and cracking formed on the back side of the exit hole under these coupled conditions. Thus, the Rational2D surface reflects the relationship between impact parameters and the damage degree. Embedding this surface as a fixed mean function into the GPR-entry and GPR-exit models, respectively, provides a physical benchmark for subsequent residual learning.
Figure 8.
Physical prior mapping surfaces for the equivalent failure area of damage: (a) entry hole; (b) exit hole.
A residual learning strategy is adopted during the modeling process, where the target value minus the mean function value is used as the new output variable:
where y is the original target value of the equivalent failure area, is the physical prior mean function, and is the residual sequence to be learned after separating the macroscopic physical laws. The mean function is used to characterize the variations in macroscopic damage degree determined by and r. Deviations induced by the axial offset z and other unmodeled factors are compensated for by the residual GPR-entry and GPR-exit models, respectively. During Gaussian process regression training, the input features have already undergo Z-score normalization. To ensure the correct call of the physical prior surfaces, the standardized inputs and must first be converted back to their original physical scales within the mean function.
where , , and are the mean and standard deviation of the corresponding features in the training dataset, respectively. After this scale restoration, is calculated, thereby embedding the physical prior into the standardized Gaussian process regression framework in an analytical form. The residual sequence is subsequently utilized to construct the GPR-entry and GPR-exit models. During the prediction phase, the final output is obtained by superimposing the predicted value from the mean function and the residual prediction from the Gaussian process regression model, calculated as follows:
where is the final predicted equivalent failure area, and is the residual compensation output by the Gaussian process regression model.
4.6.2. Kernel Selection and Physical Constraints
The residual GPR-entry and GPR-exit models also adopt a composite kernel consisting of ARD-RBF and ARD-Matern (3/2). Since the prior surface has already separated the macroscopic trends, the residual sequences are relatively smooth, and the weights in the composite kernel are adaptively determined by Bayesian optimization. After the projectile penetrates the tube wall, the entry hole curls inward, while the exit hole curls outward and is often accompanied by cracks. The damage areas are quantified as equivalent failure areas using the comprehensive envelope principle, and the exit hole damage is greater than the entry hole damage. To enforce this physical boundary condition in the final joint prediction, the following inequality constraint is applied:
where and are the final jointly predicted equivalent failure areas of the exit and entry holes, respectively. A numerical safety margin = 0.1 mm2 is introduced. This value is much smaller than the inherent difference in measured damage areas.
4.7. Physics Prior Embedding and Uncertainty Quantification
In the progressive framework for impact parameter inversion and damage assessment, the Rational2D surfaces of A, Sentry, and Sexit are embedded into the model inference process as physical prior benchmarks. The corresponding fitting parameters are shown in Table 1. If angle inversion errors are neglected, the physical mean function over-constrains the inference. Predictive variance is overly compressed, and error bounds become invalid. To avoid this, a staged modeling and recursive propagation strategy is adopted for uncertainty quantification. For the inversion layer, Bayesian post-processing correction uses an observation noise variance that is dynamically adjusted to variations in impact conditions. This controls the posterior contraction and prevents model overconfidence when the physical prior fails. In the GPR-entry and GPR-exit models at the assessment layer, the macroscopic trends have been separated by the aforementioned physical prior surfaces. This reduces the non-stationarity of the residual sequences. The model adaptively determines the composite kernel weights and the noise floor using Bayesian optimization. The posterior variance from the angle inversion is transmitted to the damage area prediction stage by a first-order Taylor expansion error propagation mechanism [42]. This achieves recursive uncertainty quantification. For the entry hole equivalent failure area Sentry, the recursive posterior predictive variance is calculated as follows:
where is the predicted variance that is output by the residual GPR model itself, is the posterior variance of the incidence angle obtained from the inversion layer, and is the partial derivative of the area to the incidence angle, which is obtained by the central difference approximation of the physical prior mean surface.
For the equivalent failure area of the exit hole Sexit, the recursive posterior predictive variance is calculated using the exact same mathematical form. Because the limited number of validation samples makes the conventional large-sample normal asymptotic assumption prone to under-envelopment, 95% prediction intervals are constructed for the three target variables based on small-sample prediction interval theory [43]. These confidence intervals are constructed using the t-distribution with M-1 degrees of freedom, where M is the total number of validation samples.
5. Results and Discussion
5.1. Assessment Strategy
To evaluate the effectiveness of the stress wave characteristic-based and physics-guided hierarchical Gaussian process regression framework proposed in this study, and considering the high cost and limited sample size of high-speed impact experiments, an assessment strategy combining simulation modeling with independent experimental validation is adopted. In the damage mode discrimination layer, the simulation data extracted in Section 3.1.1 is used to calibrate the wavelet energy entropy threshold, and the experimental data independently obtained in Section 3.1.2 is used to verify its adaptability to experimental working conditions. In the impact parameter inversion and quantitative assessment layer, a Rational2D physical prior surface is fitted using reference working conditions from the simulation data, and the GPR composite kernel is globally optimized using the complete perforation simulation data containing random perturbations. Finally, perforation samples with through-penetration features from the experimental data are used as test samples, excluded from both model training and surface fitting. The validation process comprises four main parts, namely damage mode discrimination, impact parameter inversion, damage degree assessment, and uncertainty quantification.
5.1.1. Comparative Methods and Ablation Studies
In terms of comparison methods, traditional data-driven approaches adopt backpropagation neural networks (BPNN) and support vector regression (SVR). The BPNN adopts a single hidden layer architecture, and the number of hidden layer nodes is determined by the classical empirical formula to reduce the risk of overfitting under small sample conditions. SVR uses standard RBF kernel functions. Meanwhile, a benchmark GPR model with an isotropic RBF kernel is constructed. Its hyperparameters are adaptively optimized using Bayesian optimization consistent with the approach in this paper, and the t-distribution is used to calculate prediction intervals in the quantification of uncertainty. All three comparison methods employ a purely data-driven approach, without introducing any physical priors or Bayesian corrections. For ablation experiments, three variants of the GPR kernel function are designed to independently validate the performance advantages of the adaptive composite kernel. These variants use the ARD-RBF kernel, the ARD-Matern(3/2) kernel, and a weighted combination of the two, respectively. To control for variables, none of these kernel ablation experiments include the Rational2D physical prior or Bayesian correction. All of the above models are run independently five times. The final model for the point-prediction BPNN is selected based on the minimum validation error. For each probabilistic GPR model, on the basis of ensuring the coverage rate of the prediction interval, the final model is selected based on the principle of minimum inversion error.
5.1.2. Evaluation Metrics
A differentiated evaluation strategy is adopted in this paper for impact parameter inversion and damage assessment. The predictive accuracy is evaluated using root mean square error (RMSE), mean absolute error (MAE), and mean absolute percentage error (MAPE), while the reliability of the prediction intervals is assessed by calculating the prediction interval coverage probability (PICP). During the impact parameter inversion stage, since an incidence angle of 0° under normal impact conditions leads to a denominator of zero in the relative error calculation, MAE is used to measure absolute inference accuracy. In the damage degree assessment, due to the relatively large numerical difference in area between the entry hole (Sentry, 117–228 mm2) and the exit hole (Sexit, 304–356 mm2), MAPE is selected to effectively eliminate evaluation biases caused by differences in scale. The mathematical formulations for these validation metrics are calculated as follows:
where is the true observed value, and is the model prediction, i.e., the posterior distribution mean.
The PICP expression for confidence is defined as follows [44]:
where and are the upper and lower bounds of the 95% prediction interval. Due to the small sample size, the critical value is calculated by adopting the t-distribution for M−1 degrees of freedom [43]. The interval is as follows:
where and are the final posterior prediction mean and the recursive total standard deviation of the uth verification sample.
5.2. Damage Mode Discrimination Results
5.2.1. Time-Frequency Domain Characteristics Analysis of Different Damage Modes
A comparative analysis of typical perforation and non-perforation conditions is conducted to elucidate the stress wave characteristics under different damage modes. The corresponding damage morphologies, normalized time-domain impact stress wave signals, and frequency spectra are illustrated in Figure 9. The stress wave responses of the two damage modes exhibit clear distinctions. In the perforation conditions shown in Figure 9a–c, the material undergoes penetrating failure. Due to material fracture and the formation of perforation boundaries, the high-frequency components of the signal are significantly enhanced, and the energy distribution exhibits typical broadband characteristics. Figure 9d–f show a non-perforation condition, presenting continuous material integrity with only a localized dent. The high-frequency components are severely attenuated, and the energy is concentrated in the low-frequency range below 100 kHz. This spectral difference provides a quantitative basis for subsequent damage mode discrimination using wavelet energy entropy Hwe.
Figure 9.
Stress wave time-frequency responses and damage morphologies under typical perforation and non-perforation conditions: (a–c) perforation and (d–f) non-perforation dent, each including damage morphology, time-domain signal, and frequency spectrum.
5.2.2. Damage Mode Discrimination Based on Wavelet Energy Entropy
The Hwe distribution calculated for all simulation data using the method described in Section 3.2.1 is shown in Figure 10. The entropy values of the two sample classes do not overlap and are clearly separated. Using Equation (14), the adaptive threshold T = 0.0061 is calculated to lie exactly between the two sample types. This effectively distinguishes the different damage modes in the simulation data.
Figure 10.
Wavelet energy entropy distribution based on the simulation data: (a) overall distribution of Hwe; (b) local amplification near the Hwe threshold.
To verify the applicability of the damage mode discrimination method under experimental conditions, the simulation-calibrated thresholds are applied to the experimental data. As shown in Figure 11, both the perforation and non-perforation samples from the experiment fall within the simulated distribution range. Some experimental data points approach the threshold line. This is due to the difference in the sensitivity of the sensor to different frequency bands, and limited by the frequency response range of the data acquisition system and the sensor, the high-frequency characteristics are not completely collected. It can be seen from Figure 11b that the entropy values of the experimental perforation samples remained stable above the threshold line. Under the current experimental validation set, the damage modes of two sample types are both accurately discriminated.
Figure 11.
Wavelet energy entropy distribution based on the simulation and experimental data: (a) overall distribution of Hwe; (b) local amplification near the Hwe threshold.
5.3. Inversion Accuracy and Uncertainty Quantification of Impact Parameters
This section assesses the incidence angle inversion accuracy of the GPR-θ model and the comparison method for samples identified as perforation. Table 2 compares the error metrics of different methods on independent experimental test samples. As shown in Table 2, for the small sample conditions, the data-driven techniques such as SVR and BPNN have no guidance from physical priors. The RMSE values of inversion incidence angle are 11.55° and 11.21°. While the benchmark GPR incorporates probabilistic inference, it is restricted by the single-scale assumption of isotropic kernels and the absence of physical prior knowledge. The ability to characterize multidimensional coupled features is limited. An inversion RMSE of 5.79° is recorded. The proposed method builds upon the benchmark GPR by introducing an adaptive composite kernel and Bayesian post-processing correction based on physical priors. The RMSE and MAE of the incidence angle inversion are reduced to 3.02° and 2.54°, respectively. These values correspond to decreases of 48% and 47% compared to the benchmark GPR. The true experimental angles lie within the 95% prediction interval. This is attributed to constructing a global map with three high-dimensional stress wave features during the prior learning stage while employing only the amplitude of the first-arrival wave trough as a unidimensional likelihood constraint during the posterior calibration stage. Cumulative bias from joint correction of multiple features is avoided by this correction strategy.
Table 2.
The inversion accuracy of incident angle and 95% prediction interval of different methods.
Figure 12 shows the scatter distribution of the incidence angle inversion value and the real value based on the simulation data training (blue dots) and the experimental data test (red squares). It can be seen that the experimental test samples show good consistency with the ideal diagonal. Prediction errors remain stable and do not diverge with increasing angle, validating the adaptability of the model to experimental conditions. At discrete angles of 0°, 15°, 30°, 45°, and 60°, the inverted results show vertical scatter. This arises from feature perturbations caused by coupled conditions, such as varying offsets at the same angle. These perturbations are reasonable prediction residuals for a continuous regression model. Such vertical dispersion is due to discrete reference settings and multi-parameter coupling. It is inherent to continuous regression models in this class of inverse problems.
Figure 12.
Comparison between the true and inverted incidence angles of impact.
5.4. Prediction Accuracy and Uncertainty Quantification of Damage Degree
Based on the impact incidence angle obtained from the inversion in Section 5.3, along with the radial and axial offsets determined by the impact localization algorithm, the GPR-entry and GPR-exit models predict the equivalent failure areas of the entry and exit holes, respectively. This process uses a Rational2D physical prior surface as a fixed mean function to perform residual learning while imposing physical inequality constraints. Table 3 compares the prediction accuracy and uncertainty quantification results of different methods.
Table 3.
Comparison of damage degree prediction accuracy and uncertainty quantification of 95% prediction intervals under different methods.
As shown in Table 3, SVR and BPNN exhibit large errors in damage degree prediction as purely data-driven methods. The RMSE and MAPE values for damage prediction at the entry and exit holes are higher than those of the method proposed in this paper, which incorporates physical priors. The benchmark GPR model shows improved prediction accuracy but is worse for quantifying uncertainty, with PICP values of only 63.64% for the exit holes. This shows that purely data-driven models lack physical prior knowledge and can be easily overfitted to local data perturbations during the training phase, resulting in the contraction of the prediction variance. The narrow prediction intervals cannot reliably include the true values of the test samples. Compared to the benchmark GPR model, the RMSE for predicting the entry hole has been reduced from 14.79 mm2 to 13.32 mm2. The improvement for the exit hole is even more impressive, with the RMSE reduced by 26%. The proposed method covers the 95% prediction intervals for both entry and exit holes with reliability, and the predictions satisfy the physical constraint that the area of the exit hole is larger than the area of the entry hole. This shows that using physical priors in residual learning can prevent prediction intervals from contracting too much, ensuring the robustness of the overall quantitative damage evaluation. Figure 13 presents scatter plots of true versus predicted values for the entry and exit holes obtained with the proposed method. As can be seen from Figure 13, the blue dots represent the simulation training data, whose distribution is based on the Rational2D physical prior surface as a global baseline and is corrected by the GPR-entry and GPR-exit models trained by residual learning. The red squares representing the experimental test samples are tightly clustered near the diagonal, indicating that the proposed model successfully compensates for the unmodeled deviations caused by complex impact conditions. Comparing Figure 13a,b shows that all exit hole areas are predicted to be larger than the corresponding entry hole areas, verifying the validity of the physical inequality constraints applied in the model. Combined with the previously discussed PICP metrics, this confirms that residual learning guided by physical priors, as well as a reasonable lower bound on observation noise, effectively prevents model overconfidence, enabling the 95% prediction intervals to reliably envelop the true experimental values.
Figure 13.
Comparison between the true and predicted values of the equivalent failure area of damage: (a) equivalent failure area of the entry hole; (b) equivalent failure area of the exit hole.
5.5. Discussion
5.5.1. Analysis of Kernel Function Ablation Studies
To assess the performance of the adaptive composite kernel, Table 4 compares the prediction accuracy and interval coverage of the single ARD-RBF kernel, the single ARD-Matern(3/2) kernel, and the adaptive composite kernel model. None of the models incorporated the Rational2D mean prior and Bayesian post-processing corrections.
Table 4.
Comparison of ablation studies for different kernel functions and uncertainty quantification of 95% prediction intervals.
According to Table 4, the adaptive composite kernel outperforms the single-kernel model on every metric. In angle inversion and exit hole damage prediction, the ARD-RBF kernel had the highest RMSE value, while the ARD-Matern(3/2) kernel and the composite kernel showed similar RMSE accuracy, but the ARD-RBF kernel had a PICP of 90.91%, indicating insufficient reliability of the interval estimates. For entry hole damage prediction, the composite kernel performed the best, with an RMSE of 11.59 mm2, representing a 15.6% reduction compared to the 13.74 mm2 RMSE of the ARD-Matern(3/2) kernel. The composite kernel achieved a better balance of accuracy in both angle inversion and damage prediction while maintaining reliable interval coverage. This suggests that the mapping relationship between stress wave signals and damage parameters involves both global smoothing trends caused by energy attenuation and local non-stationary fluctuations caused by perforation tearing. The composite kernel proposed in this paper achieves adaptive fusion of these two characteristics through data-driven means. A further comparison of Table 2 with Table 4 shows the effect of introducing the Bayesian post-processing correction guided by physical priors. The incidence angle RMSE is further reduced from 3.47° to 3.02°, representing a relative decrease of 13%. Additionally, comparing the damage prediction results in Table 3 and Table 4 shows that the purely data-driven adaptive composite kernel, while more accurate for the entry hole, is easily affected by local data fluctuations without physical prior guidance. With the introduction of the Rational2D mean prior and physical inequality constraints in this paper, local fitting fluctuations in the data-driven mechanism have been effectively suppressed. Although there are small fluctuations in the local prediction error at the entry hole, the model prediction error for the exit hole damage is further reduced to 12.98 mm2, a decrease of 12%. It also achieves compliance with the physical inequality constraints across all test samples. These results demonstrate that residual learning guided by physical priors enables reliable prediction intervals and ensures compliance with physical constraints while improving prediction accuracy for exit holes.
5.5.2. Comparison with Existing Methods
In the detection of impact damage for thin-walled tubular structures like tail drive shafts, Zhang et al. [24] identified impact events using vibration axis trajectory characteristics. Panagiotopoulou et al. [25] determined damage types by combining vibration acceleration estimation errors with a NARX model. An effective method for the qualitative discrimination of impact events is provided by these methods. The quantitative inversion of impact parameters and the continuous assessment of damage degree remain unaddressed. A framework integrating stress wave features with a physics-guided hierarchical Gaussian process regression is proposed based on impact-induced high-frequency stress wave signals. In damage mode discrimination, the adaptive threshold based on wavelet energy entropy achieved accurate discrimination between perforation and non-perforation types. An RMSE of 3.02° is recorded for incidence angle inversion. The prediction errors for the entry and exit holes are 13.32 mm2 and 12.98 mm2, respectively. The data in Table 2 and Table 3 demonstrate RMSE reductions of 48% for angle inversion and 26% for exit hole damage prediction relative to the benchmark GPR. Thin-walled tubular structures are highly sensitive to perforation damage. This level of accuracy provides a reliable input for assessing structural residual strength. The actual experimental values lie within the 95% prediction interval. A quantitative basis for uncertainty in damage assessment is established by this coverage. This framework provides a viable technical approach for the quantitative assessment of impact damage in thin-walled tube structures like tail drive shafts. However, this study has mainly focused on validating the aluminum alloy materials, geometric dimensions, and impact velocity ranges commonly used for tail shafts. The framework can be used after recalibrating the physical prior and updating the training samples according to different working conditions. Subsequent research will further consider calibration under rotational conditions and projectile deformation models to expand its applicability in a wider range of working conditions.
6. Conclusions
To achieve impact parameter inversion and quantitative damage assessment for thin-walled tube structures, this paper proposes a framework based on stress wave characteristics and physics-guided hierarchical Gaussian process regression. Damage modes are discriminated using wavelet energy entropy with an adaptive threshold. Impact parameters are inverted by adaptive composite kernels and Bayesian post-processing correction. A two-dimensional rational function surface is introduced as a mean function to guide residual learning for damage assessment. Each stage independently outputs a 95% prediction interval. The following conclusions are drawn.
(1) Physically interpretable stress wave characteristics and prior mapping relationships are established. Based on the correlation between features and impact parameters, key feature indicators are selected from 39 multi-domain features. Wavelet energy entropy is used to discriminate between perforation and non-perforation damage. The first-arrival wave trough amplitude, frequency standard deviation, and the ratio of low-frequency to high-frequency root mean square values are used to quantitatively invert impact parameters and damage degree. A two-dimensional rational function surface fitted to simulation data establishes a physical mapping relationship between impact parameters, stress wave characteristics, and damage degree under the coupled effects of incidence angle and radial offset. This surface provides explicit physical prior information for model inversion and evaluation.
(2) The effectiveness of the hierarchical progressive evaluation framework is validated. Under the current validation conditions, an accurate discrimination between perforation and non-perforation damage is achieved by the adaptive threshold algorithm based on wavelet energy entropy. In the impact parameter inversion layer, inversion bias is effectively suppressed through the integration of the adaptive composite kernel and Bayesian post-processing correction guided by physical priors. An RMSE as low as 3.02° is recorded for the incidence angle inversion, obviously outperforming traditional purely data-driven SVR, BPNN, and benchmark GPR models. In the damage degree assessment layer, the Rational2D surface is applied as a physical mean constraint. The RMSE values for the equivalent failure areas of the entry and exit holes are 13.32 mm2 and 12.98 mm2, respectively. There is reliable coverage of the 95% prediction intervals for both the inversion and assessment layers. The physical inequality constraint requiring the exit hole area to exceed the entry hole area is satisfied by predictions.
(3) Ablation experiments show that the proposed adaptive composite kernel effectively takes into account the smooth characteristics and local abrupt features of the signals. It outperforms individual kernel functions in prediction accuracy. After introducing the Rational2D mean prior and Bayesian post-processing correction, parameter inversion errors and exit hole damage prediction errors are further reduced. The entire evaluation process maintains stable coverage of the prediction interval, ensuring the reliability of the quantitative damage assessment.
These conclusions indicate that the proposed framework offers a new method with both physical interpretability and uncertainty quantification for impact parameter inversion and quantitative damage assessment of thin-walled tube structures.
Author Contributions
Conceptualization, Q.W. and Y.S.; methodology, Q.W. and Y.S.; software, Q.W.; validation, Q.W., Y.S., S.W. and Y.P.; formal analysis, Q.W., Y.S. and J.L.; investigation, Q.W.; resources, Y.S. and J.L.; writing—original draft, Q.W.; writing—review and editing, Q.W., Y.S., S.W. and Y.P.; visualization, Q.W.; supervision, Y.S.; project administration, Y.S.; funding acquisition, Y.S. All authors have read and agreed to the published version of the manuscript.
Funding
This work was supported by the National Natural Science Foundation of China (Grant No. 52275107) and the Science Fund for Distinguished Young Scholars of Hunan Province (Grant No. 2024JJ2030).
Data Availability Statement
The simulation datasets generated in this study can be requested from the corresponding author on reasonable request. The raw experimental data are proprietary and therefore not publicly available.
Conflicts of Interest
The authors declare no conflicts of interest.
Abbreviations
The following abbreviations are used in this manuscript:
| HTDS | Helicopter Tail Drive Shaft |
| GPR | Gaussian Process Regression |
| ARD | Automatic Relevance Determination |
| RBF | Radial Basis Function |
| ROC | Receiver Operating Characteristic |
| BPNN | Backpropagation Neural Network |
| SVR | Support Vector Regression |
| RMSE | Root Mean Square Error |
| MAE | Mean Absolute Error |
| MAPE | Mean Absolute Percentage Error |
| PICP | Prediction Interval Coverage Probability |
References
- Li, H.C.H.; Wang, J.; Baker, A. Rapid Composite Bonded Repair for Helicopter Tail Drive Shafts. Compos. Part B Eng. 2012, 43, 1579–1585. [Google Scholar] [CrossRef] [Scilit]
- Fossati, M.; Pagani, M.; Giglio, M.; Manes, A. Fatigue Crack Propagation in a Helicopter Component Subjected to Impact Damage. Def. Technol. 2021, 17, 416–428. [Google Scholar] [CrossRef] [Scilit]
- Edwards, A.C.; Neugebauer, A.K. Damage Tolerant Design of the YAH-64 Drive System. J. Am. Helicopter Soc. 1981, 26, 29–33. [Google Scholar] [CrossRef] [Scilit]
- Zhang, C.; Zhu, R.P.; Wang, D.; Cao, P.; Li, J.; Li, J.; Li, P. Dynamic Characteristics Analysis and the Identification Signal of the Horizontal Tail Drive Shaft System with the Ballistic Impact Damage of a Helicopter. Struct. Health Monit. 2024, 23, 1123–1147. [Google Scholar] [CrossRef] [Scilit]
- Mitra, M.; Gopalakrishnan, S. Guided Wave based Structural Health Monitoring: A Review. Smart Mater. Struct. 2016, 25, 053001. [Google Scholar] [CrossRef] [Scilit]
- Capineri, L.; Bulletti, A. Ultrasonic Guided-Waves Sensors and Integrated Structural Health Monitoring Systems for Impact Detection and Localization: A Review. Sensors 2021, 21, 2929. [Google Scholar] [CrossRef] [Scilit] [PubMed]
- Zeng, X.; Deng, D.S.; Yang, H.J.; Yang, Z.Y.; Yang, L.; Wu, Z.J. Hybrid DOA–TDOA Method for Impact Localization on Thin-Walled Structures Using Sensor Clusters. IEEE Sens. J. 2025, 25, 6659–6672. [Google Scholar] [CrossRef] [Scilit]
- Jiao, P.C.; Egbe, K.J.I.; Xie, Y.; Matin Nazar, A.; Alavi, A.H. Piezoelectric Sensing Techniques in Structural Health Monitoring: A State-of-the-Art Review. Sensors 2020, 20, 3730. [Google Scholar] [CrossRef] [Scilit] [PubMed]
- Ju, M.; Dou, Z.S.; Li, J.W.; Qiu, X.T.; Shen, B.L.; Zhang, D.W.; Yao, F.Z.; Gong, W.; Wang, K. Piezoelectric Materials and Sensors for Structural Health Monitoring: Fundamental Aspects, Current Status, and Future Perspectives. Sensors 2023, 23, 543. [Google Scholar] [CrossRef] [Scilit] [PubMed]
- Guan, R.Q.; Lu, Y.; Duan, W.H.; Wang, X.M. Guided Waves for Damage Identification in Pipeline Structures: A Review. Struct. Control. Health Monit. 2017, 24, e2007. [Google Scholar] [CrossRef] [Scilit]
- Banerjee, S.; Ricci, F.; Monaco, E.; Mal, A. A Wave Propagation and Vibration-Based Approach for Damage Identification in Structural Components. J. Sound. Vib. 2009, 322, 167–183. [Google Scholar] [CrossRef] [Scilit]
- Wu, Q.Z.; Shen, Y.P.; Wang, S.L.; Li, J.; Chen, A.H.; Peng, Y.F. Stress Wave Characteristics and Damage Analysis of the Helicopter Tail Drive Shaft with the High-Speed Projectile Impact. Int. J. Struct. Stab. Dyn. 2026, 26, 2650088. [Google Scholar] [CrossRef] [Scilit]
- Zhu, C.; Xu, Z.D.; Lu, H.F.; Lu, Y. Evaluation of Cross-Sectional Deformation in Pipes Using Reflection of Fundamental Guided-Waves. J. Eng. Mech. 2022, 148, 04022016. [Google Scholar] [CrossRef] [Scilit]
- Yuan, F.G.; Zargar, S.A.; Chen, Q.Y.; Wang, S.H. Machine Learning for Structural Health Monitoring: Challenges and Opportunities. Sens. Smart Struct. Technol. Civ. Mech. Aerosp. Syst. 2020, 11379, 1137903. [Google Scholar] [CrossRef] [Scilit]
- Scarselli, G.; Nicassio, F. Machine Learning for Structural Health Monitoring of Aerospace Structures: A Review. Sensors 2025, 25, 6136. [Google Scholar] [CrossRef] [Scilit] [PubMed]
- Yue, N.; Aliabadi, M.H. Hierarchical Approach for Uncertainty Quantification and Reliability Assessment of Guided Wave-Based Structural Health Monitoring. Struct. Health Monit. 2021, 20, 2274–2299. [Google Scholar] [CrossRef] [Scilit]
- Zhang, Y.Y.; Logachov, A.; Smirnov, A.; Kazarinov, N. Artificial Neural Networks for Impact Strength Prediction of Composite Barriers. Materials 2025, 18, 3001. [Google Scholar] [CrossRef] [Scilit] [PubMed]
- Haywood-Alexander, M.; Bacsa, K.; Liu, W.; Lai, Z.; Chatzi, E. Physics Enhanced Machine Learning for Monitoring and Twinning. Struct. Health Monit. 2023. [Google Scholar] [CrossRef] [Scilit] [PubMed]
- Polle, C.; Bosse, S.; Herrmann, A.S. Damage Location Determination with Data Augmentation of Guided Ultrasonic Wave Features and Explainable Neural Network Approach for Integrated Sensor Systems. Computers 2024, 13, 32. [Google Scholar] [CrossRef] [Scilit]
- Xu, Y.F.; He, X.; Wang, X.Y.; Zhang, H.; Peng, X.Y.; Liu, D.T.; Zhang, L.Y. Physics Induced Terahertz Time-of-Flight Compensation Method for Accurate Thickness Measurement and Full-Field Imaging of Damage in Composite. Mech. Syst. Signal Process. 2025, 231, 112709. [Google Scholar] [CrossRef] [Scilit]
- He, X.; Liu, D.T.; Hua, H.Z.; Zhang, H.; Xu, Y.F. A Novel LightGBM-LSTM-GA Framework for Performance Degradation Prediction of Composite Laminates with Variable Structural Parameters. Eng. Struct. 2026, 364, 123113. [Google Scholar] [CrossRef] [Scilit]
- Li, P.H.; Liu, D.T.; Wang, X.Y.; Cui, Y.Q.; Zhang, L.Y.; Xu, Y.F. Physics Inspired Sparse Deconvolution Network for Dispersion Compensation of Terahertz Wave. Mech. Syst. Signal Process. 2026, 243, 113692. [Google Scholar] [CrossRef] [Scilit]
- Xu, Y.F.; Li, P.H.; He, X.; Cui, Y.Q.; Peng, X.Y.; Liu, D.T.; Zhang, L.Y. Physics Informed Terahertz Multi-Label Dual Adversarial Network for Intelligent Identification of Composite Overlapping Defects under Variable Testing Conditions. Mech. Syst. Signal Process. 2026, 257, 114597. [Google Scholar] [CrossRef] [Scilit]
- Zhang, C.; Liao, M.J.; Chen, X.Y.; Yu, H.; Cai, Y.F.; Zhu, R.P.; Chen, W.F.; Wang, D. A Ballistic Impact Identification Method for the Helicopter Tail Drive Shaft System Based on Vibration Response Analysis. Chin. J. Aeronaut. 2025, 38, 103556. [Google Scholar] [CrossRef] [Scilit]
- Panagiotopoulou, V.; Brancato, L.; Petriconi, E.; Baldi, A.; Mariani, U.; Giglio, M.; Sbarufatti, C. Comparative Study on Ballistic Impact Detection in Helicopter Transmission Shafts Using NARX and LSTM Models. Appl. Intell. 2025, 55, 264. [Google Scholar] [CrossRef] [Scilit]
- Shen, Y.F.; Giurgiutiu, V. WaveFormRevealer: An Analytical Framework and Predictive Tool for the Simulation of Multi-Modal Guided Wave Propagation and Interaction with Damage. Struct. Health Monit. 2014, 13, 491–511. [Google Scholar] [CrossRef] [Scilit]
- Paialunga, P.; Corcoran, J. Damage Detection in Guided Wave Structural Health Monitoring Using Gaussian Process Regression. Struct. Health Monit. 2023, 22, 3956–3970. [Google Scholar] [CrossRef] [Scilit]
- Karniadakis, G.E.; Kevrekidis, I.G.; Lu, L.; Perdikaris, P.; Wang, S.F.; Yang, L. Physics-Informed Machine Learning. Nat. Rev. Phys. 2021, 3, 422–440. [Google Scholar] [CrossRef] [Scilit]
- Zhang, H.Y.; Jiang, S.L.; Gao, D.F.; Sun, Y.W.; Bai, W.X. A Review of Physics-Based, Data-Driven, and Hybrid Models for Tool Wear Monitoring. Machines 2024, 12, 833. [Google Scholar] [CrossRef] [Scilit]
- Jones, M.R.; Rogers, T.J.; Cross, E.J. Constraining Gaussian Processes for Physics-Informed Acoustic Emission Mapping. Mech. Syst. Signal Process. 2023, 188, 109984. [Google Scholar] [CrossRef] [Scilit]
- Li, D.H.; Li, Y.G.; Liu, C.Q. Gaussian Process Regression Model Incorporated with Tool Wear Mechanism. Chin. J. Aeronaut. 2022, 35, 393–400. [Google Scholar] [CrossRef] [Scilit]
- Cao, S.; Fan, J.T. Numerical Model for Penetration Process of a Deformable Projectile into Ductile Metallic Target Plate Considering the Interaction of Projectile and Target. Int. J. Impact Eng. 2025, 195, 105107. [Google Scholar] [CrossRef] [Scilit]
- Peng, C.; Wang, S.L.; Wu, Q.Z.; Shen, Y.P.; Li, J. Study of Projectile Impact Damage to the Helicopter Tail Drive Shaft and Its Effect on Crack Propagation Life. Adv. Mech. Eng. 2026, 18, 1–18. [Google Scholar] [CrossRef] [Scilit]
- Forrestal, M.J.; Piekutowski, A.J. Penetration Experiments with 6061-T6511 Aluminum Targets and Spherical-Nose Steel Projectiles at Striking Velocities Between 0.5 and 3.0 km/s. Int. J. Impact Eng. 2000, 24, 57–67. [Google Scholar] [CrossRef] [Scilit]
- Wu, Q.Z.; Shen, Y.P.; Wang, S.L.; Peng, Y.F.; Zhou, J.; Li, J. Impact-Induced Stress Wave Mechanism-Based ASVD-AGSD and Its Application in High-Accuracy Feature Extraction and Localization for Thin-Walled Tubes. Proc. Inst. Mech. Eng. Part C J. Mech. Eng. Sci. 2026, 240, 6198–6221. [Google Scholar] [CrossRef] [Scilit]
- Zhang, X.L.; Yan, Q.; Yang, J.; Zhao, J.F.; Shen, Y.B. An Assembly Tightness Detection Method for Bolt-Jointed Rotor with Wavelet Energy Entropy. Measurement 2019, 136, 212–224. [Google Scholar] [CrossRef] [Scilit]
- He, J.; Yang, S.X.; Gan, C.B. Unsupervised Fault Diagnosis of a Gear Transmission Chain Using a Deep Belief Network. Sensors 2017, 17, 1564. [Google Scholar] [CrossRef] [Scilit] [PubMed]
- Tian, S.X.; Wu, Z.N.; Zhang, D.X. Gaussian Process Regression Based Inspection Robot for Predicting and Locating Pipeline Anticorrosion Coating Defects. Meas. Sci. Technol. 2024, 35, 066205. [Google Scholar] [CrossRef] [Scilit]
- Seeger, M. Gaussian Processes for Machine Learning. Int. J. Neural Syst. 2004, 14, 69–106. [Google Scholar] [CrossRef] [Scilit] [PubMed]
- Liu, K.L.; Li, Y.; Hu, X.S.; Lucu, M.; Widanage, W.D. Gaussian Process Regression with Automatic Relevance Determination Kernel for Calendar Aging Prediction of Lithium-Ion Batteries. IEEE Trans. Ind. Informat. 2019, 16, 3767–3777. [Google Scholar] [CrossRef] [Scilit]
- Manfredi, P. Conservative Gaussian Process Models for Uncertainty Quantification and Bayesian Optimization in Signal Integrity Applications. IEEE Trans. Compon. Packag. Manuf. Technol. 2024, 14, 1261–1272. [Google Scholar] [CrossRef] [Scilit]
- Hewing, L.; Kabzan, J.; Zeilinger, M.N. Cautious Model Predictive Control Using Gaussian Process Regression. IEEE Trans. Control Syst. Technol. 2020, 28, 2736–2743. [Google Scholar] [CrossRef] [Scilit]
- Altman, N.; Krzywinski, M. Predicting with Confidence and Tolerance. Nat. Methods 2018, 15, 843–845. [Google Scholar] [CrossRef] [Scilit] [PubMed]
- Niu, T.; Xu, Z.J.; Luo, H.; Zhou, Z.Q. Hybrid Gaussian Process Regression with Temporal Feature Extraction for Partially Interpretable Remaining Useful Life Interval Prediction in Aeroengine Prognostics. Sci. Rep. 2025, 15, 11057. [Google Scholar] [CrossRef] [Scilit] [PubMed]
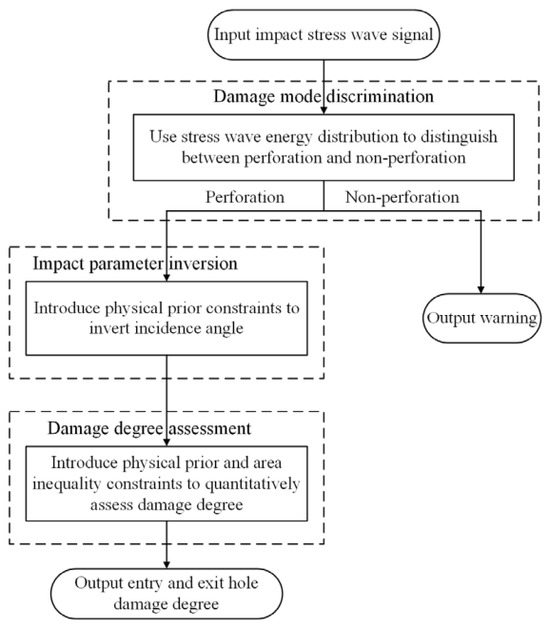
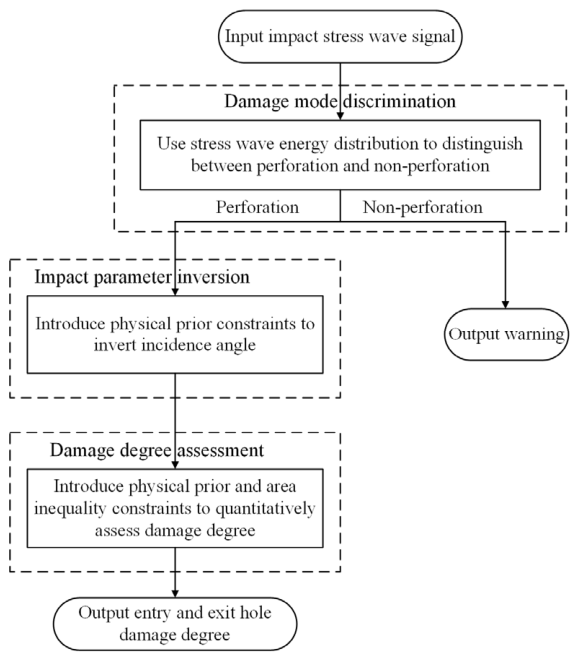
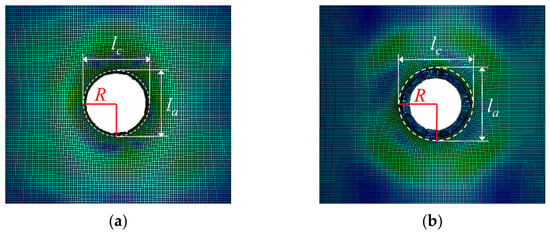
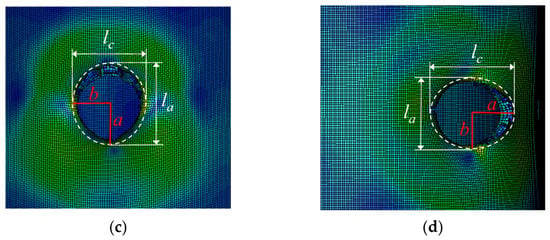
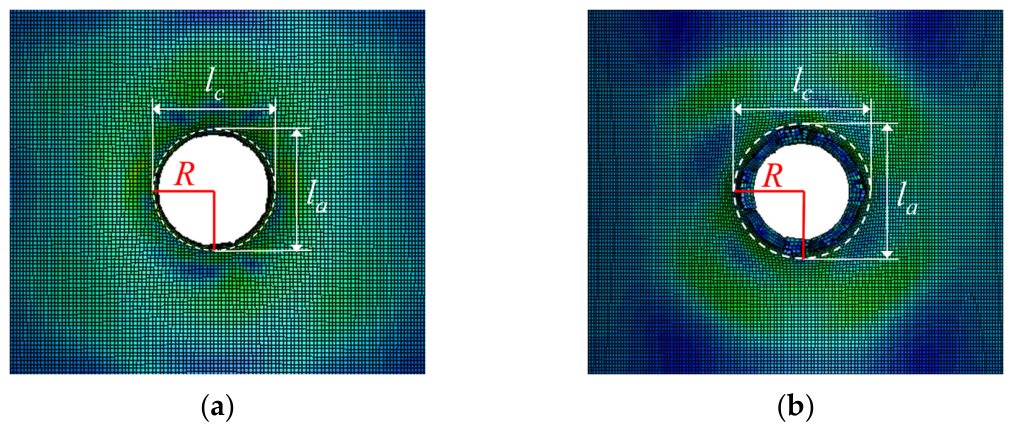
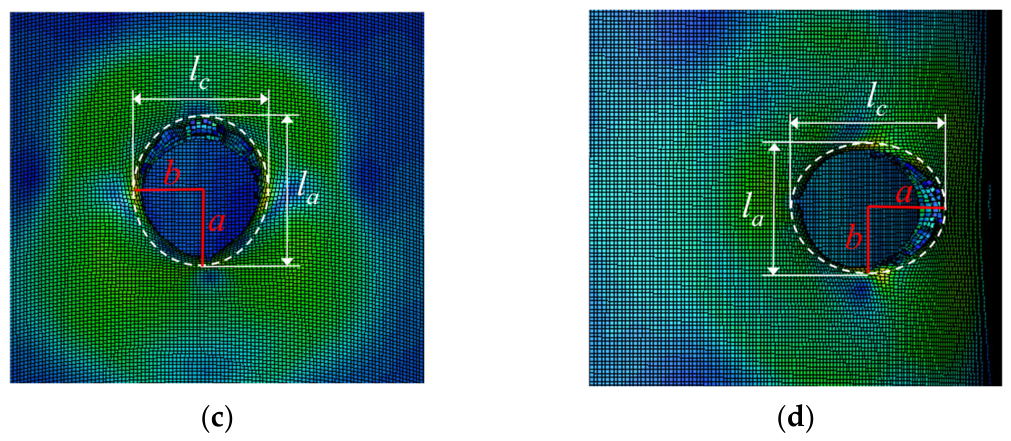
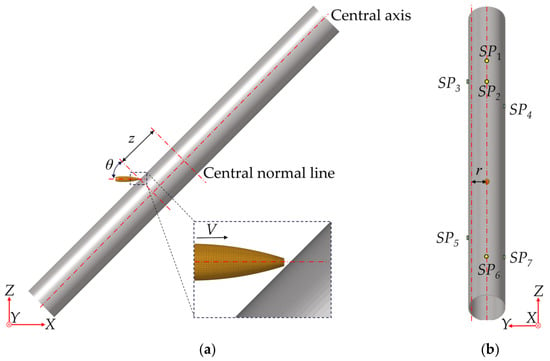
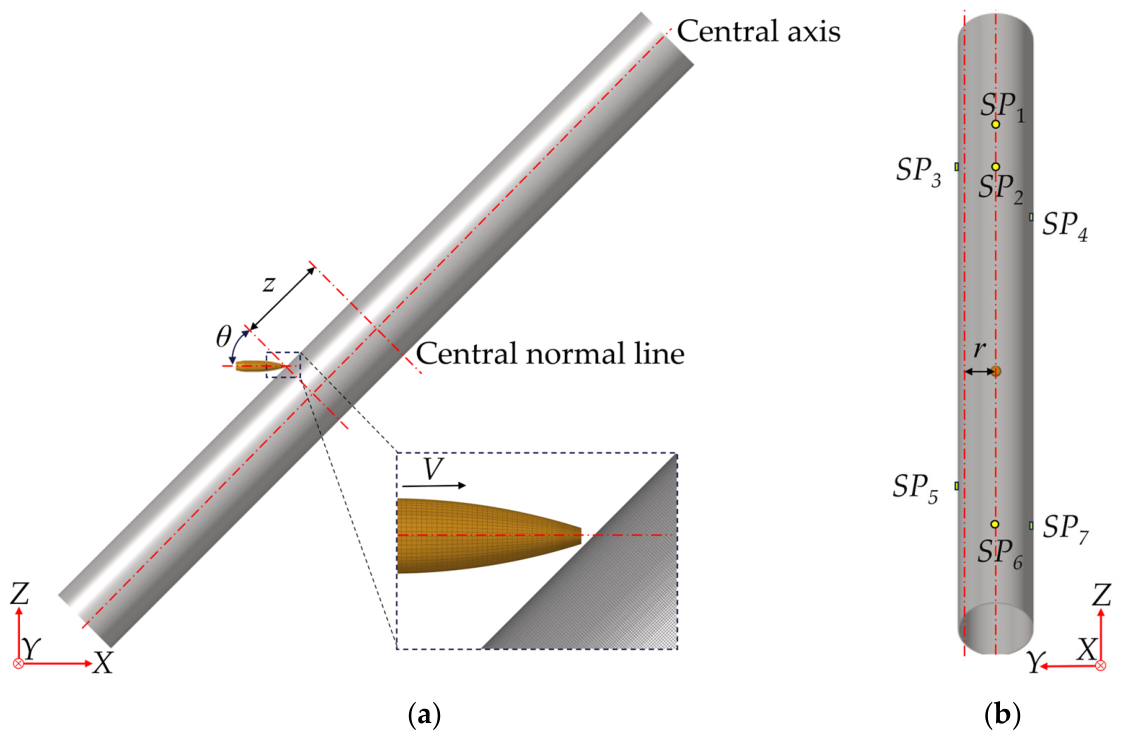
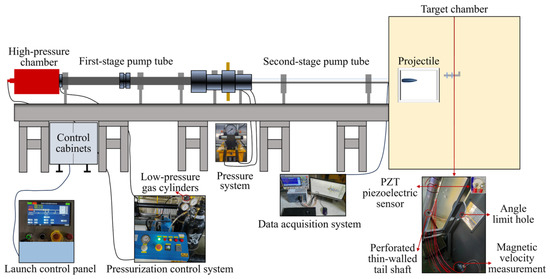
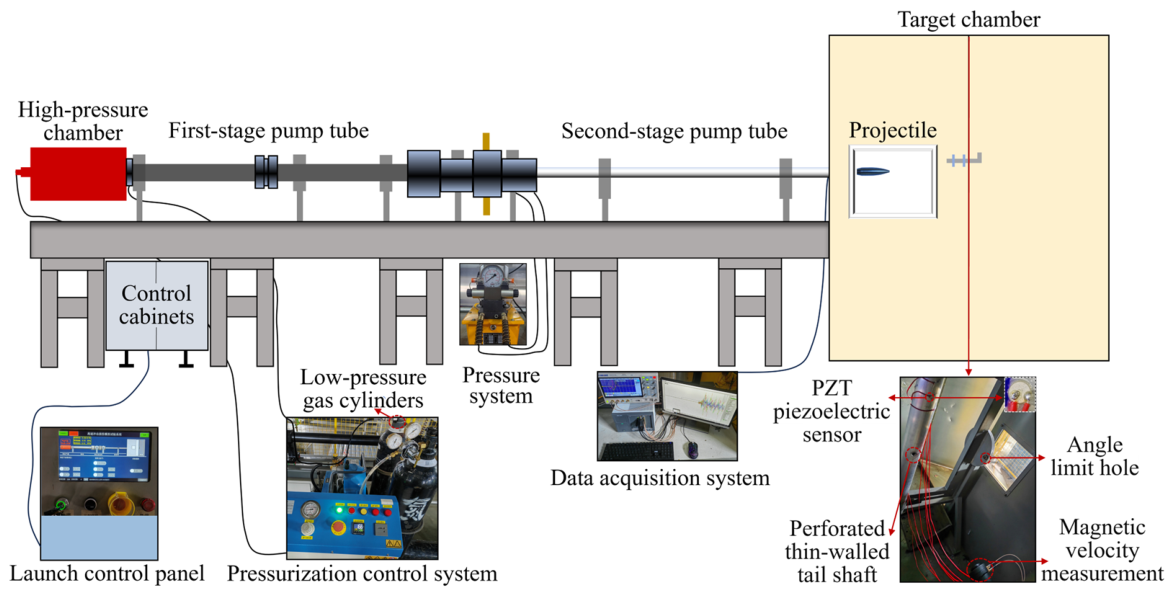
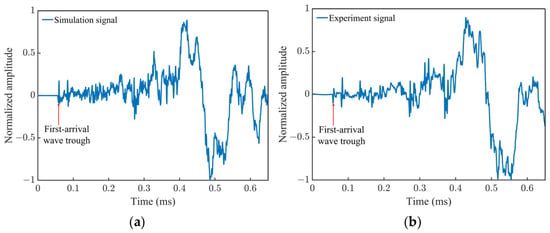
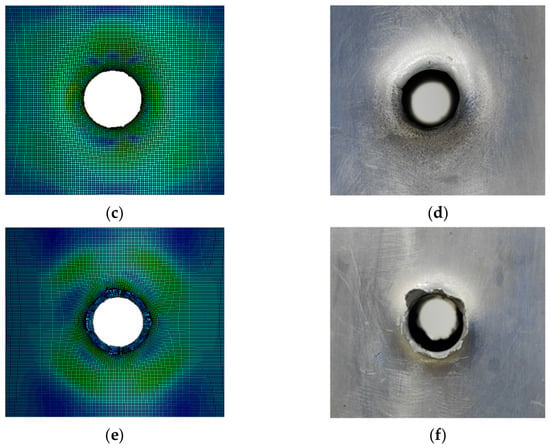
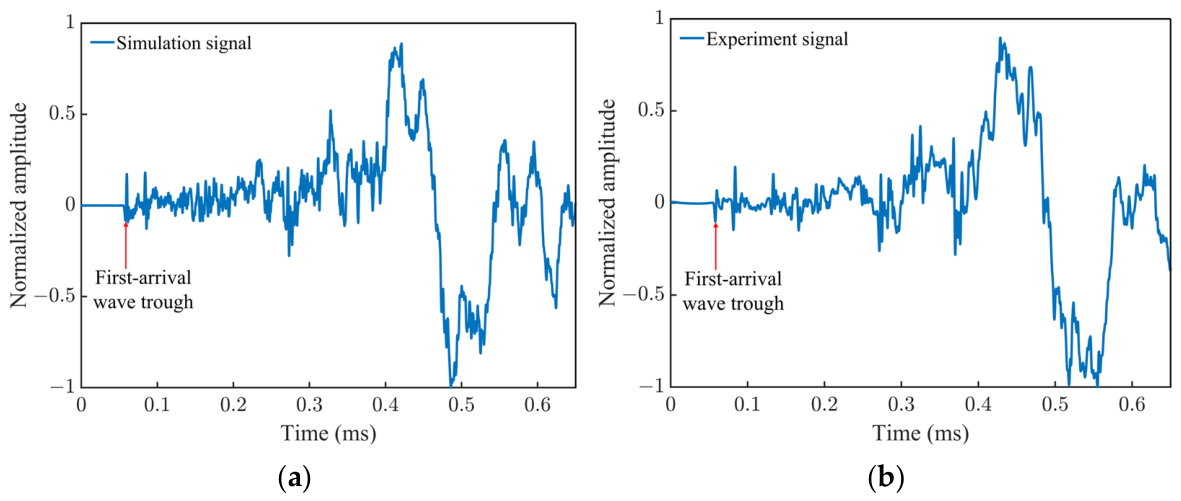
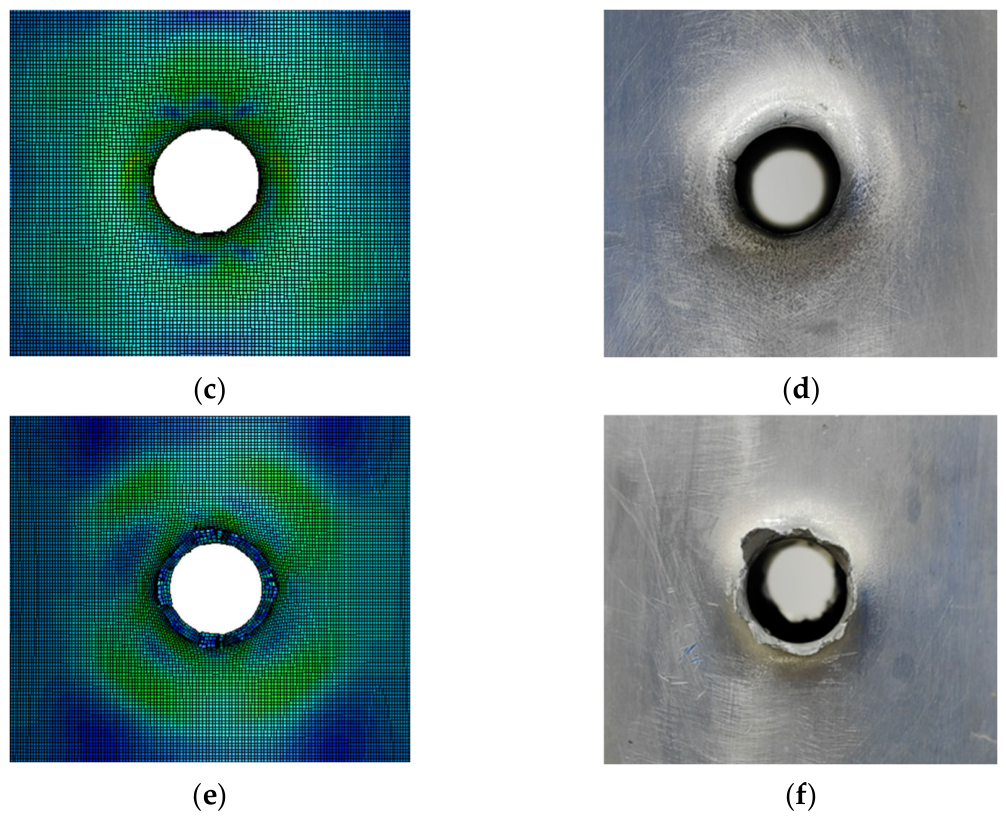
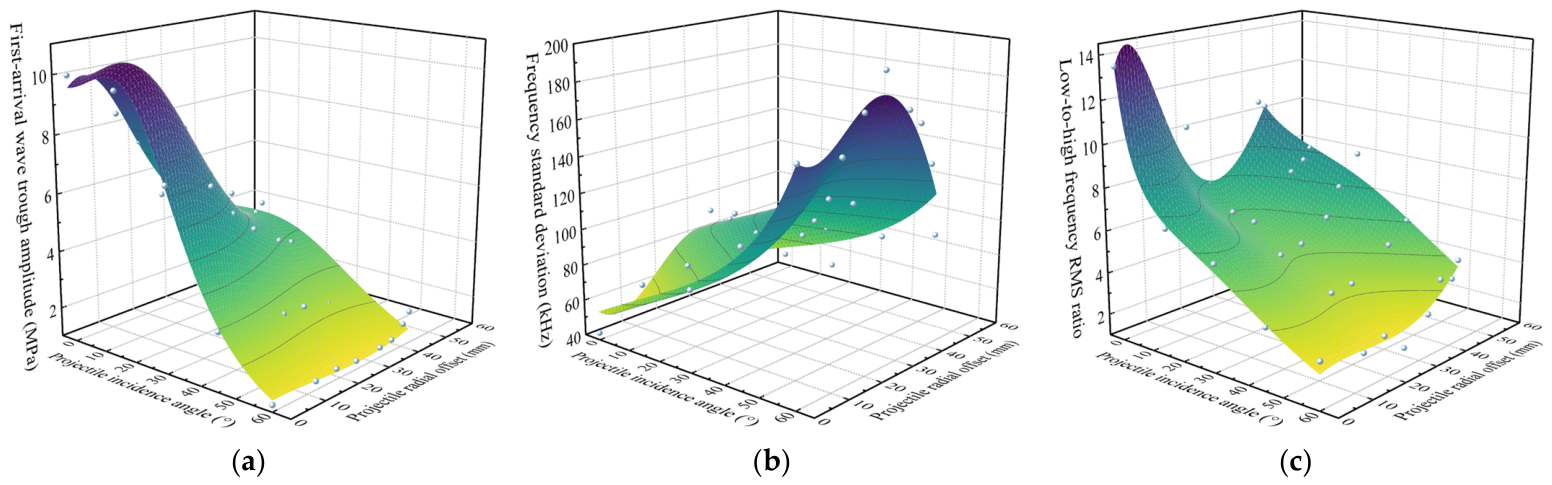
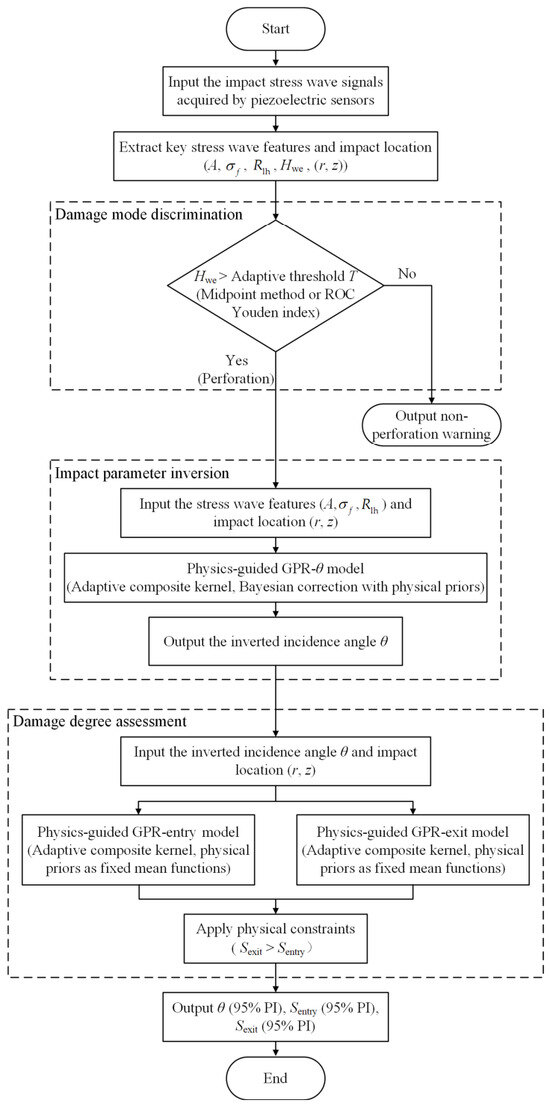
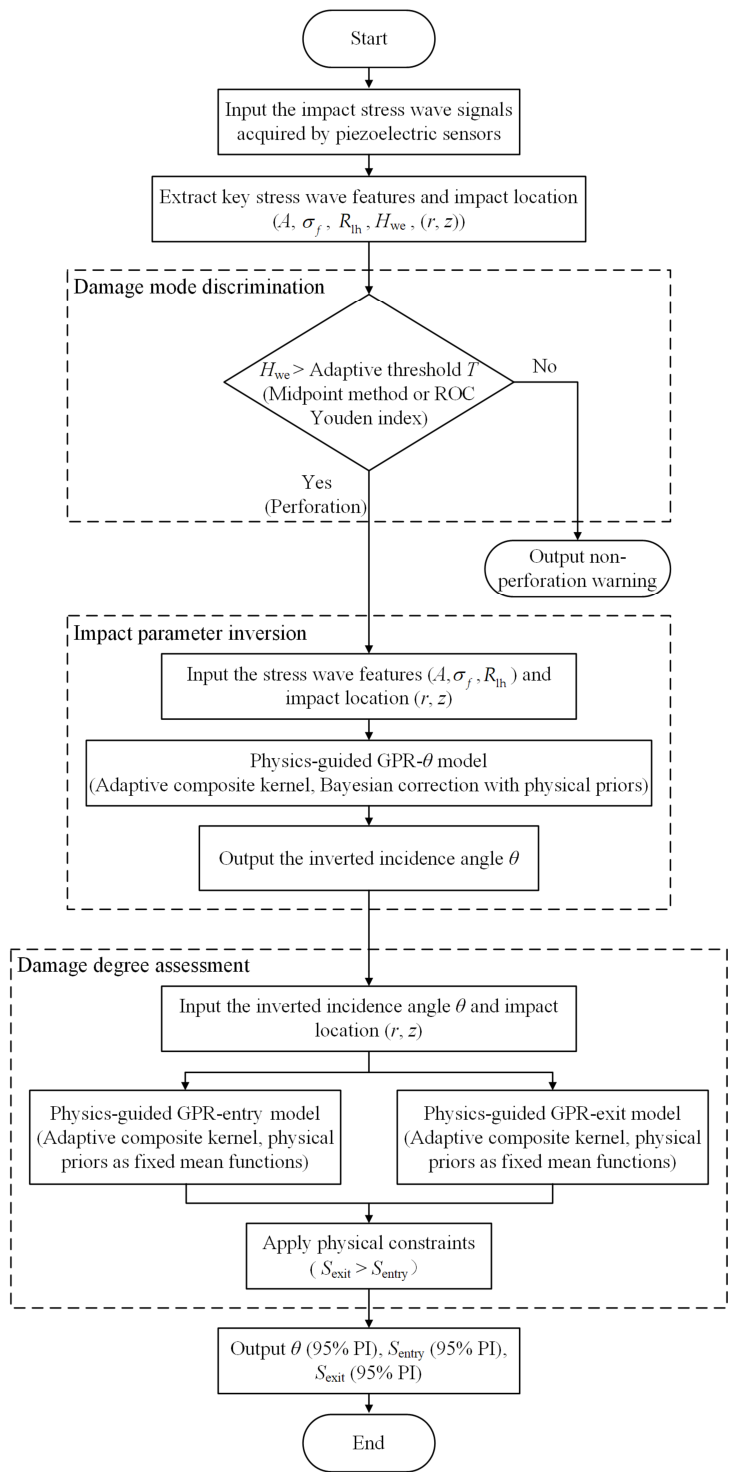
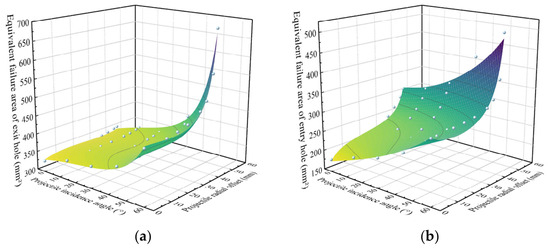
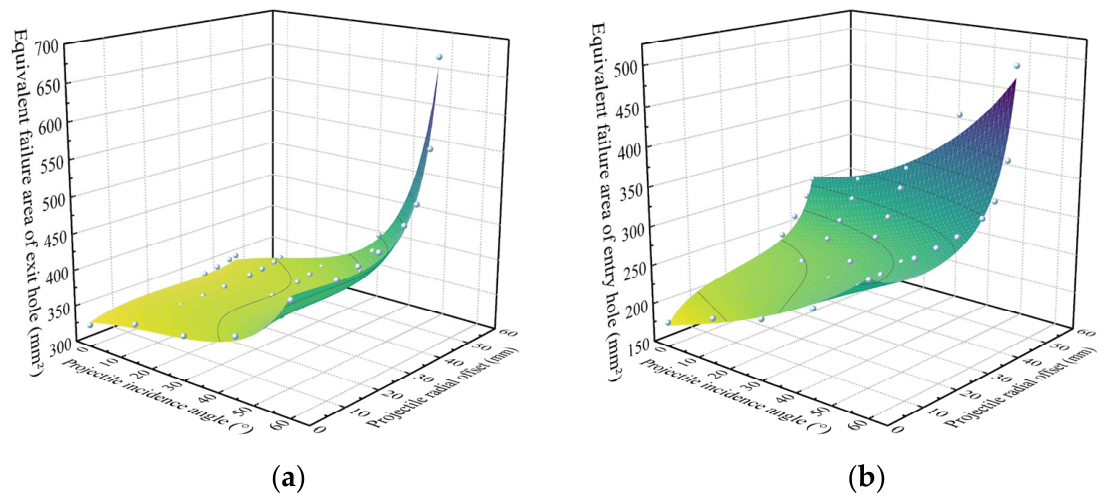
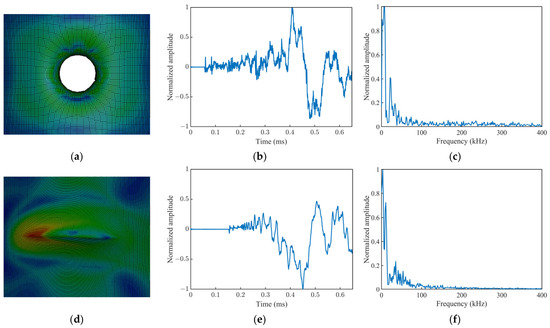
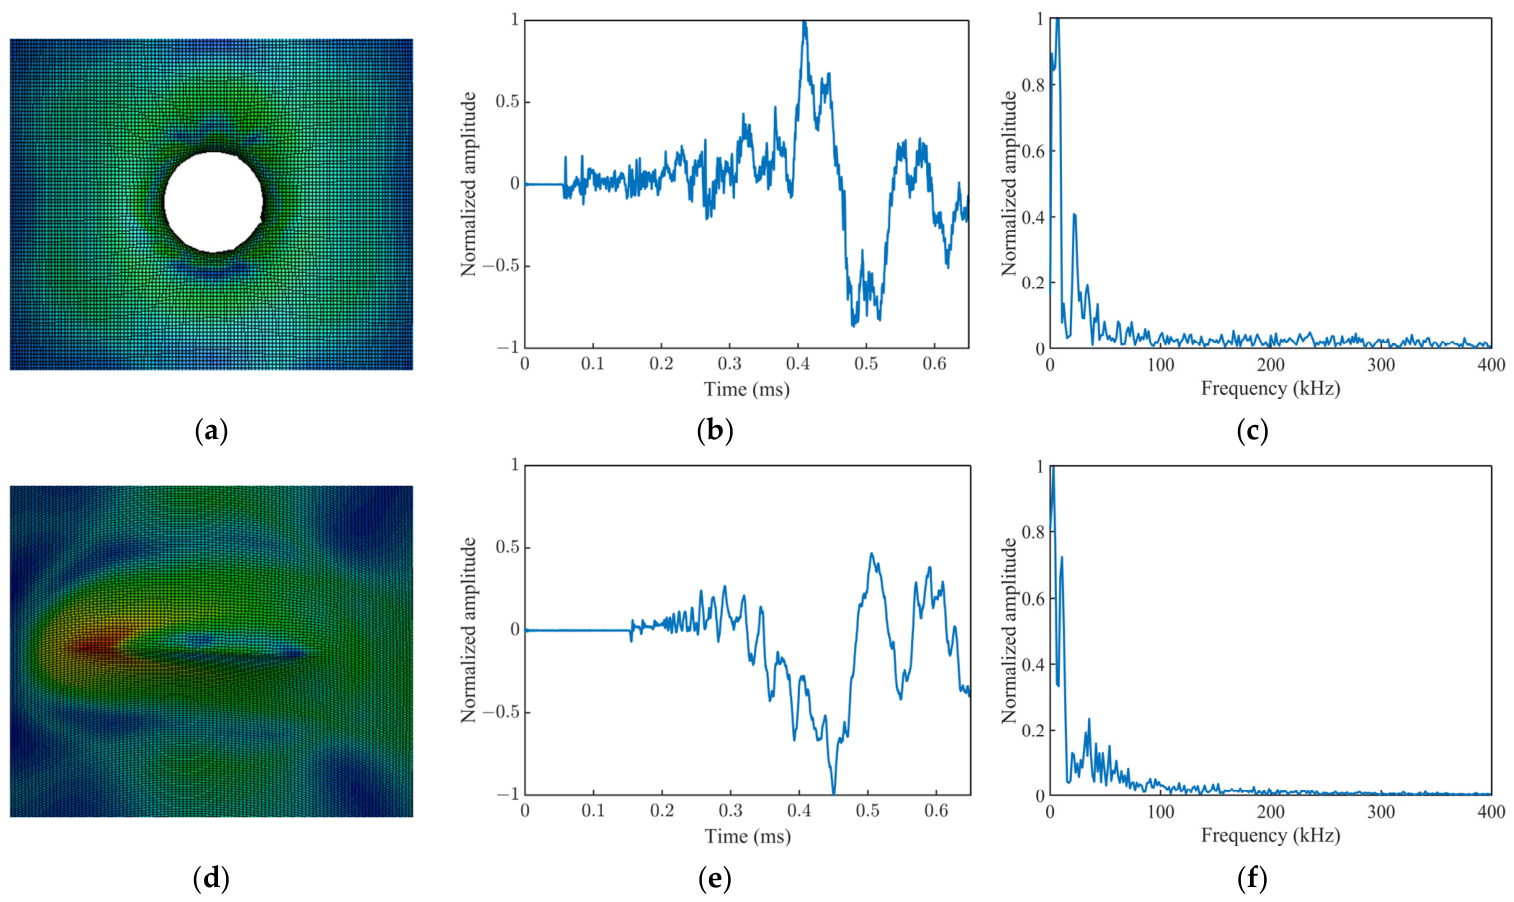
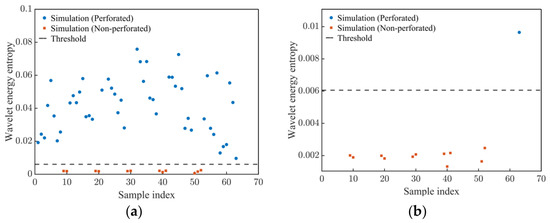
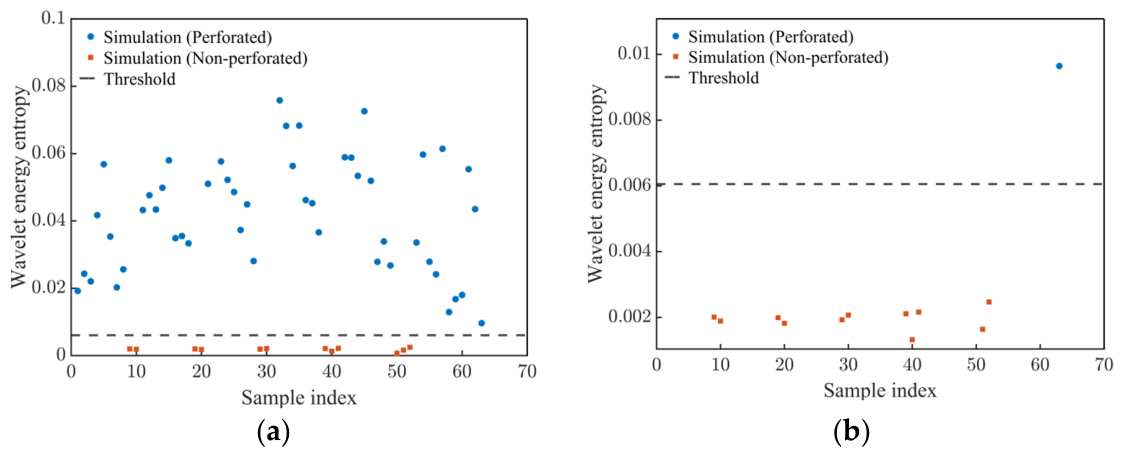
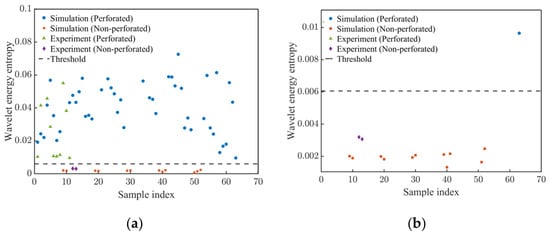
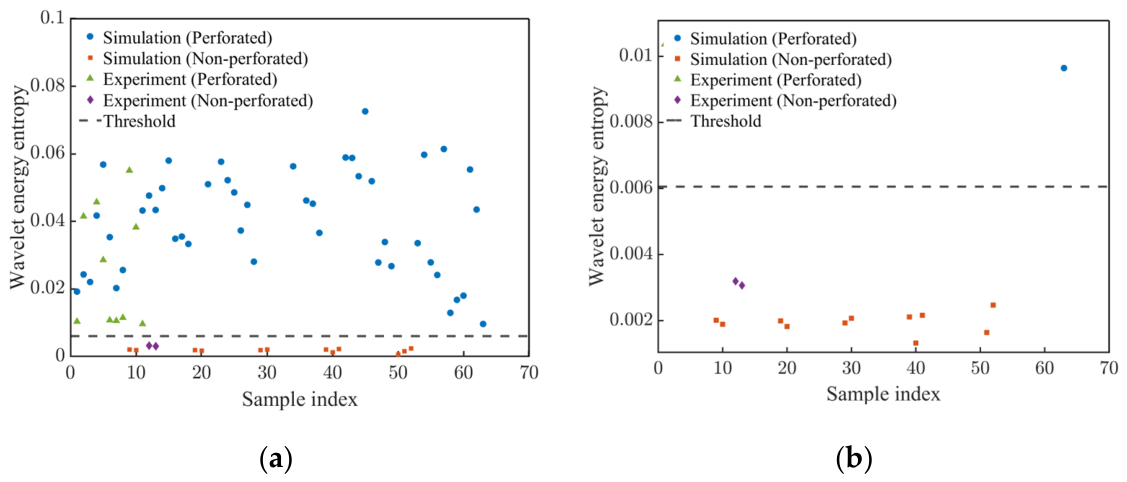
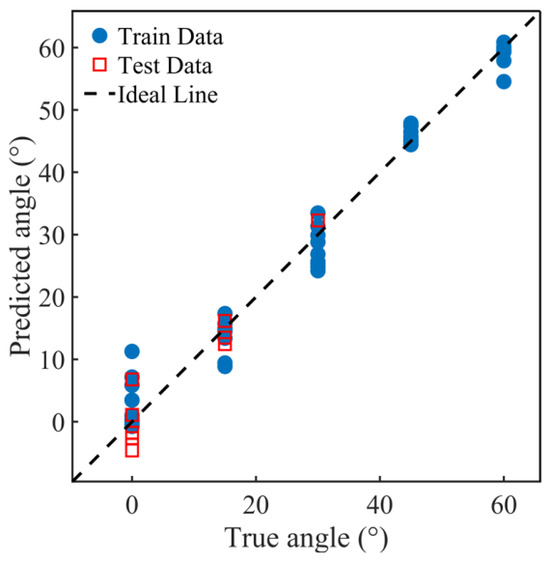
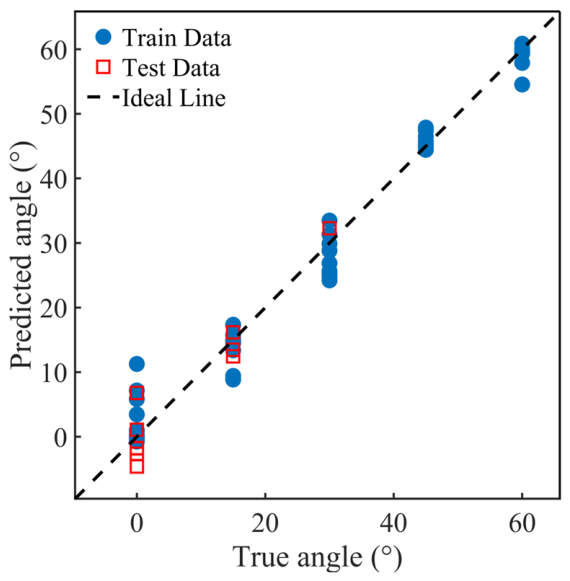
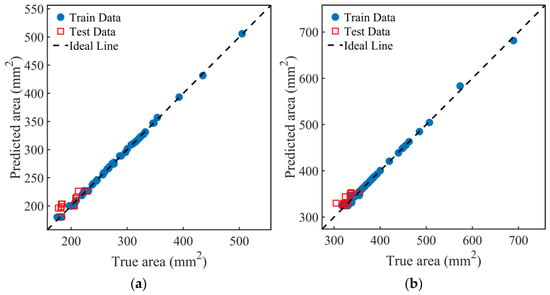
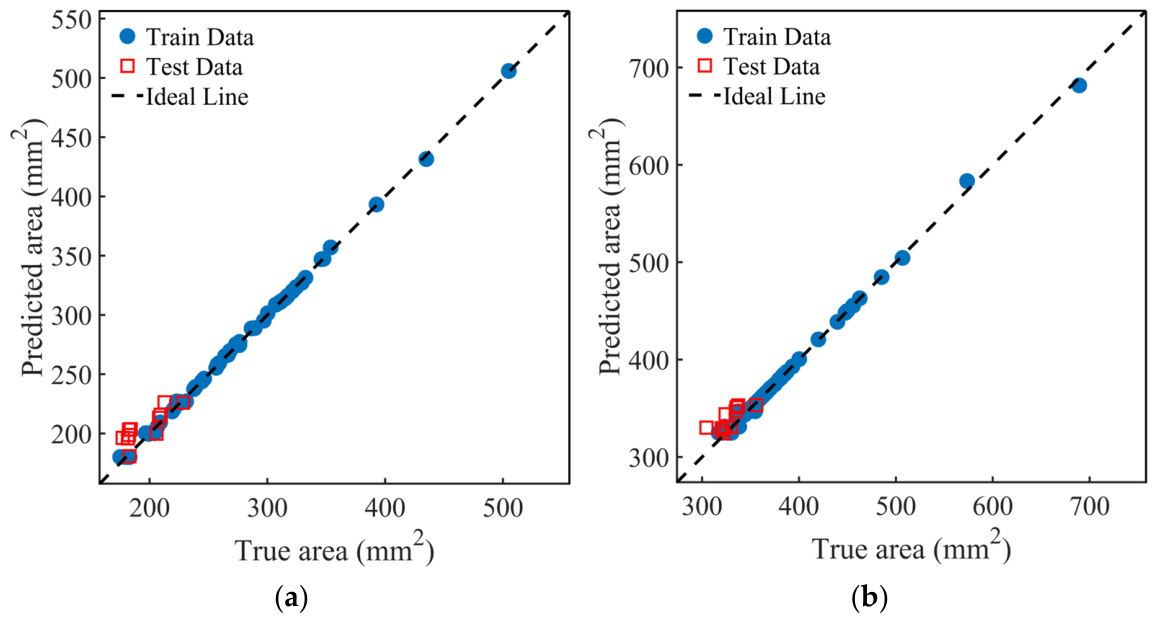

Disclaimer/Publisher’s Note: The statements, opinions and data contained in all publications are solely those of the individual author(s) and contributor(s) and not of MDPI and/or the editor(s). MDPI and/or the editor(s) disclaim responsibility for any injury to people or property resulting from any ideas, methods, instructions or products referred to in the content. |
© 2026 by the authors. Licensee MDPI, Basel, Switzerland. This article is an open access article distributed under the terms and conditions of the Creative Commons Attribution (CC BY) license.