


Abstract
To resolve the fatigue fracture occurring at the tip trailing edge of thin-walled single-crystal turbine rotor blades for a specific aero-engine, this paper derives the relationship between the single-crystal constitutive stiffness matrix and crystal orientation, and clarifies the influence mechanism of crystal orientation on blade-vibration characteristics. The influence rules and degrees of uncertain parameters on the vibration characteristics of thin-walled and thickened-profile blades are comparatively investigated. The results reveal that blade dynamic frequency is strongly affected by both blade profile thickness and crystal orientation, and blade profile optimization can effectively weaken the effects of crystal orientation and blade thickness on the dynamic frequency of critical modes. Based on the above results, the hazardous resonance overlooked in conventional engineering approaches is detected using uncertainty-based vibration analysis. The corresponding failure mechanism is illustrated, the resonant speed range is determined, and the risk of bending–torsion coupled flutter is detected. The outcomes provide valuable guidance for the frequency tuning design of turbine blades.
1. Introduction
Turbine blades are the critical components responsible for thermal-to-mechanical energy conversion in aero-engines. Their performance ceiling determines the overall engine performance and serves as a critical safety barrier, since their failure directly threatens flight safety. Operating under extreme conditions of high temperature, high rotational speed and intense aerodynamic excitation, turbine blades exhibit a substantially higher risk of resonance-induced failure than other components. Resonance often induces large vibratory stresses, which can readily lead to blade fracture, engine shutdown, or even catastrophic accidents [1]. The pursuit of high efficiency and light weight in advanced aero-engines is driving blade design toward thin-walled configurations, further elevating the risk of resonance-induced fracture [2,3].
Owing to the orthotropic nature of single-crystal (SC) materials, deviations in crystal-orientation directly alter the stiffness distribution of the entire blade, thereby modifying its stress state and vibration characteristics. SC turbine blades are typically fabricated via the helical grain selection (HGS) casting process, which inevitably introduces random crystal orientation deviations. In general, the primary orientation deviation is constrained within a 15° cone whose axis coincides with the designed crystal orientation, whereas the secondary orientation is randomly distributed [4,5]. Large variations in crystal orientation, wide casting-thickness tolerances, and material property scatter together produce substantial frequency scatter in thin-walled SC turbine blades; this broadens the resonance speed range, increases the resonance risk, complicates resonance-avoidance design, and alters adjacent frequency separations, potentially exacerbating the risk of bending–torsion coupled flutter.
Numerous studies have investigated the effect of crystal orientation on the vibration characteristics of SC turbine blades [6,7]. Wen et al. [8] systematically quantified crystal orientation and examined its influence on the vibration frequencies of DD6 turbine blades, finding that primary orientation deviation significantly affects both low-order and high-order frequencies: constraining the primary deviation within 10° limits frequency fluctuation to within 4%, whereas random secondary deviation mainly influences high-order frequencies, with variations below 2.5% for modes below the sixth order. Using lotus-leaf diagrams, Zhao et al. [9] revealed the influence of orientation on dynamic frequency, showing that the first-order bending and sixth-order torsion frequencies fluctuate markedly and that orientation deviation may reduce the resonance margin to below 10%. Li et al. [10] investigated the coupled effect of crystal orientation on elastic stress and vibration characteristics, noting that identifying an optimal orientation range that balances both remains challenging. Henderson et al. [11] examined the influence of crystal orientation on the thermomechanical fatigue (TMF) behavior of the novel SC superalloy STAL-15, demonstrating that the elastic stiffness along the loading direction dominates TMF life, with the <001> orientation exhibiting the lowest stiffness and the longest life. Kaneko [12] compared the natural frequency scatter among SC, directionally solidified (DS), and conventionally cast (CC) blades via sensitivity analysis, showing that SC and DS blades exhibit twice the frequency scatter of CC blades owing to anisotropy and orientation deviation, which must therefore be incorporated into mistuning design. Manetti et al. [6] studied the first-stage blade of the second-generation SC alloy René N5, reporting that constraining the primary orientation deviation within 7.5° limits frequency fluctuation to below 4%. With respect to thickness effects, an early NASA report [13] emphasized that vibration analysis must account for blade dimensional tolerance bands, including the extreme cases of maximum-root–minimum-tip and minimum-root–maximum-tip thickness combinations. Kabalyk et al. [3] reported that the resonance-induced high-cycle fatigue risk of titanium-alloy centrifugal compressor blades is governed by thickness and system damping; reducing the impeller thickness by 30% improves the aerodynamic flow capacity by ~10.7% but increases the fatigue risk, necessitating a trade-off between aerodynamic efficiency and structural safety. These studies confirm that crystal orientation and thickness significantly influence blade-vibration characteristics, but their effects vary with blade geometry. Comparative investigations between thin-walled and thickened-profile blades remain limited, and systematic failure-mechanism analyses incorporating real-world uncertainties are scarce.
Regarding bending–torsion coupled flutter, Schuff et al. [14] found that smaller frequency separation, lower mass ratio, and higher cascade solidity increase the coupled-flutter risk in linear compressor cascades, although the solidity effect contradicts findings reported by Clark et al. [15], likely owing to geometric differences. Kim et al. [16] developed anisotropic beam elements for the accurate calculation of modal frequencies in coupled blades. Lobitz et al. [17] reported that coupling reduces the flap–torsion frequency separation and thereby deteriorates aeroelastic stability. Although small frequency separation is known to promote flutter, the effect of crystal orientation on the bending–torsion frequency separation of SC blades remains underexplored, despite its engineering importance for flutter avoidance.
Uncertainty-based design is mainly divided into robust design [18] and reliability design [19]. The former aims to weaken the influence of parametric variations on structural responses, while the latter focuses on reducing the probability of structural failure. There are three primary approaches to characterizing uncertain variables, namely the probabilistic model, fuzzy model and convex model, based on which corresponding theoretical systems, including probabilistic reliability, fuzzy reliability and non-probabilistic reliability, have been established [20,21,22]. In uncertainty design, the linear growth in the number of uncertain variables leads to an increase in the dimensionality of the design space and an exponential surge in computational cost. By adopting the design of experiment (DOE) methods such as optimized Latin hypercube sampling and standard Latin hypercube sampling, a small yet reasonable set of sample points can be arranged for uncertain parameters [23]. Numerical models are solved exhaustively to obtain the structural responses at these sampling points. Surrogate models are then constructed via approximation techniques including neural networks, Kriging models and response surface methodology [24,25,26]. This workflow can drastically cut down computational expenses and facilitate sensitivity analysis and uncertainty quantification, as well as uncertainty optimization design. Given the lack of authentic probabilistic statistical data for the uncertain parameters of turbine blades, non-probabilistic interval parameters are adopted in this paper to quantify uncertainties. With regard to crystal-orientation parameters, full factorial design (FFD) featuring unbiased estimation is employed within affordable computational overhead to identify the most unfavorable parameter combinations in the densely sampled design space.
Motivated by the fracture occurring at the tip trailing edge of thin-walled SC turbine rotor blades, this paper investigates the failure process and fracture position, as well as macroscopic and microscopic fracture characteristics. This study theoretically establishes the explicit correlation between the SC constitutive stiffness matrix and crystal orientation and reveals how deviations in crystal orientation influence blade-vibration characteristics. Finite-element modal analyses are conducted on a high-fidelity three-dimensional blade model to investigate the effects of crystal orientation, airfoil thickness, [001] elastic modulus, [001] shear modulus, [001] Poisson’s ratio, density, and temperature on blade-vibration performance. The comparative effects of multi-source uncertain parameters on the vibration characteristics of thin-walled and thickened-profile blades are quantitatively investigated. The results indicate that airfoil optimization can effectively suppress the frequency sensitivity of critical modes induced by crystal-orientation deviation and airfoil-casting thickness deviation. The proposed uncertainty-based vibration analysis identifies the dangerous resonance overlooked in traditional design. The predicted resonant speed and maximum vibratory stress location show good consistency with the actual engine test speed and crack initiation positions of fractured blades. In addition, this work identifies potential risks of bending–torsion coupled flutter of thin-walled SC turbine blades. The present work addresses some restrictions within conventional design methods and provides valuable engineering guidance for frequency tuning and failure prevention of turbine blades.
2. Description of Blade Tip-Trailing-Edge Fracture
2.1. Failure Process and Macroscopic Fracture Analysis
During the first full-engine ground test of an aero-engine, after reaching idle speed, the engine was rapidly accelerated to 33,600 rpm (~90% of design speed) and operated stably for ~20 min before being decelerated and shut down. Two turbine blades failed during this run and are hereafter designated Blade 1 and Blade 2.
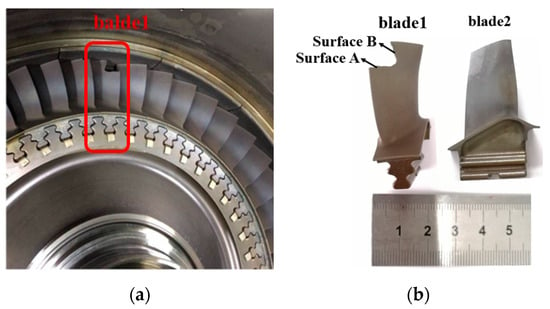
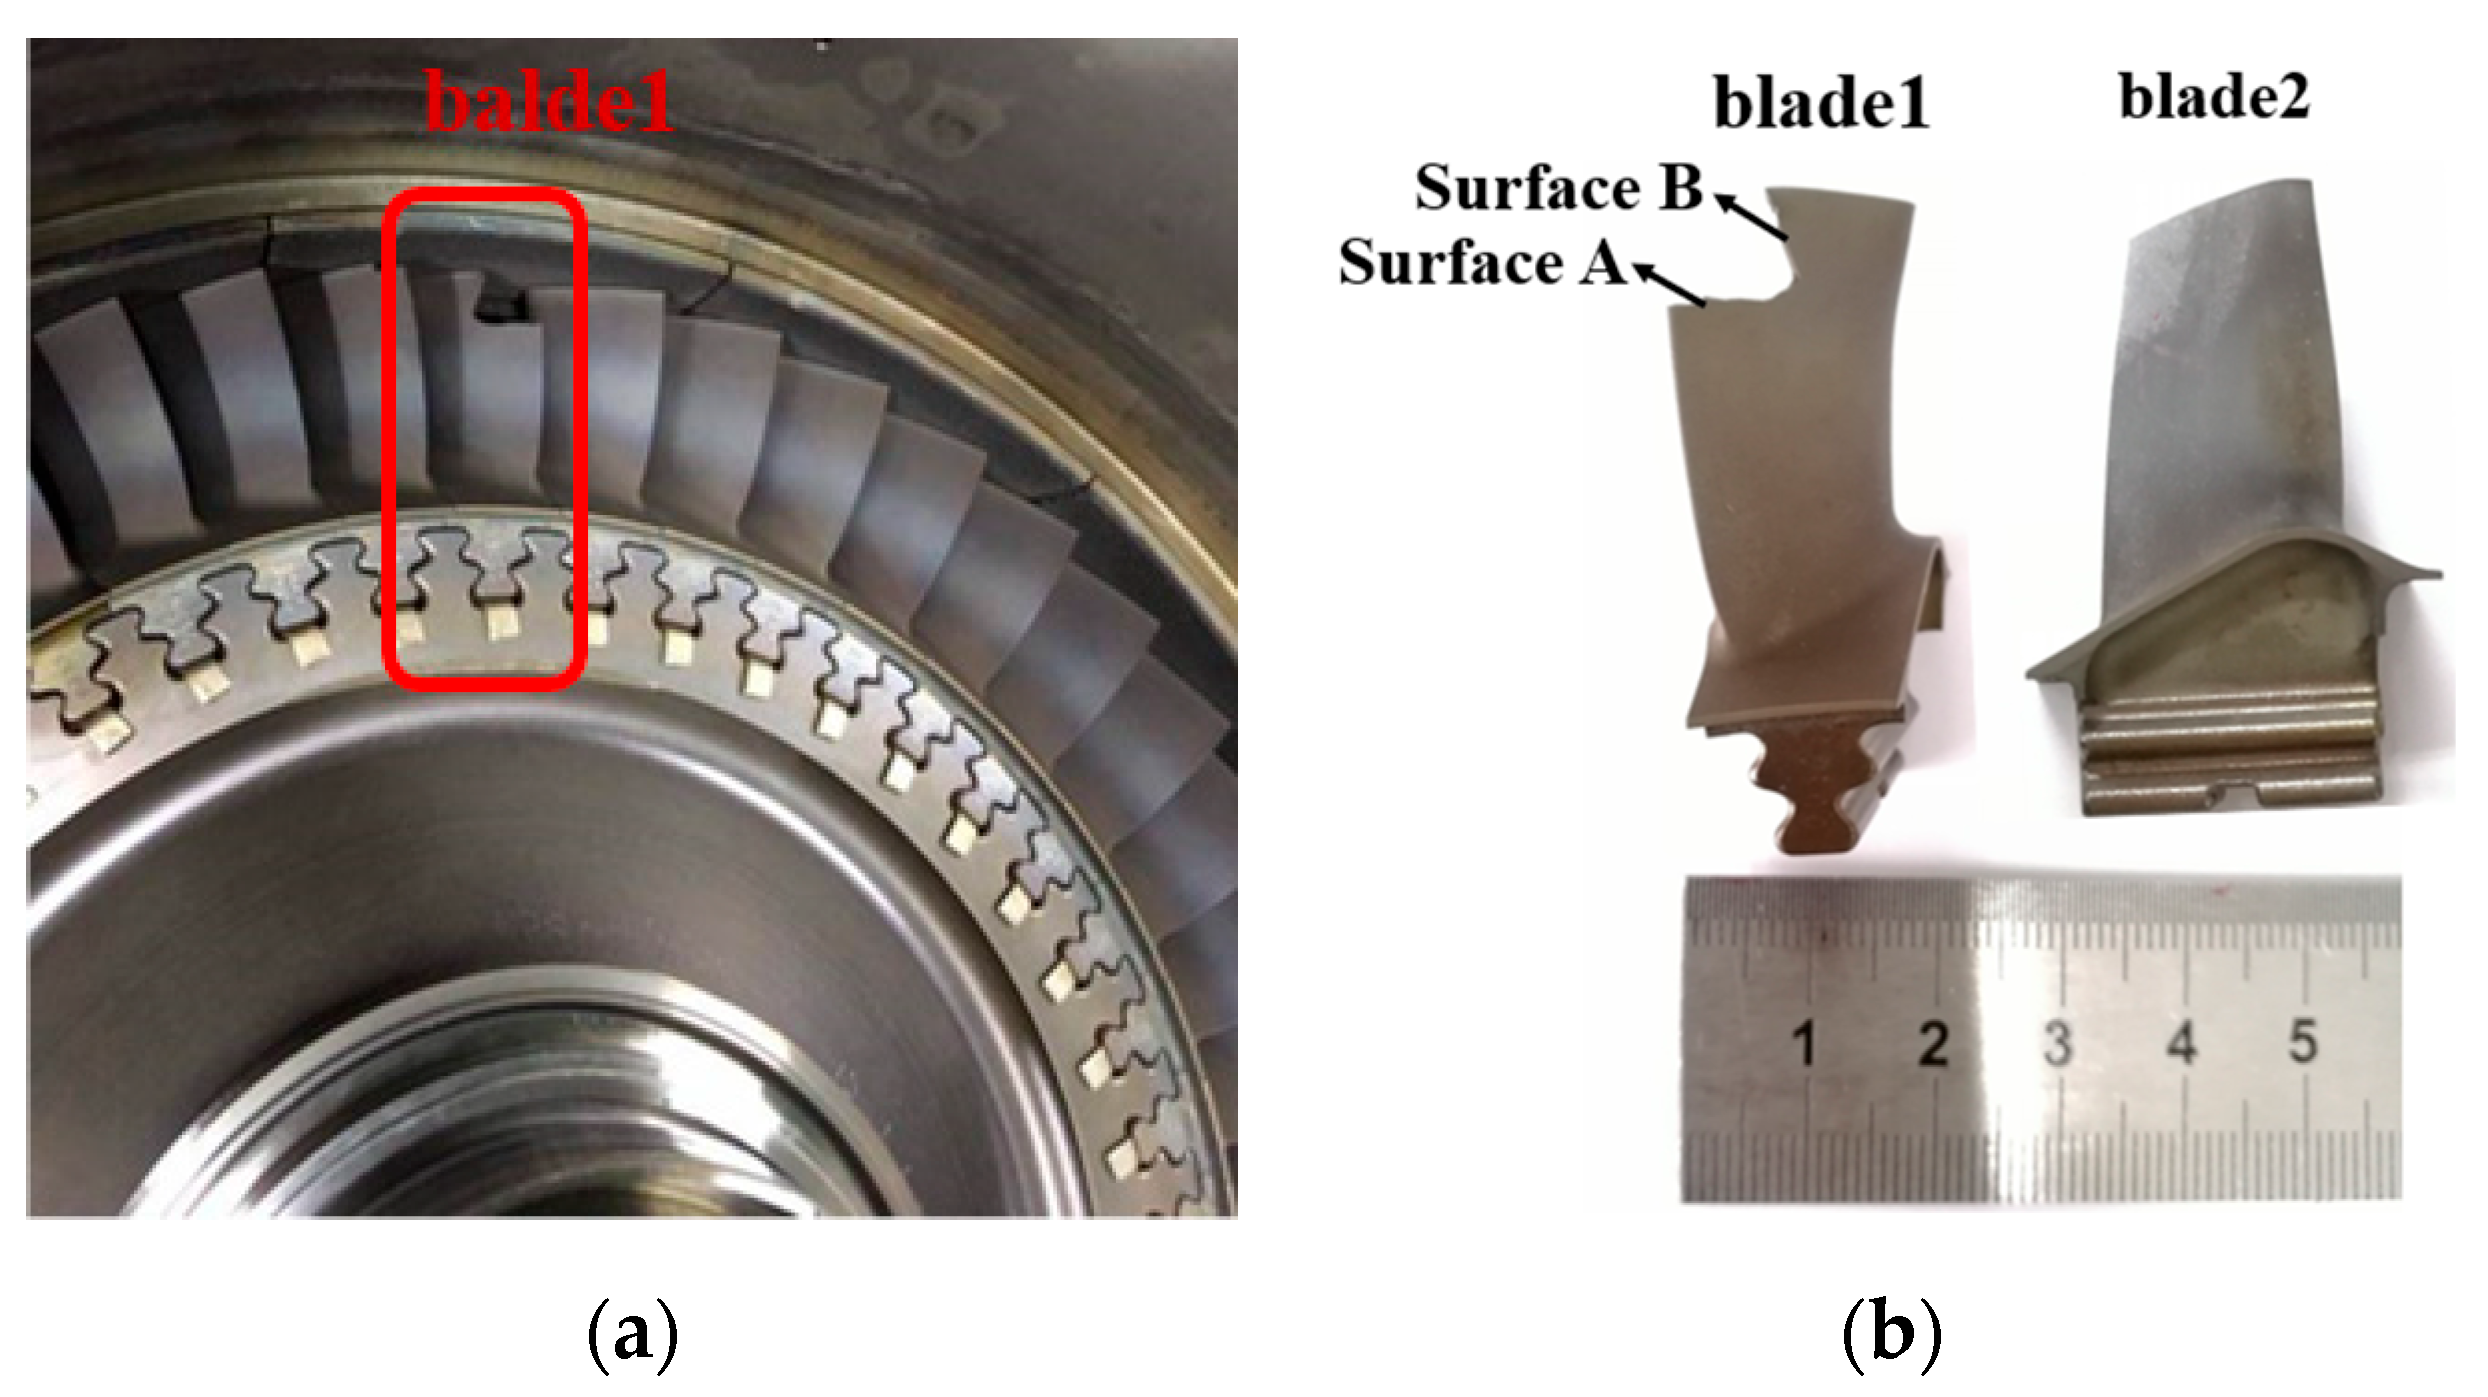
The turbine disk and blades exhibit a metallic-gray appearance, with a 20 mm wide grayish-white band on the midspan of the suction surface (Figure 1a). Blade 1 is enclosed in the red box, and Blade 2 is located 120° clockwise from Blade 1 (Figure 1b).
Figure 1.
Overall appearance: (a) turbine disk and blades; (b) fractured blades.
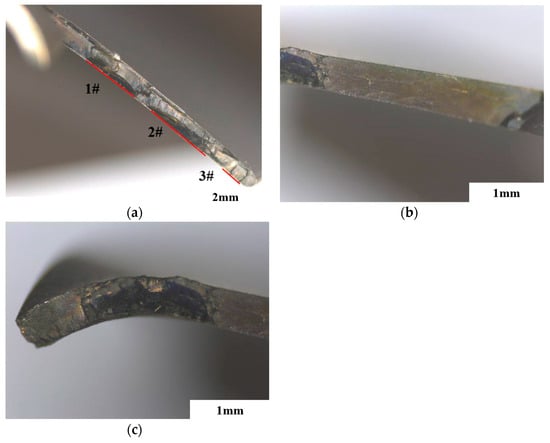
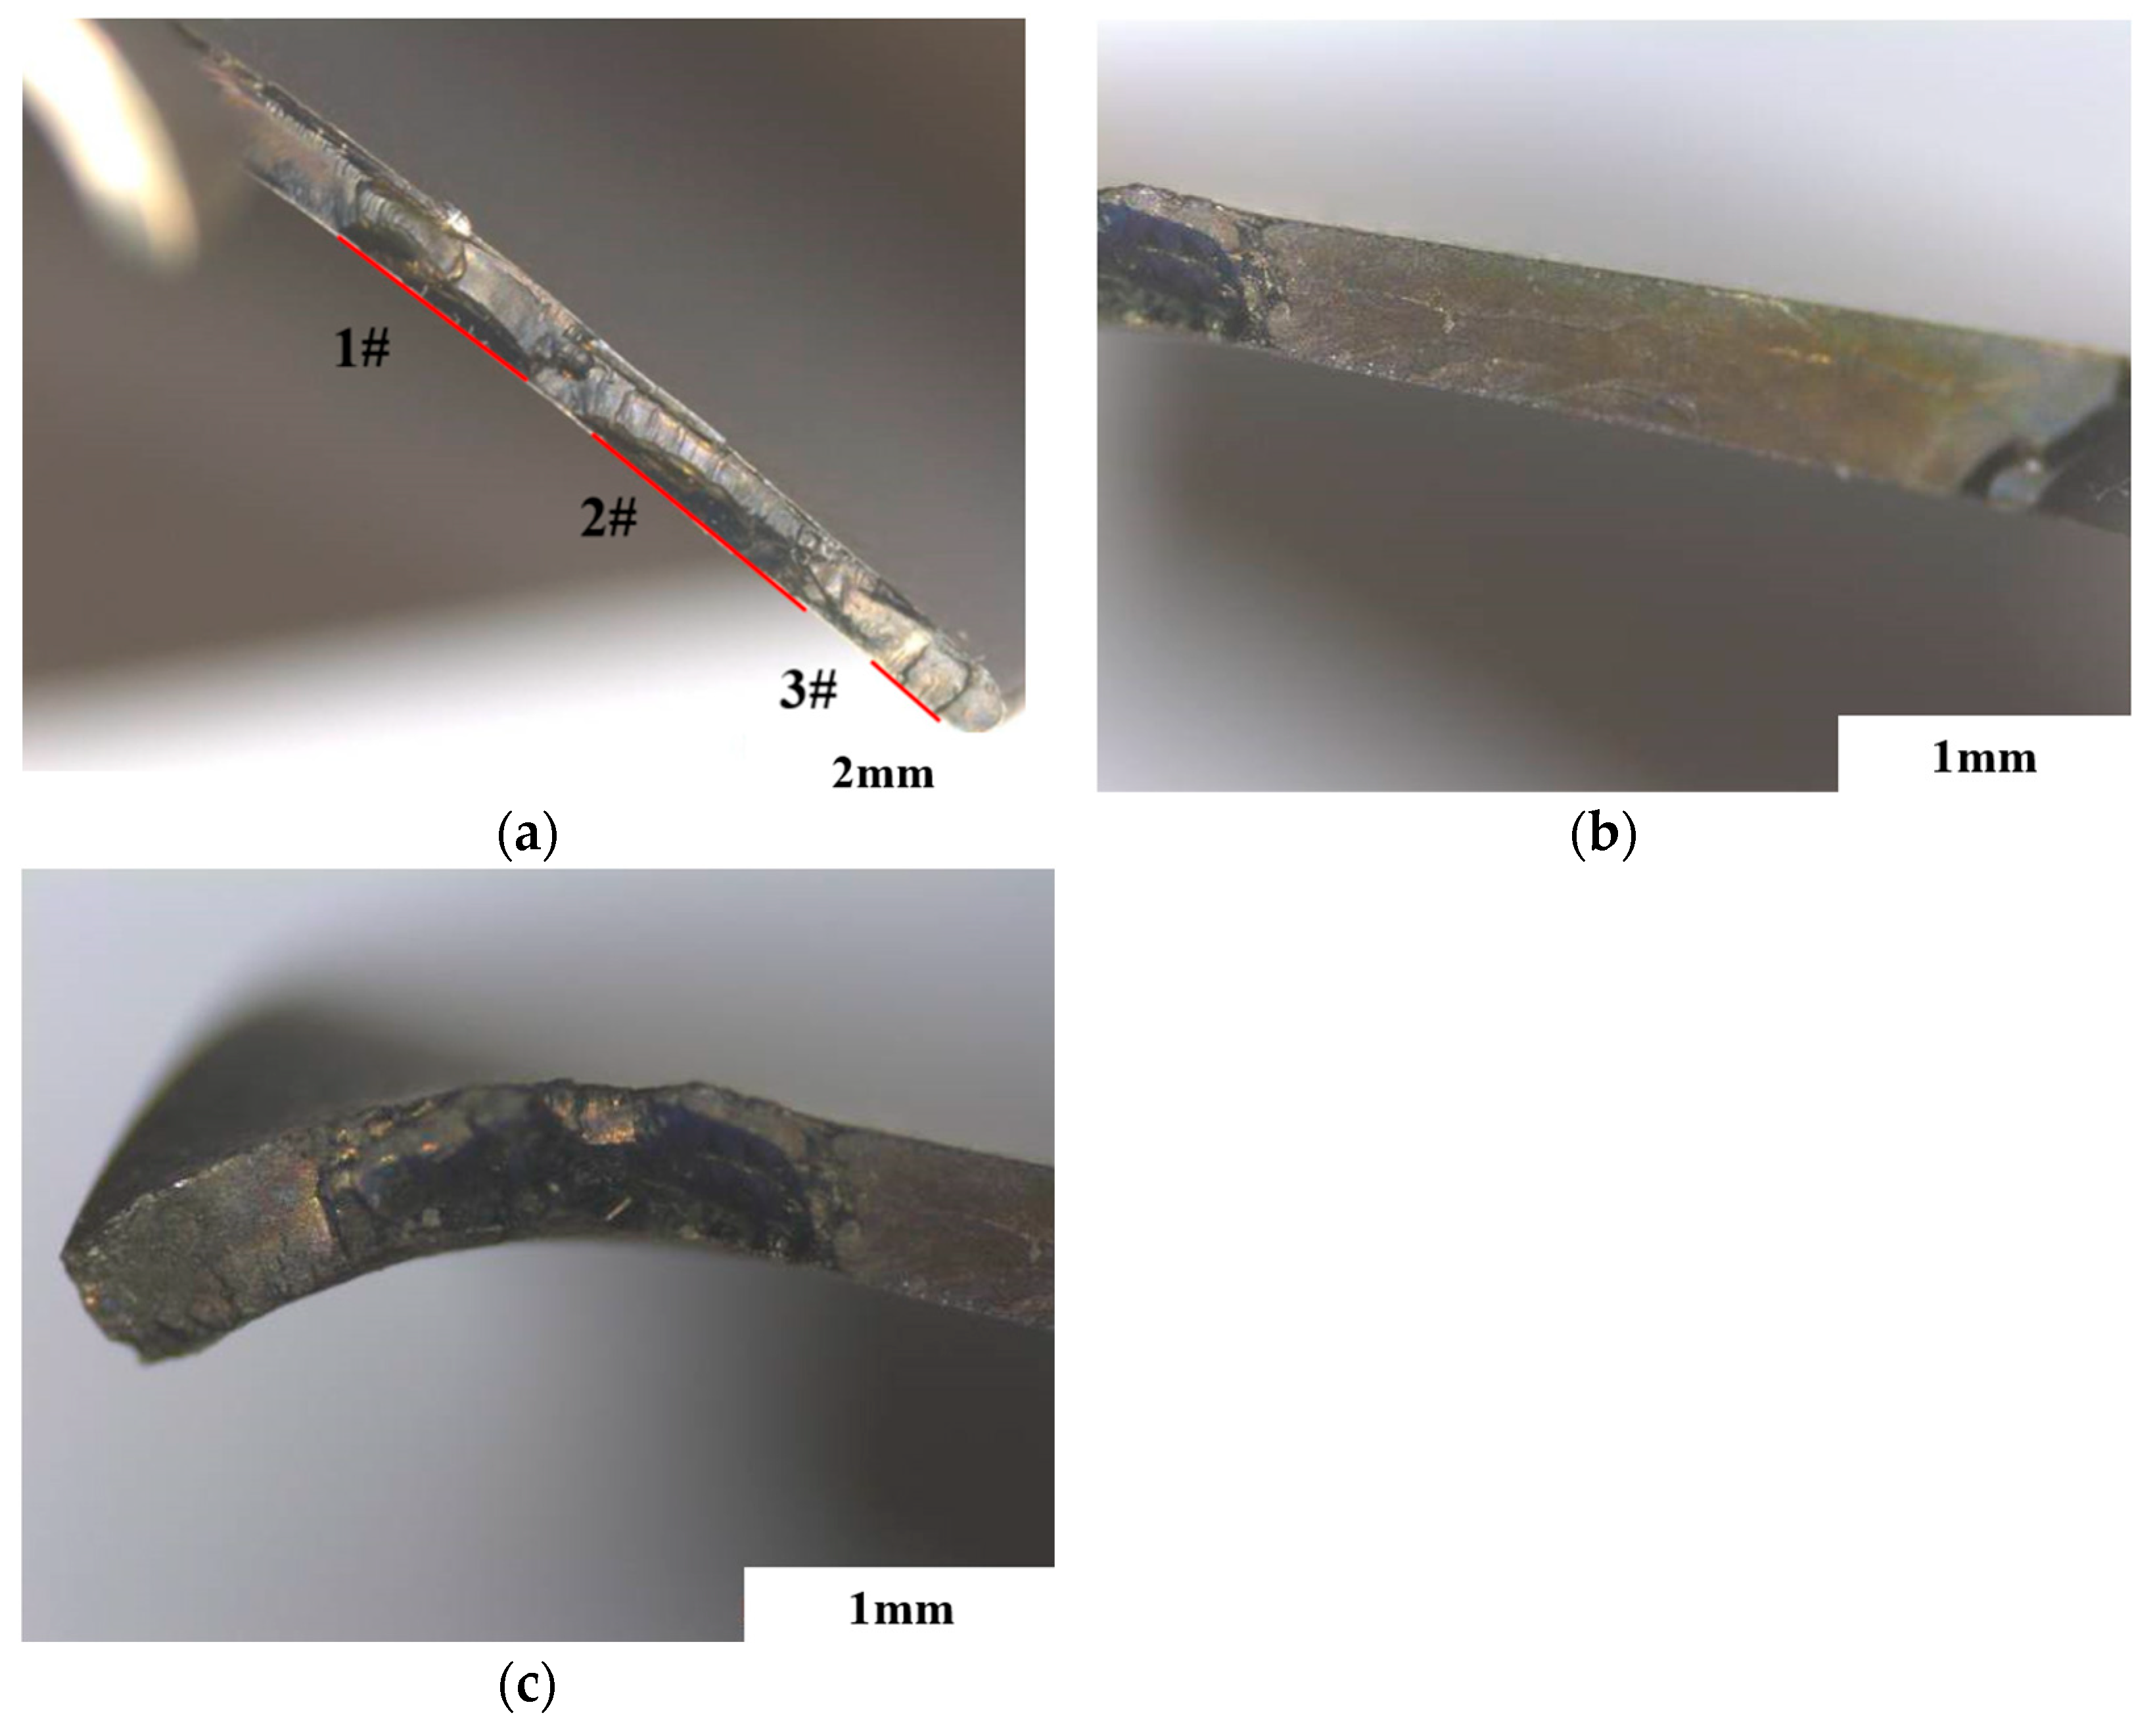
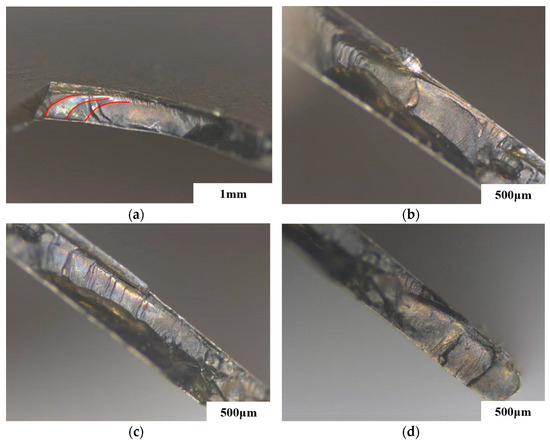
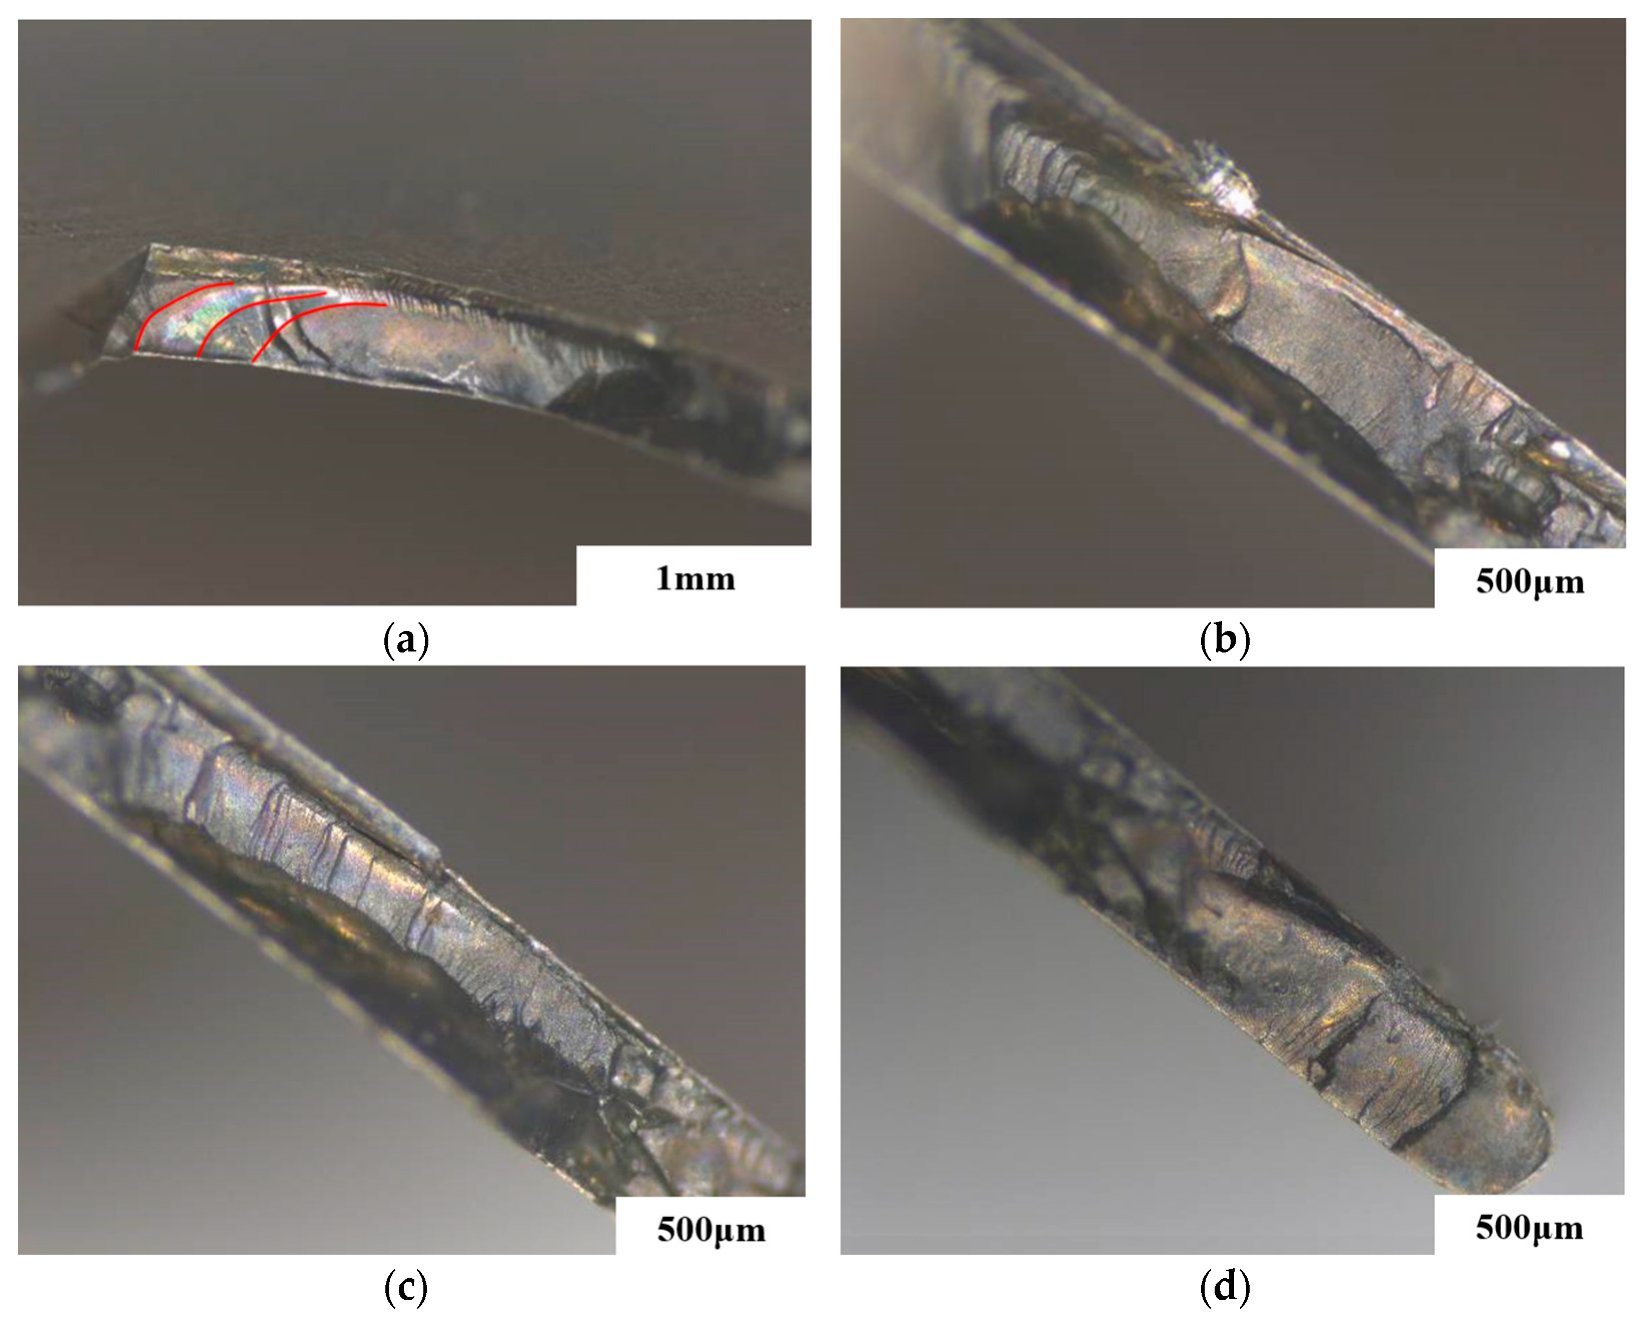
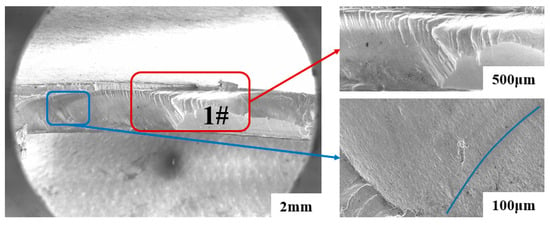
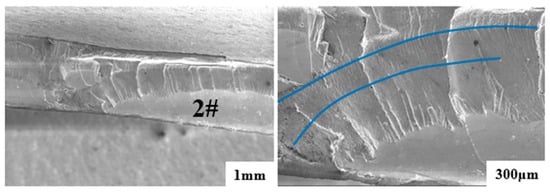
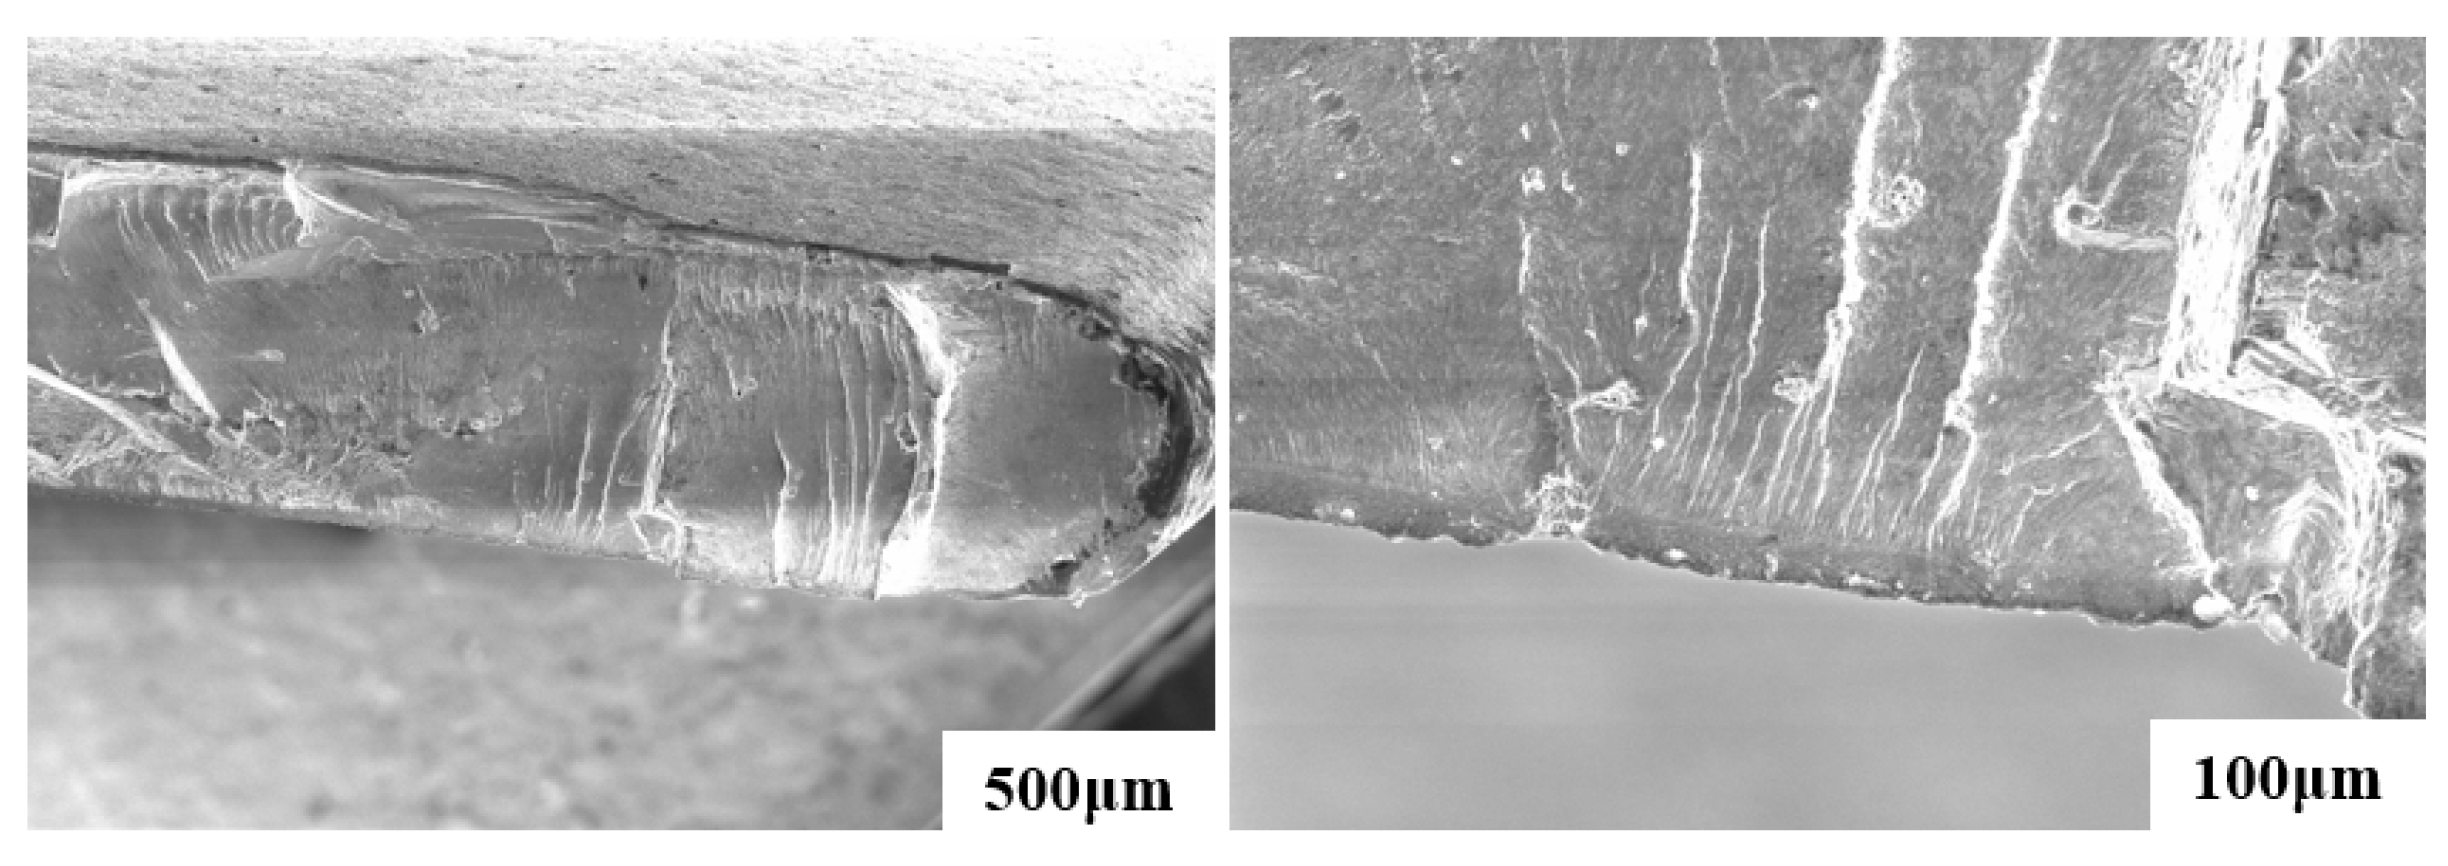
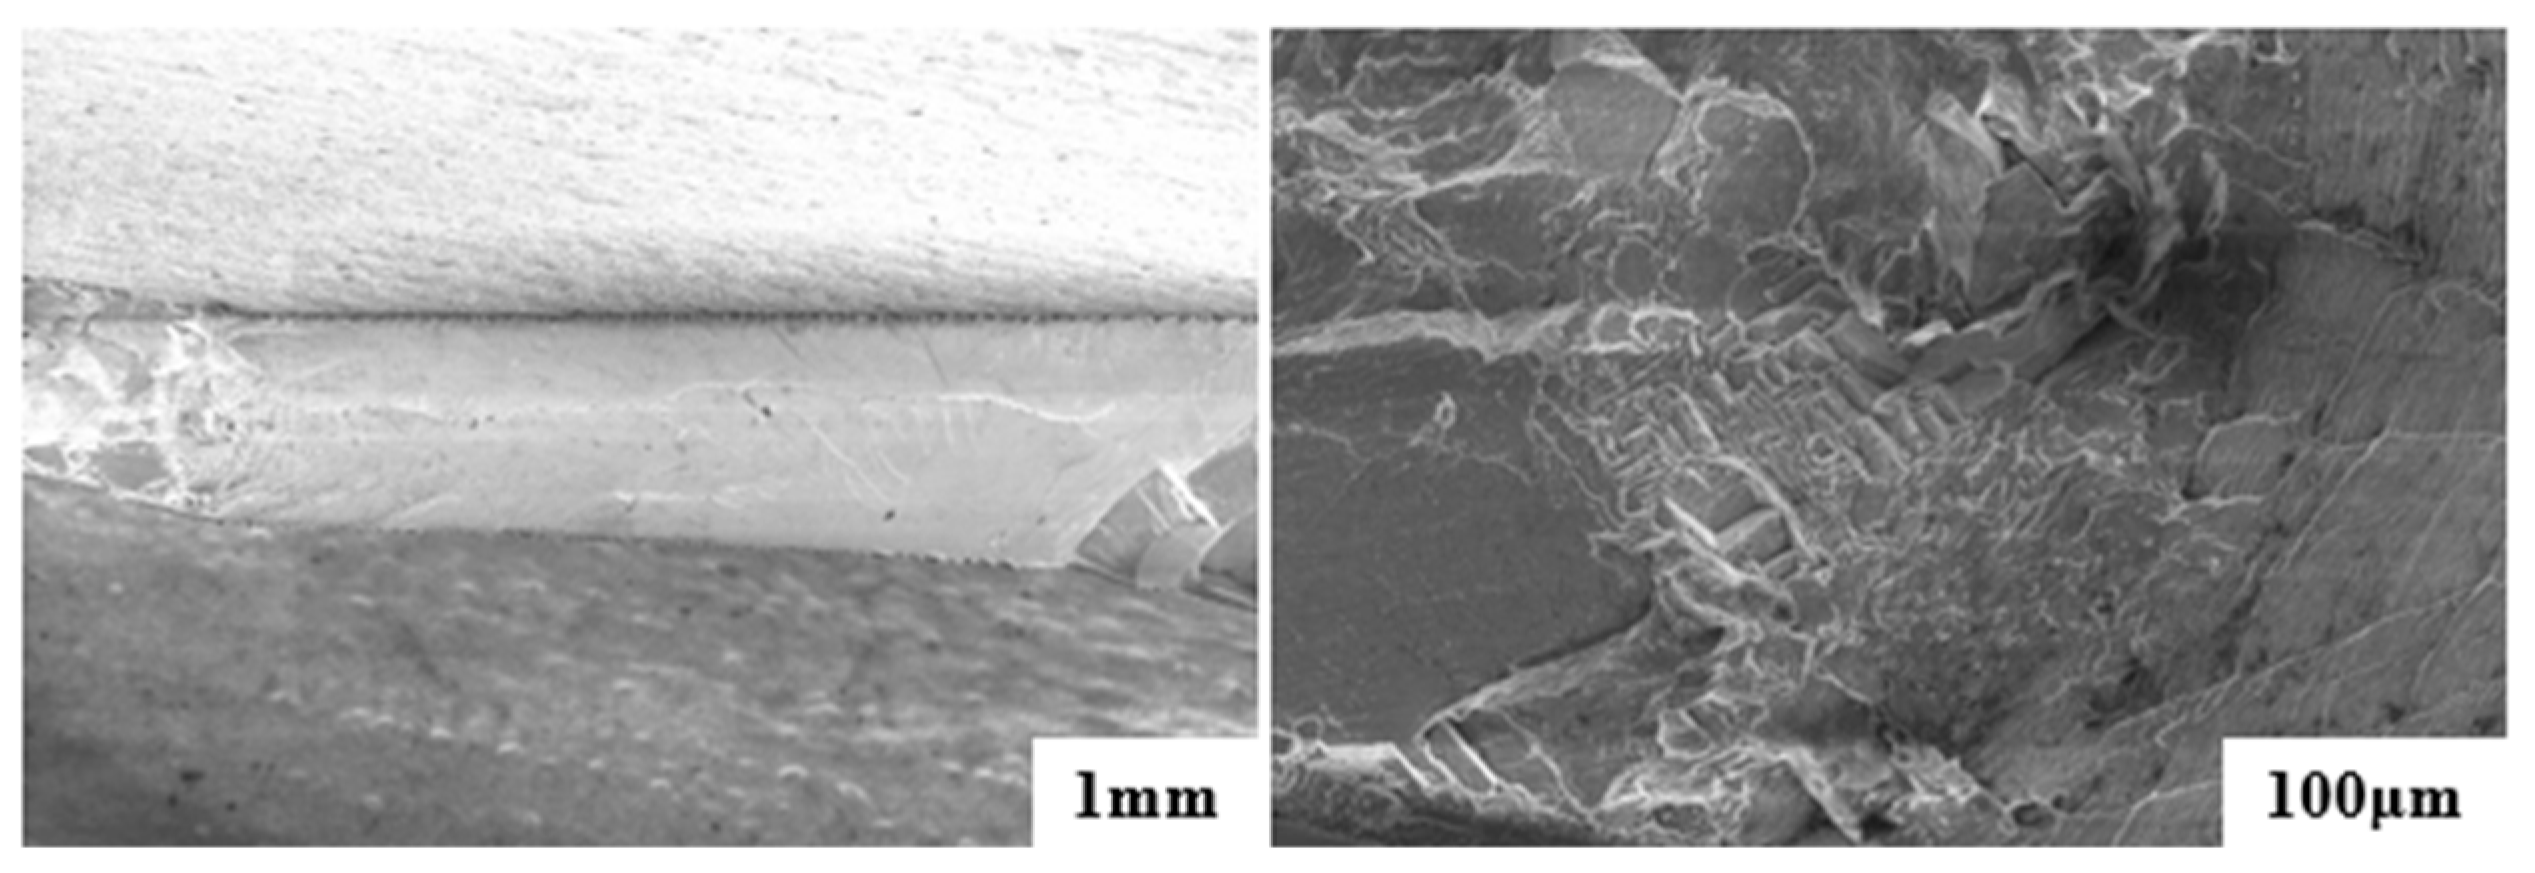
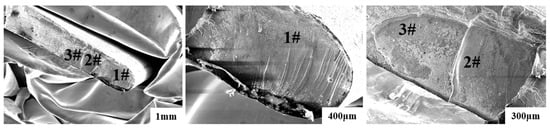
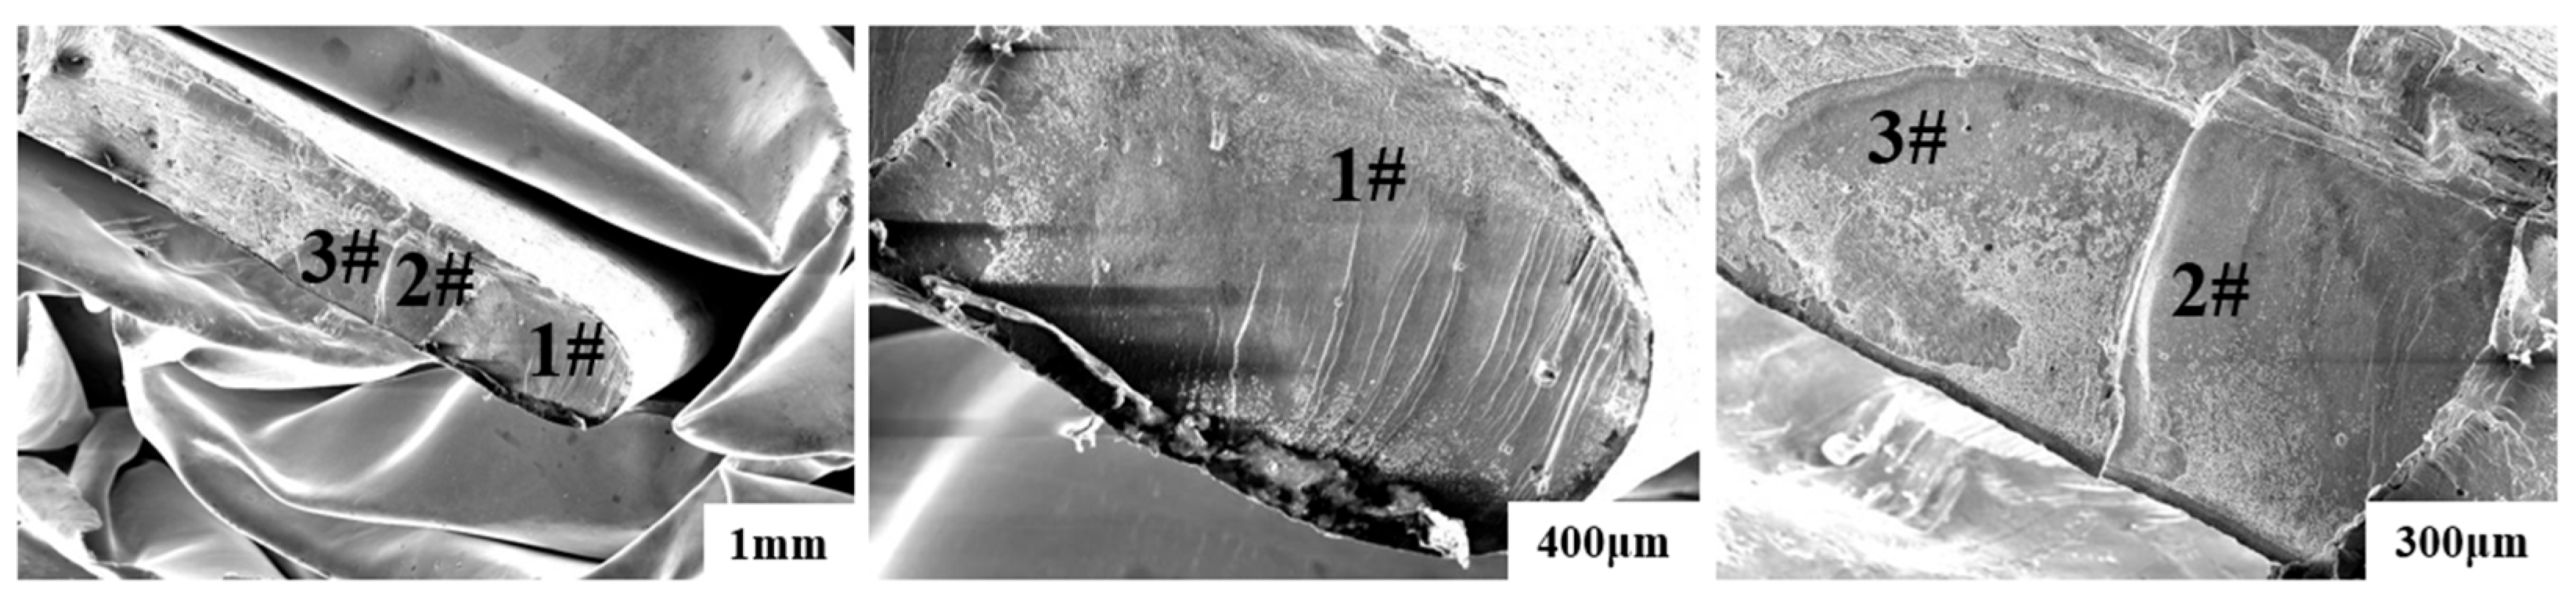
A quadrilateral material loss was observed at the tip trailing edge of Blade 1. This defect is about 35 mm away from the tenon base and measures 10 mm × 9 mm. The fracture surface is flat and exhibits multi-line crack-source characteristics. The cross-sectional surface is denoted Surface A and the vertical surface Surface B (Figure 1). Surface A contains three flat regions (1#, 2#, 3#) extending from the midspan to the trailing edge (Figure 2a). The 1# region shows purple/gold discoloration and beach marks, with a crack source on the pressure surface ~5 mm from the trailing edge. The 2# and 3# regions exhibit golden discoloration, beach marks and propagation ridges, with sources on the pressure surface ~5 mm from the trailing edge (Figure 3). Surface B contains no independent crack source; the ridges converge at the A–B junction, indicating that it is an extension of the 1# fatigue zone (Figure 2b). The final fracture zone is rough in morphology (Figure 2c).
Figure 2.
Macroscopic fracture morphology: (a) flat regions (1#, 2#, 3# of Surface A); (b) rapid propagation zone (Surface B); and (c) final fracture zone (Surface B).
Figure 3.
Low magnification morphology of Surface A: (a) beach marks in 1# region shown by the red lines; (b) source in 1# region; (c) source and ridges in 2# region; and (d) source and radial ridges in 3# region.
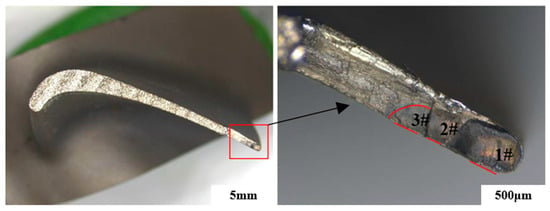
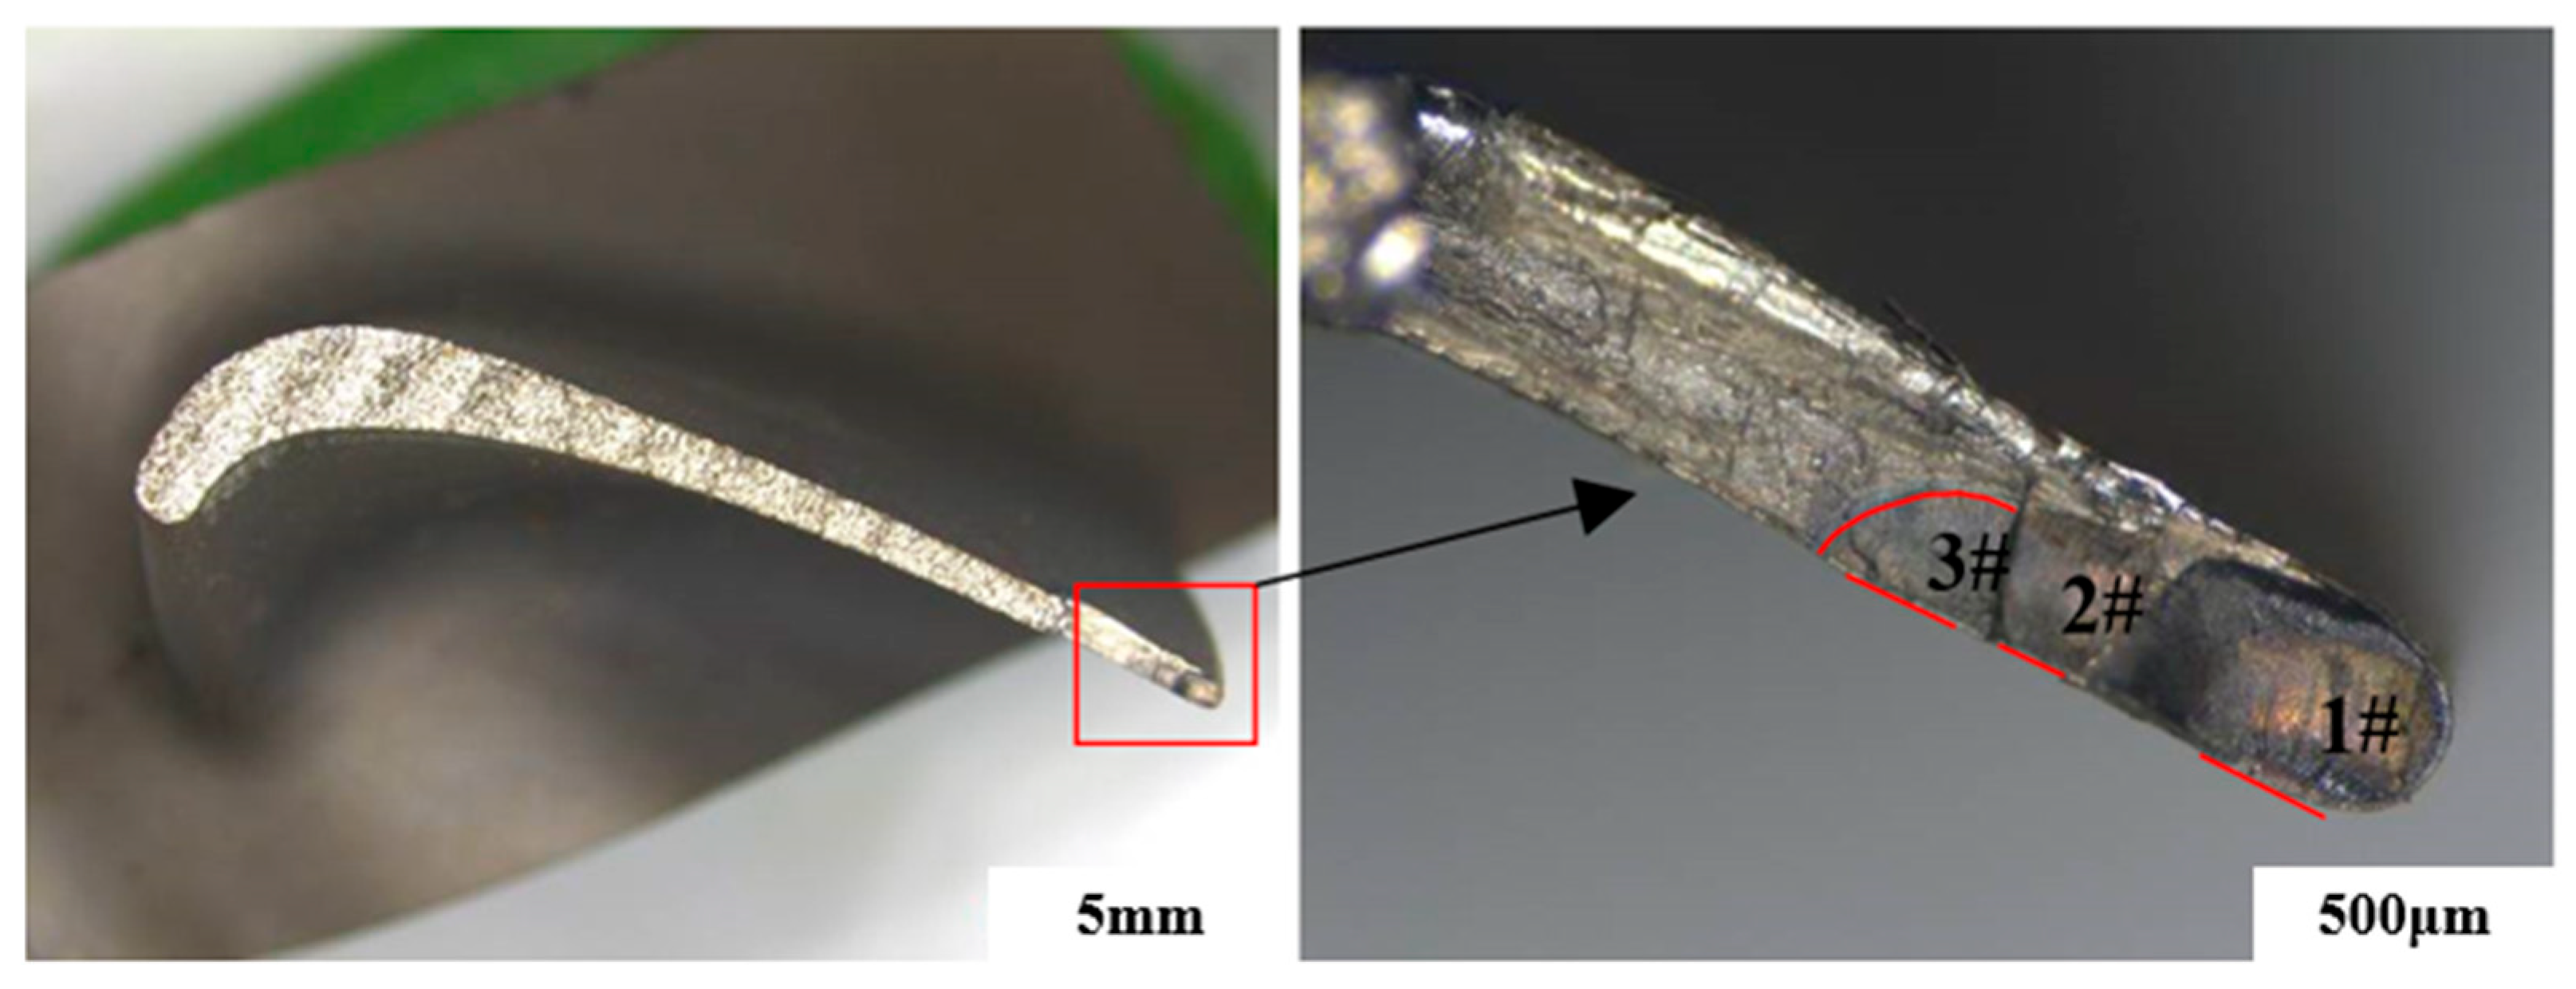
Fluorescent penetrant inspection revealed a microcrack on the trailing edge of Blade 2, 8.5 mm from the tip. Manual opening of the crack indicated multi-source initiation on the pressure surface and propagation toward the suction surface. Three flat regions (1#, 2#, 3#) were identified: the 2# and 3# regions display dark-yellow discoloration with beach marks, while the 1# region shows yellow/purple discoloration and radial ridges converging at the pressure surface, indicating full penetration. Both blades exhibit identical fatigue failure features accompanied by high-temperature discoloration (Figure 4).
Figure 4.
Cross section and macroscopic fracture morphology of Blade 2 crack.
2.2. Microscopic Fracture Analysis
The crack in Blade 1 initiates on the pressure surface and propagates toward the suction surface, exhibiting distinct fatigue striations (blue arcs in Figure 5 and Figure 6). The source of the 3# fatigue zone lies at the free surface and lacks typical striations (Figure 7). No metallurgical defects or machining damage were detected at any of the crack sources. Surface B displays radial ridges, and the final fracture zone reveals slip planes and dimples (Figure 8).
Figure 5.
Microscopic morphology of A 1# fatigue zone.
Figure 6.
Microscopic morphology of A 2# fatigue zone.
Figure 7.
Microscopic morphology of A 3# fatigue zone.
Figure 8.
Microscopic morphology of Surface B.
The crack sources in Blade 2 are also located on the pressure surface and are accompanied by fatigue striations and propagation ridges. The ridges within the 1# zone converge at the oxide-covered pressure surface, whereas the 2# and 3# zones initiate at the free surface (Figure 9).
Figure 9.
Microscopic morphology of Blade 2 fracture.
2.3. Supplementary Analysis
Further analyses—including crystal-orientation microstructure observation, porosity inspection, coating examination, hardness testing, and thermal-simulation tests—were performed on Blade 1 and Blade 2. The results are summarized as follows:
- (1)
- The γ’ phases in both blades retain a well-defined cubic morphology, and no signs of microstructural overheating or overburning are observed;
- (2)
- The casting porosity of both blades complies with the relevant standard requirements;
- (3)
- The coatings remain intact and free of cracks;
- (4)
- The blade hardness values meet the specification requirements;
- (5)
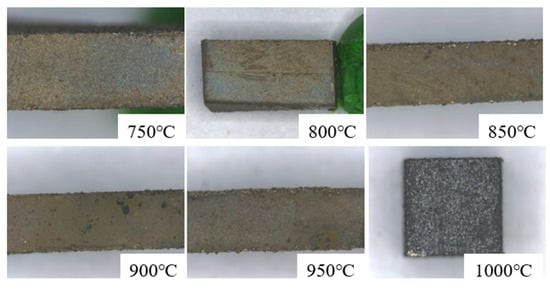
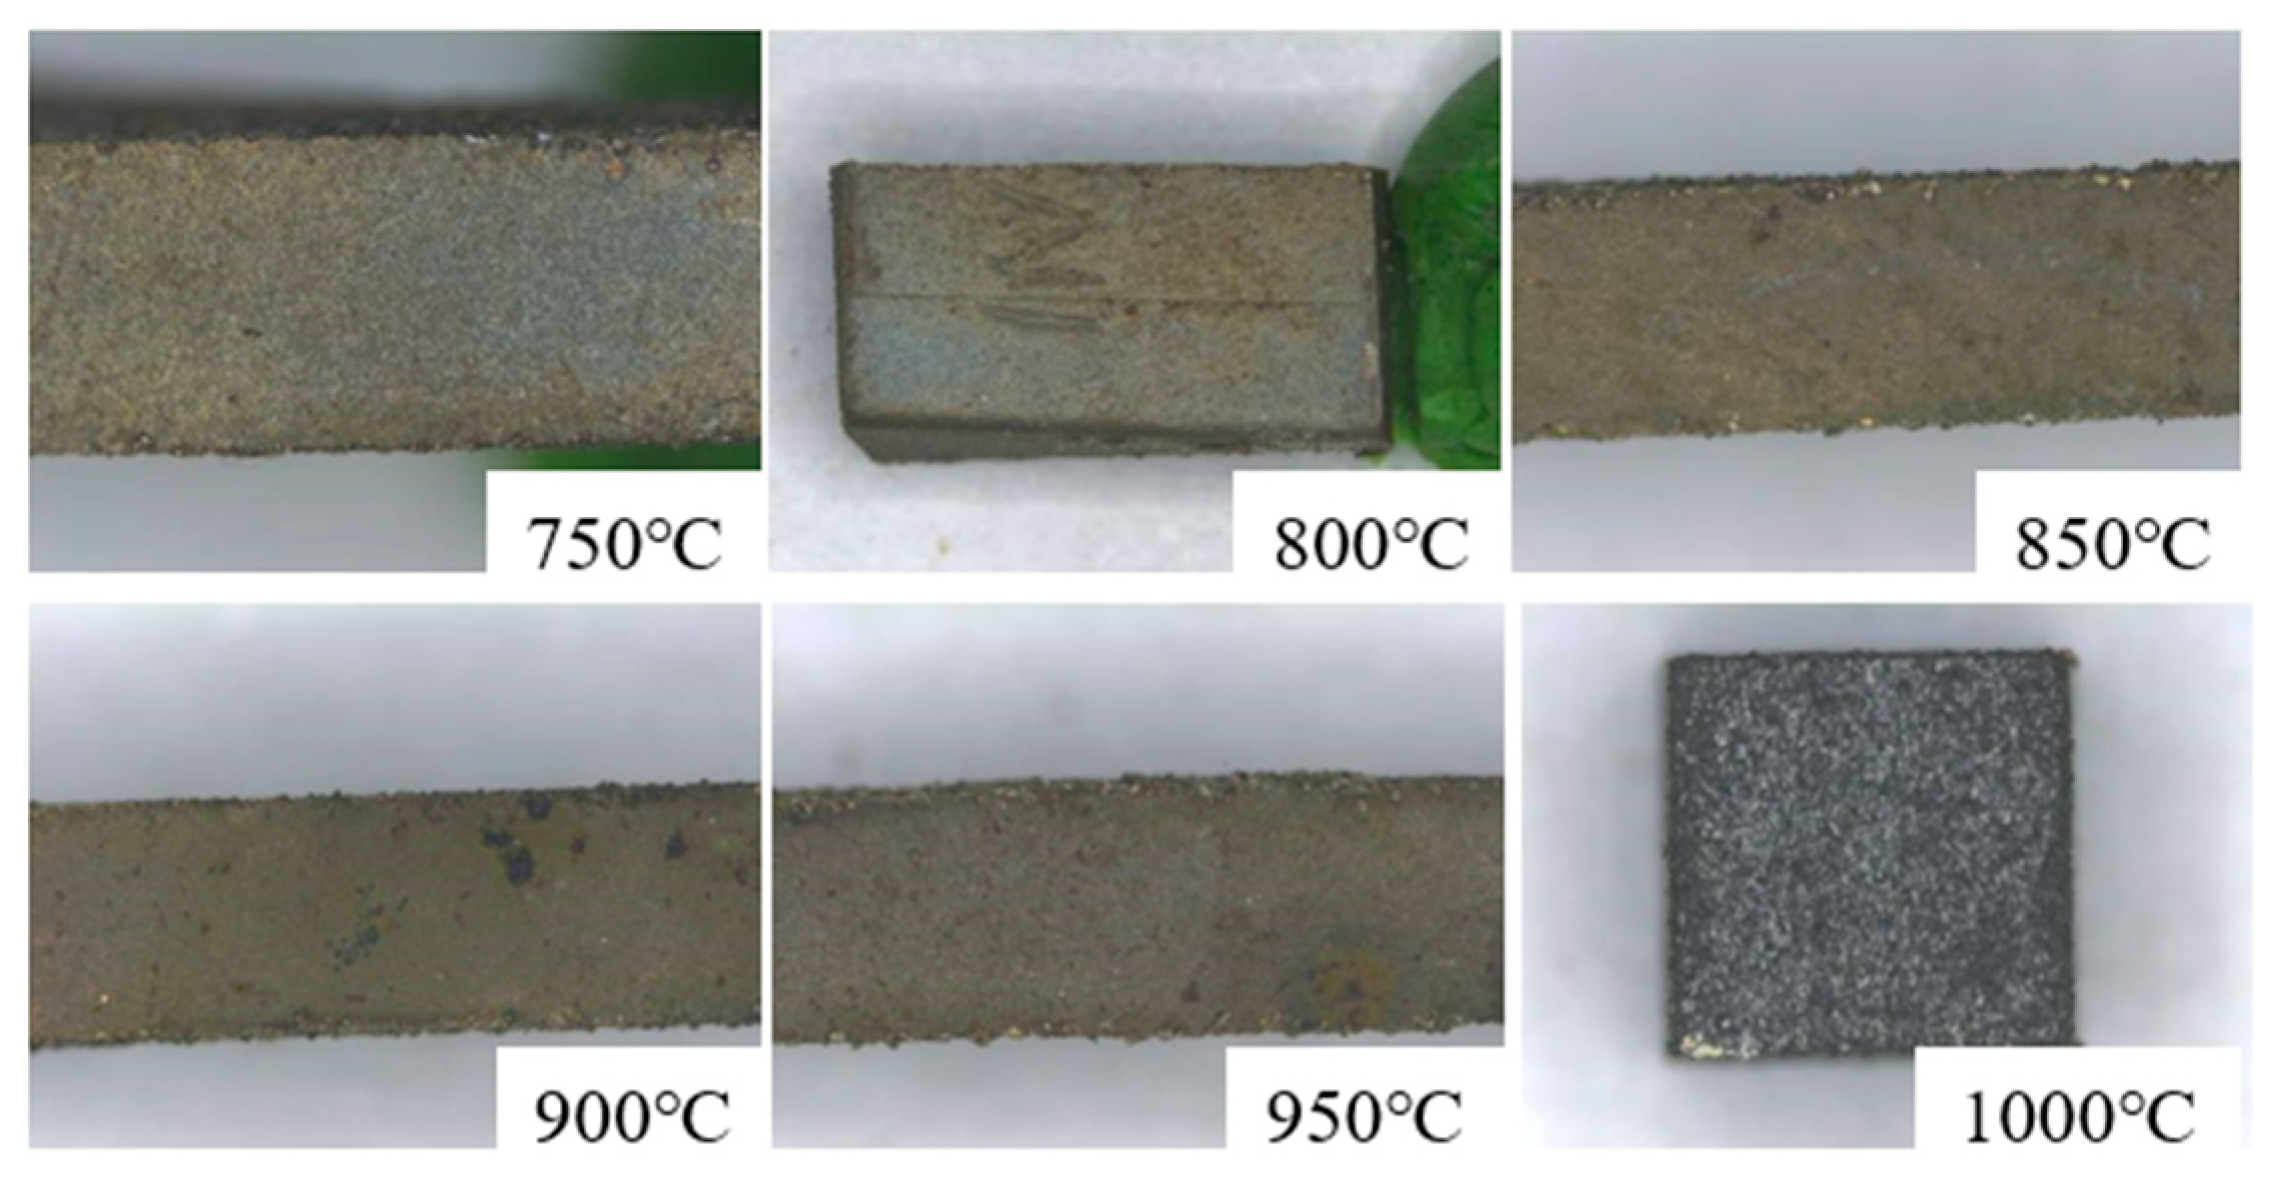
- After exposure at the simulated service operating temperature as shown in Figure 10, the color of the coated blade surfaces is consistent with that shown in Figure 1, indicating that no overtemperature service occurred.Figure 10. Surface colors of coated blades after 20 min exposure at 750–1000 °C.
In summary, fatigue fracture induced by defects originating from blade casting, machining, or coating preparation, as well as by service overtemperature, can be excluded.
2.4. Fracture Analysis Conclusions
The fracture analysis yields the following conclusions:
- (1)
- All crack initiation zones are situated 34–35 mm above the tenon base, and the crack sources are on the pressure surface, about 0.3–5 mm away from the trailing edge.
- (2)
- The crack sources exhibit linear initiation characteristics, and the cracks propagate toward the suction side during the early stage of propagation, confirming that the two blades suffered from identical failure modes.
- (3)
- Failure occurs at the same location on both blades with linear crack-initiation features, indicating that the blades were subjected to relatively high initial stress. Subsequent analysis attributes this primarily to severe vibratory stress.
3. Mechanism of Crystal Orientation on Vibration Characteristics
3.1. Definition and Description of Crystal Orientation
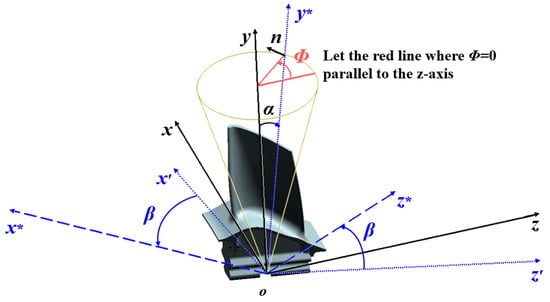
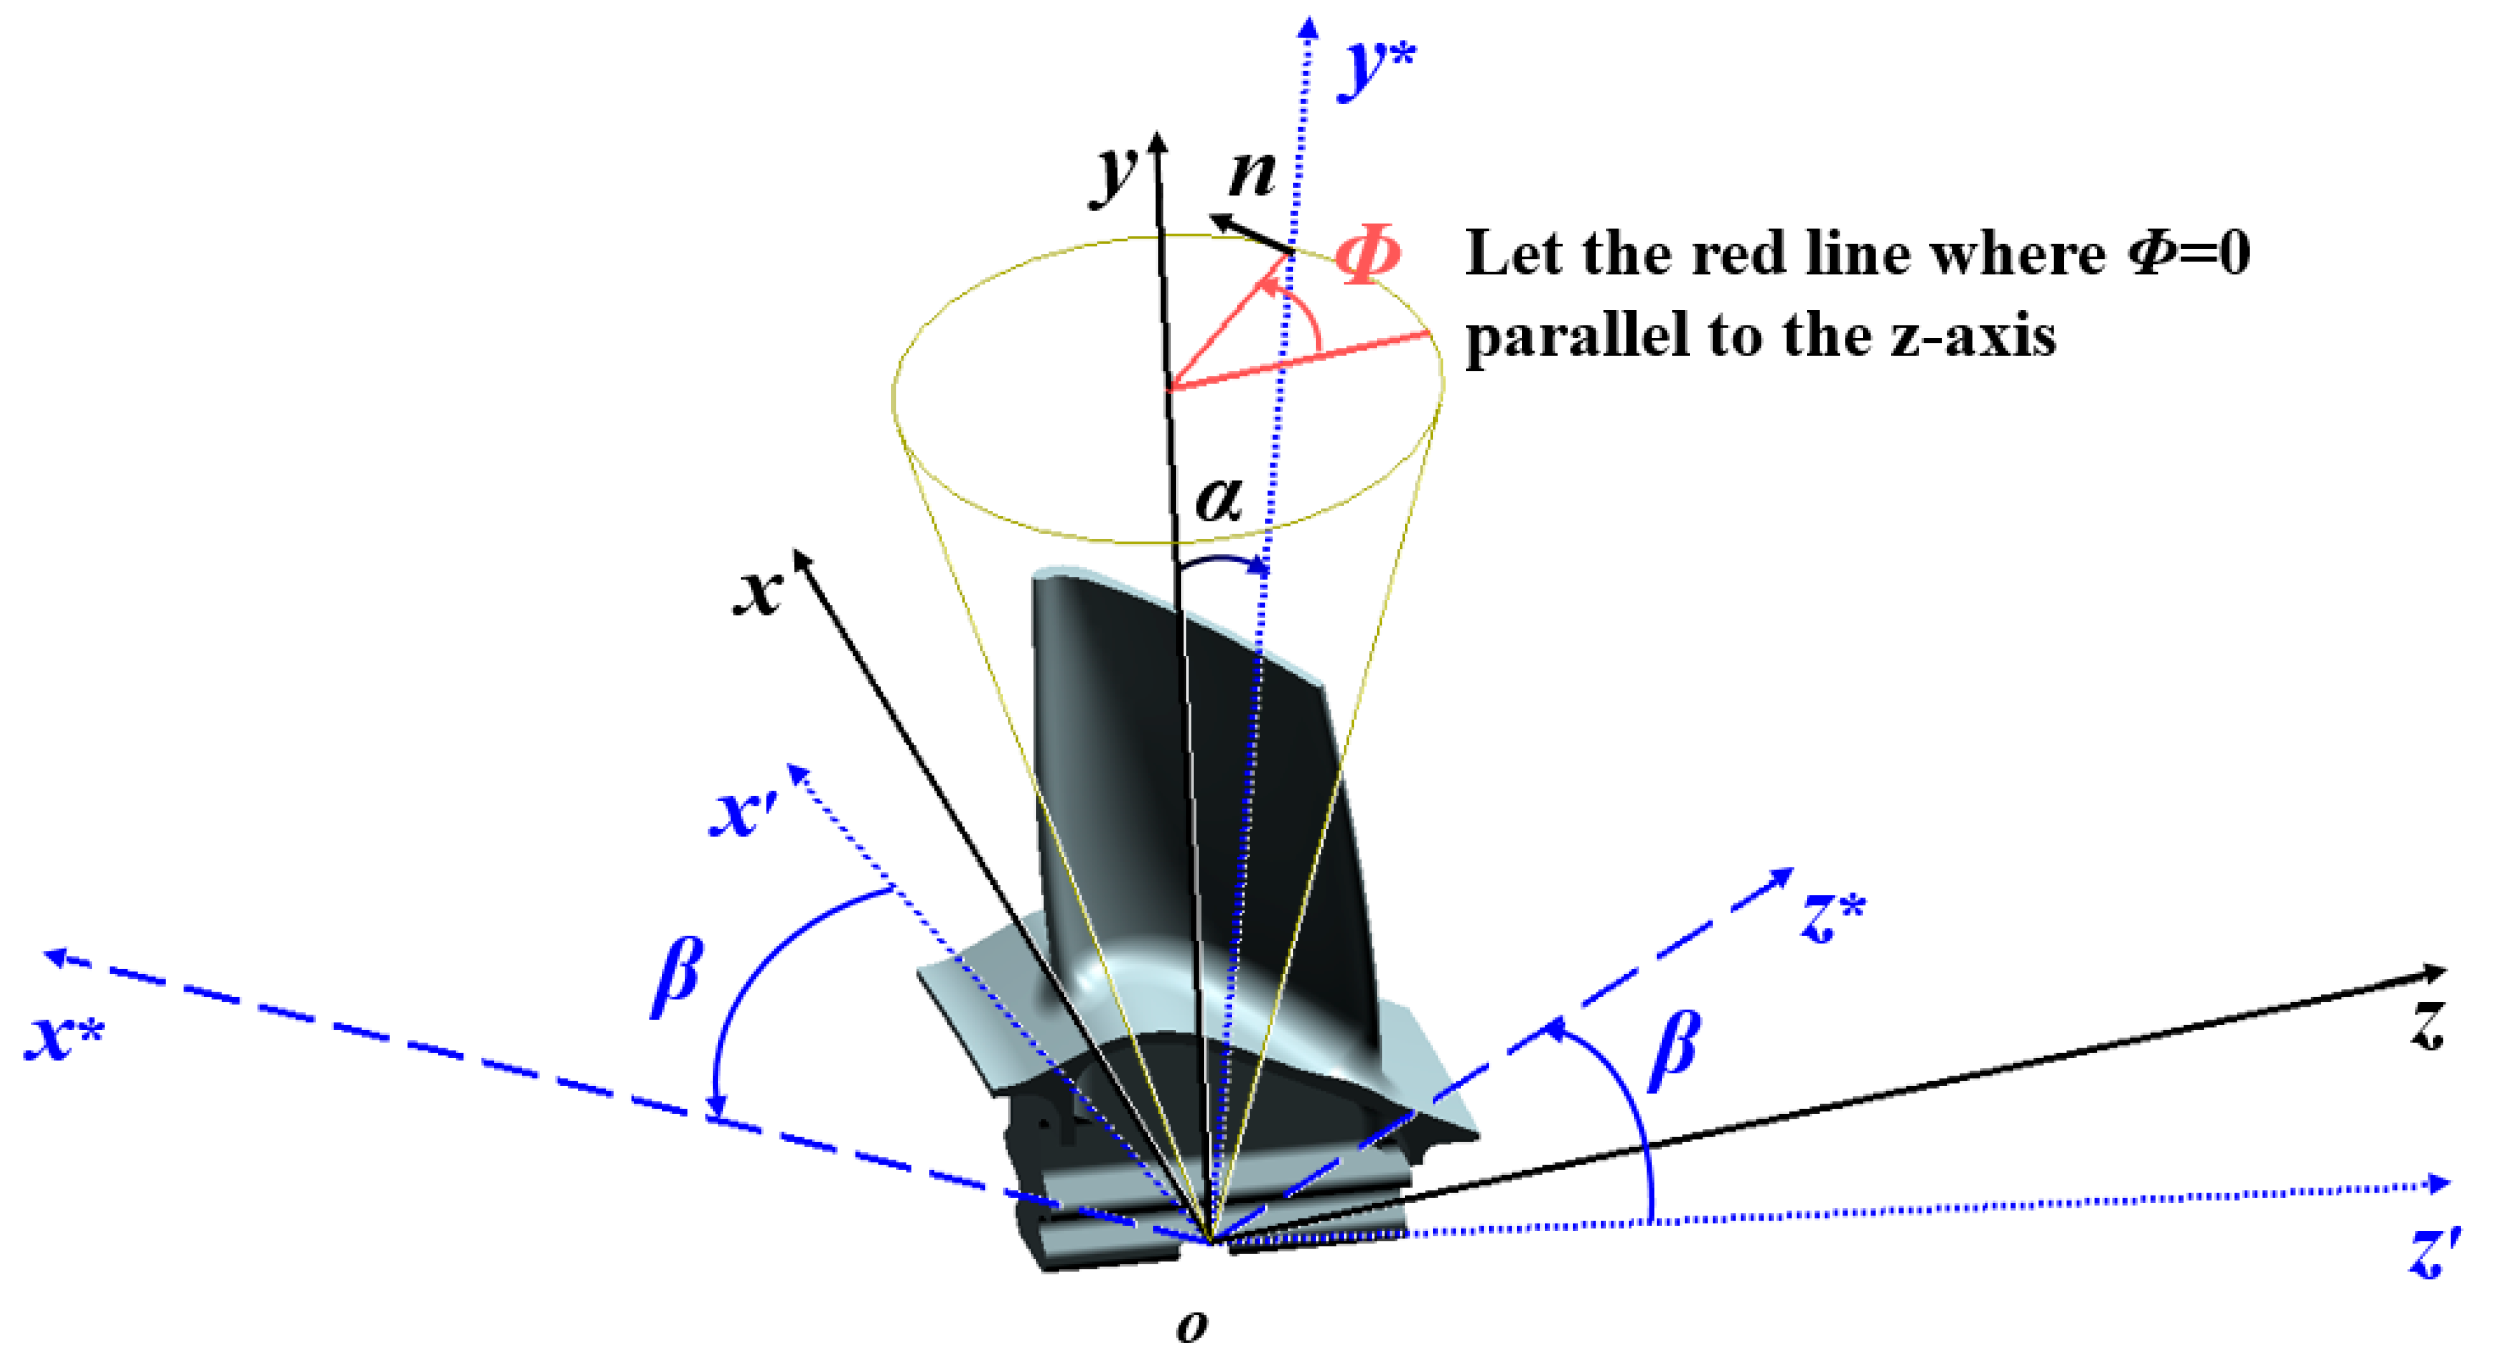
The designed SC growth direction of the turbine blade is normal to the bottom plane of the blade tenon and is taken as the positive direction of the -axis in Figure 11. During fabrication, the primary orientation is constrained within a conical surface whose maximum deviation from the designed direction is 15° [1], and it may occupy any angular position on the circular cross-section of this cone. Let denote the angle between the positive direction of the actual primary-orientation -axis and that of the designed -axis, with an admissible range of . Let denote the angular position on the circular cross-section measured from the positive -axis—i.e., the engine axial direction—within the range of , where the counterclockwise sense is defined as positive. The secondary-orientation deviation angle is defined as the rotation angle about the actual primary-orientation direction. and are not constrained during fabrication [1]. The correlation is derived and established between the angular difference of the actual crystal coordinate system from the designed crystal coordinate system and the three crystal-orientation deviation angles , and as shown in Equations (A1)–(A5) (Appendix A.1).
Figure 11.
Schematic of crystal orientation.
3.2. Effect of Crystal Orientation on Vibration Mechanism
The forced vibration equation of SC turbine blades under excitation force without considering damping is expressed as [27,28]:
where denotes the -th modal mass matrix, denotes the -th time-varying modal coordinate column vector, denotes the -th modal stiffness matrix, and denotes -th time-varying modal force vector. Furthermore,
where denotes the density, denotes the rectangular matrix containing shape functions of the -th mode; denotes the matrix relating nodal displacements to strains for the -th mode; and denotes the constitutive stiffness matrix for the nodal stress–strain relation SC materials.
The relations of the -th modal angular frequency , frequency , modal stiffness matrix and modal mass matrix are as follows:
All the above matrices and equations are defined in the designed crystal coordinate system . If the mode shape remains unchanged with the variation in crystal orientation, namely the modal mass matrix , the matrix relating nodal displacements to strains stay constant. The change in crystal orientation of SC mainly affects the component within the modal stiffness matrix .
Let the direction cosines of coordinate axes , , with respect to crystal axes , , and be expressed as:
where , , and () are related to crystal orientation, as shown in Equations (A3)–(A5) (Appendix A.1).
Let denote the constitutive stiffness matrix for the stress–strain relation in the actual crystal coordinate system . The expression of is given as follows.
where , , and denote the elastic modulus, Poisson’s ratio and shear modulus of the SC material in <001> direction, respectively.
Equation (6) reveals that the constitutive stiffness matrix of the SC material evolves into a general anisotropic matrix in the designed crystal coordinate system when the actual crystal coordinate system does not coincide with the designed crystal coordinate system . Consequently, both normal stress and shear stress are induced by both normal strain and shear strain.
Equations (1)–(7) demonstrate that crystal orientation influences the modal stiffness matrix by changing the constitutive stiffness matrix , thereby altering the vibration characteristics. Since each mode has a unique shape function, resulting in changes to matrix , matrix therefore influences the modal stiffness matrix to different extents.
All the above analyses are based on the assumption that the mode shape remains constant as crystal orientation varies. In fact, changes in crystal orientation will alter the stiffness distribution of the blade, which may lead to slight or even considerable variations in the corresponding mode shapes of the same order, and further induce changes in the modal mass matrix . Due to the complex geometry of the blade, the constitutive stiffness matrix characterizes the mechanism of crystal orientation on blade-vibration characteristics, but fails to directly quantify the variation laws and influence magnitudes. Therefore, further finite-element numerical simulation is essential.
4. Effect of Uncertain Parameters on Blade-Vibration Characteristics
4.1. Variation in Blade Dynamic Frequencies Versus Crystal-Orientation Deviation
4.1.1. Thin-Walled SC Turbine Blades
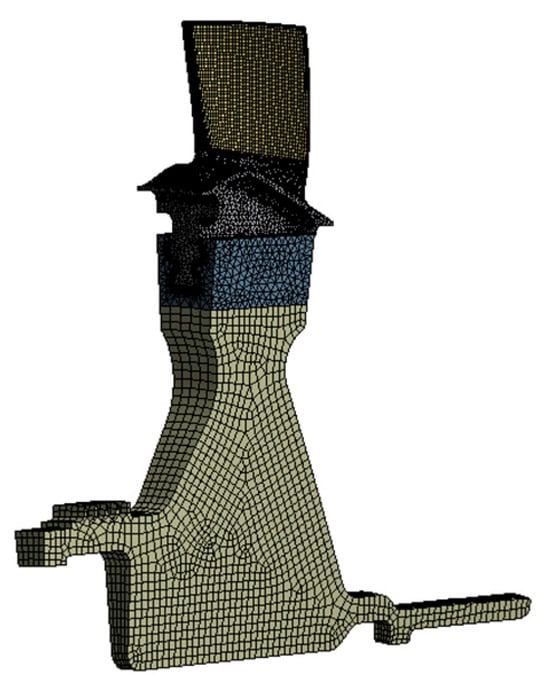
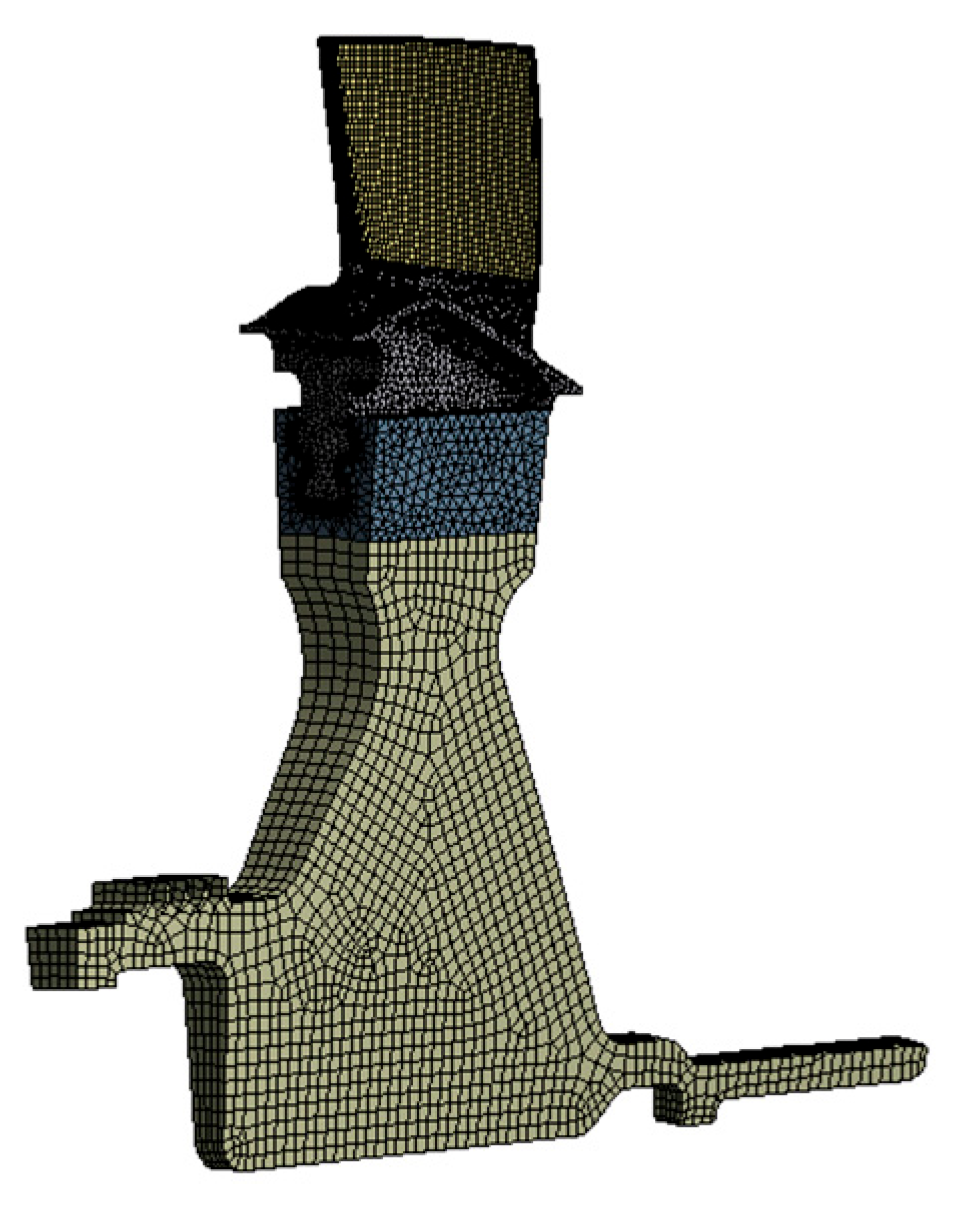
Based on the cyclic symmetric structural characteristics of the turbine rotor, a single-sector finite-element model is established with mid-node enriched quadratic elements, as illustrated in Figure 12. The model contains 121,546 elements and 283,099 nodes. Cyclic symmetric boundary conditions are imposed on the cyclic symmetry surfaces of the disk. Axial constraints are imposed on the rear end face of the disk shaft, and circumferential constraints are applied to an edge perpendicular to the circumferential direction on the front-end face of the disk. Frictional contact boundary conditions are defined for the mating surfaces between blade fir-tree tenons and disk mortises, with a friction coefficient of 0.15 adopted.
Figure 12.
Finite-element model.
For dynamic frequency calculation, the prestressed modal analysis method is utilized, where both centrifugal stiffening induced by high-speed rotation and spin softening caused by the change in rotational inertia are taken into account. A mesh independence verification is carried out by globally refining the mesh size by a factor of 2, and the relative deviations of the first six natural frequencies are controlled within 0.2%, which proves the mesh independence of the model.
The overall modeling framework complies with the standard simulation procedures widely adopted by domestic aero-engine research institutes. The simulation accuracy has been verified via multiple calibration tests in published studies [29,30,31], which effectively reduces numerical simulation errors.
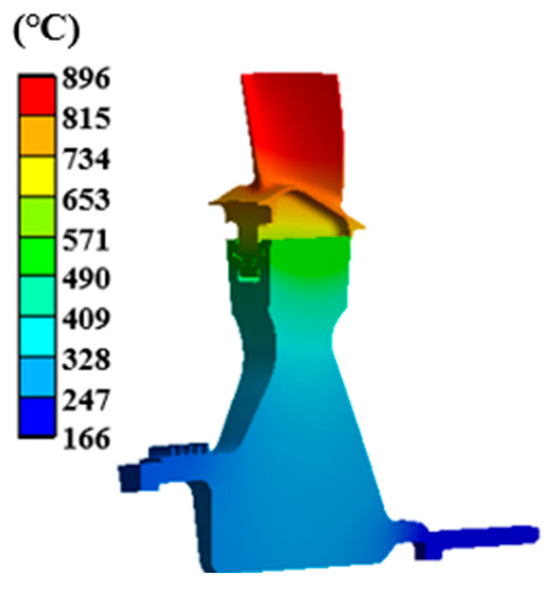
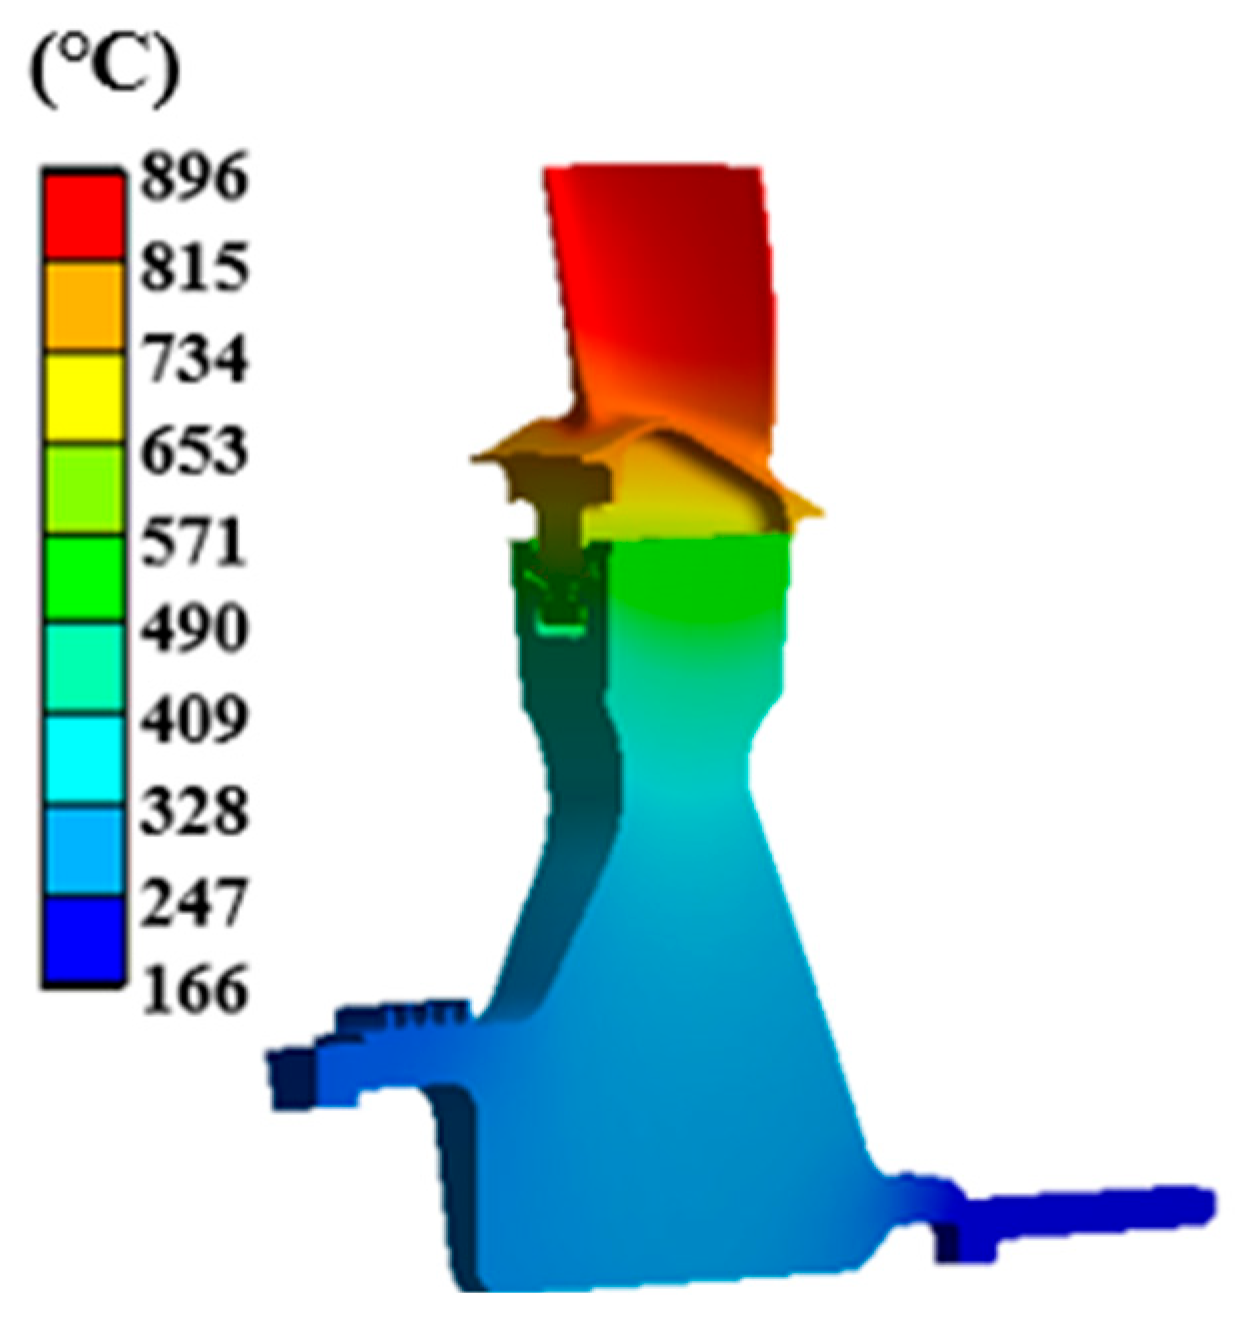
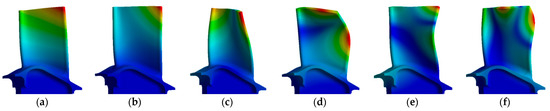
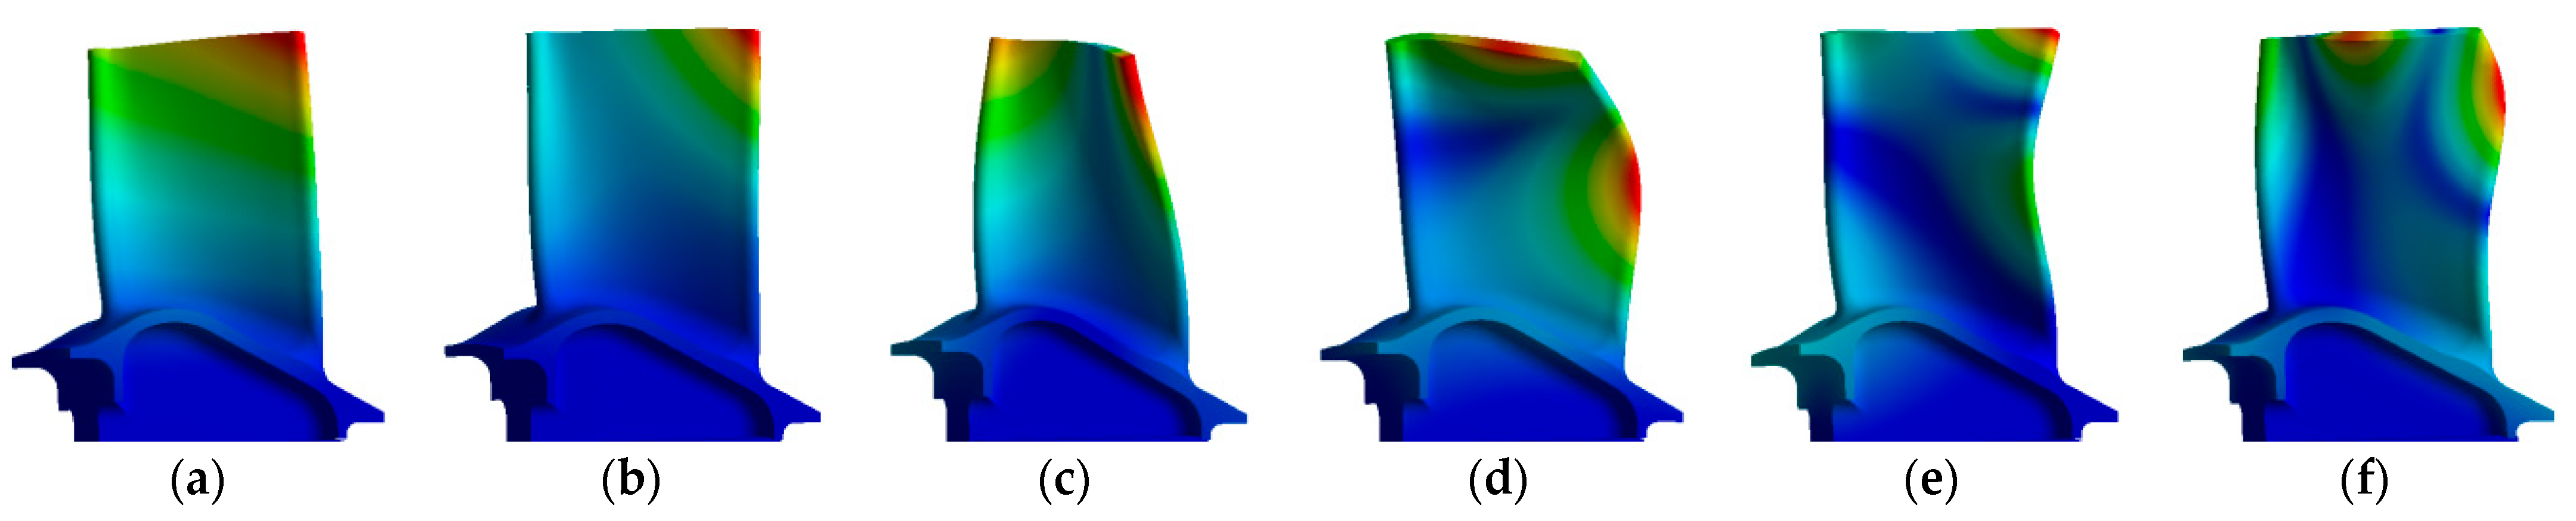
When the designed coordinate system coincides with the actual crystal coordinate system , the first six dynamic frequencies and the corresponding mode shapes of the thin-walled SC turbine blade are presented in Figure 13. In sequence, these modes are the first-order bending mode, a composite mode dominated by first-order bending, the first-order torsional mode, the second-order bending mode, a higher-order composite mode and the first-order chordwise-bending mode. The dynamic frequencies are evaluated at the operating speed of the fractured blade—namely 33,600 r/min—and the corresponding temperature field is shown in Figure 14. This temperature field corresponds to the steady-state thermal simulation results under the engine test run condition of 33,600 r/min, which is calibrated based on the measured temperatures at key monitoring points acquired during engine bench tests.
Figure 13.
First six mode shapes of thin-walled SC turbine blades: (a) the 1st mode; (b) the 2nd mode; (c) the 3rd mode; (d) the 4th mode; (e) the 5th mode; and (f) the 6th mode.
Figure 14.
Temperature field.
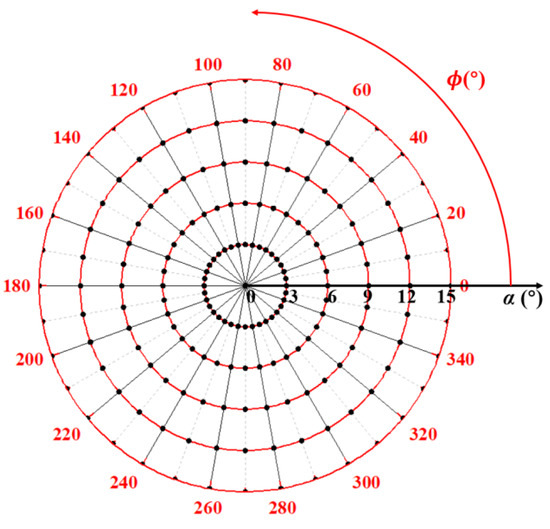
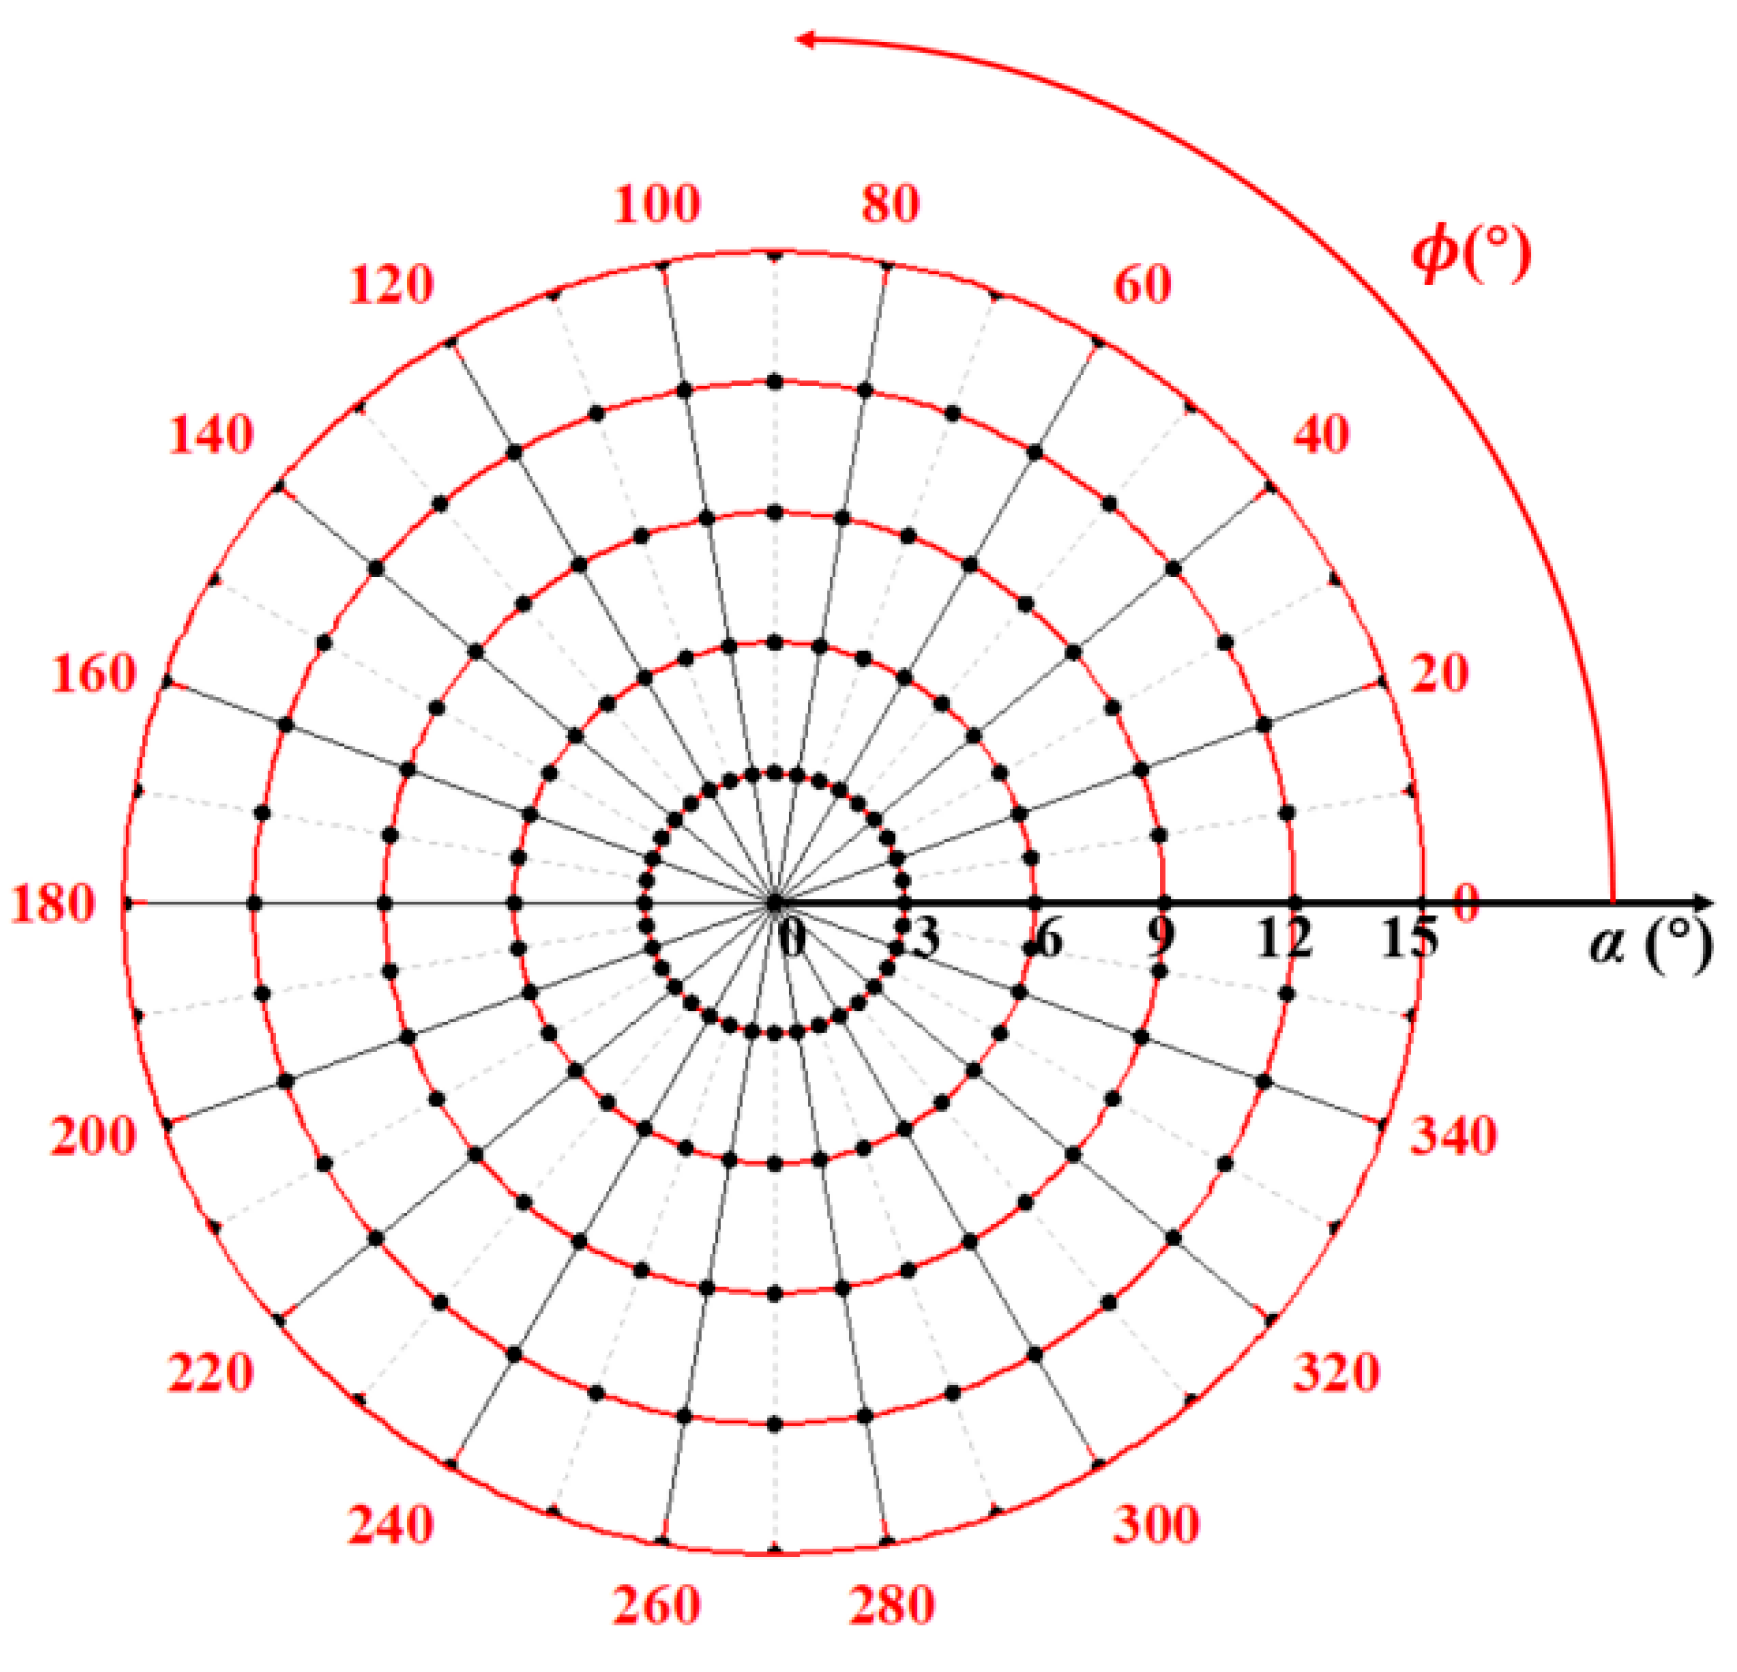
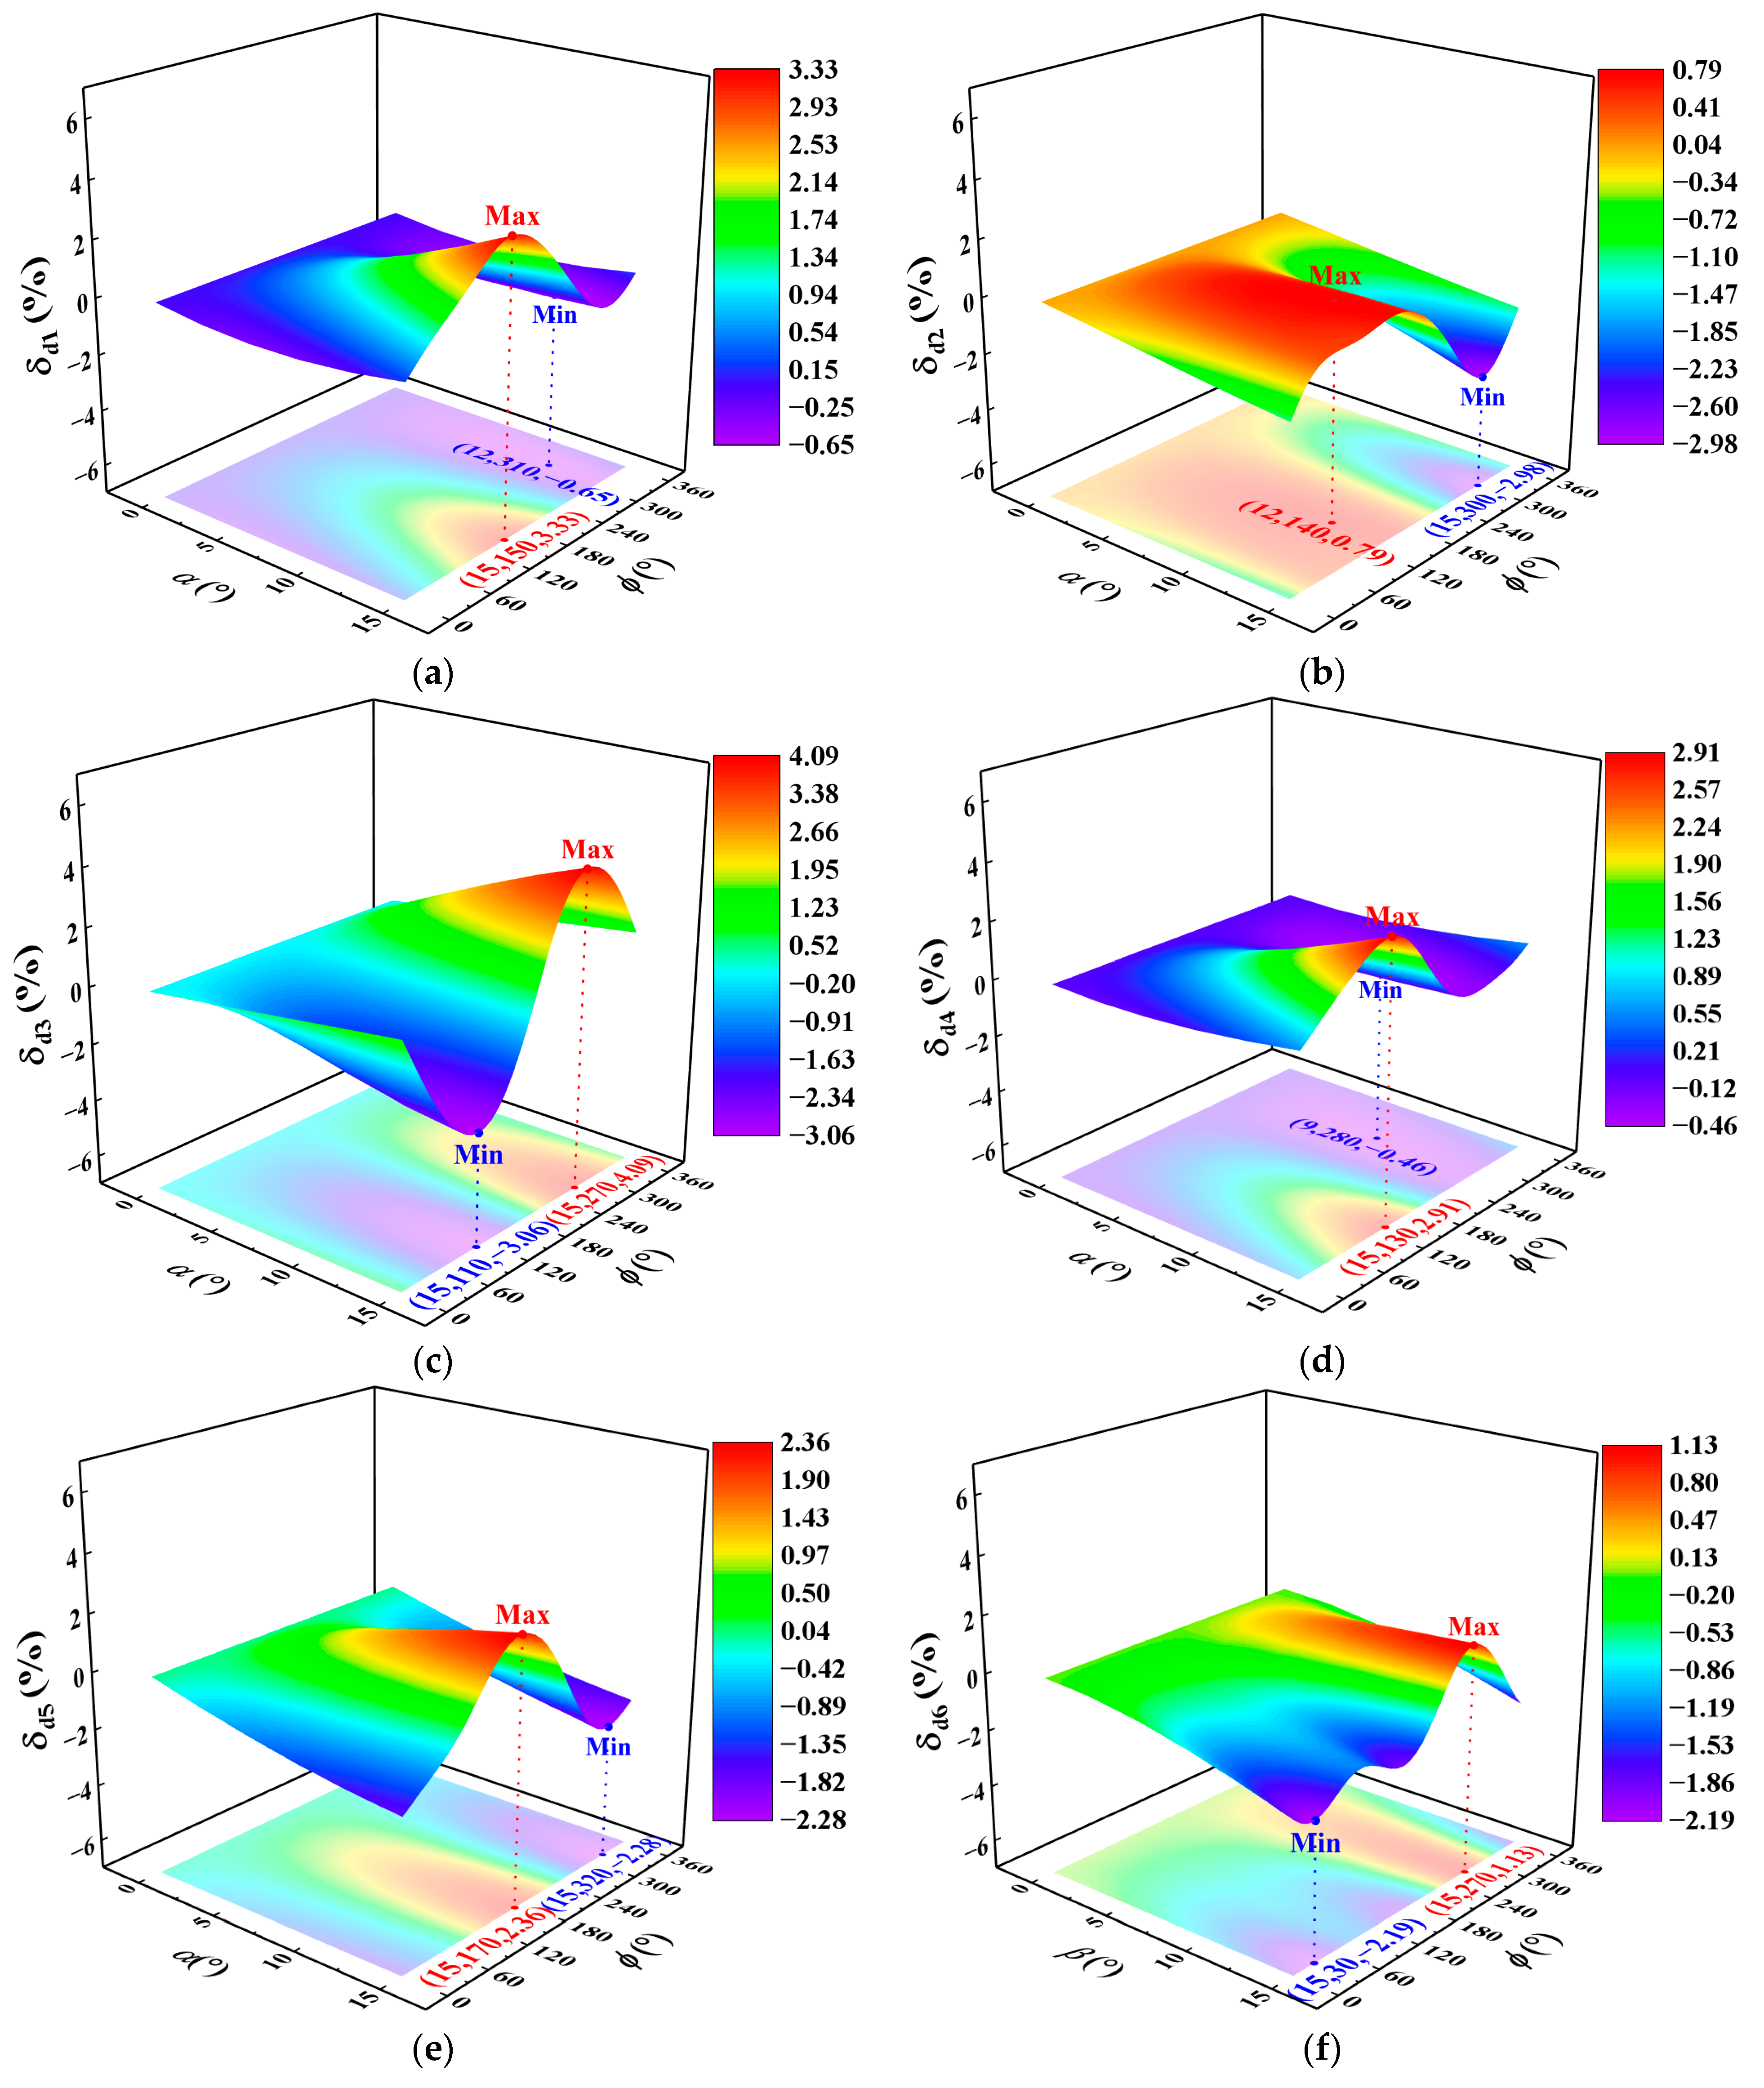
When the secondary-orientation deviation angle , the sample-point combinations of the primary-orientation deviation angle and its angular position used in the numerical analysis are marked by black dots in Figure 15. The angle is sampled at an interval of 3° over the range of 0~15°, and the angular position is sampled at an interval of 10° over the range of 0~360°. Compared with References [8,9,10], a finer sampling interval of crystal orientations is adopted in this work, and the frequency deviation between adjacent sampling points near the extremum of statistical frequency is controlled below 0.1%. The FFD is employed, yielding a total of 186 sample-point combinations. The trends and magnitudes of the influence of and on the first six dynamic frequencies of the thin-walled SC turbine blade are illustrated in Figure 16. The dynamic frequency deviation shown in the figure is defined as:
where denotes the deviation of the -th dynamic frequency, in %; is the -th dynamic frequency under zero crystal-orientation deviation, i.e., the dynamic frequency obtained from the deterministic analysis, in Hz; and denotes the -th dynamic frequency when the crystal-orientation deviation angles are , and , in Hz.
Figure 15.
186 sample-point combinations for numerical analysis of and .
Figure 16.
Relationship between the first six dynamic frequency deviations and , when = 0° for the thin-walled blade: (a) the 1st mode; (b) the 2nd mode; (c) the 3rd mode; (d) the 4th mode; (e) the 5th mode; and (f) the 6th mode.
Figure 16 reveals the following:
- (1)
- Each frequency varies with , with a period of 360°.
- (2)
- For most of the first six modes, the dynamic frequency deviation increases with , and the maximum and minimum dynamic frequencies occur at = 15°. The exception is that the minimum dynamic frequencies of the 3rd and 6th modes occur at = 12°.
- (3)
- The composite mode dominated by the first bending mode () exhibits two maxima and two minima of unequal amplitude within one period; the angular-position offset between the larger maximum and the smaller minimum is approximately 270°. Each of the remaining five modes possesses only one maximum and one minimum within a period, and the angular-position offset between them ranges from 160° to 210°.
- (4)
- Parameters and exert the weakest influence on . The difference between its maximum and minimum dynamic frequency deviations is merely 1.69%, whereas those of the other modes reach 3.5% to 6%.
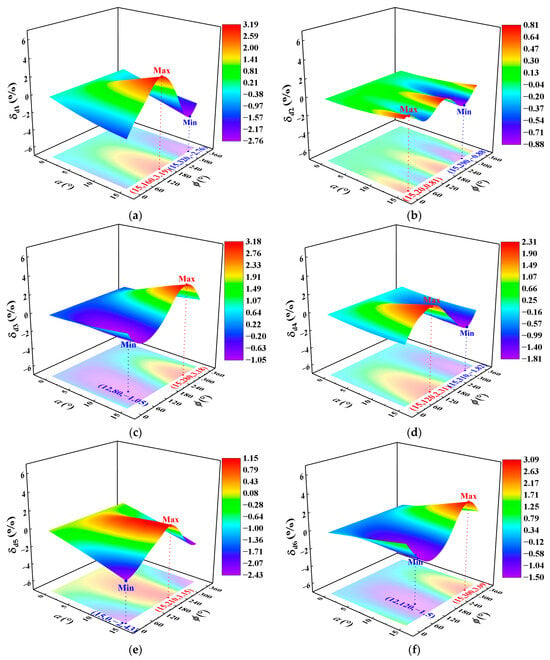
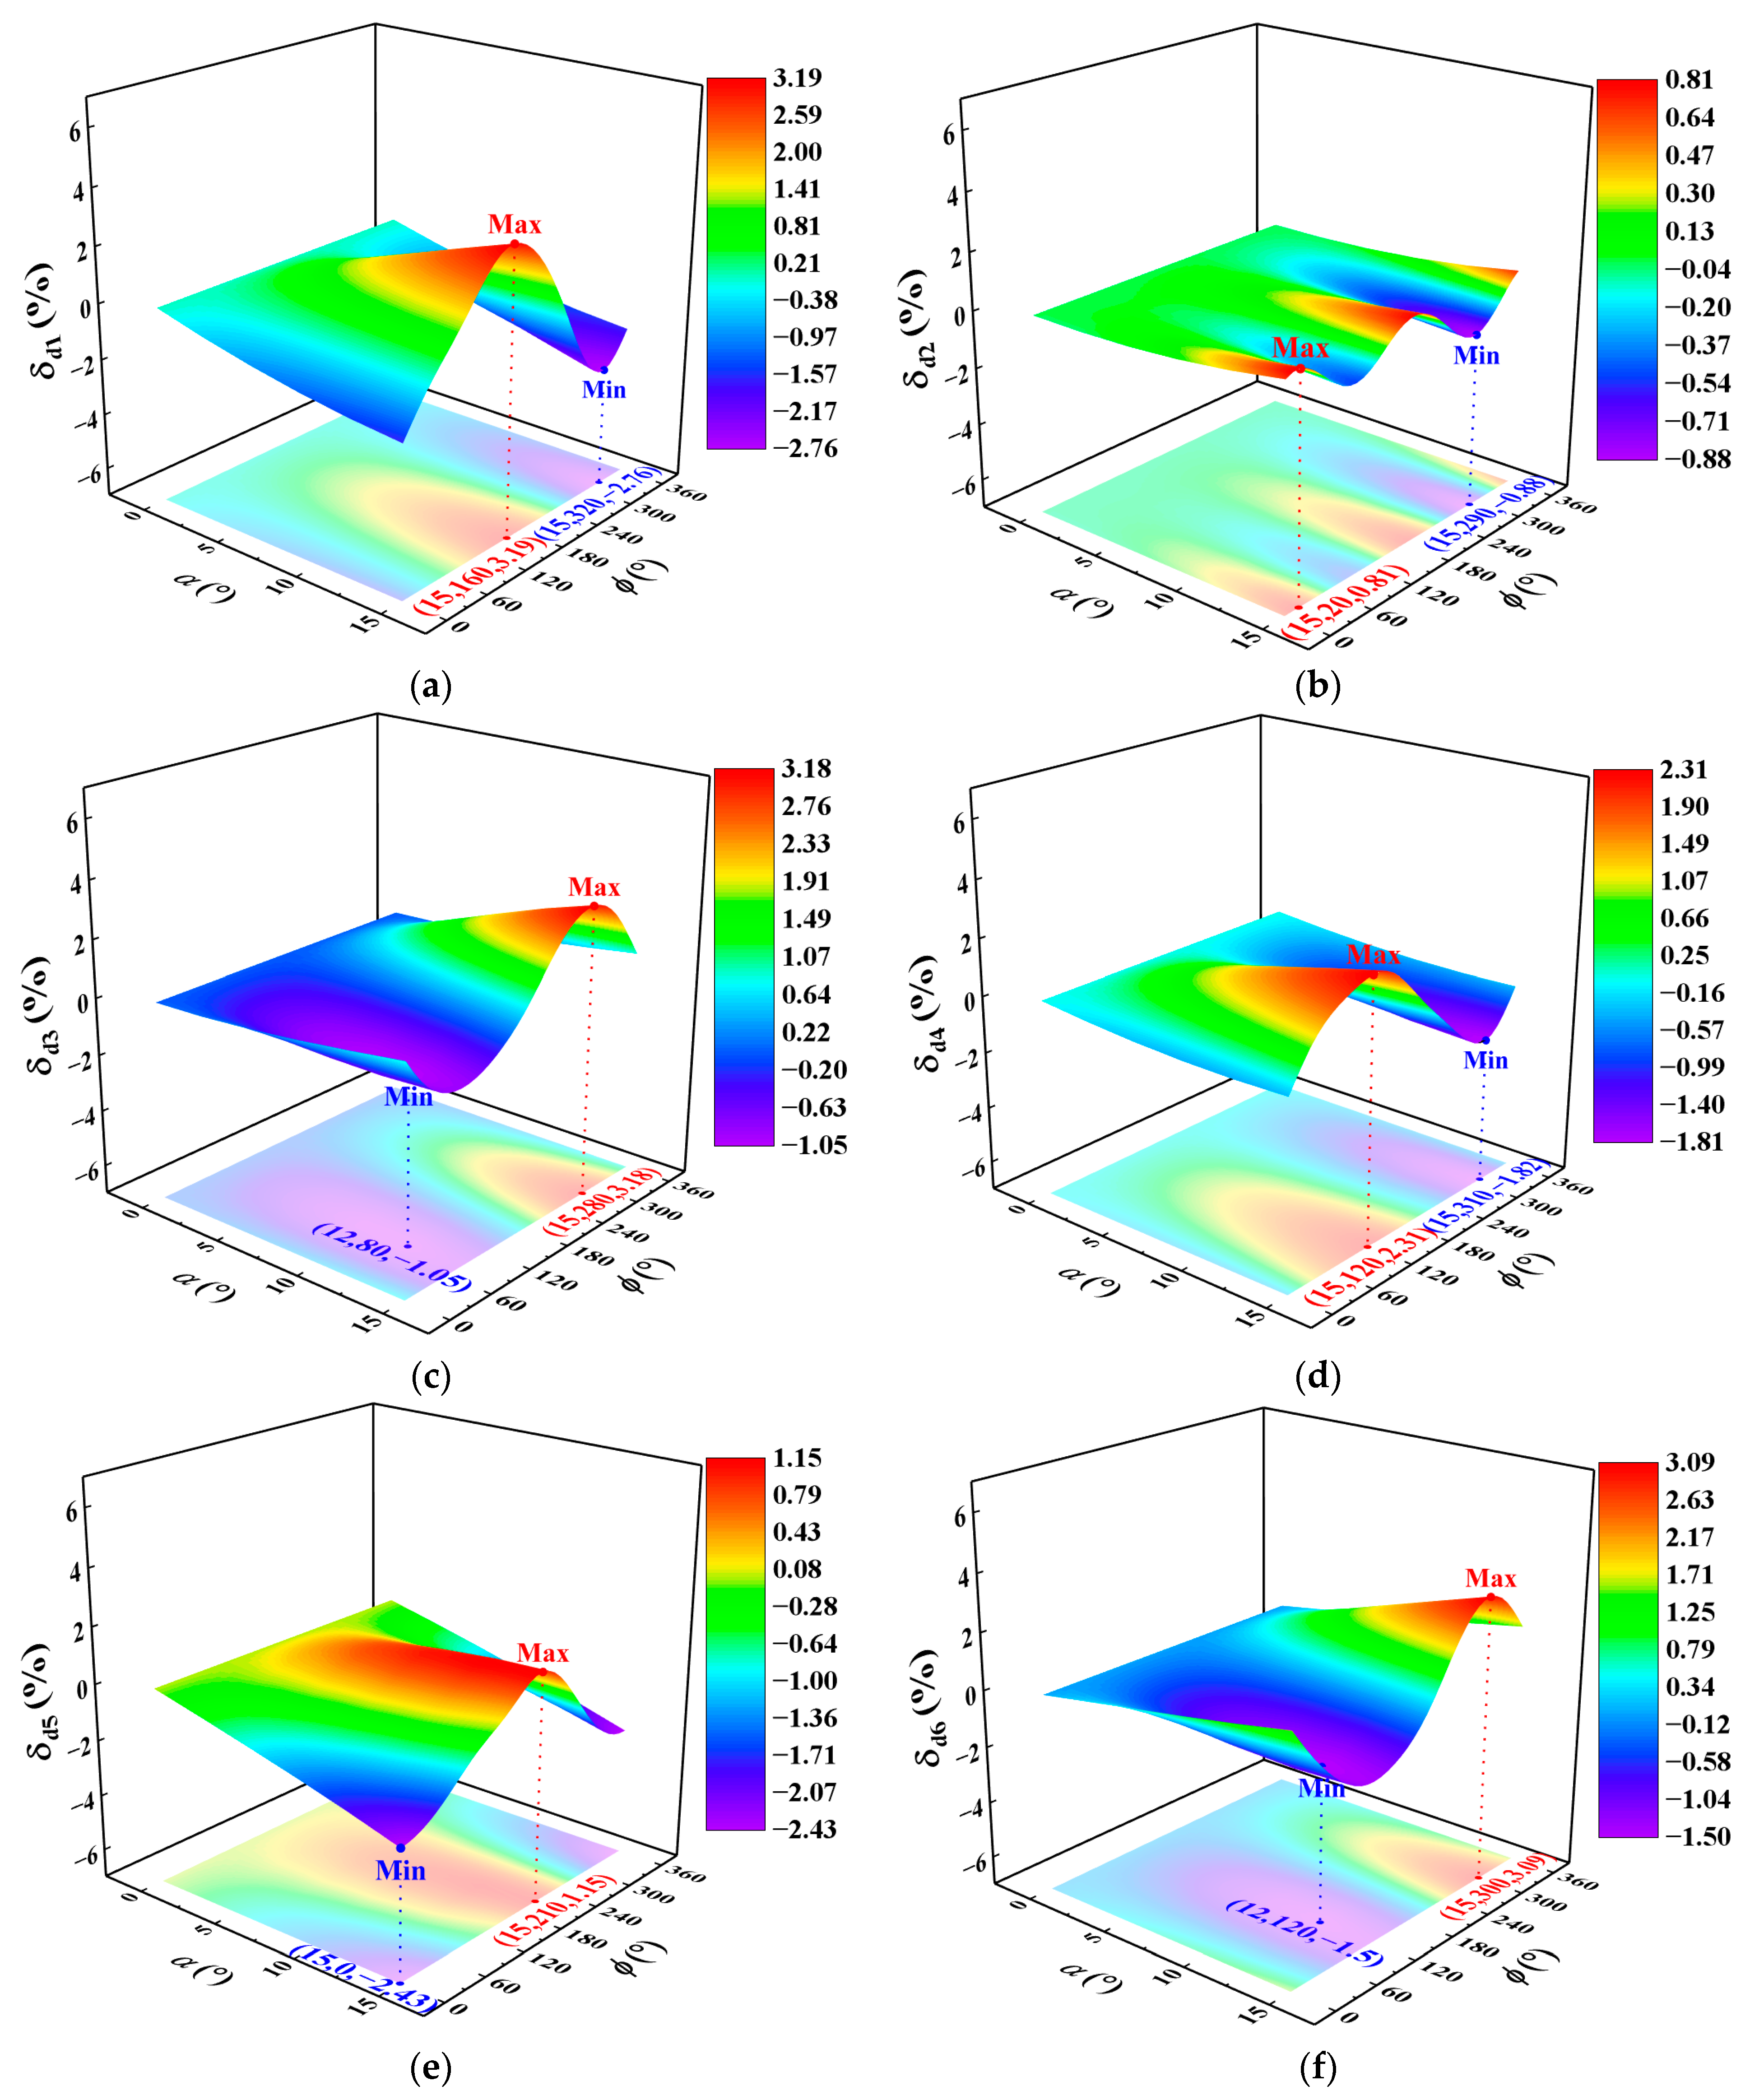
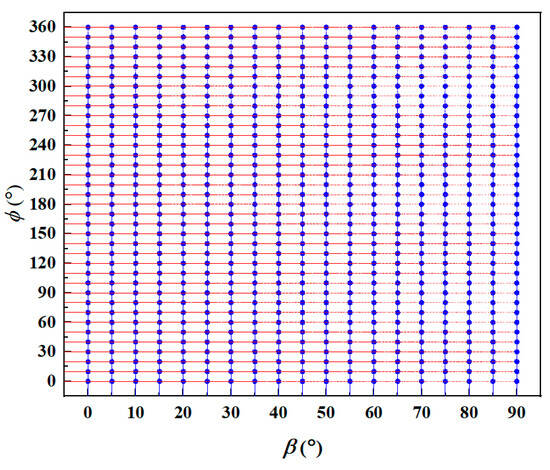
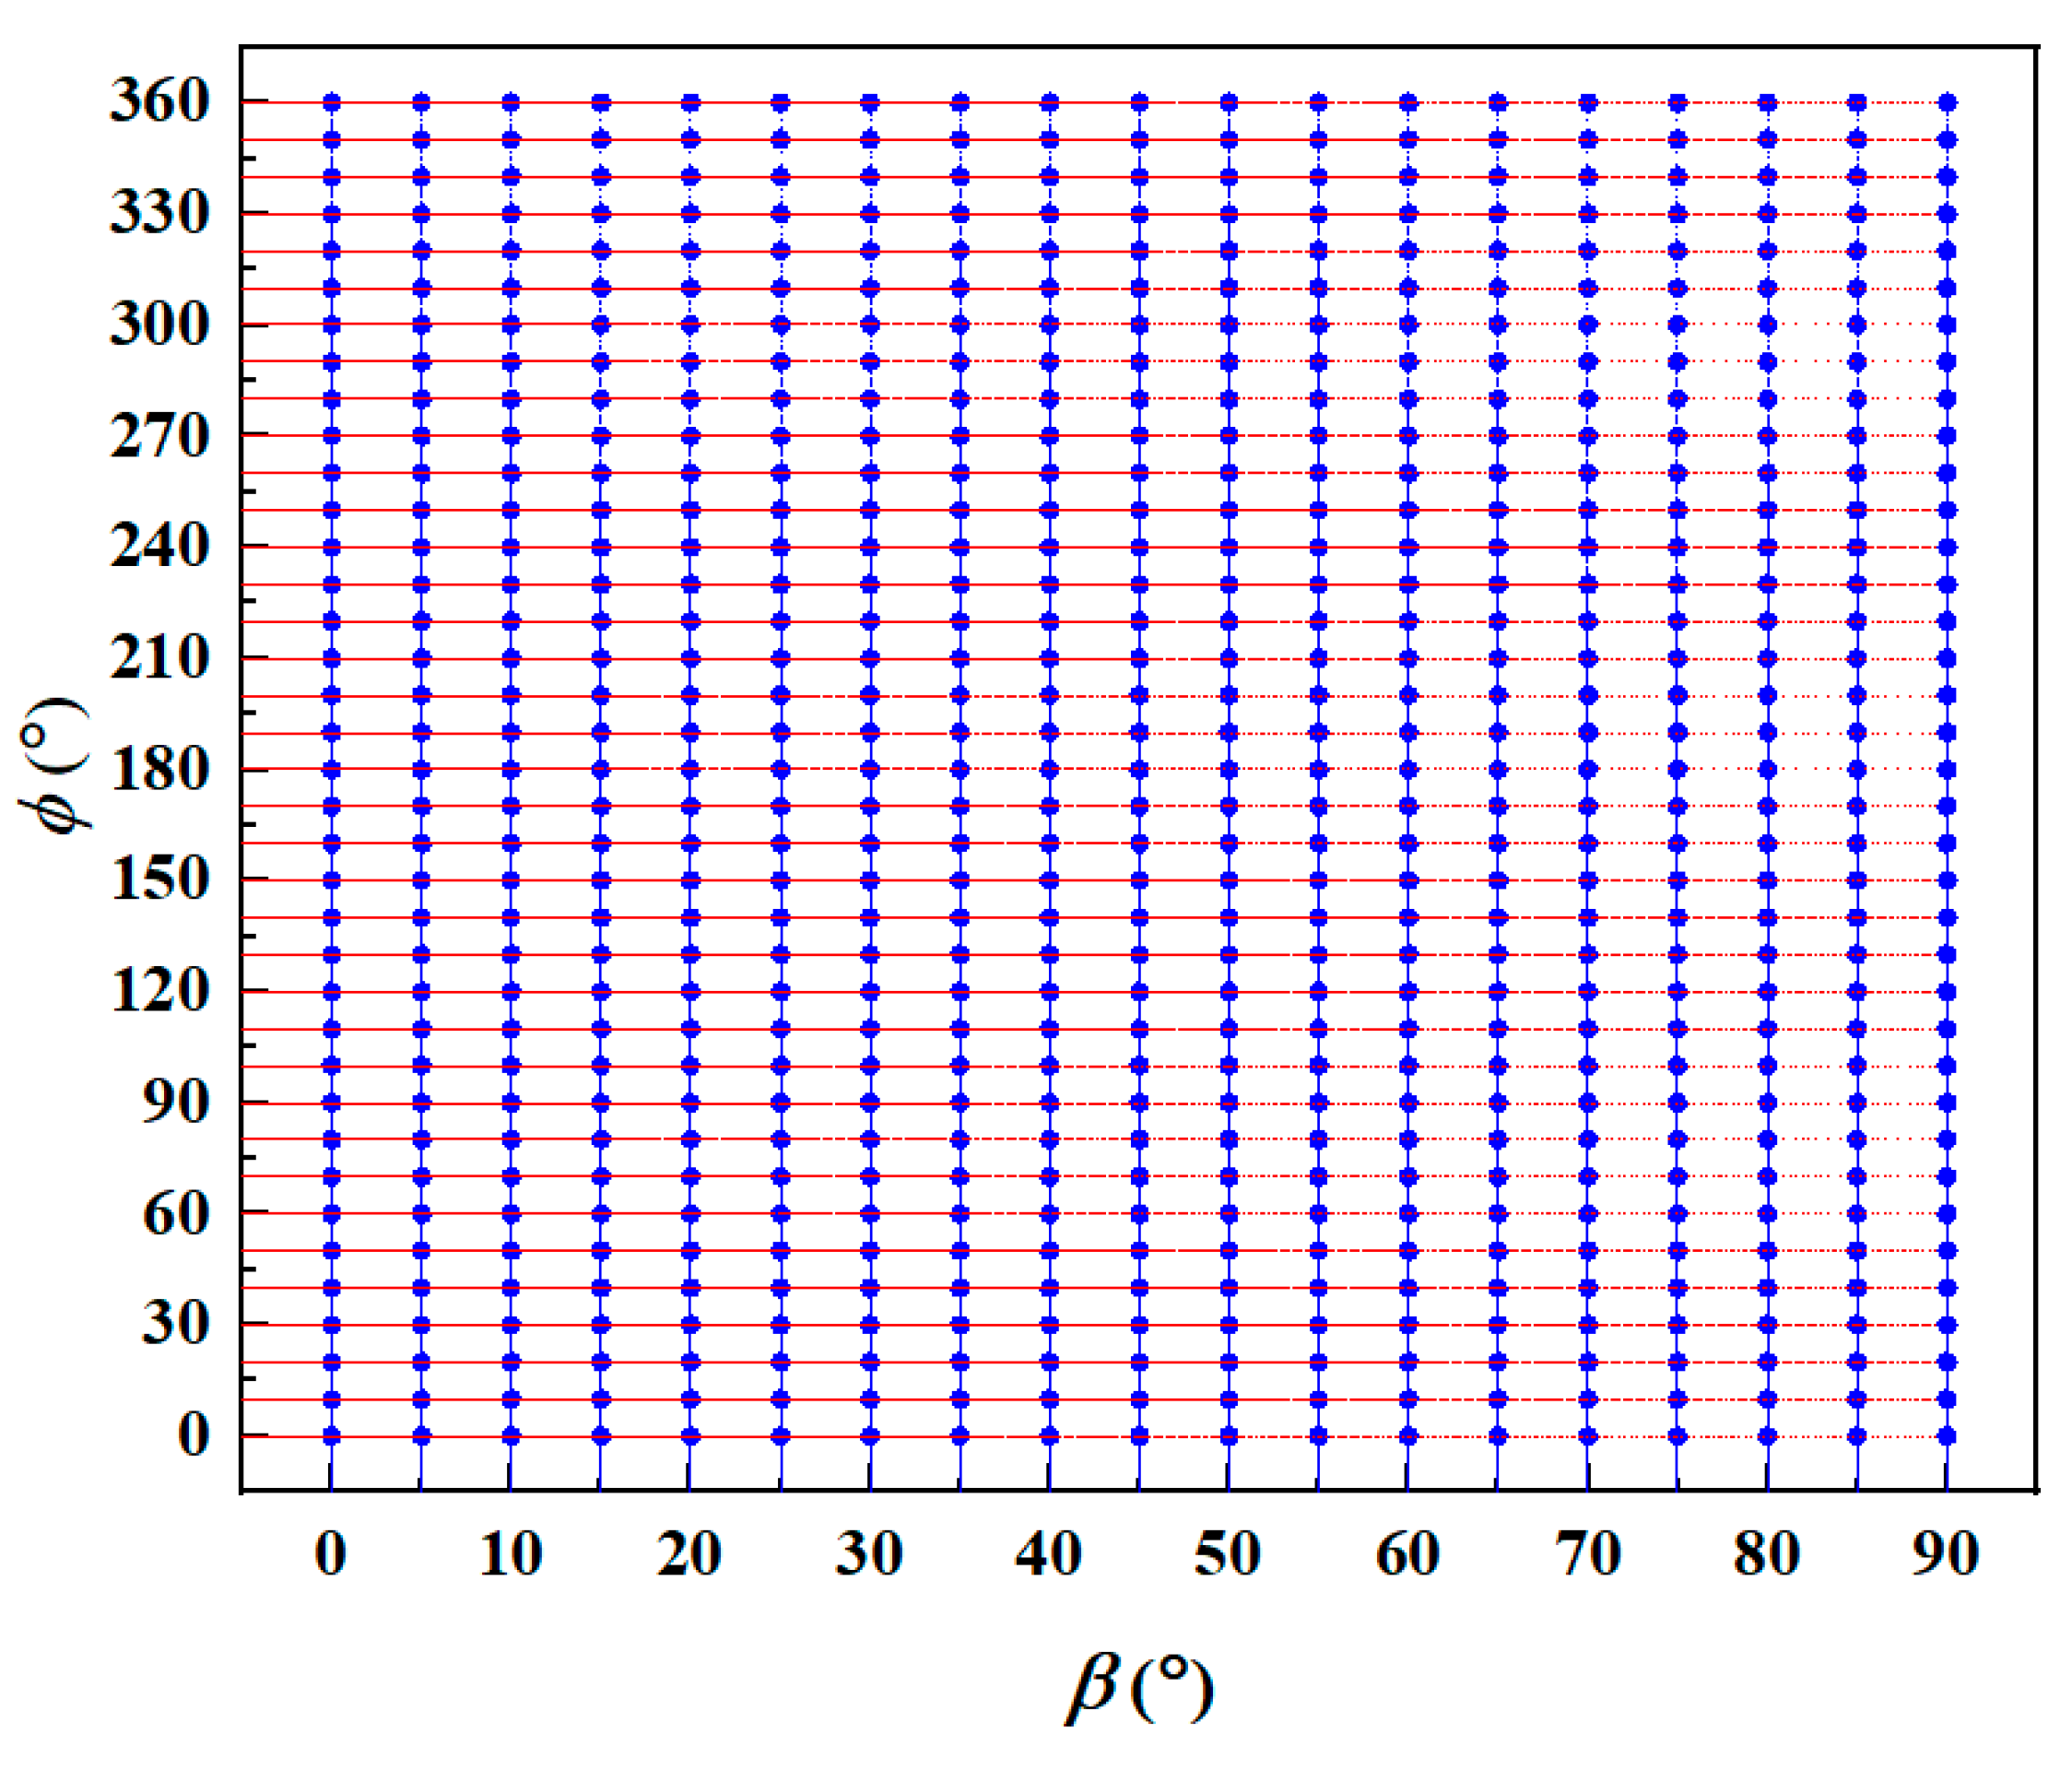
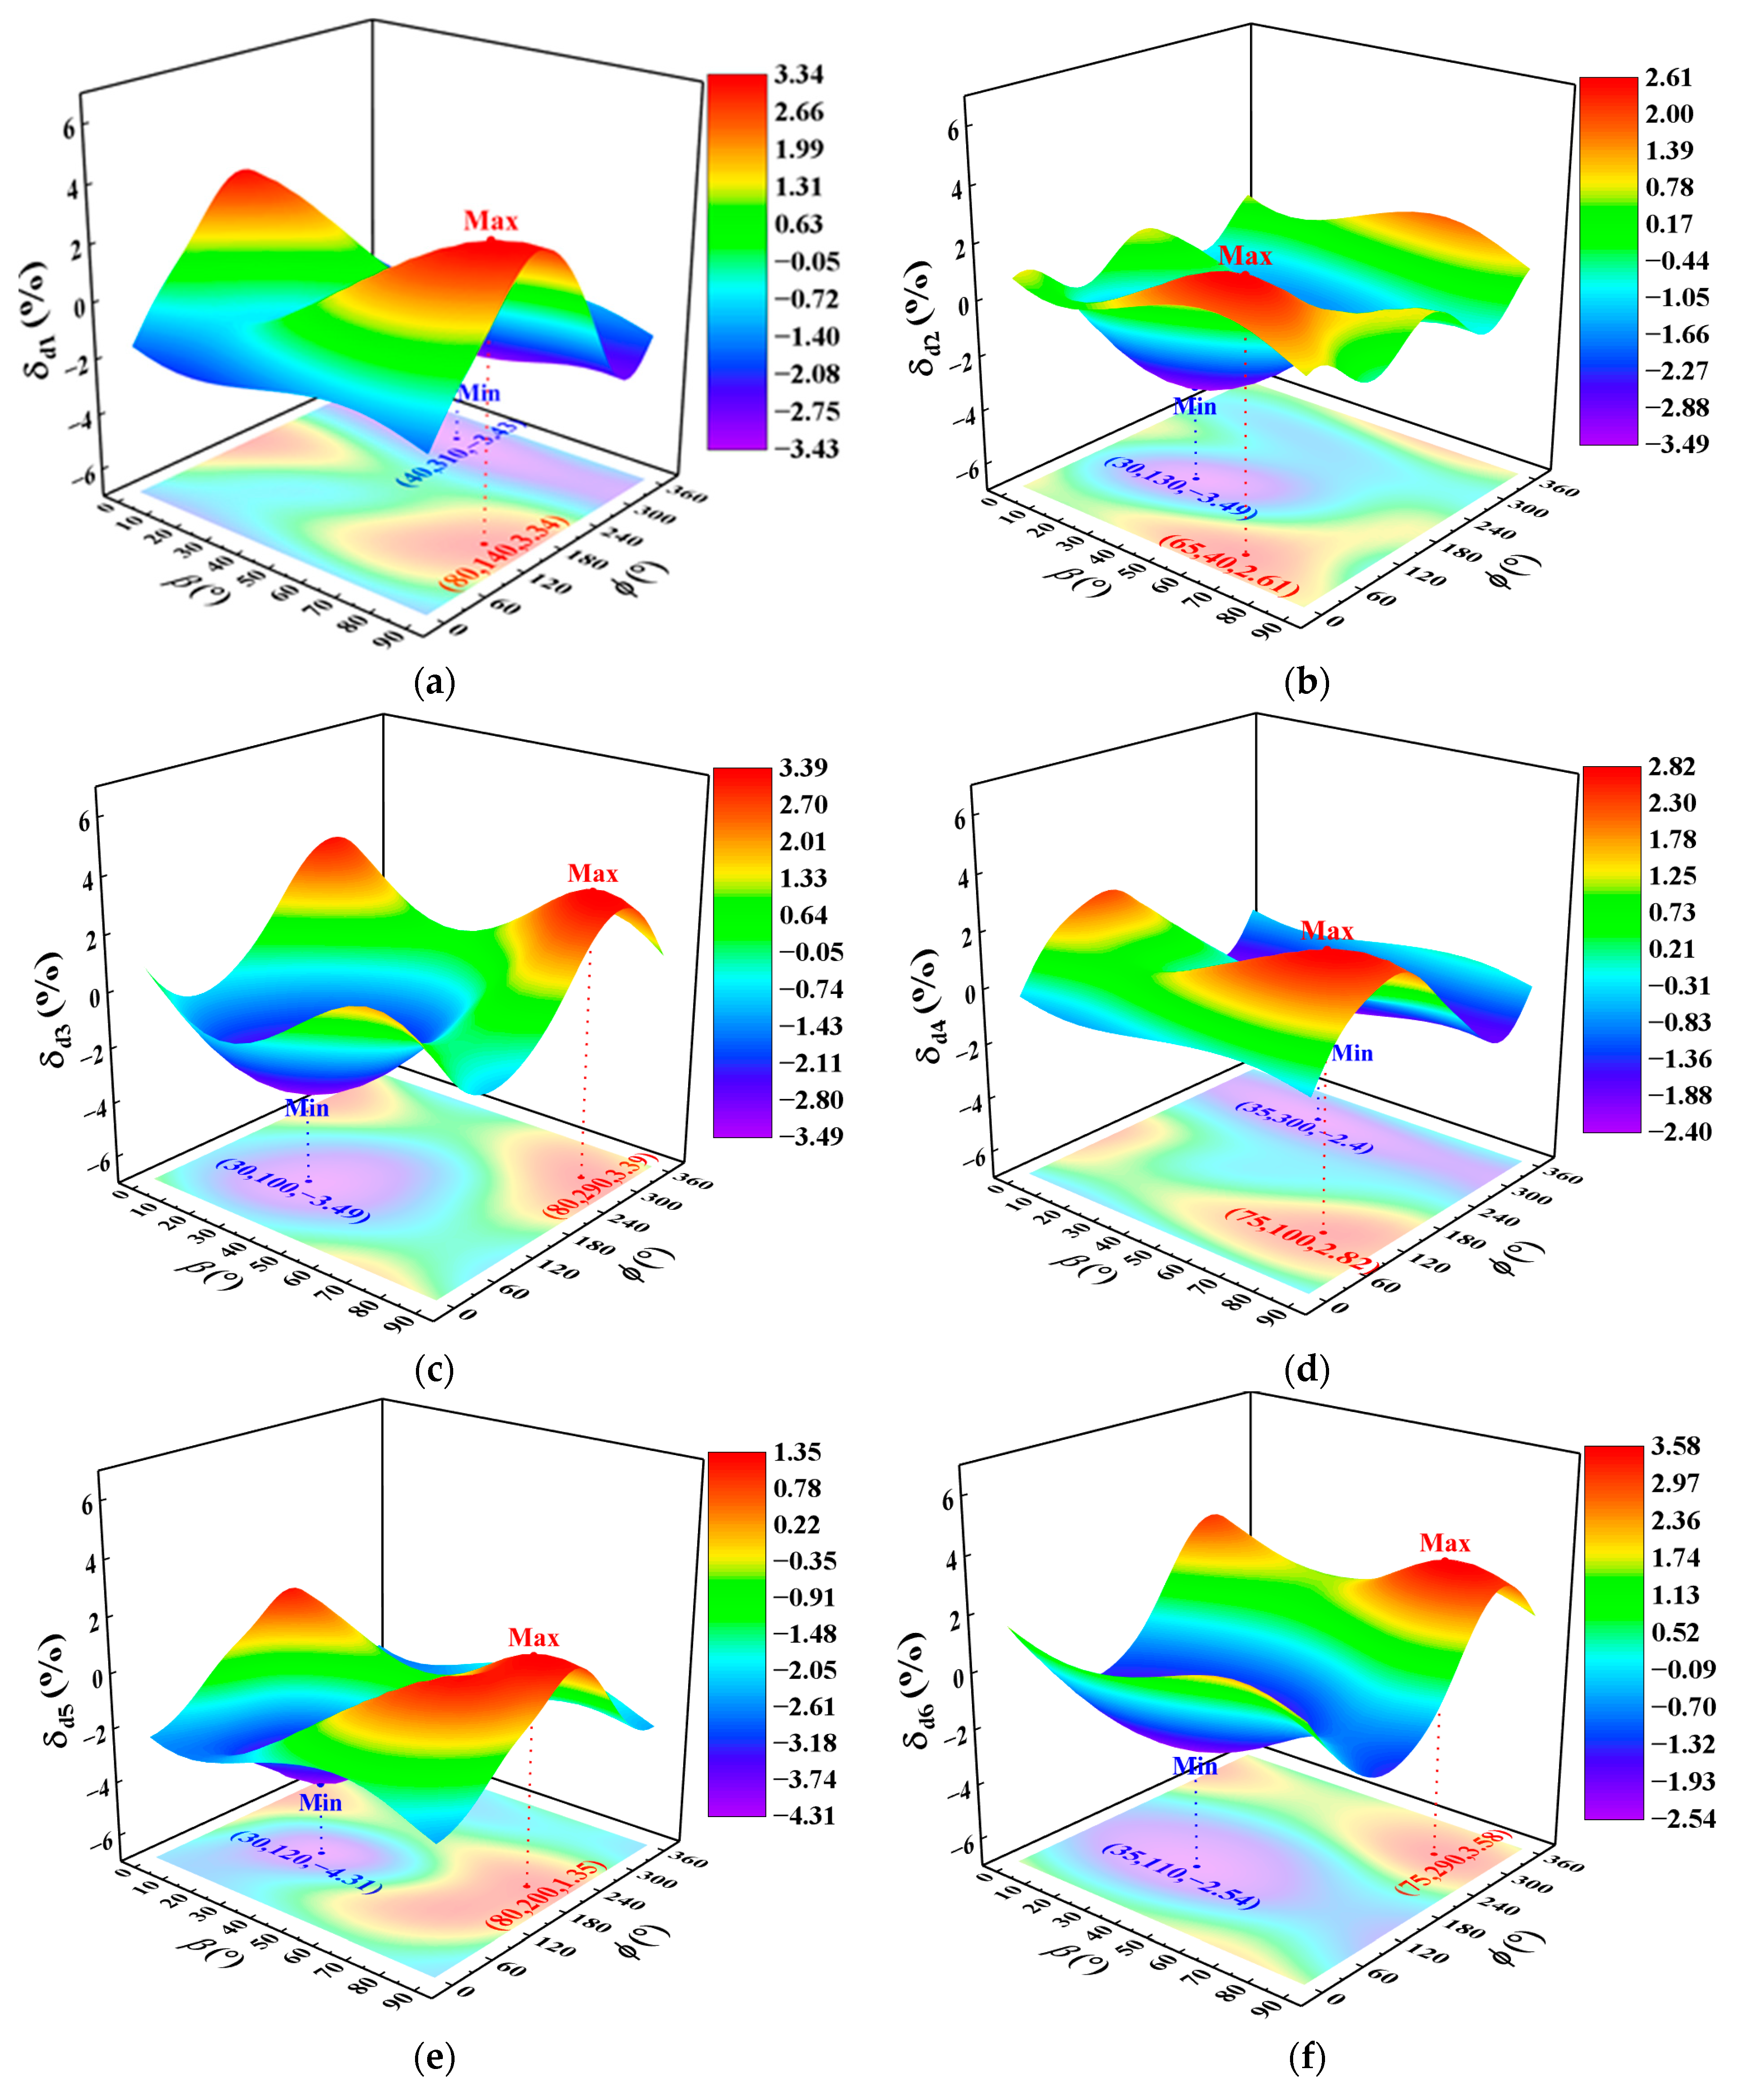
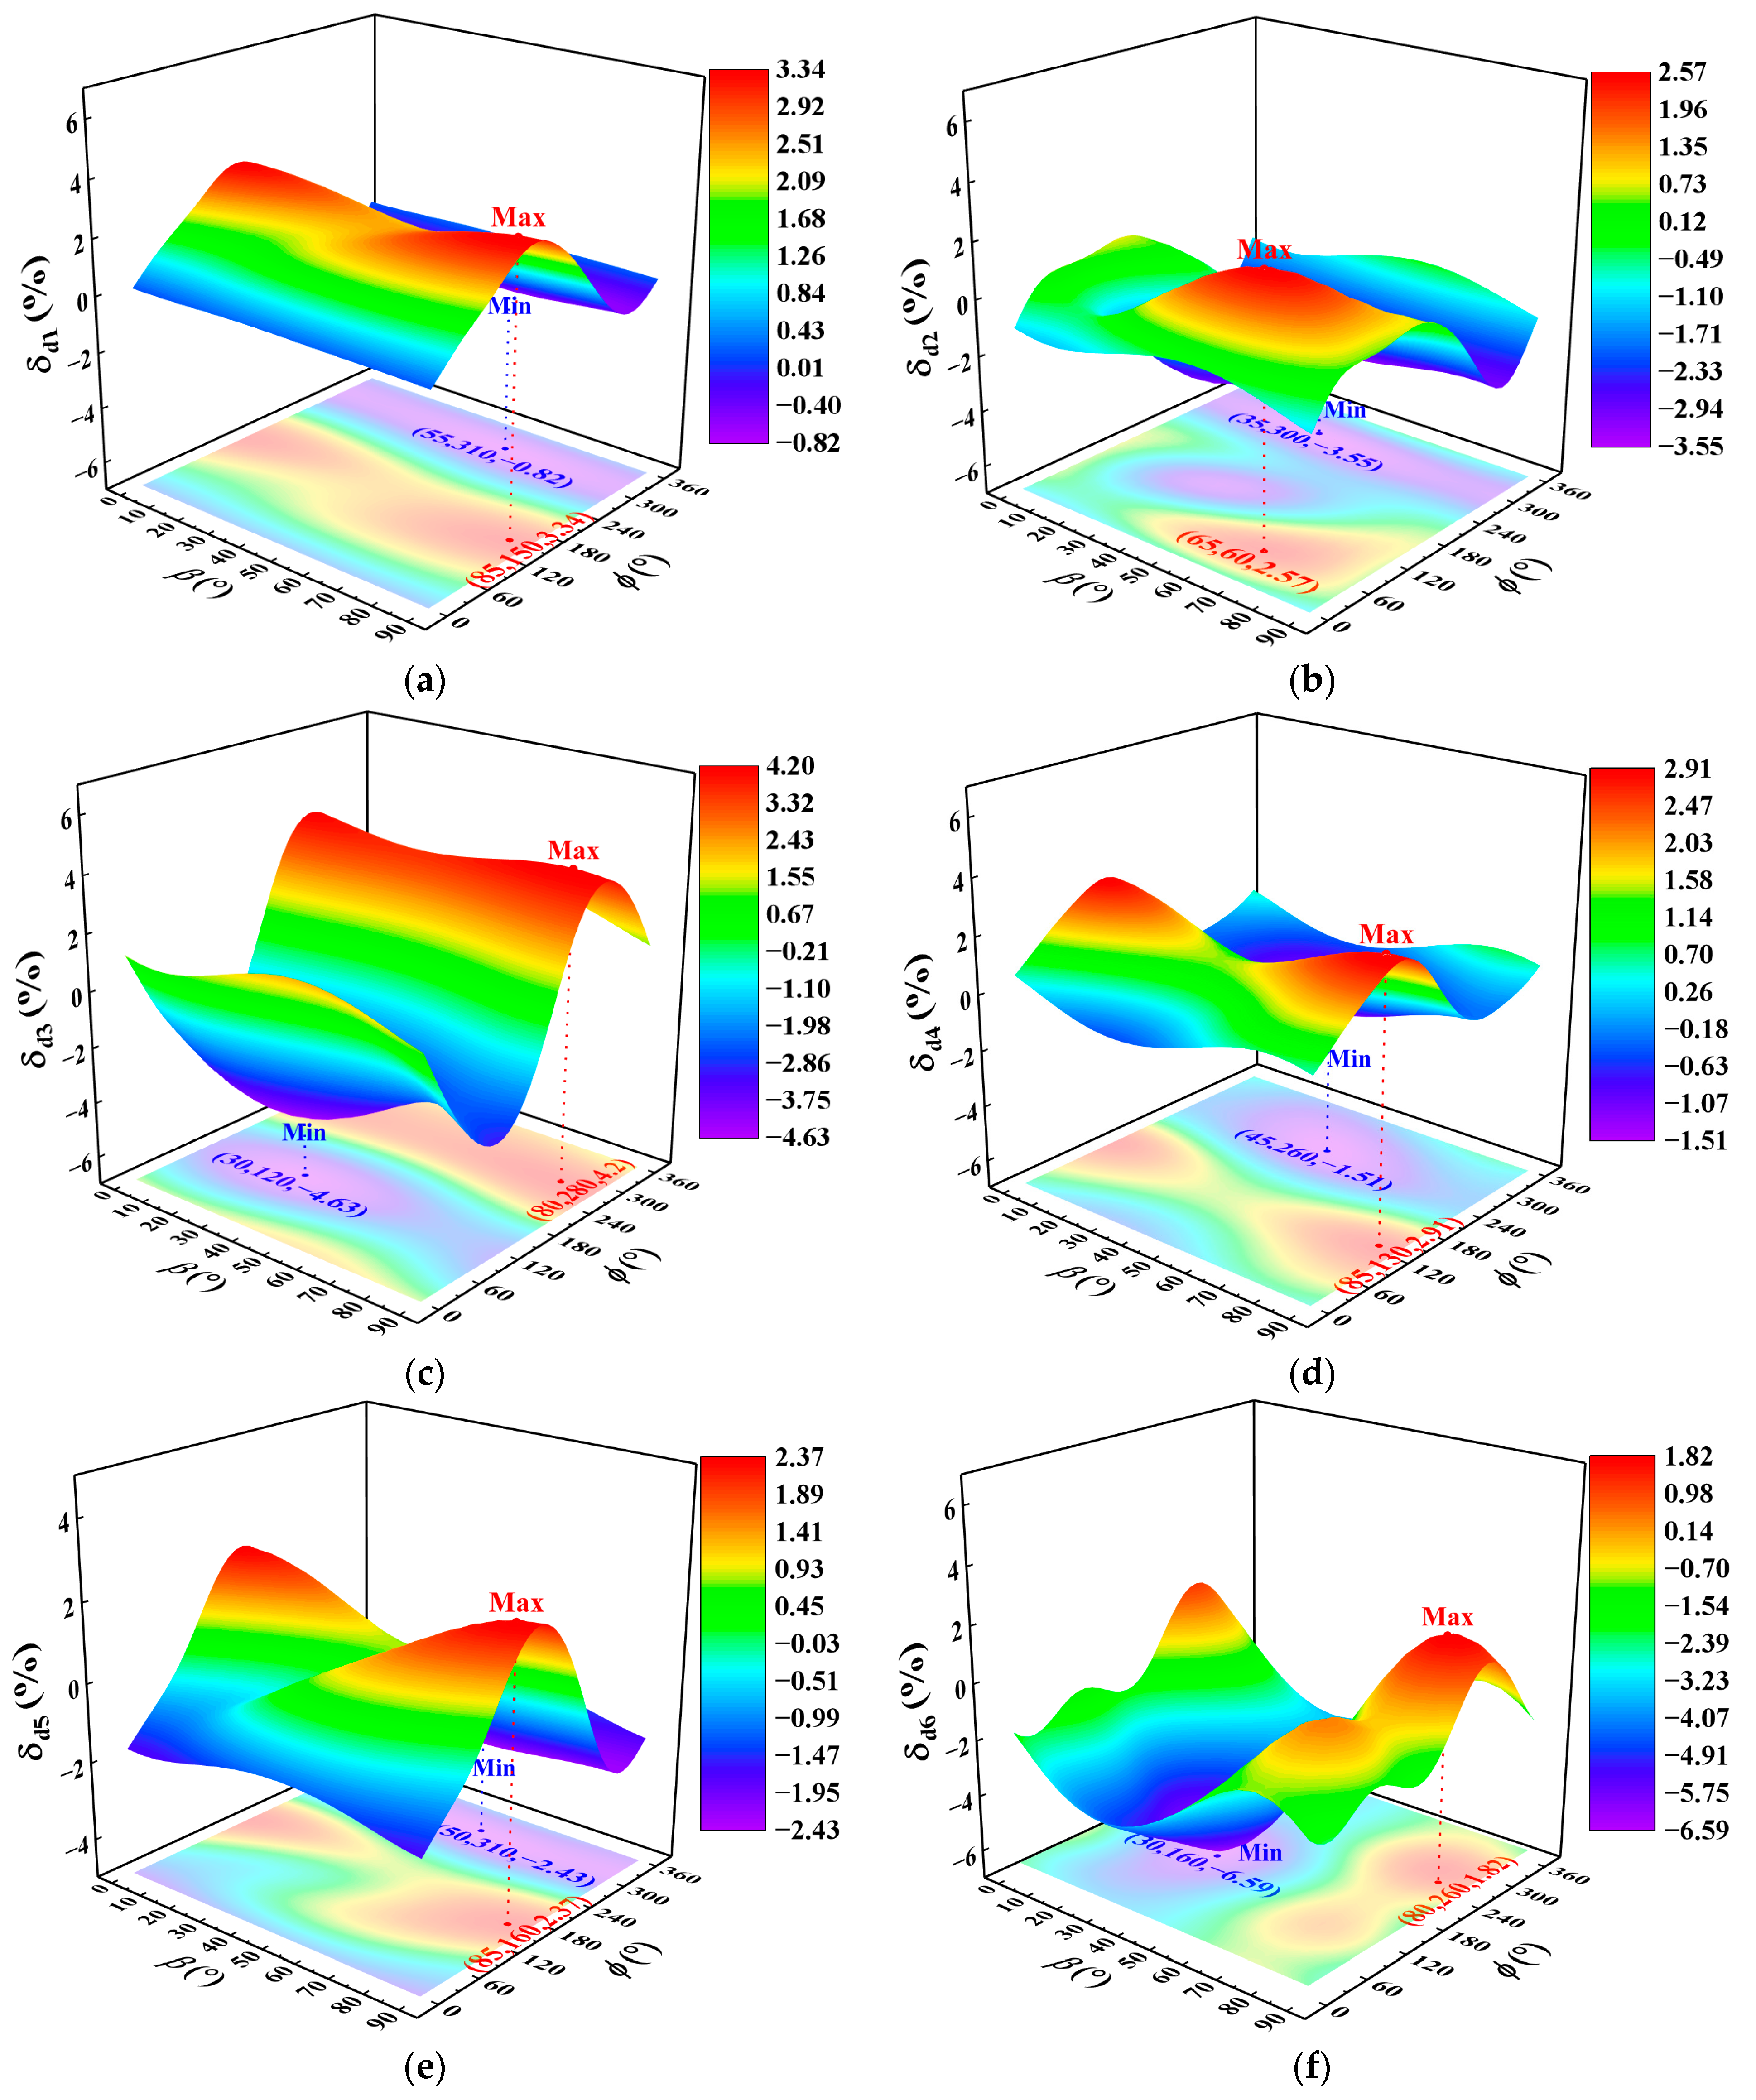
When the primary-orientation deviation angle = 15°, the sample-point combinations of the secondary-orientation deviation angle and primary-orientation angular position used in the numerical analysis are marked by black dots in Figure 17. Parameter is sampled at an interval of 5° over 0° to 90°, and is sampled at an interval of 10° over 0° to 360°. The FFD is again adopted, yielding a total of 703 sample-point combinations. The influence characteristics and magnitudes of and on the first six dynamic frequencies of the thin-walled SC turbine blade are presented in Figure 18.
Figure 17.
703 sample-point combinations for numerical analysis of and .
Figure 18.
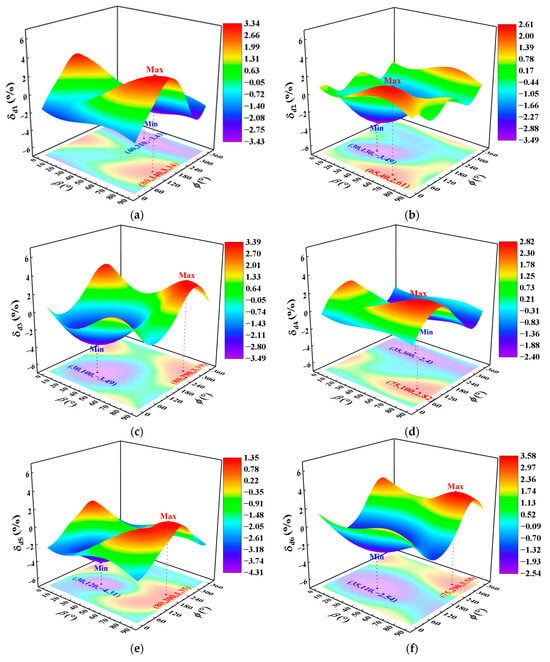
Relationship between the first six dynamic frequency deviations and , when = 15° for the thin-walled blade: (a) the 1st mode; (b) the 2nd mode; (c) the 3rd mode; (d) the 4th mode; (e) the 5th mode; and (f) the 6th mode.
Figure 18 reveals the following:
- (1)
- Each modal frequency varies with , with a period of 90°, exhibiting only one maximum and one minimum within one period.
- (2)
- For the first six dynamic frequencies, the values of corresponding to the frequency maximum converge to approximately 65° to 80°, and those corresponding to the frequency minimum converge to roughly 30° to 40°.
- (3)
- When = 15°, the amplitudes of the maximum and minimum dynamic frequency deviations of the first six modes differ from each other, and the discrepancy is remarkably large for certain modes. For instance, the maximum dynamic frequency deviation of is 1.35%, while the minimum reaches as low as −4.31%. This indicates that the conventional engineering method based on deterministic analysis, which evaluates resonance risk by adopting a fixed margin for both positive and negative deviations, can no longer meet the requirements of current refined design.
- (4)
- At the angular positions corresponding to the minimum of and , parameter exerts a slight effect on their dynamic frequencies.
- (5)
- A comparison between Figure 16 and Figure 18 reveals that the values of c corresponding to the extreme values of dynamic frequency deviations for the same mode are different. It demonstrates that the extreme values can only be obtained by traversing all three crystal-orientation parameters simultaneously.
The FFD is therefore conducted for the three crystal-orientation parameters, with the factor levels specified as follows: ranging from 0° to 15° at an increment of 3°, from 0° to 360° at an increment of 10°, and from 0° to 90° at an increment of 5°. A total of 3534 sample-point combinations are generated for the traversal analysis, as listed in Table 1. When = 0°, the value of degenerates to zero, and the dataset accordingly contains only 19 sample points corresponding to various levels of . The extreme values of the dynamic frequency deviation for each mode of the thin-walled blade, together with their corresponding crystal orientations, are summarized in Table 2.
Table 1.
DOE parameters of crystal orientation.
Table 2.
Maximum and minimum frequency deviations for the thin-walled blade.
The dynamic frequency scatter is expressed as:
where denotes the scatter of the -th order dynamic frequency, in %; denotes the maximum value of the -th order dynamic frequency deviation, in %; and denotes its minimum value, in %.
Table 2 indicates the following:
- (1)
- The crystal-orientation deviation exerts the most significant influence on the dynamic frequency of the first-order torsional mode , with a corresponding scatter of 7.14%. The first-order bending mode ranks second at 6.77%. The influence decreases successively for , and , whereas the dynamic frequency of the second-order bending mode is affected the least, with a scatter of 5.22%.
- (2)
- Among the first six modes, the extrema of the dynamic frequency deviation for most orders occur at = 15°. The exceptions are the minimum dynamic frequencies of the third and sixth modes, which are obtained at = 9°—different from the value = 12° found in Figure 16 when only the two parameters and are considered. This phenomenon occurs because parameter changes the coupled stiffness distribution of and .
- (3)
- The crystal primary orientation and angular position corresponding to the maximum dynamic frequency deviation of the first-order torsional mode () and the minimum dynamic frequency deviation of the second-order bending mode () are close to each other, namely = 15° and . Meanwhile, as illustrated in Figure 18, the secondary orientation has a weak effect over the angular range . This points to a critical worst-case combination of crystal orientations, at which the dynamic frequencies of two adjacent modes—the first-order torsional and the second-order bending—reach their minimum separation. If these two modal frequencies are already close under the nominal design orientation, the frequency separation will shrink further once the manufacturing deviation of crystal orientation is taken into account, considerably elevating the risk of bending–torsion coupled flutter, which cannot be ignored in practical engineering design.
4.1.2. Thickened-Profile SC Turbine Blades
To investigate the correlation between blade thickness and the effect of crystal-orientation deviation on the first six dynamic frequencies, the airfoil of the thin-walled SC turbine blade is uniformly thickened by 0.25 mm each on the pressure side and suction side, corresponding to a total airfoil-thickness increment of 0.5 mm. The resulting thickened-profile blade is then adopted for comparative analysis. With the designed coordinate system defined as the actual crystal coordinate system and under operating conditions identical to those of the thin-walled SC turbine blade, the first six dynamic frequencies and the corresponding mode shapes of the thickened-profile blade are presented in Figure 19. In ascending modal order, the modes are the first-order bending mode, a composite mode dominated by first-order bending, the first-order torsional mode, the second-order bending mode, a high-order composite mode and the first-order chordwise bending mode. Distinct differences in the 3rd, 4th and 5th mode shapes can be observed compared with those of the thin-walled blade.
Figure 19.
First six mode shapes of thickened-profile SC turbine blades: (a) the 1st mode; (b) the 2nd mode; (c) the 3rd mode; (d) the 4th mode; (e) the 5th mode; and (f) the 6th mode.
When the secondary-orientation deviation angle = 0°, the numerical analysis is performed over the same sample-point combinations as those adopted for the thin-walled SC turbine blade. The trends and magnitudes of the influence of and on the first six dynamic frequencies of the thickened-profile SC turbine blade are illustrated in Figure 20.
Figure 20.
Relationship between the first six dynamic frequency deviations and , when = 0° for the thickened-profile blade: (a) the 1st mode; (b) the 2nd mode; (c) the 3rd mode; (d) the 4th mode; (e) the 5th mode; and (f) the 6th mode.
As shown in Figure 20, in contrast to the thin-walled blade, the first-order chordwise bending mode of the thickened-profile blade exhibits two maxima and two minima of unequal amplitude within one period of = 360°, and the angular-position offset between the larger maximum and the smaller minimum is approximately 240°. By contrast, each of the remaining five modes possesses only one maximum and one minimum within a period, with the angular-position offset ranging from approximately 150° to 160°.
When the primary-orientation deviation angle = 15°, the numerical calculation is carried out using the same sample-point combinations as those adopted for the thin-walled SC turbine blade. The trends and magnitudes of the influence of and on the first six modal dynamic frequencies of the thickened-profile SC turbine blade are presented in Figure 21.
Figure 21.
Relationship between the first six dynamic frequency deviations and , when = 15° for the thickened-profile blade: (a) the 1st mode; (b) the 2nd mode; (c) the 3rd mode; (d) the 4th mode; (e) the 5th mode; and (f) the 6th mode.
Figure 21 reveals the following:
- (1)
- For most of the first six modes, the values of at which the dynamic frequency reaches its maximum cluster within a narrow range of approximately 80–85°. The exception is the 2nd mode (), for which the maximum dynamic frequency occurs at = 60°. The values of corresponding to the minimum dynamic frequencies cluster within 30°–55°, albeit over a slightly wider range.
- (2)
- At the angular positions corresponding to the minima of , , and the maximum frequency of , parameter exerts only a slight effect on the dynamic frequencies.
Using the same sample-point combinations as those for the thin-walled blade, the extreme values of the dynamic frequency deviation and their corresponding crystal orientations for the thickened-profile blade at each modal order are summarized in Table 3.
Table 3.
Maximum and minimum frequency deviations for the thickened-profile blade.
As listed in Table 3, the crystal-orientation deviation exerts the most pronounced influence on the dynamic frequency of the first-order torsional mode of the thickened-profile blade, with a frequency scatter of 8.82%—1.68 percentage points higher than that of the thin-walled blade. The first-order chordwise bending mode ranks second with a scatter of 8.41%, an increase of 1.91 percentage points relative to the thin-walled blade, followed in turn by , and . The first-order bending mode is least sensitive to orientation deviation, with a scatter of 4.22%—2.55 percentage points lower than that of the thin-walled blade. This demonstrates that airfoil-geometry optimization, such as thickness adjustment, is a promising means of mitigating the orientation-induced frequency scatter of the modes of interest.
For both the thin-walled and the thickened-profile blades, the influence of crystal orientation on the modal frequencies varies markedly across modes: certain modes are strongly affected, with a frequency scatter exceeding 8.8%, whereas others are only slightly affected, with scatter as low as 4.2%. The magnitude of the orientation-induced frequency scatter is blade-dependent; changes in blade dimension and airfoil geometry rearrange the sensitivity ranking of the individual modes. Consequently, the conventional anti-resonance design with a fixed frequency margin tends to be over-conservative for some modes yet risky for others. It is therefore essential to perform an uncertainty-based resonance analysis of SC blades that explicitly accounts for crystal-orientation deviation.
4.2. Variation in Blade Dynamic Frequencies Versus Other Uncertain Parameters
4.2.1. Airfoil-Casting Thickness Deviation
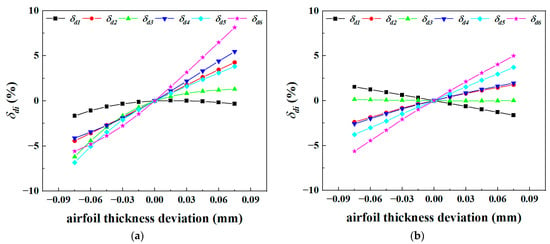
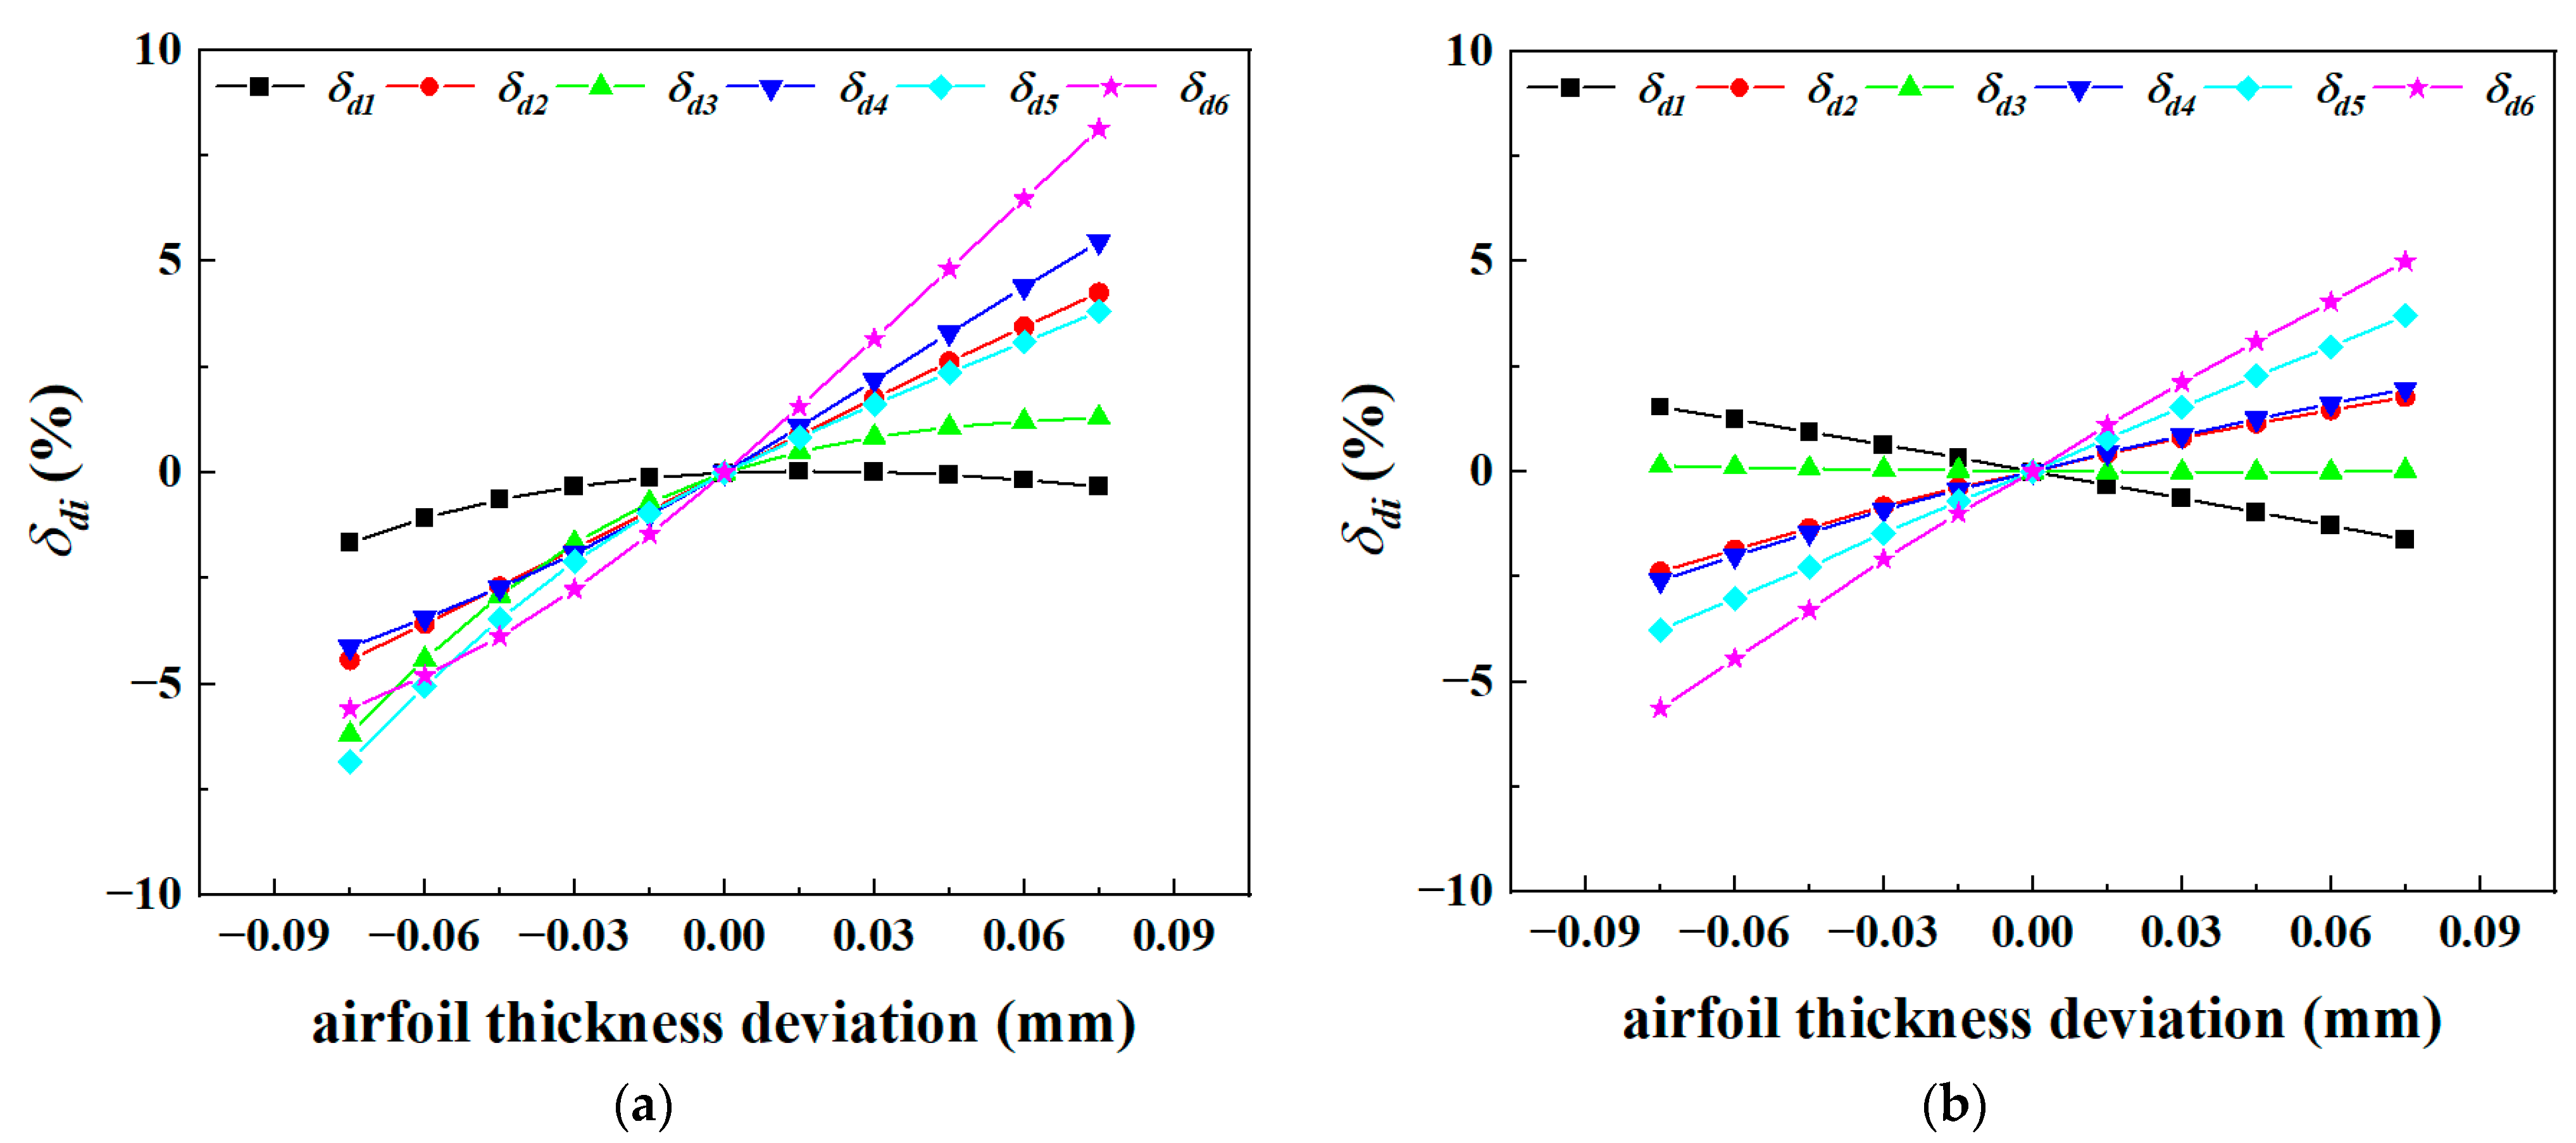
With the airfoil-casting thickness tolerance set at ±0.075 mm, the magnitude and variation pattern of its influence on the first six modal dynamic frequencies of the thin-walled and thickened-profile SC turbine blades are first investigated, as plotted in Figure 22. A turbine blade is formed by the radial stacking of multiple airfoil profiles, and thickness deviations may occur on either the pressure or suction side of each profile at different streamwise locations. Consequently, an exhaustive parametric study covering all combinations of profile thickness deviations is impracticable. To quantify the uncertainty introduced by airfoil-casting thickness deviation, a simplified modeling strategy is therefore adopted in this paper: the entire blade profile is uniformly offset by a fixed deviation relative to the nominal design airfoil parameters. Although this simplification may omit certain unfavorable thickness combinations corresponding to extreme dynamic frequencies, it efficiently captures the frequency–thickness correlation and yields results close to the actual extreme values.
Figure 22.
Relationship between dynamic frequency deviations of the first six modes of turbine blades and casting-thickness deviation: (a) thin-walled blade; (b) thickened-profile blade.
Figure 22a reveals the following:
- (1)
- Within the casting tolerance range of the thin-walled blade, the dynamic frequency deviations ~ for the 2nd to 6th modes increase monotonically with airfoil thickness deviation, indicating that the thickness-induced increment of modal stiffness exceeds that of modal mass for these modes. By contrast, the deviation of the first bending mode initially rises, peaks at a thickness deviation of +0.015 mm, and subsequently declines. This trend reveals that the stiffness increment outpaces the mass increment at small thickness, the two increments become nearly equivalent at +0.015 mm, and any further thickness growth drives the stiffness increment below the mass increment.
- (2)
- The airfoil thickness tolerance of the thin-walled blade exerts the most pronounced influence on of first-order chordwise bending mode, producing a dynamic frequency scatter of approximately 13.7%. Ranked in descending order of influence are of the high-order composite mode, of the second-order bending mode, of the first-order-bending-dominated composite mode, and of the first-order torsional mode, whose frequency scatters range from 7.5% to 10.7%. The effect on of the first-order bending mode is the weakest, at only about 1.7%. Hence, airfoil-casting deviation imposes a considerable impact on the dynamic frequencies of thin-walled SC turbine blades, and the influence of fabrication tolerance cannot be neglected in the design of thin-walled SC turbine blades.
Figure 22b reveals the following:
- (1)
- Among all modes of the thickened-profile blade, airfoil thickness tolerance has the most significant effect on of the first-order chordwise bending mode, with a dynamic frequency scatter of approximately 10.6%. Sorted in descending order of influence magnitude are of the high-order composite mode, of the second-order bending mode, of the first-order-bending-dominated composite mode and of the first-order bending mode, whose dynamic frequency scatters range from 3.2% to 7.5%. The influence on of the first-order torsional mode is the minimum, at roughly 0.1%. Compared with the thin-walled blade, the overall influence of airfoil-casting deviation declines for most modes of the thickened-profile blade, except a few individual modes, yet it remains non-negligible.
- (2)
- Unlike the thin-walled blade, of the first-order bending mode of the thickened-profile blade decreases as the airfoil thickness rises, with a frequency scatter of 3.2%, 1.5 percentage points higher than that of the thin-walled blade. The first-order torsional mode is barely sensitive to thickness variation, exhibiting a scatter of only 0.14%, far lower than the 7.5% of the thin-walled blade. These observations reveal that modal frequency rises with airfoil thickness deviation below a critical thickness and decreases above it, while near the critical thickness the influence of thickness deviation on frequency becomes weak. This finding is of great significance for the frequency-tuning design of critical dangerous modes.
- (3)
- In comparison with the thin-walled blade, airfoil thickness deviation displays the same nearly linear positive correlation with and ~ of the thickened-profile blade, but the corresponding influence magnitude drops markedly. For example, regarding the second bending mode, the dynamic frequency scatter is 9.6% for the thin-walled blade versus only 4.6% for the thickened-profile blade. This demonstrates that adjusting blade thickness is an effective design approach for suppressing the casting-tolerance-induced scatter of target modal frequencies during turbine blade design.
It is further worth noting that variations in crystal orientation only moderately alter the magnitude of the thickness effect on each modal frequency, whereas the corresponding variation pattern remains essentially unchanged.
4.2.2. Material- and Load-Parameter Deviations
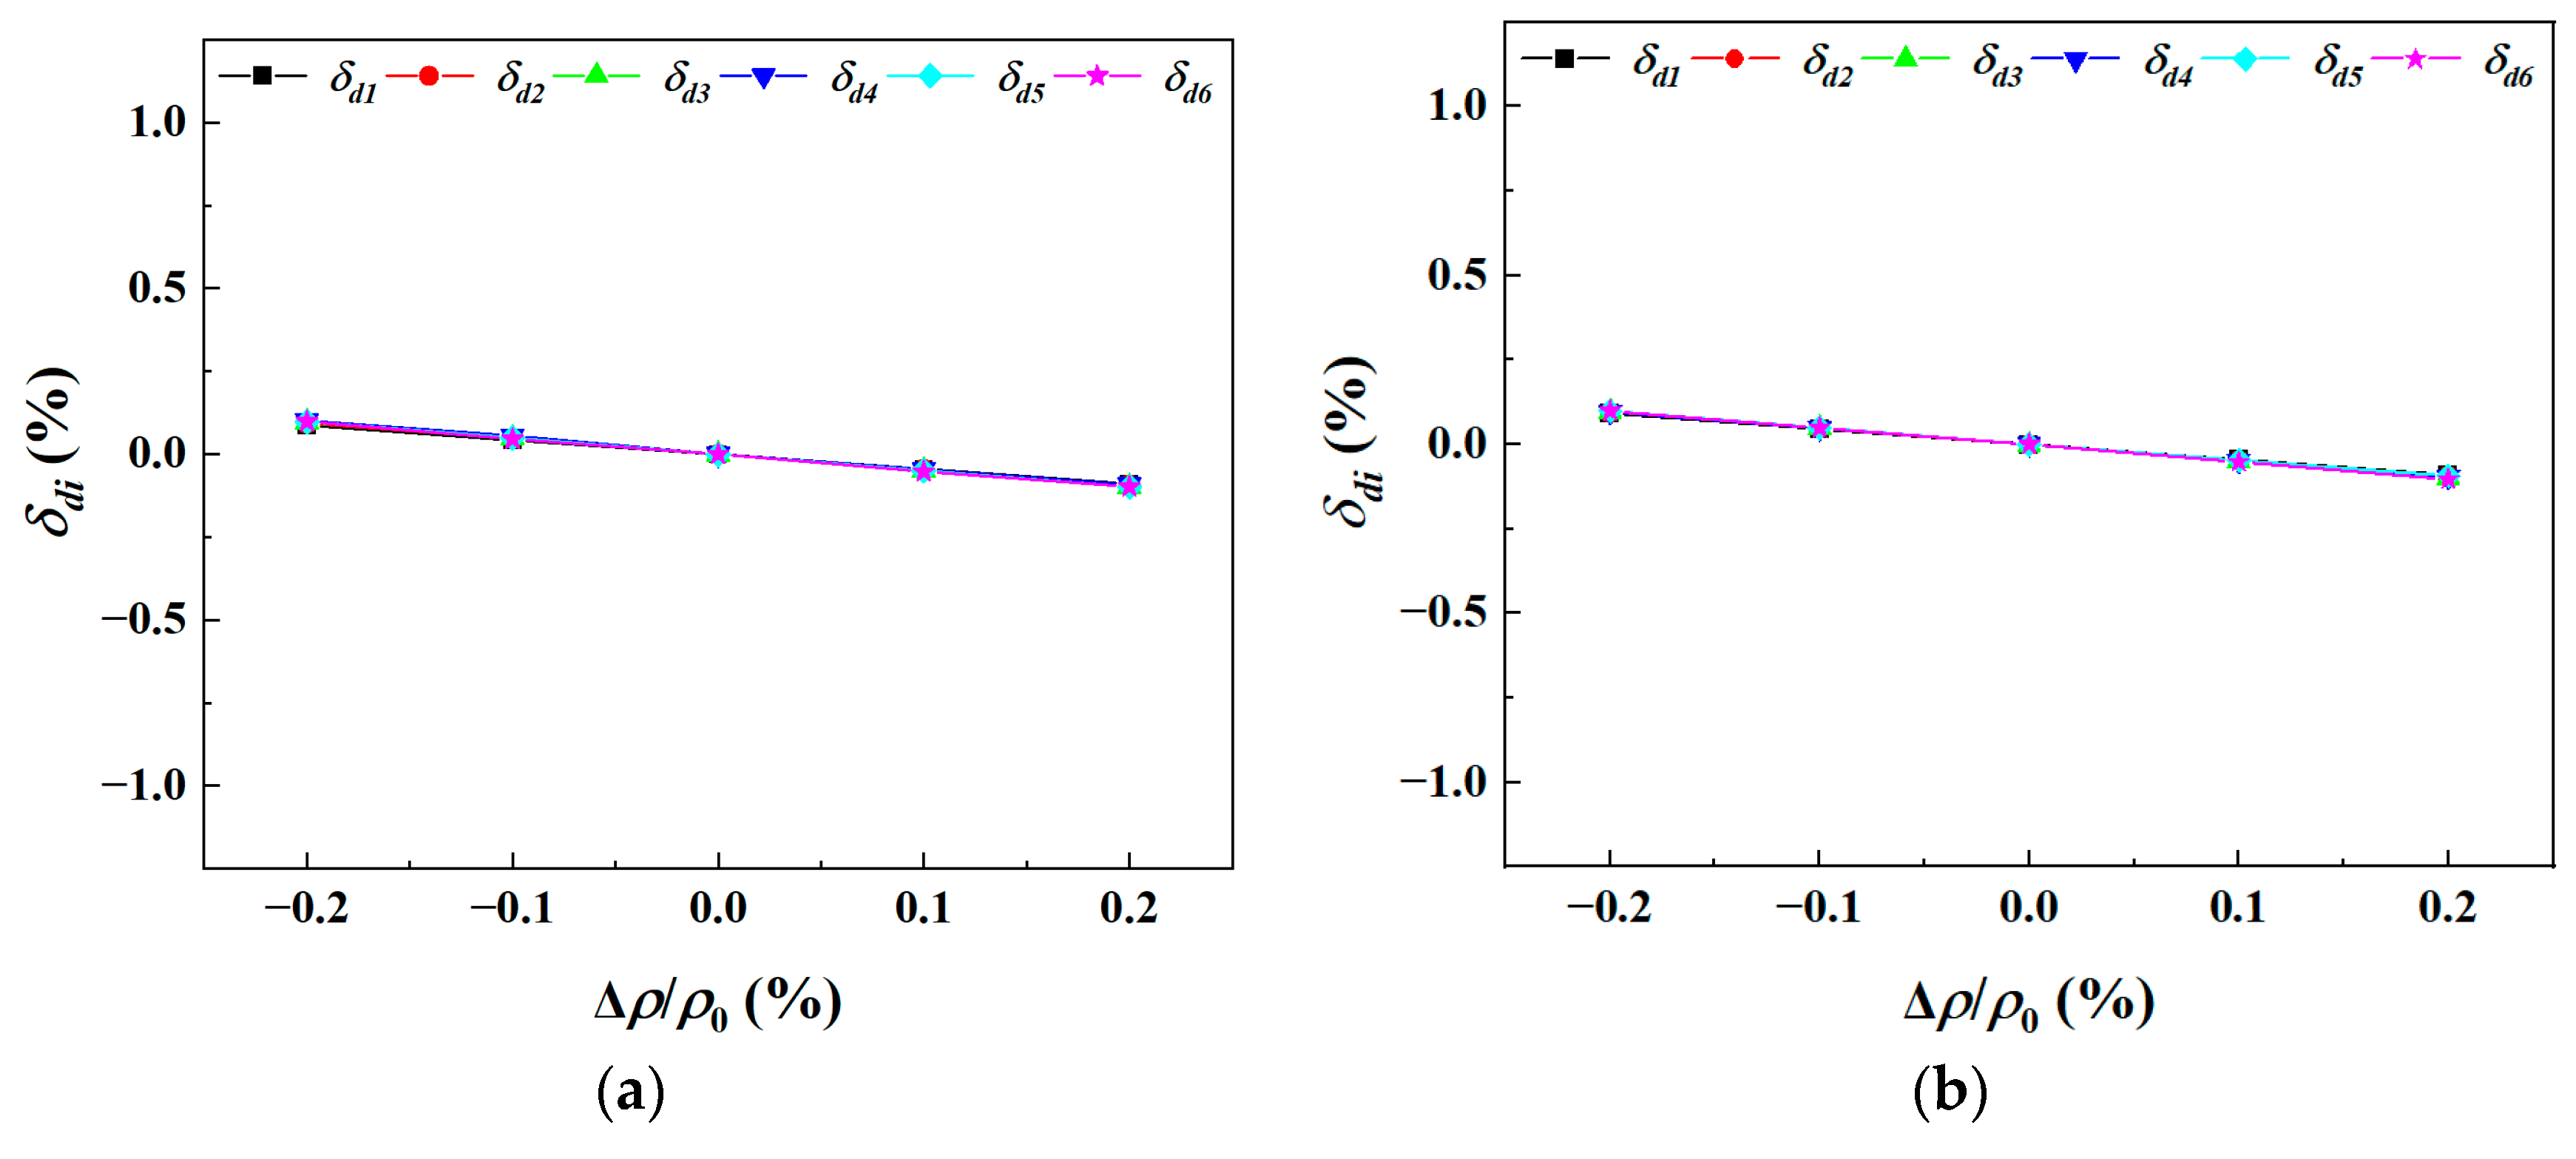
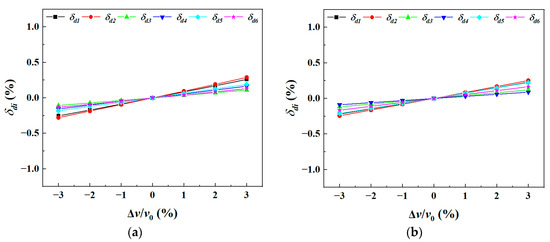
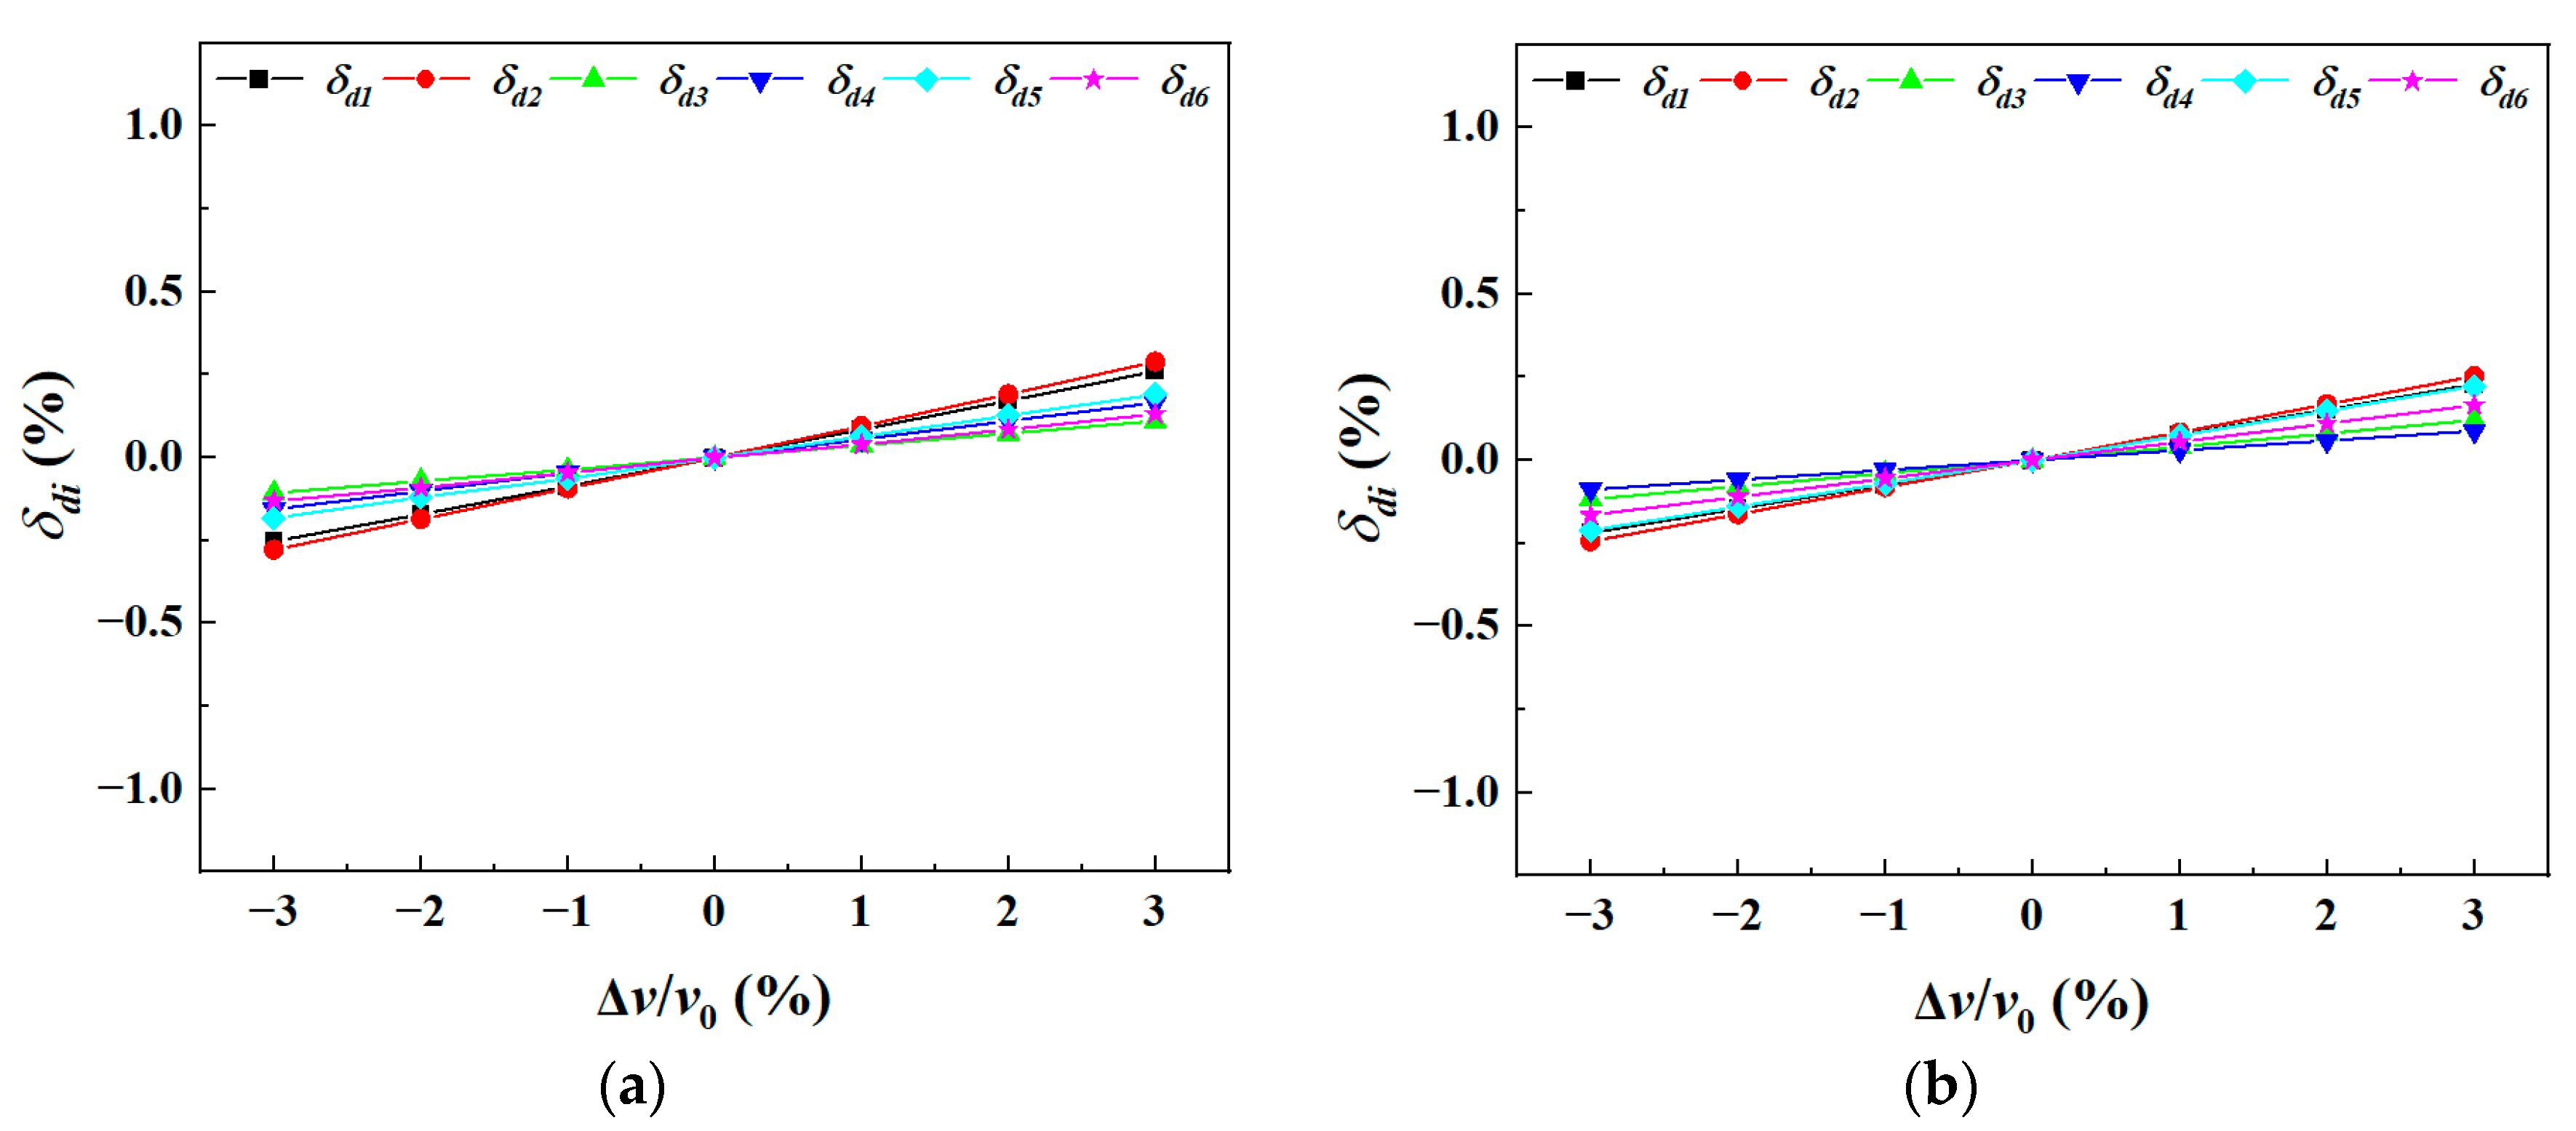
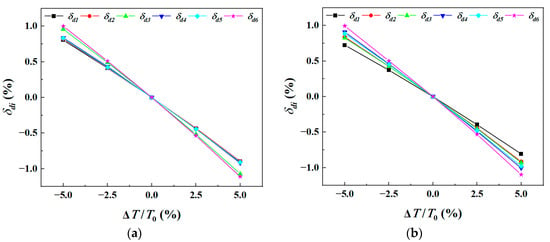
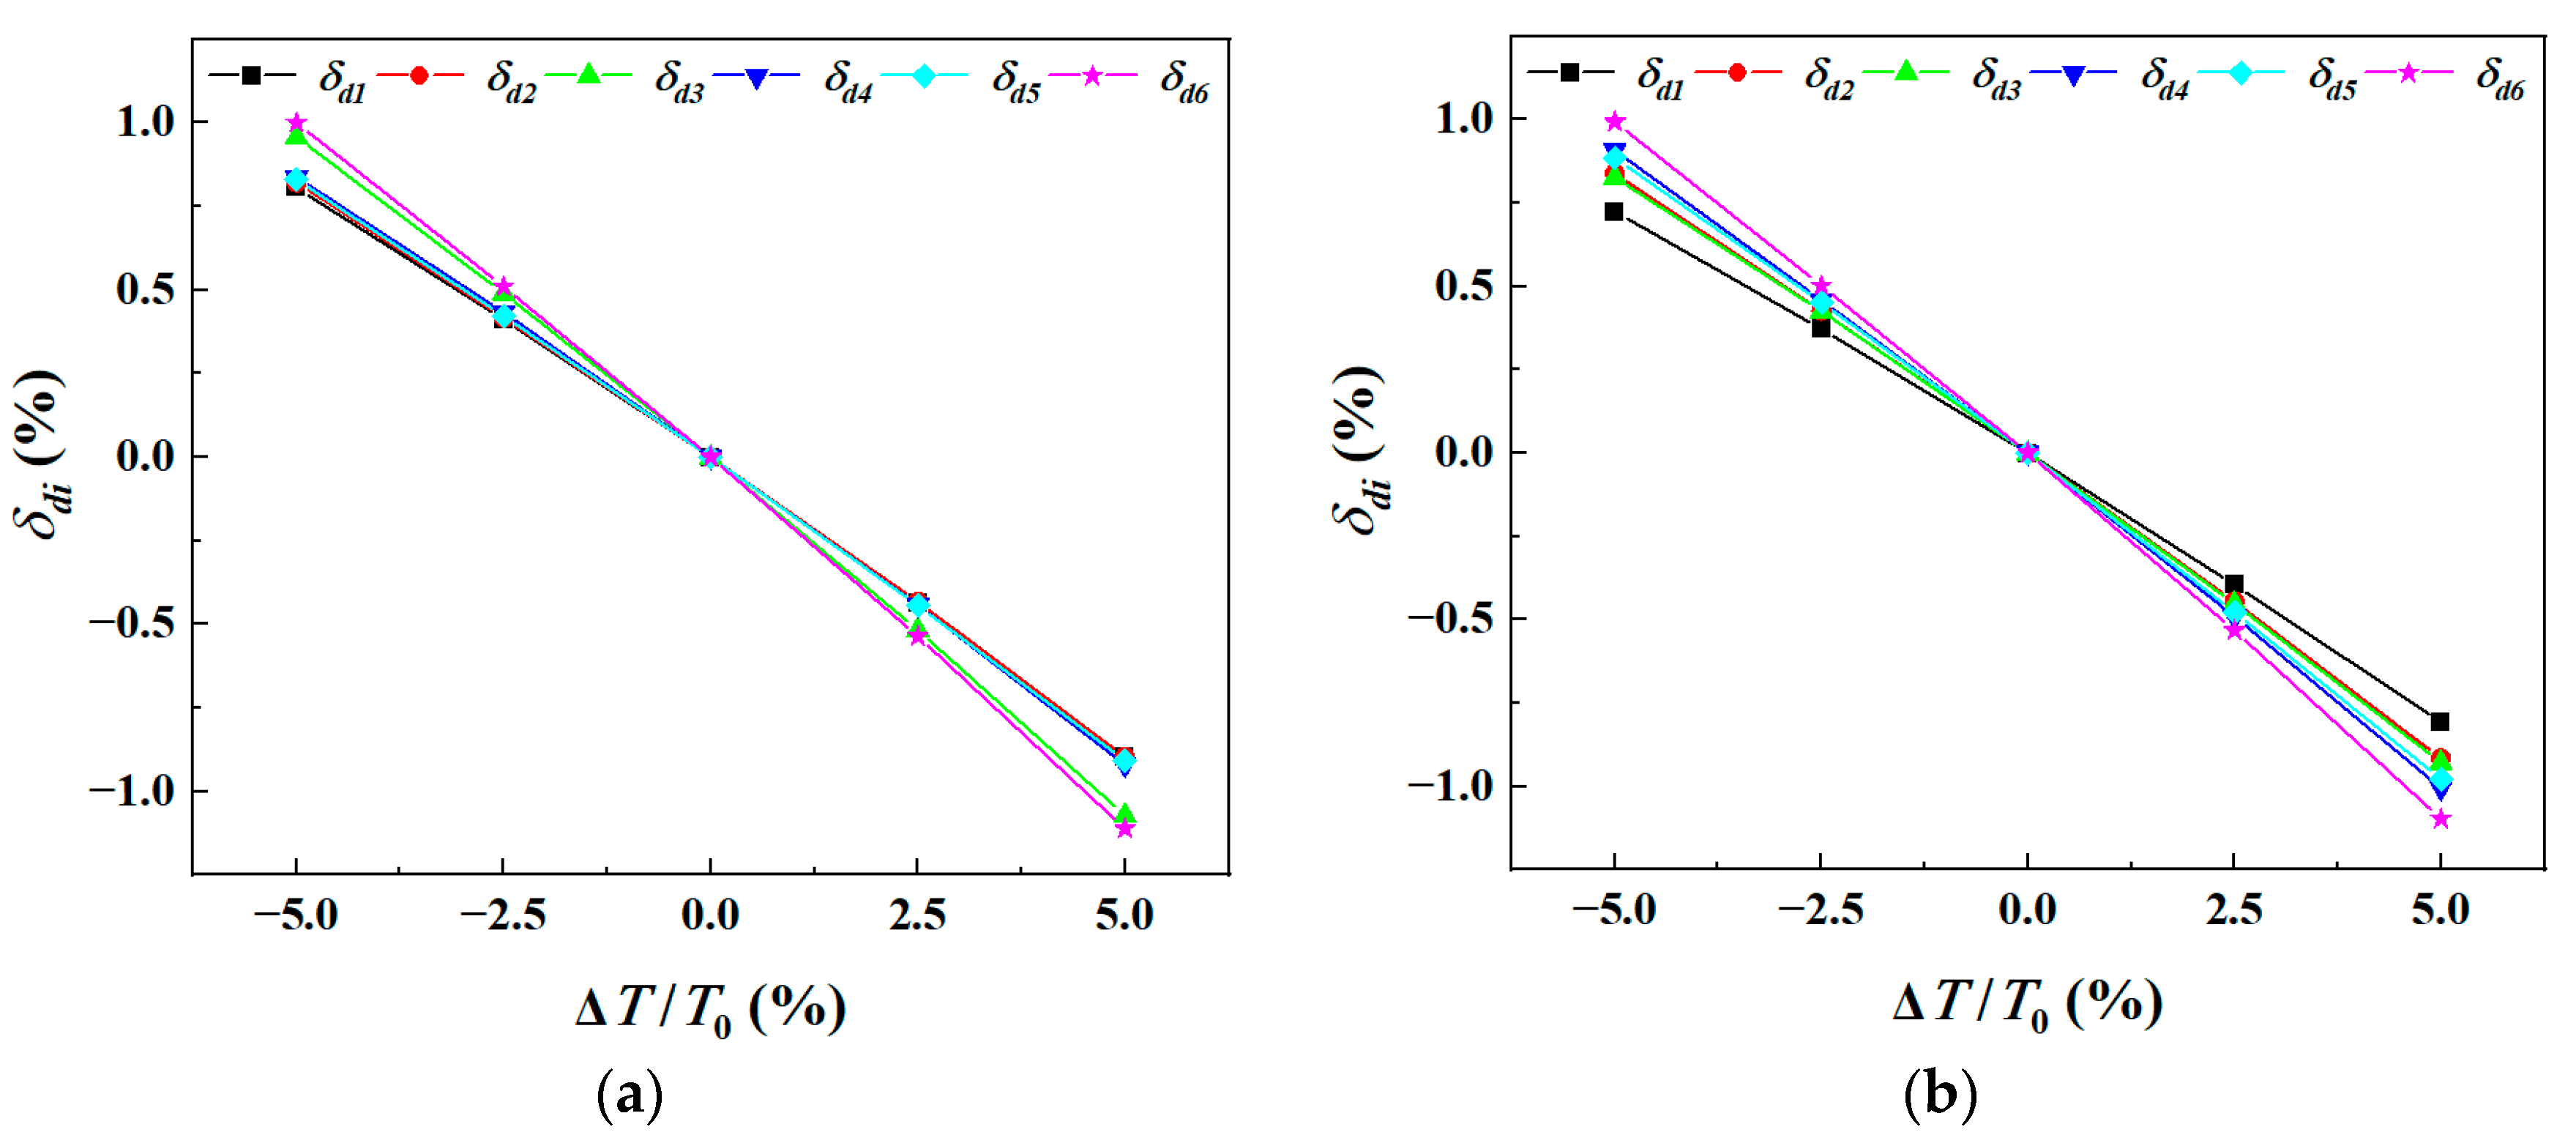
Material scatters [32,33]—comprising density of ±0.2%, elastic modulus along the SC <001> direction of ±3%, shear modulus of ±3% and Poisson’s ratio of ±3%—together with a thermal load scatter of ±5%, are quantified as non-probabilistic interval variables. Among the uncertain parameters considered, crystal orientation, airfoil thickness and density are independent uncertain parameters. The [001] elastic modulus, [001] shear modulus and [001] Poisson’s ratio are correlated with temperature. For simplification, these three material parameters are assumed to fluctuate uniformly at each temperature level, and the potential difference in fluctuation ranges across various temperatures is neglected. The influence magnitude and variation laws of these uncertain parameters on the dynamic frequencies of both thin-walled and thickened-profile SC turbine blades are investigated, as shown in Figure 23, Figure 24, Figure 25, Figure 26 and Figure 27. When evaluating the effect of a single uncertain parameter, all other uncertain parameters are fixed at their respective mid-interval values. Herein, and , and , and , and , and denote the nominal midpoint value and variable increment of density, elastic modulus, shear modulus, Poisson’s ratio, and temperature field, respectively.
Figure 23.
Relationship between dynamic frequency deviations of the first six modes of turbine blades and density deviation: (a) thin-walled blade; (b) thickened-profile blade.
Figure 24.
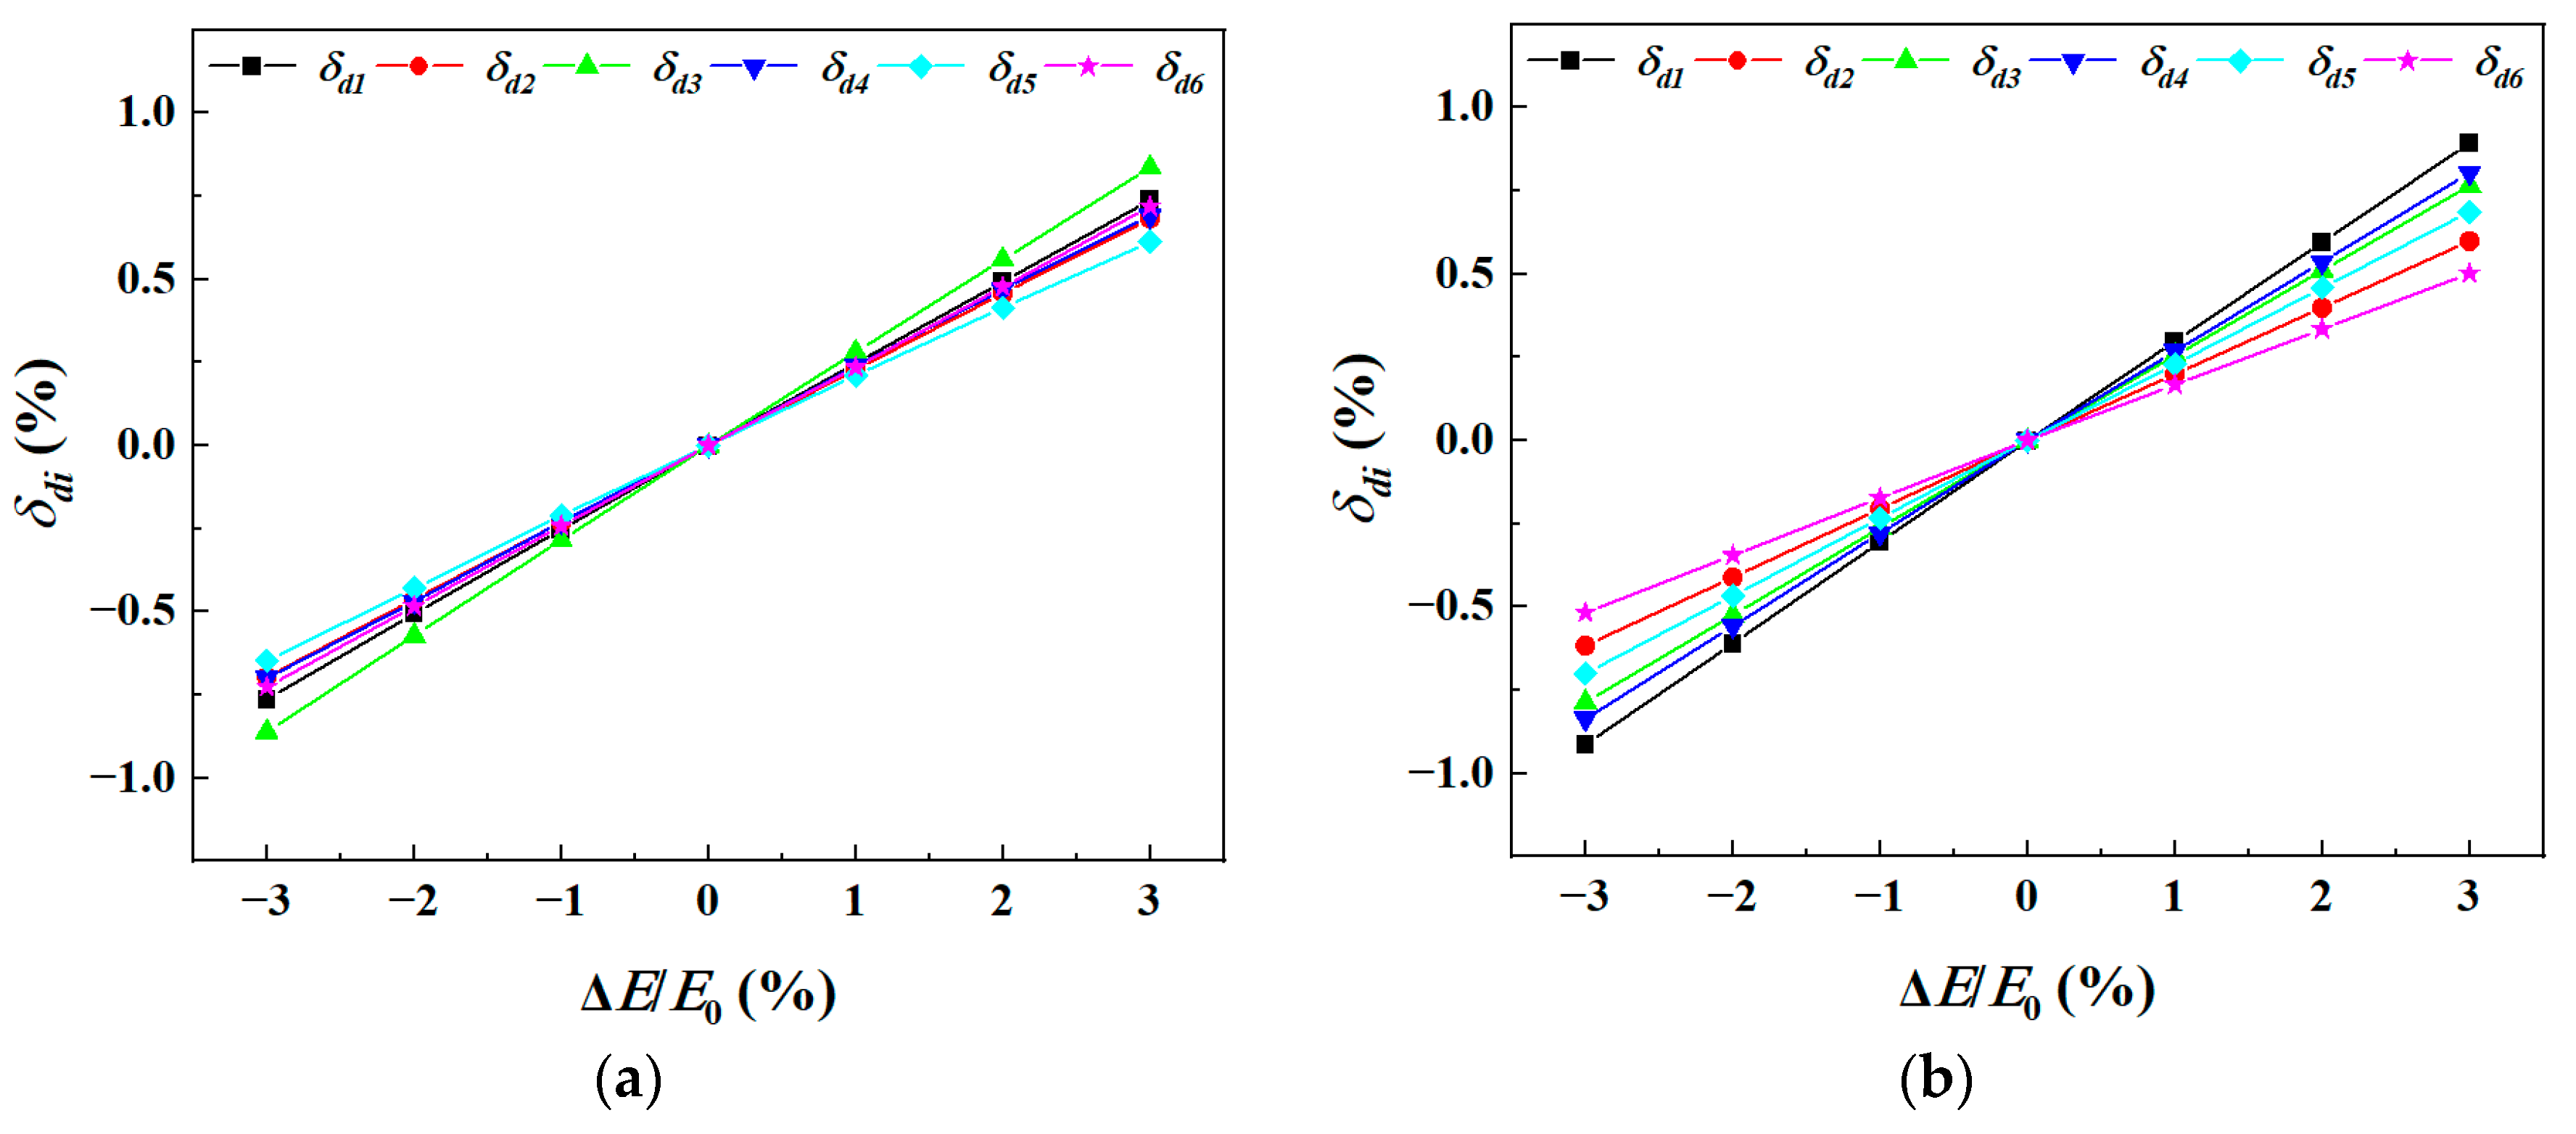
Relationship between dynamic frequency deviations of the first six modes of turbine blades and elastic modulus deviation: (a) thin-walled blade; (b) thickened-profile blade.
Figure 25.
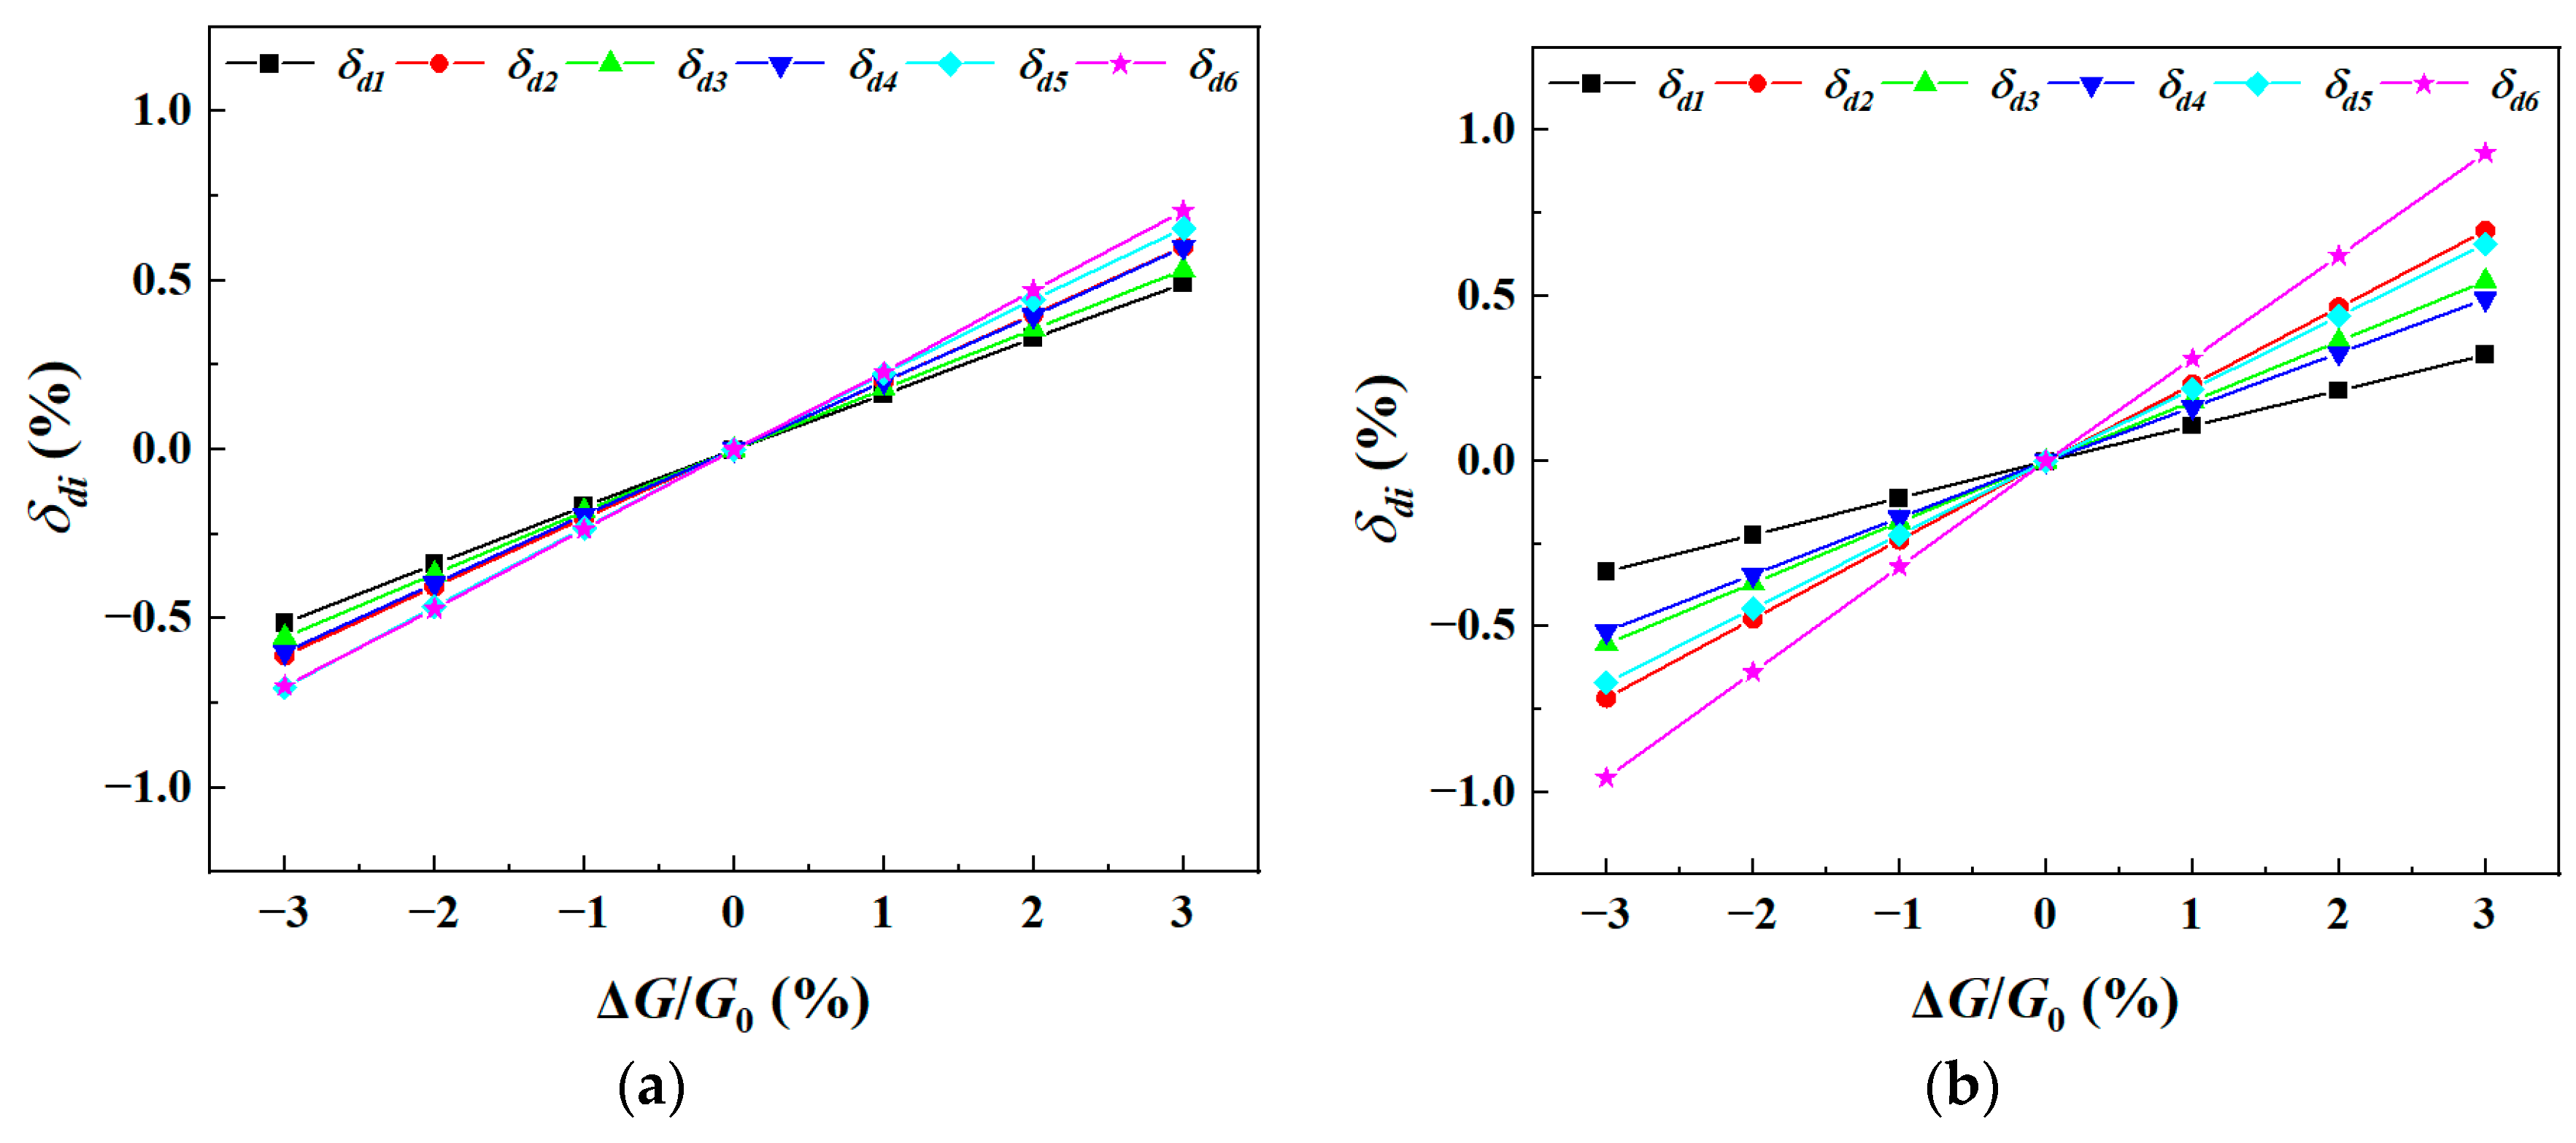
Relationship between dynamic frequency deviations of the first six modes of turbine blades and shear modulus deviation: (a) thin-walled blade; (b) thickened-profile blade.
Figure 26.
Relationship between dynamic frequency deviations of the first six modes of turbine blades and Poisson’s ratio deviation: (a) thin-walled blade; (b) thickened-profile blade.
Figure 27.
Relationship between dynamic frequency deviations of the first six modes of turbine blades and temperature field deviation: (a) thin-walled blade; (b) thickened-profile blade.
The results indicate the following:
- (1)
- In general, compared with the effects induced by crystal-orientation and airfoil-casting deviation, uncertain material and load parameters exert weaker influences on each modal dynamic frequency, and the resulting frequency scatter is contained within 2.2%.
- (2)
- The modal frequencies are positively correlated with elastic modulus, shear modulus and Poisson’s ratio, since increases in these three parameters enhance modal stiffness. The dynamic frequency scatters induced by elastic modulus and shear modulus range from 1% to 1.8%, whereas Poisson’s ratio causes frequency scatters below 0.6%. The disparate parameter sensitivities across modes arise from unequal modal stiffness changes triggered by identical material-parameter increments, which in turn stems from the anisotropy of the SC material: distinct modal stiffness matrices bear different proportional relations to the elastic modulus, shear modulus, and Poisson’s ratio along the SC <001> crystal direction.
- (3)
- The frequencies are negatively correlated with density, and all modes share identical sensitivity to density variation, because increasing density yields proportional growth of modal mass for every order. Benefiting from the small density scatter, the corresponding dynamic frequency scatters are merely around 0.2%.
- (4)
- The dynamic frequency scatters caused by temperature field range from 1.5% to 2.2%. The frequencies decrease as temperature rises, primarily because of the degradation of elastic modulus and shear modulus at elevated temperature and the consequent reduction in modal stiffness.
- (5)
- The uncertain material and thermal load parameters produce identical variation trends in the dynamic frequencies of the thickened-profile and thin-walled blades, with overall comparable influence magnitudes; only minor discrepancies in sensitivity and ranking arise for specific modal orders.
5. Uncertainty Analysis on Vibration Characteristics of Thin-Walled SC Turbine Blades
5.1. Uncertain Vibration Analysis of Thin-Walled SC Turbine Blades
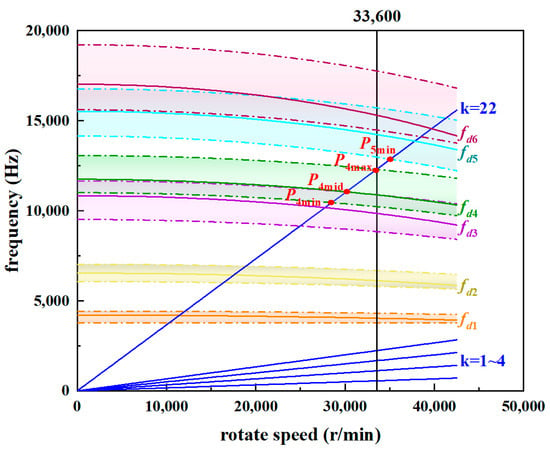
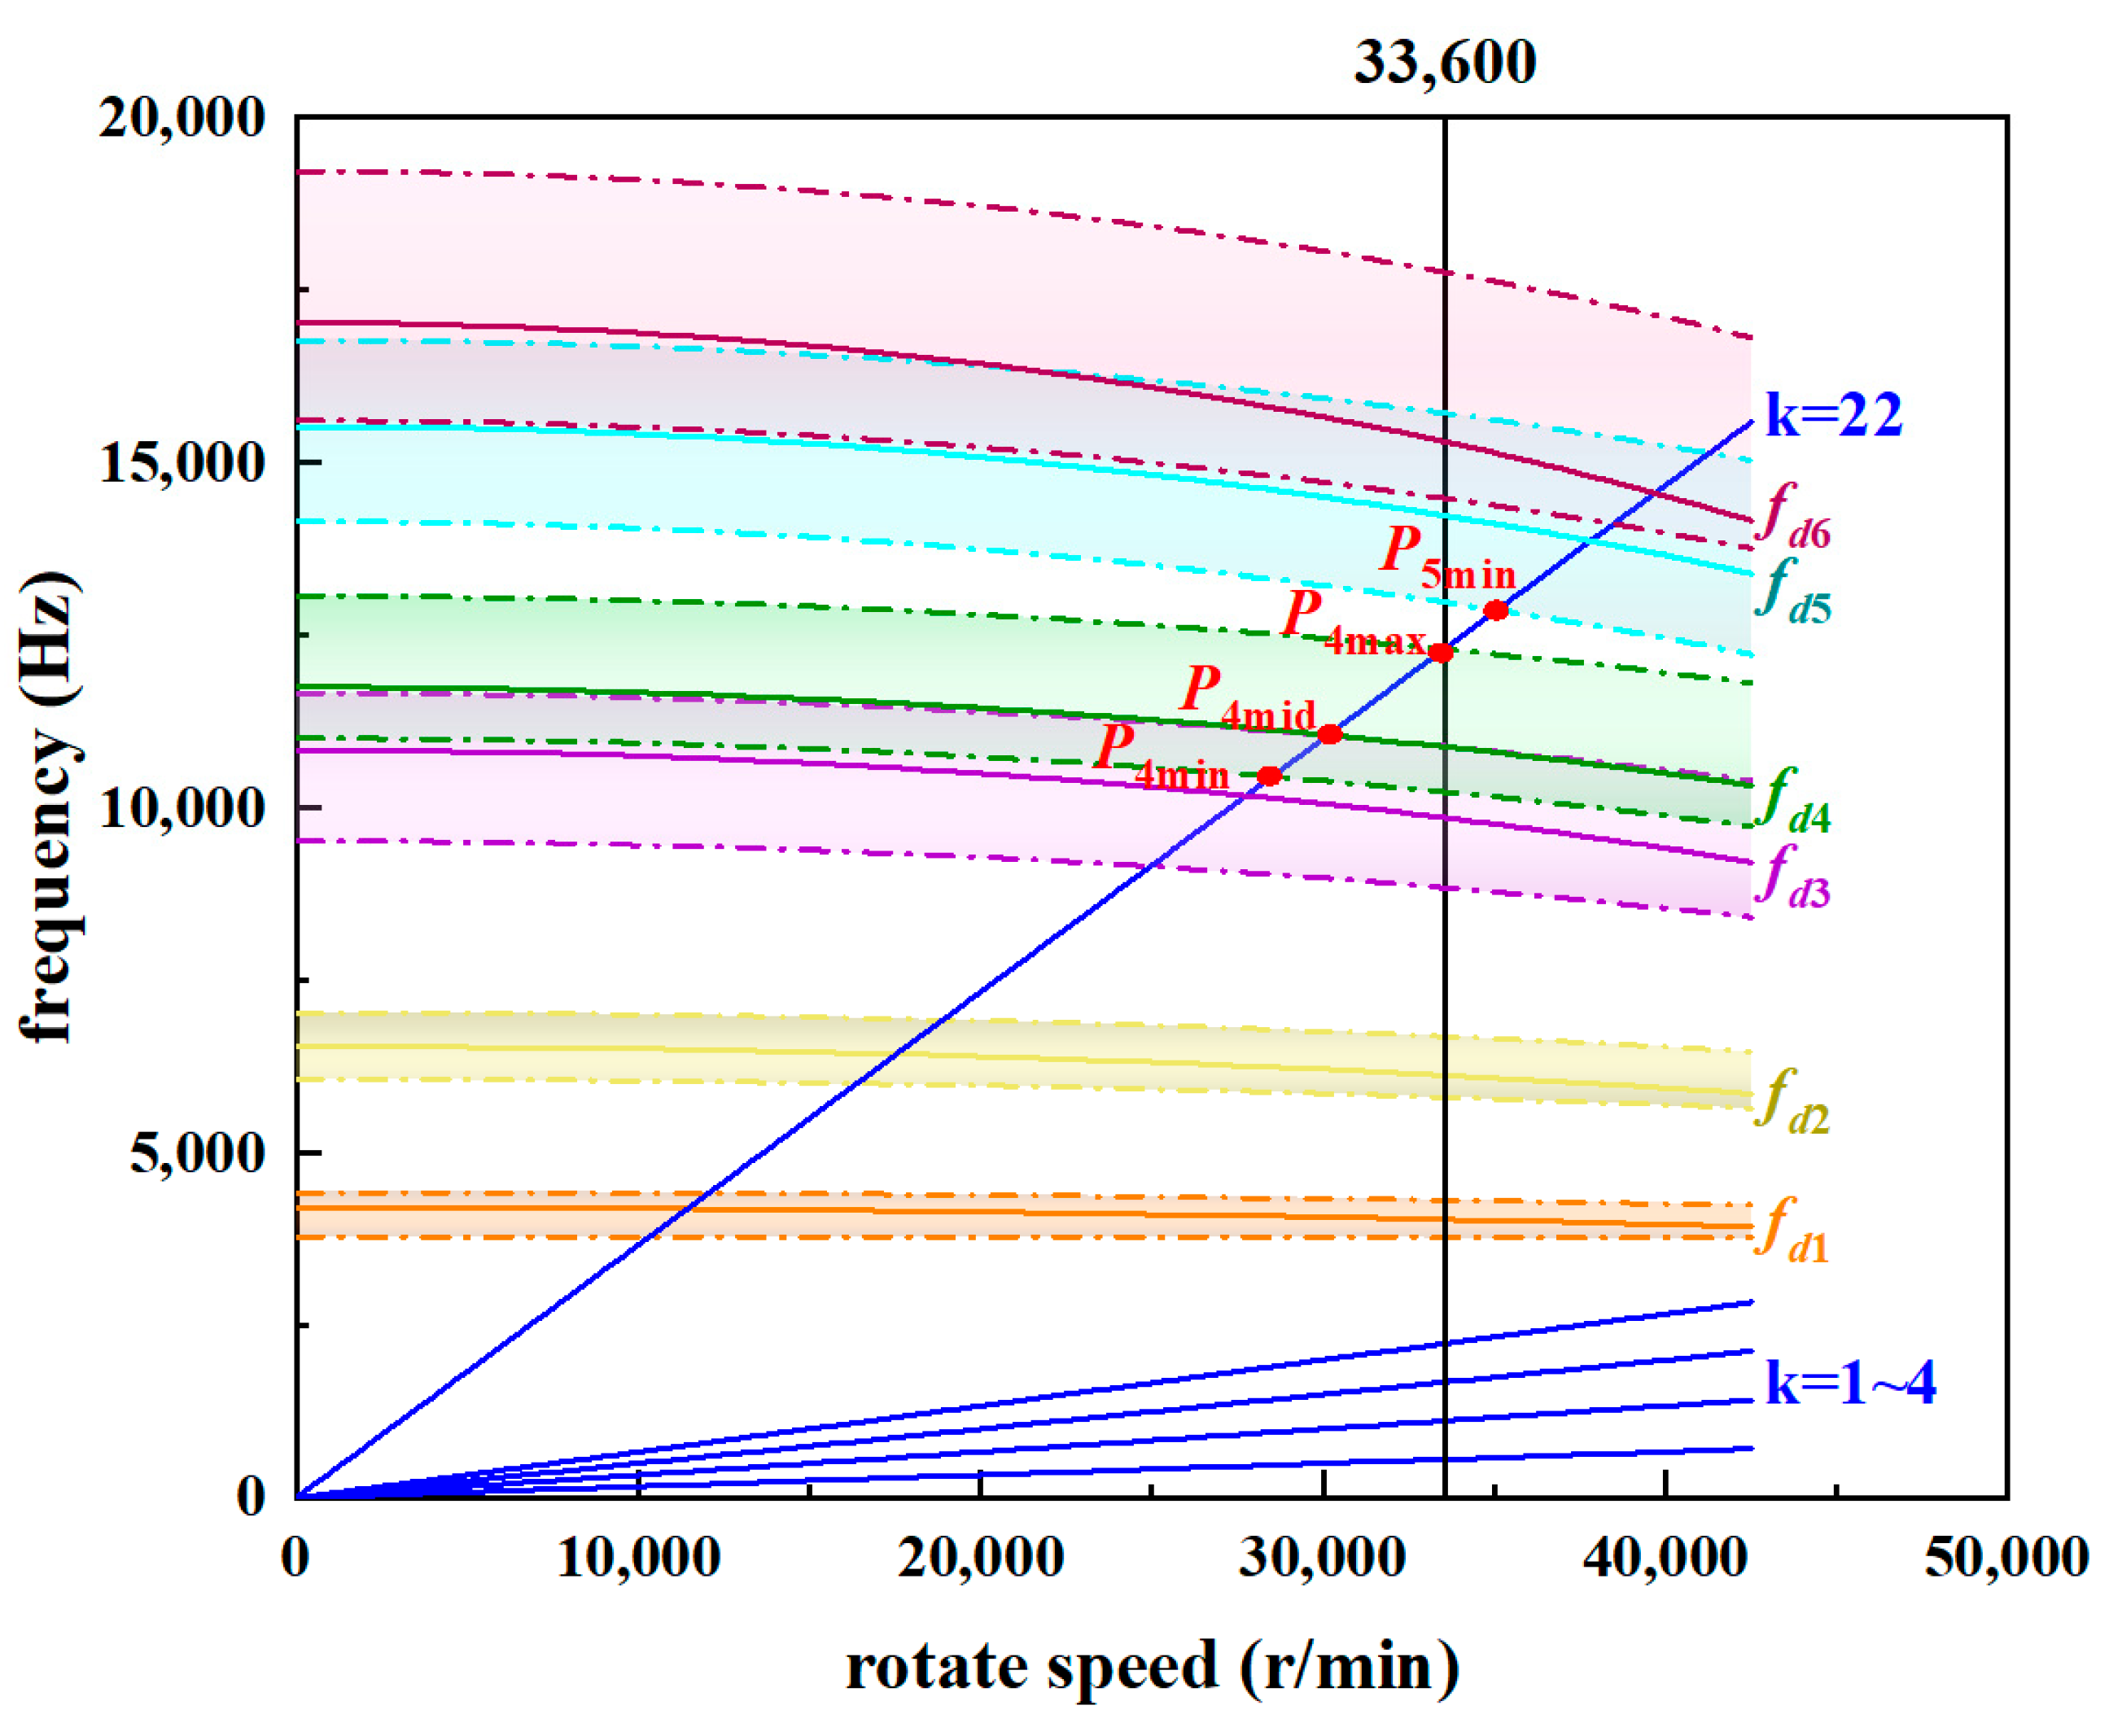
In accordance with the influence laws of the uncertain parameters on modal frequencies, static-frequency calculations under the assembled state and dynamic-frequency calculations at the cruise rotational speed of 33,600 r/min are performed for the thin-walled SC turbine blade under three groups of uncertain-parameter combinations: the median combination, the combination corresponding to the maximum modal frequencies, and the combination corresponding to the minimum modal frequencies. The median combination serves as the input of the empirical engineering method, and the resulting frequencies are regarded as the predictions of that approach. Among them, the crystal orientations and airfoil thicknesses corresponding to the maximum and minimum modal frequencies are merely discrete sampling points within the allowable parameter ranges. This implies the actual maximum and minimum modal frequencies can exceed the values obtained from the present analysis. Nevertheless, such potential out-of-range extremum values will still fall within the engineering tolerance interval and will not alter the core conclusion regarding resonance risk, so this discrepancy does not affect the validity of the main findings. Based on the empirical formula in Equation (10), the dynamic-frequency coefficients at the median, maximum, and minimum frequencies of each order are calculated, and the corresponding modal frequency curves are plotted in the Campbell diagram of Figure 28. The colored solid lines denote the frequencies obtained at the median parameters (i.e., the engineering-method predictions), labeled ~ and distinguished by color. For each color, the upper dashed line represents the maximum modal frequency ~, while the lower dashed line denotes the minimum modal frequency ~. The colored band enclosed between the two dashed lines stands for the frequency variation band of the corresponding mode induced by the uncertain parameters. The vertical solid black line marks the steady operating speed of 33,600 r/min in the bench test, and the blue radial lines represent harmonic excitation lines, including the 1st–4th engine-order excitations and the 22nd-order excitation corresponding to the vane count of the upstream guide vanes.
where denotes the -th dynamic frequency, in Hz; denotes the -th static frequency, in Hz; B is the dimensionless dynamic-frequency coefficient; and stands for rotational speed, in r/min.
Figure 28.
Uncertainty-based Campbell diagram of the thin-walled SC turbine blade.
When the excitation force is relatively large, the blade attains its maximum vibratory stress at the resonant rotational speed and maintains a high stress level over a finite speed range around resonance; in other words, resonance may occur within a finite speed interval near the theoretical resonant speed. As shown in Figure 28 and Table 4, the resonant speed corresponding to is nearly equal to the operating speed of 33,600 r/min, with a frequency margin of only 0.13%. The resonant speed for is 35,089 r/min, the second closest to the rated operating speed, yielding a frequency margin of 5.33%. In terms of resonant speed and frequency margin, the operating condition at bears the highest risk of hazardous resonance, followed by , whereas all other resonance points pose negligible risk.
Table 4.
Resonance analysis.
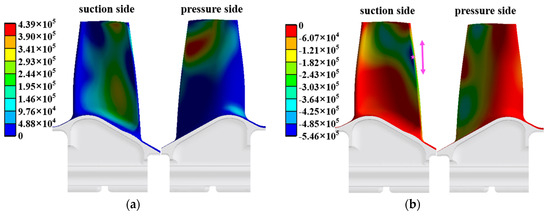
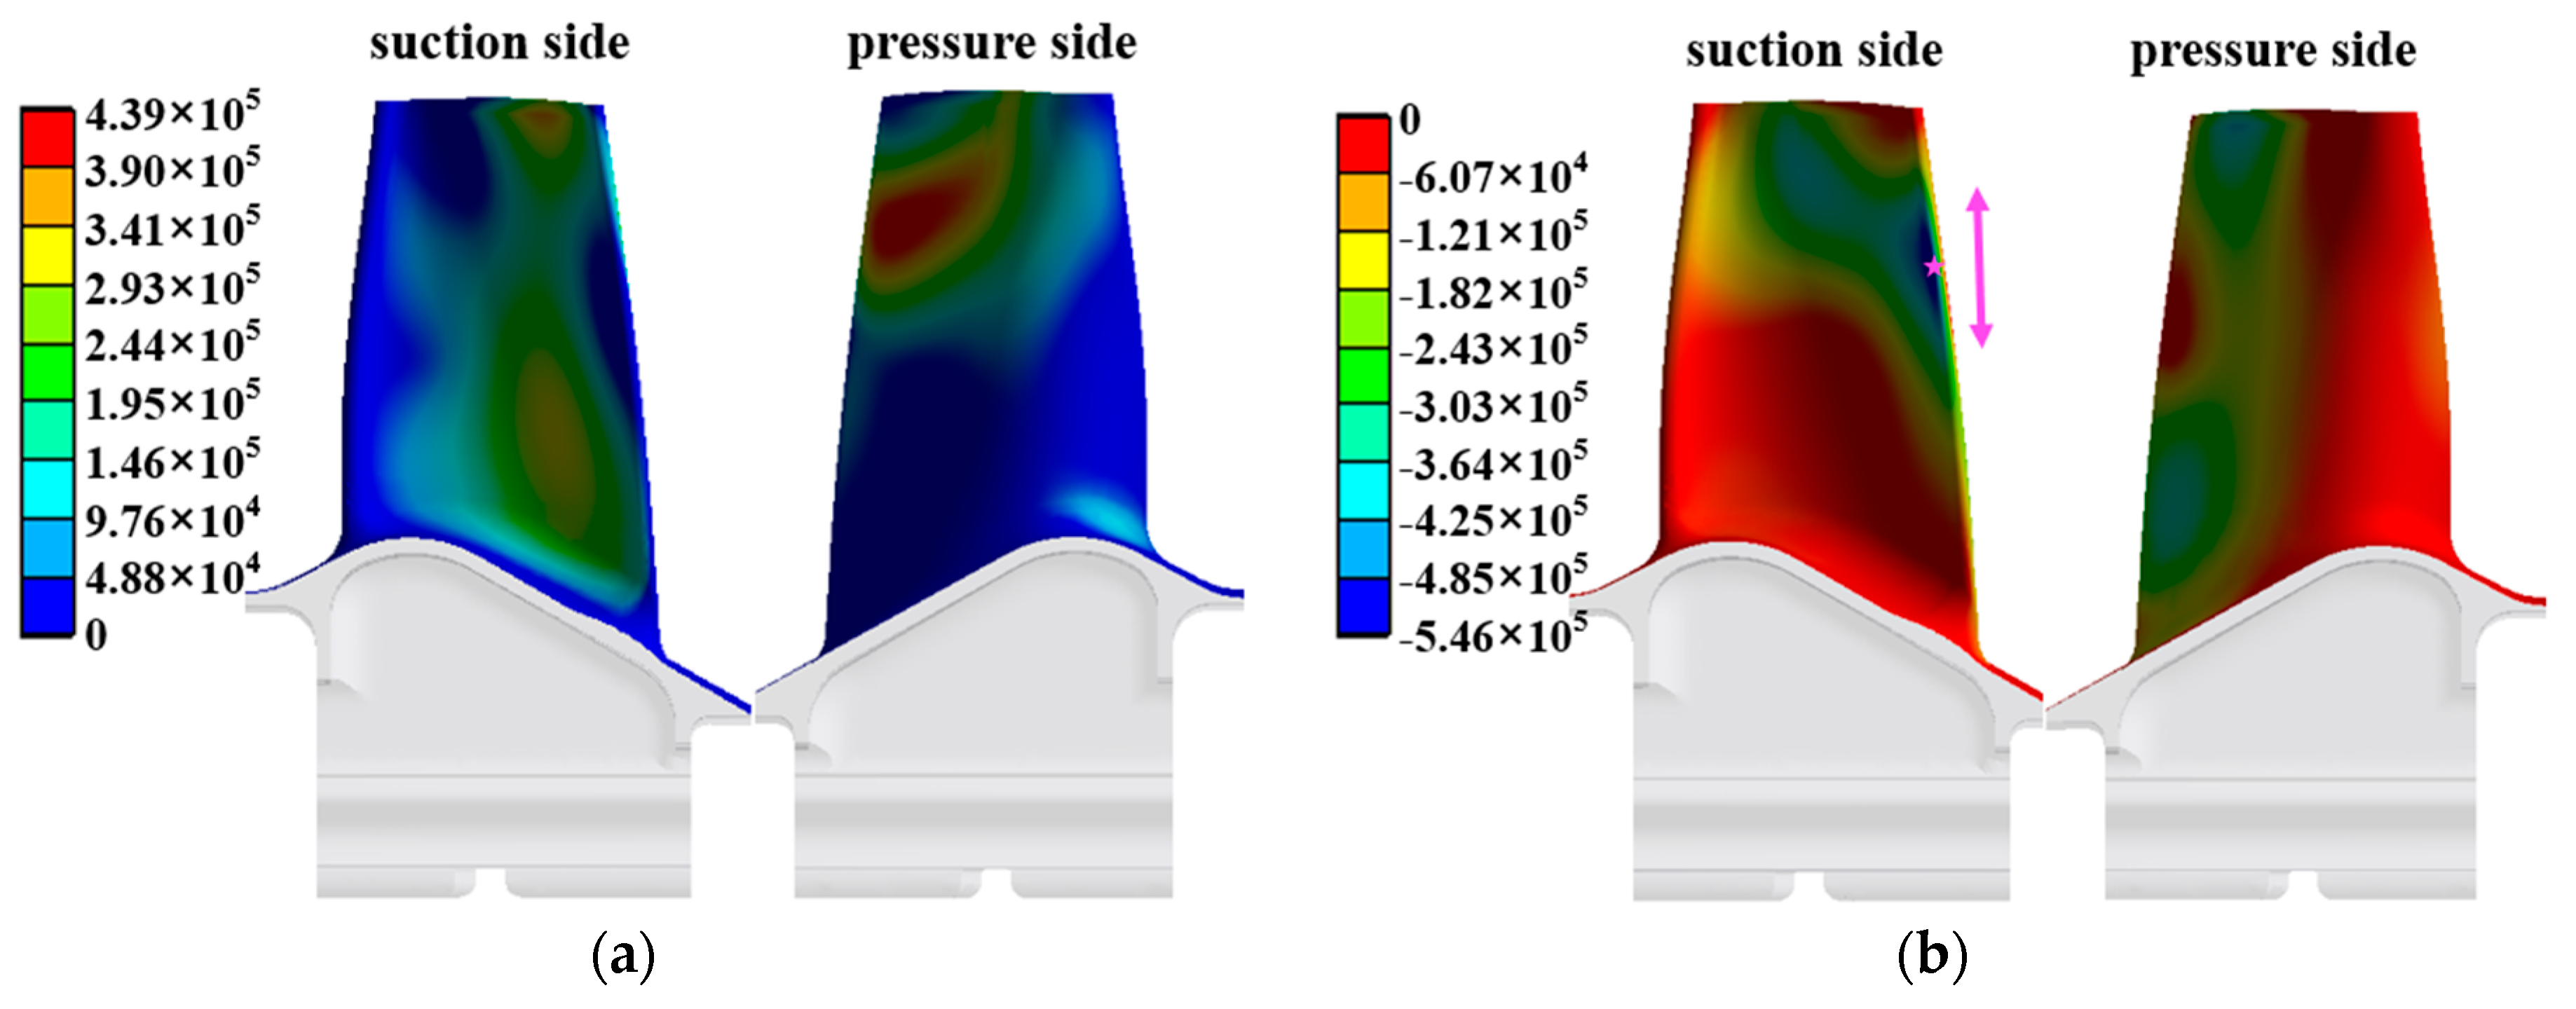
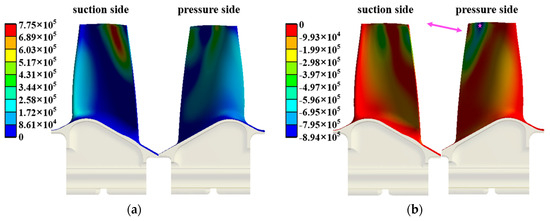
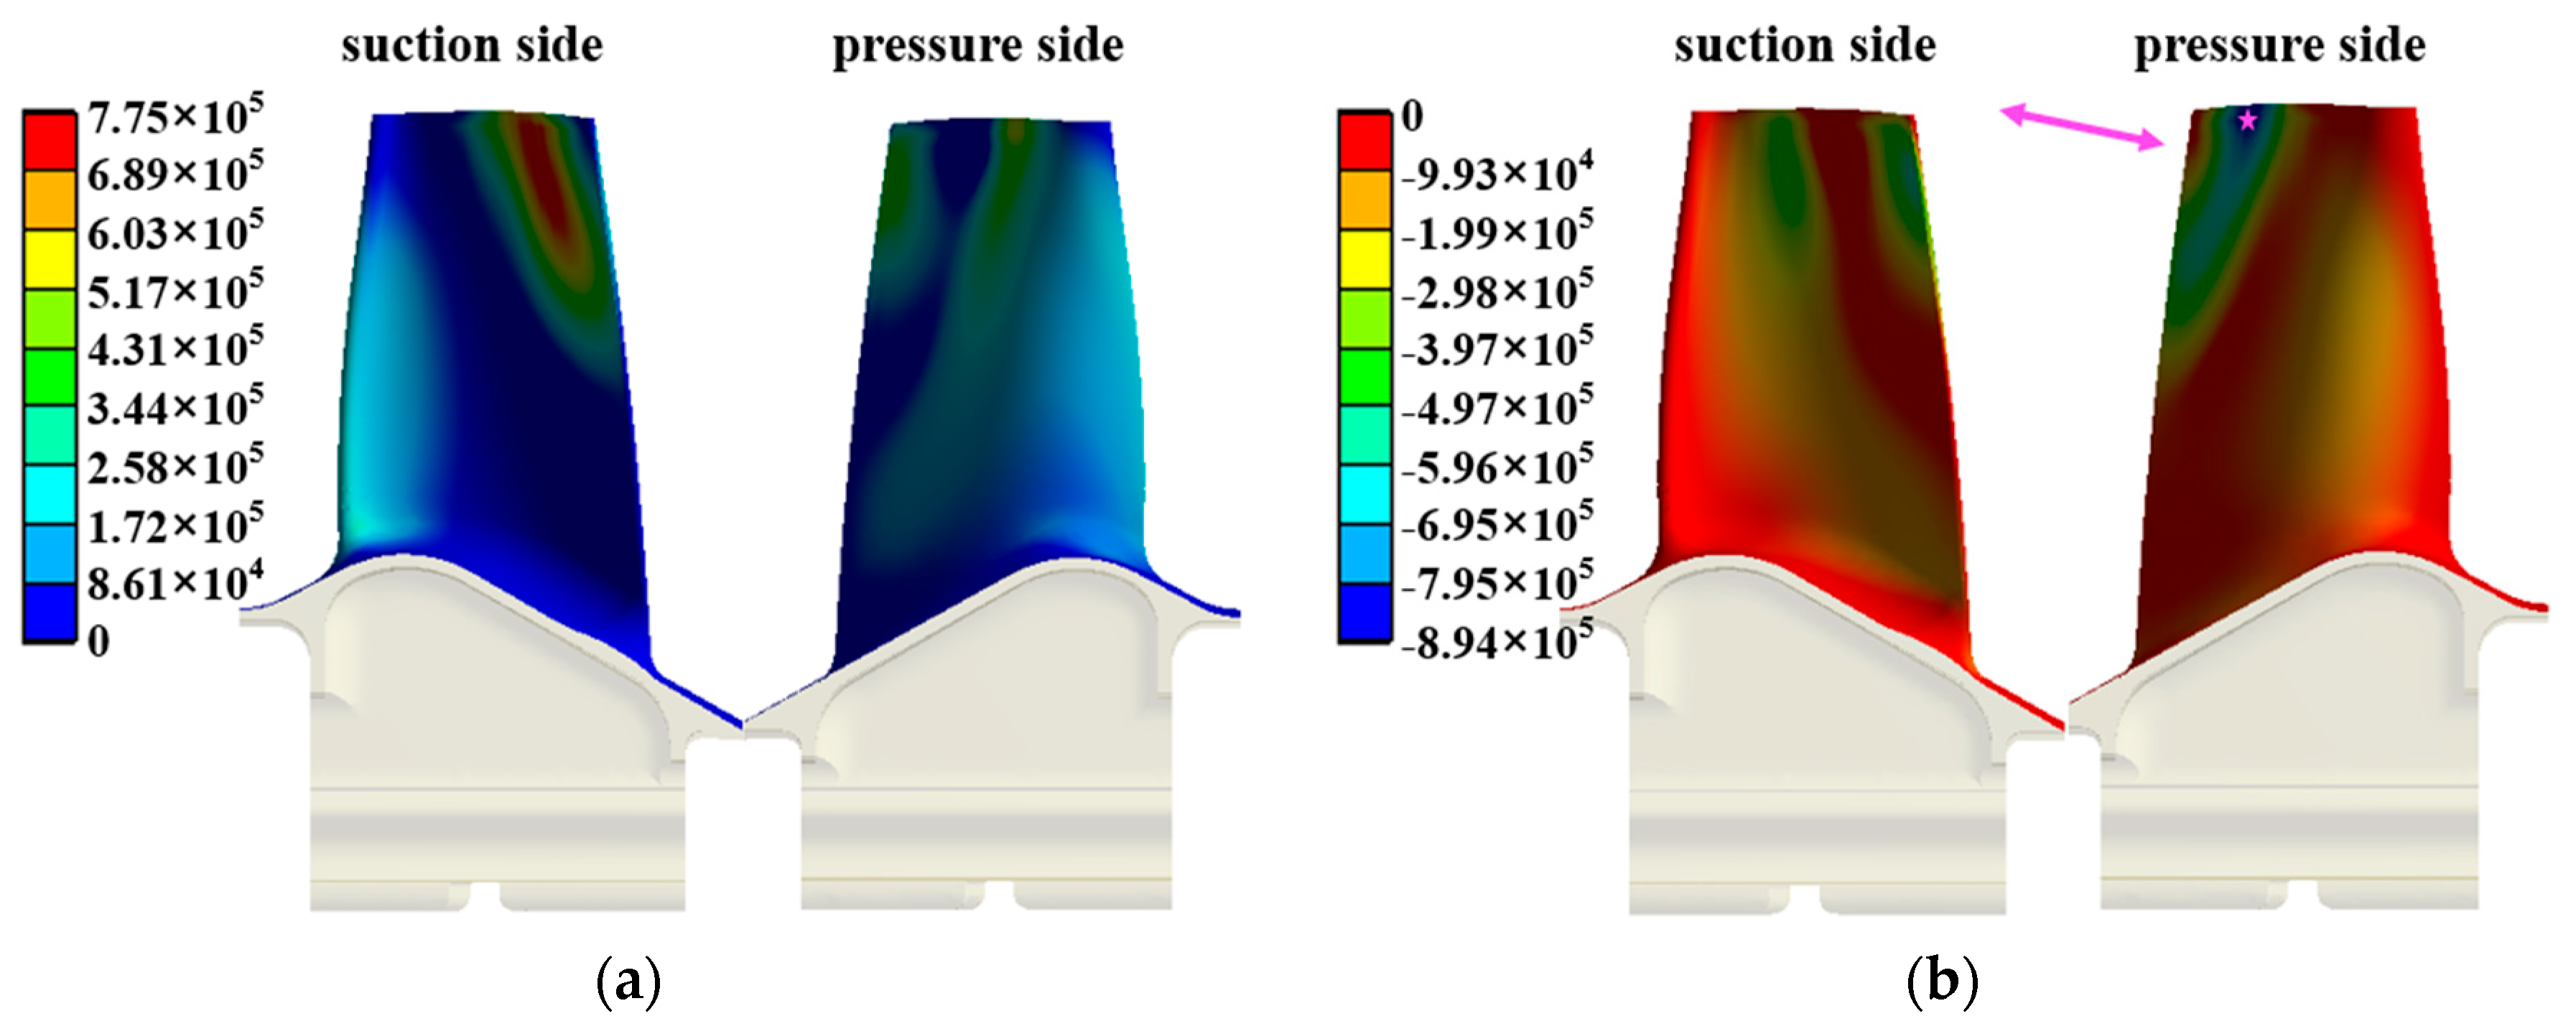
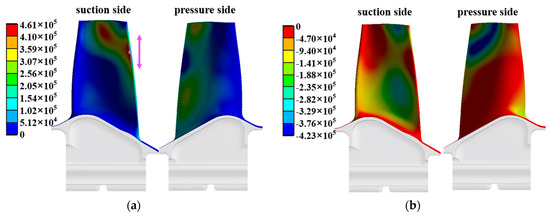
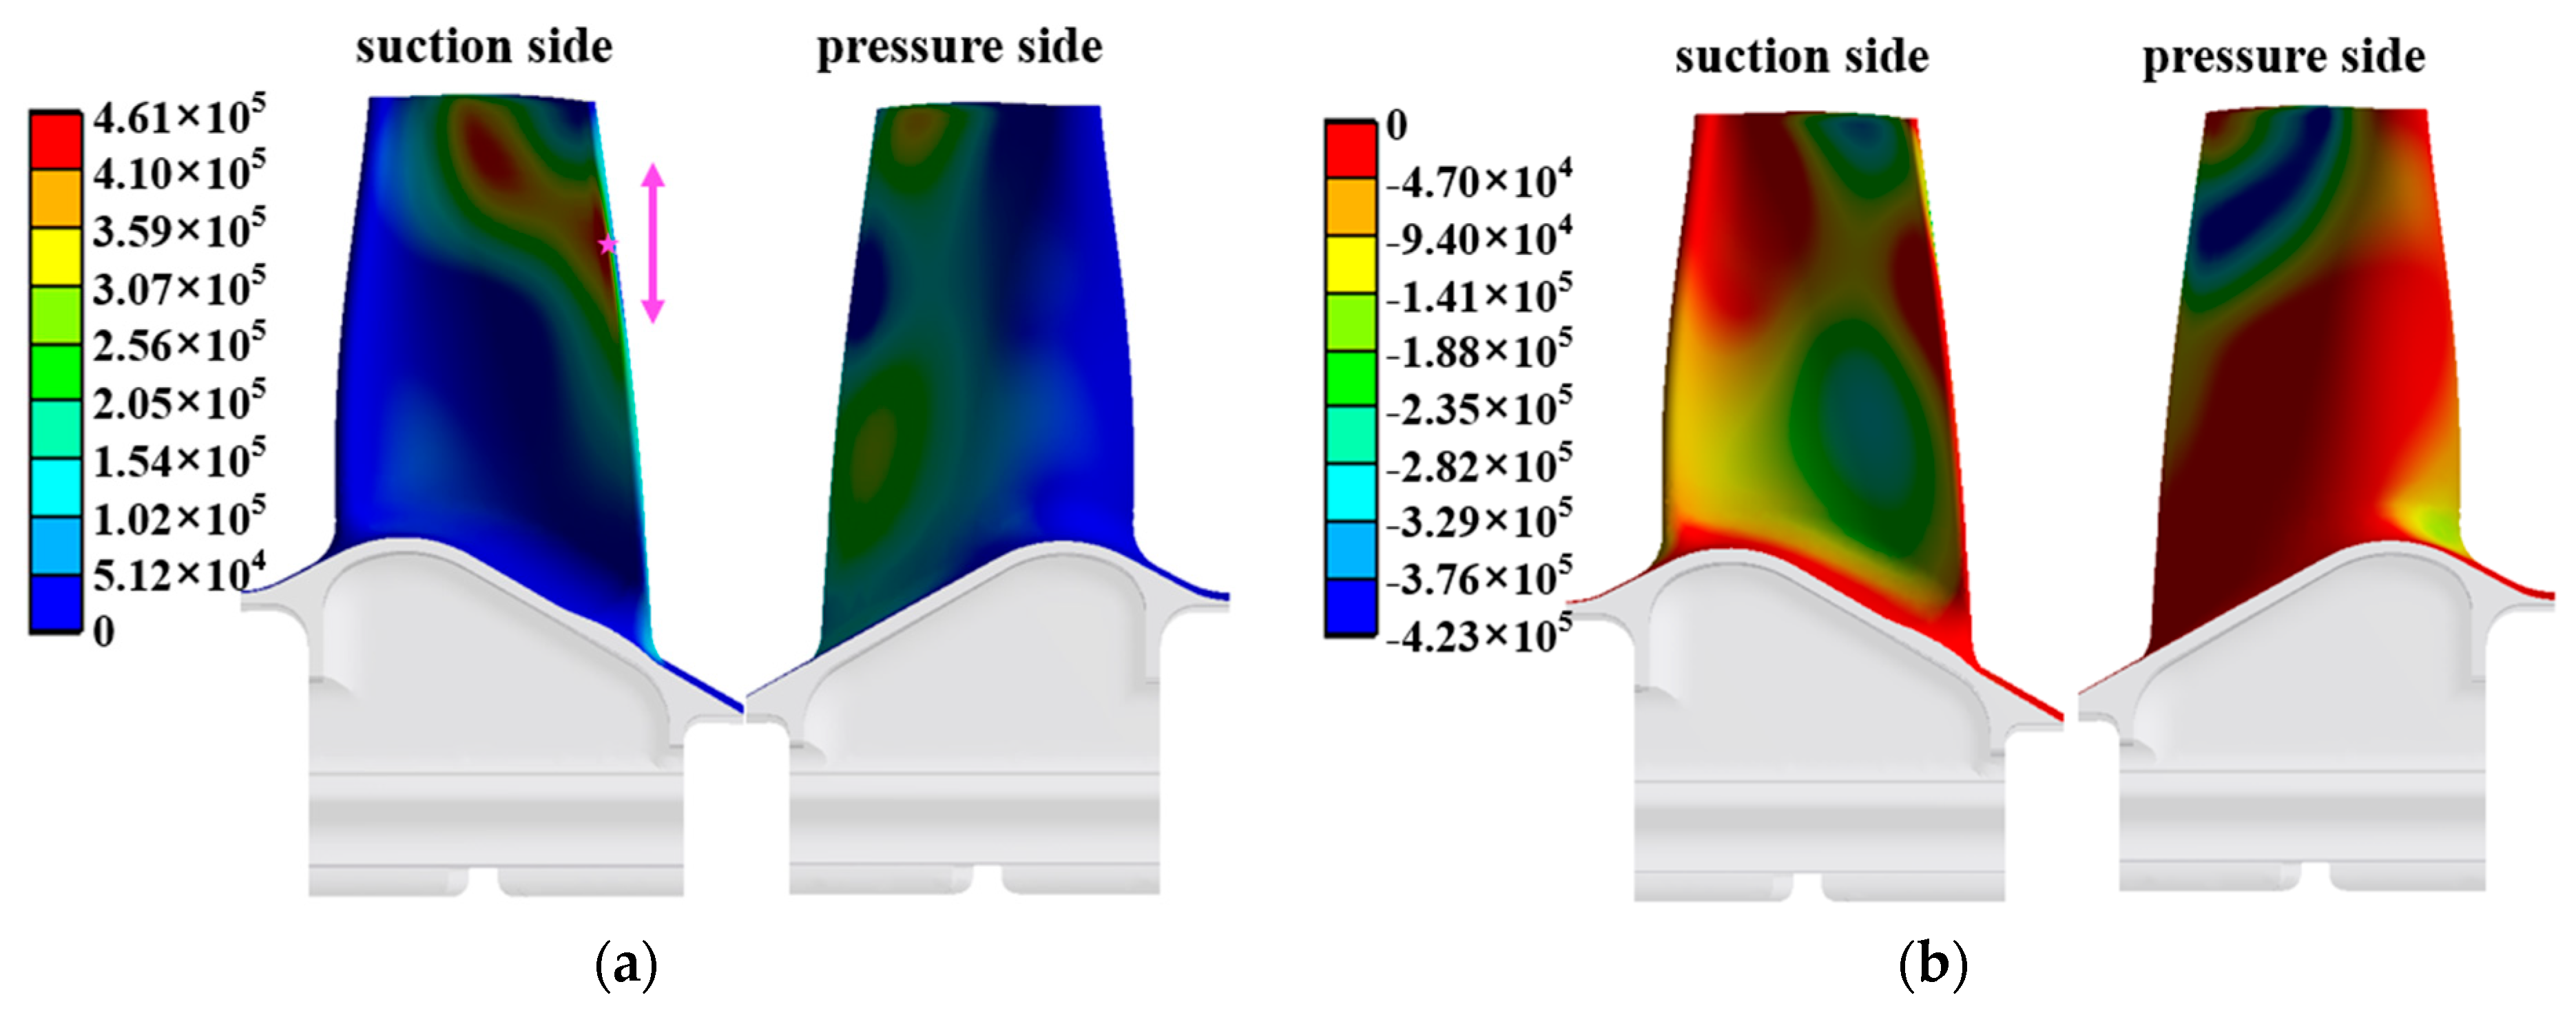
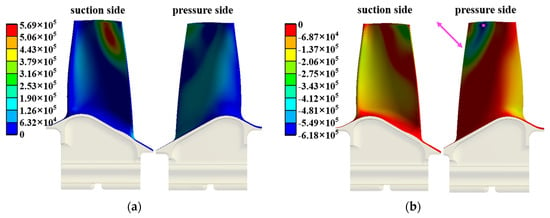
A further analysis is performed to examine whether the vibratory stress distribution matches the observed fracture mode. The relative vibratory stress contours corresponding to and of the thin-walled SC turbine blade are presented in Figure 29 and Figure 30, respectively. The magenta five-pointed stars mark the locations of maximum vibratory stress, and the magenta arrows indicate the principal direction of peak vibratory stress.
Figure 29.
Relative vibratory stress contour of the blade for at the operating speed of 33,600 r/min: (a) first principal stress; (b) third principal stress.
Figure 30.
Relative vibratory stress contour of the blade for at the operating speed of 33,600 r/min: (a) first principal stress; (b) third principal stress.
corresponds to the second-order bending mode at the blade trailing edge. Its maximum vibratory stress shown in Figure 29 occurs on the pressure surface near the trailing edge, 8.5 mm from the blade tip and 35.1 mm from the dovetail-root bottom, in close agreement with the crack-initiation site. The vibratory stress acts along the blade span and perpendicular to the fracture section, consistent with the crack propagation mode of the failed blade. Meanwhile, the high-temperature exposure test results in Figure 10 indicate that the temperature of the off-white region in the middle part of the blade shown in Figure 1 is approximately 800 °C, which is consistent with the temperature field corresponding to with a temperature dispersion of −5%.
corresponds to the high-order coupled mode of the blade. The maximum vibratory stress shown in Figure 30 is located on the suction surface close to the blade tip and 8.3 mm away from the trailing edge; this location deviates from the crack-initiation site, thereby ruling out resonance-induced failure under .
Figure 31 and Figure 32 respectively show the relative vibratory stress distributions, peak stress positions (marked by magenta five-pointed stars), and principal stress orientations (indicated by magenta arrows) of the blade trailing edge under and . The relative stress distribution of is analogous to that of , with the maximum vibratory stress also concentrated on the pressure surface adjacent to the trailing edge but at a different spanwise height: the peak stress under lies 7.3 mm from the blade tip and 36.3 mm from the dovetail-root bottom, inconsistent with the measured position on the failed blade. This indicates that crystal orientation exerts a notable effect on the failure of the tested blade.
Figure 31.
Relative vibratory stress contour of the blade for at the operating speed of 33,600 r/min: (a) first principal stress; (b) third principal stress.
Figure 32.
Relative vibratory stress contour of the blade for at the operating speed of 33,600 r/min: (a) first principal stress; (b) third principal stress.
On the one hand, the conventional engineering approach performs blade modal analysis using the median values of the uncertain parameters, and the corresponding resonance point is denoted as . According to the design specifications, the design requirement is satisfied when the frequency margin (defined as the difference between the operating frequency and the resonance frequency divided by the excitation frequency) between the resonance point and the operating speed is no less than 10%. The frequency margin of relative to the rated operating speed of 33,600 r/min reaches 11.68% (≥10%), which complies with the empirical design criterion. Consequently, this resonance point was incorrectly judged as non-hazardous during the design phase, eventually triggering blade fracture failure in the bench test. This phenomenon proves that the traditional engineering method is invalid for the resonance evaluation of cast thin-walled SC blades. On the other hand, the frequency-margin difference between and is only 5.29 percentage points, in which range the original engineering calculation turns excessively conservative. Combining the two aspects, the conventional engineering methodology exhibits evident limitations in the resonance prediction of cast thin-walled SC blades, demonstrating that the uncertainty-based vibration analysis method possesses prominent advantages over the existing empirical engineering approaches.
In summary, the failure mechanism responsible for the tip-trailing-edge fracture of the thin-walled SC turbine blade is presented as follows. Excited by the wake flow from upstream the guide vane, the thin-wall SC turbine blade undergoes second-order bending resonance at its trailing edge under the operating speed of 33,600 r/min, in the presence of uncertain parameters—principally crystal-orientation deviations and airfoil-casting tolerances. When resonance occurs, the vibration amplitude increases sharply accompanied by a remarkable rise in vibratory stress. After approximately 1.5 × 10⁷ load cycles, the high-cycle fatigue fracture emerges on the thin-walled SC turbine blade. Cast thin-walled SC turbine blades exhibit notable susceptibility to uncertainties from crystal orientation and casting dimensional tolerance. In this context, the safety margin of traditional deterministic design cannot account for parameter fluctuations, which may leave certain resonant risks unforeseen. Hence, incorporating uncertainty-based vibration design is recommended for subsequent blade optimization.
5.2. Analysis on Frequency Separation of Bending–Torsion Coupling for Thin-Walled SC Turbine Blades
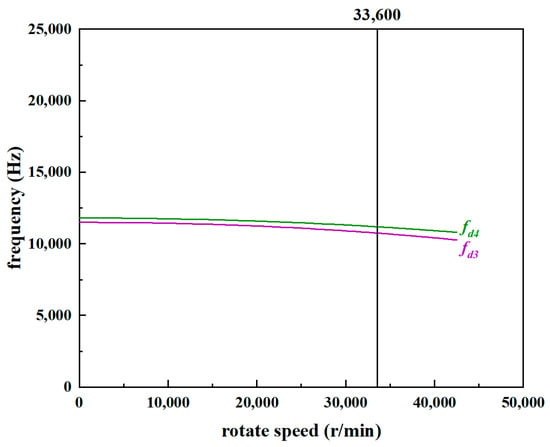
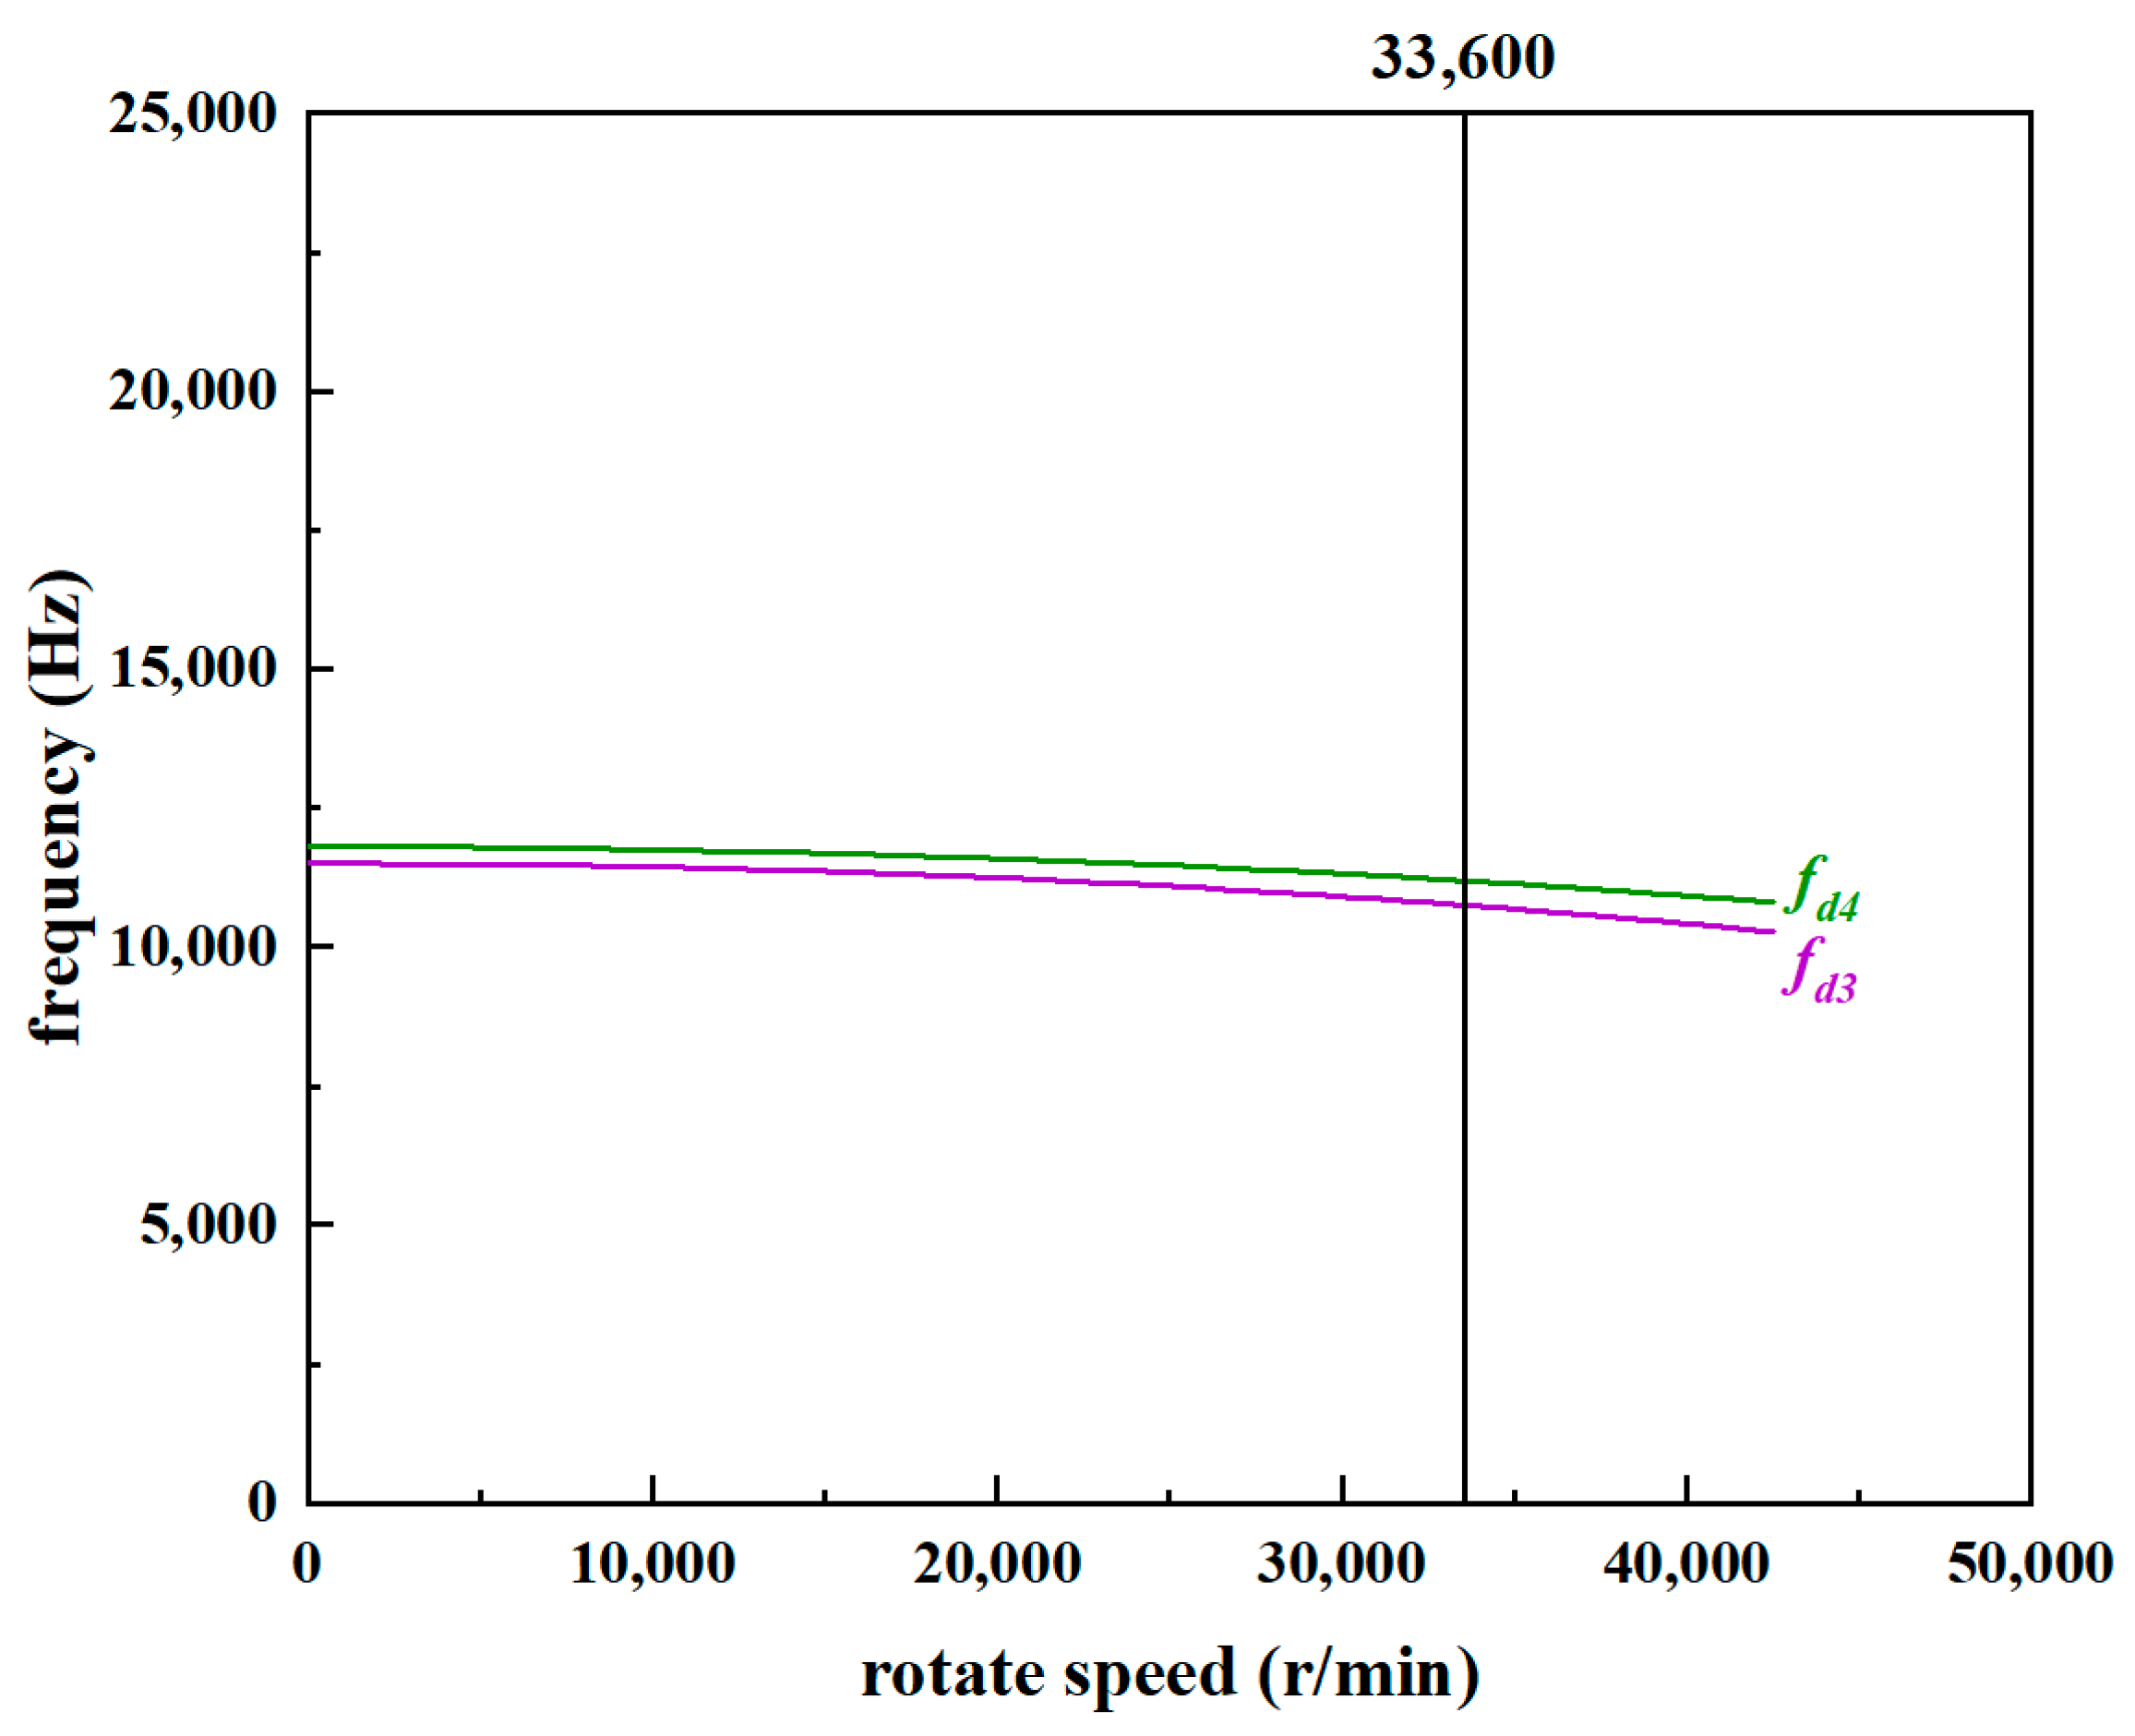
As shown in Figure 28, under the median combination of uncertain parameters, the dynamic frequency of the first-order torsional mode and the dynamic frequency of the second-order bending mode for the thin-wall blade are relatively close. Once the torsional and bending modal frequencies become nearly coincident, the risk of bending–torsion coupled flutter rises significantly. The dynamic frequency separation coefficient defined in Equation (11) is therefore adopted to quantify the proximity between and , and the value evaluated by the conventional engineering method using the median uncertain parameters is = 9.6%.
With the remaining uncertain parameters fixed at their median values, among the crystal-orientation combinations obtained via FFD in Table 1, the thin-walled blade with the orientation (15°, 300°, 80°) yields the minimum = 4.7%, whereas the orientation (15°, 70°, 35°) produces the maximum = 13.1%. Hence, crystal orientation drives from 13.1% down to 4.7%, exerting a significant influence on the bending–torsion frequency separation.
Furthermore, the effects of the remaining uncertain parameters on are investigated under the crystal orientation of (15°, 300°, 80°). The results reveal that the minimum is obtained when the elastic modulus, shear modulus, and Poisson’s ratio attain their upper bounds while the density and temperature field reach their lower bounds. Owing to the limited effect of material-property scatter and load dispersion on dynamic frequencies, their corresponding impact on is marginal, reducing from 4.7% to 4.1%.
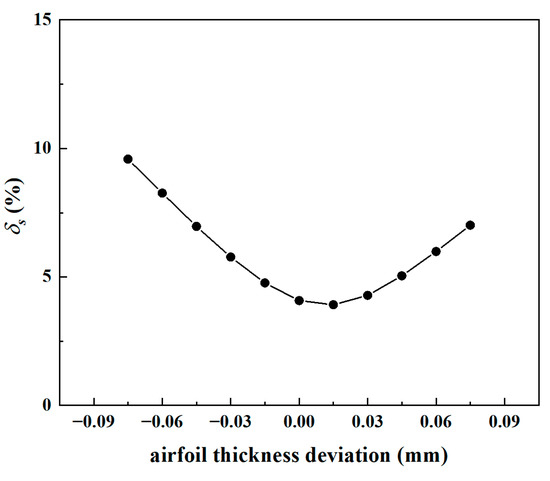
On this basis, the effect of airfoil thickness tolerance on is further examined. As plotted in Figure 33, among the discrete airfoil thickness deviations considered, the minimum value = 3.9% occurs at a thickness deviation of +0.015 mm, while the maximum = 9.6% corresponds to a deviation of −0.075 mm. Accordingly, the airfoil thickness deviation drives from 9.6% down to 3.9%, indicating a significant overall impact. Nevertheless, because +0.015 mm lies close to the median thickness, the additional reduction in contributed by this thickness deviation (from 4.1% down to 3.9%) is less pronounced than that introduced by the combined material-property and load scatter (from 4.7% to 4.1%).
Figure 33.
Effect of airfoil thickness deviation on .
Under the most unfavorable combination of uncertain parameters, drops to 3.9%. At this condition the dynamic frequencies and become extremely close, as illustrated in Figure 34, leading to a high risk of bending–torsion coupling on the blade and rendering the design unacceptable. Benefiting from the uncertainty-based vibration analysis, potential design defects overlooked by the conventional engineering approach are identified in advance, thereby preventing prospective failures induced by bending–torsion coupled flutter.
Figure 34.
Adjacent frequencies corresponding to the minimum of the thin-walled SC turbine blade.
6. Conclusions
Aiming at the tip trailing edge failure of a thin-walled SC turbine rotor blade for an aero-engine, this paper documents the full failure process together with the macroscopic and microscopic fractographic results. The stiffness matrix of SC blades is derived with explicit account for crystal-orientation. The respective influences and contribution levels of crystal orientation deviation, airfoil-casting thickness tolerance, and material- and load-parameter scatter on vibration characteristics of thin-walled and thickened-profile turbine blades are investigated in turn. On this basis, an uncertainty-based vibration analysis is performed on the thin-walled SC blade to interpret the failure mechanism. The limitations of the conventional deterministic engineering approach and the necessity of uncertainty-based vibration analysis in the vibration design of thin-walled SC turbine blades are illustrated. Furthermore, the effect of uncertain parameters on the bending–torsion frequency separation coefficient is examined, and a hidden risk of bending–torsion coupled flutter is identified for thin-walled SC turbine blades, providing guidance for subsequent detuning design. The detailed conclusions are summarized as follows:
- (1)
- Fractographic analysis indicates that fatigue failure occurs at the same location and originates from the same initiation source for both failed blades.
- (2)
- Analysis of the undamped forced-vibration equations under external excitation, combined with the orientation-dependent stiffness matrices of SC turbine blades, reveals that crystal orientation modulates the constitutive stiffness matrix, thereby altering the modal stiffness and modal mass of each order and, consequently, the dynamic frequencies and other vibration properties.
- (3)
- With the remaining uncertain parameters fixed at their median values, the dynamic-frequency dispersion of all modes for the thin-walled blade ranges from 5.22% to 7.14% under the effect of crystal orientation, whereas that for thickened blades lies within 4.22–8.82%. Crystal orientation exerts disparate impacts on the dynamic frequency of the same mode between the two airfoils. Airfoil optimization such as thickness modification therefore offers the potential to suppress the sensitivity of target modal frequencies to crystal-orientation scatter.
- (4)
- With the remaining uncertain parameters at their median values, airfoil thickness deviation leads to dynamic-frequency dispersions of 1.7–13.7% across all modes of thin-walled blades and of 0.1–10.6% for the thickened-profile blade. Compared with the thin-walled blade, certain modal frequencies of the thickened-profile blade are far less sensitive to airfoil thickness deviation. Restricting blade thickness is therefore an effective measure to mitigate the dispersion of target modal frequencies induced by casting tolerances.
- (5)
- Among all investigated uncertain parameters, the dynamic frequencies of SC turbine blades are predominantly governed by crystal orientation and casting-thickness deviation, whereas material- and load-parameter scatter exert relatively weak effects.
- (6)
- The FFD over the specified design levels of the three crystal-orientation parameters is adopted to quantify orientation uncertainty in this work. However, its computational cost is notably high and hampers practical engineering implementation. For engineering applications, an alternative scheme is proposed: separately investigate the effects of the primary-orientation angular position at the maximum primary-orientation deviation and of the secondary-orientation deviation, together with moderately enlarged sampling intervals of the orientation angles. Such optimization enables the frequency values to approach their extreme limits while drastically reducing computational expense, making the procedure suitable for industrial use.
- (7)
- The resonance point of the failure mode predicted by the conventional engineering design with median values of the uncertain parameters yields a frequency margin of 11.68% relative to the operating rotational speed, which exceeds the 10% threshold specified in the design criteria; consequently, the hazard of this resonance was overlooked at the original design stage. In addition, the predicted location of maximum vibratory stress for this mode deviates by approximately 1 mm in spanwise height from the actual fracture site, making the failure mode easy to overlook during post-failure diagnosis. The uncertainty analysis shows that, under the worst-case combination of uncertain parameters, the resonant rotational speed nearly coincides with the operating speed, and the predicted region of maximum vibratory stress achieves good agreement with the crack initiation site. This result realizes accurate failure location and demonstrates the necessity of applying uncertainty-based vibration design for thin-walled SC turbine blades.
- (8)
- A hidden bending–torsion coupled flutter risk in the thin-walled SC blade is detected through the proposed uncertainty-based vibration analysis, whereas this risk is difficult to capture using conventional median-value deterministic design. This result further highlights the necessity and significance of adopting uncertainty-based vibration design for thin-walled SC turbine blades.
Author Contributions
Conceptualization and methodology, W.J.; software, D.L.; validation, L.G.; formal analysis, W.J.; data curation, Y.L.; writing—original draft preparation, W.J.; writing—review and editing, W.S. and Y.F.; visualization, E.H. All authors have read and agreed to the published version of the manuscript.
Funding
This research was funded by the Strategic Priority Research Program of the Chinese Academy of Sciences, grant number XDB1280100 and XDC0160102; the Basic Product Innovation Research Project: Research on Comprehensive Optimization Design Technology, grant number D5020250003. The APC was funded by the National Key Laboratory of Science and Technology on Advanced Light-duty Gas-turbine.
Data Availability Statement
The original contributions presented in this study are included in the article. Further inquiries can be directed to the corresponding author.
Acknowledgments
The authors are grateful to the Institute of Engineering Thermophysics, CAS for providing technical support in turbine rotor fabrication and full-engine bench tests. Appreciation is extended to the relevant engineers for their substantial assistance in blade inspection and experimental data acquisition. The authors also thank the Key Laboratory of Light Duty Gas Turbine for supplying test facilities and computational resources for finite-element simulations.
Conflicts of Interest
The authors declare no conflicts of interest.
Abbreviations
| HGS | Helical grain selection |
| TMF | Thermomechanical fatigue |
| SC | Single-crystal |
| DS | Directionally solidified |
| CC | Conventionally cast |
| DOE | Design of experiments |
| FFD | Full factorial design |
Appendix A
Appendix A.1
Rotate the -axis by the primary-orientation deviation angle about the normal vector to obtain the -axis. The designed coordinate system is transformed into the new coordinate system , and the secondary-orientation deviation angle is defined as 0 at this state. An arbitrary point in the designed coordinate system is rotated to accordingly. Here,
When , i.e., the unit vector of the -axis, the unit vector of the -axis in the designed coordinate system can be derived from the Equation (A1) as . is equal to the rotation angle of the plane around the -axis, with the counterclockwise direction defined as positive. Since the secondary orientation takes 90° as one periodic interval, the research range adopted herein is specified accordingly. The crystal coordinate system corresponding to crystal-orientation deviation angles , and is . The point is rotated to accordingly. Here,
Accordingly, the correlation is established between the angular difference of the actual crystal coordinate system from the designed crystal coordinate system and the three crystal-orientation deviation angles , and .
Appendix A.2
The force components and strain components along coordinate axes , , and for a point with direction cosine (, , and ) in the actual crystal coordinate system are expressed as [28]:
Here, , and .
Furthermore, we obtain:
Here,
where matrices and satisfy:
Furthermore, we have:
References
- Yin, Z.Y. Structural Strength Design of Aero-Engines; Science Press: Beijing, China, 2022. [Google Scholar]
- Yadav, N.; Jadhav, P.; Lande, C. Design of Metal Leading Edge Cap Joint on Thin Wall Composite Fan Blade in Aircraft Engine. J. Compos. Sci. 2026, 10, 166. [Google Scholar] [CrossRef] [Scilit]
- Kabalyk, K.; Bednarz, A.; Kantyka, K. Fatigue safety factor of a transonic centrifugal compressor impeller subject to blade thickness. Sci. Rep. 2025, 15, 18693. [Google Scholar] [CrossRef] [Scilit] [PubMed]
- Reed, R.C. The Superalloys Fundamentals and Applications; Cambridge University Press: Cambridge, UK, 2006. [Google Scholar]
- Caron, P.; Lavigne, O. Recent studies at onera on superalloys for single crystal turbine blades. ONERA Aerosp. Lab J. 2011, 3, 1–14. [Google Scholar]
- Manetti, M.; Giovannetti, I.; Pieroni, N.; Horculescu, H.; Peano, G.; Zonfrillo, G.; Giannozzi, M. The Dynamic Influence of Crystal Orientation on a Second Generation Single Crystal Material for Turbine Buckets. In Proceedings of the ASME Turbo Expo 2009, Orlando, FL, USA, 8–12 June 2009. [Google Scholar]
- Fang, Y.; Li, Y. Dynamic responses of nickel-based single crystal superalloy dd6 blade. J. Mater. Eng. Perform. 2013, 22, 1565–1573. [Google Scholar]
- Wen, Z.; Mao, H.; Yue, Z.; Wang, B. The influence of crystal orientation on vibration characteristics of DD6 nickel-base single crystal superalloy turbine blade. J. Mater. Eng. Perform. 2014, 23, 372–377. [Google Scholar]
- Zhao, Y.C.; Gao, H.S.; Wen, Z.X.; Yang, Y.Q.; Yue, Z.F. Effect of orientation deviation on resonance characteristics of single crystal turbine blades. AIAA J. 2020, 58, 2673–2681. [Google Scholar] [CrossRef] [Scilit]
- Li, L.; Zeng, Y.; Li, J.; Zhao, Y.; Yuan, T.; Yue, Z. Effect of crystal orientation on elastic stresses and vibration characteristics of nickel-based single crystal turbine blade. Mater. Today Commun. 2023, 35, 106135. [Google Scholar] [CrossRef] [Scilit]
- Henderson, M.B.; Martin, J.W. The influence of crystal orientation on the high temperature fatigue crack growth of a ni-based single crystal superalloy. Acta Mater. 1995, 44, 111–126. [Google Scholar]
- Kaneko, Y. Study on Vibration Characteristics of Single Crystal Blade and Directionally Solidified Blade. In Proceedings of the ASME Turbo Expo 2011, Vancouver, BC, Canada, 6–10 June 2011. [Google Scholar]
- NASA. Liquid Rocket Engine Turbopump Inducers; Space Vehicle Design Criteria: Washington, DC, USA, 1971.
- Schuff, M.; Chenaux, V. On the Effect of Frequency Separation, Mass Ratio, Solidity and Aerodynamic Resonances in Coupled Mode Flutter of a Linear Compressor Cascade. J. Eng. Gas Turbines Power 2022, 145, 011018. [Google Scholar] [CrossRef] [Scilit]
- Clark, S.T. Design for Coupled-Mode Flutter and Non-Synchronous Vibration in Turbomachinery; Duke University: Durham, NC, USA, 2013. [Google Scholar]
- Kim, T.; Hansen, A.M.; Branner, K. Development of an anisotropic beam finite element for composite wind turbine blades in multibody system. Renew. Energy 2013, 59, 172–183. [Google Scholar] [CrossRef] [Scilit]
- Lobitz, D.W.; Veers, P.S. Aeroelastic Behavior of Twist-Coupled HAWT Blades; Office of Scientific & Technical Information: Oak Ridge, TN, USA, 2013.
- Frangopol, D.M.; Corotis, R.B. Reliability-based structural system optimization: State-of-the-art versus state-of-the-practice. In Analysis and Computation; ASCE: Reston, VA, USA, 1996. [Google Scholar]
- Freudenthal, A.M. The Safety of Structures; ASCE: New York, NY, USA, 1947. [Google Scholar]
- Guo, S.X.; Lu, Z.Z. Comparison between the non-probabilistic and probabilistic reliability methods for uncertain structure design. Chin. J. Appl. Mech. 2003, 20, 107–110. [Google Scholar]
- Wang, X.J.; Wang, R.X.; Wang, L.; Chen, X.; Geng, X. An efficient single-loop strategy for reliability-based multidisciplinary design optimization under non-probabilistic set theory. Aerosp. Sci. Technol. 2017, 73, 148–163. [Google Scholar]
- Wang, R.X.; Luo, Y. Efficient strategy for reliability-based optimization design of multidisciplinary coupled system with interval parameters. Appl. Math. Model. 2019, 75, 349–370. [Google Scholar] [CrossRef] [Scilit]
- Jiang, W.; Wang, X.; Wang, R.; Shi, Q.; Zhu, J. Nonprobabilistic uncertain model updating and optimization design of thermal protection system. Appl. Therm. Eng. 2020, 180, 115822. [Google Scholar] [CrossRef] [Scilit]
- Papadrakakis, M.; Lagaros, N.D. Reliability-based structural optimization using neural networks and Monte Carlo simulation. Comput. Methods Appl. Mech. Eng. 2002, 191, 3491–3507. [Google Scholar] [CrossRef] [Scilit]
- Wang, P.; Zhang, Y.; Jiang, W. Application of K-Nearest Neighbor (KNN) Algorithm for Human Action Recognition. In Proceedings of the 2021 IEEE 4th Advanced Information Management, Communicates, Electronic and Automation Control Conference (IMCEC); IEEE: Piscataway, NJ, USA, 2021; Volume 4, pp. 492–496. [Google Scholar]
- Wang, P.; Jiang, W.; Wang, J. Reliability Analysis of Structures with Interval Parameters Based on a Radial Basis Function (RBF) Neural Network. In Proceedings of the 2020 IEEE 5th Information Technology and Mechatronics Engineering Conference (ITOEC); IEEE: Piscataway, NJ, USA, 2020; Volume 5, pp. 285–289. [Google Scholar]
- Timoshenko, S.; Young, D.H.; Weaver, W. Vibration Problems in Engineering; Wiley: Hoboken, NJ, USA, 1974. [Google Scholar]
- Timoshenko, S.P.; Goodier, J.N. Theory of Elasticity; Tsinghua University Press: Beijing, China, 2005. [Google Scholar]
- Wang, F.M.; He, J.; Zhu, J.Q. Measurement Method and Its Application on Dynamical Stress of High-Speed Small-Size Turbine Blades. J. Propuls. Technol. 2018, 39, 1406–1411. [Google Scholar] [CrossRef] [Scilit]
- Yu, M.; Wu, D.; Zhao, J.; Liu, S.; Gong, K.; Qu, Z. Vibration Characteristics Analysis of a Type of Turbine Disk-Blade Assembly System. Adv. Mech. Eng. 2022, 14, 16878132221136945. [Google Scholar] [CrossRef] [Scilit]
- Fan, X.; Liang, W.; Zeng, J.; Yang, Y.; Ma, H.; Fan, C.; Fu, S. Dynamic Characteristics of a Rotating Blade with a Dovetail Fixture. Machines 2023, 11, 643. [Google Scholar] [CrossRef] [Scilit]
- Zhao, P.T.; Yu, H.C.; He, Y.H. Current Situation of Research on Test Methods for Elastic Modulus and Poisson’s Ratio of Single Crystal Superalloys. J. Aeronaut. Mater. 2019, 39, 25–34. [Google Scholar]
- Wei, D.; Liu, Y.; Wang, Y.; Wang, J.; Jiang, X. Normalized Parameter Creep Model of DD6 Nickel-Based Single Crystal. Metals 2021, 11, 254. [Google Scholar] [CrossRef] [Scilit]



Disclaimer/Publisher’s Note: The statements, opinions and data contained in all publications are solely those of the individual author(s) and contributor(s) and not of MDPI and/or the editor(s). MDPI and/or the editor(s) disclaim responsibility for any injury to people or property resulting from any ideas, methods, instructions or products referred to in the content. |
© 2026 by the authors. Licensee MDPI, Basel, Switzerland. This article is an open access article distributed under the terms and conditions of the Creative Commons Attribution (CC BY) license.