


Abstract
Partial discharge (PD) is a key indicator of insulation degradation in high-voltage transformers and can provide early warning of incipient failure. Although artificial neural networks (ANNs) have been applied to PD classification, their performance may be affected by redundant features and overfitting when using expanded feature spaces. This study proposes a PD severity classification framework that combines physics-informed feature engineering, principal component analysis (PCA), and a multilayer perceptron (MLP) neural network. PD measurements were acquired from a physical transformer using the IEC 60270 electrical measurement method, yielding 294 samples labelled into four severity classes: normal, low, medium, and high PD. Two measured variables, namely PD magnitude and applied voltage, were expanded into a 10-dimensional feature space using energy-based, ratio-based, logarithmic, and normalized features. PCA was then used to reduce the feature space, and the retained principal components were used as inputs to the classifier. The results show that the first two principal components captured more than 90% of the total variance and enabled the MLP to achieve 98.3% test accuracy, matching the performance obtained using all 10 engineered features and improving on classification based on the raw measurements alone (91.5%). The proposed PCA-ANN model also achieved perfect precision and recall for the medium- and high-severity classes on the test set, and outperformed K-nearest neighbours, support vector machine, and Gaussian Naïve Bayes models in 5-fold cross-validation. These findings indicate that PCA can reduce feature dimensionality without loss of diagnostic performance, providing an efficient approach for transformer PD severity classification.
1. Introduction
The reliable operation of high-voltage (HV) electrical equipment, particularly power transformers, is essential for the continuity and stability of electrical grids and transmission networks [1]. The performance and service life of transformers depend strongly on the condition of their insulation systems, which deteriorate progressively during operation [2,3]. Insulation degradation is influenced by several interacting factors, including ageing, operating conditions, chemical processes, and internal mechanical and electrical stresses [4]. As this degradation progresses, the probability of dielectric defects and insulation failure increases, making accurate condition monitoring a critical requirement for transformer asset management [5,6]. One of the major manifestations of insulation deterioration in transformers is partial discharge (PD) [7]. PD is a localized electrical discharge that occurs within a small portion of an insulation system without completely bridging the electrodes [8]. Although initially limited in extent, repeated PD activity gradually weakens the dielectric structure and may eventually lead to severe insulation failure if it is not detected and mitigated in time [9,10]. In practice, PD may occur in several forms, including surface discharge, corona discharge, internal or void discharge, and treeing, depending on the nature of the insulation defect and the dielectric medium involved [11]. These discharge mechanisms may develop in air, liquid, or solid insulation systems, and each produces different electrical signatures and different degrees of insulation damage.
The various forms of PD generate distinct features and release different levels of energy, which in turn reflect the severity of the underlying insulation defect. The detection and interpretation of these features can therefore provide useful information for identifying fault conditions and supporting maintenance decisions in transformer operation [12].
PD activity can be detected using several measurement approaches, depending on the insulation system, operating environment, and required sensitivity. The conventional electrical detection method standardized in IEC 60270 [13] remains one of the most widely adopted approaches for transformer PD monitoring because of its high sensitivity and established calibration procedures. However, alternative techniques such as ultra-high-frequency (UHF) sensing, acoustic-emission (AE) monitoring, optical methods, and radio-frequency (RF) measurements have also received considerable research attention for detecting and characterizing discharge phenomena in high-voltage systems and related electrical applications [14,15,16]. In recent years, RF-based discharge monitoring has demonstrated strong capability for identifying spark-discharge behaviour and operating states in electrical discharge machining (EDM) systems. Research has shown that RF signatures can effectively distinguish different discharge conditions and machining states, thereby improving process stability and efficiency [17,18,19]. These findings are relevant to PD diagnostics because both EDM spark discharges and transformer PD events involve transient electrical discharge phenomena with characteristic electromagnetic signatures. Consequently, recent advances in RF-based discharge analysis and intelligent classification provide additional motivation for the development of machine-learning-assisted PD monitoring frameworks.
However, the relationship between PD type, measured signal characteristics, and discharge severity is often complex. In many cases, the separation between severity classes is not visually obvious, particularly when intermediate operating conditions are considered. As a result, conventional threshold-based or visually interpreted methods may be insufficient for robust PD diagnosis. To address this limitation, machine learning techniques have increasingly been applied to PD analysis and classification [20]. These methods are well suited to modelling the nonlinear relationships that often exist between measured variables and insulation condition states. Among them, Artificial Neural Networks (ANNs) have attracted particular attention because of their strong pattern-recognition capability and their ability to classify complex electrical fault signatures with high accuracy [19,20]. Nevertheless, ANN-based classifiers are sensitive to the representation of the input space. When trained directly on limited raw measurements, important discriminatory information may remain underrepresented. Conversely, when many engineered features are introduced, feature redundancy and inter-feature correlation may increase model complexity and lead to overfitting, particularly when the dataset is limited or imbalanced [20]. Feature engineering offers one way to improve class separability by constructing physically meaningful variables from the measured data. In PD applications, such variables can reflect energy-related behaviour, voltage stress, relative discharge intensity, and scale-normalized characteristics. However, an expanded feature space also introduces strong statistical dependence between variables derived from the same underlying measurements. Under these conditions, dimensionality-reduction methods become necessary to retain the informative structure of the data while reducing redundancy. Principal Component Analysis (PCA) is particularly suitable for this purpose because it transforms correlated variables into a smaller number of orthogonal components that capture the dominant variance structure of the dataset. In this study, a PD severity classification framework is proposed for transformer condition assessment using physics-informed feature engineering, PCA, and an ANN classifier. PD measurements were collected from a physical transformer using the IEC 60270 electrical measurement method, and the resulting dataset was grouped into four severity classes: normal PD, low PD, medium PD, and high PD. Starting from the two primary measured variables, namely apparent discharge magnitude and applied voltage, additional derived features were constructed to better represent the physical behaviour of the discharge process. PCA was then applied to obtain a compact set of informative features, which were subsequently used as inputs to a multilayer perceptron classifier. The proposed framework was further evaluated against alternative classification approaches in order to assess its diagnostic effectiveness.
The main contribution of this study is the development of a compact and physically grounded framework for transformer PD severity classification that integrates feature engineering, dimensionality reduction, and neural-network-based prediction. Unlike approaches that rely only on the raw measured variables, the proposed method constructs a richer feature space from IEC 60270-aligned PD data and then compresses that space before classification. This allows the model to retain the discriminatory information contained in the engineered features while avoiding the penalty of excessive dimensionality. The novelty of the study lies in three aspects. First, it formulates a physics-informed feature space for PD severity analysis using derived descriptors based on apparent charge magnitude and applied voltage. Second, it applies PCA specifically as a feature-compression stage for transformer PD severity classification, thereby reducing feature redundancy before ANN training. Third, it demonstrates that a reduced number of principal components can preserve the dominant diagnostic information required for accurate four-class severity classification. In this way, the study contributes not only a classification model, but also to a practical methodological pathway for combining physically meaningful PD descriptors with low-dimensional machine-learning representations.
The remainder of this manuscript is organized as follows. Section 2 describes the dataset, class definitions, and the feature-engineering procedure. Section 3 presents the proposed methodology, including correlation analysis, PCA, and the ANN architecture. Section 4 discusses the classification results, including dimensionality-reduction performance, confusion-matrix analysis, per-class evaluation, and benchmarking against alternative classifiers. Section 5 concludes the paper by summarizing the main findings, providing recommendations, and outlining directions for future research.
2. Dataset Description
2.1. Data Collection and Test Setup
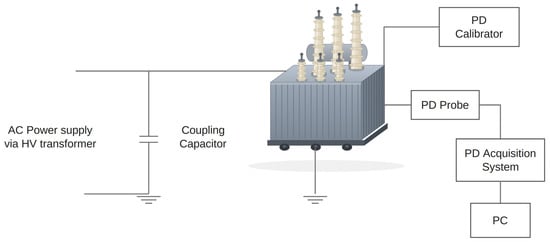
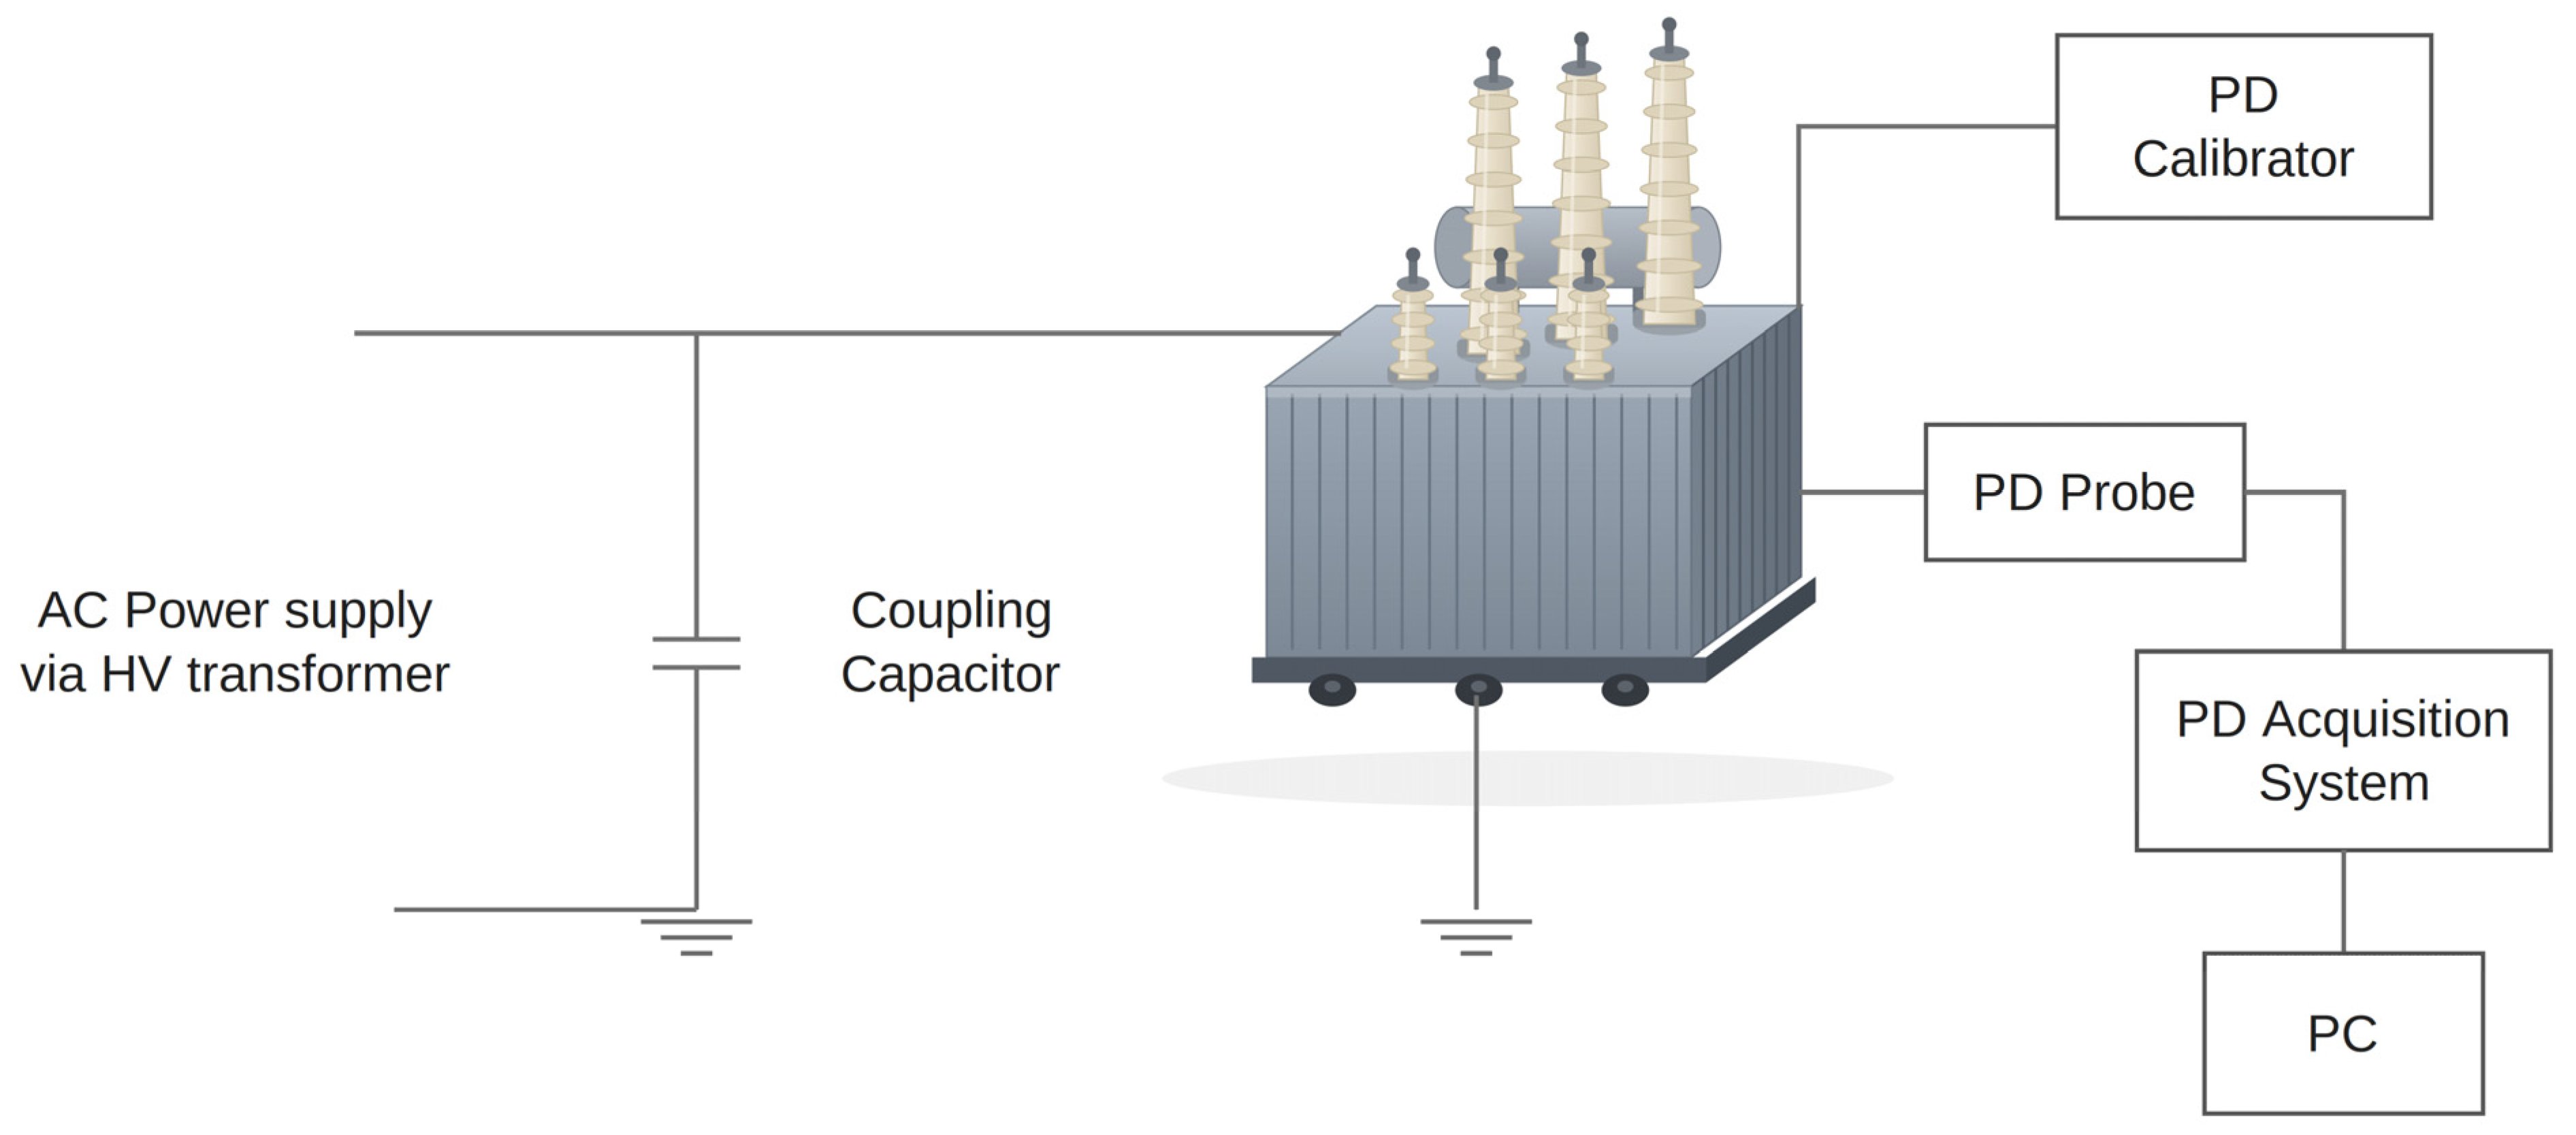
The PD data has been collected from a power transformer in a manufacturers workshop. The test setup is premised on the guidelines of Section 11.5 of the International standard IEC 60270, as shown in Figure 1.
Figure 1.
PD Test Setup.
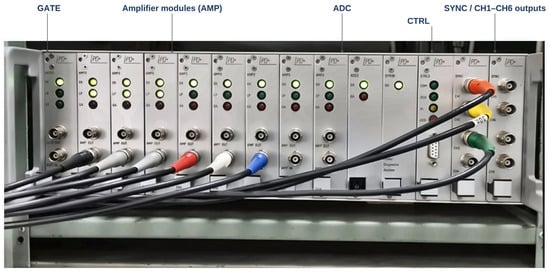
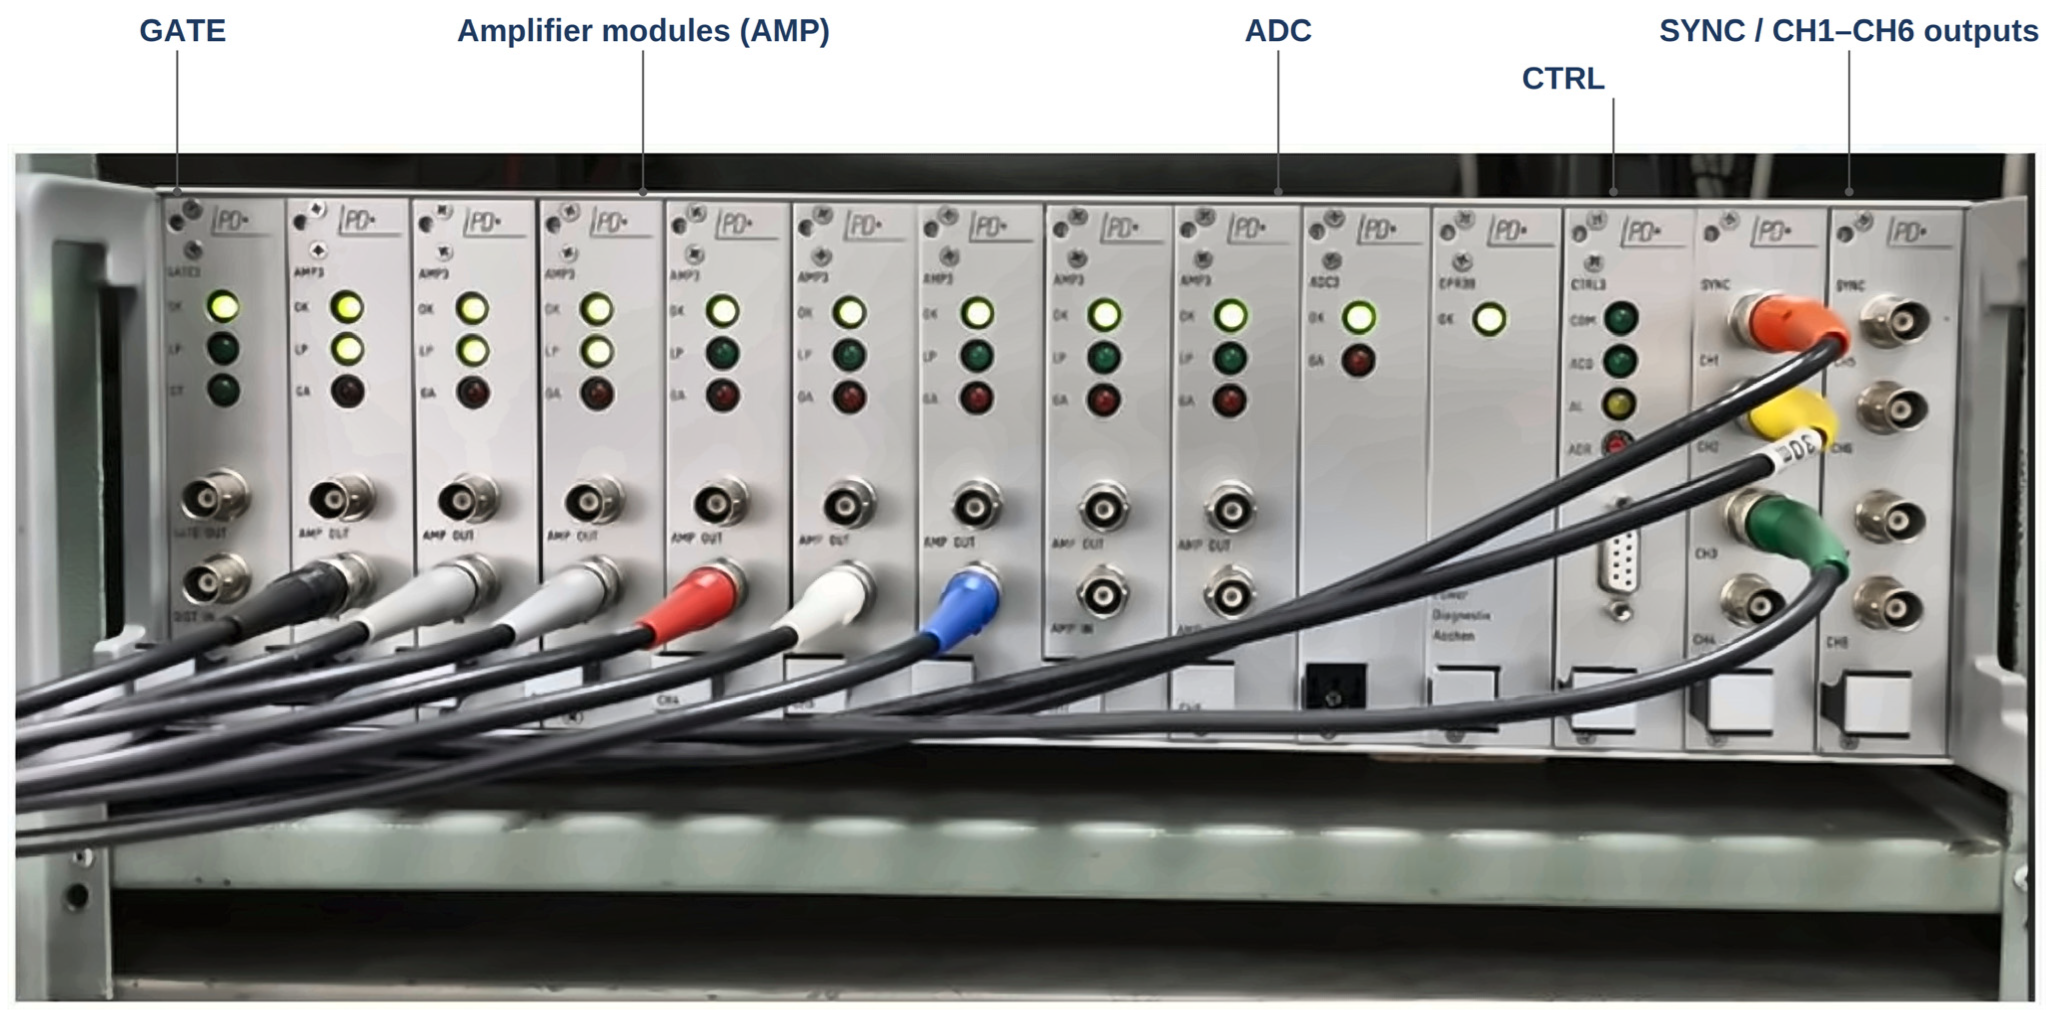
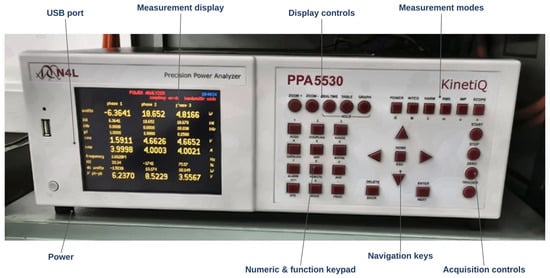
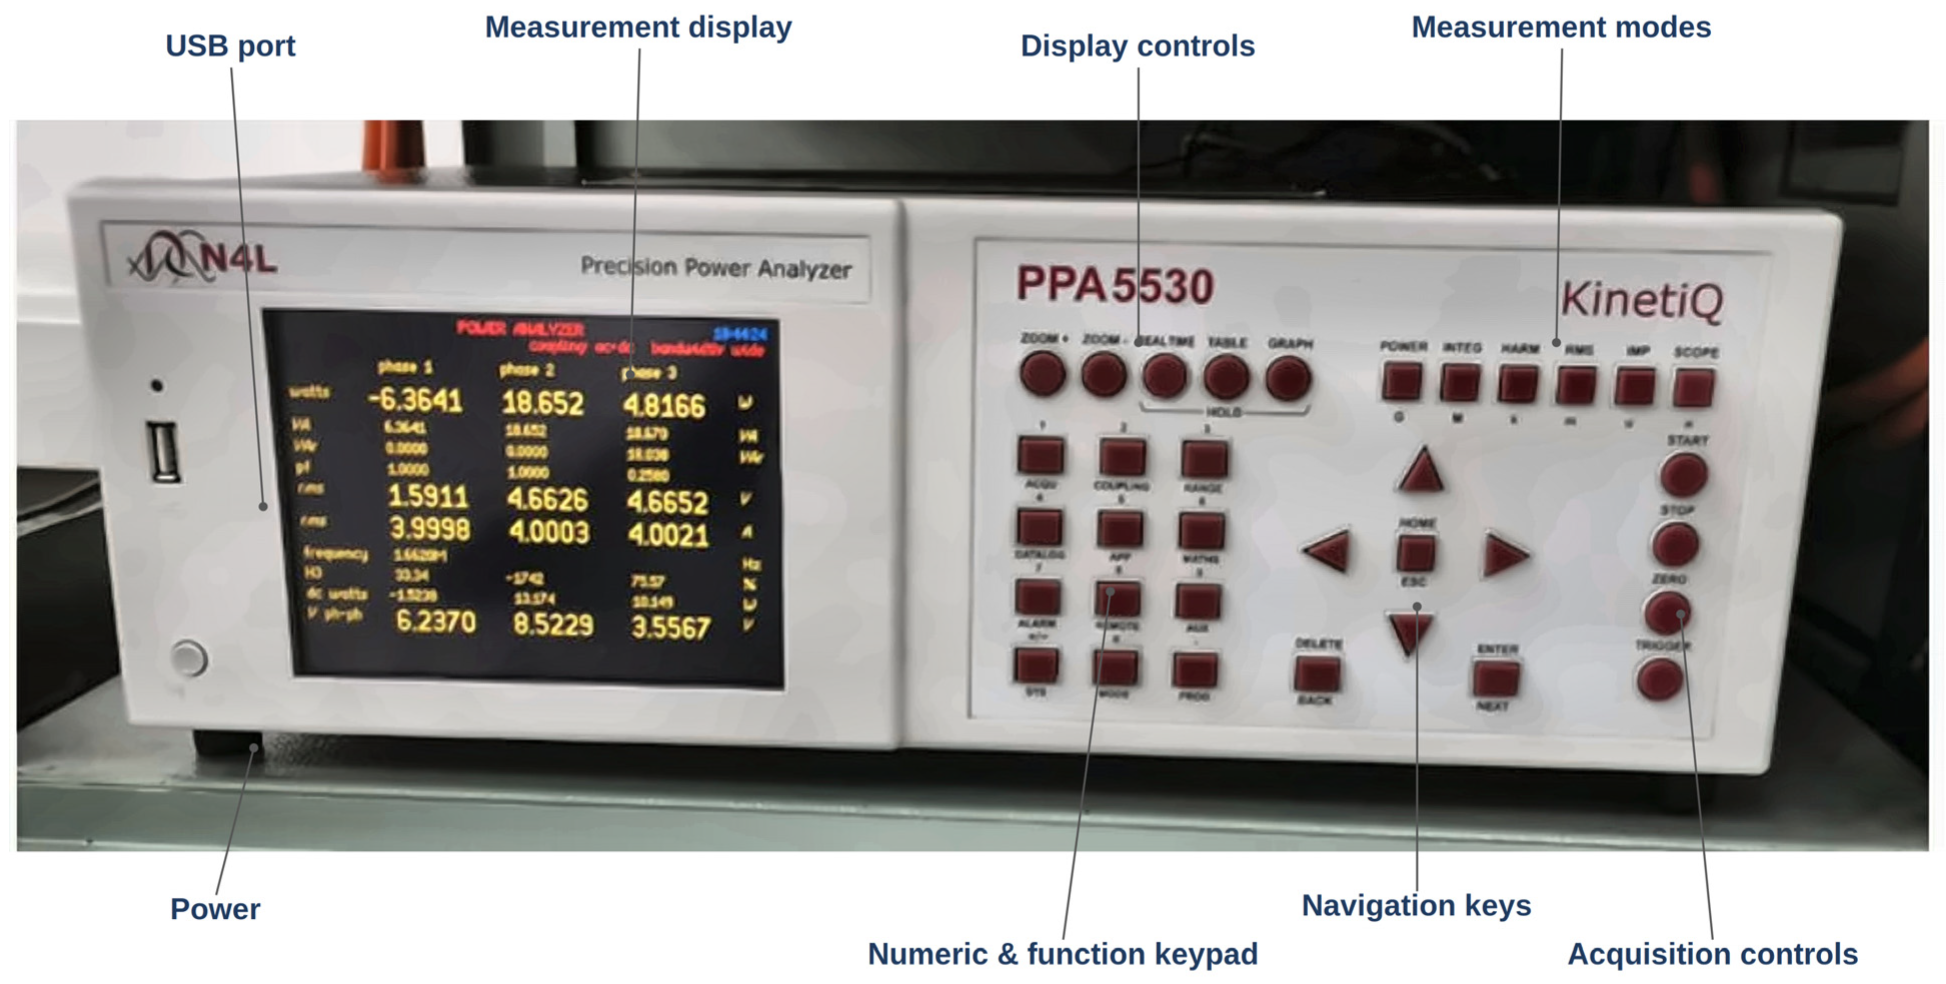
The setup comprises a power supply, a coupling capacitor, PD calibrators, PD probes, a multi-channel PD acquisition system (Figure 2), a power analyzer (Figure 3) and a person computer with appropriate software.
Figure 2.
PD Test Multi-Channel PD Acquisition.
Figure 3.
PD Test Power Analyzer.
2.2. Data Source and Condition Classes
The dataset comprised 294 partial discharge (PD) measurement records acquired from a physical transformer during condition-monitoring tests. Measurements were obtained using the electrical detection method in accordance with the IEC 60270 standard. Each record included PD charge magnitude (pC), applied voltage (kV), time stamp (ms), frequency (Hz), and phase angle (°). For classification purposes, each sample was assigned a PD severity label based on the relationship between the discharge magnitude and the applied voltage. Four operating-condition classes were defined: Normal Operation, Low PD Activity, Medium PD Activity, and High PD Activity. The class distribution and the stratified training-testing split are summarized in Table 1. Of the 294 total samples, 235 were used for training and 59 for testing.
Table 1.
Sample distribution of PD condition classes.
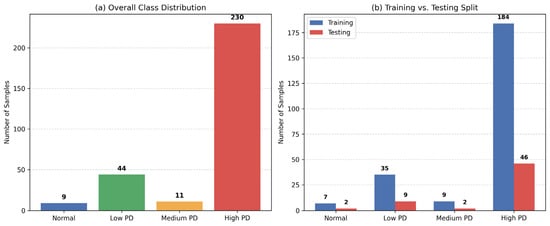
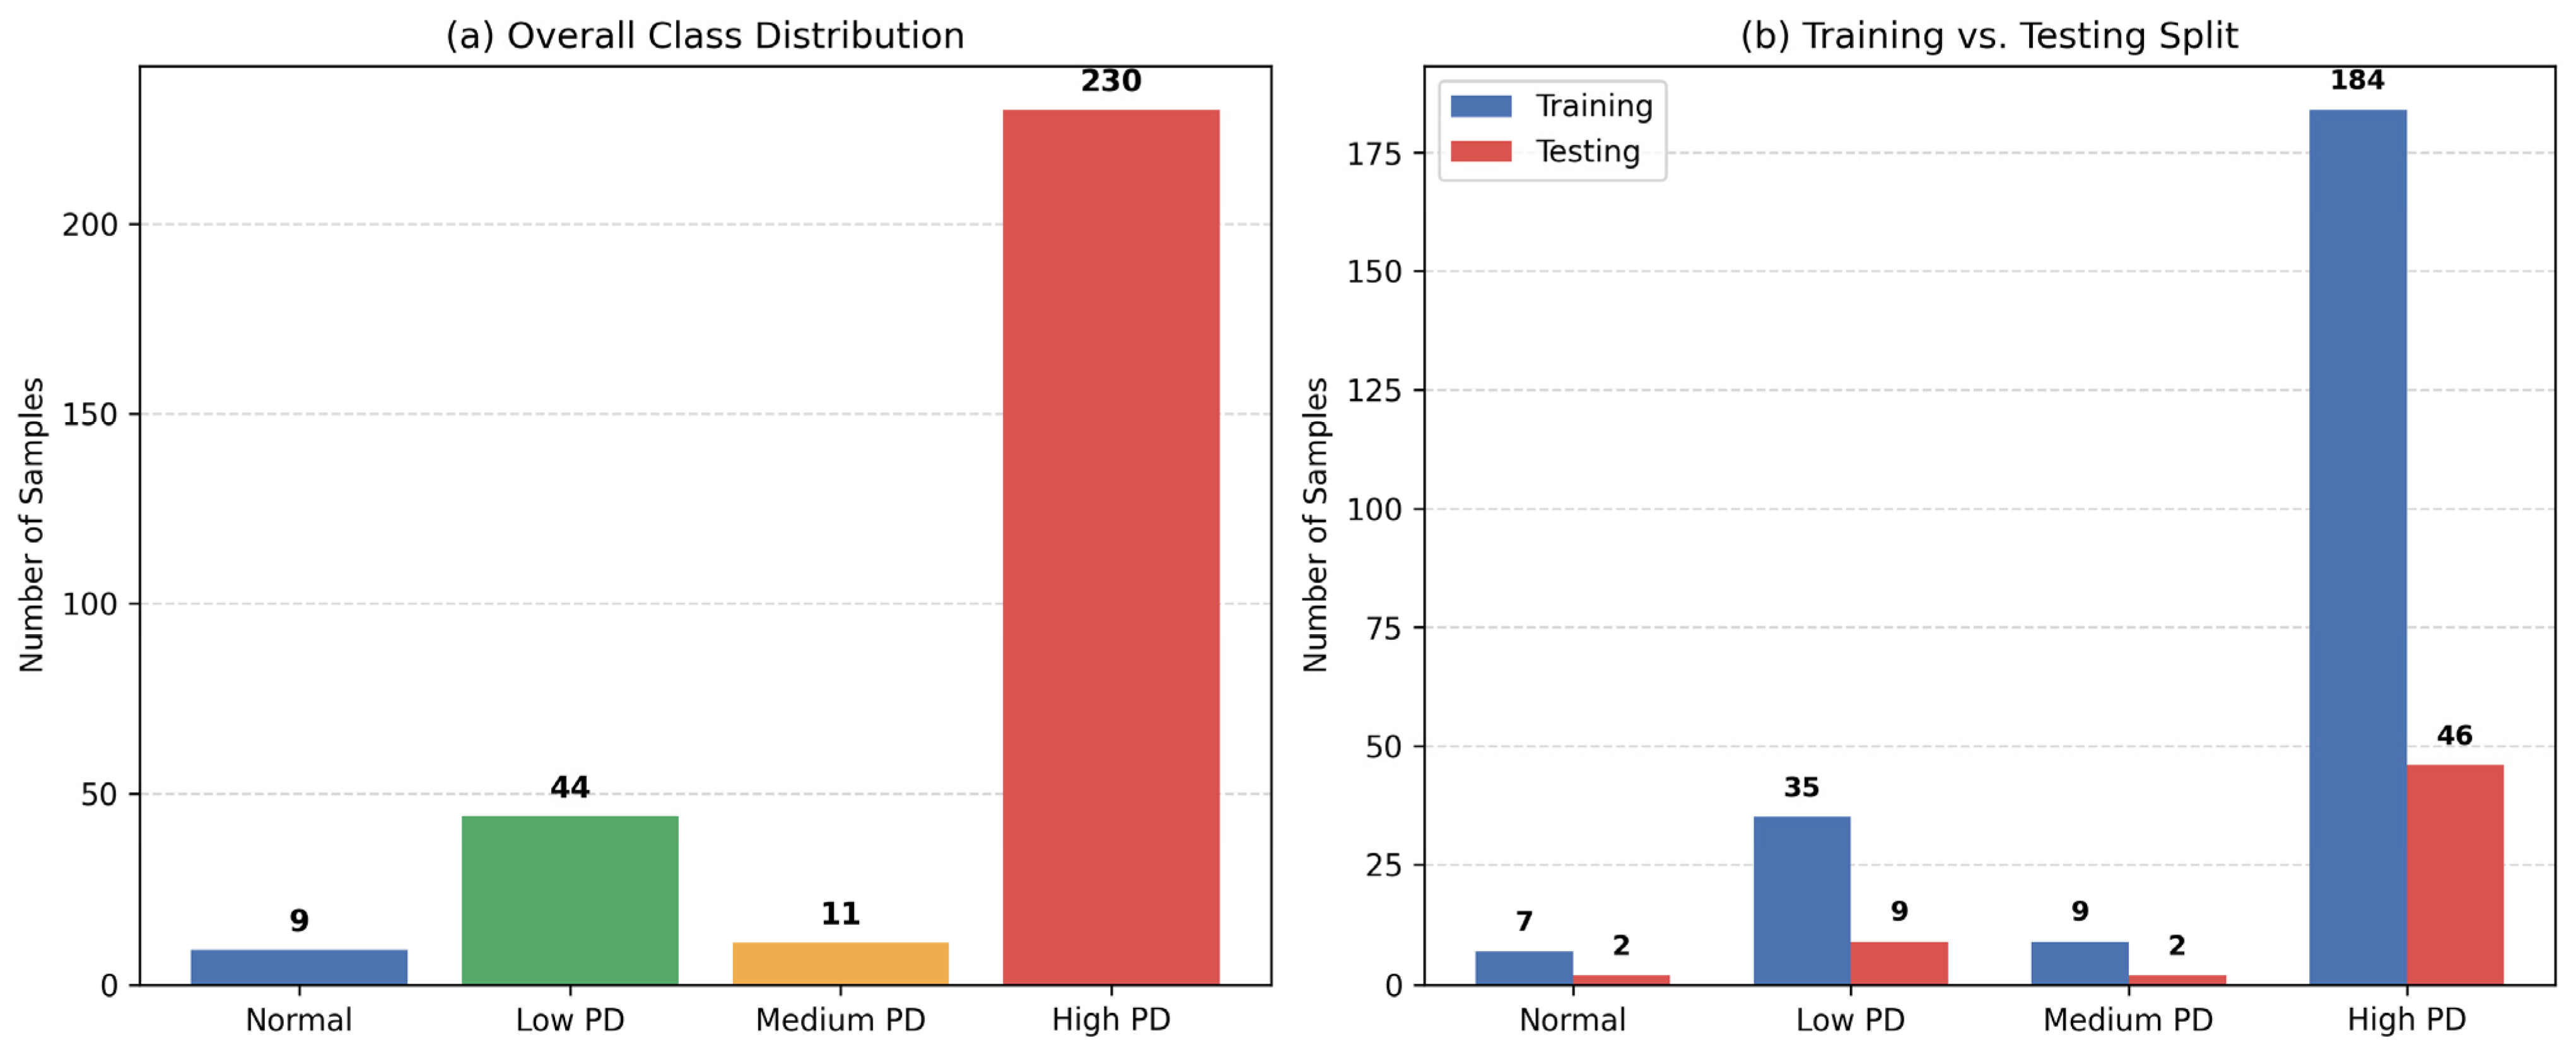
Figure 4 illustrates both the overall class distribution and the corresponding stratified training-testing split. The dataset is markedly imbalanced, with High PD Activity accounting for 230 of the 294 samples, or 78.2% of the total dataset.
Figure 4.
Partial discharge class distribution: (a) overall class distribution across the four severity classes; (b) stratified training and testing split.
By comparison, Normal Operation and Medium PD Activity are sparsely represented, contributing only 3.1% and 3.7% of the samples, respectively. The stratified split preserves these class proportions in both the training and testing subsets, thereby ensuring that the test set remains representative of the original class composition.
2.3. Raw Data Exploration
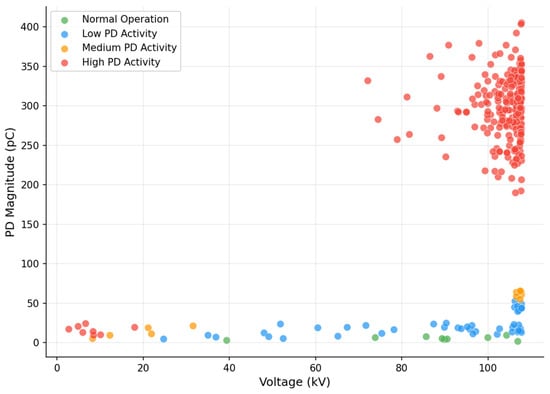
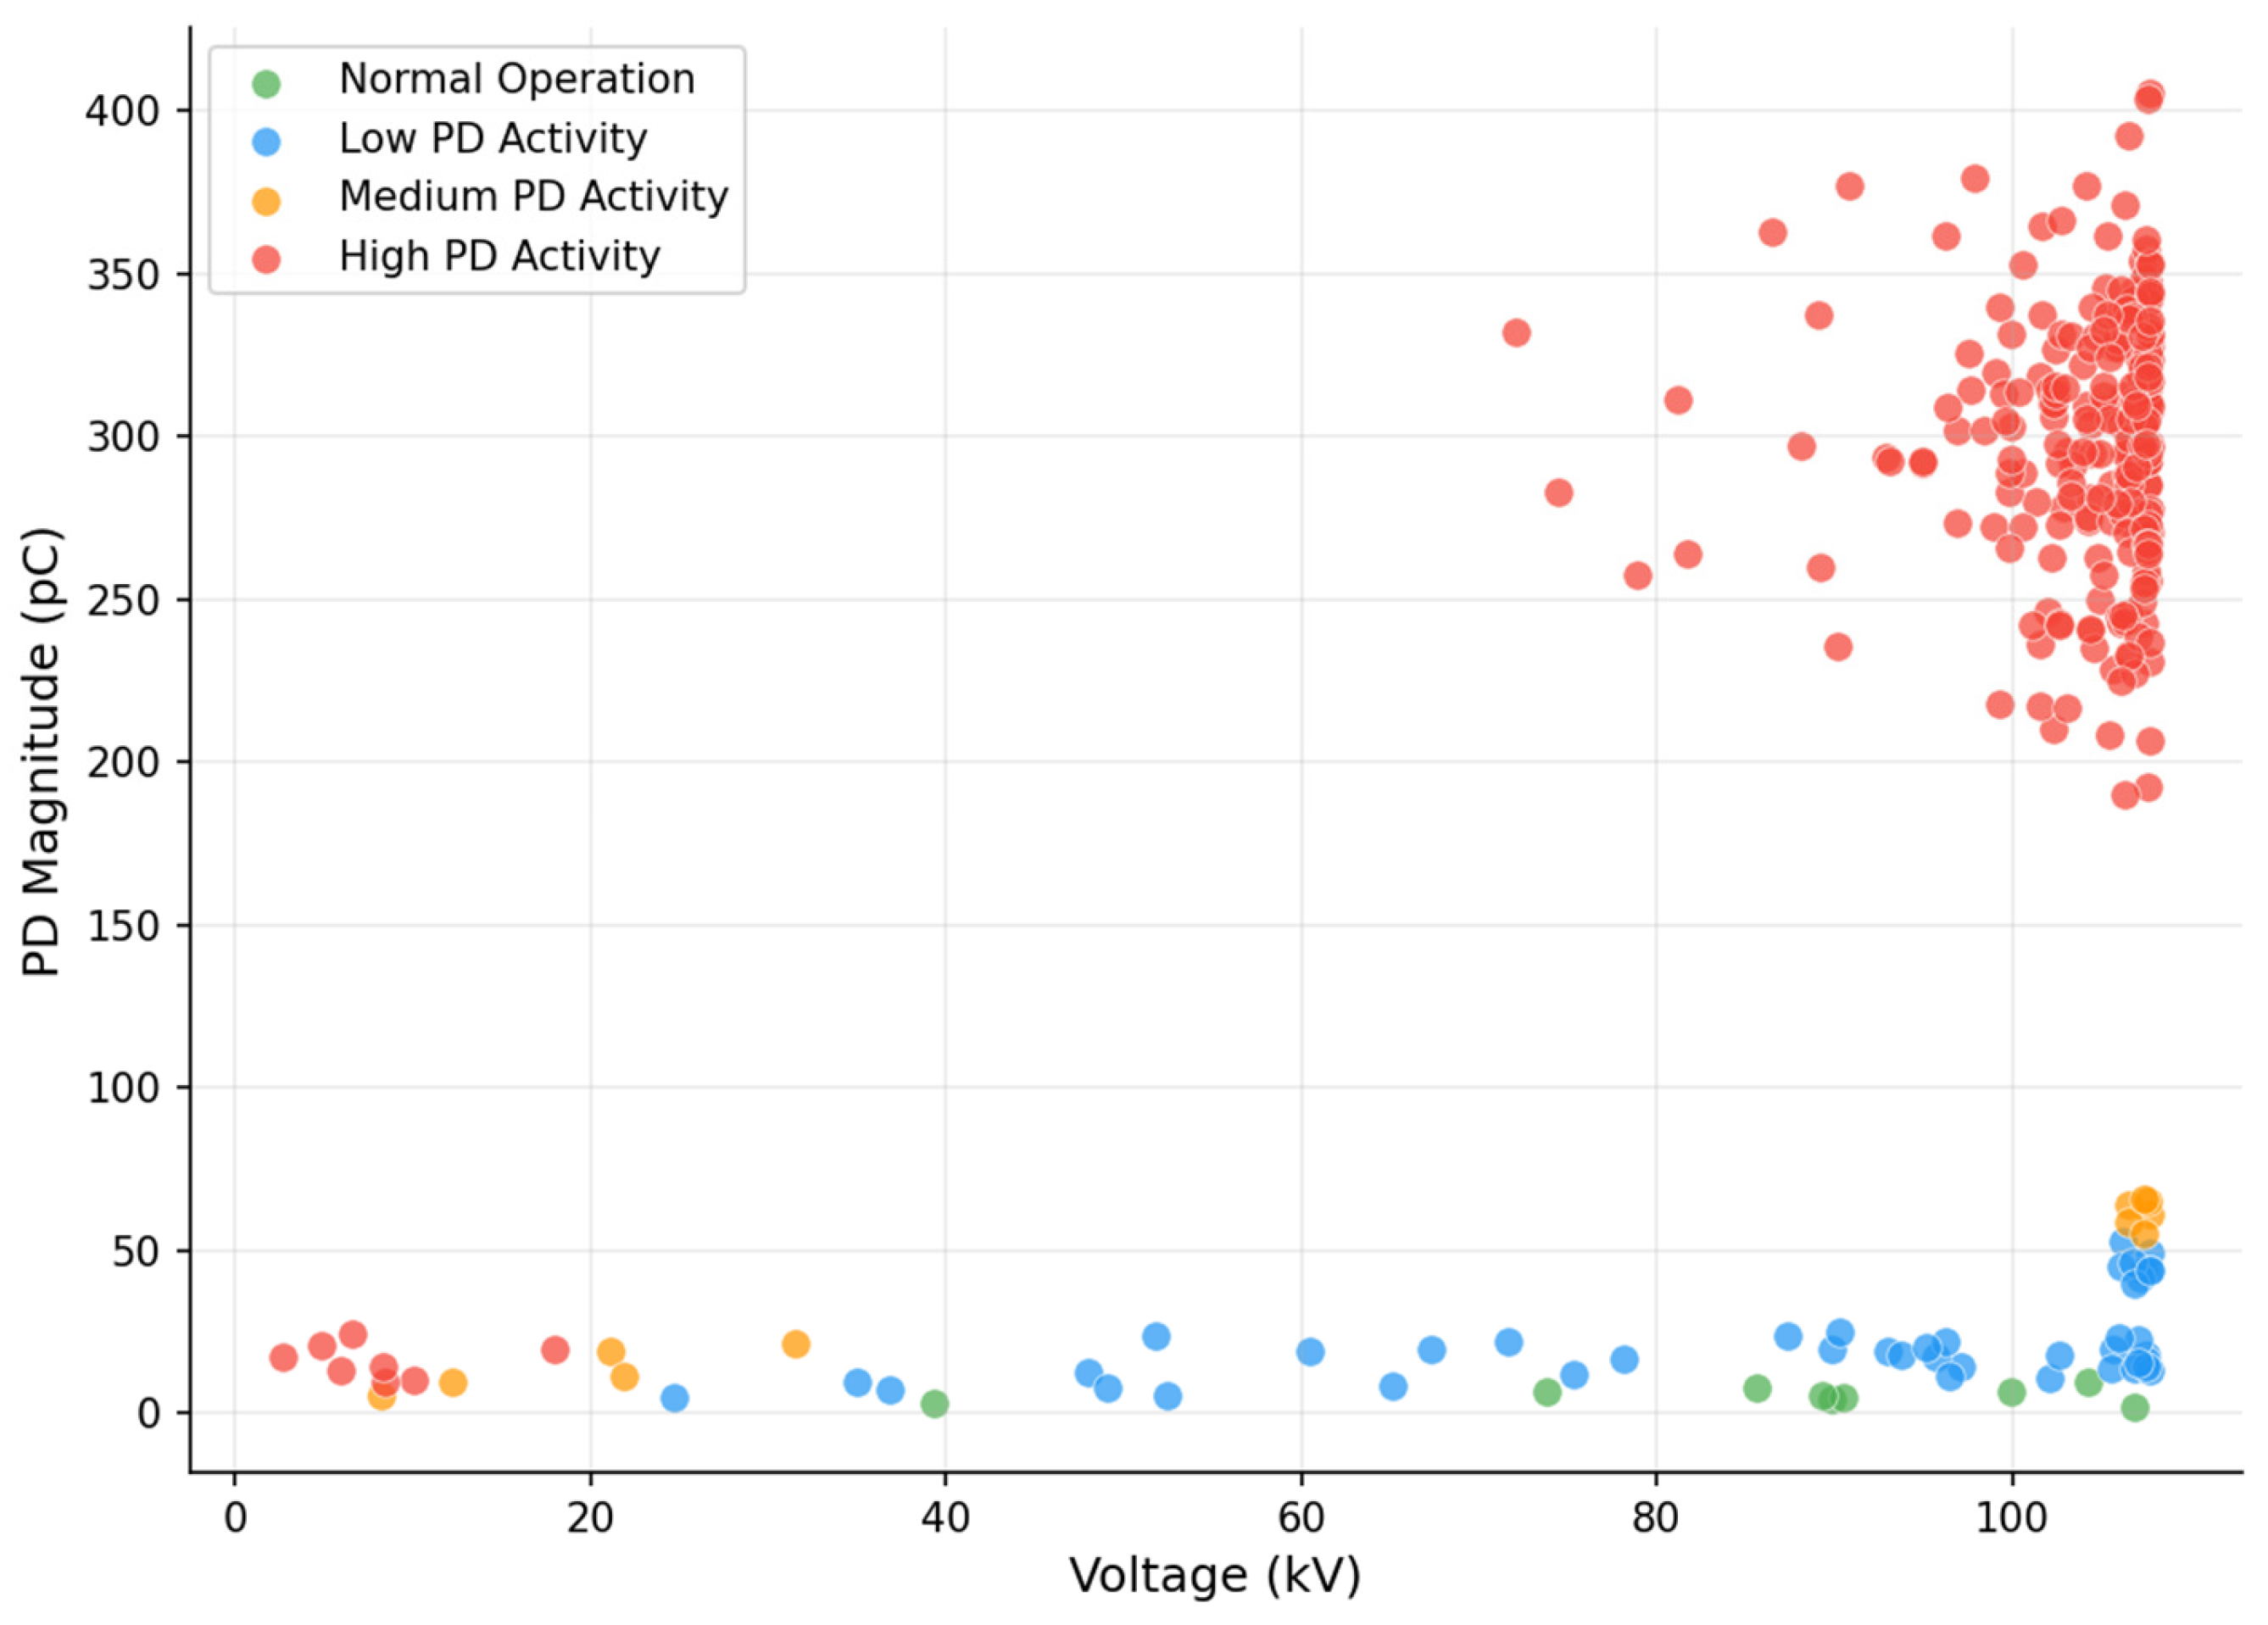
Figure 5 presents a scatter plot of PD magnitude versus applied voltage for all recorded samples. The plot provides an initial visual assessment of class separability in the raw measurement space. High PD Activity samples are concentrated at substantially higher discharge magnitudes, with most observations occurring above 200 pC and clustered predominantly at high applied voltages. A small number of High PD Activity samples appear outside the dominant high-magnitude cluster due to the stochastic and transient nature of partial discharge behavior during IEC 60270 measurements. Severe insulation defects may intermittently produce lower instantaneous discharge magnitudes because of phase-dependent discharge extinction and localized electric-field variations. Medium PD Activity occupies a transitional region, generally at high voltage levels and moderate discharge magnitudes, typically above 50 pC. In contrast, Low PD Activity and Normal Operation are concentrated at comparatively low discharge magnitudes, mostly below 50 pC, although they remain distributed across a similar high-voltage region.
Figure 5.
Scatter plot of PD magnitude versus applied voltage for the four PD severity classes.
Although the extreme High PD cluster is visually distinguishable, the boundary between Normal Operation, Low PD Activity, and Medium PD Activity is less clearly defined. In particular, overlap is evident in the intermediate voltage range and at lower discharge magnitudes, where class separation cannot be achieved reliably using simple threshold-based zoning. This observation motivates the use of feature engineering and machine-learning classification to extract more informative discriminatory patterns from the measurements.
2.4. Feature Engineering
To improve the discriminative power of the input space beyond the two primary measured variables, eight additional physics-informed features were derived from the PD magnitude and applied voltage. This expanded the feature space from 2 to 10 dimensions. The engineered features were designed to capture complementary aspects of PD behaviour, including energy-related effects, voltage-stress relationships, ratio-based severity indicators, and logarithmic transformations for dynamic-range compression. The full set of derived features is listed in Table 2.
Table 2.
Engineered features derived from the measured PD variables.
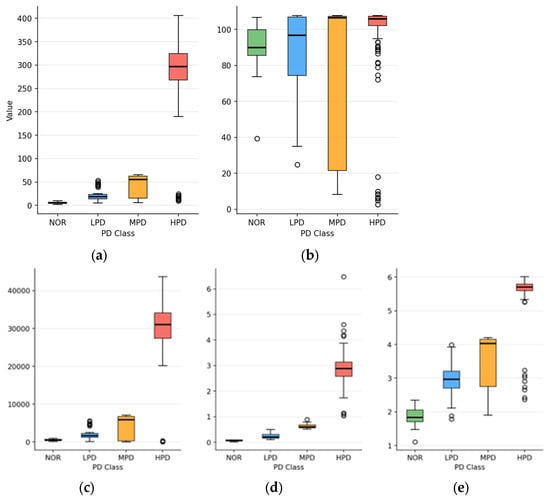
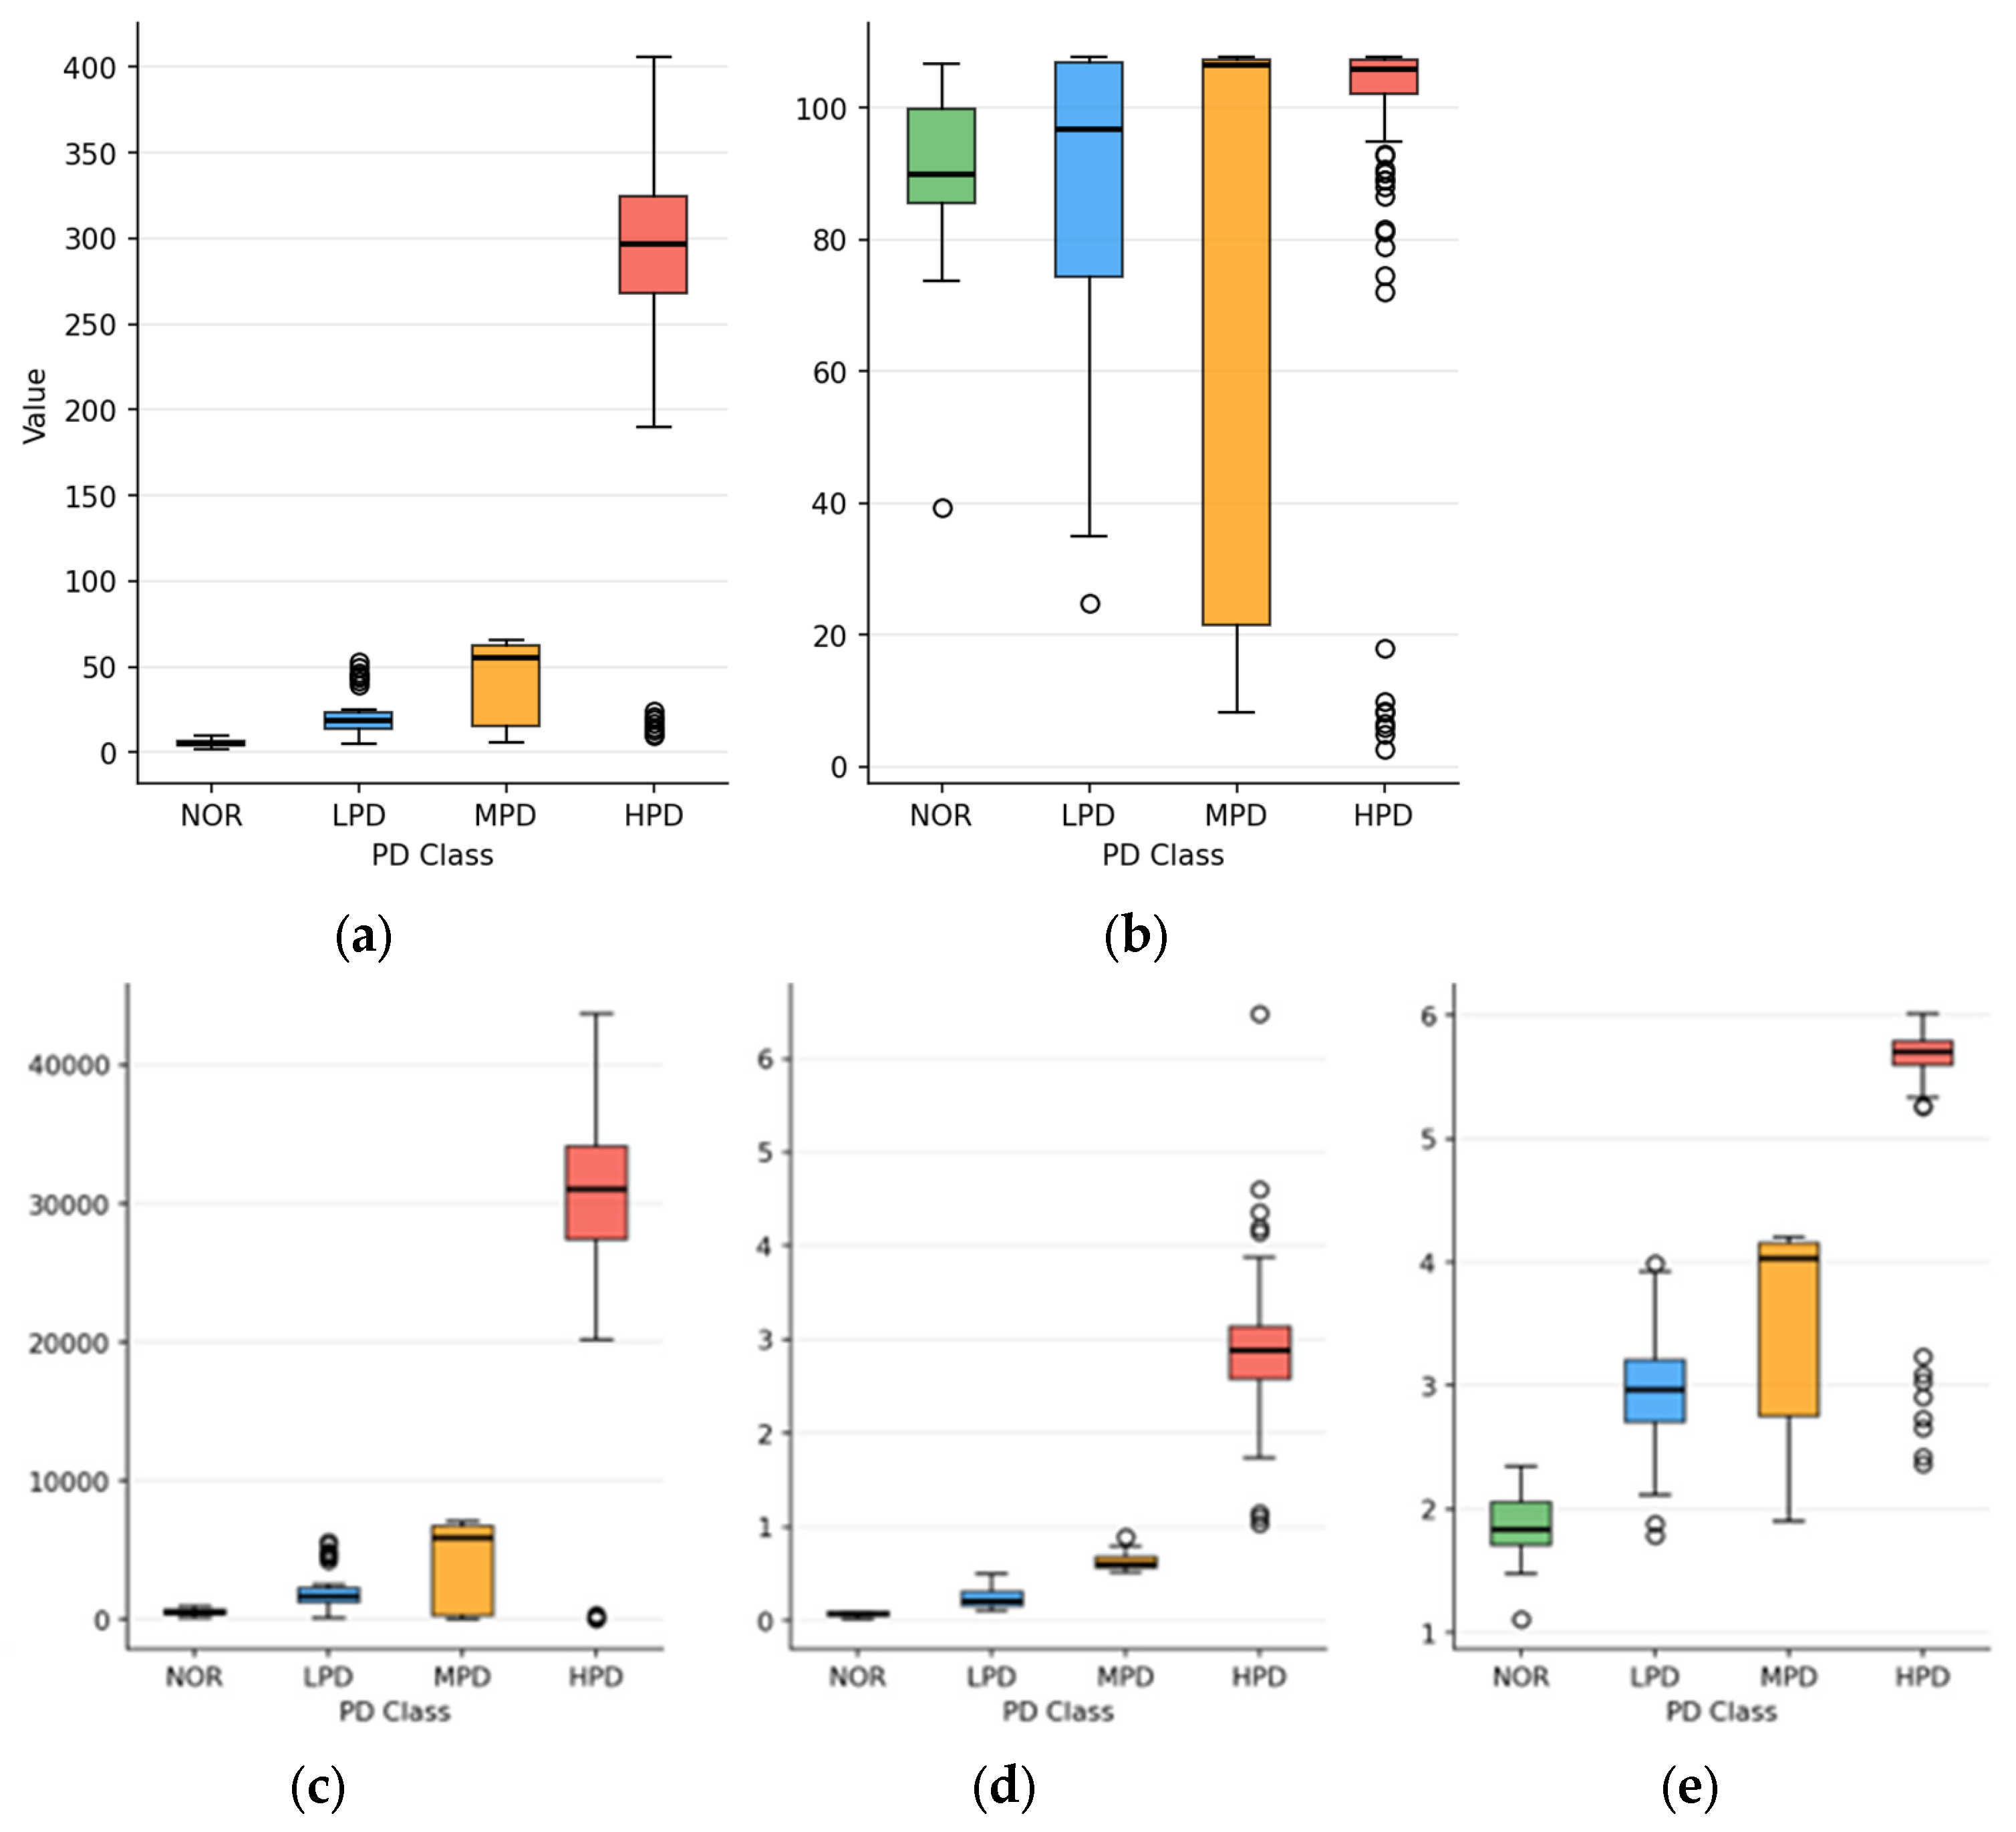
Figure 6 presents box plots of representative engineered features grouped by PD severity class. The distributions indicate that the derived variables provide clearer inter-class separation than the raw measurements alone.
Figure 6.
Distribution of representative engineered features by PD severity class (a) |Q|, (b) Voltage, (c) |Q|·V, (d) |Q|/V, and (e) log|Q|.
In particular, features such as |Q|·V and |Q|/V show stronger separation between the severity groups, especially for the high-PD class and the intermediate boundary between low and medium PD activity. This supports the use of physics-informed feature engineering as a means of improving the separability of PD condition classes prior to dimensionality reduction and classification.
3. Proposed Methodology
3.1. Correlation Analysis
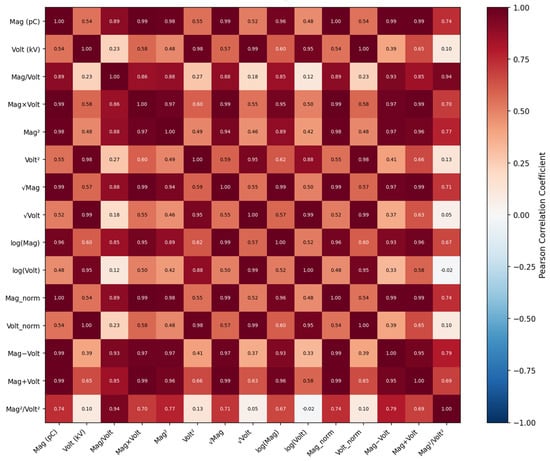
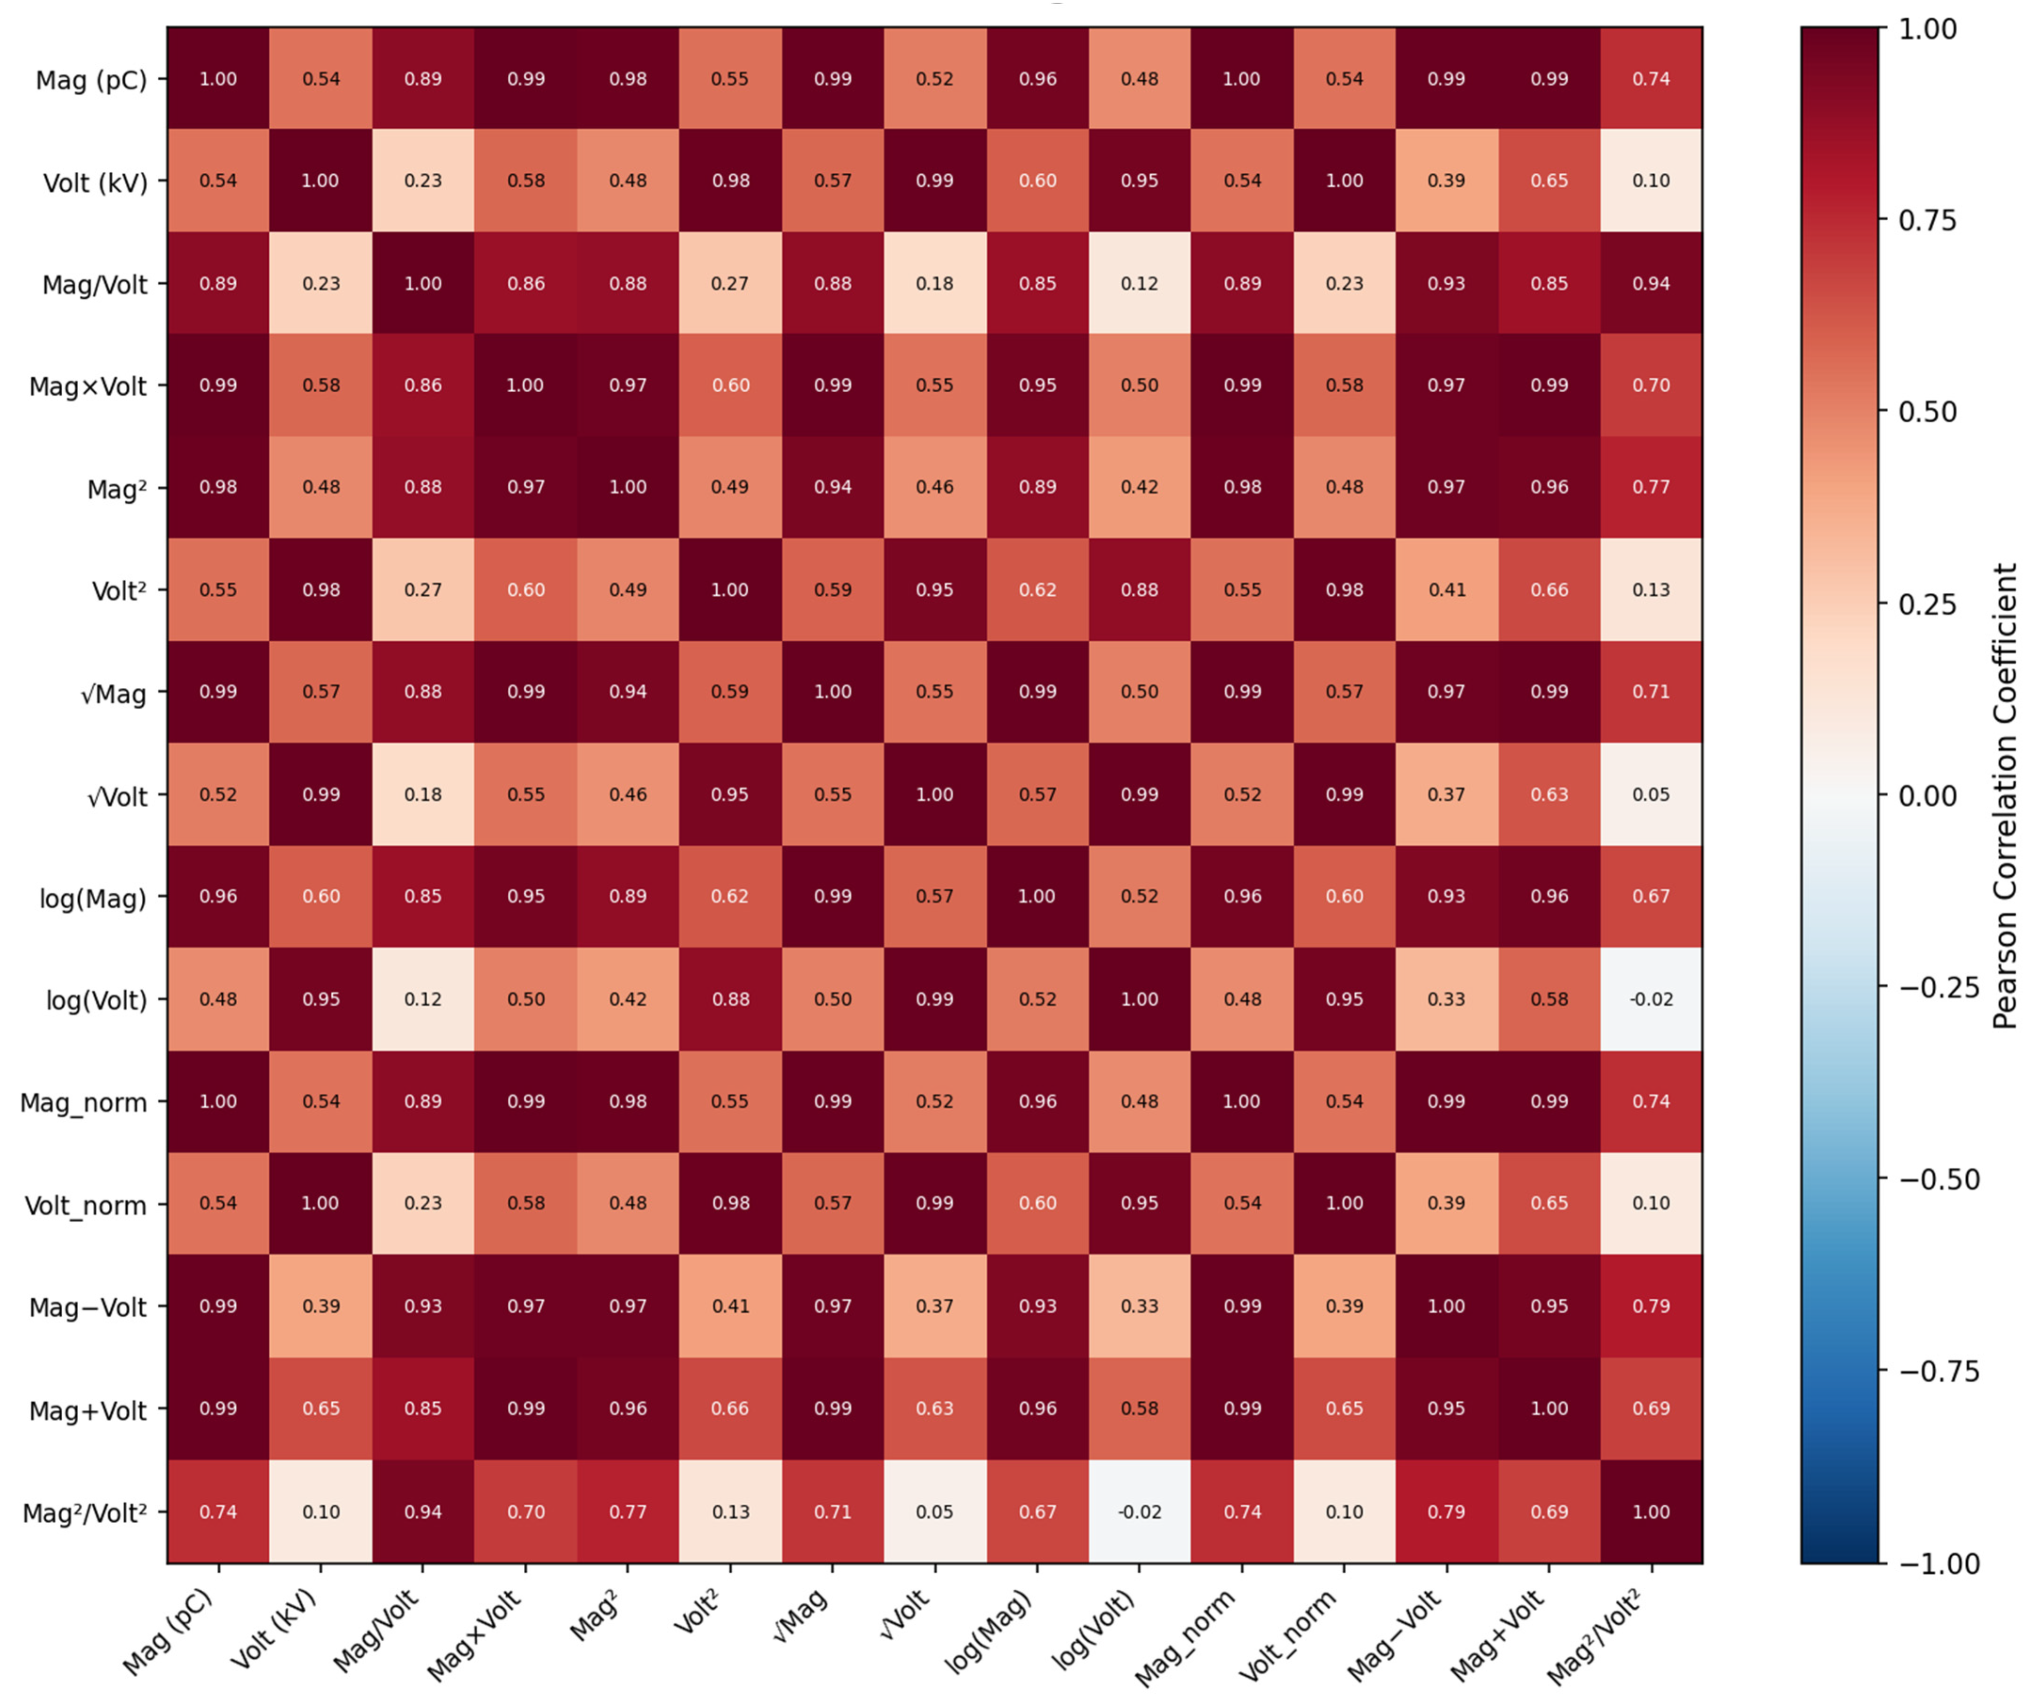
Before applying Principal Component Analysis (PCA), the correlation structure of the engineered feature set was examined in order to assess redundancy among the derived variables. As shown in Figure 7, strong positive correlations are observed among magnitude-related features, including |Q|, |Q|2, log|Q|, and |Q|norm, since these variables are all derived from the same underlying discharge-magnitude measurement. A similarly strong correlation is evident among voltage-related features, namely V, V2, and logV, as each reflects the same fundamental applied-voltage quantity through different transformations. These relationships indicate that the engineered feature space contains substantial redundancy and that dimensionality reduction is appropriate prior to classifier training.
Figure 7.
Pearson correlation matrix of the engineered PD features.
From a modelling perspective, this redundancy is important because highly correlated inputs may increase model complexity without providing equivalent gains in discriminatory information. Reducing the feature space is therefore expected to improve the efficiency of the Artificial Neural Network (ANN) classifier while preserving the dominant structure of the data.
3.2. Principal Component Analysis (PCA)
PCA was applied to the training data in order to identify orthogonal directions of maximum variance and to transform the 10-dimensional engineered feature space into a smaller set of informative components. The procedure consisted of three steps. First, all features were standardized to zero mean and unit variance using statistics computed from the training set. Second, the sample covariance matrix was calculated from the standardized data. Third, the eigenvalues and corresponding eigenvectors of the covariance matrix were obtained and ranked in descending order of explained variance. The leading eigenvectors were then retained to form a reduced projection of the original feature space. Mathematically, if X denotes the standardized training matrix, the covariance matrix is given by Equation (1).
and the reduced PCA projection is obtained as Equation (2).
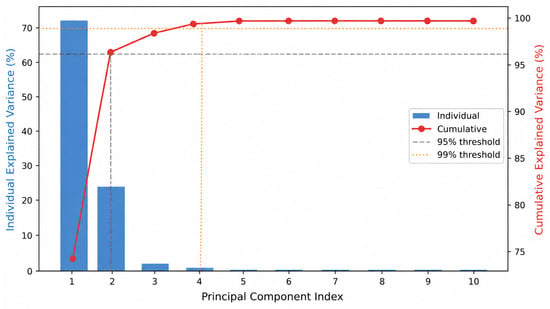
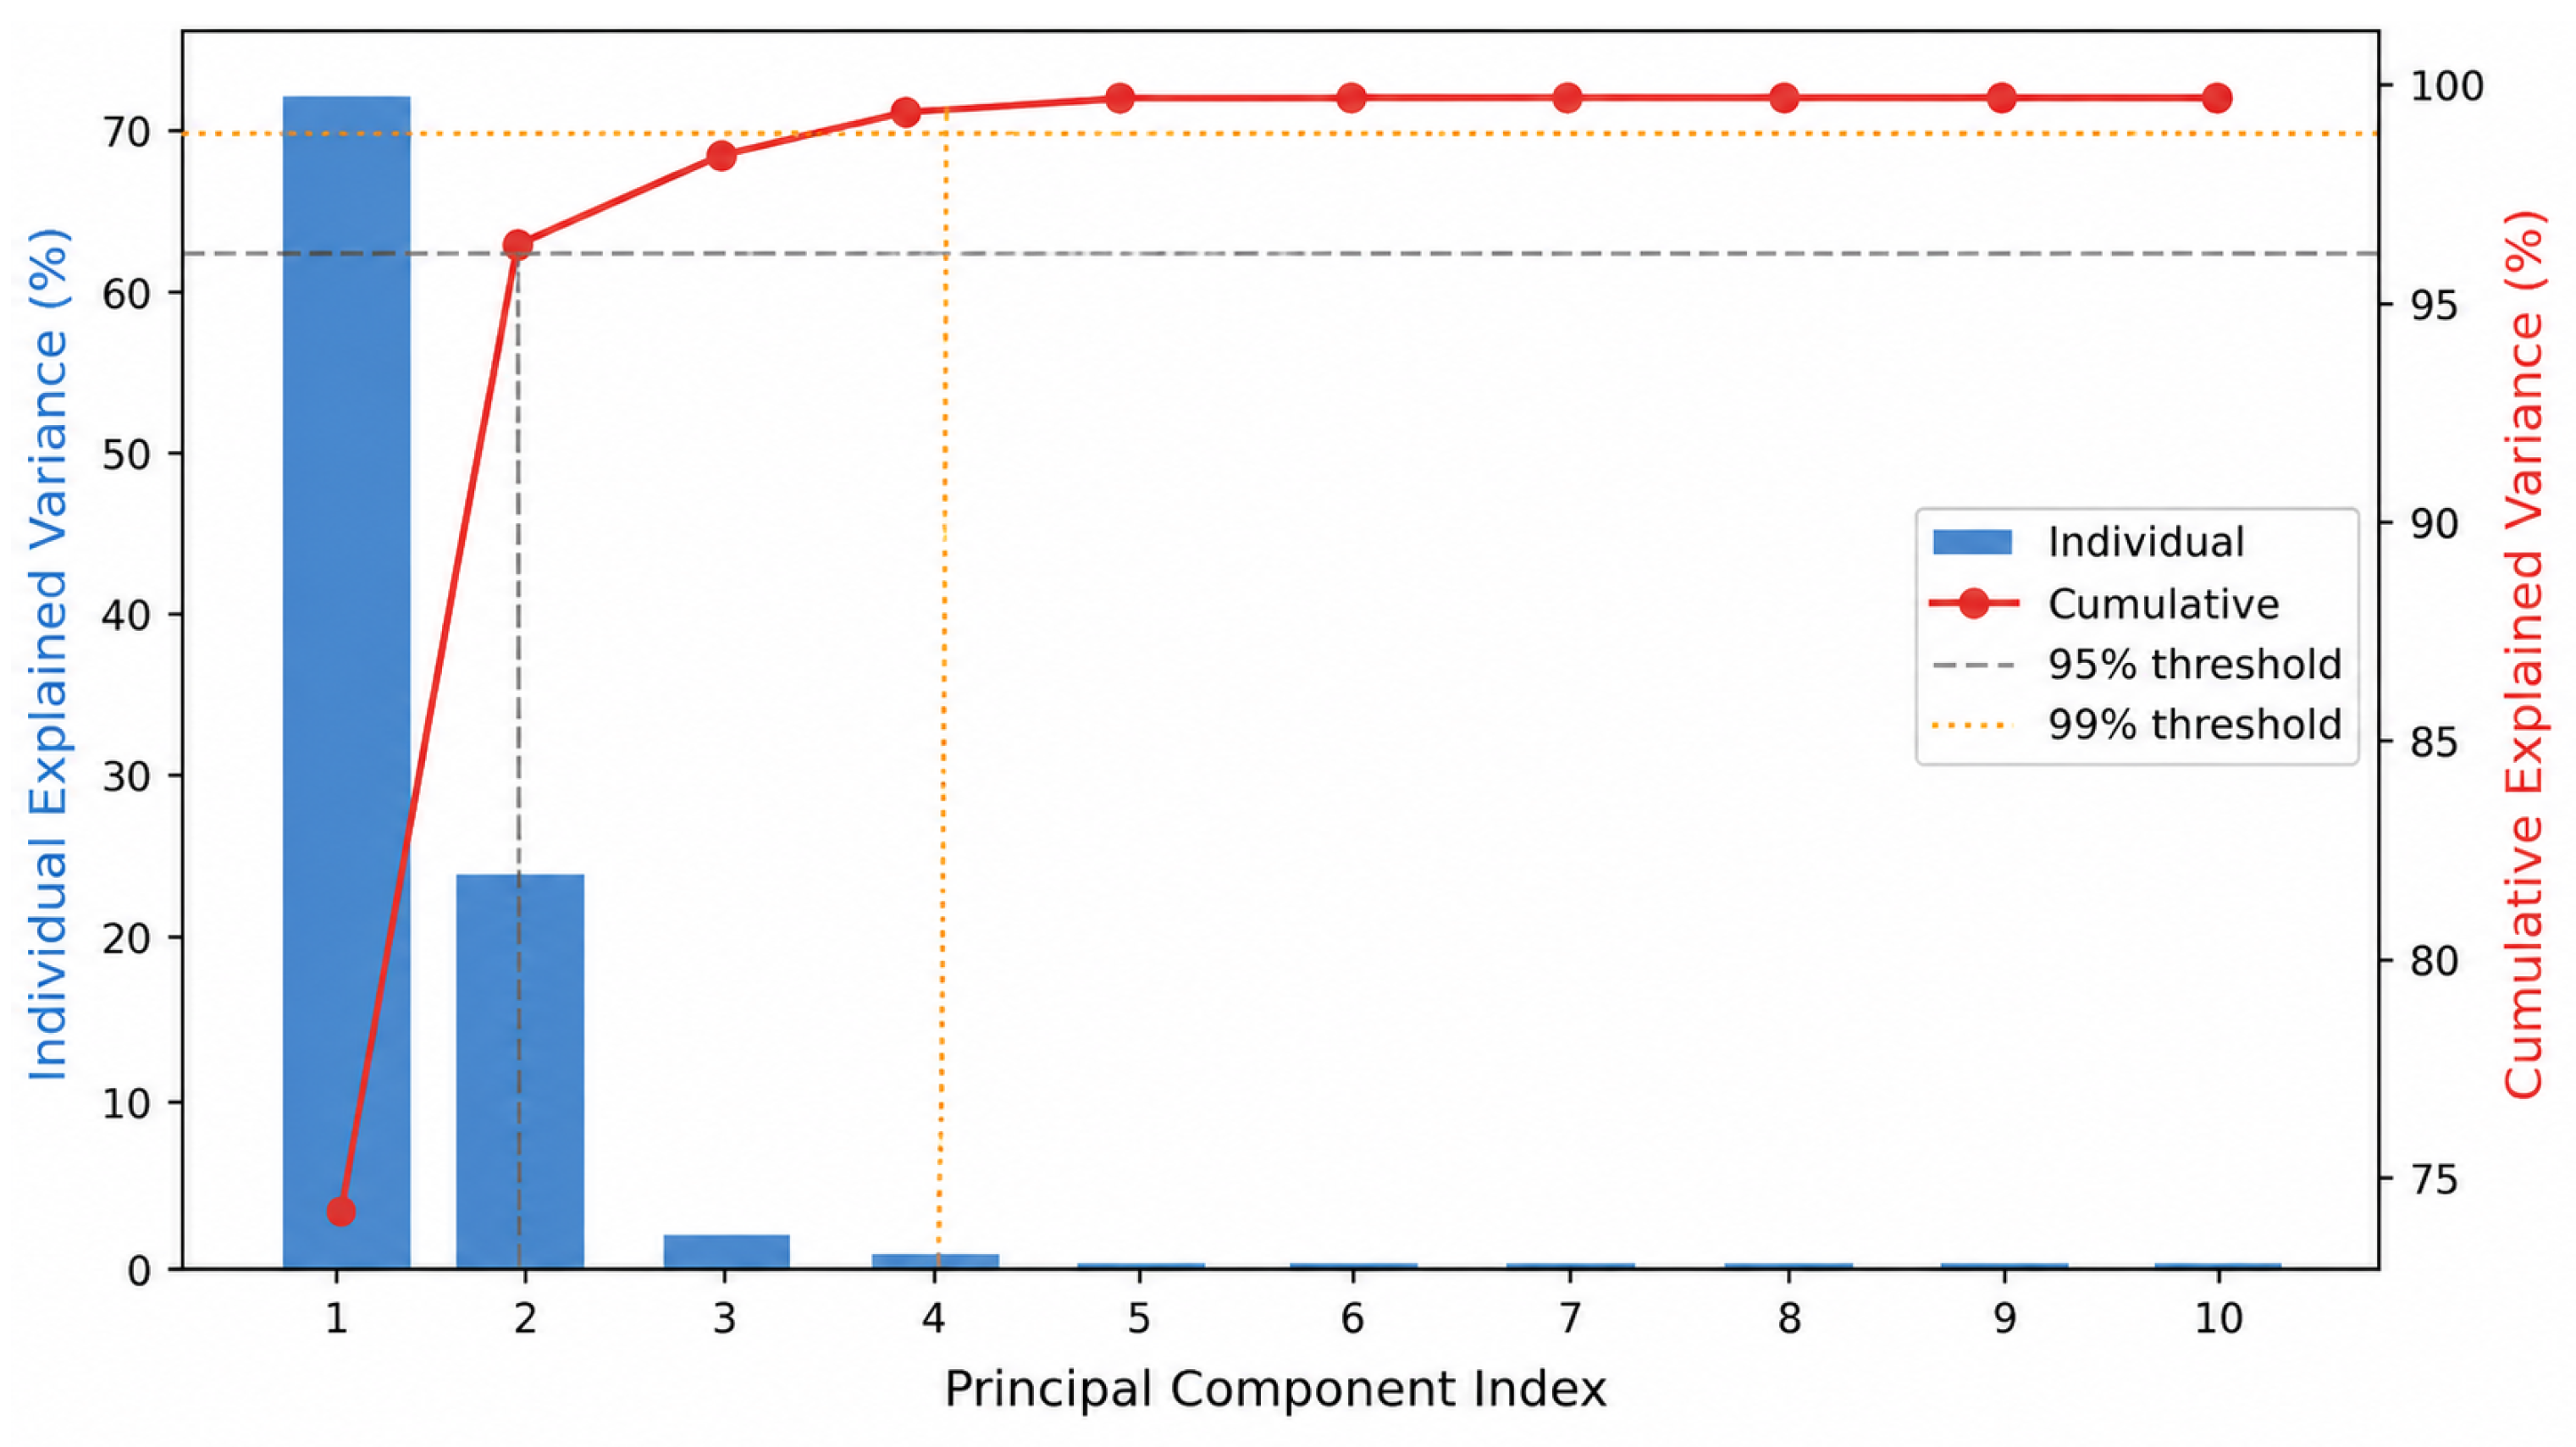
where contains the eigenvectors associated with the first principal components. Figure 8 shows the scree plot of explained variance by principal component. The results indicate that the first two principal components capture the dominant variance structure of the engineered feature space, accounting for more than 90% of the cumulative explained variance at .
Figure 8.
PCA scree plot of explained variance by principal component index.
This suggests that most of the useful information contained in the 10 derived features can be represented in a much lower-dimensional space without substantial loss of information. On this basis, PCA provides an effective compression stage before ANN classification.
3.3. PCA Biplot and Loading Analysis
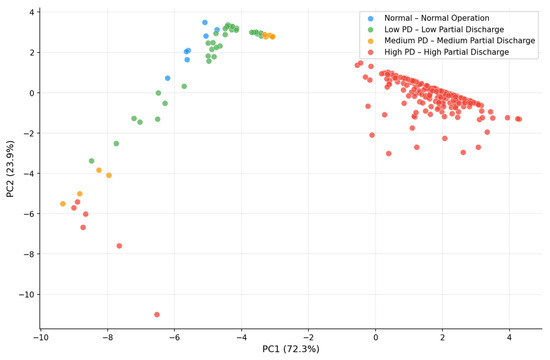
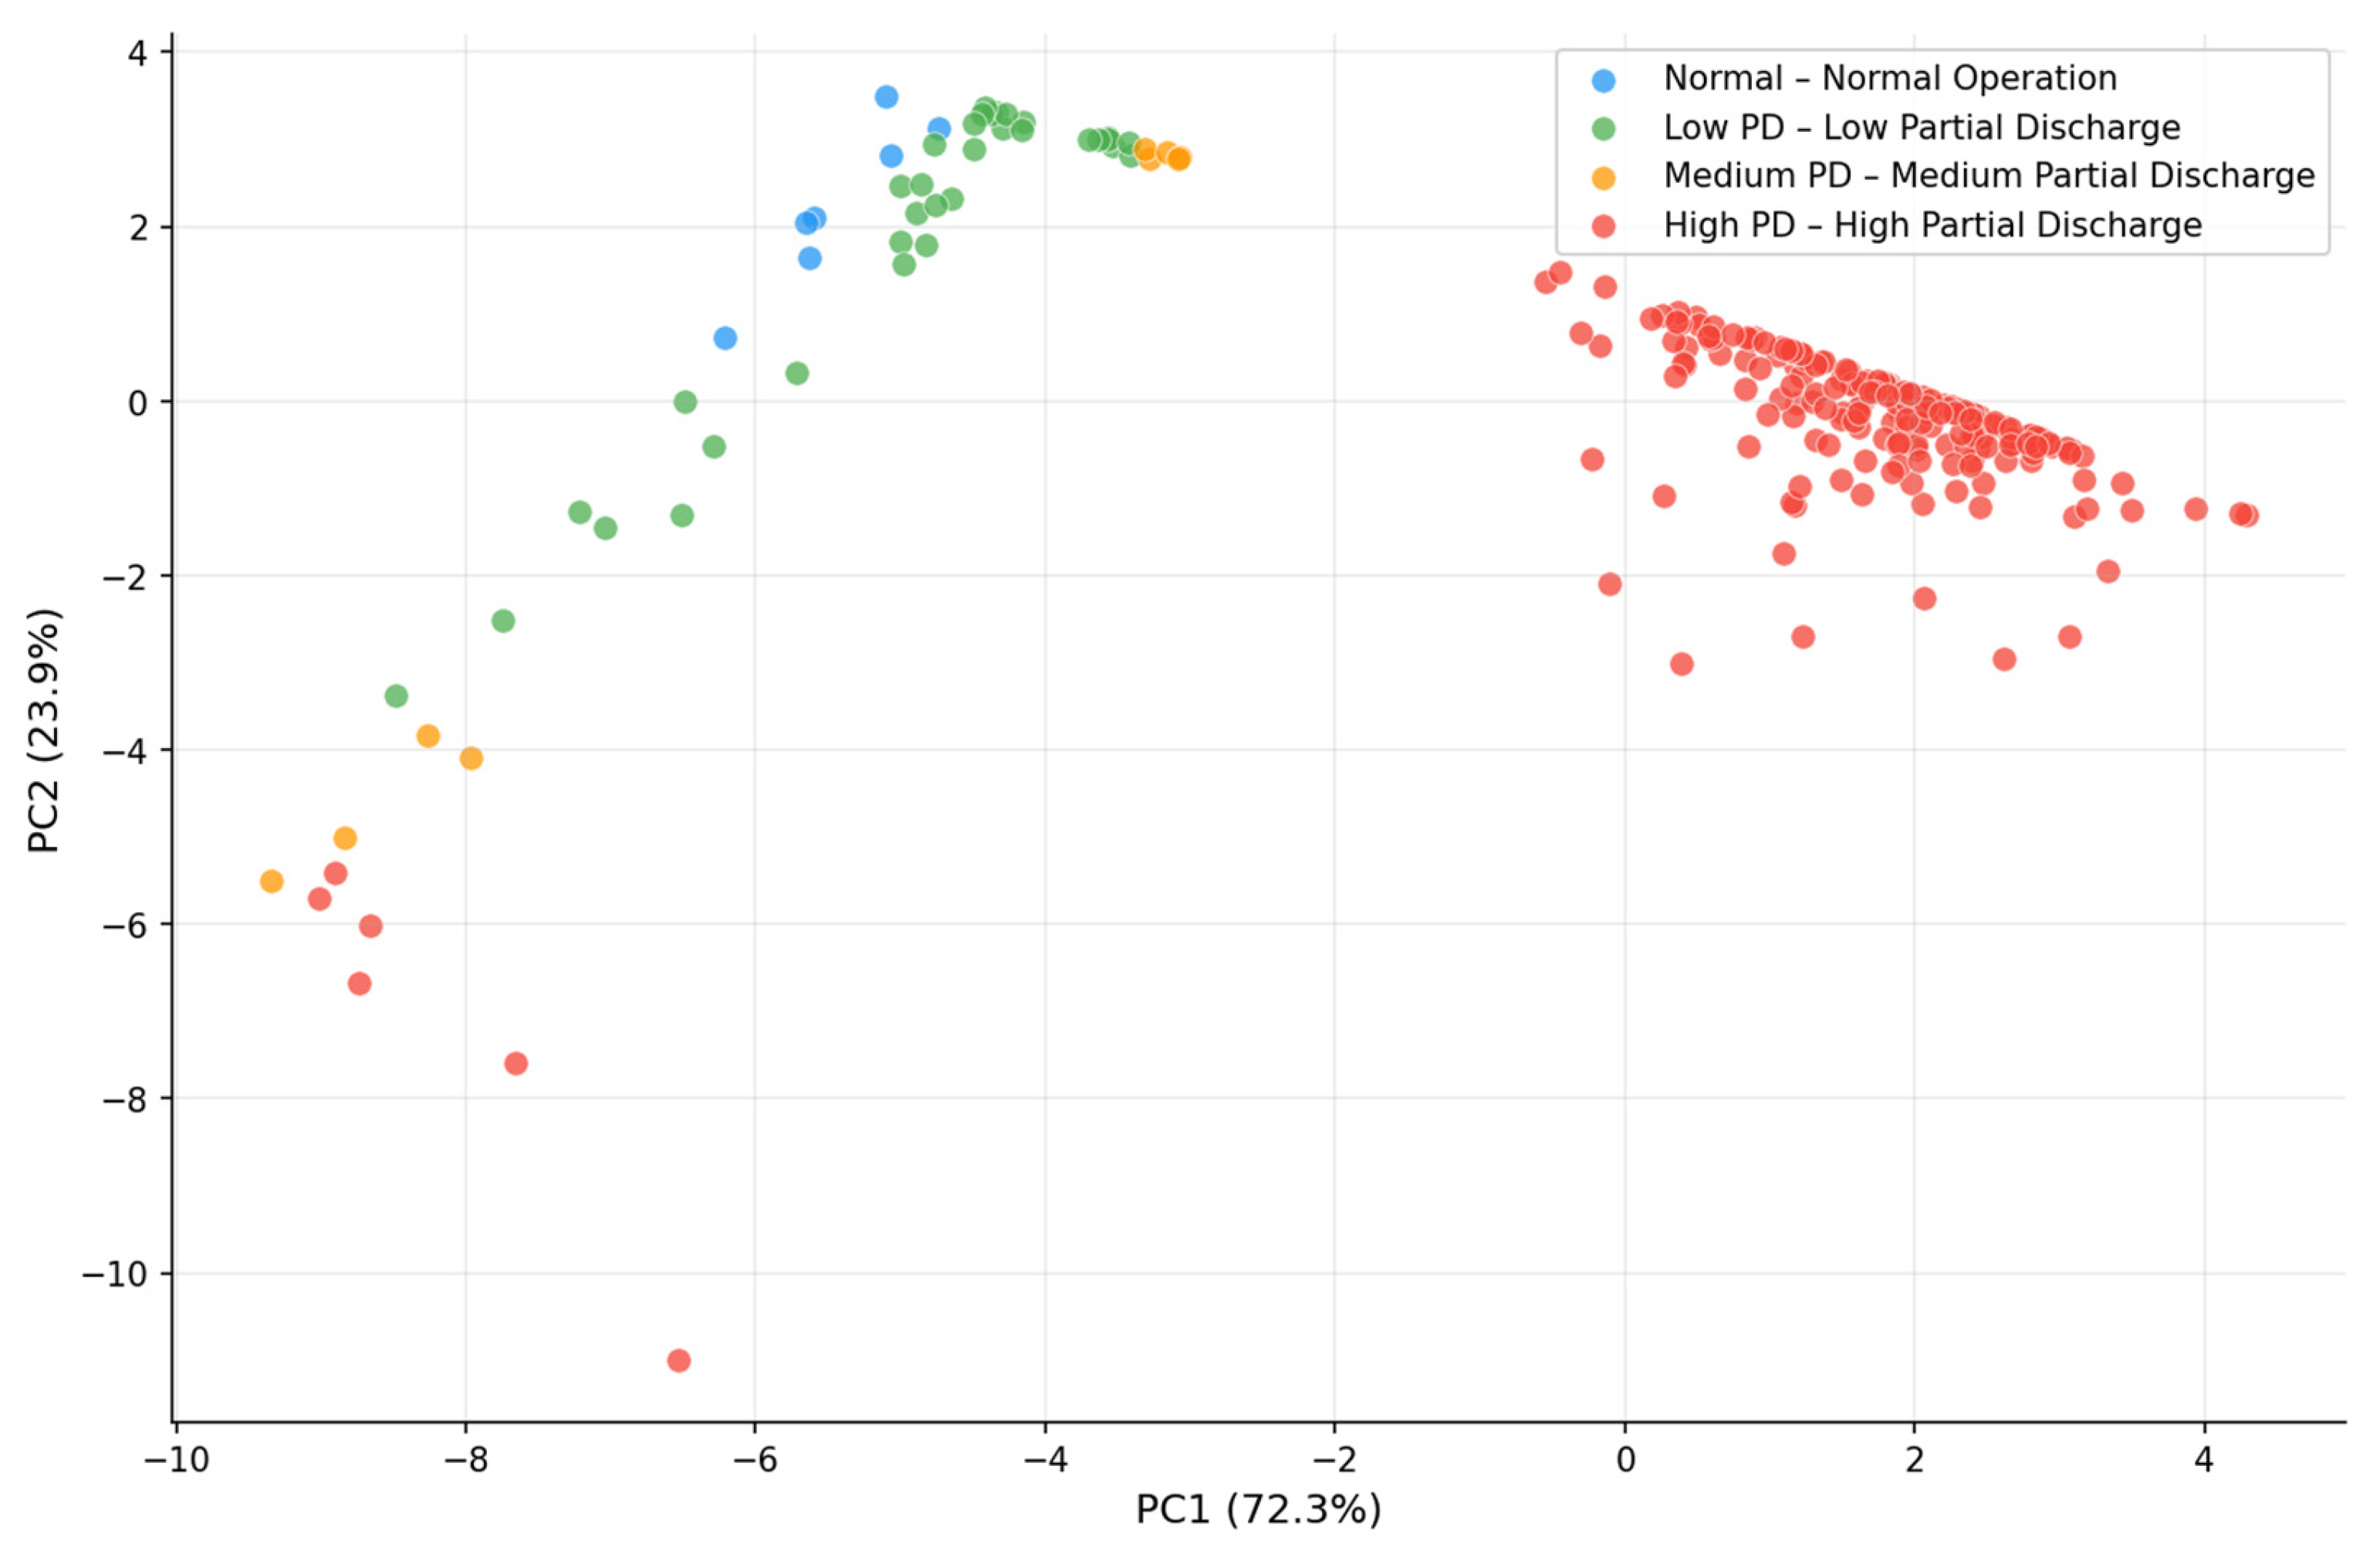
Figure 9 shows the distribution of the training samples in the reduced two-dimensional PCA space defined by PC1 and PC2. The biplot indicates clear separation among the PD severity classes. High PD samples are concentrated in the high-PC1 region, whereas Normal Operation and Low PD Activity are located predominantly in the low-PC1 region. Medium PD Activity occupies an intermediate zone between the lower- and higher-severity classes. This distribution suggests that the first two principal components preserve the dominant discriminatory structure of the engineered feature space.
Figure 9.
PCA Biplot of Training Data Projected onto PC1 vs. PC2.
The observed class arrangement explains why provides near-optimal classification performance. Although some local overlap remains between neighbouring low-severity classes, the reduced feature space retains sufficient information for the ANN to learn an effective nonlinear decision boundary. The loading patterns further indicate that the principal components capture the dominant magnitude- and voltage-related variation embedded in the engineered features, thereby providing a compact and informative representation for PD severity classification.
3.4. ANN Architecture
A multilayer perceptron (MLP) was employed as the PD severity classifier. The network architecture is structured into three layers which process the input data through nonlinear transformations in order to reach a final classification. The input layer is configured on the basis of the results of the PCA preprocessing stage. The optimal architecture employs an input layer with two neurons (k = 2) which corresponds to the retained PCA components. These components represent a compressed version of a 10-dimensional feature space, thus preserving over 90% of the cumulative variance. The input vector from the PCA stage is defined as , representing the two principal components. Subsequent to the input layer is a single hidden layer with 20 neurons. This layer functions as the computational core of the network, and is responsible for learning the complex, nonlinear decision boundaries required to discern between various insulation condition states. The net input to the th neuron in the hidden layer (where ) is calculated as the weighted sum of the input components as well as a dedicated bias scalar, as in Equation (3):
where represents the weights connecting the i-th input component to the j-th hidden neuron, and represents the bias scalar for the corresponding hidden node. Each neuron in this layer applies a hyperbolic tangent (tanh) activation function to the weighted sum of its inputs to produce a localized hidden activation output, as expressed in Equation (4):
The smooth, restricted nature of the activation function guarantees stable gradient propagation throughout the domain during backpropagation operations. The final stage of the architecture is the output layer, which consists of four neurons, each representing one of the defined PD severity classes. The net input arriving at the k-th output neuron (where ) is calculated by mapping the accumulated hidden layer activations through the second weight matrix and bias layer according to Equation (5):
where signifies the weights connecting the j-th hidden neuron activation to the k-th output neuron, and denotes the bias scalar for the particular output node. This layer utilizes the SoftMax activation function, which converts the raw numerical outputs of the network into a probability distribution across the four categories. The estimated probability belonging to a partial discharge severity class k is formulated using the exponential normalization shown in Equation (6):
This probability distribution allows definitive multi-class prediction by assigning each evaluated data sample to the condition category that maximizes this distribution, yielding the final predicted label . This architecture was selected to provide sufficient nonlinear modelling capacity while maintaining a relatively compact structure suited to the low-dimensional PCA input space. The SoftMax output layer enables multi-class prediction by converting the final network outputs into class probabilities, allowing each sample to be assigned to one of the four PD severity categories.
4. Results and Discussion
4.1. Effect of Dimensionality Reduction Ratio
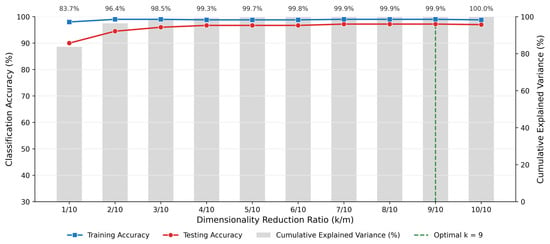
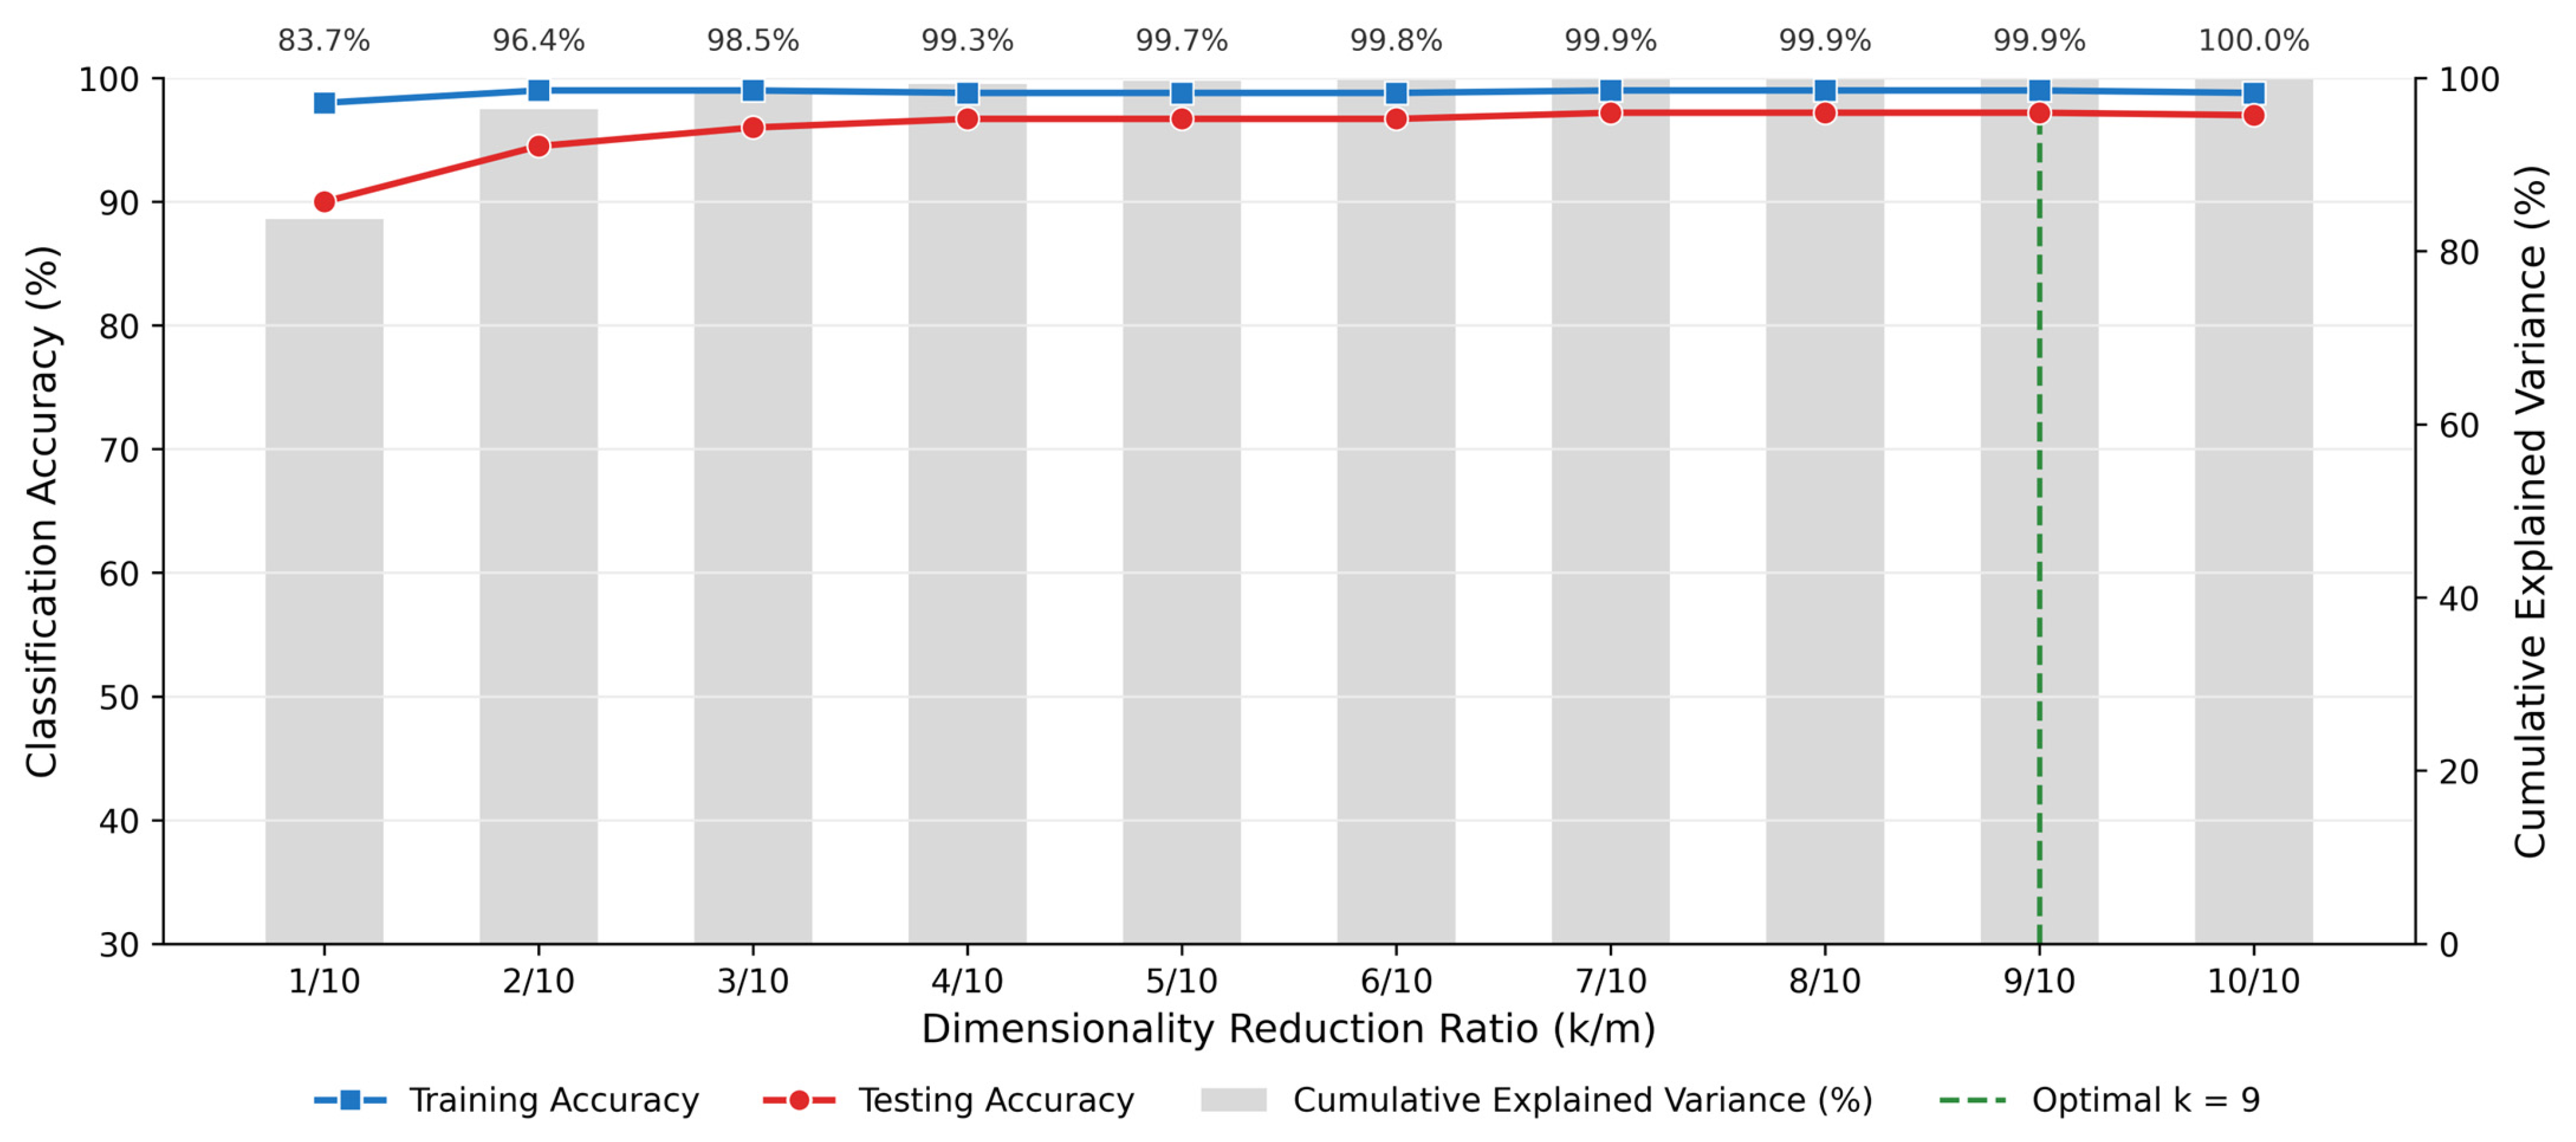
Table 3 presents the training and testing accuracy obtained for all retained principal-component dimensions, with varying from 1 to 10. The best overall test performance was achieved at , corresponding to a dimensionality-reduction ratio of , where the model reached a test accuracy of 98.3%. This indicates that two principal components were sufficient to preserve the dominant discriminatory information required for PD severity classification. Although several higher-dimensional configurations also achieved the same test accuracy, the model is preferred because it provides the most compact representation of the engineered feature space while maintaining optimal predictive performance. By contrast, the configuration produced a lower test accuracy of 93.2%, indicating that a single principal component did not retain enough information for robust class separation. These results show that a small increase from one to two retained components yields a substantial improvement in classification performance, whereas further increases in dimensionality provide little or no additional benefit. The results in Table 3 are illustrated in Figure 10, which plots training and testing accuracy as a function of the dimensionality-reduction ratio. The figure shows that training accuracy reaches 100.0% from onward, while testing accuracy stabilizes at 98.3% for several configurations.
Table 3.
ANN classification accuracy under different dimensionality-reduction ratios.
Figure 10.
ANN classification accuracy as a function of dimensionality reduction.
This pattern suggests that the essential class structure of the dataset is already captured in the first two principal components, and that retaining additional components does not materially improve generalization performance. Accordingly, was selected as the optimal PCA configuration for the subsequent analyses.
4.2. Confusion Matrix and Per-Condition Analysis
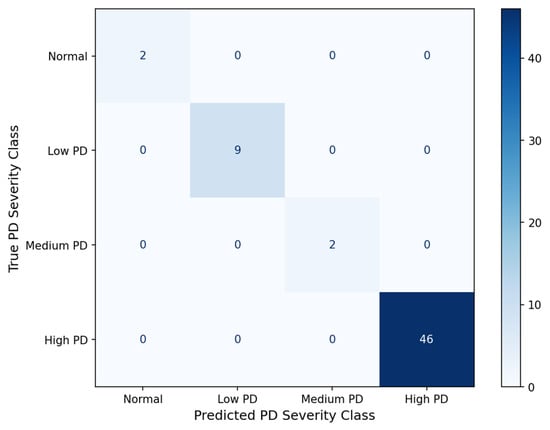
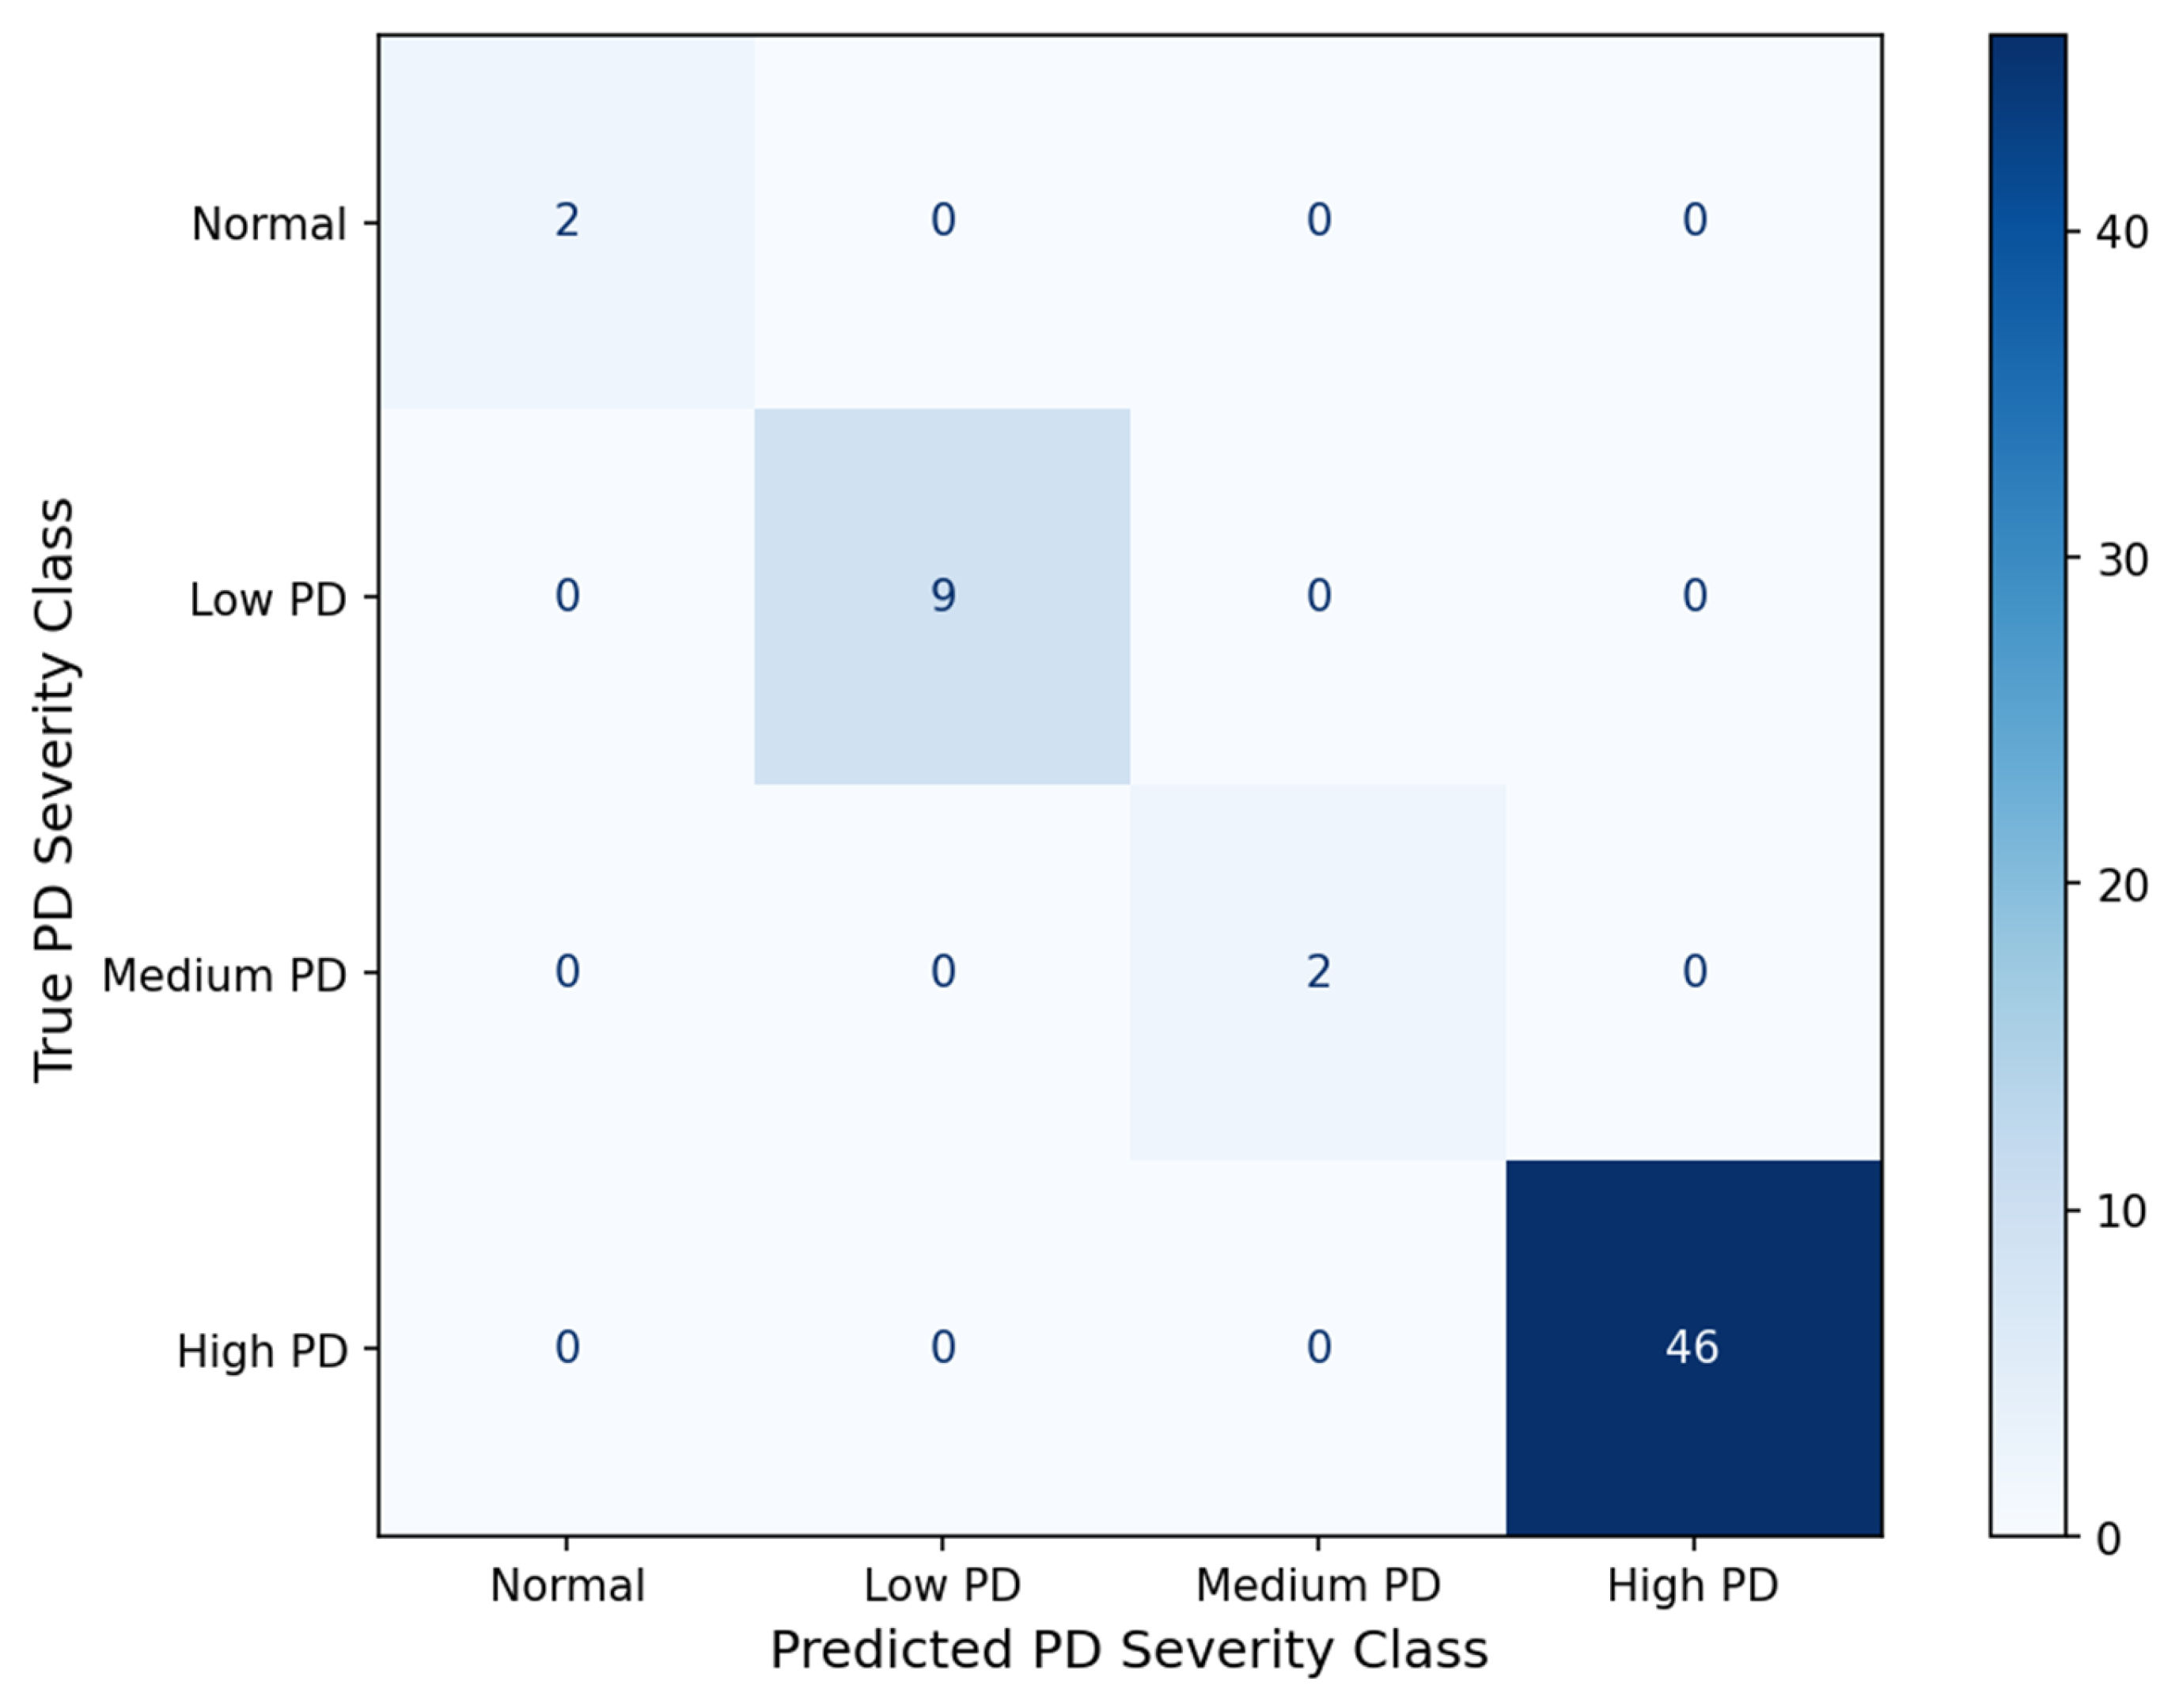
Figure 11 presents the confusion matrix for the optimal PCA-ANN model obtained at . The matrix shows that the classifier achieved perfect recognition of the High PD and Medium PD classes on the test set, with all 46 High PD samples and both Medium PD samples classified correctly. This result is particularly important because these classes represent the more severe insulation conditions and are therefore of greatest operational concern.
Figure 11.
Confusion matrix of the optimal PCA-ANN model at .
For the Low PD class, the model correctly classified 9 of the 9 test samples, corresponding to a recall of 100. In the Normal Operation class, both test samples were correctly identified, yielding a recall of 100.0%. Overall, the confusion matrix indicates that the proposed model is highly effective in distinguishing the critical medium- and high-severity PD states, while the only residual ambiguity occurs at the boundary between Normal Operation and Low PD Activity.
4.3. Measures to Prevent Overfitting and Stability Validation
To guarantee robust model generalization and eliminate the risk of high-variance noise memorization, several distinct anti-overfitting mechanisms were integrated into the design. The primary structural safeguard against overfitting is the deployment of PCA feature compression immediately prior to the introduction of the neural network. By mathematically transforming a redundant, highly correlated 10-dimensional engineered feature space into two orthogonal principal components, the network’s structural input dimension was reduced by 80%. This compression significantly simplified the learning task and prevented the network from overfitting to high-frequency experimental noise. Furthermore, the internal volume of the network was kept intentionally compact with a single hidden layer, restricting the model’s total trainable weight parameters to match the compressed input space. The validation stability of this optimized network configuration was carefully tested using a 5-fold stratified cross-validation protocol. The proposed PCA-ANN model achieved a mean cross-validation accuracy of 98.3%, demonstrating exceptional predictive consistency. Critically, the cross-validation process yielded a remarkably narrow standard deviation of just ±0.9%. This tight standard deviation serves as definitive statistical proof of model stability, demonstrating that the network’s generalization performance is entirely invariant to specific data partitions and is free from overfitting artifacts, representing the lowest performance variance among all evaluated machine learning architectures.
4.4. Handling Dataset Class Imbalance
The partial discharge dataset exhibits a pronounced class imbalance, with the High PD Activity class dominating approximately 78.2% of the total observations, while Normal PD (3.1%) and Medium PD (3.7%) classes are sparsely represented. In standard machine learning frameworks, such severe imbalance typically causes the classifier to optimize for the majority class, leading to a drastic deterioration in minority class predictive accuracy. In this study, this limitation was resolved entirely at the data-representation level through physics-informed feature engineering rather than empirical data resampling. By mapping the raw measurements (|Q|, V) into physics-grounded nonlinear transformations, the underlying multi-class boundaries were significantly expanded. This feature enhancement achieved complete geometric isolation and distinct structural separation of the minority classes within the higher-dimensional space prior to classification. The empirical validation of this feature-driven separability is demonstrated by the model’s exceptional per-class metrics. Despite their minor representation, the minority Medium PD class achieved an absolute 100.0% Precision, 100.0% Recall, and 100.0% F1-score on the independent test set, while the Normal PD class reached 100.0% Recall. The network learned the definitive physical signatures of these transient states without being overwhelmed by the dominant class. Consequently, standard synthetic data generation techniques (such as SMOTE) or undersampling strategies were intentionally avoided. Unconstrained data augmentation risks creating unphysical feature correlations that violate real-world high-voltage transformer physics governed by IEC 60270 standards, as well as introducing data leakage into validation loops. Locking the exact class ratios via stratified splits ensured that all validation metrics reflect authentic structural classification performance.
4.5. Per-Class Performance Metrics
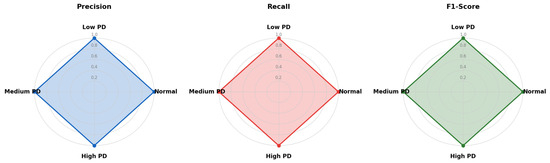
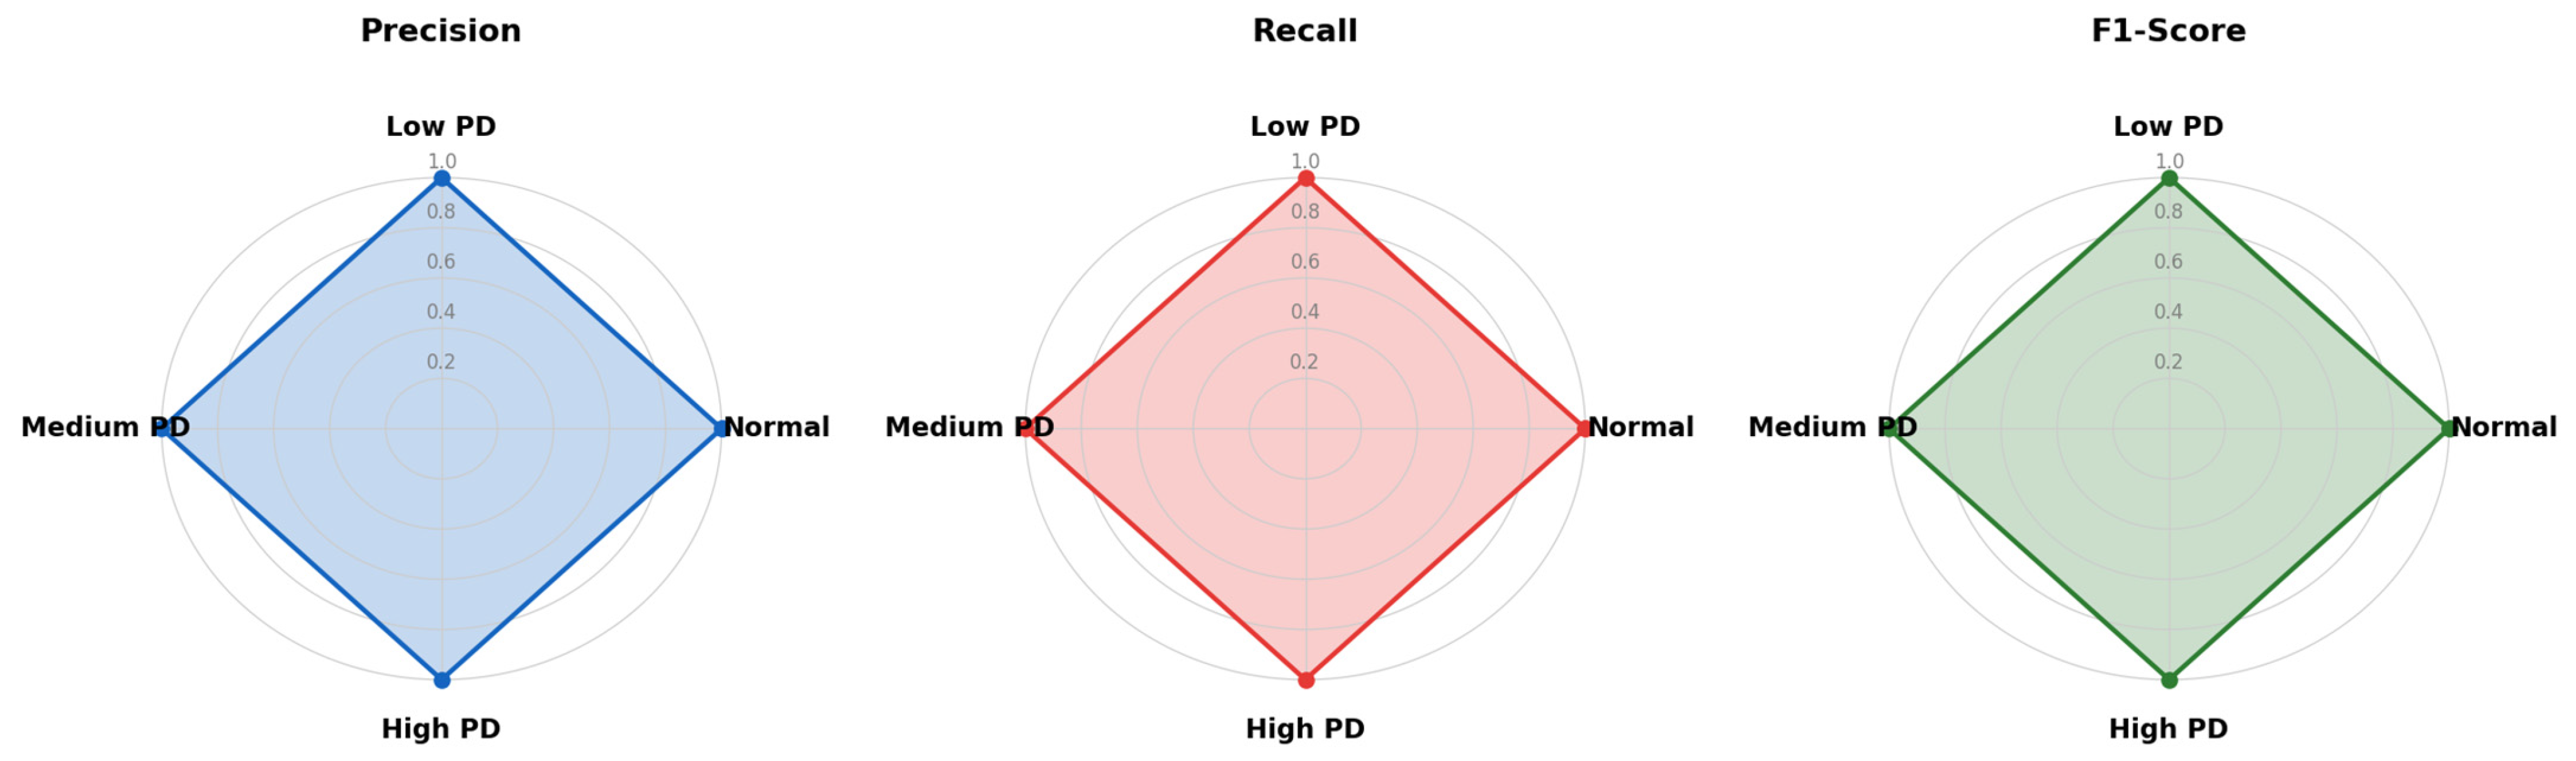
Table 4 and Figure 12 summarize the per-class precision, recall, and F1-score for the optimal PCA-ANN model. The results confirm the strong performance observed in the confusion matrix analysis. Medium PD Activity and High PD Activity both achieved precision, recall, and F1-score values of 100.0%, indicating complete separation of the most critical PD severity classes in the test set.
Table 4.
Per-class classification performance of the optimal PCA-ANN model.
Figure 12.
Per-class performance metrics for the optimal PCA-ANN model.
Low PD Activity achieved a precision of 100.0%, a recall of 88.9%, and an F1-score of 94.1%, reflecting the single Low PD sample that was assigned to the Normal class. Normal Operation achieved a recall of 100.0% but a lower precision of 67.0%, again due to the same misclassification at the Normal-Low PD boundary. The weighted-average precision, recall, and F1-score were 99.3%, 98.3%, and 98.6%, respectively, demonstrating strong overall classification performance.
These results suggest that the proposed PCA-ANN framework is highly reliable for identifying the more severe PD conditions, while the remaining classification difficulty is concentrated in the lower-severity region, where discharge signatures are inherently weaker and more similar to background or early-stage activity. This behaviour is consistent with the raw-data and engineered-feature distributions discussed earlier.
4.6. Comparison with Alternative Feature Configurations
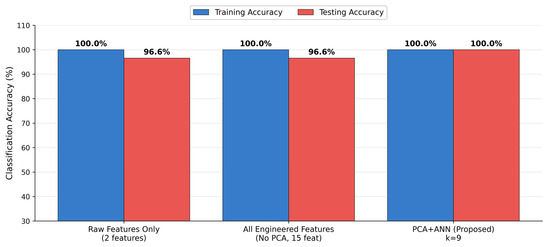
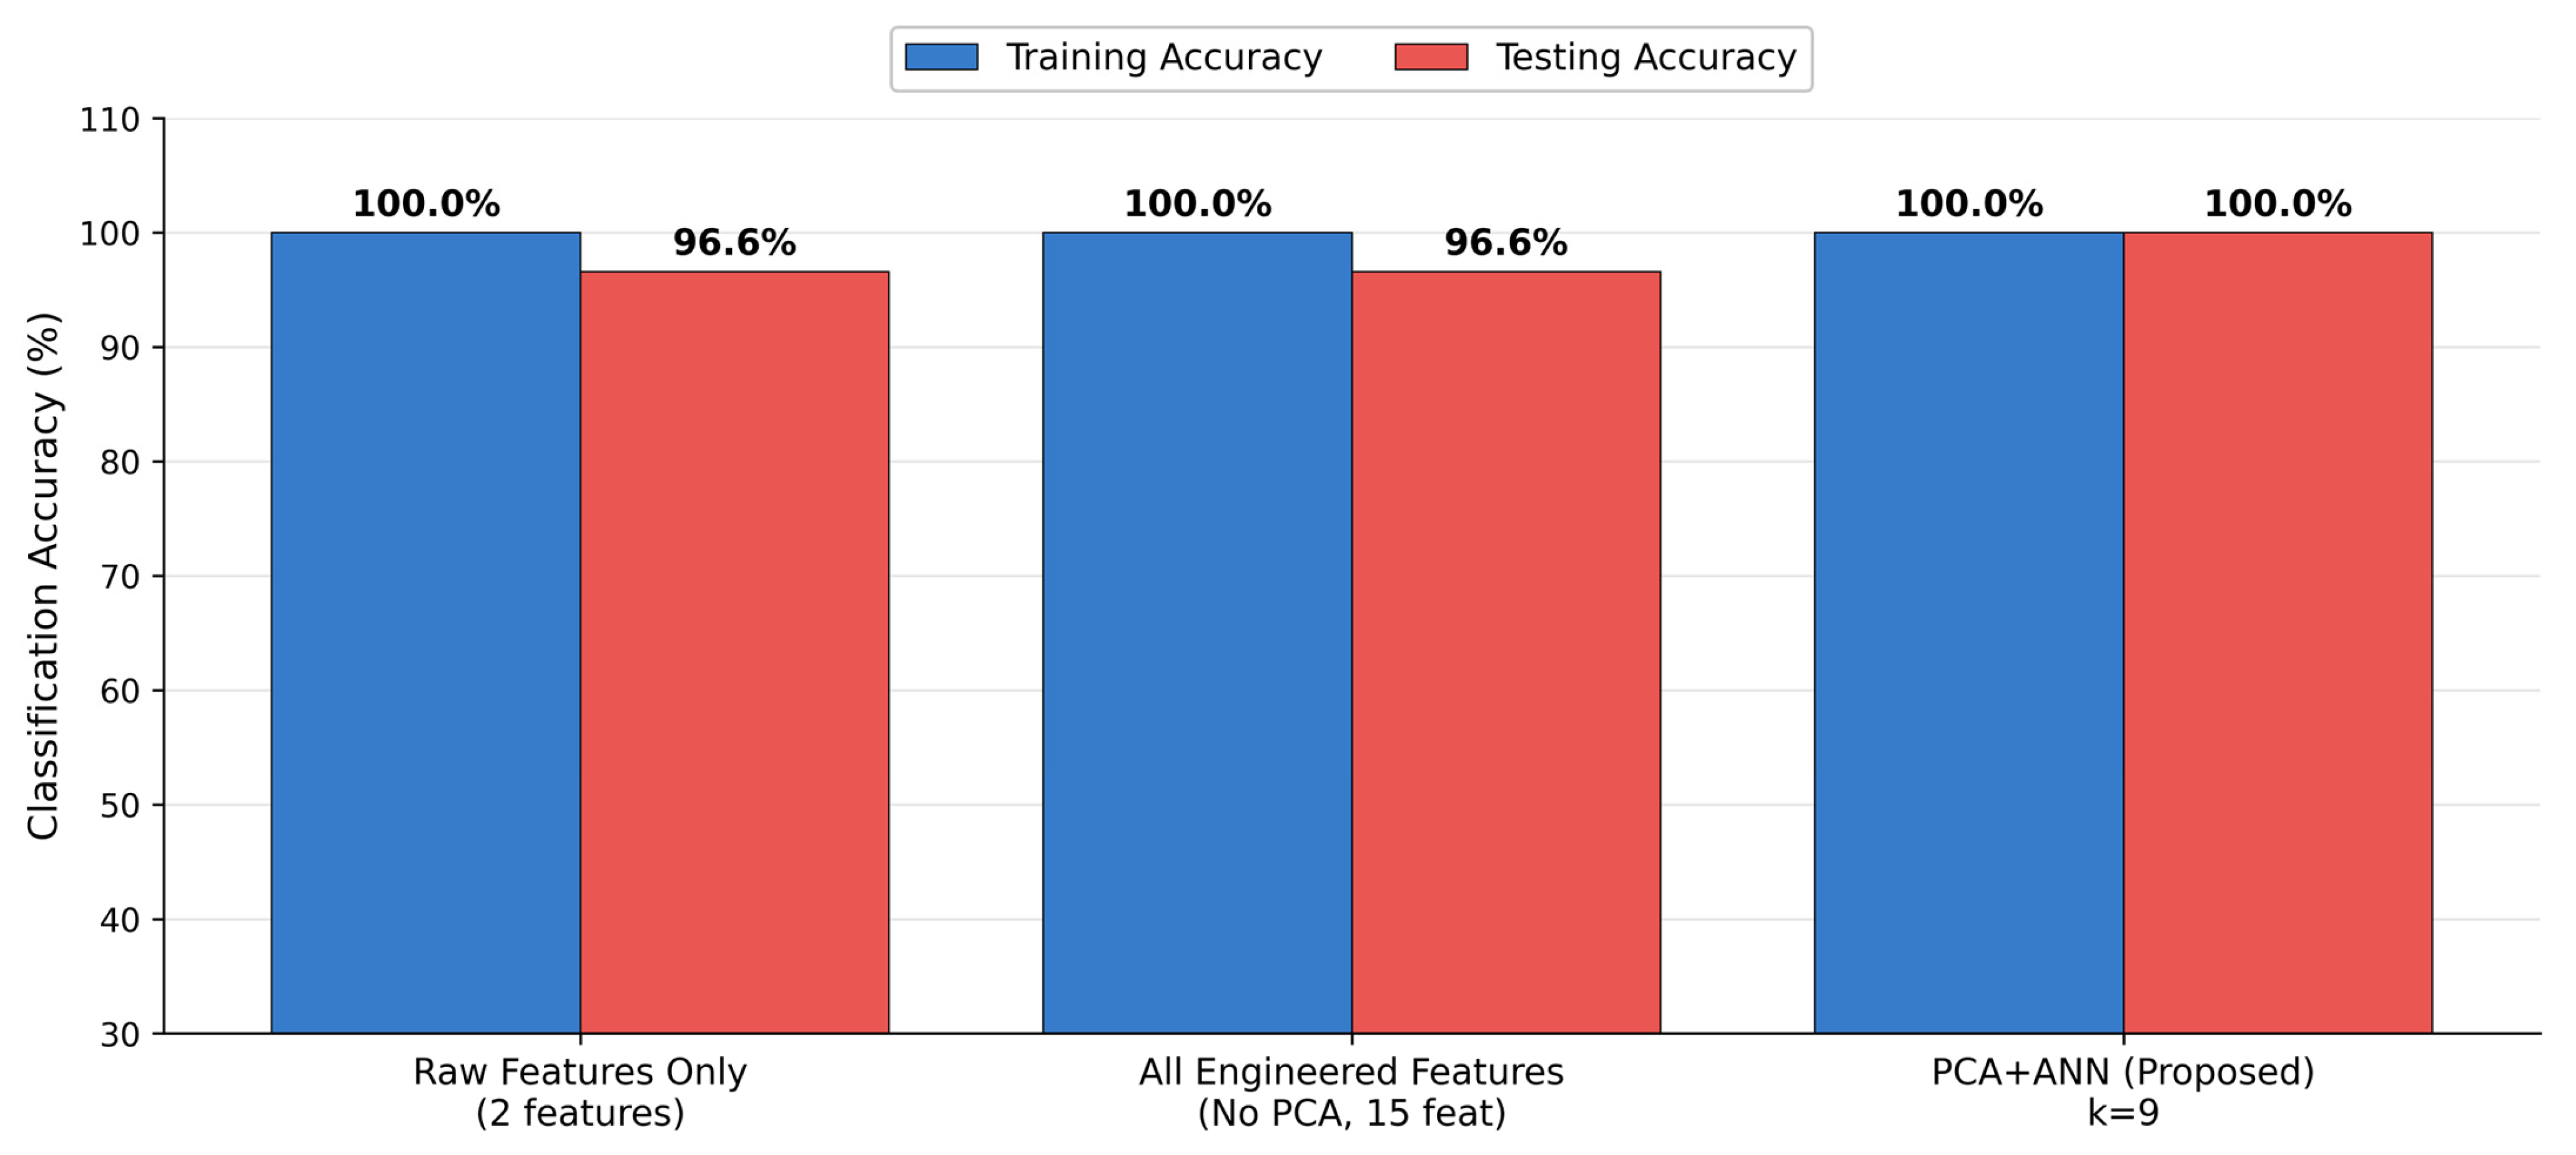
Table 5 compares the performance of the ANN classifier under three input-feature configurations: (i) the raw measurement pair , (ii) the full set of 10 engineered features without PCA, and (iii) the proposed PCA-ANN configuration using the optimal reduced representation with . The purpose of this comparison is to evaluate the effect of feature engineering and dimensionality reduction on classification performance. The results show that the raw-feature ANN produced the lowest performance, with a training accuracy of 96.6% and a test accuracy of 91.5%. When the ANN was trained on the full 10-dimensional engineered feature space, performance improved substantially to 100.0% training accuracy and 98.3% test accuracy. The proposed PCA-ANN model achieved the same test accuracy of 98.3% while using only two input dimensions. This demonstrates that PCA preserved the dominant discriminatory information contained in the engineered feature space while reducing the dimensionality of the classifier input.
Table 5.
Performance comparison of ANN across feature configurations.
Figure 13 illustrates these results graphically. The comparison confirms that feature engineering plays a major role in improving PD severity classification relative to the raw measurements alone.
Figure 13.
ANN Performance Comparison with Dissimilar Feature Sets.
At the same time, the PCA stage provides a more compact representation of the engineered feature set without any loss in predictive performance. Therefore, the proposed PCA-ANN configuration offers the most efficient trade-off between model compactness and classification accuracy among the three alternatives considered.
4.7. Multi-Classifier Benchmarking
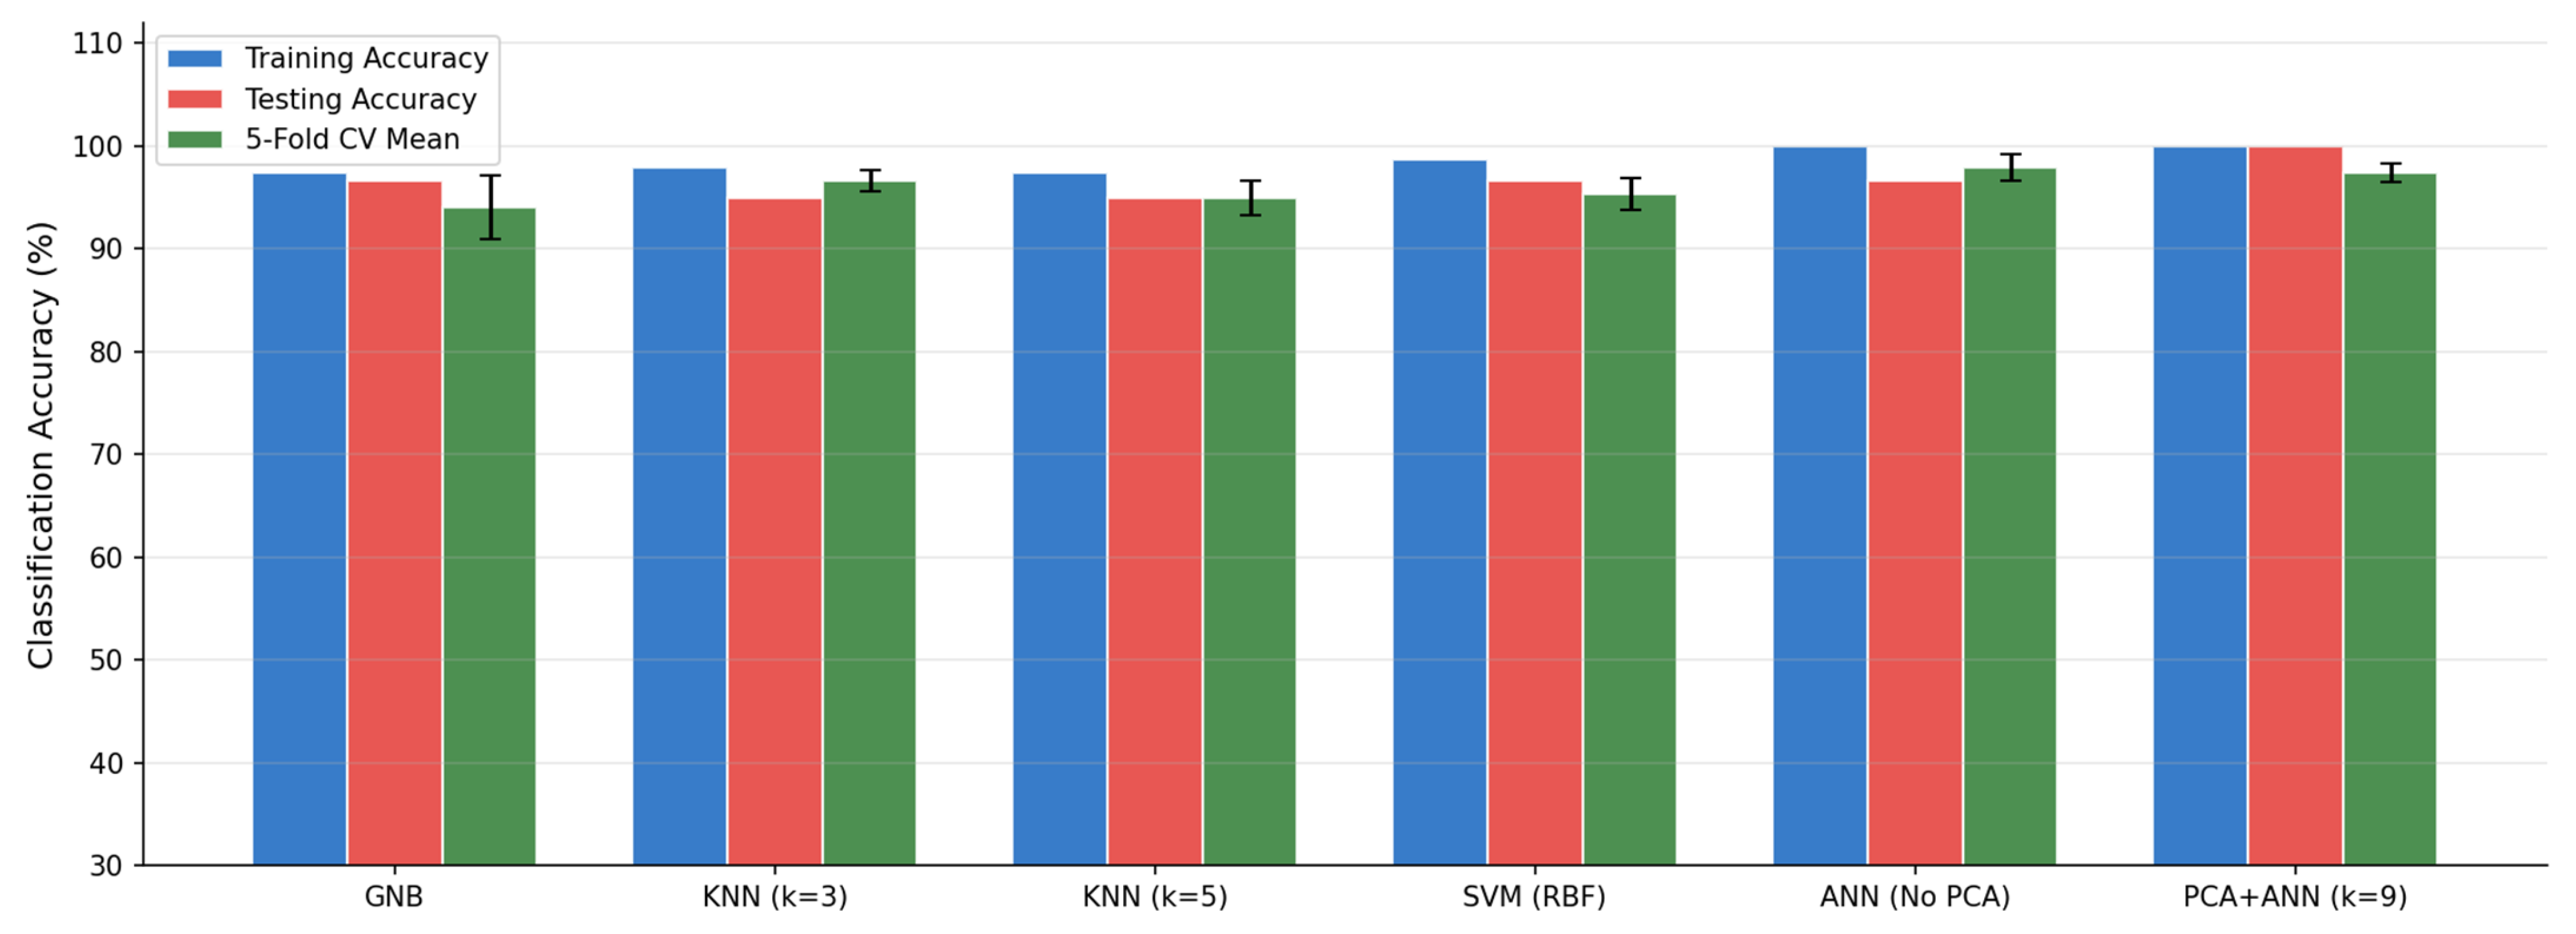
Table 6 compares the proposed PCA-ANN model with five alternative classifiers, namely Gaussian Naïve Bayes (GNB), K-Nearest Neighbours (KNN) with and , Support Vector Machine (SVM) with radial basis function kernel, and an ANN trained without PCA. The benchmark models were evaluated using the full 10-dimensional engineered feature space, whereas the proposed model used only the two retained principal components. In addition to training and test accuracy, 5-fold stratified cross-validation was used to assess robustness and variability in model performance. The proposed PCA-ANN model achieved a training accuracy of 100.0% and a test accuracy of 98.3%, matching the best held-out test performance among all evaluated models. It also produced the highest mean cross-validation accuracy, 98.3%, together with the lowest standard deviation, ±0.9%, indicating the most stable performance across folds. The ANN without PCA achieved the same training and test accuracy, but its mean cross-validation accuracy was slightly lower, at 97.9%, with a larger standard deviation of ±1.3%. Among the non-ANN benchmark methods, GNB achieved the highest mean cross-validation accuracy at 97.0%, followed by KNN at 96.6% and SVM at 96.2%.
Table 6.
Benchmarking of the proposed PCA-ANN model against alternative classifiers.
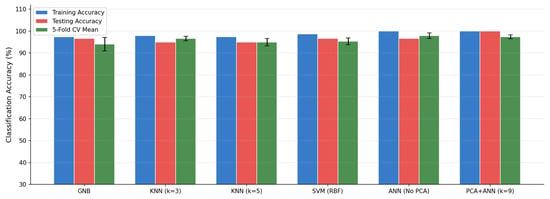
Figure 14 provides a visual comparison of training accuracy, test accuracy, and cross-validation performance for all six classifiers. Overall, the results indicate that the proposed PCA-ANN framework achieves competitive or superior classification performance while using a substantially reduced input representation.
Figure 14.
Performance comparison between classifiers in terms of training accuracy, test accuracy, and 5-fold cross-validation performance.
This is an important outcome, as it shows that the compressed PCA feature space is sufficient not only for accurate classification, but also for consistent generalization across different data partitions.
4.8. Discussion
The results of this study confirm that partial discharge severity classification benefits substantially from combining physics-informed feature engineering with dimensionality reduction prior to neural-network classification. From a diagnostic perspective, this outcome is consistent with the established understanding that PD behaviour is governed by the interaction between discharge magnitude, electric-field stress, and insulation condition, rather than by any single raw measured variable alone [8,9,10,11]. In the present study, the use of derived features based on apparent charge magnitude and applied voltage improved class separability relative to the raw measurement pair, which explains why the ANN trained on engineered features outperformed the ANN trained directly on . This result is in line with prior work showing that physically meaningful representations can improve the diagnostic value of transformer condition-monitoring data by exposing relationships that are not sufficiently visible in the original measurement space [2,3,4,12].
The strong inter-feature correlation observed among the engineered variables also supports the use of PCA as a rational preprocessing stage. Since several of the constructed descriptors were different transformations of the same underlying physical quantities, redundancy in the feature space was expected. PCA is specifically intended to address this problem by projecting correlated variables onto a smaller set of orthogonal components that retain the dominant variance structure of the data [5]. The finding that the first two principal components captured more than 90% of the cumulative variance, while still supporting 98.3% test accuracy, therefore agrees with the theoretical role of PCA as an information-preserving compression method. In practical terms, the result suggests that the dominant discriminatory structure of the PD dataset is largely governed by two underlying factors associated with discharge magnitude and applied-voltage behaviour, which were successfully preserved in the reduced feature space.
The near-equivalence in performance between the 10-feature ANN and the proposed PCA-ANN model is particularly important. Rather than merely improving accuracy, PCA reduced the dimensionality of the classifier input from 10 variables to 2 retained components without loss of predictive performance. This indicates that the benefit of the engineered feature space lies not only in its richness, but also in the latent structure that it reveals after compression. Similar findings have been reported in transformer fault diagnosis studies where PCA was used to simplify multidimensional diagnostic data while maintaining or improving ANN performance [2,3,4]. In that sense, the present results extend the value of PCA-ANN integration from dissolved-gas-analysis-oriented diagnosis to IEC 60270-aligned PD severity classification.
The class-wise results are also technically meaningful. The model achieved perfect precision and recall for the Medium PD and High PD classes on the test set, indicating that the proposed feature representation was particularly effective in separating the most operationally significant insulation states. This is consistent with the broader PD literature, which shows that more severe discharge conditions generally produce stronger and more distinguishable electrical signatures due to higher apparent charge levels, more pronounced field effects, and greater insulation disturbance [8,9,11]. By contrast, the only residual ambiguity in the present study occurred at the boundary between Normal Operation and Low PD Activity. This behaviour is expected because low-level PD signatures are often weak, overlap with background activity, and are more difficult to distinguish reliably using magnitude-based measurements alone [11,12]. The single Low PD sample misclassified as Normal Operation is therefore not anomalous, but rather reflects a recognized challenge in practical PD diagnosis.
The benchmark comparison against GNB, KNN, SVM, and ANN without PCA further reinforces the validity of the proposed framework. The PCA-ANN model matched the best held-out test accuracy and achieved the highest mean 5-fold cross-validation accuracy with the lowest standard deviation. This combination of high accuracy and low fold-to-fold variability suggests that the reduced PCA space was not only discriminative, but also more stable under repeated partitioning of the data. That observation is consistent with the machine-learning literature on overfitting, where redundant or highly correlated inputs may inflate model complexity without improving generalization [15]. By compressing the feature space into orthogonal components, PCA likely reduced this sensitivity and enabled the ANN to learn a more robust decision function. The lower cross-validation variance of the PCA-ANN model relative to the ANN without PCA supports exactly this interpretation.
From a practical transformer-monitoring perspective, these findings are significant because they suggest that accurate PD severity classification does not require a large raw-input space, but rather an informative and physically grounded one. IEC 60270 remains the standard framework for PD electrical measurement [11], and the present study shows that even within such a conventional measurement setting, enhanced diagnostic performance can be obtained when the raw measurements are transformed into physically meaningful descriptors and then rationalized through PCA. This aligns with the broader direction of transformer condition assessment research, which increasingly combines established measurement standards with intelligent diagnostic algorithms to improve fault recognition and maintenance decision support [2,3,4,8,12].
At the same time, the discussion must acknowledge the limitations that frame these results. The dataset was strongly imbalanced, with High PD samples dominating the observations, while the Normal and Medium PD classes had very limited support. Although stratified splitting and cross-validation help to mitigate this issue, the small number of minority-class samples means that caution is required when interpreting the apparent perfection of some per-class metrics. This is particularly relevant for Medium PD, where the test support was only two samples. In addition, the current feature set was derived primarily from discharge magnitude and applied voltage and did not incorporate richer descriptors such as phase-resolved PD patterns, pulse repetition characteristics, or waveform-shape parameters, all of which are known to provide additional discriminatory information in PD diagnostics [8,9,10,11]. Accordingly, the present framework should be understood as a strong proof of concept rather than a final universal model.
5. Conclusions
This study developed a partial discharge severity classification framework for high-voltage transformers by combining physics-informed feature engineering, principal component analysis, and an artificial neural network. Starting from the measured partial discharge magnitude and applied voltage, the feature space was expanded to include derived descriptors associated with discharge energy, electrical stress, scaling, and relative intensity. PCA was then used to reduce redundancy in the engineered feature space and retain the most informative variation before classification. The results showed that the proposed PCA-ANN framework achieved 98.3% test accuracy using only two retained principal components, while maintaining the same performance as the ANN trained on all 10 engineered features and improving substantially on classification based only on the raw measurements. The model also achieved perfect precision and recall for the medium- and high-severity classes on the test set, indicating strong capability in identifying the more critical insulation conditions. Beyond accuracy alone, the findings show that the combination of domain-based feature design and dimensionality reduction can produce a compact and effective representation of PD behaviour. This is important because transformer condition-monitoring systems require classification methods that are not only accurate, but also computationally efficient and interpretable in relation to the physical meaning of the measured quantities. In this regard, the proposed approach demonstrates that a reduced feature representation can preserve diagnostic information while simplifying the learning task of the classifier. However, the results should be interpreted in light of the limitations of the study. The dataset comprised 294 samples and was strongly imbalanced, with the high-PD class dominating the observations, while the normal and medium classes had very limited representation. This means that although the classification results are promising, the reported performance may not fully capture the variability encountered in broader field conditions. In particular, the small support for some classes limits the strength of conclusions regarding generalization. In addition, the present study relied mainly on magnitude- and voltage-derived descriptors and did not incorporate richer phase-resolved discharge pattern information, which may further improve discrimination between neighbouring classes such as normal and low PD.
From a practical perspective, the study recommends that transformer PD severity assessment should not rely solely on raw apparent charge and voltage measurements when machine-learning models are used. Instead, feature engineering grounded in discharge physics should be incorporated to improve class separability before model training. The study further recommends the use of dimensionality-reduction techniques such as PCA when strong inter-feature correlation is present, since this can reduce computational burden without degrading diagnostic performance. For utilities and maintenance practitioners, the proposed framework may therefore serve as a useful basis for decision-support tools aimed at prioritizing transformers with elevated PD severity for further inspection or intervention.
Future work should focus on validating the proposed framework on larger and more diverse datasets obtained from multiple transformers, insulation conditions, and operating environments. Class imbalance should be addressed using resampling or data augmentation strategies, including methods such as SMOTE, to improve learning stability for underrepresented classes. Further studies should also integrate phase-resolved partial discharge features and compare deep-learning and hybrid diagnostic models against the present PCA-ANN approach. Finally, external validation under realistic online monitoring conditions will be necessary to assess the robustness, transferability, and deployment readiness of the method in practical transformer health-monitoring applications.
Author Contributions
Conceptualization, L.T. and B.A.T.; methodology, L.T. and B.A.T.; software, L.T. and B.A.T.; validation, B.A.T.; formal analysis, L.T. and B.A.T.; investigation, L.T. and B.A.T.; data curation, L.T.; writing—original draft preparation, L.T.; writing—review and editing, L.T. and B.A.T.; visualization, L.T.; supervision, B.A.T. All authors have read and agreed to the published version of the manuscript.
Funding
This research received no external funding.
Data Availability Statement
The raw data used for model development and classifier training are not publicly available due to confidentiality restrictions imposed by the equipment owner. The code and simulation results supporting the findings of this study are available from the corresponding author upon reasonable request.
Conflicts of Interest
The authors declare no conflict of interest.
Abbreviations
The following abbreviations are used in this manuscript:
| AE | Acoustic Emission |
| ANN | Artificial Neural Network |
| CV | Cross-Validation |
| EDM | Electrical Discharge Machining |
| GNB | Gaussian Naïve Bayes |
| HPD | High PD Activity |
| HV | High Voltage |
| IEC | International Electrotechnical Commission |
| KNN | K-Nearest Neighbours |
| LPD | Low PD Activity |
| MLP | Multilayer Perceptron |
| MPD | Medium PD Activity |
| NOR | Normal Operation |
| PCA | Principal Component Analysis |
| PD | Partial Discharge |
| PRPD | Phase-Resolved Partial Discharge |
| RBF | Radial Basis Function |
| RF | Radio Frequency |
| SVM | Support Vector Machine |
| UHF | Ultra-High Frequency |
References
- Saleh, A.M.; István, V.; Khan, M.A.; Waseem, M.; Ahmed, A.N.A. Power system stability in the Era of energy. Transition: Importance, Opportunities, Challenges, and future directions. Energy Convers. Manag. X 2024, 24, 100820. [Google Scholar] [CrossRef] [Scilit]
- Ahmed, R.; Liu, J.; Zhang, M.; Fan, X. Reliability and condition assessment techniques for oil-immersed power equipment under varying temperatures: A review. Energy Rep. 2025, 14, 1896–1916. [Google Scholar] [CrossRef] [Scilit]
- Gutten, M.; Korenciak, D.; Konarik, R.; Kanuch, J. Comparative Analysis of Distribution Transformers with Varying Ratings and Insulation States via Frequency Domain Spectroscopy and Capacitance Ratio. Appl. Sci. 2025, 15, 4715. [Google Scholar] [CrossRef] [Scilit]
- Shirasaka, Y.; Murase, H.; Okabe, S.; Okubo, H. Cross-sectional comparison of insulation degradation mechanisms and lifetime evaluation of power transmission equipment. IEEE Trans. Dielectr. Electr. Insul. 2009, 16, 560–573. [Google Scholar] [CrossRef] [Scilit]
- Gumilang, H.; Risal, F. Degradation mechanism of power transformer’s insulation system in PLN Indonesia. In Proceedings of the 2017 International Conference on High Voltage Engineering and Power Systems (ICHVEPS), Denpasar, Indonesia, 2–5 October 2017; pp. 317–320. [Google Scholar] [CrossRef] [Scilit]
- Peng, L.; Fu, Q.; Lin, M.; Qian, Y.; Lv, W. Aging Degradation of Insulation Paper in Power Transformers by XRD Method. In Proceedings of the 2018 IEEE International Conference on High Voltage Engineering and Application (ICHVE), Athens, Greece, 10–13 September 2018; pp. 1–3. [Google Scholar] [CrossRef] [Scilit]
- Yan, W.; Yang, L.; Cui, H.; Ge, Z.; Li, S.; Li, S. Comparison of Degradation Mechanisms and Aging Behaviors of Palm Oil and Mineral Oil during Thermal Aging. In Proceedings of the 2018 Condition Monitoring and Diagnosis (CMD), Perth, WA, Australia, 23–26 September 2018; pp. 1–6. [Google Scholar] [CrossRef] [Scilit]
- Hussain, R.; Refaat, S.S.; Abu-Rub, H. Overview and Partial Discharge Analysis of Power Transformers: A Literature Review. IEEE Access 2021, 9, 64587–64605. [Google Scholar] [CrossRef] [Scilit]
- Govindarajan, S.; Morales, A.; Ardilla-Rey, J.A.; Purushothaman, N. A review on partial discharge diagnosis in cables: Theory, techniques and trends. Measurement 2023, 216, 112882. [Google Scholar] [CrossRef] [Scilit]
- Harbaji, M.; Shaban, K.; El-Hag, A. Classification of common partial discharge types in oil-paper insulation system using acoustic signals. IEEE Trans. Dielectr. Electr. Insul. 2015, 22, 1674–1683. [Google Scholar] [CrossRef] [Scilit]
- Refaat, S.S.; Sayed, M.; Shams, M.A.; Mohamed, A. A Review of Partial Discharge Detection Techniques in Power Transformers. In Proceedings of the 2018 Twentieth International Middle East Power Systems Conference (MEPCON), Cairo, Egypt, 18–20 December 2018; pp. 1020–1025. [Google Scholar] [CrossRef] [Scilit]
- Hung, C.-C.; Wang, M.-H.; Lu, S.-D.; Kuo, C.-C. Diagnosis of Partial Discharge in High-Voltage Potential Transformers Using 2D Scatter Plots with Residual Neural Networks. Processes 2026, 14, 403. [Google Scholar] [CrossRef] [Scilit]
- Escurra, C.M.; Mor, A.R.; Vaessen, P. IEC 60270 Calibration Uncertainty in Gas-Insulated Substations. In Proceedings of the 2023 IEEE Electrical Insulation Conference (EIC), Quebec City, QC, Canada, 18–21 June 2023; pp. 1–4. [Google Scholar] [CrossRef] [Scilit]
- Faizol, Z.; Zubir, F.; Saman, N.M.; Ahmad, M.H.; Rahim, M.K.A.; Ayop, O.; Jusoh, M.; Majid, H.A.; Yusoff, Z. Detection Method of Partial Discharge on Transformer and Gas-Insulated Switchgear: A Review. Appl. Sci. 2023, 13, 9605. [Google Scholar] [CrossRef] [Scilit]
- Chan, J.Q.; Raymond, W.J.K.; Illias, H.A.; Othman, M. Partial Discharge Localization Techniques: A Review of Recent Progress. Energies 2023, 16, 2863. [Google Scholar] [CrossRef] [Scilit]
- Yao, Z.; Wu, M.; Qian, J.; Reynaerts, D. Intelligent Discharge State Detection in Micro-EDM Process with Cost-Effective Radio Frequency Radiation: Integrating Machine Learning and Interpretable AI. Expert Syst. Appl. 2025, 291, 128607. [Google Scholar] [CrossRef] [Scilit]
- Yao, Z.; Wu, M.; Qian, J.; Reynaerts, D. Non-Invasive Radio Frequency-Driven In-Process Monitoring and Control for Enhancing Micro-Electrical Discharge Machining Stability and Efficiency. Mech. Syst. Signal Process. 2026, 249, 114072. [Google Scholar] [CrossRef] [Scilit]
- Ghanakota, K.C.; Yadam, Y.R.; Ramanujan, S.; Vishnu Prasad, V.J.; Arunachalam, K. Study of Ultra High Frequency Measurement Techniques for Online Monitoring of Partial Discharge in High Voltage Systems. IEEE Sens. J. 2022, 22, 11698–11709. [Google Scholar] [CrossRef] [Scilit]
- Chakraborty, S.; Banerjee, D.K. Classification Using Artificial Intelligence and Machine Learning. J. Artif. Intell. Syst. 2024, 6. [Google Scholar] [CrossRef] [Scilit]
- He, R.; Xu, Y. Overfitting Identification in Machine Learning Models with the Person-Fit Indicator. In Proceedings of the 2023 4th International Conference on Computer Engineering and Intelligent Control (ICCEIC), Guangzhou, China, 20–22 October 2023; pp. 520–524. [Google Scholar] [CrossRef] [Scilit]

Disclaimer/Publisher’s Note: The statements, opinions and data contained in all publications are solely those of the individual author(s) and contributor(s) and not of MDPI and/or the editor(s). MDPI and/or the editor(s) disclaim responsibility for any injury to people or property resulting from any ideas, methods, instructions or products referred to in the content. |
© 2026 by the authors. Licensee MDPI, Basel, Switzerland. This article is an open access article distributed under the terms and conditions of the Creative Commons Attribution (CC BY) license.