


Abstract
This work presents the development and validation of an automated 3D scanning device based on two opposed consumer-grade Apple TrueDepth sensors integrated into a controlled rotational architecture, designed for the digitization of complex freeform surfaces such as the external cranial geometry. The system design was guided by a prior metrological characterisation of the sensor’s distance-dependent behaviour and complemented by an additional study of the influence of surface orientation, from which a suitable operating window for complete head acquisition was derived. On this basis, a mechatronic system was implemented comprising a mechanical structure, electronic hardware, a control architecture, and a calibration procedure that registers the local point clouds from both sensors into a common global coordinate system. Geometric validation was performed using symmetric and asymmetric cranial phantoms digitized with both the proposed device and a professional reference scanner. Surface comparison revealed localized discrepancies concentrated in fine anatomical details, while the cranial vault showed good overall agreement, with RMS deviations of 0.314 mm and 0.286 mm for the symmetric and asymmetric phantoms, respectively. Morphometric consistency was assessed through the cranial vault asymmetry index (CVAI), for which both systems produced the same general trend with a maximum difference of 0.2%. These results demonstrate the feasibility of the proposed system as a geometrically consistent and morphometrically reliable instrument for head surface digitization under controlled laboratory conditions.
1. Introduction
Three-dimensional digitization of complex freeform surfaces is a relevant task in dimensional metrology, particularly when conventional contact-based measurement cannot provide sufficient spatial completeness or when contactless acquisition is required by the application [1]. Although optical scanners and stereophotogrammetric systems provide high-quality surface data, their traditionally elevated cost and operational complexity have limited their adoption in dedicated, application-specific devices [2]. The integration of depth sensors into consumer mobile devices has created new opportunities for accessible 3D measurement, though comprehensive performance validation at the system level remains scarce and inconsistent [3]. Comparative analyses of Apple depth sensors against industrial scanning solutions have likewise shown that consumer devices may still be suitable for tasks demanding moderate dimensional accuracy when acquisition conditions and workflow are properly controlled [4,5].
When consumer-level depth sensors are used in a dedicated measurement machine context, reconstructed geometry quality depends not only on the sensing principle itself, but also on stand-off distance, incidence angle, target geometry, viewpoint coverage, and calibration strategy. This is especially relevant for Apple’s TrueDepth sensor (Apple Inc., Cupertino, CA, USA), whose metrological behaviour has been shown to vary significantly with sensor-to-object distance [6,7]. Accordingly, sensor suitability must be assessed as a function of acquisition geometry rather than through application-level outcomes alone, moving away from the common practice of treating smartphone scanning as a black-box reconstruction tool.
Full-surface digitization of a head-like geometry introduces additional challenges, since self-occlusions, local curvature changes, and limited field of view prevent complete acquisition from a single viewpoint. Integrating multiple captures therefore requires a coherent calibration strategy [8,9,10,11]. Methods based on spherical targets have proven effective for extrinsic calibration of RGB-D camera networks [12], while line-based approaches enable accurate pose estimation even with little or no overlap between fields of view [13]. Rotary scanning systems are attractive because they impose a controlled kinematic structure on the acquisition process, although they require proper rotation-axis calibration to avoid cumulative registration errors [14]. Several approaches have been proposed to improve this calibration: while classical methods fit a circle to the trajectory of feature points, more recent work has shown that incorporating both position and orientation information of the calibration target yields substantially lower radius error and better repeatability [15]. Systems based on line laser projectors coupled to a rotating camera have also demonstrated this calibration strategy in practice, achieving low plane reconstruction errors and dimensional RMSE [16].
External cranial geometry provides a challenging test case for this system-oriented approach: it is a smooth but nontrivial freeform surface from which morphometric descriptors of asymmetry and shape must be reliably derived [17,18]. Most affordable craniofacial solutions reported in the literature rely on handheld photogrammetry or smartphone applications [19,20,21], and even studies validated against professional stereophotogrammetry systems tend to focus primarily on facial surfaces [22,23]. Recent app-based TrueDepth facial-scanning studies have reported sub-millimetric agreement with CBCT-derived facial models and overall trueness and precision values below in comparisons involving smartphone, laser, and structured-light facial scanners [24,25]. However, full-head acquisition at affordable cost, with controlled and repeatable sensor motion, remains comparatively underexplored [19,23]. Several systems have introduced automated capture at low cost [26,27] primarily for facial surfaces, without extending coverage to the posterior cranium. Few accessible 3D scanning systems successfully combine complete surface coverage with rigorous, standardized calibration, as high-precision technologies remain largely restricted by prohibitive costs and technical complexity [28,29]. The literature therefore still lacks an integrated study combining metrological sensor characterisation, geometry-driven specification of acquisition conditions, a mechatronic architecture for automated multi-view capture, and reference-based validation on anatomically representative head-like objects.
We address that gap by presenting the development and validation of an automated 3D measurement system based on consumer-grade TrueDepth sensors integrated into a controlled rotational architecture. The system is approached primarily as a dimensional measurement problem, in which sensing, acquisition geometry, synchronisation, and calibration are treated as mutually dependent design decisions rather than independent steps. Previously established metrological constraints on working distance are complemented here by an additional characterisation of surface orientation effects, from which a suitable operating window for full-head acquisition is derived. On this basis, a complete mechatronic system is implemented and validated against a professional reference scanner using cranial phantoms as test artefacts, with both geometric deviation and morphometric consistency as comparison criteria.
The main contribution of this work is therefore the integrated development and validation of a low-cost automated scanning system in which sensor behaviour, acquisition geometry, mechanical architecture, calibration, and validation are addressed as coupled elements of a dimensional measurement problem. Unlike most smartphone-based or handheld craniofacial scanning approaches, the proposed system does not rely on an uncontrolled acquisition trajectory or black-box reconstruction alone. Instead, the sensor operating conditions are first specified from metrological characterization, the acquisition viewpoints are selected from a geometry-driven coverage analysis, and the resulting dual-sensor rotational architecture is calibrated and validated against a professional reference scanner. This combination of sensor characterization, working-window definition, automated multi-view acquisition, extrinsic calibration, and reference-based geometric and morphometric validation defines the specific contribution of the present study.
2. Sensor Characterization and Specification Formulation
The scanning device developed in this work is based on the Apple TrueDepth sensor, integrated into consumer mobile devices such as iPhones and iPads. This sensor operates on an active optical ranging principle: it projects a pattern of infrared points onto the target surface and captures the projected pattern with an infrared camera, from which the three-dimensional coordinates of the sampled points are reconstructed. Although originally designed for biometric facial recognition, its availability, moderate cost, and point density make it attractive for the development of dedicated measurement devices based on consumer-grade hardware.
In this work, two iPhone 12 Pro units (Apple Inc., Cupertino, CA, USA) were used, each providing a depth map resolution of over a nominal working range of approximately 150–800 mm. The iPhone 12 Pro units were selected as previous-generation consumer devices, each acquired below €400, since this study is intended as a validation of an affordable TrueDepth-based measurement architecture rather than as a benchmark of the latest smartphone hardware. Apple does not publish performance specifications for its depth sensors, such as depth accuracy, depth-map resolution, or operating range, across device generations. Consequently, the quantitative results should be interpreted as specific to the tested units and acquisition conditions. Newer devices should be independently characterized before being adopted within the proposed architecture, as no publicly available data on TrueDepth performance variations across iPhone generations was identified during this study.
2.1. Prior Distance Based Constraints
A previous study on the metrological behaviour of this sensing technology evaluated the effect of sensor-to-object distance using planar surfaces, parallel planes, and a hemisphere [6]. The results showed that the sensor does not provide valid depth information below , and that depth noise increases progressively as distance grows. For an object of the size and curvature of a human head, a nominal working distance of was selected as a suitable design compromise between point-cloud quality and field coverage. However, distance alone is not sufficient to fully specify the acquisition geometry: full cranial scanning requires multiple viewpoints and surface orientation therefore becomes an additional variable affecting data quality, since the angle of incidence between the sensor axis and the local surface normal influences both point density and depth noise. This motivated the further characterisation described in the following section, from which the final design specifications were derived.
2.2. Orientation Characterization
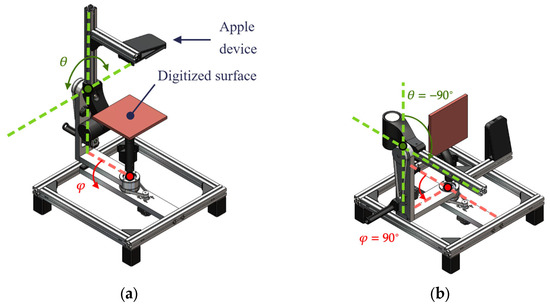
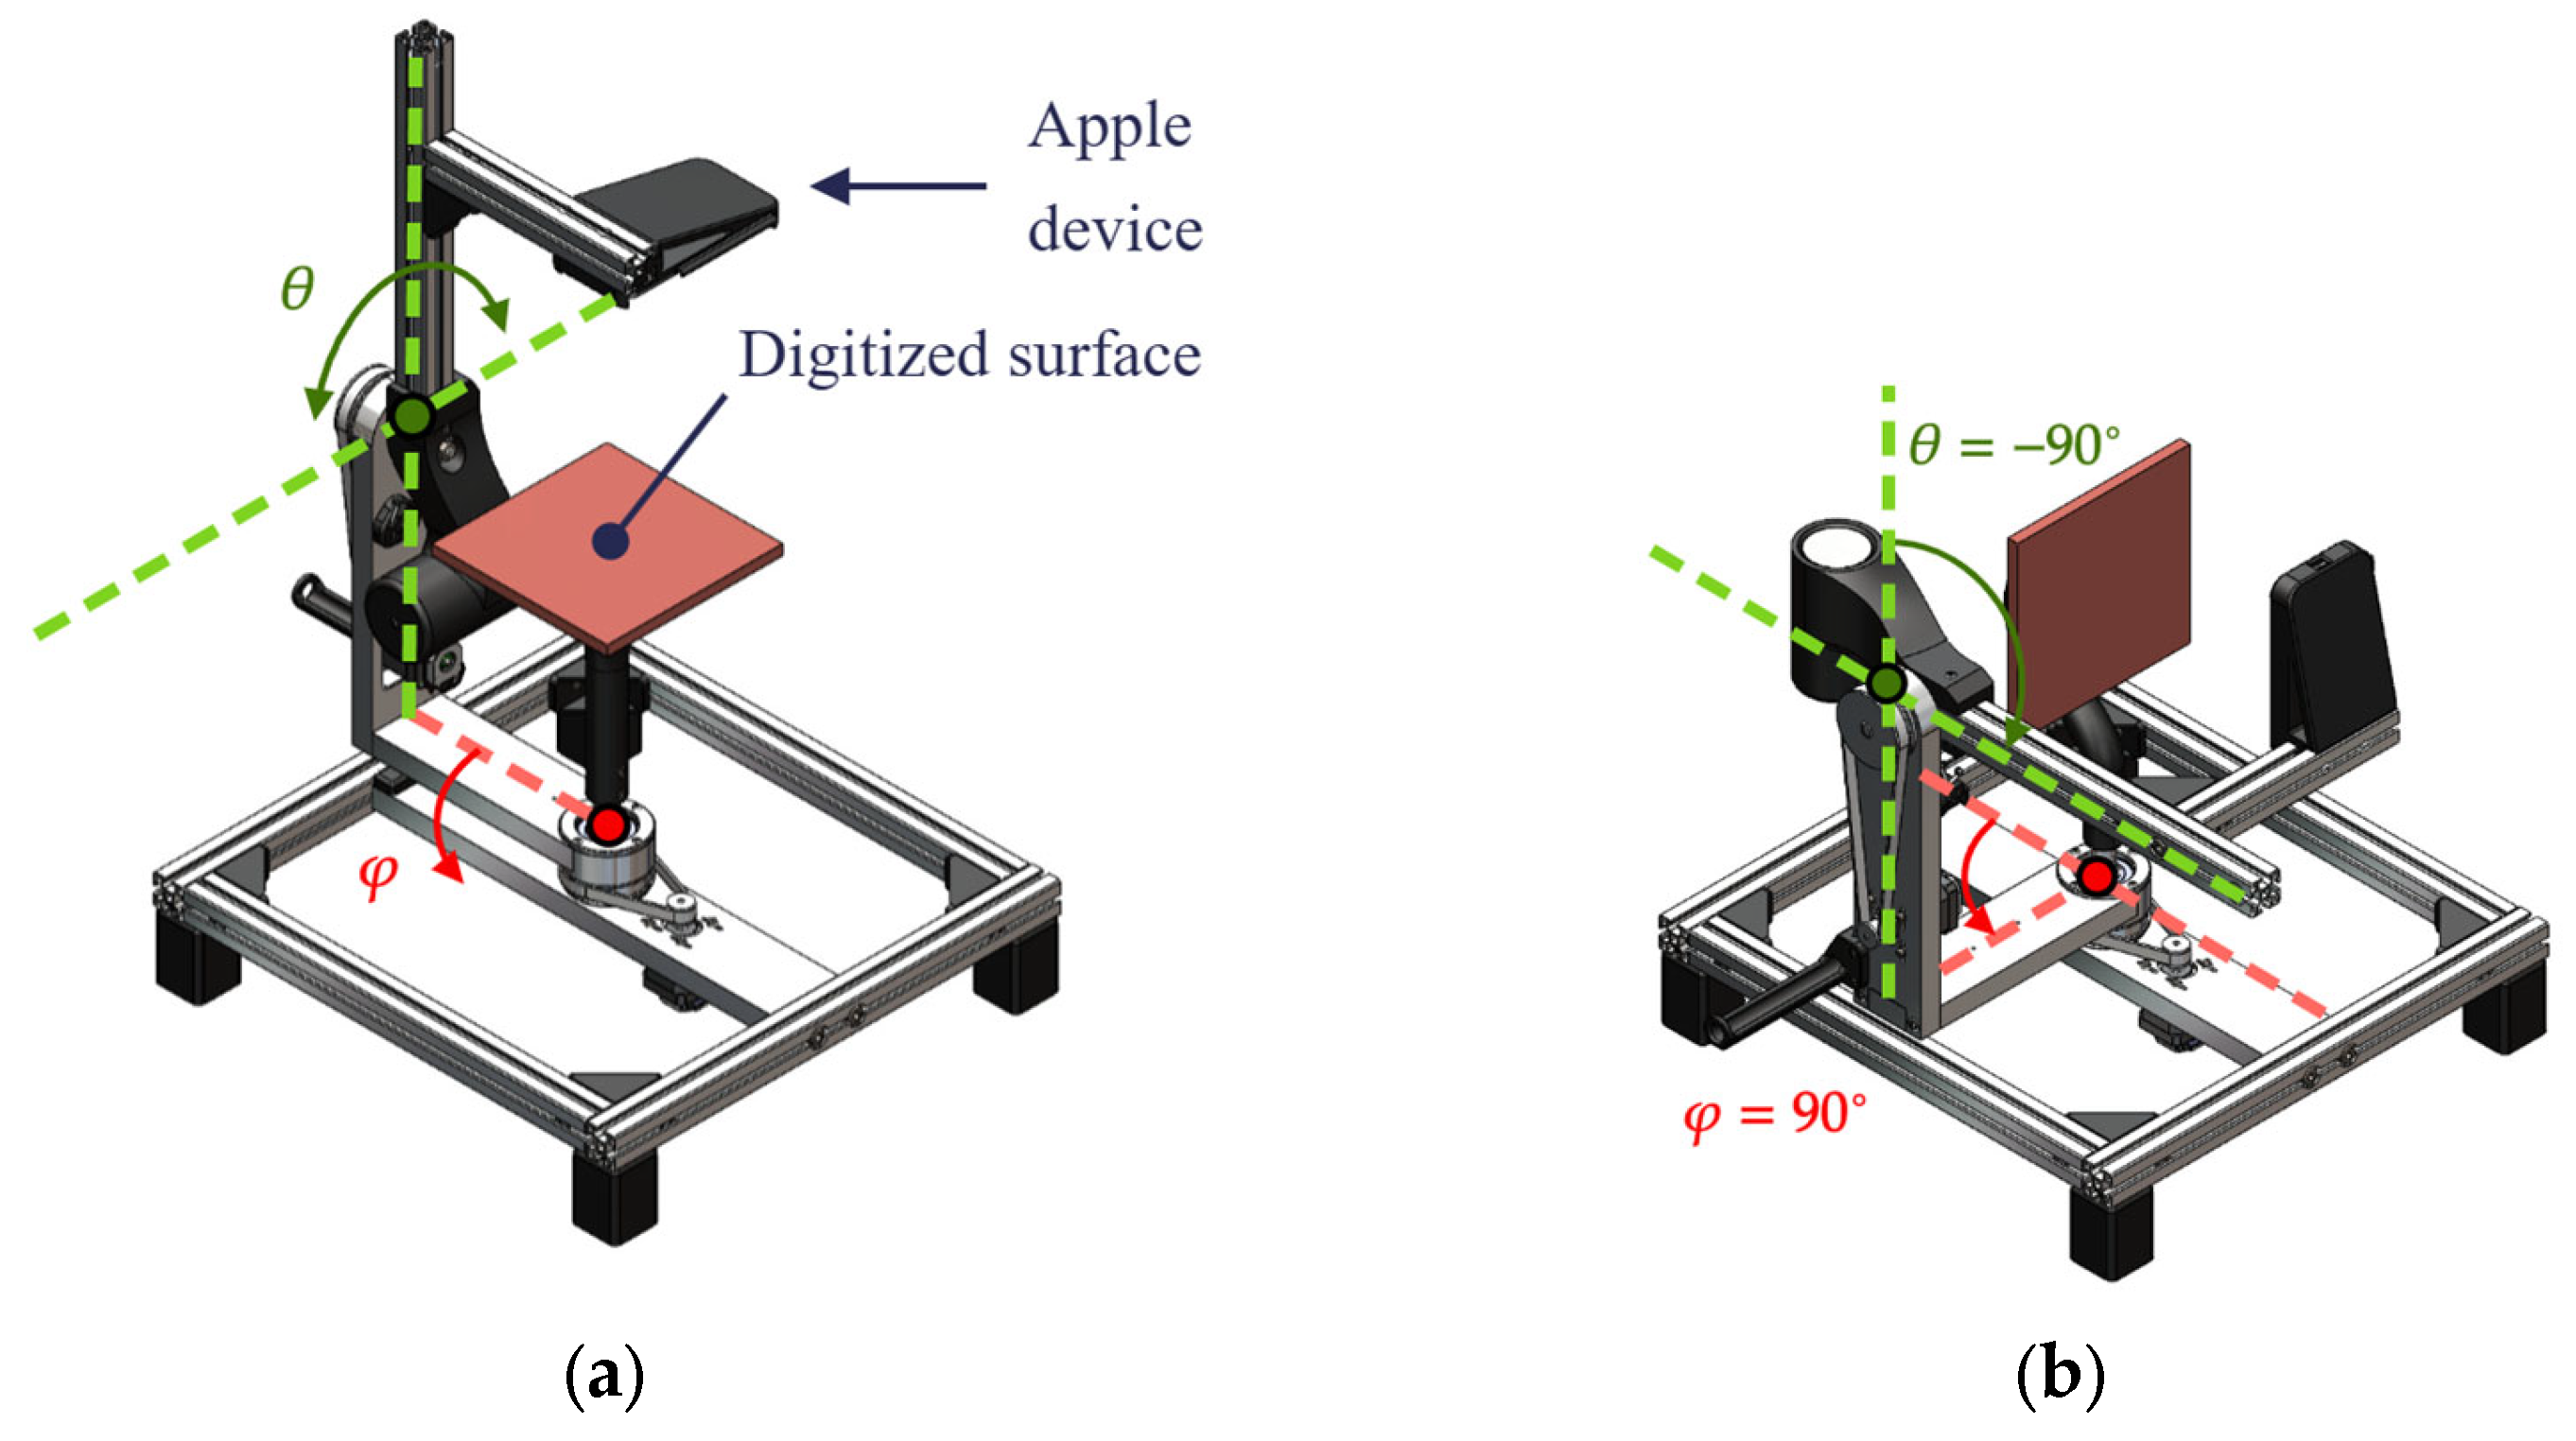
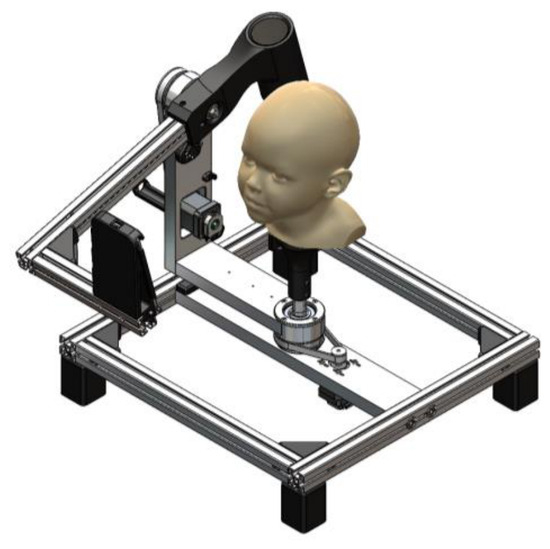
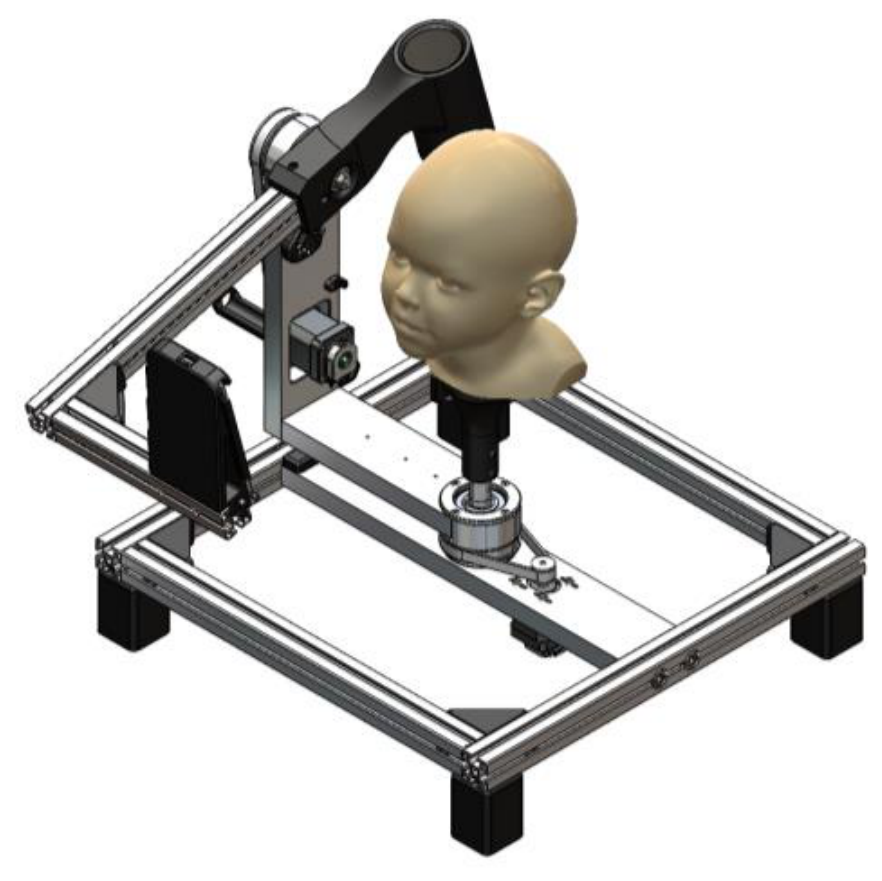
To assess the effect of sensor-to-surface orientation on data quality, the experimental setup shown in Figure 1 was developed.
Figure 1.
Experimental setup developed to characterise the influence of surface orientation on TrueDepth sensor data quality. (a) PH tests (b) PV tests.
The test bench allowed the relative orientation between the sensor and a planar target to be varied independently through two angles, and , while maintaining a constant distance of between the sensor and the centre of the planar target in all tested configurations, as illustrated in the Supplementary Materials (Video S1). For each orientation, two output variables were recorded from the resulting point cloud: the number of captured points, as a measure of capture completeness, and the standard deviation of point residuals with respect to the nominal plane geometry, as a geometric quality indicator. This design isolated the effect of surface orientation from that of stand-off distance, characterised previously.
Two angular configurations, denoted as PH and PV, were defined for the tests, as summarized in Table 1 and illustrated in Figure 1.
Table 1.
Angular configurations used in the orientation characterisation tests.
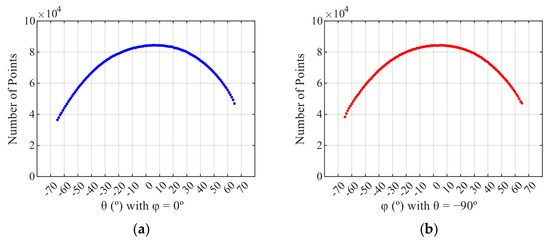
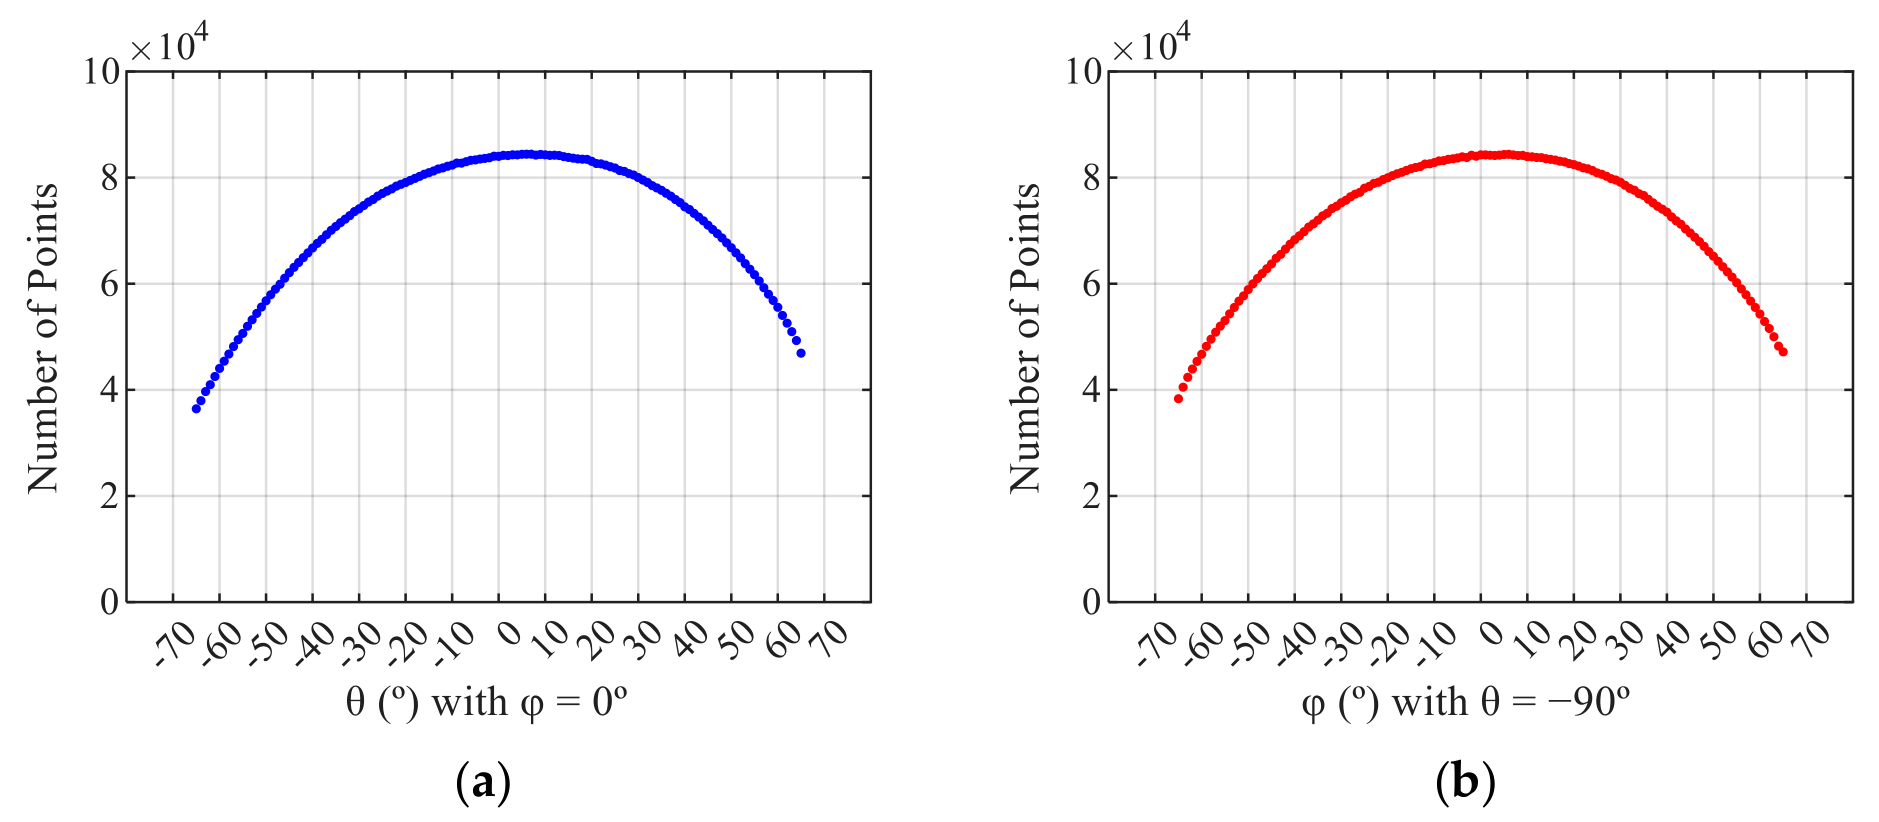
The results for the number of captured points are presented in Figure 2.
Figure 2.
Number of captured points as a function of surface orientation for configurations (a) PH and (b) PV.
In both configurations, the sensor exhibited the same general behaviour, suggesting that the angular sensitivity of the TrueDepth sensor follows a similar pattern in both the horizontal and vertical directions. In addition to this qualitative observation, a symmetry analysis was conducted by pairing measurements at or depending on the configuration. Given the non-linear profile of both metrics, the Spearman rank correlation coefficient was adopted as the primary symmetry indicator (a statistic robust to the non-linear and potentially non-normal distribution of the metric across angles). For the number of captured points, the Spearman correlation between mirrored angle pairs was for PH and for PV, confirming that the response profile is highly consistent between positive and negative orientations in both configurations. The normalized RMS asymmetry error did not exceed in either configuration, further supporting this interpretation. Figure 3 shows the standard deviation of point residuals obtained for the same set of orientations.
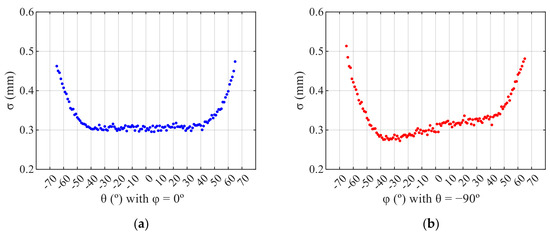
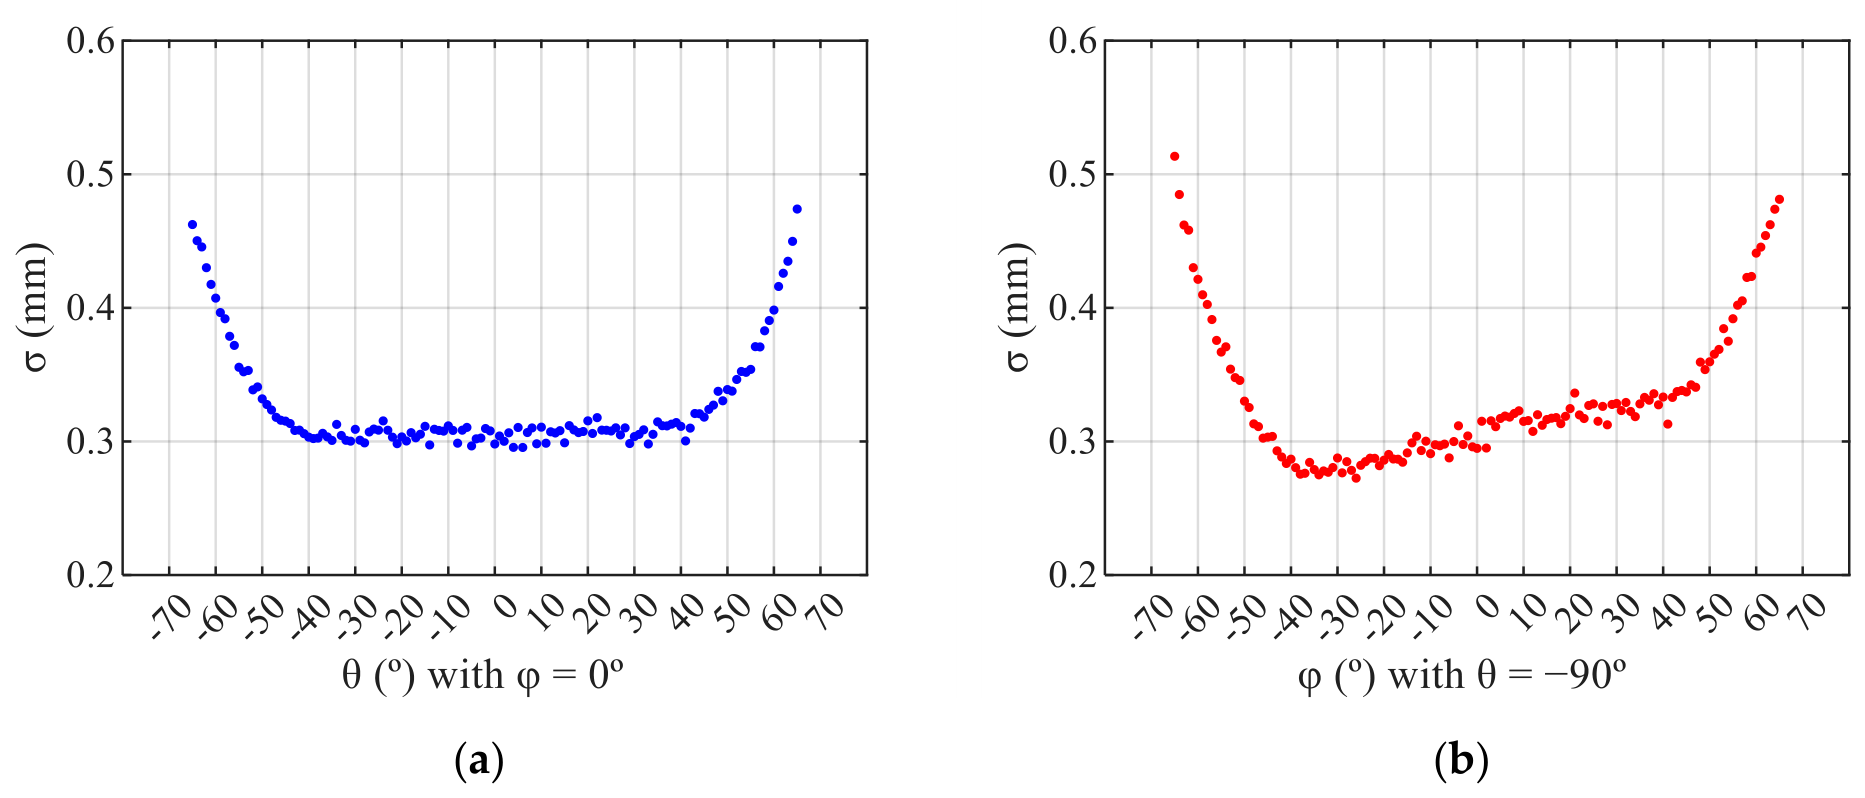
Figure 3.
Standard deviation of point residuals with respect to the nominal plane geometry as a function of surface orientation for configurations (a) PH and (b) PV.
In both configurations, the same general trend was observed: the lowest standard deviation values were obtained within a broad central region of the tested angular interval, and performance degraded progressively towards the extremes.
Examination of the curves showed that the sensor response was somewhat more stable when varying than when varying . For configuration PH, the standard deviation remained approximately constant at around over the interval . For configuration PV, a comparable level was maintained over the interval and then increased slightly up to . Beyond those limits, data quality degraded sharply in both cases.
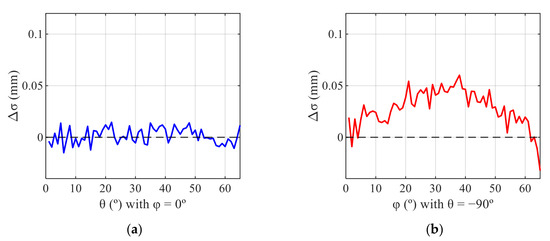
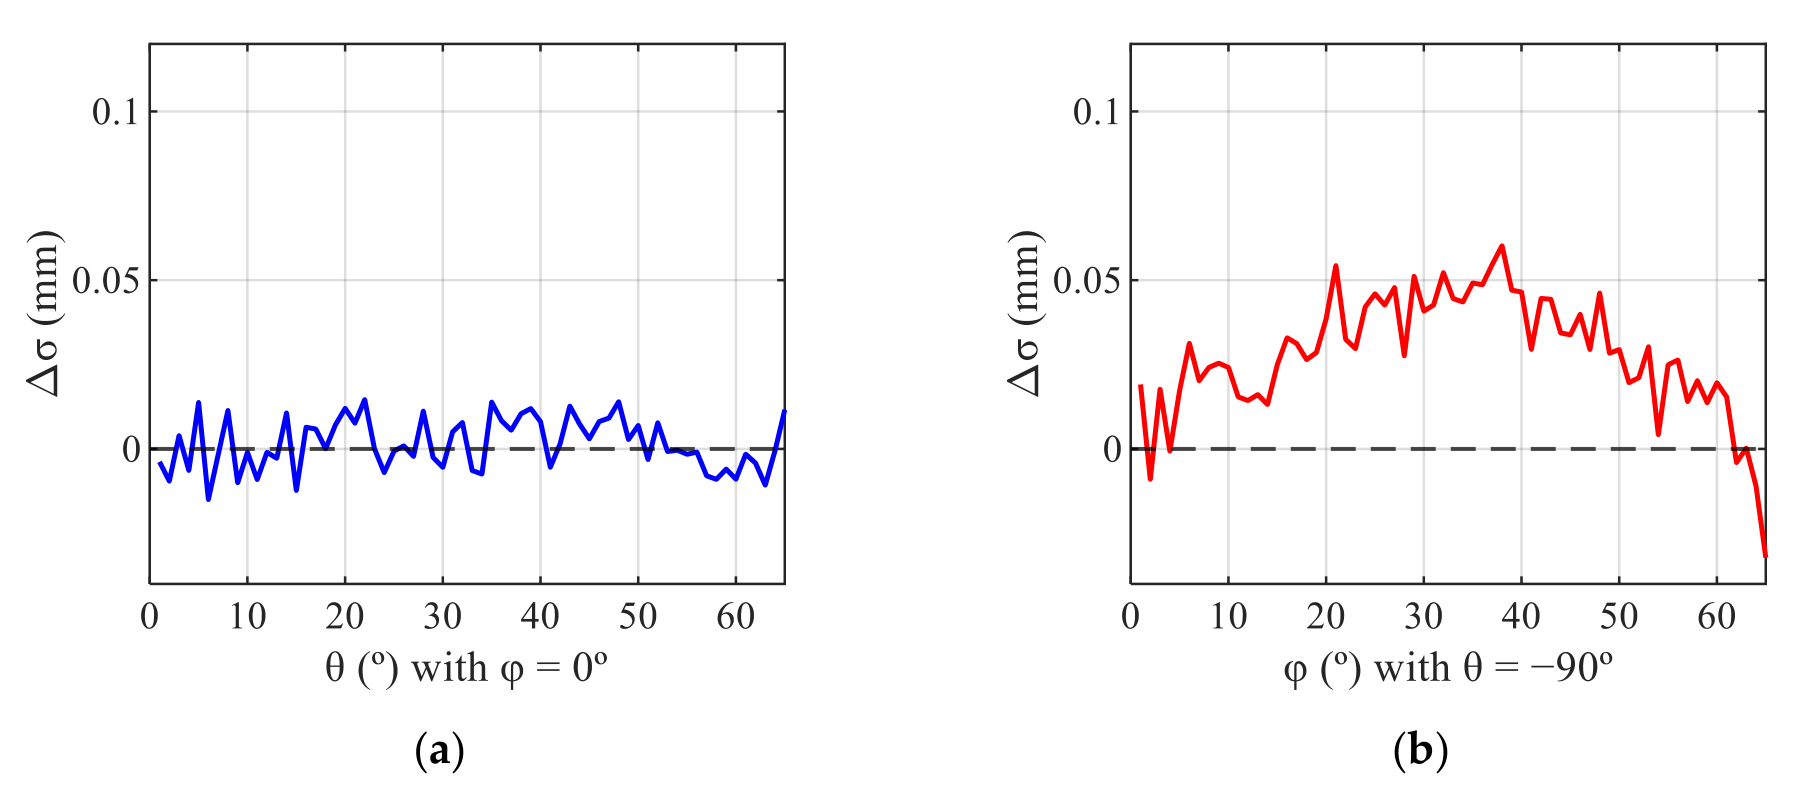
Regarding symmetry in the standard deviation of point residuals profiles, the normalized RMS asymmetry error was for PH and for PV. Given the U-shaped profile of the standard deviation curves, the Spearman rank correlation coefficient was used again to assess symmetry between mirrored angle pairs. The Spearman correlation was for PH and for PV, indicating that the rank ordering of values is better preserved in the horizontal rotation configuration. A Wilcoxon signed-rank test yielded for PH, confirming no statistically significant difference between symmetric angles, whereas PV yielded , consistent with a more structured asymmetry. This is further supported by profiles shown in Figure 4: for PH, the difference between mirrored angle pairs fluctuated randomly around zero with no discernible trend, whereas for PV a more structured deviation was observed. The peak asymmetry in PV reached approximately , representing a non-negligible deviation relative to the central standard deviation values of . This behaviour may be attributable to the asymmetric physical arrangement of emitters and receiver within the TrueDepth module, though this remains speculative. Nevertheless, within the reliable angular interval identified in Figure 3, the standard deviation of point residuals remained below or very close to .
Figure 4.
Asymmetry profiles of the standard deviation of point residuals for the planar target. represents the difference between mirrored angle pairs for configuration PH (a) and PV (b).
2.3. Influence of Ambient Lighting
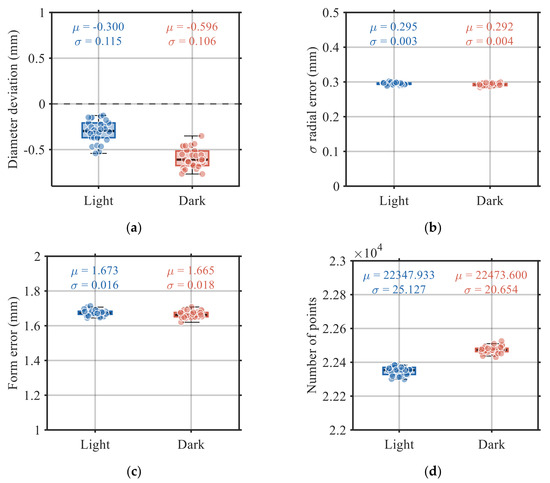
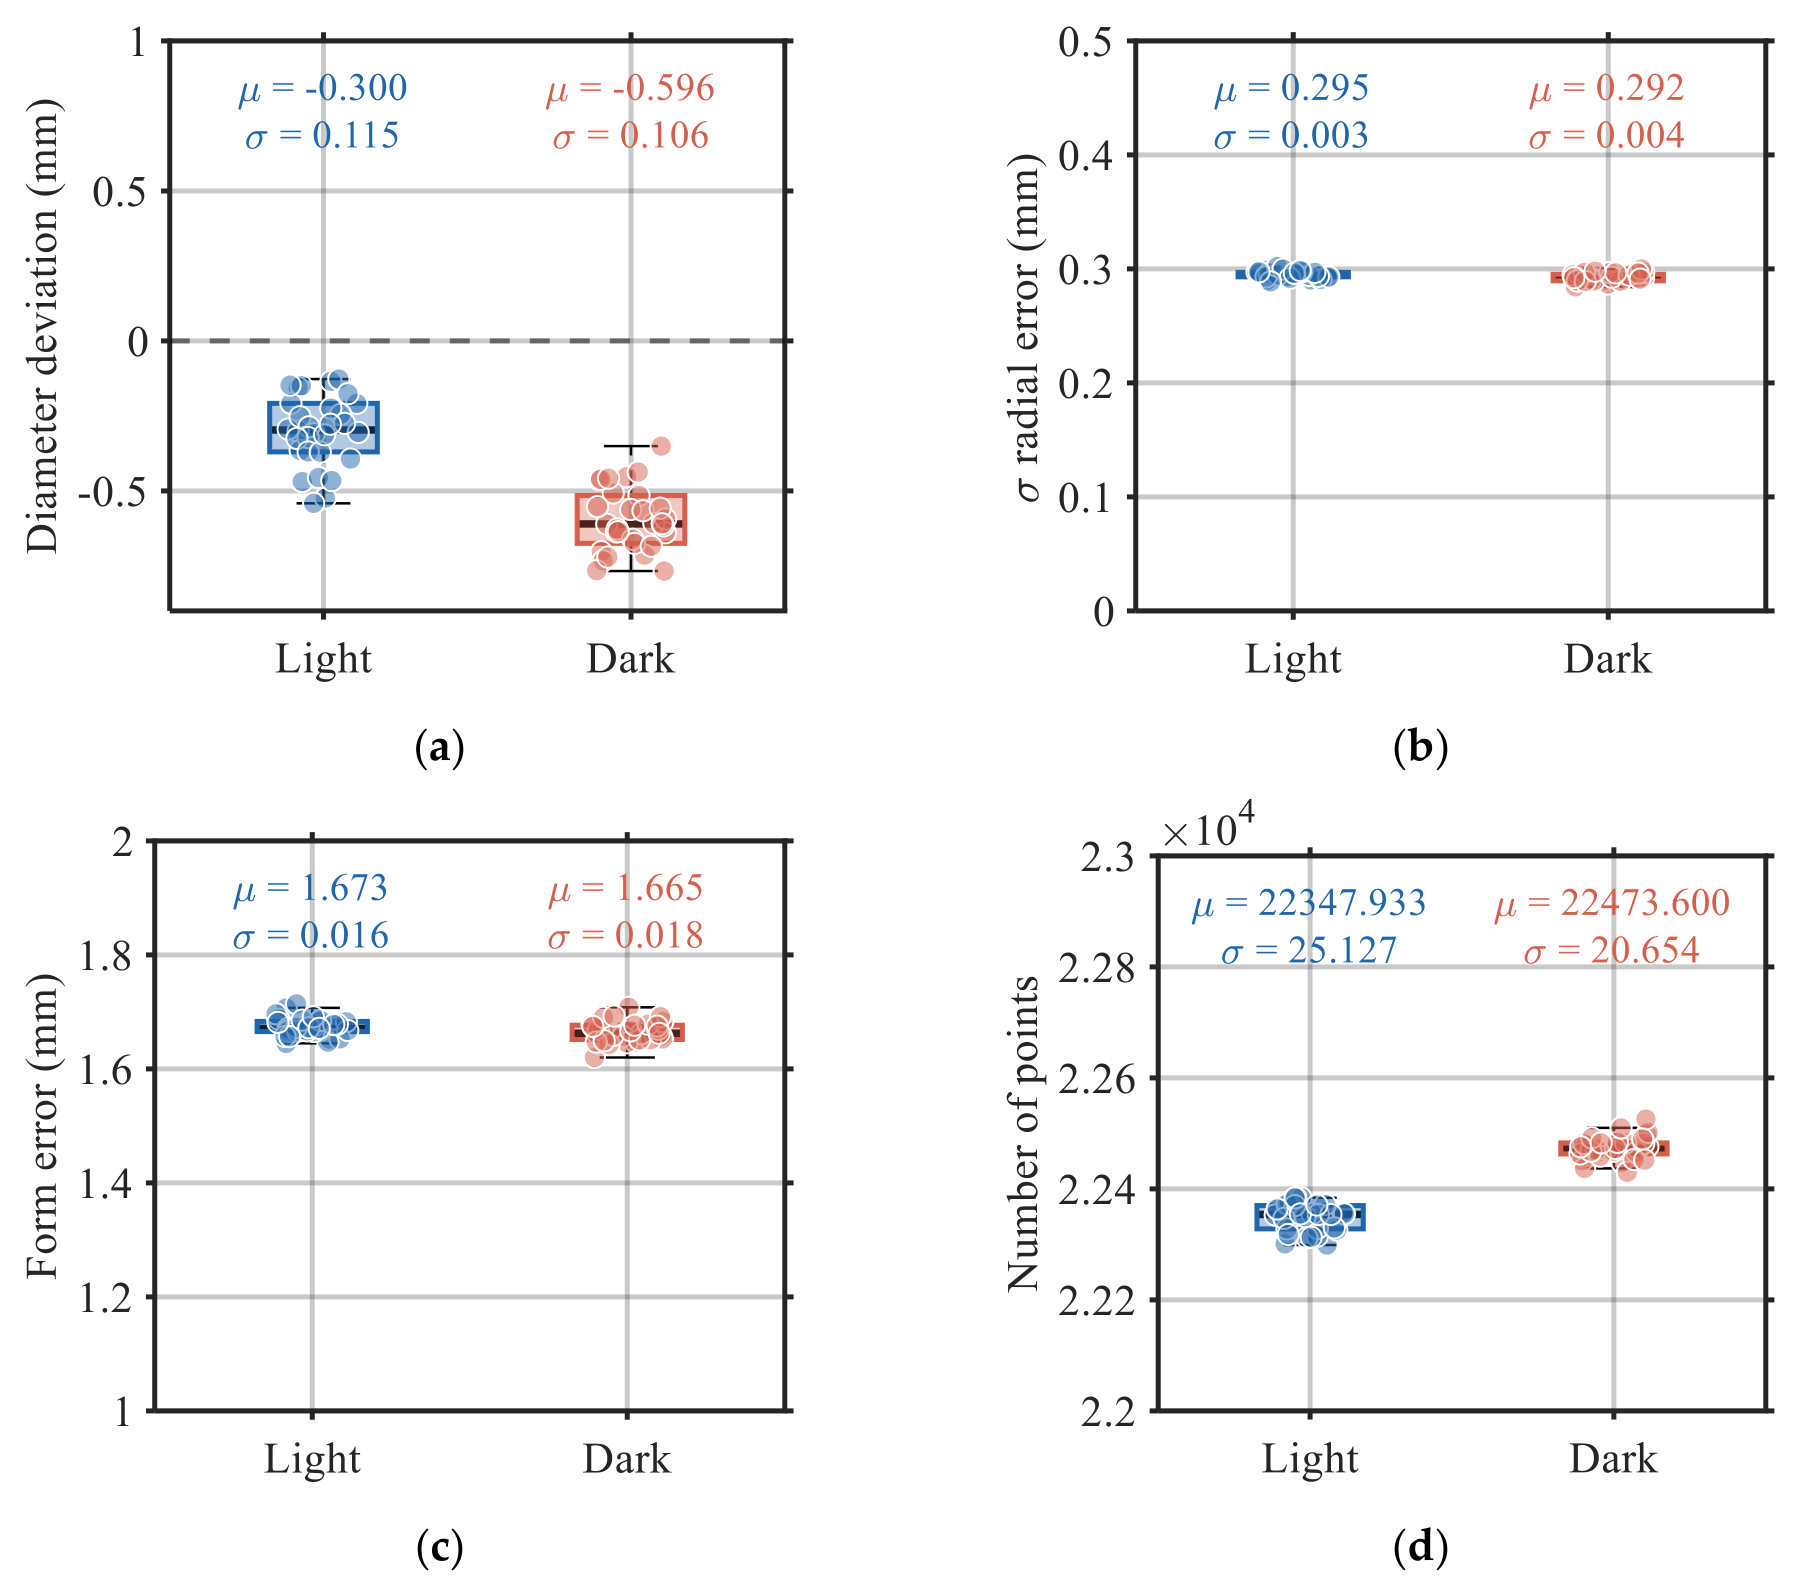
To assess the influence of ambient lighting on sensor performance, point clouds of two reference artefacts, a stepped plane surface and a hemispherical test piece of known geometry [6], were digitized under two conditions: standard laboratory environment and complete darkness ( per condition). Complete darkness was included as a boundary condition not representative of clinical practice, where illumination levels are typically comparable to those of the laboratory condition tested. For the planar artefact, flatness was computed yielding mean values of and under light and dark conditions respectively. Although a difference of approximately was observed, both values remain within the range of values obtained in previous sensor characterisation process [6] at comparable working distances, suggesting that the tested illumination conditions do not alter the order of magnitude of the measurement error. For the hemispherical artefact, four metrics were extracted from a spherical cap fit: estimated diameter deviation, radial error standard deviation, form error and number of points (Figure 5). Welch’s test revealed a statistically significant difference in diameter deviation between conditions (Light: ; Dark: ), indicating that ambient lighting does affect the depth scale estimated by the sensor. A statistically significant but practically negligible difference was also found in radial error standard deviation (; ). In contrast, form error showed very little difference (; ). These findings suggest that ambient lighting primarily affects the absolute depth scale rather than the local geometry of the reconstructed surface. Given that the cranial asymmetry indices evaluated in this study are derived from relative morphological measurements rather than absolute depth values, the observed effect of ambient lighting does not compromise the validity of the proposed scanning strategy.
Figure 5.
Effect of ambient lighting on 3D point cloud quality metrics derived from a hemispherical reference artefact (n = 30 per condition; complete darkness included as extreme boundary case). (a) Diameter deviation, (b) Radial Error, (c) Form Error and (d) Number of points.
2.4. Coverage Analysis and Acquisition Strategy
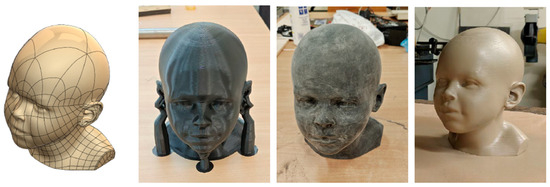
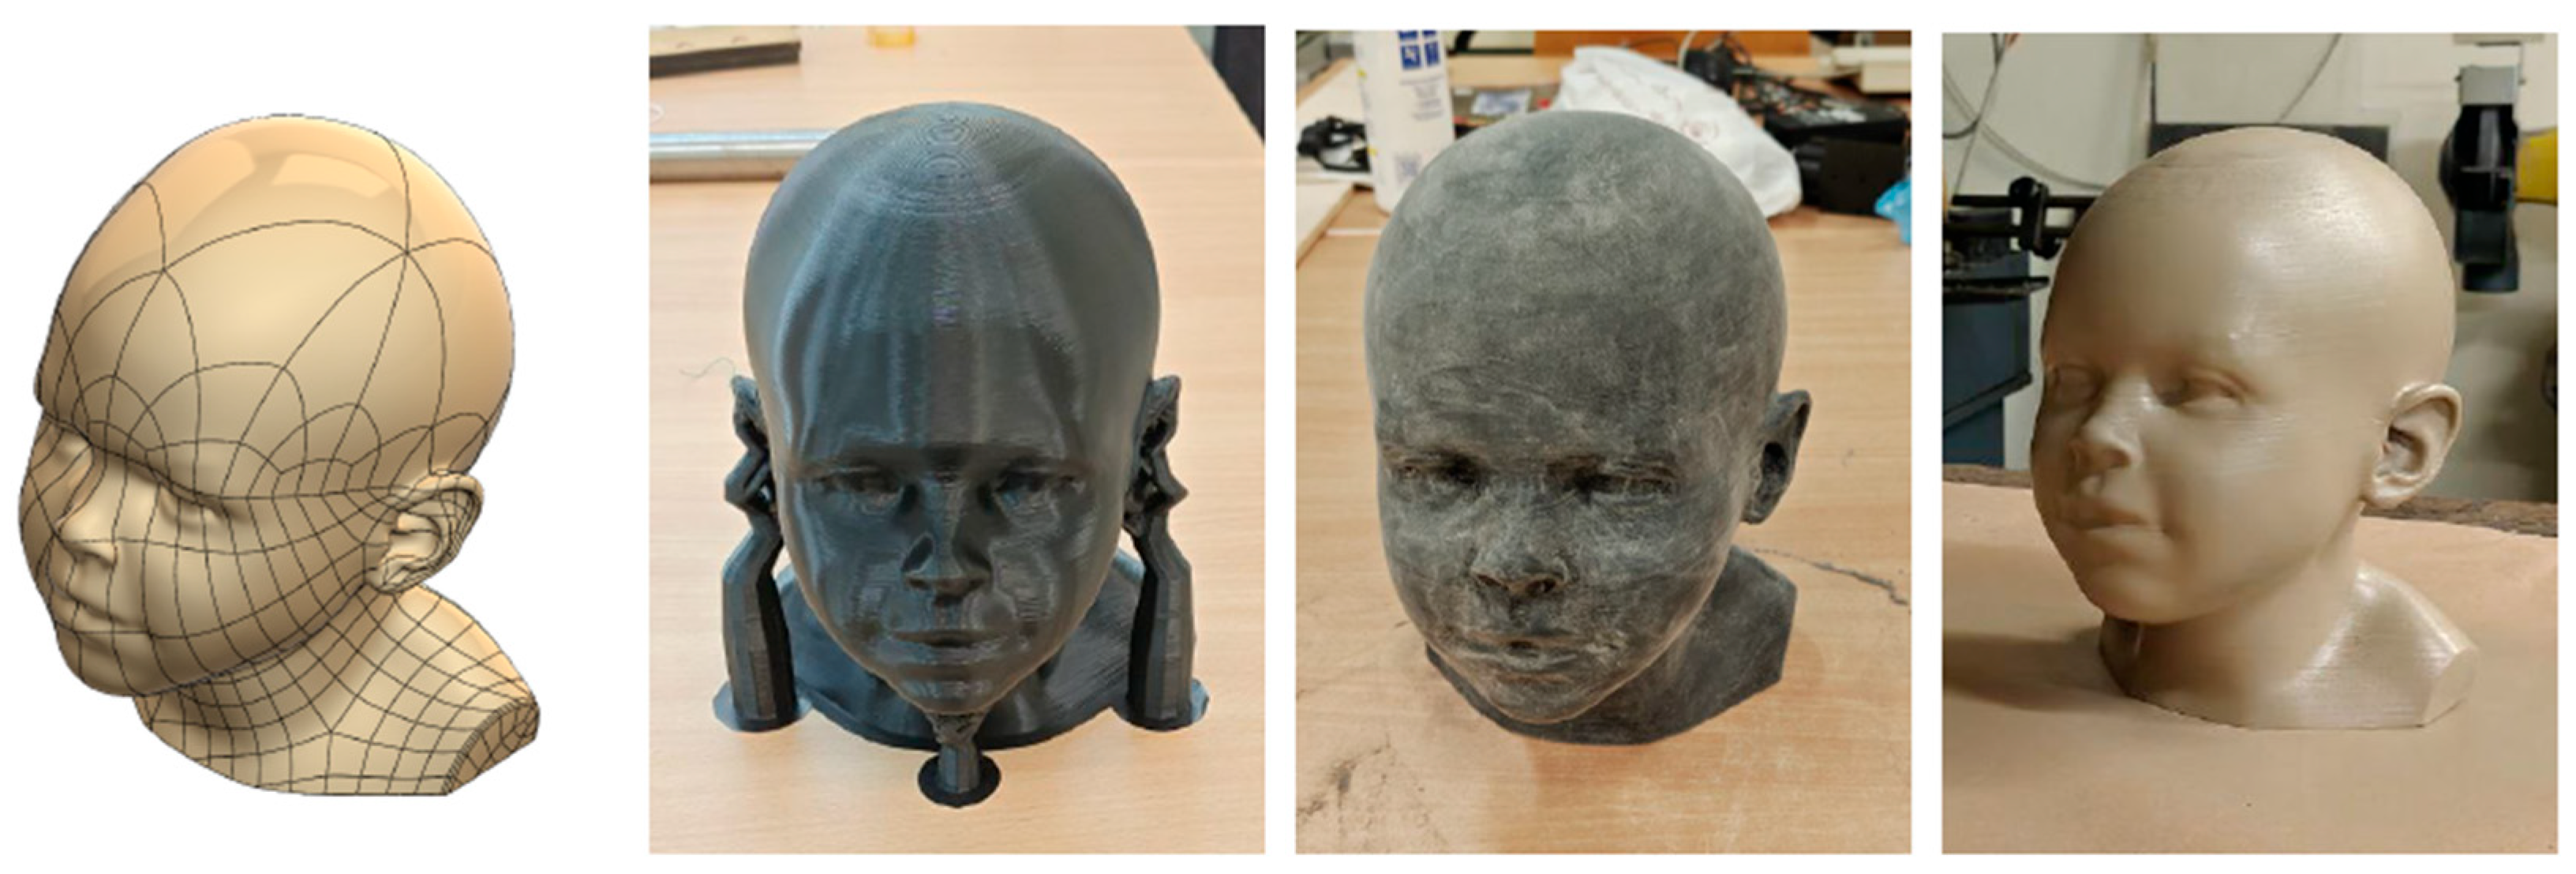
To determine the number of viewpoints and sensor orientations required for complete head coverage, an additional test was carried out using the same characterisation bench with a head model (symmetric cranial phantom or CFS) as the target. This reference CFS was based on a commercially available digital model obtained from TurboSquid (ref. 1891973, Baby Head). The physical part was manufactured in polylactic acid (PLA) by material extrusion additive manufacturing (MEX) on an Ultimaker S5 system (Ultimaker B.V., Utrecht, Netherlands). To reduce the staircase effect associated with the process, the surface underwent two-stage sanding using 120 and 600 grit abrasives and then coated with two layers of multi- surface paint (RAL 1019) to improve surface uniformity (Figure 6).
Figure 6.
Processing of the reference head for testing. From left to right: solid model in CAD, 3D-printed reference head, result after the sanding stage, and final standardized painted version.
A dense exploratory sweep was performed over the angular space using the characterization bench (Figure 7), covering from to and from to in steps of , yielding acquisition positions with one capture per position.
Figure 7.
Experimental setup with the head model mounted on the bench.
The resulting point clouds were examined to identify the minimal subset of angular positions capable of providing complete cranial coverage with sufficient overlap between adjacent captures. Coverage completeness was assessed by visual inspection of the fused point cloud after ICP-based pairwise registration: a configuration was considered valid when no surface voids were detectable in the reconstructed cranial vault. Inter-capture overlap adequacy was assessed by whether ICP registration converged successfully for all adjacent capture pairs. Both criteria had to be simultaneously satisfied for a configuration to be accepted.
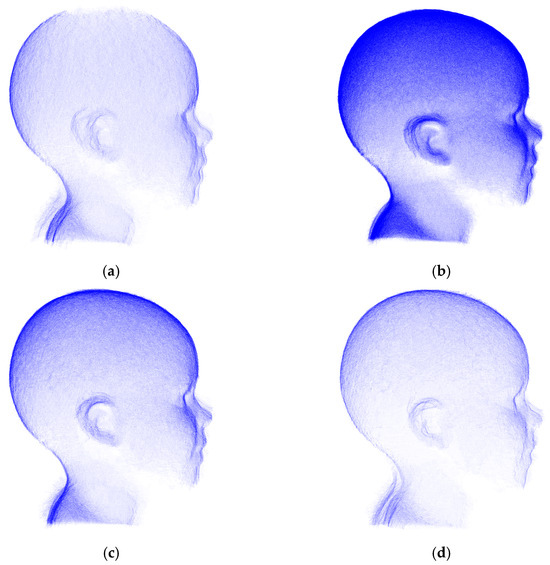
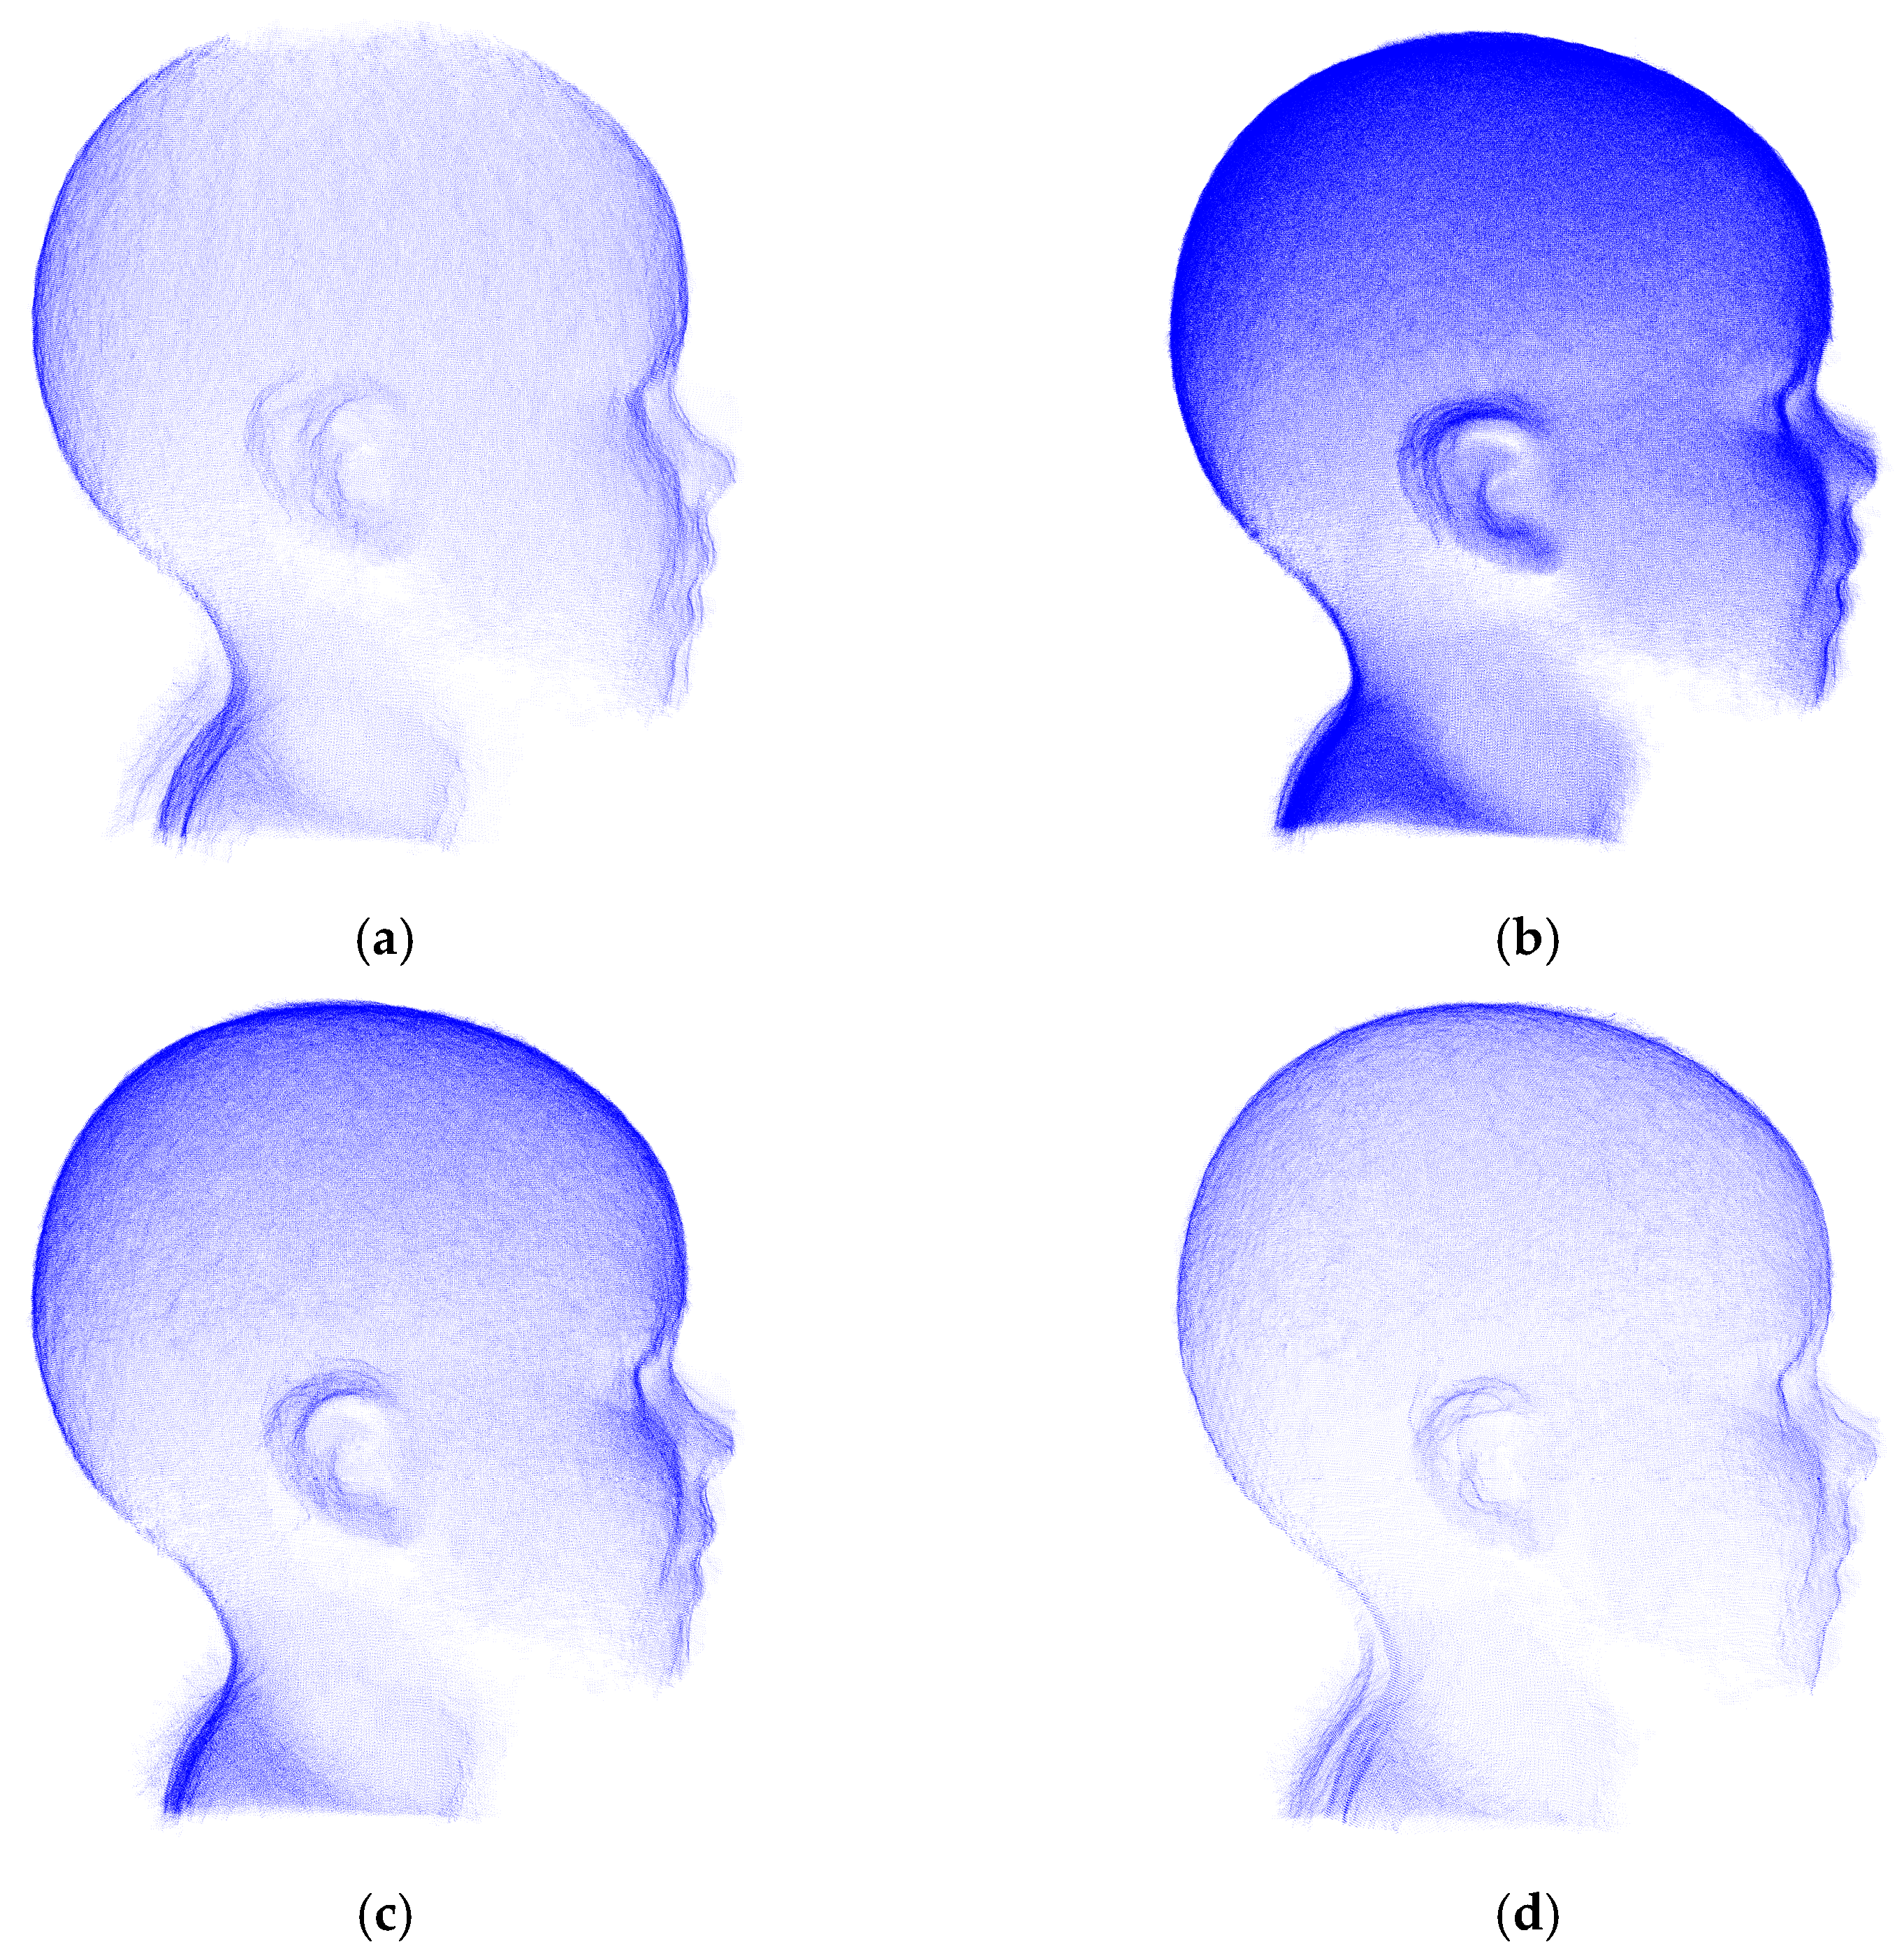
First, the need for at least two viewpoints was established: as shown in Figure 8a, a single viewpoint leads to incomplete cranial vault reconstructions. The selection of the two angles then resulted from an iterative process in which candidate angle pairs were evaluated by comparing the reconstructed surface completeness and the positioning constraints imposed on the subject. Configurations were progressively tested by fixing at intervals and varying , discarding those that produced surface voids or required excessively oblique sensor orientations relative to the subject. The chosen values ( and ) represented the combination that yielded complete vault coverage while remaining compatible with subject postures considered tolerable in a clinical context.
Figure 8.
Expected point cloud under different sensor orientations: (a) one sensor at and increments of (b) two sensors (, ) and increments of (c) two sensors (, ) and increments of (d) two sensors (, ) and increments of .
This analysis showed that two values of (specifically and ) combined with 12 evenly distributed positions of at intervals over , produced complete coverage of the cranial vault with successful ICP convergence: no surface voids were detected in the fused point cloud and pairwise ICP registration converged for all adjacent pairs. Increasing the spacing beyond introduced convergence failures between adjacent captures due to limited surface overlap as seen in Figure 8d. Conversely, finer angular spacing did not improve surface completeness and increased processing time without benefit, as the larger number of captures increased the computational load without adding useful coverage information. The selected configuration therefore yields 24 captures per scan, 12 per sensor.
2.5. Operating Window and Sensor Arrangement
Taken together, the results of Section 2.2 and Section 2.4 allow both the usable acquisition window and the sensor arrangement of the final system to be defined. Regarding data quality, the sensor exhibits a broadly similar sensitivity pattern in the horizontal and vertical directions, with best performance obtained when the sensor faces the surface perpendicularly. This is consistent with the reduction in projected dot density that occurs as the surface tilts away from the sensor, as a consequence of the oblique projection geometry of the structured-light emitter. Reliable data can nonetheless be obtained within an angular interval around the normal direction, and the operating window of the final system is therefore defined by the combination of the stand-off distance and the admissible orientation range of established in Section 2.2.
Regarding sensor arrangement, the coverage analysis showed that complete cranial acquisition requires two fixed values of ( and ) swept across positions of . This configuration is realised through a dual-sensor rotational architecture in which each sensor is mounted at one of the required values and both rotate together around the subject through . Adopting two opposed sensors rather than one reduces the number of sequential acquisitions by half while maintaining full coverage, with limited additional impact on system cost or complexity.
3. System Development
Based on the previous results, a rotational scanning system was developed to acquire complete head scans under controlled geometric conditions. The system was conceived as an integrated measurement device in which sensor arrangement, rotational motion, data acquisition, and geometric reconstruction were treated as interdependent design decisions. In accordance with the operating constraints identified in Section 2, the design had to satisfy four main requirements: maintain the 250 mm working distance; keep the observed surface within the ±40° of the sensor normal direction across the nominal acquisition trajectory; provide full coverage of the cranial vault and ensure synchronisation between angular position and point cloud acquisition.
3.1. Mechanical Design
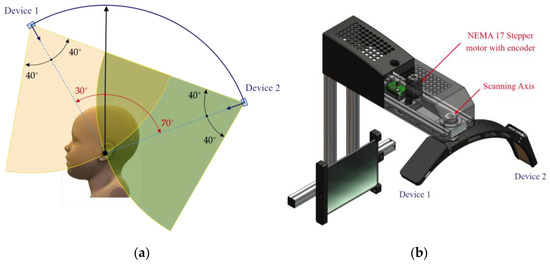
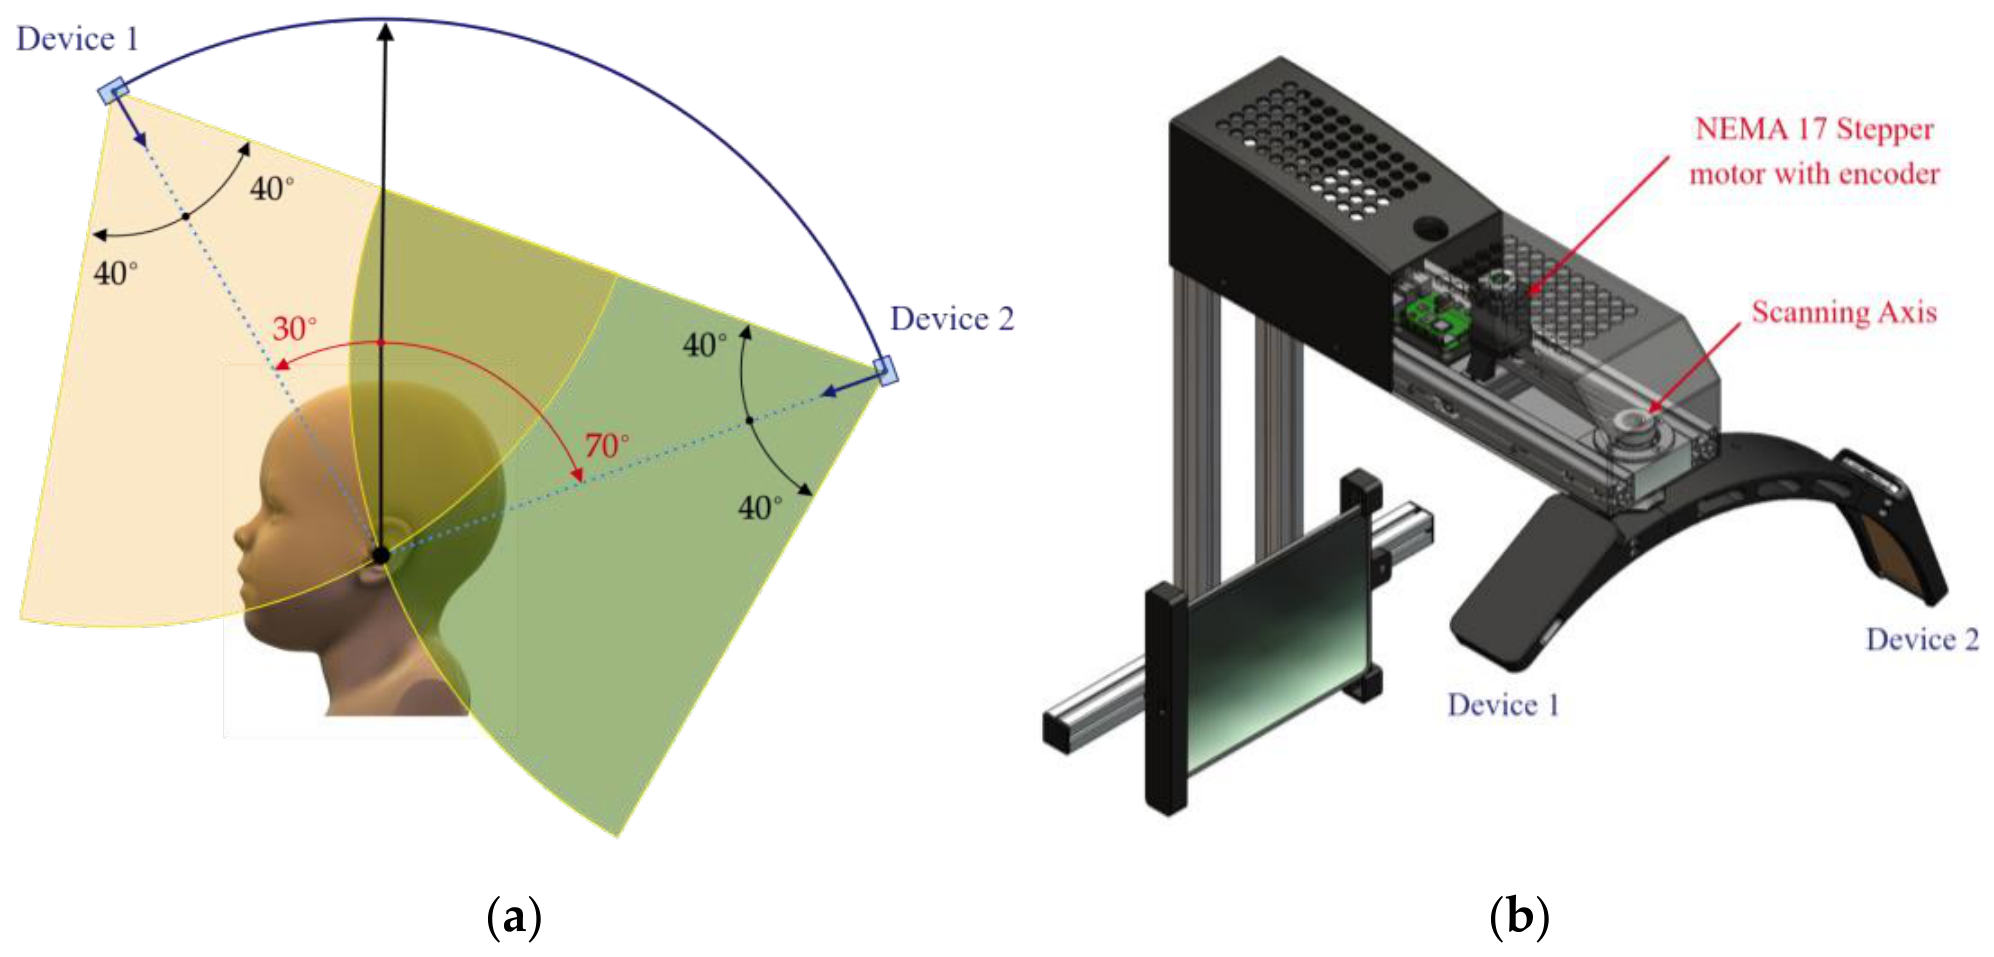
The mechanical architecture was based on the viewpoint configuration established in Section 2.5. Two TrueDepth sensors were mounted at inclination angles of and respectively, corresponding to the two acquisition directions identified as necessary for complete cranial coverage. Both sensors were mounted in an opposed configuration with a fixed angular separation of in , so that at each rotational position they observed complementary regions of the head. This arrangement is illustrated in Figure 9a.
Figure 9.
Mechanical sensor arrangement: (a) viewing geometry of the two TrueDepth sensors at and , mounted in opposed configuration; (b) physical mounting of both sensors.
A belt-driven mechanism transmitted rotary motion from the stepper motor to the scanning axis, using a 10-tooth pulley on the motor shaft and a 20-tooth pulley on the scanning axis. A 2:1 reduction ratio was therefore obtained, improving the effective angular positioning resolution while reducing the influence of stepping errors and mechanical backlash. The Nema 17-19-07PD stepper motor was selected on the basis of its torque-to-inertia ratio with respect to the inertial load of the rotating sensor assembly, a property verified to ensure smooth motion at the required angular velocity without step loss. Operating in 1/16 microstepping mode yields a nominal motor step of 0.113°; after the 2:1 belt reduction, the effective positioning increment at the scanning axis was (the encoder is used here as a position-arrival verification device rather than a fine positioning reference), ensuring that programmed positions were reliably reached and confirmed before each capture was triggered. This transmission arrangement provided the 360° circumferential motion required for data acquisition.
Both sensors were mounted on the scanning axis using rigid support arms that fixed their relative orientation. The geometry of this assembly was chosen so that the optical axes of both sensors converged at the scanning region, placing the target surface at approximately 250 mm from each sensor for the head dimensions considered in this study, as shown in Figure 9b. In this way the system combines the coverage advantages of a multi-viewpoint arrangement with a compact and mechanically straightforward structure.
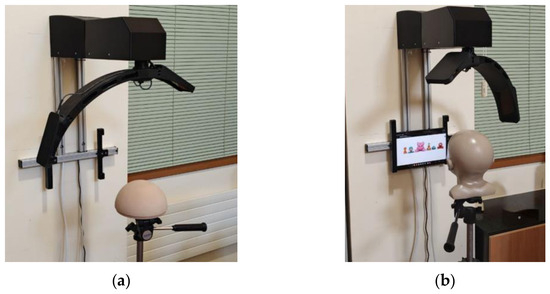
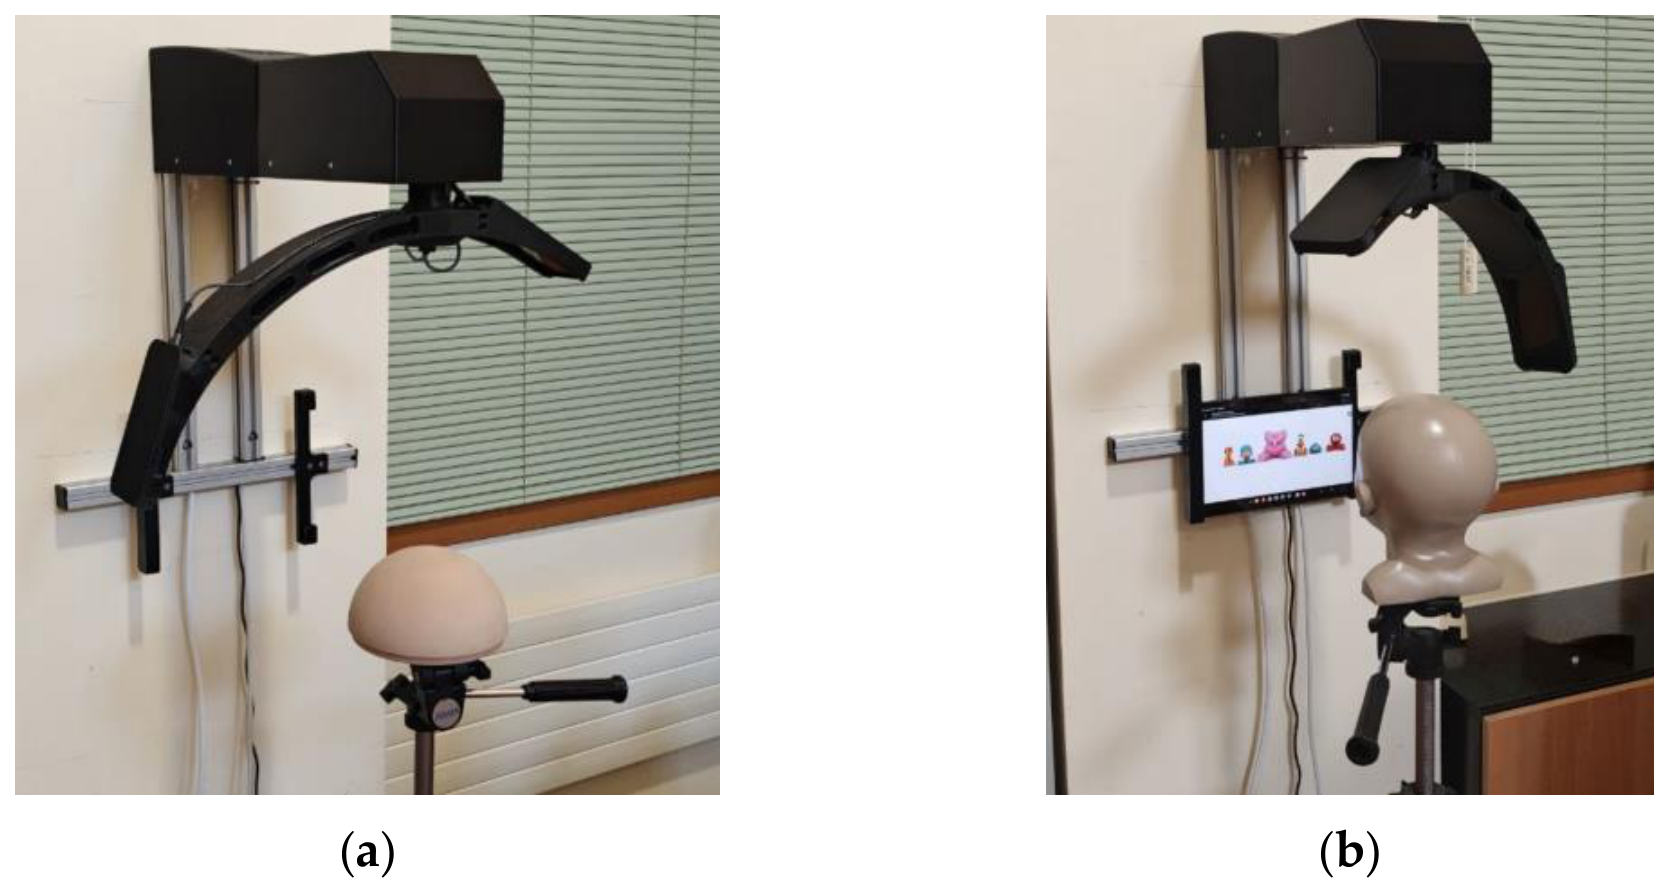
The final assembled device is shown in Figure 10.
Figure 10.
Final assembled scanning device: (a) with hemispherical calibration artefact; (b) with cranial phantom.
This mechanical design established a controlled geometric relationship between the sensors, the scanning axis, and the subject, enabling each acquired point cloud to be linked to a known angular position and the cranial vault surface to be reconstructed in a common global coordinate system.
3.2. Electronic Design
The electronic architecture was designed around a single processing unit responsible for motion control, encoder feedback, sensor communication, acquisition synchronisation, and data transmission. Given the interface and computational requirements of the different subsystems, the central unit was implemented using a Raspberry Pi 4 (Raspberry Pi Foundation, Cambridge, UK) together with a custom printed circuit board responsible for motor driving, encoder signal conditioning, and power distribution.
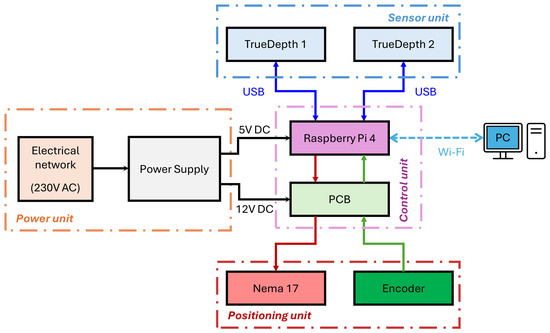
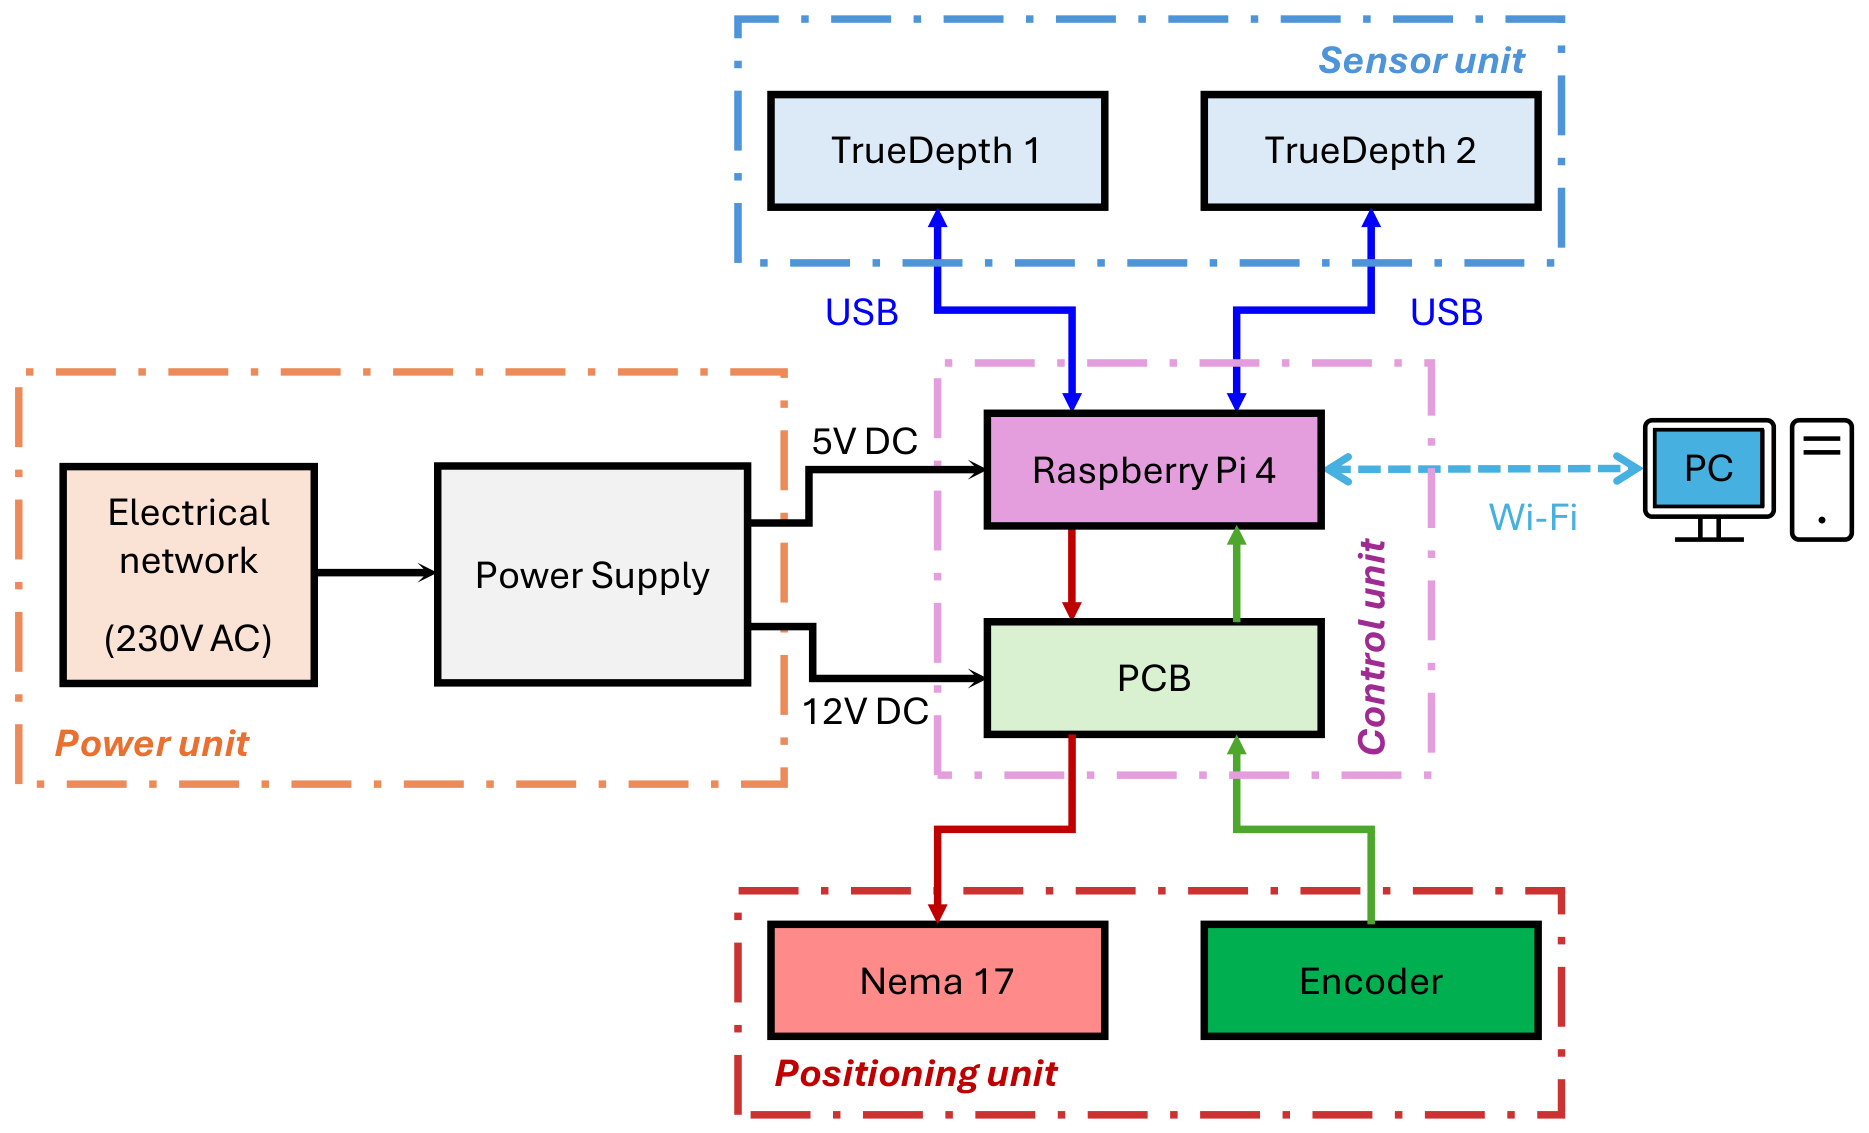
The architecture is organised into four functional units, as illustrated in the block diagram of Figure 11. The power unit converts the 230 V AC main supply into the 5 V DC and 12 V DC levels required by the processing and positioning subsystems respectively. The positioning unit consists of a NEMA17-19-07PD-AMT112S (Same Sky, Lake Oswego, OR, USA) stepper motor driven through an A4988 driver and equipped with an AMT112S encoder. The motor was operated in 1/16 microstepping mode in order to reduce vibration and ensure smoother rotational motion during scanning. The AMT112S encoder was configured for 512 pulses per revolution and generated two quadrature digital signals (channels A and B), enabling both angular displacement and direction to be monitored by the processing unit. Since the encoder operated at 5 V logic levels while the Raspberry Pi GPIO interface is limited to 3.3 V, level shifters were incorporated to ensure electrical compatibility between the two subsystems. Taking into account the quadrature operation of the encoder and the 2:1 transmission ratio described in Section 3.1, the effective angular monitoring resolution of the scanning axis was approximately 0.088°, which is larger than the nominal positioning step ; the encoder therefore serves as a position-arrival verification. For the nominal acquisition radius of , this corresponds to a tangential spacing of approximately 0.4 mm between consecutive encoder positions at the scanning radius, consistent with the sub-millimetre surface detail required for cranial morphometry. The sensor unit comprises the two TrueDepth devices, each connected to the Raspberry Pi via USB, enabling the 3D data from both sensors to be associated with the corresponding angular position of the rotating axis. Finally, the processing unit communicates with an external workstation via Wi-Fi, allowing the reconstructed point cloud data to be transmitted for processing, visualisation and further analysis.
Figure 11.
Block diagram of the electronic architecture.
3.3. Control Architecture
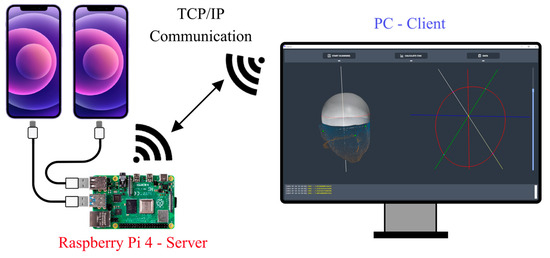
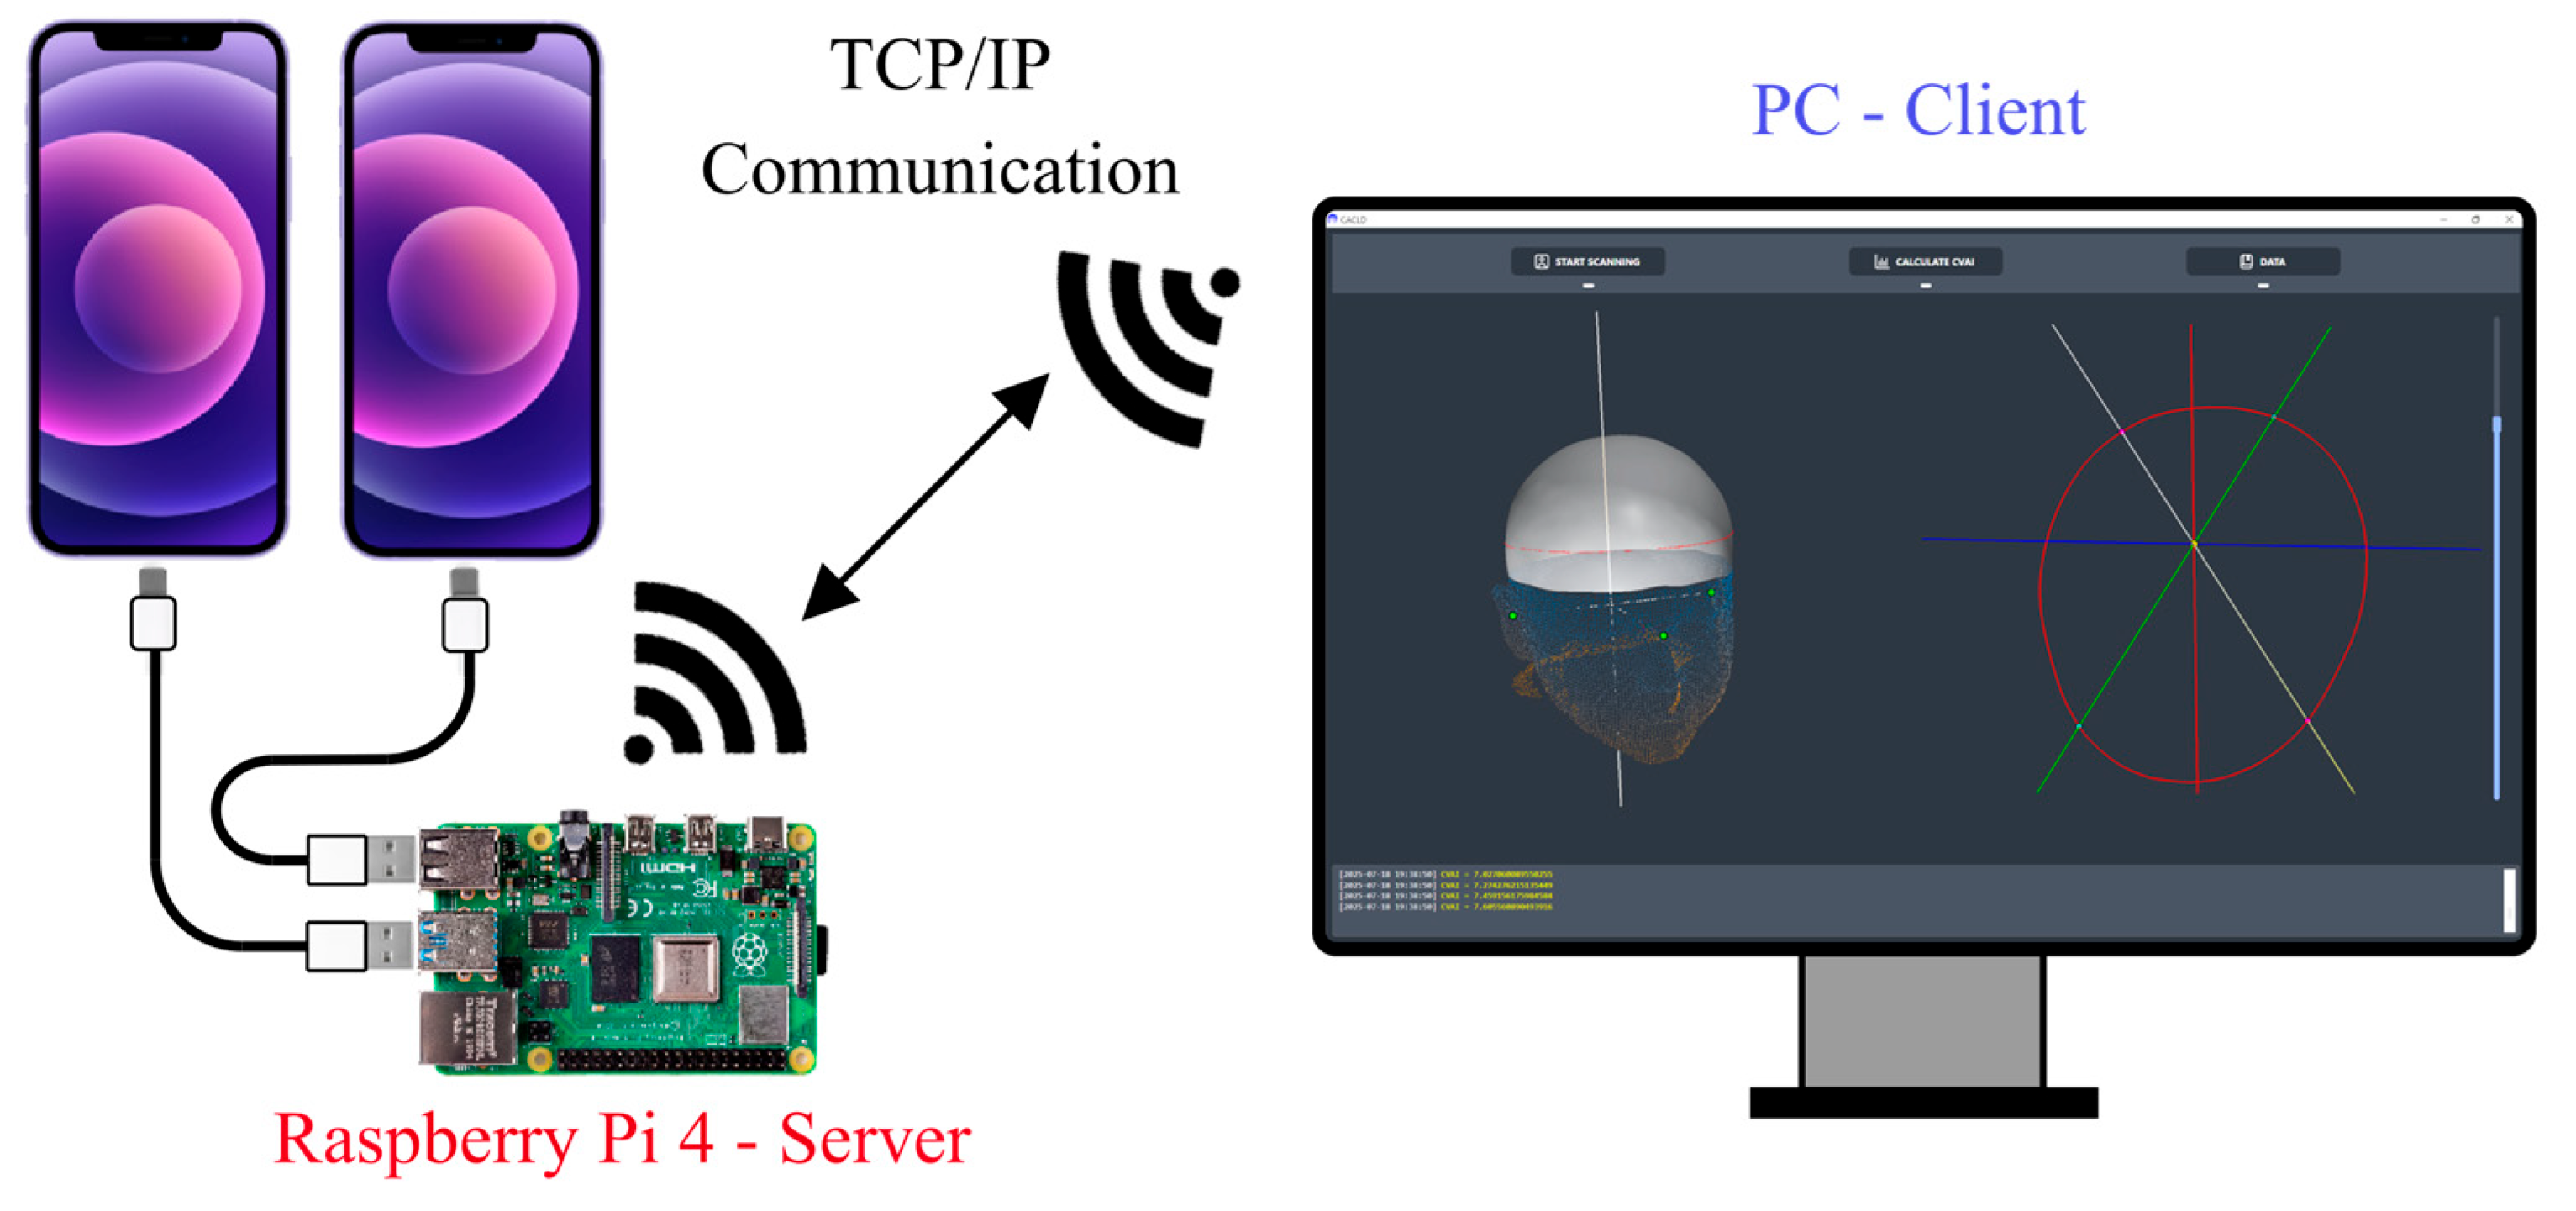
The control strategy was organised as a master–slave architecture. A software application running on the external workstation served as the master, communicating via TCP/IP with a custom routine embedded in the Raspberry Pi, which functioned as the slave and executed the scanning procedure on command, as illustrated in Figure 12.
Figure 12.
Control architecture of the developed system.
During operation, the embedded routine was required to coordinate two concurrent processes: angular positioning of the rotating axis and sequential acquisition of 3D data from both TrueDepth sensors. To achieve this, the routine executes two concurrent software threads, each assigned to a dedicated task to allow interleaved execution. The first thread was devoted to continuous feedback, providing a continuous record of the instantaneous angular position and triggered data acquisition from both sensors each time a predefined angular position was reached, as determined by comparison with the encoder feedback value. In the implemented configuration, the iPhone devices run the Record3D application (Record3D, PointMap d.o.o., Ljubljana, Slovenia) in USB Live Streaming mode, which enabled live transmission of RGBD frames from the TrueDepth sensors to the Raspberry Pi, allowing the Raspberry Pi to access the captured depth data directly.
In this way, the system records a synchronised data tuple (encoder position and 3D captures from both sensors) at each of the 12 programmed angular positions, yielding a total of 24 frames. The total acquisition time for the implemented 24-frame sequence was approximately , including angular positioning, stabilisation, and depth-frame acquisition at each programmed position. Once the scanning sequence was complete, the acquired data were processed and the resulting point cloud was transmitted to the primary application, as illustrated in Figure 12.
This control architecture transformed a sequence of independent local captures into an ordered dataset in which each point cloud was unambiguously associated with a known angular position, providing the necessary input for geometric reconstruction.
3.4. Calibration and Global Reconstruction Model
Once the mechanical, electronic, and control subsystems had been defined, a geometric model was developed to transform the synchronised encoder positions and sensor captures into point clouds expressed in a common reference frame. Since the device incorporates two TrueDepth sensors, this model had to account for both the intrinsic calibration of each sensor and the extrinsic calibration of the overall system.
Apple does not publish metrological intrinsic parameters for the TrueDepth sensor. The intrinsic parameters used in this work were those estimated initially by the Record3D application, since they are computed by Apple’s internal calibration pipeline and are not independently verifiable. Their influence on the final reconstructed geometry is partially absorbed by the extrinsic calibration procedure; however, any residual intrinsic error constitutes and unquantified uncertainty contributor, as acknowledged in Section 4.4.
The extrinsic calibration determines the transformation required to express the point clouds captured by each sensor in a common global reference frame. This requires establishing both the pose of each sensor relative to the scanning axis and the angular position of that axis at the instant of each capture. For this purpose, a hemispherical reference artefact of known radius, previously measured using a coordinate measuring machine, was employed, as shown in Figure 10a.
The artefact was scanned with the developed system at 36 angular positions distributed over to . At interval, the encoder feedback value and the point clouds from both sensors were recorded. Based on these data, the extrinsic calibration for each sensor was determined as a rotation matrix and a translation vector relating the local sensor frame to a global coordinate system OXYZ centred at the centre of the hemisphere, with the Z axis directed vertically upward and the Y axis aligned with the angular direction of the first capture.
The calibration procedure was carried out in four stages. First, for each point cloud acquired at position , the centre of the best-fit hemisphere was determined in local sensor coordinates by least-squares fitting. Second, the set of centres was used to estimate the best-fit plane of the rotational sweep, characterised by its centroid and normal vector n. Third, the centres were projected onto this plane and fitted to a circle whose centre C was determined; together with n, this defined the scanning axis in the local sensor frame. Fourth, a rotation matrix R was computed to align n with the unit vector , thereby aligning the local Z axis with the global Z axis.
The adopted strategy is conceptually related to the calibration framework proposed by Liu et al. [15], in which feature-point trajectories are analysed to determine both the direction vector and a point on the rotation axis; the present implementation on hemisphere centroids rather than checkerboard corner points, thereby avoiding the need for a translation stage. Ha et al. [16] applied a comparable approach in a line-laser rotating system, identifying the rotation axis from the circular arc traced by the camera origin and refining the result through non-linear optimisation.
Once this transformation had been obtained for each sensor, the local point clouds could be translated and rotated into the common global frame. The relative transformation between the two sensors was thereby implicitly determined through their respective calibrations to the common global frame, rather than through direct sensor-to-sensor calibration. The angular motion of the scanning axis was additionally compensated through a rotation about the global Z axis corresponding to the encoder feedback value at each capture. In this way, all successive captures from both sensors were expressed in a single coordinate system, providing the geometric foundation for cranial vault surface reconstruction.
To further refine the reconstructed head geometry, the point clouds obtained after acquisition were processed through statistical outlier removal (6 neighbours, ), followed by an iterative closest point (ICP) registration (correspondence threshold of ) for alignment, and subsequent mesh smoothing using Taubin filtering (, , 10 iterations) and Laplacian smoothing (3 iterations) to reduce noise and improve surface continuity.
4. System Validation
4.1. Reference Scanner and Test Artefacts
Reference scans were acquired using a FreeScan Combo Series scanner (SHINING 3D, Hangzhou, China), a professional handheld metrology scanner capable of operating in blue laser or infrared structured-light mode. The blue laser mode was selected for all reference acquisitions, this being the mode designated by the manufacturer as the metrology-grade configuration of the system, with a stated accuracy of , as verified against VDI/VDE 2634 [30] and ISO 10360 [31] standards in an accredited laboratory. The main technical parameters of this operating mode are summarised in Table 2.
Table 2.
Technical parameters of the FreeScan Combo Series scanner in blue laser mode.
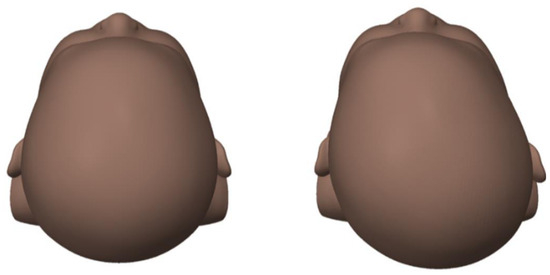
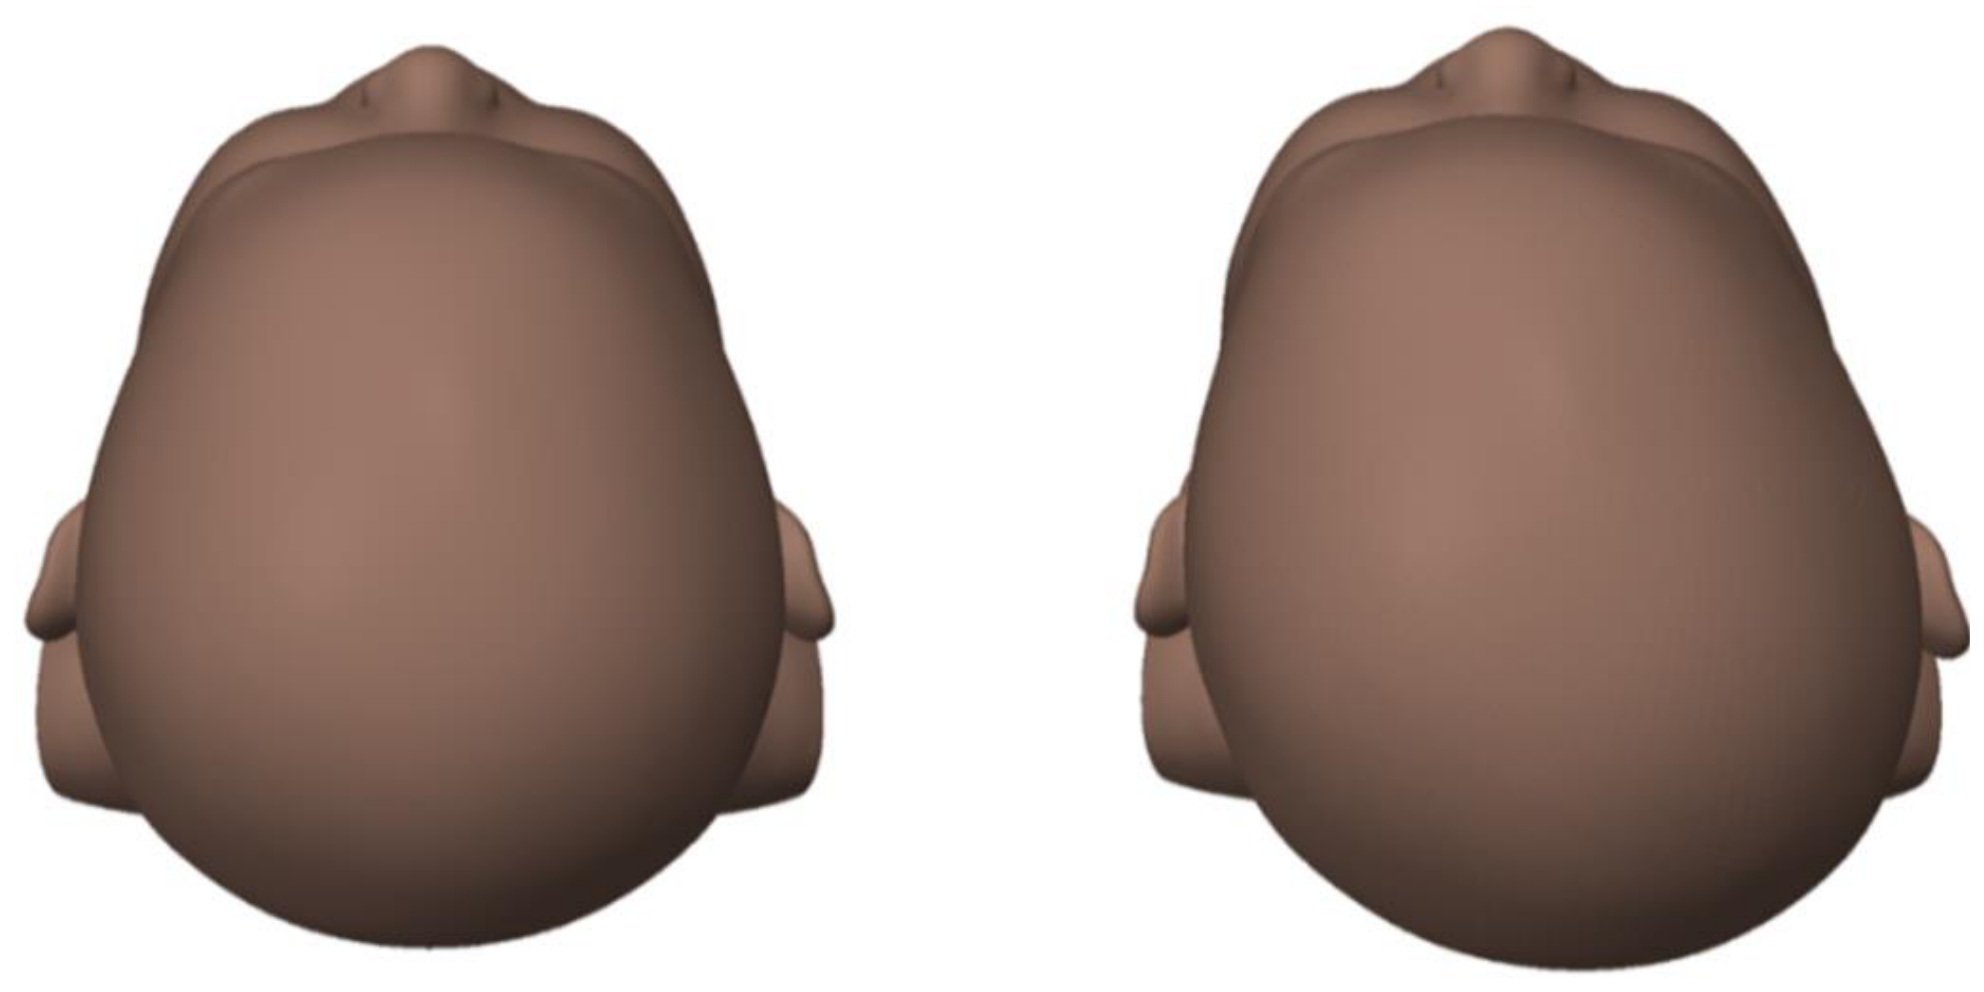
Two physical cranial phantoms were used as test artefacts. The first was the symmetric phantom introduced in Section 2.4 (Figure 4). The second (CFA) incorporated a controlled asymmetry to evaluate the ability of the system to preserve non-ideal cranial geometry. The asymmetry was introduced in Blender (Blender Foundation, Amsterdam, The Netherlands) by applying a spatially weighted deformation, using inverse-square distance weighting, to the posterior cranial region, thereby generating a localized displacement of the right occipital area consistent with the morphological characteristics of positional plagiocephaly, as shown in Figure 13.
Figure 13.
Symmetric (CFS, (left)) and asymmetric (CFA, (right)) cranial phantoms used for validation.
The use of sanded and painted PLA phantoms was intended to provide stable and repeatable test artefacts for isolating the geometric performance of the proposed measurement system. This choice allowed the influence of sensing geometry, calibration, registration, and reconstruction to be evaluated without additional variability from biological surface properties. However, it also represents an idealized acquisition scenario. Hair, skin reflectance, involuntary subject motion, and other clinical factors were not reproduced in the present experiments and therefore remain outside the scope of this validation.
4.2. Geometric Validation
Each phantom was digitized independently with both the reference scanner and the proposed system under equivalent acquisition conditions, yielding one reference mesh and one system point cloud per phantom. The point cloud captured with the reference scanner was processed using the scanner’s built-in meshing pipeline to generate a triangular surface mesh, which served as the reference geometry for subsequent comparison. The point cloud obtained with the proposed device was imported into Geomagic Studio 13 (3D Systems, Rock Hill, SC, USA), processed with an outlier filter, and compared against the corresponding reference mesh using the global best-fit alignment (iterative closest point) function in Geomagic Studio. Surface deviation maps and summary statistics were extracted from the resulting comparison.
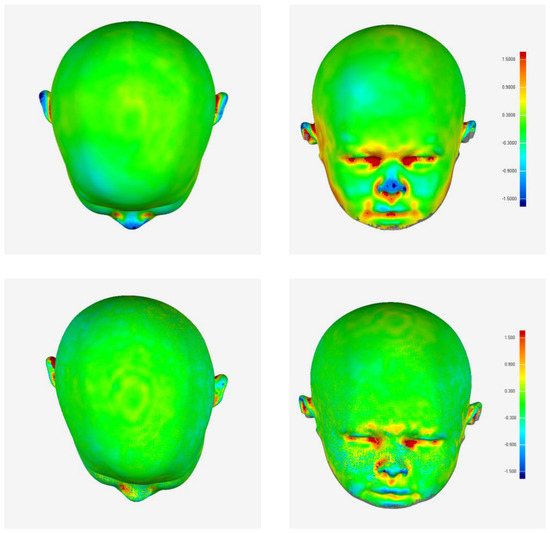
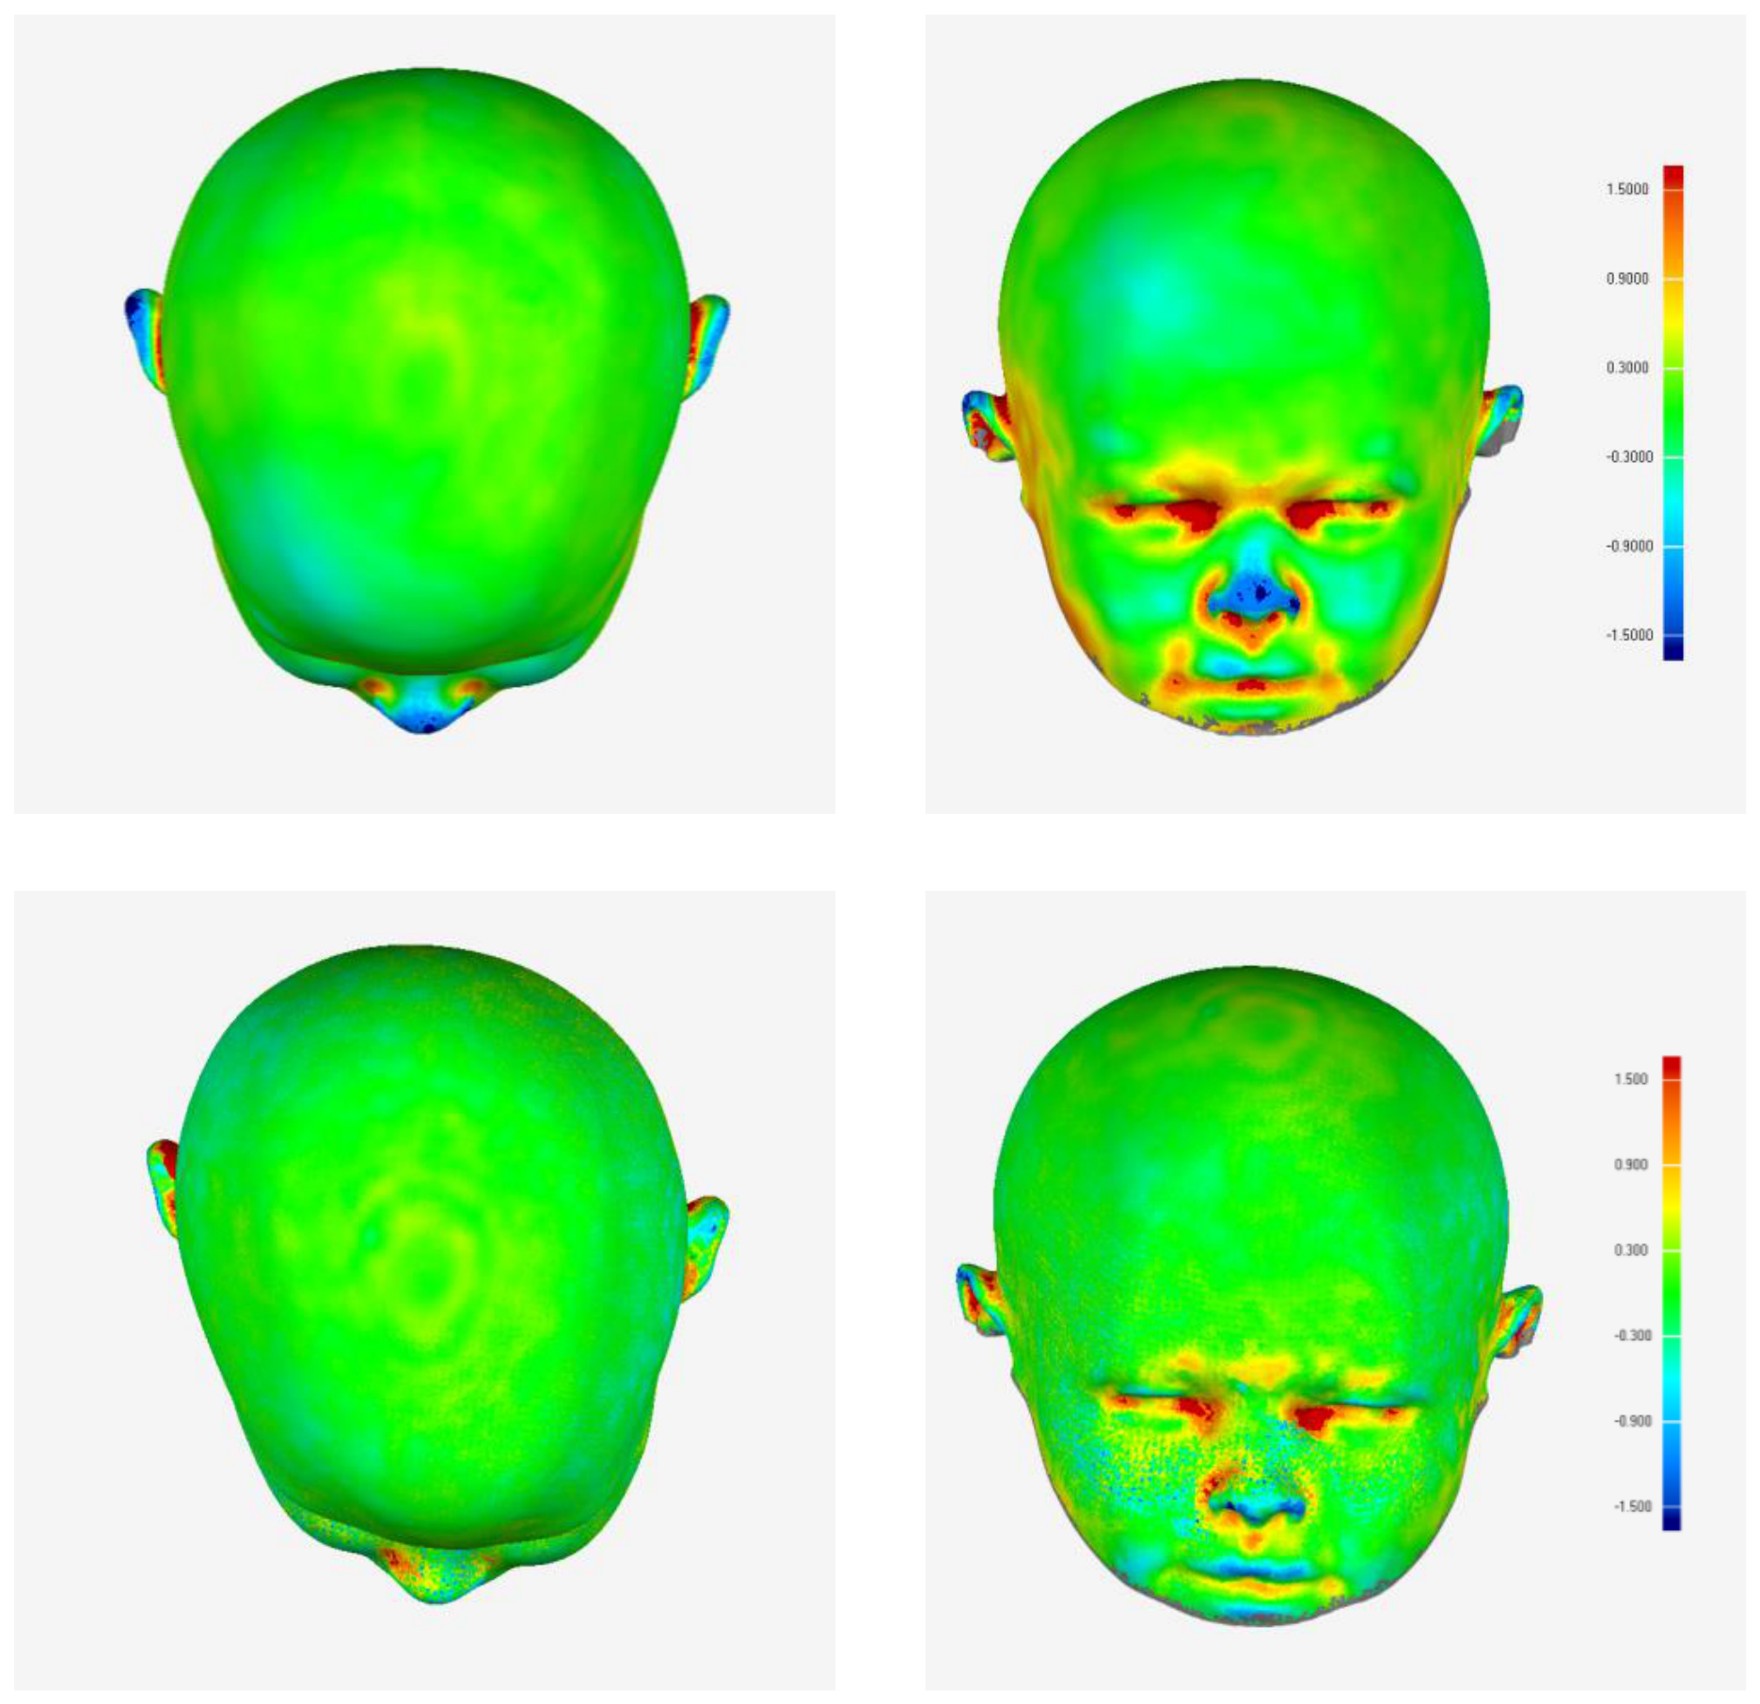
The deviation maps obtained for both phantoms are shown in Figure 14. In both cases, the cranial vault remained largely within the central tolerance band, indicating good overall geometric agreement over the primary region of interest, as quantified in Table 3.
Figure 14.
Surface deviation () maps for CFS (top) and CFA (bottom), shown in frontal and lateral views.
Table 3.
Surface deviation statistics for both cranial phantoms.
The spatial distribution of the deviations suggests that the main limitations of the proposed system are associated with local geometric complexity rather than with a global reconstruction bias. Deviations over the cranial vault were notably smaller than those in facial regions as discussed below. The largest discrepancies were concentrated in regions such as the ears, periocular area, nasal region, and lower facial contour. These areas combine high local curvature, steep incidence angles, partial self-occlusions, and reduced visibility from some viewpoints, all of which can decrease the effective density and reliability of the TrueDepth point cloud. In addition, local registration errors may arise in regions with limited overlap between adjacent captures, and post-processing operations may affect the preservation of fine anatomical features. In particular, the outlier filtering step applied during reconstruction (Section 3.4) may locally influence sparse or highly variable surface measurements. Consequently, the elevated deviations observed in facial areas are more likely associated with acquisition and registration limitations (such as reduced overlap, occlusions, and increased geometric complexity) than with systematic loss of geometric detail during post-processing. These combined effects define the effective spatial resolution limit of the system and support restricting its primary application to cranial vault morphometry rather than high-resolution facial reconstruction. The summary statistics are given in Table 3.
The RMS deviations were and for CFS and CFA, respectively. The extreme positive and negative values are localised in the anatomically complex facial regions identified above and do not reflect the quality of reconstruction over the cranial vault, which is the primary surface of interest for head shape assessment. These results indicate that the proposed system reproduces the overall cranial geometry with good consistency under controlled laboratory conditions.
The RMS deviations reported in Table 3 should be interpreted as system-level agreement with the reference scanner under controlled laboratory conditions, not as an expanded uncertainty budget. A formal uncertainty evaluation would additionally require characterization of repeatability, reference scanner uncertainty, and phantom stability, which are outside the scope of the present study.
4.3. Morphometric Validation
Morphometric validation was carried out using the cranial vault asymmetry index (CVAI) [32], a descriptor computed from the difference between two diagonal cranial dimensions. For each point cloud, a cranial reference coordinate system was first defined from three anatomical landmarks manually identified on the model: the left and right tragus and the sellion. These landmarks were used to construct a reference plane (level 0) and an associated coordinate system in which the Y axis was defined by the line joining the sellion and the midpoint between both tragi, the X axis as the in-plane perpendicular through that midpoint, and the Z axis as the normal to the reference plane. CVAI was then computed according to Equation (1) as the normalised difference between the two cranial diagonals and , measured at with respect to the midsagittal plane at each evaluation level:
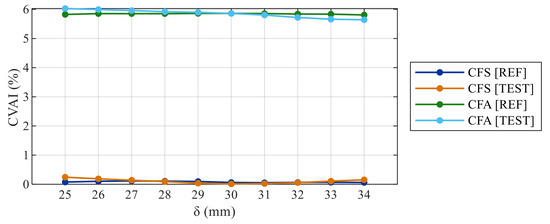
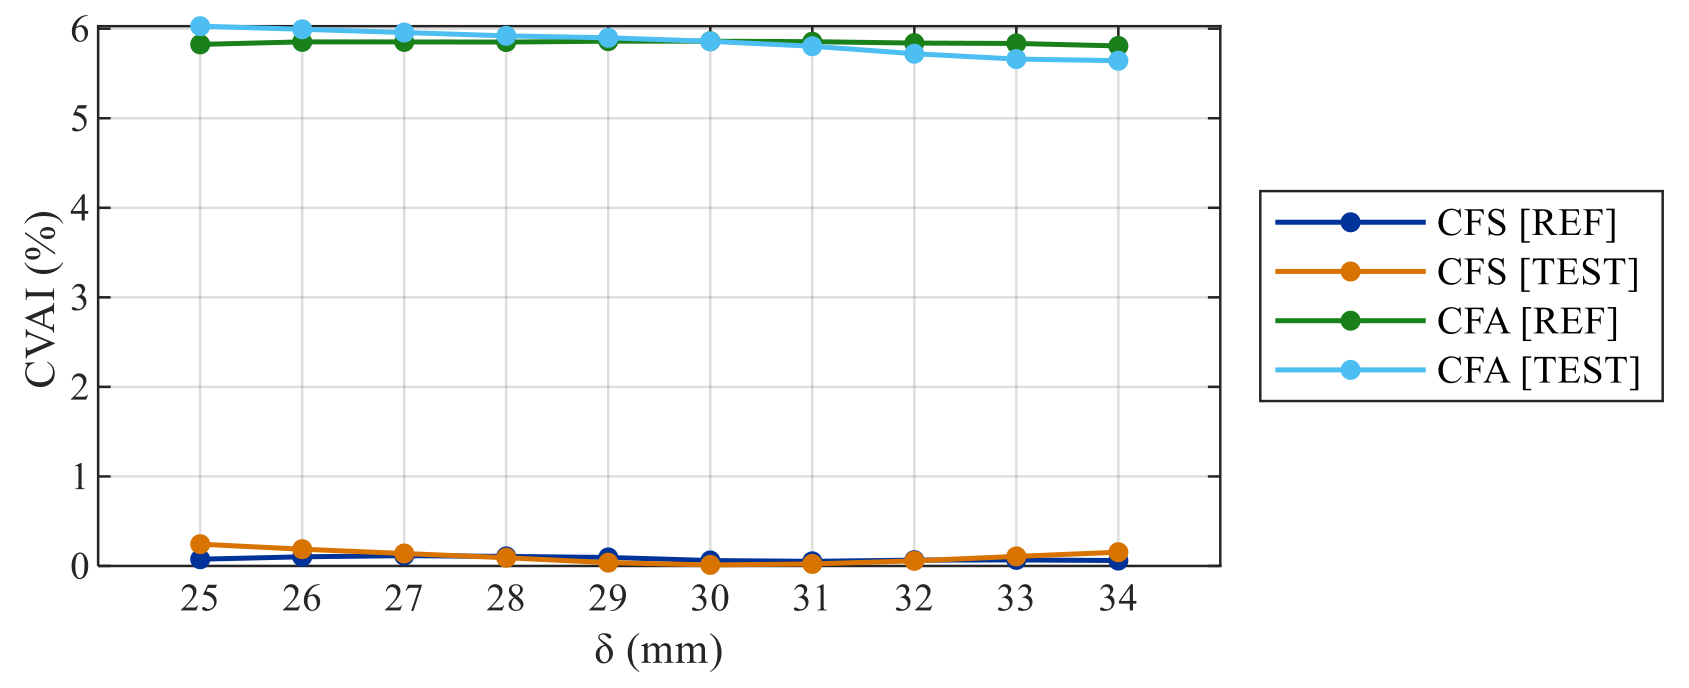
Since the cranial surface was available as a complete three-dimensional point cloud, CVAI was evaluated at successive horizontal planes separated by 1 mm along the Z axis. To avoid the influence of the ear contours, the first measurement plane was located with a offset () above level 0 (XY reference plane), and the evaluation was restricted to ten consecutive planes above that offset, corresponding to the lower cranial region where cranial asymmetry is commonly evaluated in clinical practice. CVAI was therefore computed for both CFS and CFA as a function of the offset . The resulting curves are shown in Figure 15.
Figure 15.
CVAI as a function of measurement plane offset for CFS and CFA phantoms, comparing reference and test acquisitions.
The curves obtained from the reference and test acquisitions followed the same general trend for both phantoms. For CFS, CVAI remained close to zero across the full evaluation range in both acquisitions, consistent with the nominally symmetric geometry. For CFA, both acquisitions captured the elevated and stable asymmetry introduced by the controlled deformation. Across all measurement planes and both phantoms, the mean difference in CVAI between reference and test acquisitions was %, with a standard deviation of % and a maximum of .
4.4. Practical Considerations for Clinical Translation
The present validation was performed under controlled laboratory conditions using static cranial phantoms. This design was selected to isolate the geometric performance of the sensing, calibration, and reconstruction pipeline. Motion artefacts are therefore absent from the reported geometric and morphometric results.
The sanded and painted PLA phantoms provided stable and repeatable surfaces; as noted in Section 4.1, they do not reproduce hair, skin reflectance, involuntary motion, or other clinical acquisition factors. Regarding illumination, the effect of ambient lighting on sensor performance was characterised at the sensor level in Section 2.3 using planar and hemispherical artefacts. However, the robustness of the complete system under varying clinical lighting conditions (including direct sunlight or other infrared sources) was not evaluated in the present validation and should be addressed in future work.
The distance should be interpreted as the nominal design stand-off distance of the prototype, not as a universal optimum. Although the mechanical architecture constrains this distance more effectively than a handheld workflow, a dedicated sensitivity analysis around this nominal value will be required to quantify the tolerance of the system to subject positioning errors or to variations in head size. Based on the characterization results of Section 2.2, a deviation from the nominal distance is expected to remain within the reliable operating range; however, the system-level impact of such deviations on reconstruction accuracy has not been quantified and will be addressed in future work.
The 24-frame sequence was adequate for static phantom acquisition, but clinical use (particularly with infant subjects, who represent the primary target population of the proposed system) would require evaluation under dynamic conditions. In a real acquisition scenario, involuntary head motion during the sequential scan could modify the relative pose between the subject and the calibrated sensor trajectory, potentially producing inconsistencies between successive point clouds. This effect cannot be quantified from the static phantom experiments. Future work will therefore extend the validation using a controlled infant-head motion emulator, allowing known motion patterns to be imposed during acquisition and their effect on reconstruction accuracy to be assessed. This platform will also enable the evaluation of shorter acquisition protocols, frame-quality assessment, motion detection, and motion-compensated registration strategies.
A full expanded uncertainty budget was not established in the present prototype validation. The following uncertainty contributors have been identified but not individually quantified: sensor depth noise, variability in stand-off distance, sensitivity to surface incidence angle, angular positioning, extrinsic calibration, multi-view registration, post-processing, reference scanner uncertainty, and phantom surface preparation. Future work will include repeated acquisitions and uncertainty propagation to quantify the contribution of each source.
5. Conclusions
This work has presented the development and validation of an automated three-dimensional scanning device based on consumer-grade depth sensors mounted on a controlled rotary architecture, approaching cranial digitization as a dimensional measurement problem in which sensing, acquisition geometry, and calibration were treated as coupled design decisions. The main contribution is the integration of consumer depth sensors into a dedicated mechatronic measurement system. Unlike existing smartphone-based approaches, the system design was driven by metrological constraints established through systematic sensor characterization.
The characterisation stage confirmed that sensor performance depends on the relative orientation between the scanned surface and the sensor, with a broadly similar sensitivity pattern in the horizontal and vertical directions and a reliable operating window of around the surface normal. A subsequent coverage analysis on a head model, combining a dense exploratory sweep with quantitative assessment of point cloud completeness, led to the specification of a dual-sensor configuration with inclination angles of and , mounted in opposed arrangement and rotated through 12 positions over yielding 24 point clouds. Together with the working distance established in Section 2.2, these results provided the complete geometric basis for system design.
The implemented system comprises a mechanical structure, electronic architecture, encoder-synchronised acquisition, and an extrinsic calibration procedure based on a hemispherical reference artefact. This calibration strategy enables the point clouds captured by both sensors at successive angular positions to be expressed in a common global coordinate system, providing the geometric consistency required for complete cranial vault surface reconstruction.
Validation against a professional reference scanner showed that the largest discrepancies were localised in anatomically complex regions (the ears, periocular area, nasal region, and lower facial contour) whereas the cranial vault exhibited substantially better agreement, with RMS deviations of and for the symmetric and asymmetric phantoms respectively. The CVAI analysis showed that morphometric trends derived from both systems were consistent, with a maximum difference of , well below the clinical thresholds used for plagiocephaly classification. Taken together, these results demonstrate that the proposed system is capable of geometrically consistent and morphometrically reliable three-dimensional head reconstruction under controlled laboratory conditions.
Several aspects remain open to future work. The validation should be strengthened by a dedicated uncertainty analysis, expanded to additional artefacts of known geometry, and ultimately extended to measurements on real subjects under controlled conditions. These steps will provide a more complete characterization of system performance and inform the pathway towards potential clinical application.
Supplementary Materials
The following supporting information can be downloaded at: https://www.mdpi.com/article/10.3390/machines14060643/s1. Video S1: Exploratory sweep.mp4.
Author Contributions
Conceptualization, J.Á. and D.B.; methodology, J.Á. and N.B.; software, J.Á. and A.F.; validation, P.F., P.Z. and N.B.; formal analysis, J.Á.; investigation, J.Á. and A.F.; resources, D.B.; data curation, P.F.; writing—original draft preparation, D.B. and J.Á.; writing—review and editing, P.Z.; visualization, J.Á.; supervision, P.Z.; project administration, D.B.; funding acquisition, N.B. All authors have read and agreed to the published version of the manuscript.
Funding
This work has been funded by the Council of Gijón through the University Institute of Industrial Technology of Asturias (Ref. IUTA-24-GIJON-1–19), as well as by the Government of the Principality of Asturias through the “Severo Ochoa” Programme of predoctoral grants for research and teaching (BP21-043), and the “Programa Investigo Asturias 2025” (NAC-AT-PUB-ASV-2026-INVESTIGO-6).
Data Availability Statement
The authors will make the raw data on which the conclusions of this article are based available upon request.
Acknowledgments
During the preparation of this manuscript, the authors used ChatGPT-5 and Sonnet 4.6 for English text generation. The authors reviewed and edited the output and take full responsibility for the content of this publication.
Conflicts of Interest
The authors declare no conflicts of interest. The funders had no role in the design of the study; in the collection, analyses, or interpretation of data; in the writing of the manuscript; or in the decision to publish the results.
Abbreviations
The following abbreviations are used in this manuscript:
| CFA | Asymmetric cranial phantom |
| CFS | Symmetric cranial phantom |
| CVAI | Cranial vault asymmetry index |
| RGB-D | Red-green-blue depth |
| RMS | Root mean square |
References
- Gao, W.; Haitjema, H.; Fang, F.Z.; Leach, R.K.; Cheung, C.F.; Savio, E.; Linares, J.M. On-Machine and in-Process Surface Metrology for Precision Manufacturing. CIRP Ann. 2019, 68, 843–866. [Google Scholar] [CrossRef] [Scilit]
- Marrugo, A.G.; Gao, F.; Zhang, S. State-of-the-Art Active Optical Techniques for Three-Dimensional Surface Metrology: A Review [Invited]. J. Opt. Soc. Am. A 2020, 37, B60. [Google Scholar] [CrossRef] [Scilit]
- Delasse, C.; Lafkiri, H.; Hajji, R.; Rached, I.; Landes, T. Indoor 3D Reconstruction of Buildings via Azure Kinect RGB-D Camera. Sensors 2022, 22, 9222. [Google Scholar] [CrossRef] [Scilit] [PubMed]
- Teppati Losè, L.; Spreafico, A.; Chiabrando, F.; Giulio Tonolo, F. Apple LiDAR Sensor for 3D Surveying: Tests and Results in the Cultural Heritage Domain. Remote Sens. 2022, 14, 4157. [Google Scholar] [CrossRef] [Scilit]
- Vogt, M.; Rips, A.; Emmelmann, C. Comparison of iPad Pro®’s LiDAR and TrueDepth Capabilities with an Industrial 3D Scanning Solution. Technologies 2021, 9, 25. [Google Scholar] [CrossRef] [Scilit]
- Beltrán, N.; Álvarez, J.; Fernández, A.; Álvarez, B.J.; Blanco, D. Performance Analysis of Apple’s TrueDepth Sensor for Surface Reconstruction of Regular Geometries across Varying Stand-off Distances. Int. J. Adv. Manuf. Technol. 2025, 143, s00170-025-15968-z. [Google Scholar] [CrossRef] [Scilit]
- Nissen, L.; Hübner, J.; Klinker, J.; Kapsecker, M.; Leube, A.; Schneckenburger, M.; Jonas, S.M. Towards Preventing Gaps in Health Care Systems through Smartphone Use: Analysis of ARKit for Accurate Measurement of Facial Distances in Different Angles. Sensors 2023, 23, 4486. [Google Scholar] [CrossRef] [Scilit] [PubMed]
- Jang, M.; Lee, S.; Kang, J.; Lee, S. Technical Consideration towards Robust 3D Reconstruction with Multi-View Active Stereo Sensors. Sensors 2022, 22, 4142. [Google Scholar] [CrossRef] [Scilit]
- Wang, C.-W.; Peng, C.-C. 3D Face Point Cloud Reconstruction and Recognition Using Depth Sensor. Sensors 2021, 21, 2587. [Google Scholar] [CrossRef] [Scilit] [PubMed]
- Liu, C.; Artopoulos, A. Validation of a Low-Cost Portable 3-Dimensional Face Scanner. Imaging Sci. Dent. 2019, 49, 35. [Google Scholar] [CrossRef] [Scilit]
- Guo, X.; Jiang, G.; Cui, Z.; Tao, P. Homography-Based Block Motion Estimation for Video Coding of PTZ Cameras. J. Vis. Commun. Image Represent. 2016, 39, 164–171. [Google Scholar] [CrossRef] [Scilit]
- Su, P.-C.; Shen, J.; Xu, W.; Cheung, S.-C.; Luo, Y. A Fast and Robust Extrinsic Calibration for RGB-D Camera Networks. Sensors 2018, 18, 235. [Google Scholar] [CrossRef] [Scilit] [PubMed]
- Perez-Yus, A.; Fernandez-Moral, E.; Lopez-Nicolas, G.; Guerrero, J.J.; Rives, P. Extrinsic Calibration of Multiple RGB-D Cameras From Line Observations. IEEE Robot. Autom. Lett. 2018, 3, 273–280. [Google Scholar] [CrossRef] [Scilit]
- Bisogni, L.; Mollaiyan, R.; Pettinari, M.; Neri, P.; Gabiccini, M. Automatic Calibration of a Two-Axis Rotary Table for 3D Scanning Purposes. Sensors 2020, 20, 7107. [Google Scholar] [CrossRef] [Scilit] [PubMed]
- Liu, C.; Fu, X.; Duan, F.; Li, T.; Li, J.; Wang, R. A Novel Method to Calibrate the Rotation Axis of a Line-Structured Light 3-Dimensional Measurement System. Opt. Lasers Eng. 2023, 164, 107524. [Google Scholar] [CrossRef] [Scilit]
- Ha, V.-T.; Do, V.-P.; Lee, B.-R. Calibration Method of a Three-Dimensional Scanner Based on a Line Laser Projector and a Camera with 1-Axis Rotating Mechanism. Opt. Eng. 2024, 63, 033101. [Google Scholar] [CrossRef] [Scilit]
- Dai, H.; Pears, N.; Smith, W.; Duncan, C. Statistical Modeling of Craniofacial Shape and Texture. Int. J. Comput. Vis. 2020, 128, 547–571. [Google Scholar] [CrossRef] [Scilit]
- Ploumpis, S.; Ververas, E.; Sullivan, E.O.; Moschoglou, S.; Wang, H.; Pears, N.; Smith, W.A.P.; Gecer, B.; Zafeiriou, S. Towards a Complete 3D Morphable Model of the Human Head. IEEE Trans. Pattern Anal. Mach. Intell. 2021, 43, 4142–4160. [Google Scholar] [CrossRef] [Scilit]
- Barbero-García, I.; Lerma, J.L.; Marqués-Mateu, Á.; Miranda, P. Low-Cost Smartphone-Based Photogrammetry for the Analysis of Cranial Deformation in Infants. World Neurosurg. 2017, 102, 545–554. [Google Scholar] [CrossRef] [Scilit]
- Barbero-García, I.; Pierdicca, R.; Paolanti, M.; Felicetti, A.; Lerma, J.L. Combining Machine Learning and Close-Range Photogrammetry for Infant’s Head 3D Measurement: A Smartphone-Based Solution. Measurement 2021, 182, 109686. [Google Scholar] [CrossRef] [Scilit]
- Quispe-Enriquez, O.C.; Valero-Lanzuela, J.J.; Lerma, J.L. Craniofacial 3D Morphometric Analysis with Smartphone-Based Photogrammetry. Sensors 2023, 24, 230. [Google Scholar] [CrossRef] [Scilit] [PubMed]
- Hung, P.K.; Liu, J.; Shan, Z. 3D Photogrammetry-Driven Craniofacial Analysis in Orthodontics: A Scoping Review of Recent Applications. Bioengineering 2025, 12, 1263. [Google Scholar] [CrossRef] [Scilit]
- De Jong, G.; Bijlsma, E.; Meulstee, J.; Wennen, M.; Van Lindert, E.; Maal, T.; Aquarius, R.; Delye, H. Combining Deep Learning with 3D Stereophotogrammetry for Craniosynostosis Diagnosis. Sci. Rep. 2020, 10, 15346. [Google Scholar] [CrossRef] [Scilit]
- Barone, S.; Antonelli, A.; Salviati, M.; Greco, V.; Bennardo, F.; Becker, K.; Giudice, A.; Simeone, M. Accuracy Assessment of EM3D App-Based 3D Facial Scanning Compared to Cone Beam Computed Tomography. Dent. J. 2024, 12, 342. [Google Scholar] [CrossRef] [Scilit]
- Tangthaweesuk, N.; Raocharernporn, S. The Accuracy of Three-Dimensional Facial Scan Obtained from Three Different 3d Scanners. PLoS ONE 2025, 20, e0322358. [Google Scholar] [CrossRef] [Scilit]
- Chong, Y.; Xiao, Y.; Li, Z.; Huang, J.; Yu, N.; Ting, W.; Liu, H.; Long, X. Introduction and Validation of an Automatic and Low-Cost Three-Dimensional Facial Imaging System: A Comparison to Direct Anthropometry and Vectra H1. Quant. Imaging Med. Surg. 2023, 13, 2922–2932. [Google Scholar] [CrossRef] [Scilit]
- Andrews, J.; Alwafi, A.; Bichu, Y.M.; Pliska, B.T.; Mostafa, N.; Zou, B. Validation of Three-Dimensional Facial Imaging Captured with Smartphone-Based Photogrammetry Application in Comparison to Stereophotogrammetry System. Heliyon 2023, 9, e15834. [Google Scholar] [CrossRef] [Scilit]
- Rivera, J.; Salinas, P. AutoScan3D: A Low-Cost, Portable Photogrammetry System for Automated 3D Digitization of Anatomical Specimens. PLoS ONE 2025, 20, e0336996. [Google Scholar] [CrossRef] [Scilit]
- Petrides, G.; Clark, J.R.; Low, H.; Lovell, N.; Eviston, T.J. Three-Dimensional Scanners for Soft-Tissue Facial Assessment in Clinical Practice. J. Plast. Reconstr. Aesthetic Surg. 2021, 74, 605–614. [Google Scholar] [CrossRef] [Scilit] [PubMed]
- VDI/VDE 2634 Part 2; Optical 3D Measuring Systems—Optical Systems Based on Area Scanning. Verein Deutscher Ingenieure (VDI/VDE): Düsseldorf, Germany, 2012.
- ISO 10360-8; Geometrical Product Specifications (GPS)—Acceptance and Reverification Tests for Coordinate Measuring Systems (CMS)—Part 8: CMMs with Optical Distance Sensors. International Organization for Standardization: Geneva, Switzerland, 2013.
- Pastor-Pons, I.; Lucha-López, M.O.; Barrau-Lalmolda, M.; Rodes-Pastor, I.; Rodríguez-Fernández, Á.L.; Hidalgo-García, C.; Tricás-Moreno, J.M. Interrater and Intrarater Reliability of Cranial Anthropometric Measurements in Infants with Positional Plagiocephaly. Children 2020, 7, 306. [Google Scholar] [CrossRef] [Scilit] [PubMed]

Disclaimer/Publisher’s Note: The statements, opinions and data contained in all publications are solely those of the individual author(s) and contributor(s) and not of MDPI and/or the editor(s). MDPI and/or the editor(s) disclaim responsibility for any injury to people or property resulting from any ideas, methods, instructions or products referred to in the content. |
© 2026 by the authors. Licensee MDPI, Basel, Switzerland. This article is an open access article distributed under the terms and conditions of the Creative Commons Attribution (CC BY) license.