


Abstract
Using dissolved gas analysis (DGA) to diagnose faults in power transformers is essential for preventing major failures and improving the reliability of power systems. This paper proposes a diagnostic framework based on the Duval Pentagon Combined Complex (DPCC). This framework integrates the areas of Duval Pentagons 1 and 2, along with the electric arc and paper charring subregions, into one geometric structure. This results in 16 distinct defect regions. A physically consistent dataset was generated, respecting the relative proportions of the five key gases (H2, CH4, C2H6, C2H4, and C2H2) and the typical concentration ranges in ppm reported in the literature. Four machine learning (ML) classifiers were trained using this dataset: Neural Network (NN), Fine Gaussian Support Vector Machine (SVM), Weighted K-Nearest Neighbors (KNN) and Bagged Trees Ensemble. Cross-validation results indicate high performance for all analyzed models. The Wide NN classifier had an overall accuracy of 96.53%. The Fine Gaussian SVM reached 96.07%. The Bagged Trees Ensemble achieved 96.26%. The Weighted KNN had an accuracy of 95.74%. The area under the curve (AUC) values were close to 1 for most classes, confirming the regions defined by DPCC were highly separable. Compared with conventional ML-based methods relying on individual classifiers and standard geometric representations, the proposed method provides more accurate defect separation, increased robustness in transition regions, and improved stability of the diagnostic decision. The integration of the DPCC representation with a weighted probabilistic ensemble framework reduces ambiguities between classes and enables more accurate identification of defects associated with electric arcs and insulation paper carbonization. To improve the robustness of the classification in transition zones, we implemented a Weighted Probabilistic Ensemble framework, in which each model’s contribution is proportional to its validation accuracy. This strategy minimizes the impact of geometrical ambiguity on the decision and provides a more reliable defect type estimate. The proposed methodology demonstrates that combining DPCC geometric modeling with modern ML techniques allows for the development of a robust, automated diagnostic system suitable for power transformer monitoring and predictive maintenance applications.
1. Introduction
Transformers are essential components of the power infrastructure. They ensure the efficient and safe transfer of electrical energy between different voltage levels.
Due to the growing demand for electricity, the emergence of renewable energy sources and electric vehicles, the growth of data centers, and the impact of climate change, the structure of electrical grids has become increasingly complex, and the number of power transformers has increased. All of this underscores the importance of maintaining power transformers reliably and employing the most effective strategies for monitoring and maintaining these assets. This ensures the continuous and reliable operation of each country’s entire power system [1,2].
The efficiency of the power system is closely linked to the reliability of power transformers. These transformers directly influence the continuity of electricity generation, transmission, and distribution, as well as the maintenance and operational costs for grid operators. Internal faults caused by thermal, electrical, and chemical phenomena can accelerate the degradation of the mixed oil–paper insulation system. In extreme cases, these faults can result in catastrophic failure. For this reason, accurately and thoroughly monitoring and diagnosing transformers’ operating conditions is a top priority. This enables the implementation of measures that protect, operate, and optimize maintenance, resulting in economic and energy efficiency gains [3].
Condition monitoring of transformers is no longer limited to corrective actions. Instead, it aims to identify degradation mechanisms at an early stage [4]. Dissolved gas analysis (DGA) is one of the most important, cost-effective, and widely applicable diagnostic testing techniques for evaluating the operational condition of oil-immersed power transformers [5,6].
Characteristic gases (hydrogen (H2), methane (CH4), ethane (C2H6), ethylene (C2H4), acetylene (C2H2), and carbon oxides, such as carbon monoxide (CO) and carbon dioxide (CO2)) are generated inside an operating transformer through the decomposition of mineral oil and solid insulation due to thermal, electrical, and chemical stresses. Analyzing the concentrations of these gases makes it possible to identify defects before they escalate into major failures. Although traditional DGA interpretation methods such as Key Gas, IEC reports, Rogers, and Doernerburg are widely used [7,8], they have several limitations. These limitations include ambiguity, low sensitivity to early-stage defects, difficulty identifying multiple defects, conflicting results between different methods, and reliance on expert experience [9].
To overcome the limitations of traditional methods, Michel Duval developed advanced graphical techniques, including Duval Triangles [10,11] and Duval Pentagons [12].
The Duval Pentagons Method is an extension of traditional analysis that utilizes five combustible gases (H2, C2H6, CH4, C2H4, and C2H2) in a pentagonal configuration. These gases are arranged trigonometrically and according to their production energy in transformers, from H2 to C2H2. Specific defect zones were delineated within these pentagons, including partial discharges (PD), low energy (D1) and high energy (D2) electrical discharges, thermal defects (T1, T2, and T3), dispersed oil gases (S), overheating (O), thermal defects with paper charring (C), and thermal defects in oil only (T3-H), which are specific to Pentagon 1 (P1) and Pentagon 2 (P2), respectively. These pentagons have a flaw that can be identified by the position of the centroid of the polygon formed by the percentage concentrations of the five gases. Versions P1 and P2 not only allow for the classification of thermal defects, but also for the identification of the degree of solid insulation degradation, especially in cases of paper charring. These factors are crucial for evaluating the severity of the defect and determining the transformer’s remaining service life [12,13].
The separate use of the two pentagons complicates their integration into modern monitoring systems because of their geometric complexity. Consequently, the Combined Duval Pentagon (CDP) [14] was developed. It incorporates the defect zones from P1 and P2 into one geometric structure.
This approach reduces the number of classification regions, simplifies the determination of the centroid, and makes software implementation easier for online monitoring and predictive maintenance applications [15]. This integration allows for a more precise distinction between thermal defects that affect oil and those that cause irreversible paper degradation. It also enables the identification of defects in cases where they overlap.
In recent years, artificial intelligence (AI) and ML techniques have emerged as effective tools for overcoming the limitations of traditional DGA interpretation methods. Unlike approaches based on fixed rules or graphical representations, modern methods can identify complex nonlinear relationships between gas concentrations and defect types. This improves the accuracy and robustness of diagnoses. The AI and ML techniques considered in this study include NNs, SVM algorithms, random forest and decision tree methods, fuzzy logic, and deep learning models. Hybrid approaches combine Duval’s methods with ML classifiers or artificial intelligence algorithms. Table 1 provides a brief comparative analysis of methods and approaches for diagnosing transformer faults based on DGA as reported in the literature.
Table 1.
A Comparative Review of Transformer Fault Diagnosis Using DGA from the Literature.
A review of the literature indicates that DGA is among the most effective methods for diagnosing transformer faults. Although traditional methods for interpreting dissolved gas analysis are simple and widely used, the integration of artificial intelligence methods and the development of hybrid diagnostic systems are promising avenues of research because they produce more accurate and robust results. Additionally, using IoT technologies and probabilistic methods creates new opportunities for implementing predictive maintenance systems and enhancing the reliability of power grids.
Recent research has highlighted the potential of using artificial intelligence (AI), fuzzy logic, and ML techniques to improve DGA diagnosis accuracy. Artificial NNs, optimized classification algorithms, and fuzzy systems allow for the management of uncertainty and the integration of multiple interpretation methods. These systems also enable the automation of the decision-making process. However, AI-only methods can be computationally intensive and require large training datasets. This is why combining them with established tools, such as the Duval Pentagon, remains a practical and effective approach.
This paper presents a software application that was developed using the DPCC method. The application is designed to diagnose faults in power transformers. Its main objectives are to improve diagnostic methods, reduce analysis and decision-making times, and increase transformer reliability. It also contributes to the development of predictive maintenance strategies based on the advanced interpretation of dissolved gas analysis. The study aimed to develop and evaluate ML-based classifiers capable of identifying transformer defect types. They were trained using a dataset generated with the DPCC method. This method covers the 12 defect zones and four subzones associated with paper charring. The dataset was constructed in a physically consistent manner. This took into account the relative proportions of dissolved gases, as well as the typical concentration ranges (parts per million, or ppm) reported in the literature.
After the comparative evaluation, the individual classifiers demonstrated high performance. Their accuracies ranged from 95.74% (Weighted KNN) to 96.53% (Wide NN). Meanwhile, the Fine Gaussian SVM and the Bagged Trees Ensemble achieved accuracies of 96.07% and 96.26%, respectively. To improve the robustness of the decision, a weighted probabilistic ensemble framework was implemented. In this framework, each classifier’s contribution is proportional to its validation accuracy. We achieved improved classification stability in the transition zones between defects and reduced decision variation in the geometrically ambiguous regions of the DPCC by performing weighted probabilistic aggregation of the four models. The aggregated result demonstrated an overall performance superior to, or at least equivalent to, that of the best individual classifier. There was a noticeable improvement in prediction consistency and the confidence level associated with each classification.
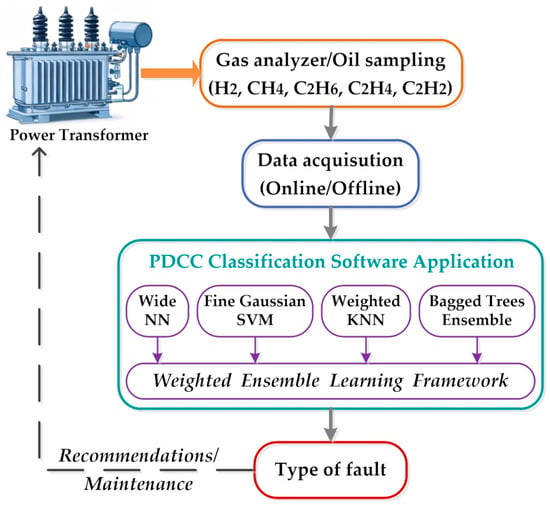
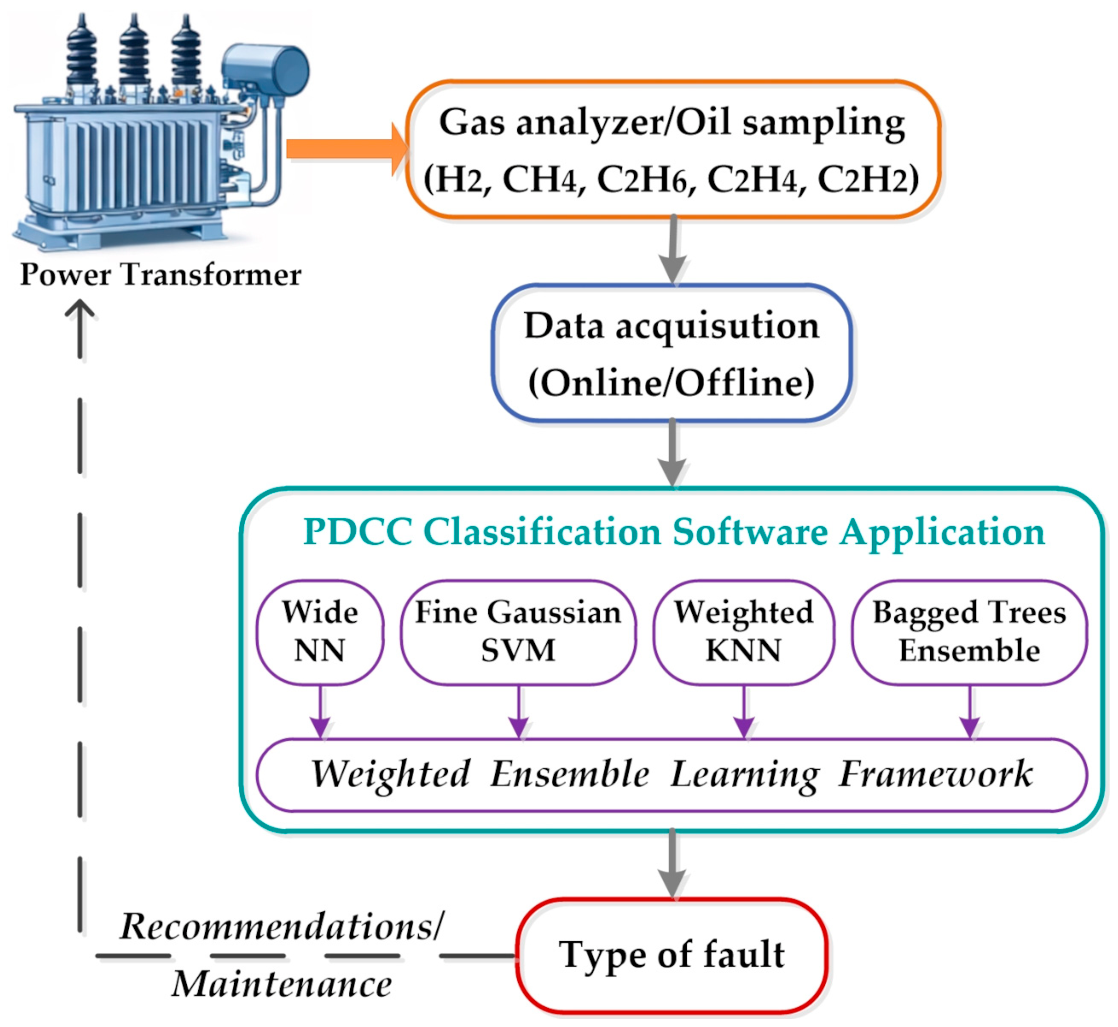
This approach confirms that combining DPCC geometric modeling with a weighted ensemble mechanism yields a more stable, robust, and practical diagnostic system for software applications designed to monitor and perform predictive maintenance on power transformers. Figure 1 illustrates the conceptual framework of the proposed method. The diagram shows how the DPCC geometric model is integrated with multiple ML classifiers and a weighted aggregation mechanism. This results in a unified, automated diagnostic system.
Figure 1.
The conceptual framework of the proposed DPCC-ML-weighted ensemble diagnostic methodology.
Most existing approaches use Duval Pentagon 1 and Duval Pentagon 2 separately, which complicates their implementation within a unified automated monitoring system. In addition, the subzones associated with electric arc defects and insulation paper carbonization are rarely integrated into a single geometric structure. Another important limitation is the use of individual classifiers, which may become sensitive in transition and overlap regions between defects. Furthermore, many of the datasets used for training ML models do not simultaneously satisfy the physical constraints related to gas proportions and realistic concentration ranges expressed in ppm.
To overcome these limitations, this paper proposes the DPCC method, which integrates into a single geometric structure the regions from P1, P2, and the subzones associated with electric arcs and paper carbonization. In addition, a weighted probabilistic ensemble classification framework is implemented, combining multiple ML paradigms to improve the robustness and stability of the decision-making process in geometrically ambiguous regions.
The main contributions of this paper are as follows:
- The development of the DPCC integrates the P1, P2, arc, and carbonization subzones into a unified geometric structure.
- Generating a physically consistent dataset that adheres to percentage constraints for gases and realistic concentration ranges in parts per million (ppm).
- Providing a comparative evaluation of four representative ML paradigms, NN, SVM, KNN, and ensemble, for classifying defects defined by DPCC.
- Implementation of a weighted probabilistic ensemble framework to improve classification robustness in transition regions.
- Development of graphical user interface software for automated decision support.
The rest of the paper is structured as follows: Section 2 presents the fundamentals of the Duval Pentagon Method and the development of the Combined Complex Duval Pentagon (CCDP). Section 3 describes the machine learning (ML)-based diagnostic framework. Section 4 shows the validation of the proposed method. Finally, the paper presents its conclusions and future research directions.
2. Duval Pentagon Combined Complex
As indicated in the literature, direct gradient analysis (DGA) remains one of the most important and cost-effective methods for assessing the condition of oil-immersed power transformers. This method is based on analyzing gases generated by the thermal, electrical, or chemical degradation of the mixed oil–paper insulation system inside the transformer.
Michel Duval’s graphical diagnostic methods (triangles and pentagons) are among the most modern and widely used techniques for interpreting DGA results. Duval triangles use the relative percentages of three hydrocarbon gases. Duval pentagons, on the other hand, expand the analysis by using the relative percentages of five key gases: H2, C2H6, CH4, C2H4, and C2H2. This provides a more detailed classification of defects and increased accuracy in diagnosing the operating condition of power transformers.
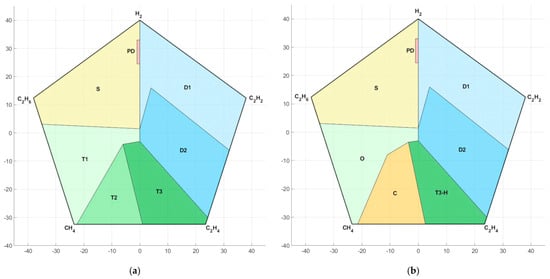
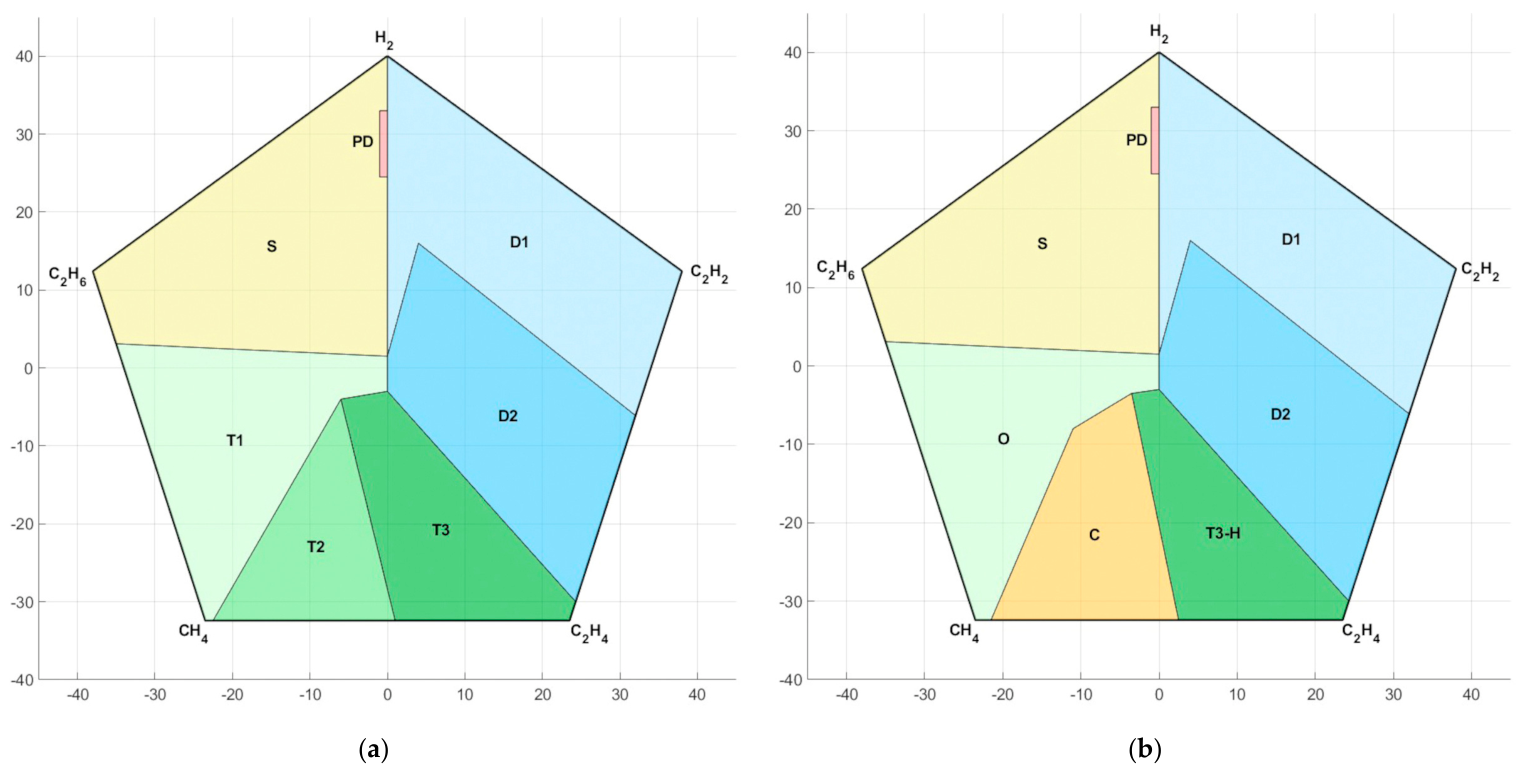
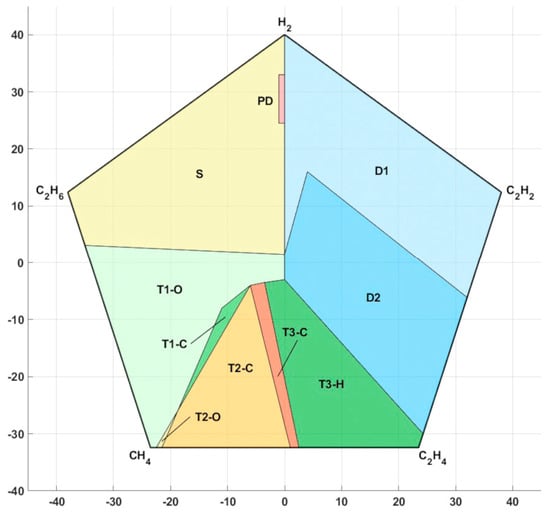
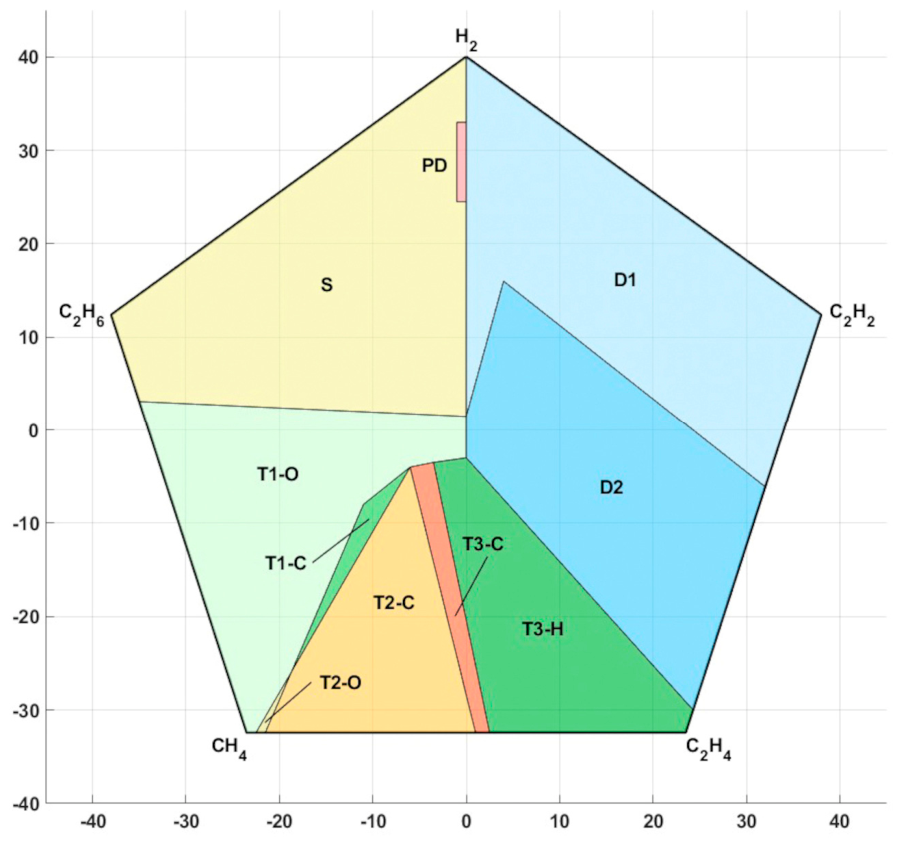
Pentagons 1 and 2, as presented by Duval, are used in the IEEE and CIGRE guidelines for DGA interpretation. Pentagon 1 is a tool that identifies the type of incipient defect. Pentagon 2 distinguishes between types of thermal defects, specifying whether the identified defect involves only oil or also insulating paper. Figure 2 shows the two Duval pentagons and their respective defect zones. Table 2 lists the meanings of these zones. As shown in Figure 2, the defect zones S, PD, D1, and D2 are identical in the two pentagons. The differences lie in the thermal defect zone.
Figure 2.
Duval Pentagons: (a) Pentagon 1; (b) Pentagon 2.
Table 2.
Meaning of the defect zones in Pentagons 1 and 2.
Furthermore, the pentagonal geometric representation shows that each vertex corresponds to a gas (from H2 to C2H2). Their order is trigonometric and corresponds to the increase in energy required to produce these gases in the oil of an operating transformer (H2 → C2H6 → CH4 → C2H4 → C2H2). S This method of gas distribution has proven to be the most effective way to detect faults in transformers. Note that the maximum level recorded at the Pentagon’s peak is 40%. This is because even when one gas accounts for 100% of the total, the others account for 0%. The centroid (the center of mass of the pentagon formed by the five gases) will not exceed 40%. Regardless of the gas levels in parts per million (ppm), the axes corresponding to each gas can be limited to 40% when their relative values are taken into account.
Duval developed the Combined Duval Pentagon (CDP) to simplify the automatic detection of faults in mineral oil-filled transformers using software while making full use of the properties of the P1 and P2 pentagons. The CDP is an analysis method obtained by superimposing the two pentagons.
The CDP reduces the total number of defect zones from 14 to 10 by combining the two methods into a single geometric structure, while preserving the essential characteristics of the original pentagons. The PD, S, D1, and D2 zones are present in both methods and do not indicate thermal defects. The other zones are used to identify different types of thermal defects.
Figure 3 shows the CDP with its ten defect zones. Table 3 lists the meanings of the six zones with thermal defects.
Figure 3.
The Combined Duval Pentagon (CDP).
Table 3.
Meaning of the defect zones in the Combined Duval Pentagon.
This approach simplifies analysis and facilitates implementation in software applications for online monitoring and predictive maintenance. It also allows for a clearer distinction between thermal defects in the oil and degradation of the insulating paper, as well as situations where combined defects occur.
The most dangerous faults in transformers are arcing in the paper insulation and thermal carbonization of the paper inside the windings. These faults can cause serious damage or even the catastrophic failure of the transformer. Thermal faults involving temperatures above 300 °C can cause the paper to carbonize. This results in the paper losing its insulating properties, which can lead to short circuits and arcing.
Type C faults, which include paper charring, most often occur between or within windings where voltages are high. However, they can also occur outside windings due to abnormal circulating currents or improperly secured cable connections. In rare cases, temperatures above 700 °C can cause oil to carbonize on hot metal surfaces. Additionally, overheating defects can occur at temperatures below 250 °C. In this case, the paper will only become brownish in color, without charring.
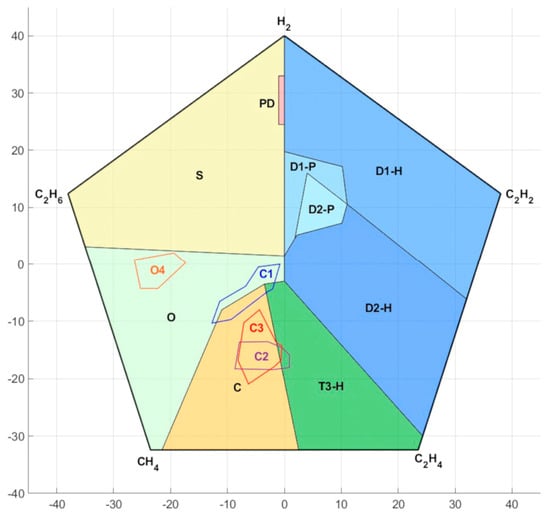
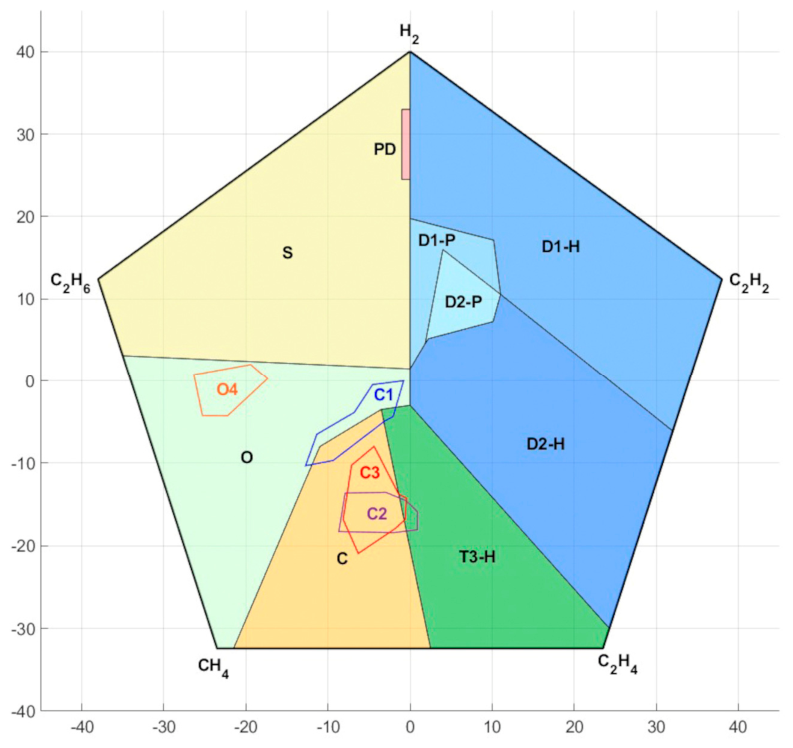
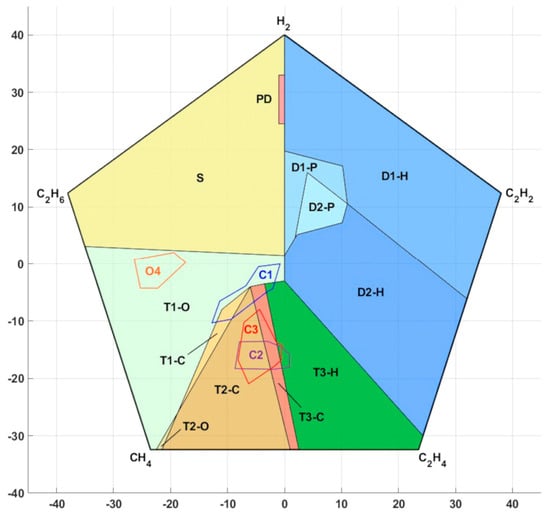
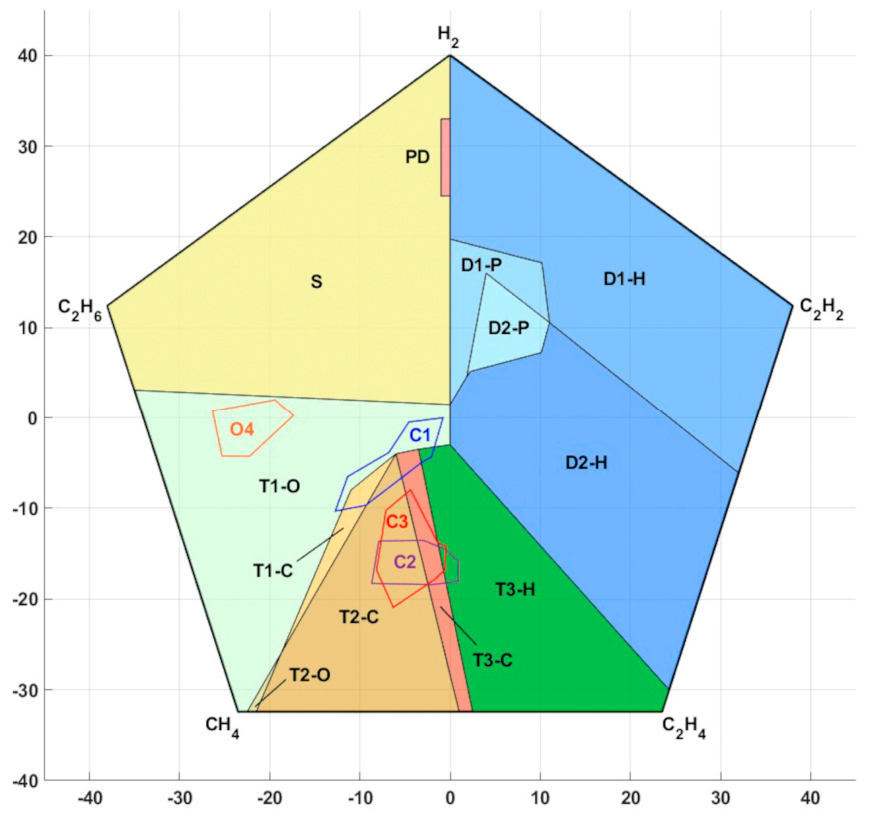
To improve detection of the most dangerous transformer faults, such as arcing and carbonization of cellulose insulation, Duval introduced new subzones in P2 [29,30]. These subzones enable more precise identification of the location and type of faults, helping operators determine if the transformer requires immediate attention or can continue operating safely. Figure 4 shows the new arc and paper charring subzones of P2.
Figure 4.
Pentagon Duval 2 with the arc and paper charring subzones.
The new subzones distinguish between low-energy (D1) and high-energy (D2) arc defects, indicating whether they occur in insulating paper (D1-P and D2-P) or oil (D1-H and D2-H). Additionally, they enable more precise identification of thermal faults that result in paper charring. These faults can be located between the windings (C1), inside the windings (C2), on the outside of the windings (C3), or in the cables (C4). They can also manifest as paper overheating without charring (O4).
It is important to determine the exact location of defects because the warning levels for the generated gases—acetylene for arc defects and ethylene for thermal defects involving paper charring—vary depending on the type and position of the defect. Faults that include charred solid insulation are particularly dangerous because they can lead to arcing and serious short circuits.
Table 4 and Table 5 show the concentration levels of C2H2 and C2H4, respectively, for arc faults and thermal faults involving paper charring. These values were taken from CIGRE Technical Brochure 771. This brochure presents calculations and recommendations by CIGRE experts for typical, intermediate, and pre-fault values at 90% gas concentration. These recommendations are based on gas levels, fault type, and fault location.
Table 4.
Arc fault C2H2 concentration levels [6].
Table 5.
Concentration levels of C2H4 for thermal faults resulting in paper charring [6].
If a transformer experiences gas generation in subzones D1-P or D2-P of P2, it is highly probable that the arc fault is in the paper. However, this is not a guarantee, as oil-filled arc faults may still occur in these areas.
Arc faults in the paper are never found in subzones D1-H and D2-H, meaning there are no false negatives. By contrast, tank-type on-load tap changers (MR) often produce gases in subzone D2-H.
D2 type faults usually happen suddenly and produce a lot of gas. This can trigger Buchholz relay alarms and cause transformers to shut down automatically. A confirmed D2-P fault is considered the most dangerous type of fault that can occur in a transformer. However, the presence of small amounts of D2-H type gases in transformers is often the result of less severe combinations of D1 and T3 type stresses.
Transformer operators find it particularly helpful to identify thermal faults caused by the carbonization of solid insulation and pinpoint their location. This helps them determine whether urgent action is needed, such as taking the transformer out of service for inspection and repairs, or if it can remain in operation with increased oil sampling frequency for DGA testing.
In light of the aforementioned considerations and the goal of swiftly identifying critical defects and their locations, as well as facilitating implementation in software applications designed for online monitoring and predictive maintenance, the authors of this paper opted to overlap pentagon P1 (Figure 2) with P2, the arc, and the paper charring subzones (Figure 4). The result of this overlap was the DPCC.
This new pentagon combines the characteristics of the two previously mentioned pentagons into a single geometric structure. Compared to when the two pentagons are used separately, it contains 12 defect zones and four paper charring subzones, as opposed to 16 defect zones and four paper charring subzones. Thanks to the intuitive visual representation, the location of a defect can be determined more precisely within the new Pentagon, particularly if it is an arc defect (low-energy or high-energy) or one associated with paper charring.
Figure 5 shows the DPCC, and Table 6 lists the (x, y) coordinates of the vertices of the defect zones and subzones in this new pentagon.
Figure 5.
The Duval Pentagon Combined Complex (DPCC).
Table 6.
The (x, y) coordinates of the vertices of the defect zones and subzones in the DPCC.
The transition from CDP to DPCC improves several important aspects: it increases defect granularity, separates defects that were previously grouped together, reduces ambiguities in transition regions, enables ML models to learn more accurate decision boundaries, provides more precise physical localization of defects, and improves diagnostic robustness in boundary regions.
The procedure for determining the point corresponding to a defect within a pentagon is the same regardless of the type of pentagon used. First, the relative percentages (in ppm) of the five key gases are calculated. Then, the relative contribution of each gas is determined by dividing the concentration of that gas by the sum of the five components. As previously explained, these percentages are the vertices of an irregular pentagon formed by the values of the five gases. The defect point is the centroid of this irregular pentagon. The Cartesian coordinates (x, y) of the centroid are determined by the following equations:
where: xi and yi are the coordinates of the five points; Cx and Cy are the coordinates (x, y) of the centroid;
A is the area of the polygon, calculated using the following formula:
3. Machine Learning-Based Diagnostic Framework
The feature engineering process was designed to preserve both the physical meaning of the data obtained from DGA and the geometric properties of the DPCC representation. In the first stage, the concentrations of the five key gases (H2, CH4, C2H6, C2H4, and C2H2) were transformed into relative percentage values with respect to the total combustible gas content. These relative proportions were subsequently used to construct the irregular pentagon associated with each transformer operating condition. The centroid coordinates (Cx, Cy) of the generated polygon were calculated using the geometric relations presented in Equations (1)–(3). These coordinates represent compact geometric descriptors of the gas distribution and were used as input features for the machine learning classifiers.
The proposed feature extraction strategy preserves the physical relationships between gases while simultaneously transforming the DGA measurements into a low-dimensional feature space suitable for robust nonlinear classification.
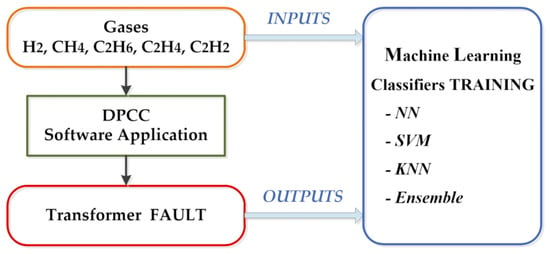
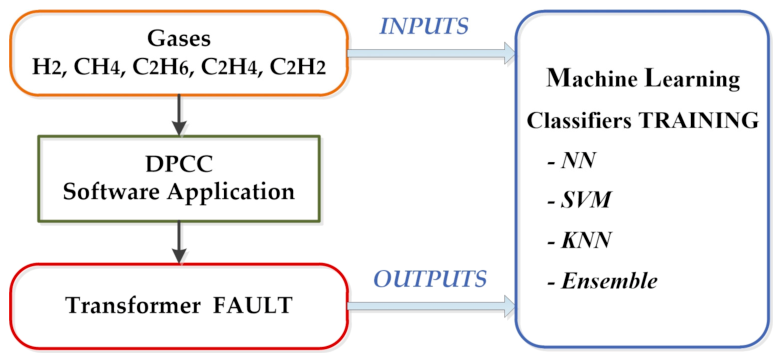
The classifiers were trained using the Classification Learner app in MATLAB (version 2025b), which enables the systematic evaluation of multiple models and hyperparameters. We evaluated the performance of each classifier using cross-validation. The metrics we analyzed included overall accuracy, training time, prediction speed, and the size of the resulting model. This approach ensures objective, reproducible comparisons between various classification techniques. Because the classification problem is geometric in nature, the classifiers used with the application software’s holistic approach ensure that the results are not dependent on a single classification technique. Rather, the results reflect the robustness and consistency of the dataset during the training, testing, and validation phases. Various representative ML paradigms were used that differed in complexity, generalization ability, and computational requirements. The four classification categories used are NN, SVM, KNN, and Ensemble. These categories allow for a balanced, comparative evaluation of classification algorithm performance in the context of defect diagnosis based on the DPCC method. Figure 6 shows the full workflow for implementing the DPCC-based diagnostic system. This includes generating data, calculating the centroid, extracting features, training the classifier, and validating the system. The diagram illustrates the interaction between geometric modeling and the ML component, emphasizing the hybrid nature of the proposed method.
Figure 6.
DPCC implementation and classifier training scheme.
NNs were chosen as classifiers due to their ability to model complex, nonlinear relationships between input variables. NNs are a powerful tool for approximating decision surfaces in the context of the complex, combined Duval pentagon, where the boundaries between defect regions are nonlinear and difficult to distinguish. The main advantage of using NNs is their architectural flexibility and ability to capture subtle interactions between gases.
SVM models were chosen due to their solid theoretical foundation and proven performance in classifying medium-dimensional and well-structured datasets. SVMs can be adapted to the geometric complexity of the data by using different kernel functions, such as linear, polynomial, or radial. The DPCC method uses radial basis function (Gaussian) SVM classifiers, which are particularly effective at modeling nonlinear boundaries between defect regions. This method offers an optimal balance between accuracy and computational complexity. Another factor that influenced the selection of this classifier is that it provides a stable solution with low overlearning sensitivity.
KNN classifiers were included as a method because of their conceptual simplicity and interpretability. Because KNN relies on the local geometric structure of the data, it is well-suited for evaluating dataset quality. The high performance of the KNN classifiers indicates that the DPCC method effectively clusters points within each region in feature space.
We used ensemble classifiers because they reduce variance and improve generalization performance by combining multiple base classifiers. Bagging techniques, in particular, have proven effective in capturing complex relationships between features.
The application software developed based on the four types of classifiers for fault diagnosis using the DPCC method has several advantages:
- Automating the decision-making process to reduce reliance on manual interpretation;
- Managing transition zones, where the DCPC method can lead to ambiguities;
- High scalability, enabling rapid analysis of large volumes of DGA data;
- Robustness to noise and data variations, thanks to the generalization ability of ML models;
- The interactive graphical interface and the possibility of integrating it into an online monitoring system.
Therefore, ML classifiers based on the DPCC method provide an additional level of decision support, enabling the development of smarter, more efficient diagnostic systems. Table 7 shows the results for the four ML classifiers mentioned earlier. These classifiers were trained using the direct sampling method on the dataset generated across the 16 defect zones and subzones corresponding to the DPCC method. As shown in Table 7, the training phase revealed that the Wide NN, Fine Gaussian SVM, Weighted KNN, and Bagged Trees Ensemble classifiers outperformed the remaining evaluated models in terms of overall classification performance. Considering their superior accuracy, reduced error rates, and favorable trade-off between predictive capability and computational complexity, these classifiers were retained for the next stages of the study.
Table 7.
A comparative evaluation of the results obtained from training the four aforementioned ML classifiers on the dataset generated using the DPCC method.
The dataset used for training and validating the ML classifiers was generated in a physically consistent manner, using information regarding the typical distributions of dissolved gases reported in the literature for the different defect types associated with the DPCC method. For each of the 16 fault classes and subclasses, samples were generated that satisfy both the relative gas proportion constraints and the realistic concentration ranges expressed in ppm. The gas concentration ranges were selected based on the values reported in the CIGRÉ and IEEE standards and guidelines related to DGA interpretation, as well as from real cases associated with the Duval Pentagon and Combined Duval Pentagon methods. In particular, information regarding the characteristic gas levels for thermal faults, electrical discharges, and insulation paper carbonization was considered. To avoid class imbalance and ensure proper classifier training, a similar number of samples was used for each fault class. The balanced data distribution enabled an objective evaluation of the ML classifier performance and reduced the influence of statistical imbalances on the final results.
3.1. Overall Performance of the Classifiers
The obtained accuracy values are concentrated within a relatively narrow range of approximately 89% to 96.53%, which indicates good separability of the defect classes. This observation suggests that the generated dataset realistically captures the overlaps and transitions between the diagnostic zones defined by the DPCC method without creating unnecessary divisions. Of the NN models evaluated, the Wide NN performed the best. These architectures’ small differences suggest that an excessively complex model is not necessary to capture the nonlinear relationships between features in the classification problem. SVM classifiers have been shown to be strongly dependent on the choice of kernel. With an accuracy of 93.65%, the Linear SVM model proved insufficient for effectively separating the classes, confirming the inherently nonlinear nature of the decision boundary associated with the combined Duval pentagon. Using polynomial kernels produced mixed results. The quadratic SVM achieved competitive accuracy (95.97%), but the cubic variant showed a significant drop in performance (approximately 89%), likely due to overlearning and numerical instability. The Fine Gaussian SVM achieved the best result in this category, with an accuracy of 96.07%. This result is comparable to that of the top-performing NNs. The KNN classifiers demonstrated varying levels of performance, achieving accuracies ranging from 91.78% to 95.74%. The Weighted KNN model produced the best results in this category. This indicates that weighting nearby neighbors improves class separation. The results of ensemble methods were mixed. With an accuracy of 96.26%, Bagged Trees nearly matched the best results obtained with NN and SVM.
This performance demonstrates the effectiveness of aggregating multiple decision trees in capturing complex, nonlinear relationships among features. By contrast, methods such as subspace discriminant analysis performed significantly worse. This confirms that linear or weakly nonlinear models are not suitable for this classification problem.
A comprehensive comparison of classifiers reveals that several ML paradigms can perform well when trained on physically and geometrically consistent datasets. For practical applications, however, factors such as training time, model size, and ease of integration must be taken into account. In this context, the fine Gaussian SVM offers the best balance between accuracy, computational complexity, and robustness. This makes it an ideal candidate for implementation in an automatic diagnostic application based on the DPCC method.
3.1.1. Performance Analysis of the Wide NN Classifier
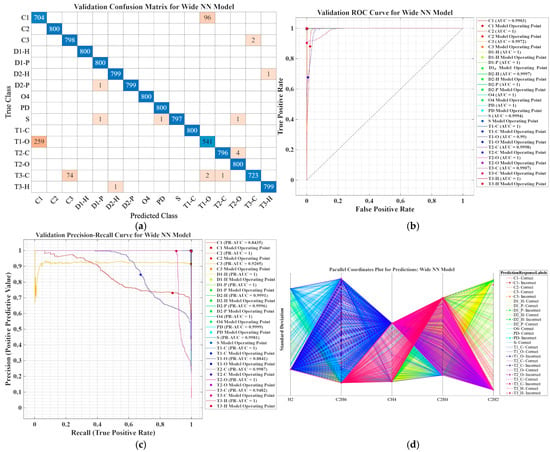
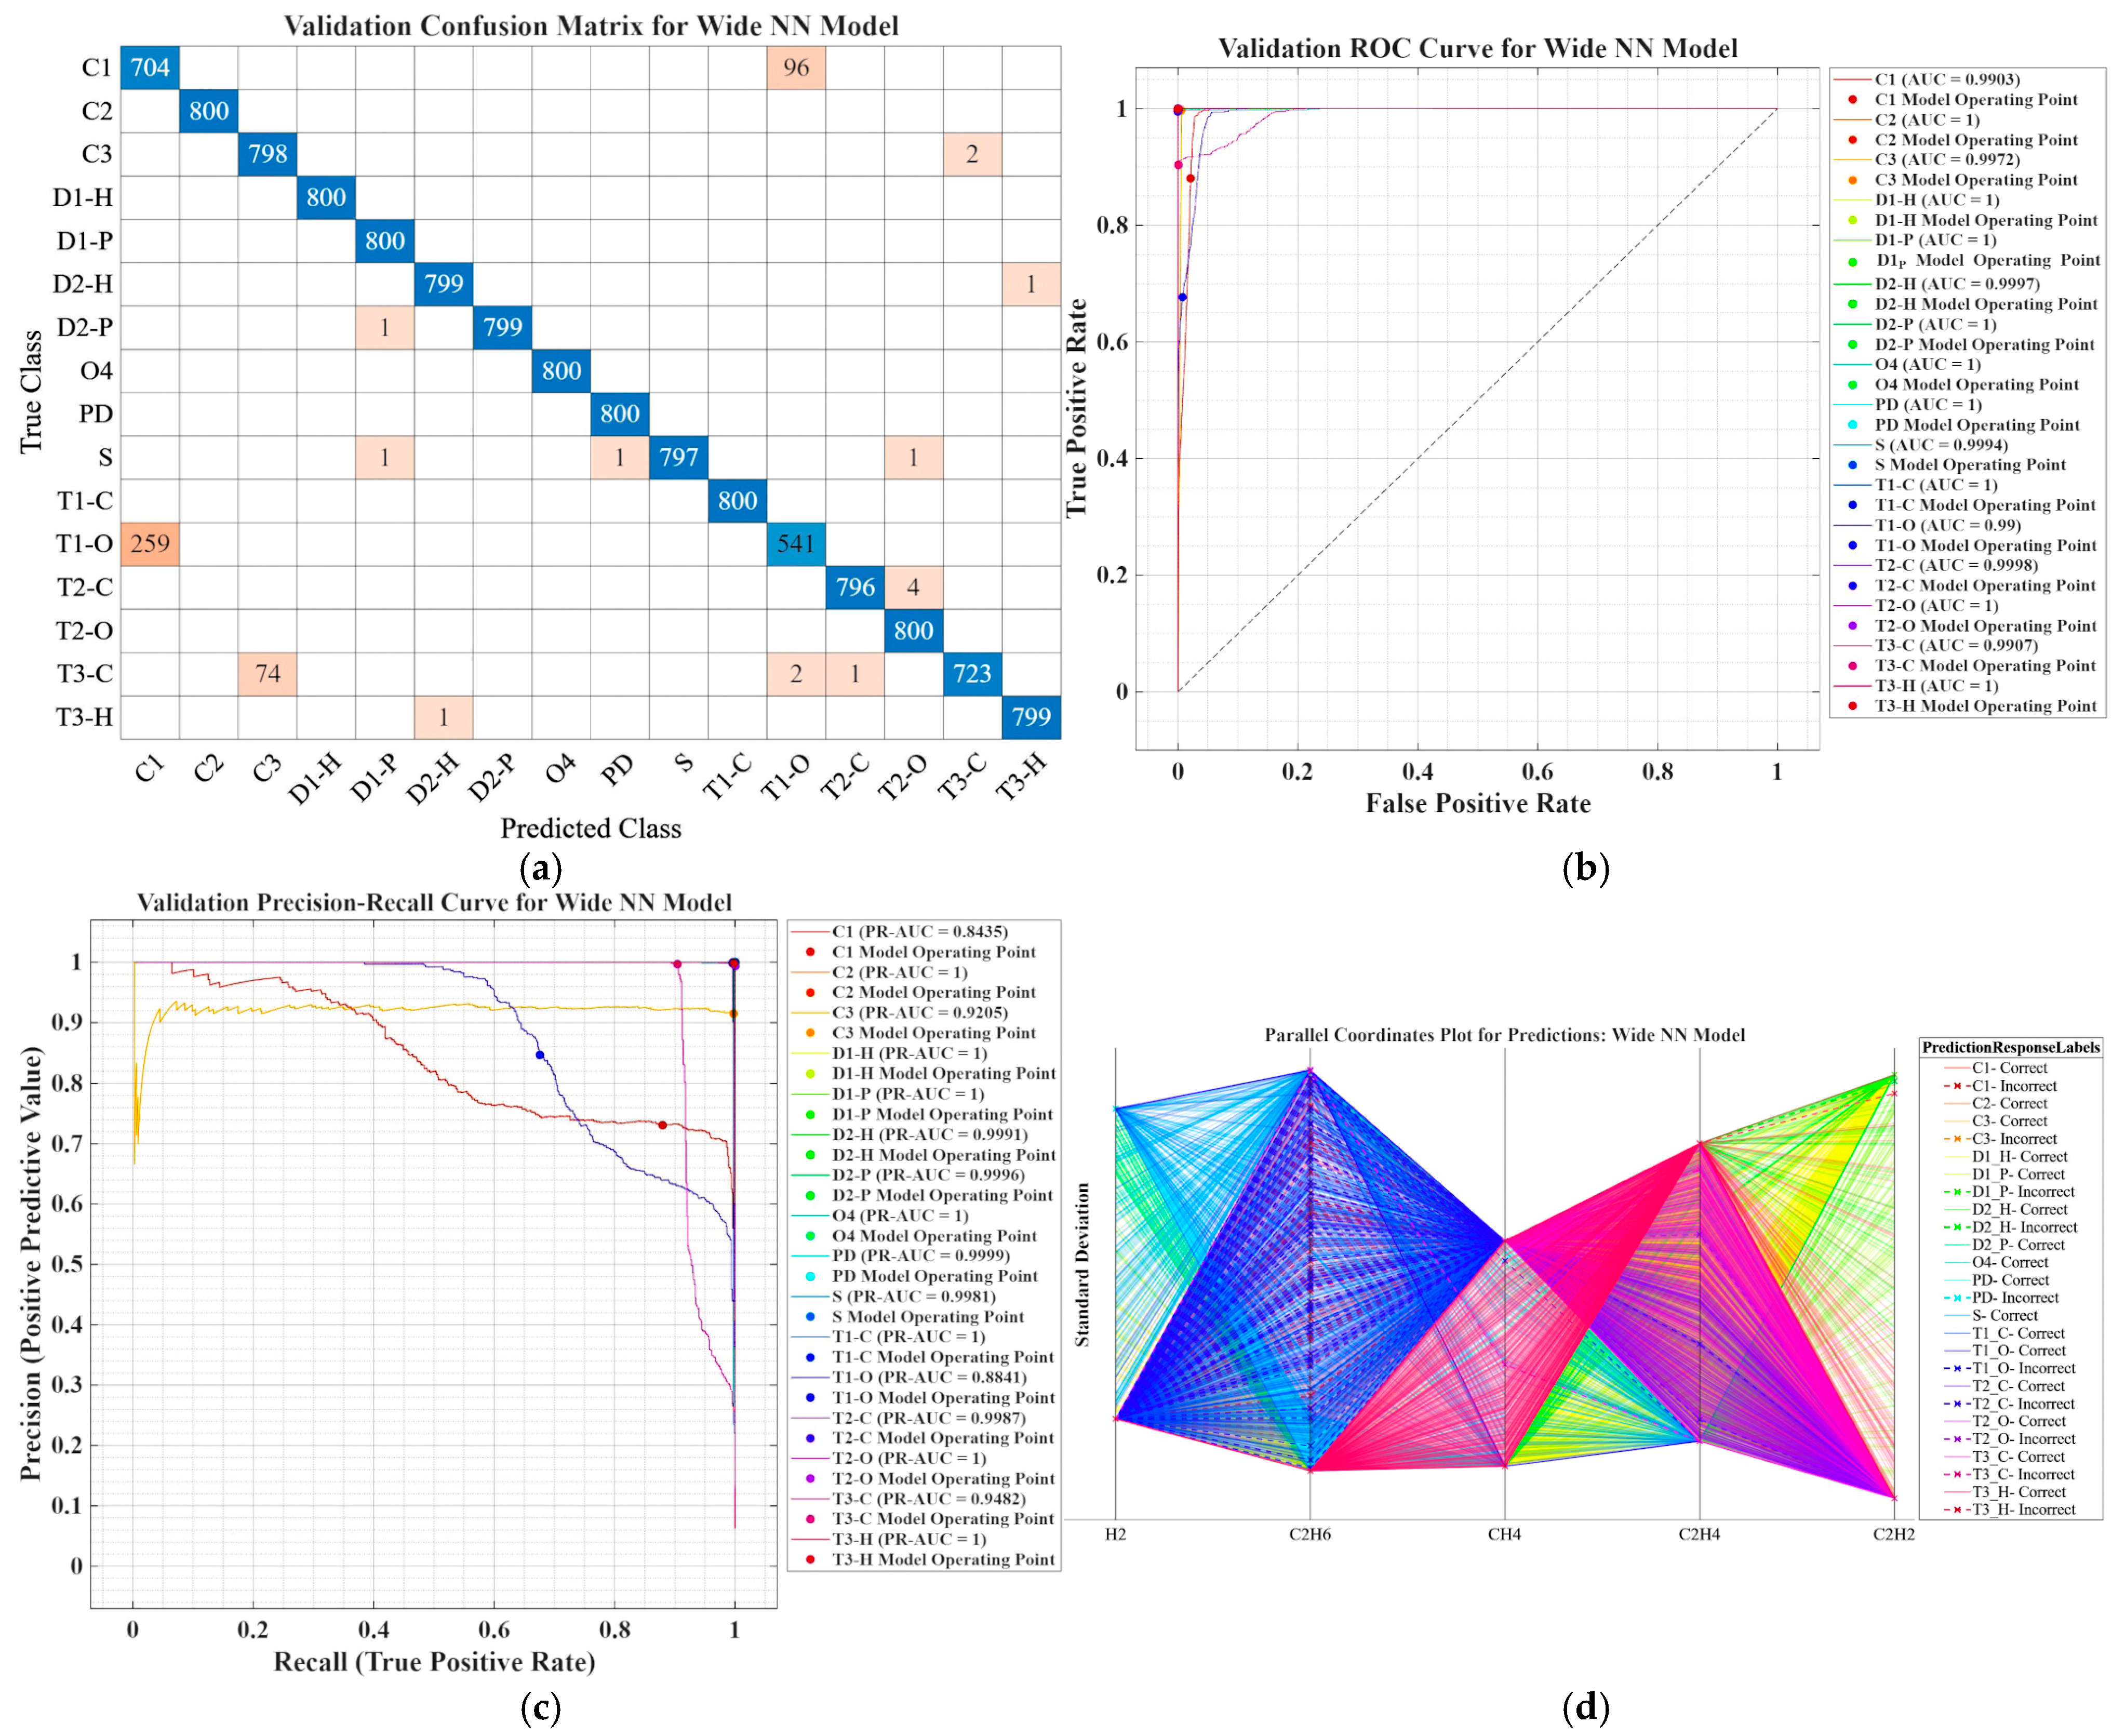
Figure 7a shows the confusion matrix, which highlights the high overall performance of the Wide NN classifier. Most classes exhibit near-perfect values along the diagonal, with approximately 800 correctly classified samples per class. This result confirms that the dataset generated using Duval polygons has high class separability. However, there are certain areas of confusion that are relevant from physical and diagnostic standpoints: there are a significant number of misclassifications in Class T1-O (259 misclassified samples), which suggests partial overlap with other thermal zones, especially transition zones; there are 96 erroneous classifications in Class C1, which indicates a possible geometric proximity to other carbonaceous or discharge regions; the T3-C and D2-P classes have a small but noticeable number of defects. These defects may be related to the way gas is distributed in these types.
Figure 7.
Performance evaluation of the Wide NN classifier: (a) Confusion matrix; (b) ROC curve; (c) Precision-recall curve; (d) Parallel coordinates plot for predictions.
Overall, the confusion matrix shows that the model accurately captures the geometric structure of the 16 zones defined by the DPCC method. Errors are concentrated in the border areas between similar thermal classes.
As shown in Figure 7b, the Receiver Operating Characteristic (ROC) curves indicate excellent discriminatory capacity for most classes. The values of the AUC are very close to 1 for nearly all categories, with many of them reaching an AUC of 1. This indicates an almost perfect separation between the analyzed class and the other classes using the one-vs-all approach. Classes with slightly lower AUC values (e.g., C1 = 0.9903, T1-O = 0.99, and T3-C = 0.9907) also showed confusion in the confusion matrix. This confirms the robustness of the analysis and indicates that classification difficulties are linked to the complex, nonlinear boundaries between regions. Overall, the ROC curves demonstrate robust classification performance, high sensitivity, and low false positive rates.
Figure 7c shows the precision–recall curves, which provide a more sensitive view of performance in the presence of potential imbalances or transition zones. The PR-AUC values of most classes are very close to 1, which indicates high accuracy and sensitivity. However, lower values are observed for the following: C1 (PR-AUC = 0.8435), T1-O (PR-AUC = 0.8841), C3 (PR-AUC = 0.9205), and T3-C (PR-AUC = 0.9482). These results confirm that these classes are particularly susceptible to false positive and false negative errors in transition zones. From a physical standpoint, this behavior can be explained by the proximity of these defects within the gas ratio space.
Thus, the Wide NN classifier performs excellently at classifying the 16 defect types defined by the DPCC method. Figure 7d shows that the generated data is highly separable, the nonlinear boundaries between regions are modeled effectively, and errors are concentrated in physically justifiable transition zones. The overall performance is very high. However, the precision–recall analysis suggests that certain classes, particularly T1-O and C1, could benefit from further optimization or enrichment of the dataset in border regions.
3.1.2. Analysis of Fine Gaussian SVM Classifier Performance
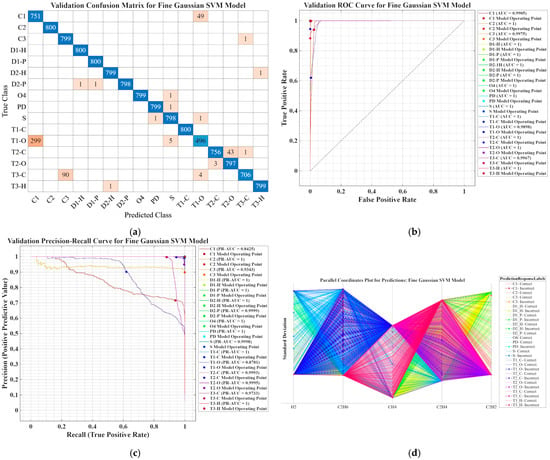
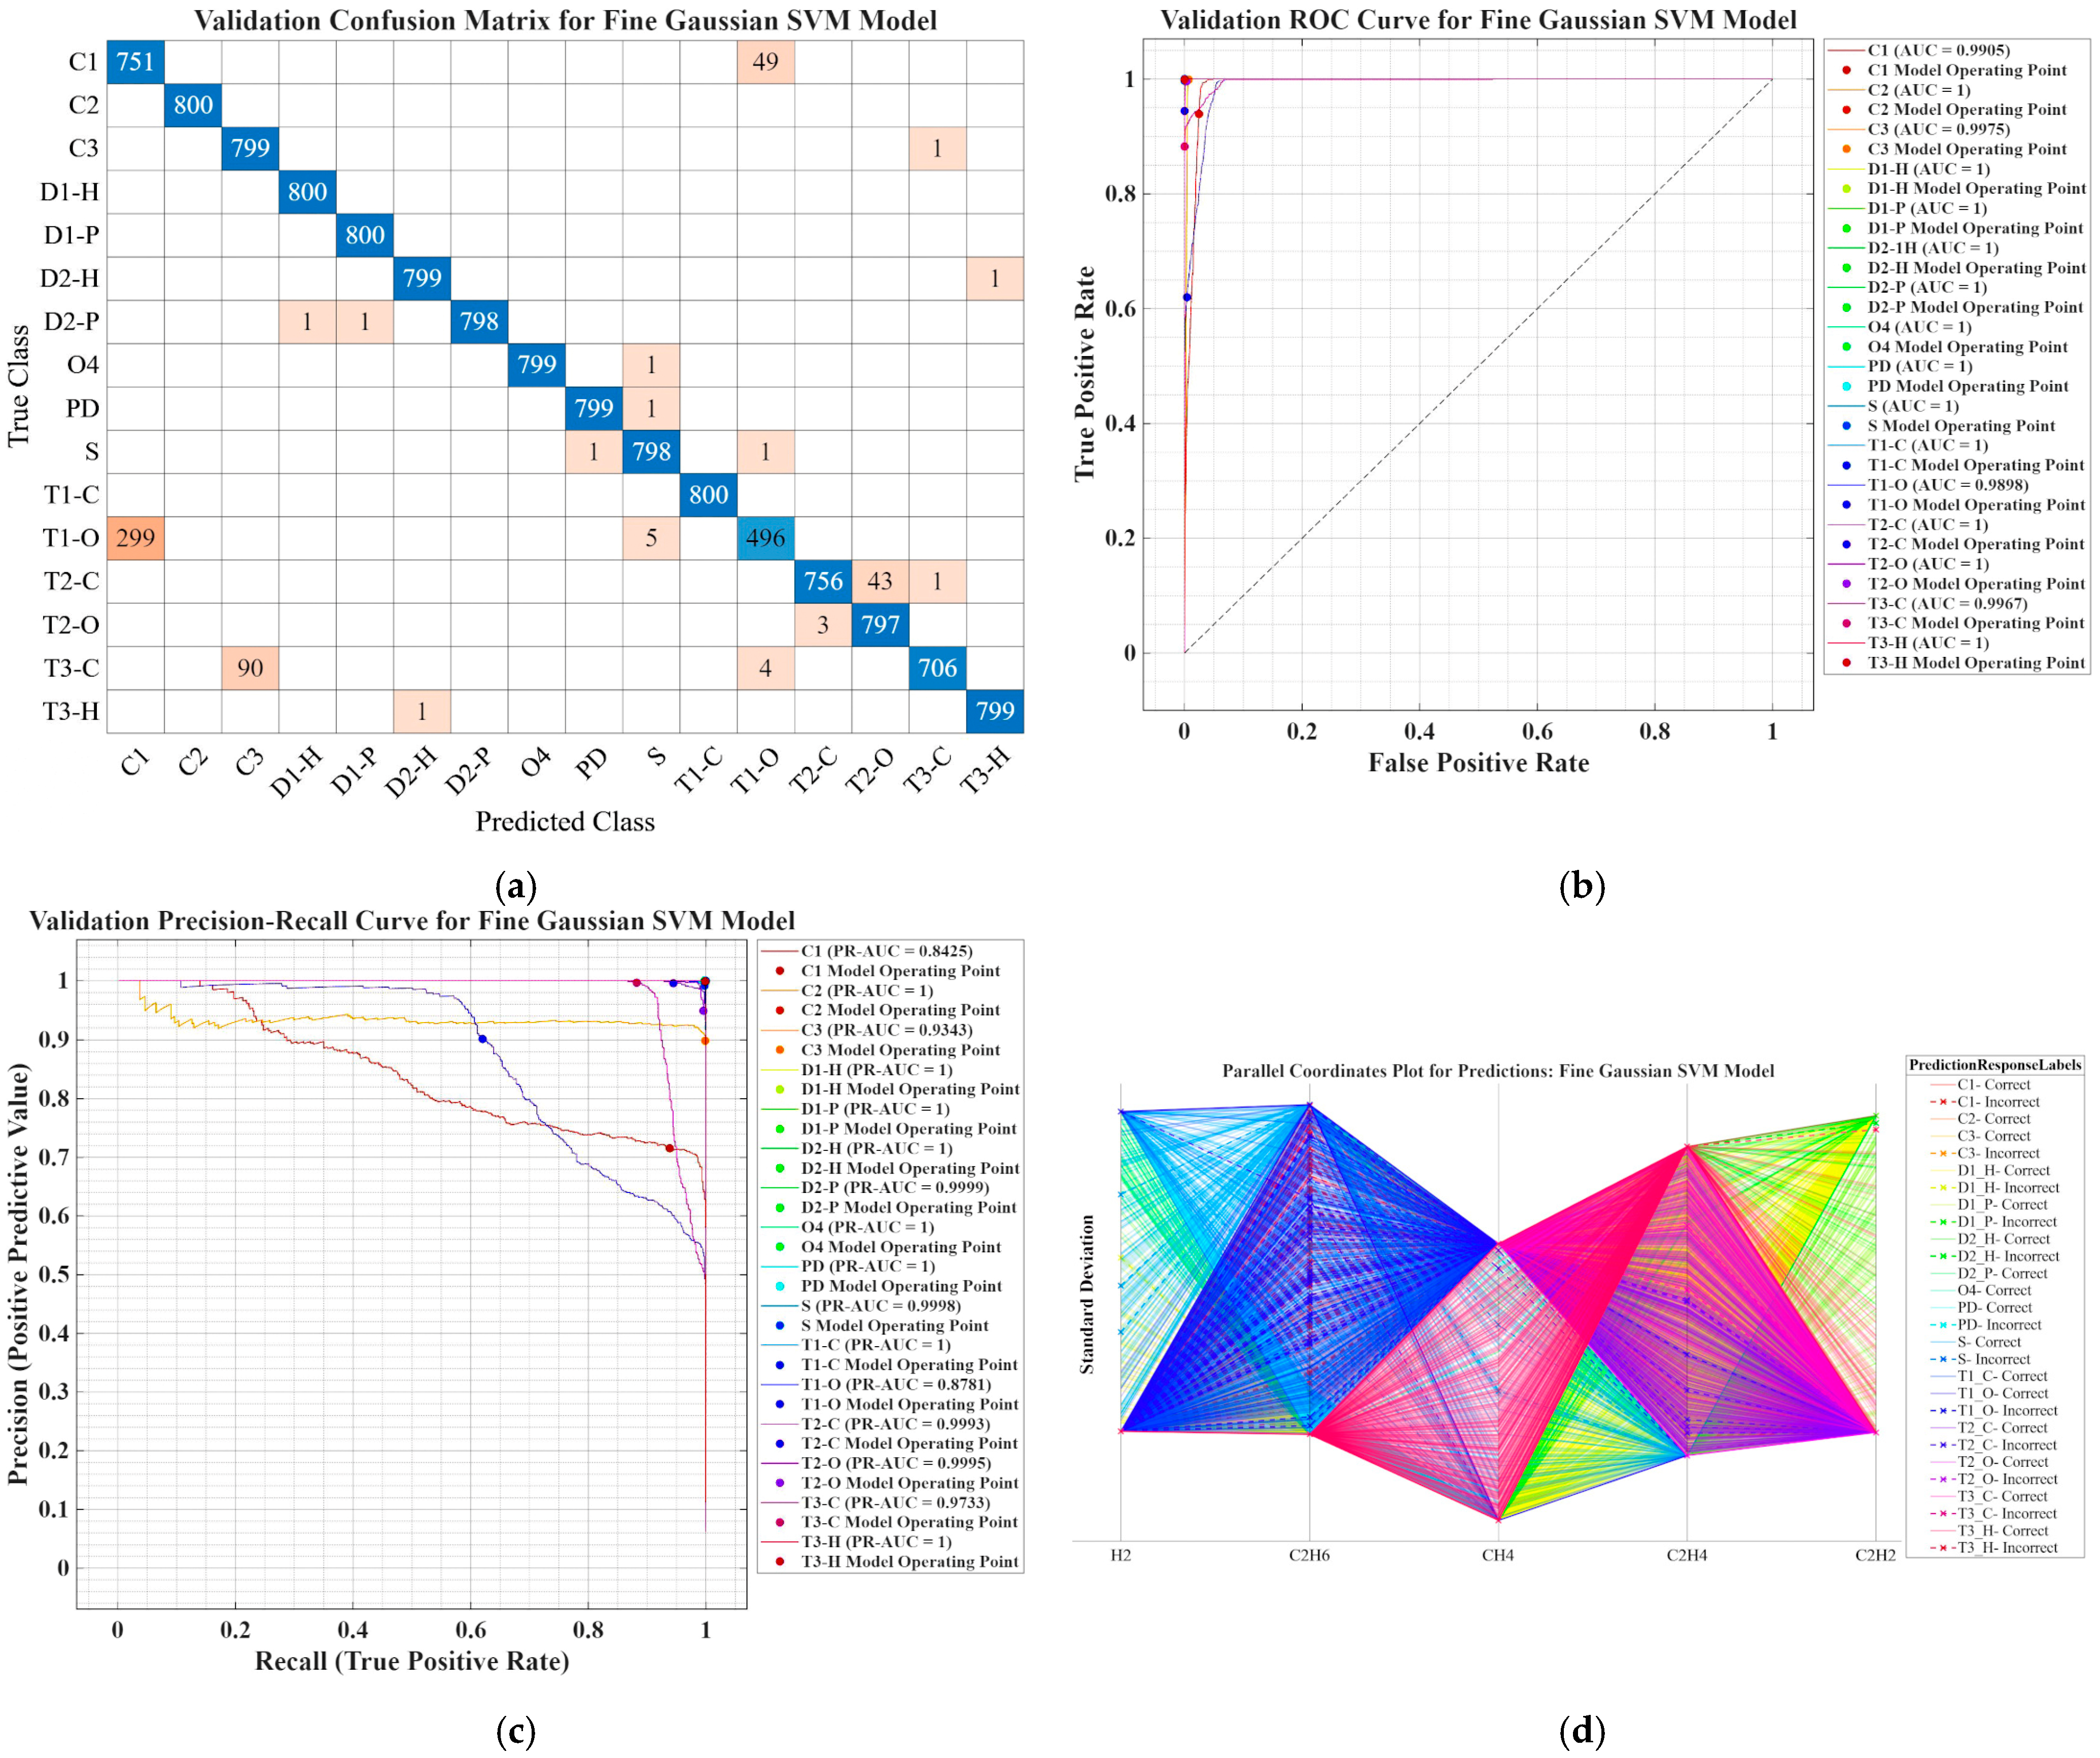
Figure 8a shows the confusion matrix for the Fine Gaussian SVM model, which demonstrates very high overall performance. Most classes achieve approximately 800 correct classifications out of 800 samples per class. This result confirms the suitability of the radial basis function (RBF) for modeling the nonlinear boundaries of the 16 regions defined in the DPCC. However, certain relevant error patterns can be observed. Class T1-O has a high number of misclassifications (299 samples) and is often confused with other thermal classes. This behavior indicates a significant overlap in the transition zone between low- and medium-level thermal faults; there are 90 misclassifications in Class T3-C, which indicates possible geometric proximity to T2-C classes or other advanced thermal faults; there are 49 defects in Class C1, which may reflect a similarity in gas proportion distribution to that of other types of carbon defects. There are a few errors in the T2-C and T2-O classes (43 and 3–4 cases, respectively), which indicates that these regions are relatively well-defined. The SVM exhibits a slightly higher number of errors concentrated in the thermal classes compared to the Wide NN model. This suggests that the boundaries generated by the Gaussian kernel are more rigid than the NN’s adaptive surfaces.
Figure 8.
Performance evaluation of the Fine Gaussian SVM classifier: (a) Confusion matrix; (b) ROC curves; (c) Precision-recall curves; (d) Parallel coordinates plot for predictions.
As shown in Figure 8b, the ROC curves indicate excellent discriminatory capacity for most classes, with AUC values close to 1. The following was observed: the AUC is 1 for many classes (C2, D1-H, D1-P, D2-H, D2-P, O4, PD, S, T1-C, T2-C, T2-O, T3-H); slightly lower values for: C1 (AUC = 0.9905), C3 (AUC = 0.9975), T1-O (AUC = 0.9898), and T3-C (AUC = 0.9967). These results confirm that the radial basis function SVM model can construct well-defined decision boundaries between classes and that performance degradation is limited to physically plausible transition regions. The AUC values are very similar compared to the NN, indicating nearly equivalent performance in terms of overall separability.
Figure 8c shows the precision–recall curves, which provide a more sensitive view of performance for classes that are difficult to distinguish. Most classes have very high PR-AUC values (approximately 1), confirming nearly perfect accuracy and sensitivity. The lower-performing classes are: C1 (PR-AUC = 0.8425), T1-O (PR-AUC = 0.8781), C3 (PR-AUC = 0.9343), and T3-C (PR-AUC = 0.9733). These results align with the observations in the confusion matrix and suggest that errors primarily occur in areas where thermal and carbon defects overlap, or where thermal defects overlap. From a practical standpoint, while the model is somewhat sensitive to variations in gas proportions in these regions, its overall performance remains very high.
Figure 8d shows a parallel-coordinate plot that confirms the well-defined structure of the classes in the space of the five gases. Samples that are correctly classified show well-clustered trajectories. In contrast, incorrectly classified samples appear in areas where the following can be observed: the CH4/C2H6 and C2H4/C2H2 ratios are similar across classes; The C2H2 values fall at the lower or upper limits of the ranges; however, there is overlap between thermal defects T1-O, T2-C, and T3-C. The error distribution is more concentrated and clearly associated with specific transition regions compared to the NN model. This suggests that the SVM generates “smoother” but less flexible decision boundaries than a Wide NN.
3.1.3. Analysis of the Weighted K-Nearest Neighbor Classifier Performance
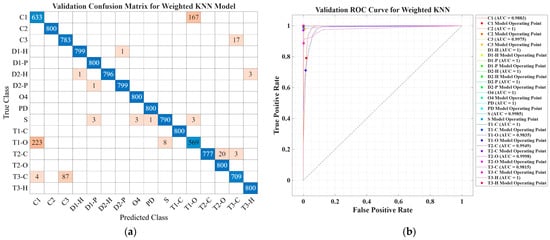
Figure 9a shows the confusion matrix for the Weighted KNN classifier, which indicates good overall performance. However, it is inferior to the Wide NN and Fine Gaussian SVM classifiers, especially for certain thermal and carbon classes. The following relevant points are noted: C1 exhibits a high number of incorrect classifications (167 errors), indicating significant difficulty separating this class from nearby regions; with 223 misclassifications, T1-O confirms that the transition zone between low-level and intermediate thermal defects is difficult to delineate using a method based solely on local proximity; T3-C shows 87 errors, which suggests that there are overlaps with other advanced thermal defects within the feature space; and classes T2-C and S have moderate error rates (2–3 cases), suggesting reasonable, though not perfect, delineation. By contrast, classes C2, D1-P, O4, PD, and T3-H are nearly perfectly classified, which suggests that there are well-separated regions in the feature space. Compared to SVM and NN, KNN exhibits more concentrated and numerous errors in transition regions. This confirms that neighborhood-based methods are more sensitive to local data point distribution and sample density.
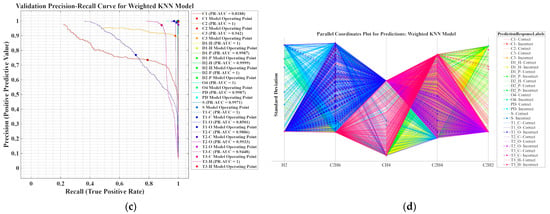
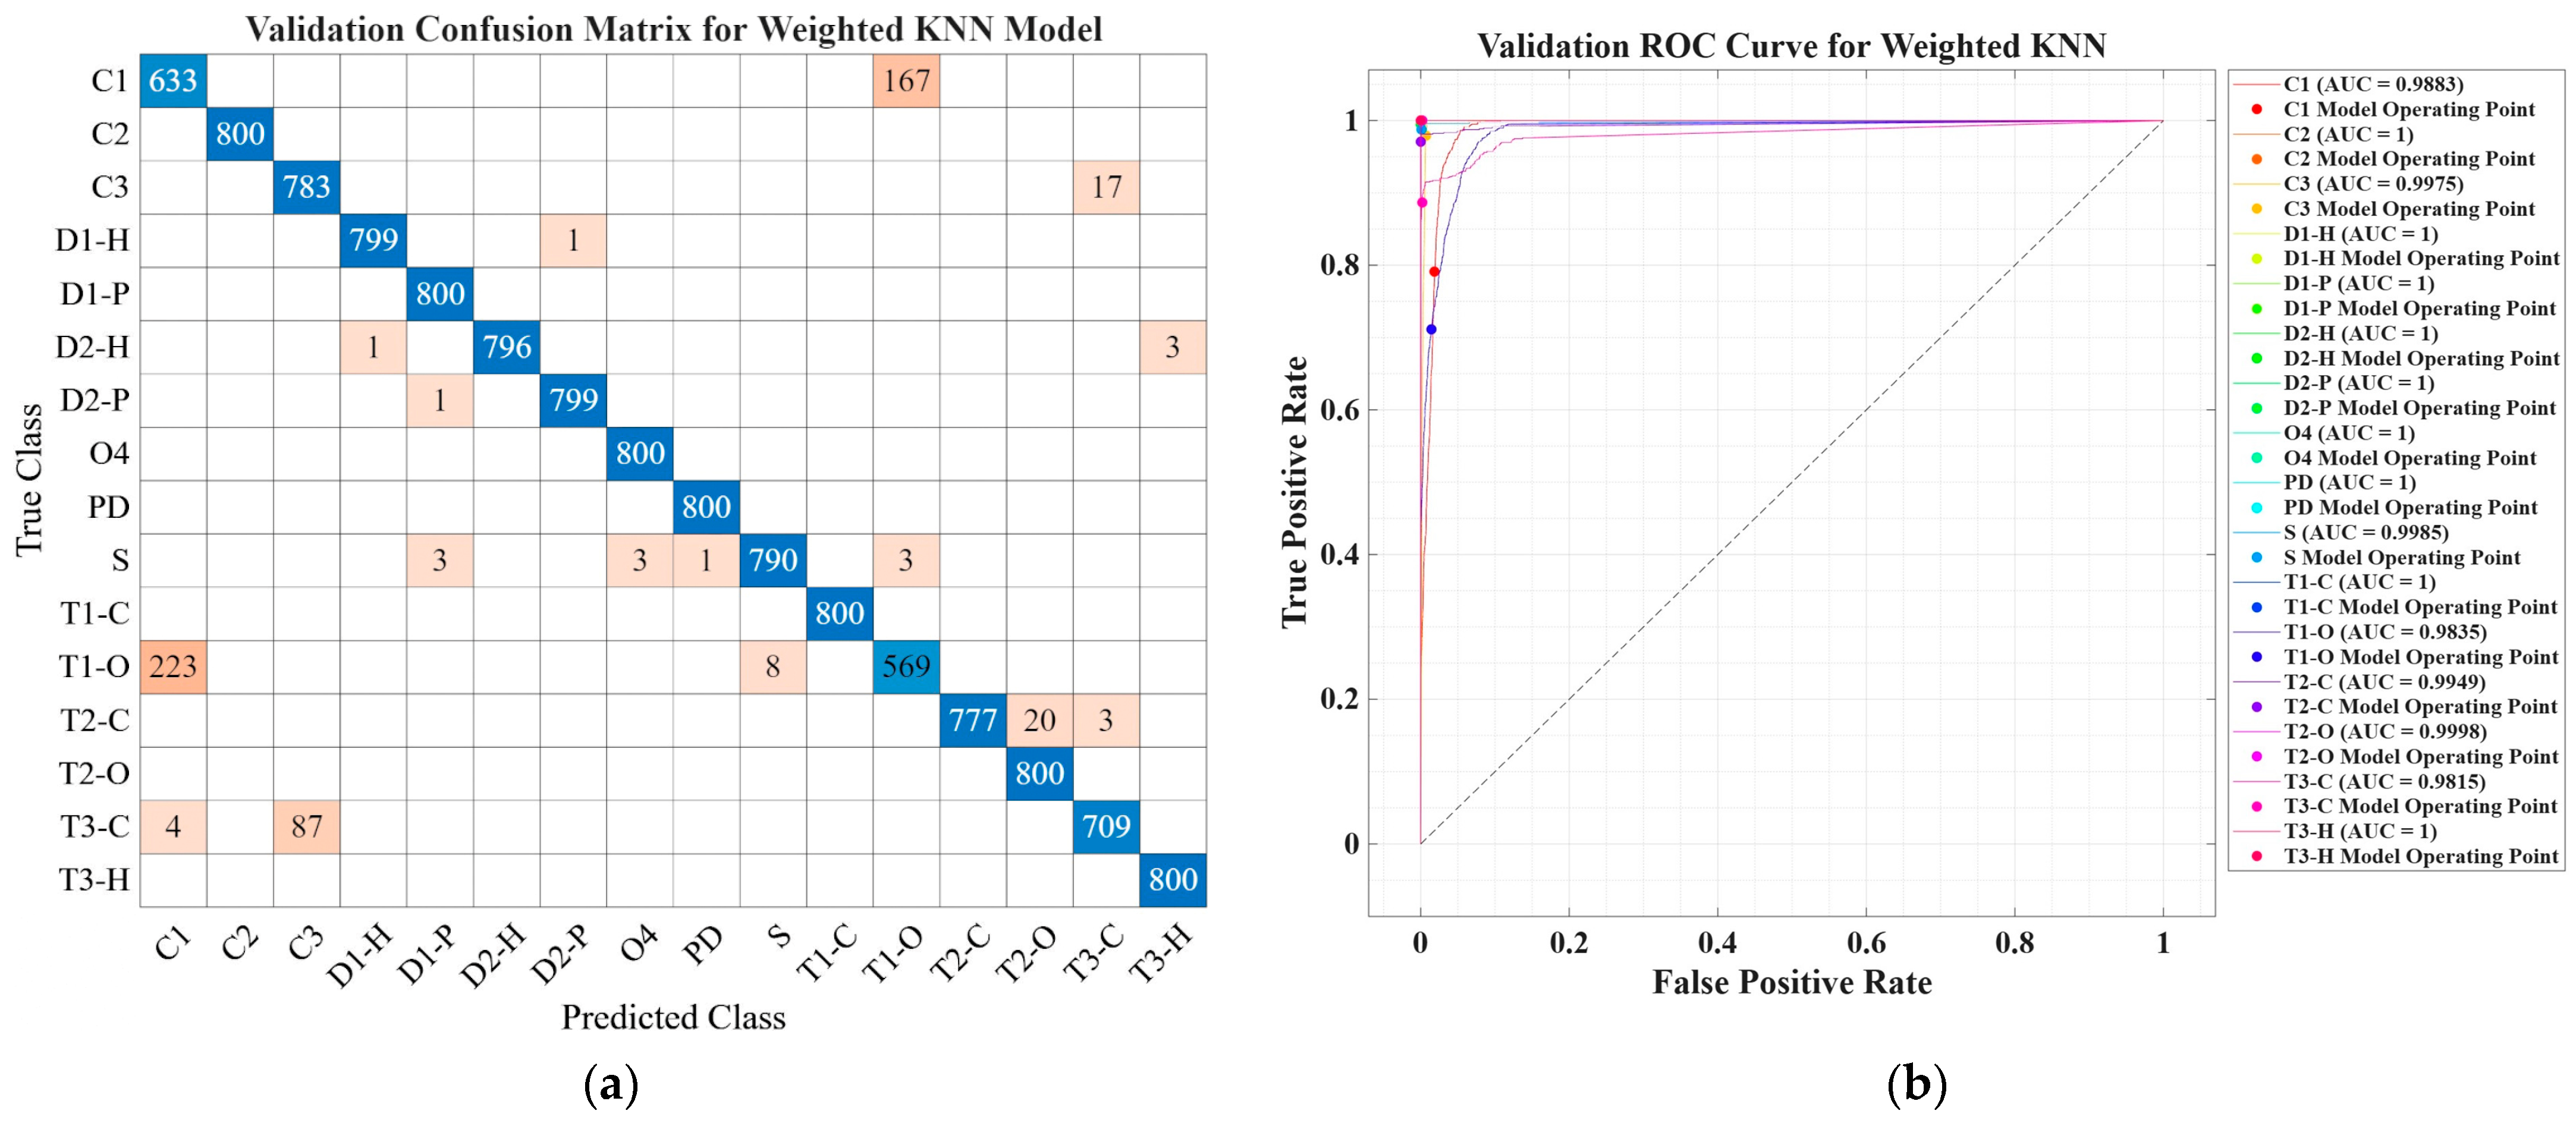
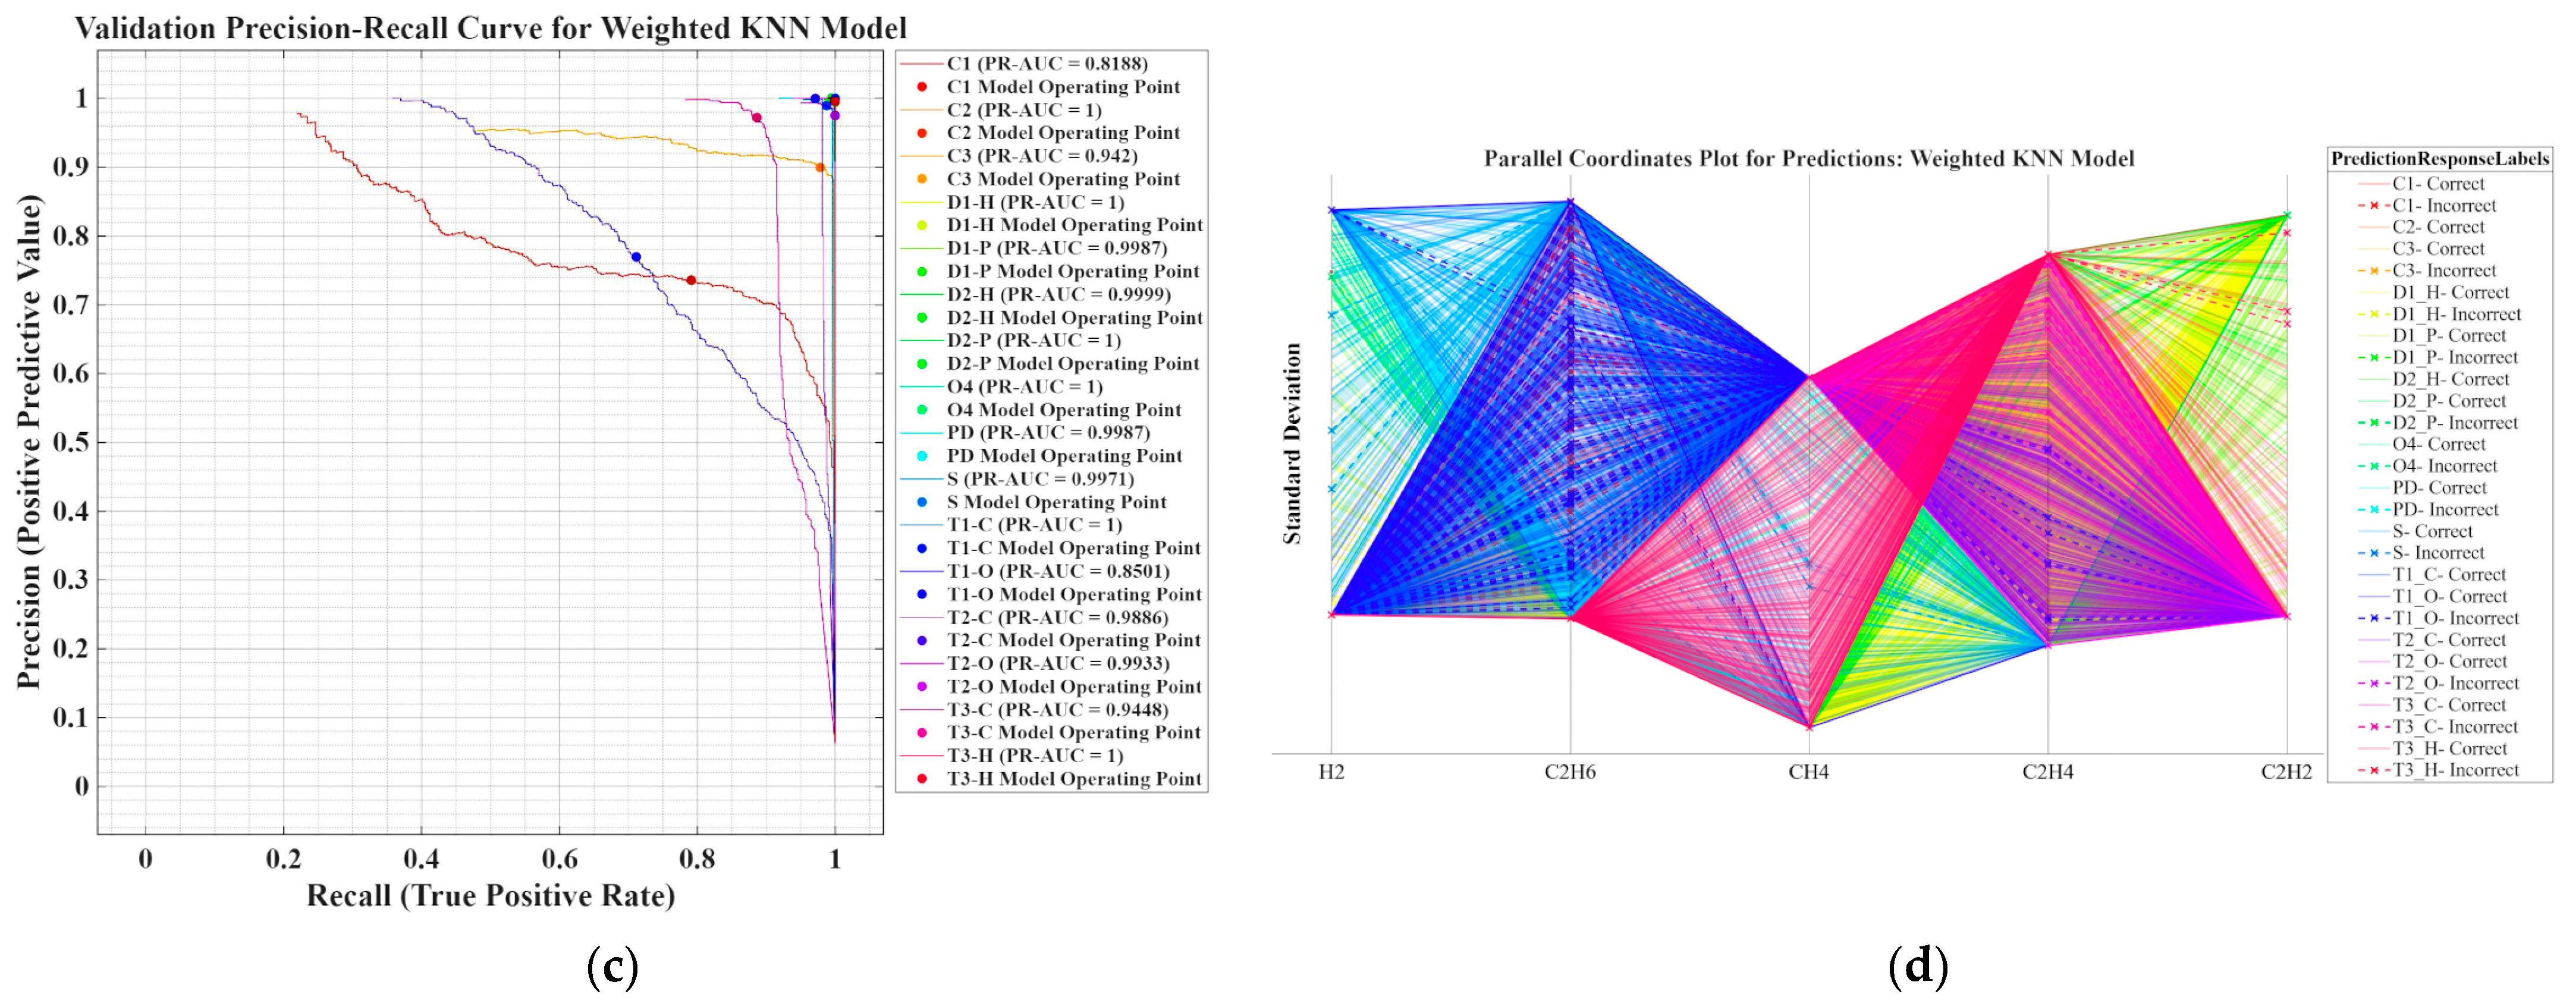
Figure 9.
Performance evaluation of the Weighted KNN classifier: (a) Confusion matrix; (b) ROC curves; (c) Precision-recall curves; (d) Parallel coordinates plot for predictions.
As shown in Figure 9b, the ROC curves indicate a high discriminatory capacity for most classes, with AUC values close to 1. The following was observed: the AUC is 1 for many classes (C2, D1-H, D1-P, D2-H, D2-P, O4, PD, T1-C, T2-O, T3-H); slightly lower values for: C1 (AUC = 0.9883), T1-O (AUC = 0.9835), T3-C (AUC = 0.9815), and T2-C (AUC = 0.9949). Although the AUC value remains high, it is generally slightly lower than the values obtained by SVM and NN. This indicates that the separation capability is less robust in areas where the classes are geometrically close. However, the ROC performance indicates that the model has a low false positive rate across most classes.
Figure 9c shows the precision–recall curves, which provide a more detailed picture of performance in difficult areas. Lower PR-AUC values are observed for: C1 (PR-AUC = 0.8188), T1-O (PR-AUC = 0.8501), and T3-C (PR-AUC = 0.9448). These results suggest that the KNN model has difficulty maintaining high accuracy and sensitivity for these classes. Notably, compared to SVM and NN, the decline in performance is more pronounced for classes in close geometric proximity, and the model is more sensitive to points in boundary regions. This observation aligns with the nature of the KNN algorithm, which relies on the local distribution of data and the selection of parameter k.
Figure 9d shows a parallel-coordinate plot that reveals a greater dispersion of misclassified samples, especially for classes C1, T1-O, and T3-C. Errors tend to occur in regions where the values of CH4 and C2H6 are similar between consecutive temperature classes; the proportion of C2H2 is similar for both T2-C and T3-C, but the distribution of H2 is less distinct. Although the KNN model more accurately reflects the local structure of the data, the neighborhood-based decision can become unstable in areas where class densities are close together. Compared to SVM, the decision boundaries are more fragmented, and the model is more sensitive to noise and boundary points.
3.1.4. Analysis of the Ensemble Bagged Trees Classifier Performance
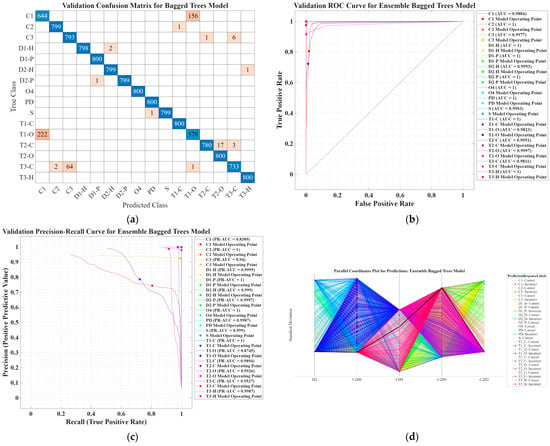
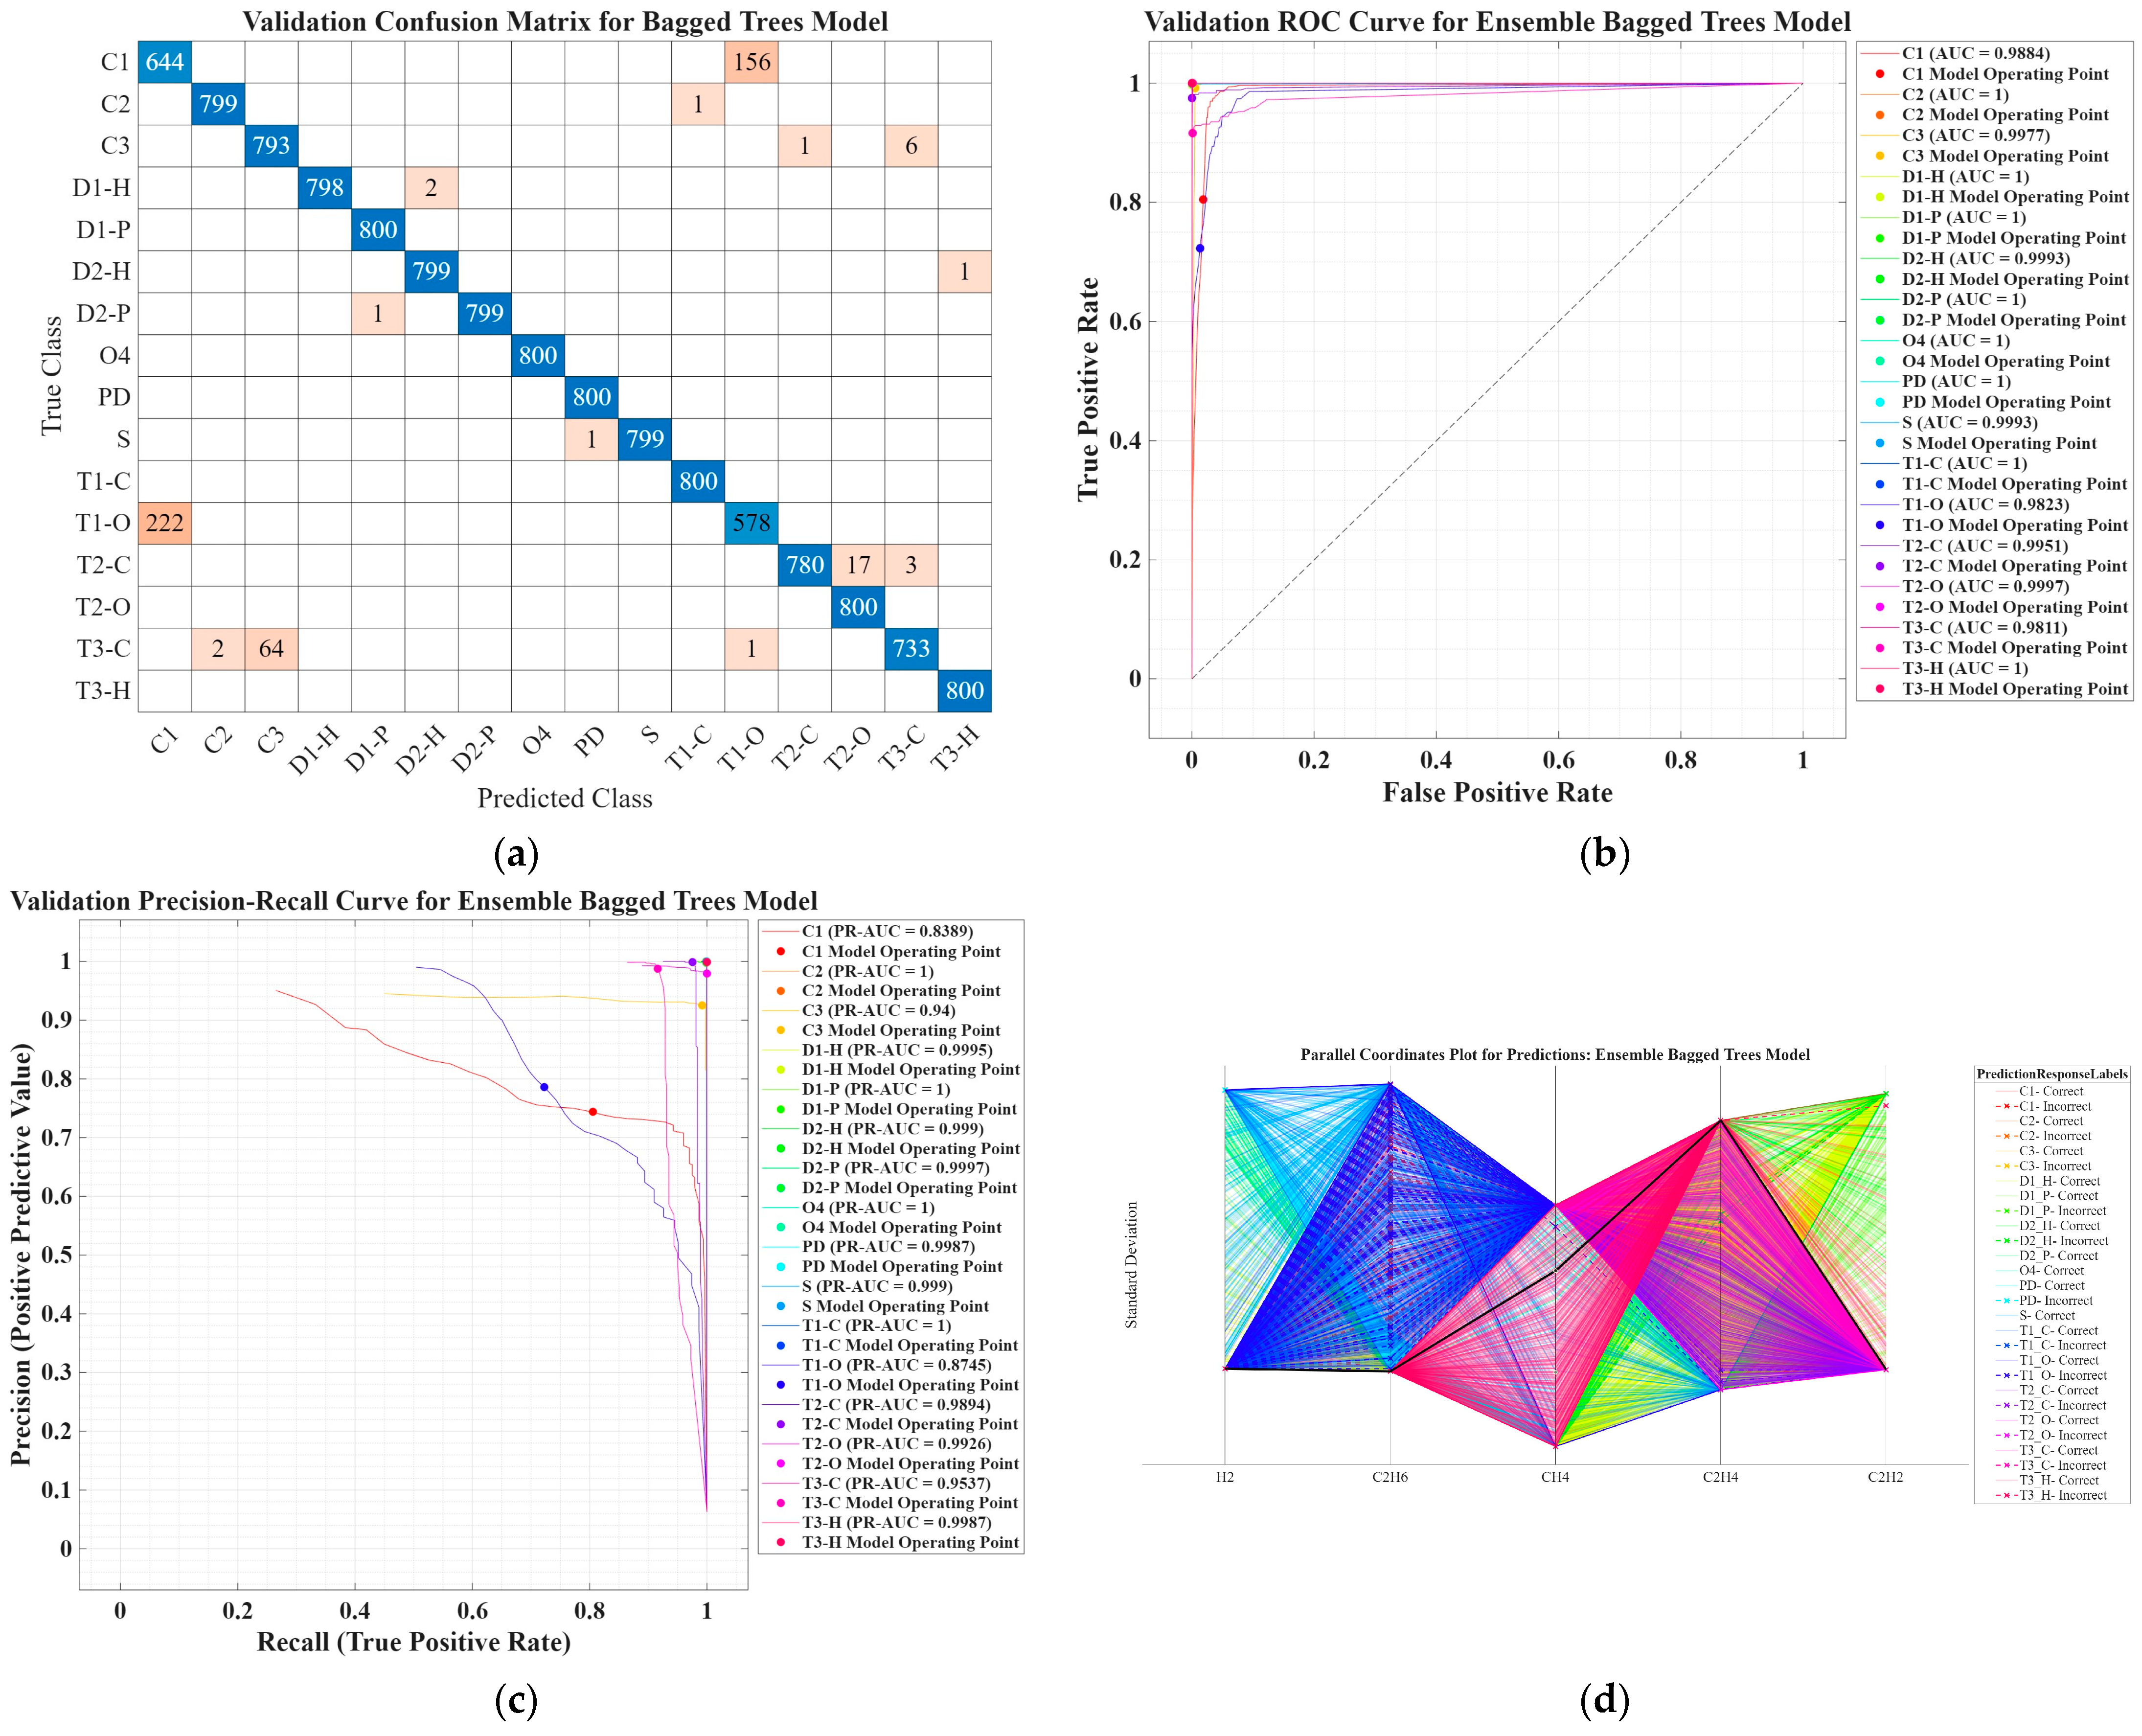
As shown in Figure 10a, the confusion matrix for the Bagged Trees ensemble classifier demonstrates very high overall performance, with most classes exhibiting values close to the diagonal (approximately 799–800 correct classifications out of 800). Classes with an excellent performance rate of almost 100% (D1-P, O4, PD, T1-C, T2-O, and T3-H) demonstrate near-perfect classification, suggesting excellent separability in the feature space. The ensemble accurately depicts the intricate boundaries between these regions within the Duval polygon. Among the problematic classes, the following are notable: C1 shows 644 correct classifications and 156 misclassifications, mostly into T1-O. This confusion reflects the natural overlap in gas distributions between the C1 regime and the T1-O zone; T1-O indicates 578 correct classifications and 222 that were classified as C1. This suggests that the decision boundary is difficult to model, even for ensemble methods; T2-C correctly identifies 780 samples and misclassifies 17 as T2-O and three as T3-C. This error occurs between thermally similar regimes where the differences in relative C2H4 and C2H2 concentrations are subtle; T3-C indicates 733 correct classifications, 64 that were misclassified as C3, two as C2, and one as T1-O; this class particularly overlaps with C3, suggesting a transition zone in the combustible gas space.
Figure 10.
Performance evaluation of the Ensemble Bagged Trees classifier: (a) Confusion matrix; (b) ROC curves; (c) Precision-recall curves; (d) Parallel coordinates plot for predictions.
As shown in Figure 10b, the AUC values are extremely high. Most classes have an AUC of 1, while a few have slightly lower values: C1 (AUC = 0.9884), T1-O (AUC = 0.9823), T3-C (AUC = 0.9811), and T2-C (AUC = 0.9951). These types of classifiers, specifically ensemble classifiers, offer excellent overall class separation capabilities. Even for the problematic classes, the AUC is greater than 0.98, indicating that the difficulty lies more with the operational threshold than with the overall discriminatory capacity.
As shown in Figure 10c, the precision–recall curves for the bagged trees ensemble classifier confirm the observations in the confusion matrix: while most classes had PR-AUC values between 0.99 and 1, some had lower values C1 (PR-AUC = 0.8389), T1-O (PR-AUC = 0.8745), and T3-C (PR-AUC = 0.9537). This suggests cross-contamination between these regions. This behavior is typical of the way the DPCC method handles physical boundaries.
Figure 10d shows the parallel coordinates plot for the Bagged Trees ensemble classifier. It reveals compact distributions for well-separated classes, frequent overlaps between C1 and T1-O, moderate overlaps between T2-C and T2-O, and increased variability for T3-C. Compared to KNN, this type of classifier reduces dispersion, indicating a better capacity to model nonlinear relationships.
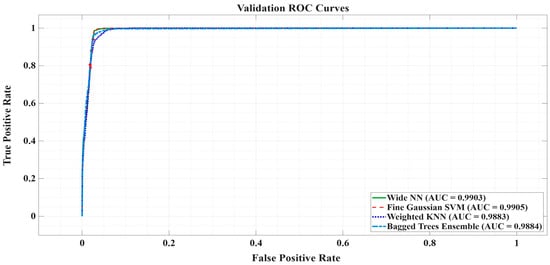
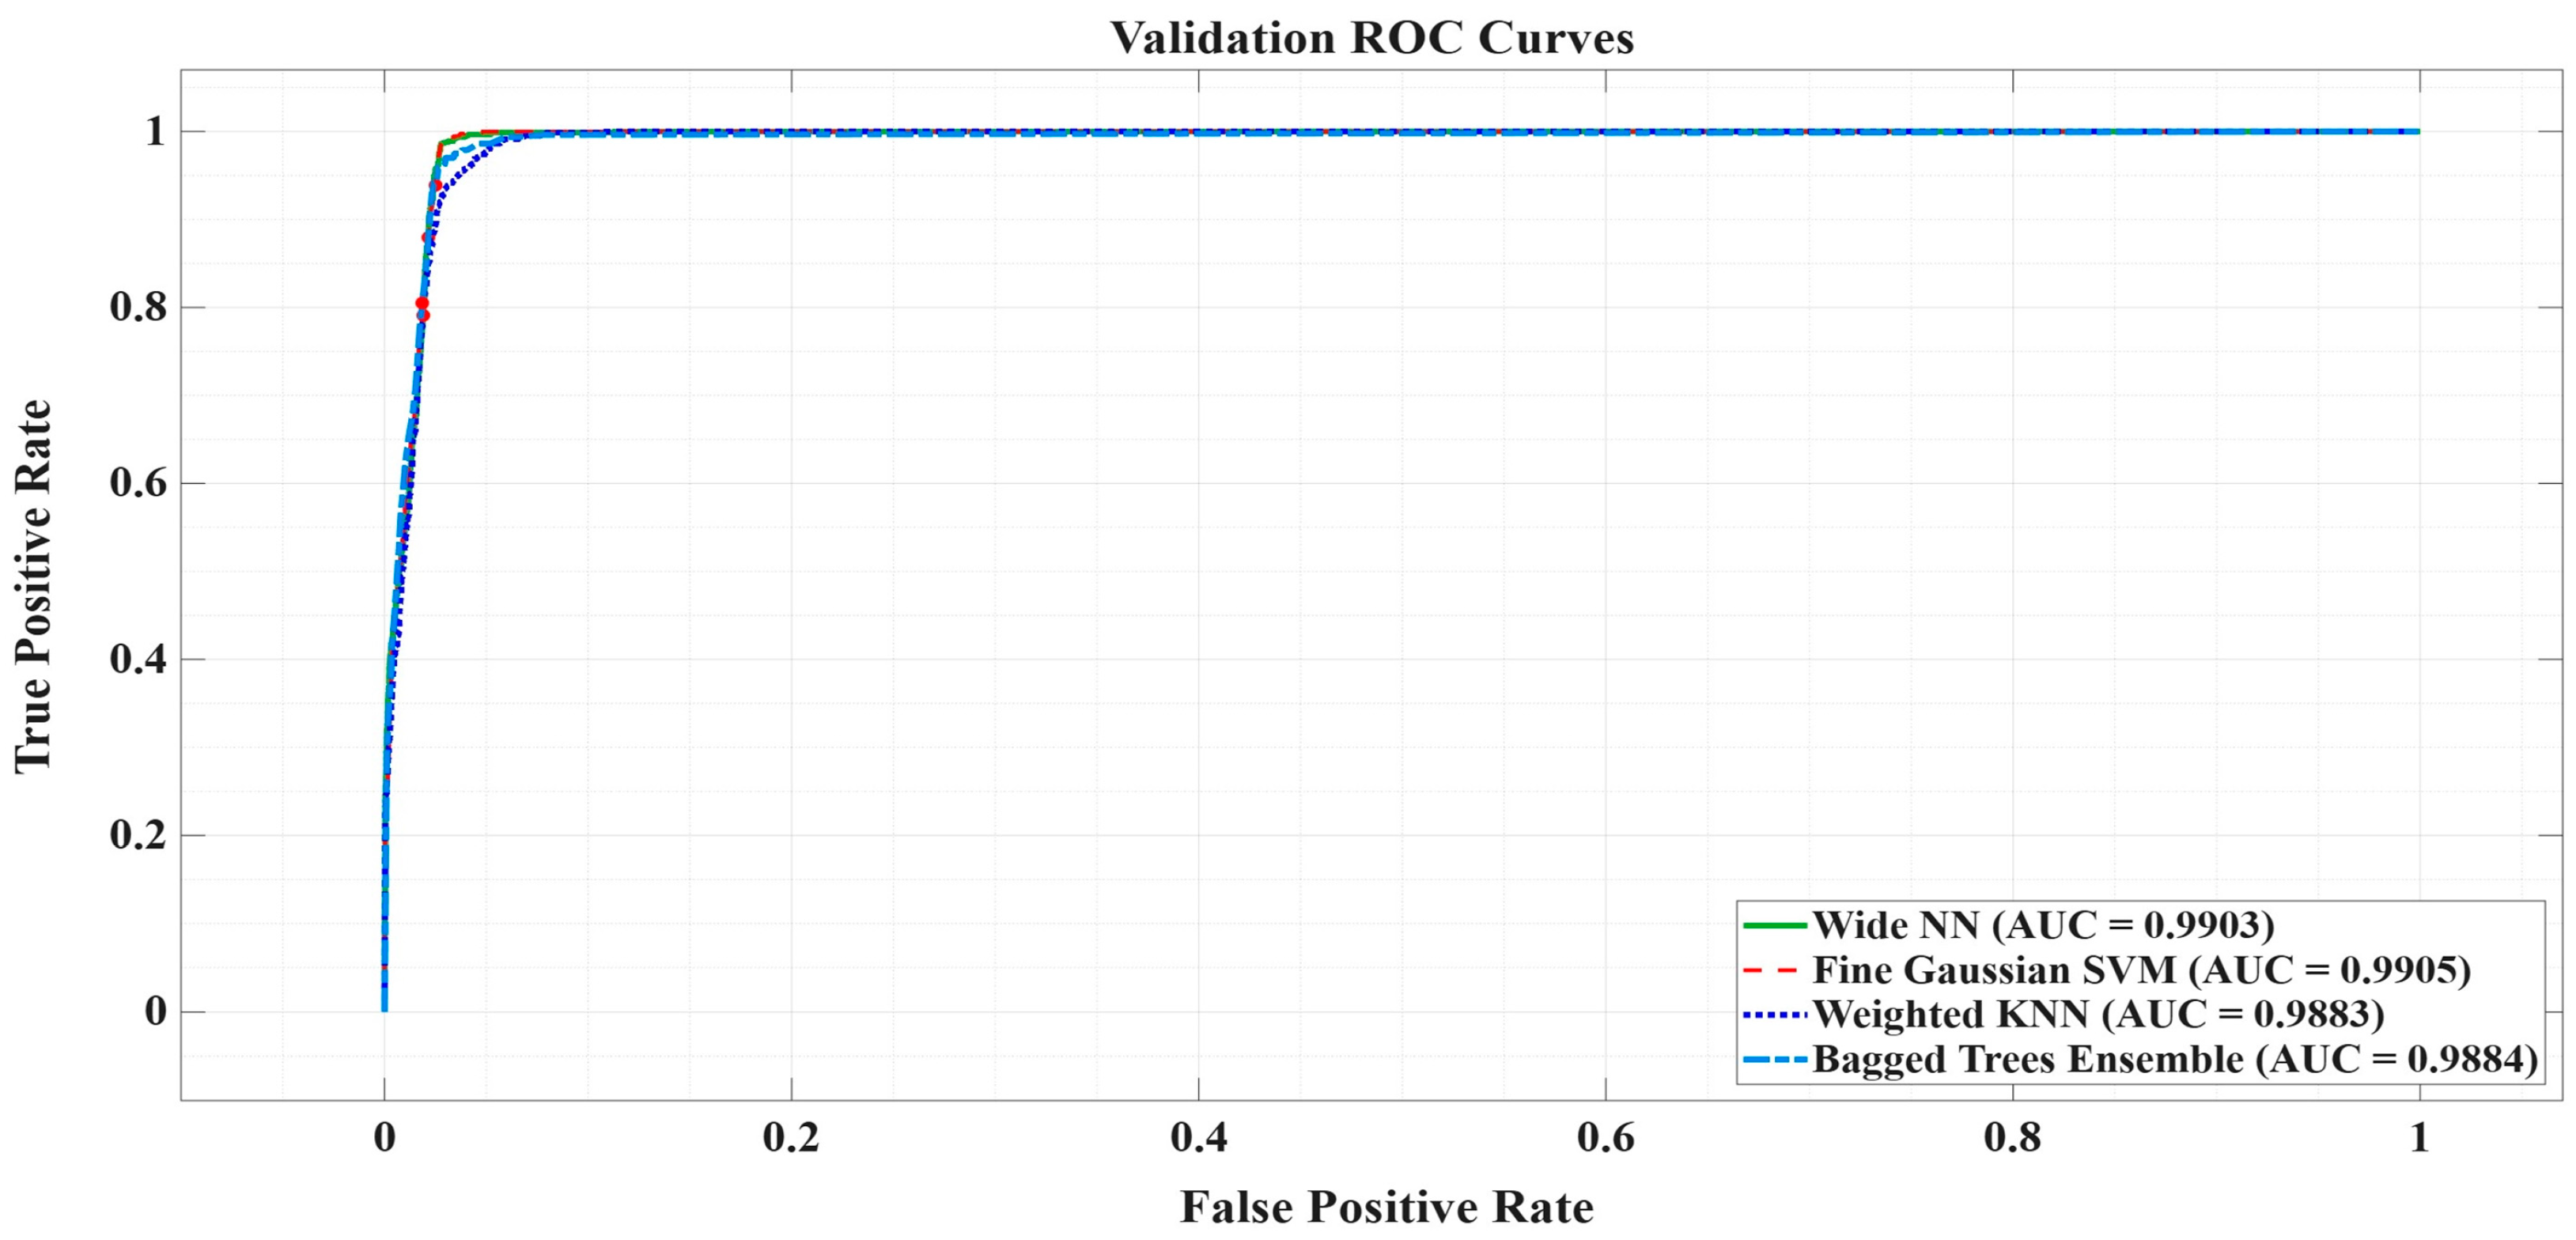
Figure 11 shows the comparative validation curve for the trained classifiers. Thus, although the differences are numerically small (less than 0.003), the Fine Gaussian SVM classifier has the highest AUC. The Wide NN classifier is extremely close. The Weighted KNN and bagged trees ensemble classifiers performed slightly worse. The curves nearly overlap, suggesting that the problem under analysis is not one of global separability, but rather one of fine-tuning the decision boundary. A steep rise in the region of very low false positive rates (FPRs) indicates excellent classification performance under conditions of low tolerance for false positives.
Figure 11.
Comparative validation curve for the four trained classifiers.
To ensure the reproducibility of the results and a fair comparative evaluation of the classifiers used, specific hyperparameter configurations were defined for each analyzed ML paradigm (see Table 8). In the case of neural networks, Narrow, Medium, Wide, Bilayered, and Trilayered architectures were used, with the default activation functions provided by the MATLAB Classification Learner environment and training based on cross-validation. The SVM classifiers were implemented using linear, polynomial, and Gaussian (RBF) kernels with different kernel scale parameter levels. For the KNN classifiers, Fine, Medium, Coarse, Cosine, Cubic, and Weighted variants were analyzed, differentiated by the number of neighbors and the distance metric used. In the case of the Ensemble classifiers, Bagged Trees, Boosted Trees, RUSBoosted Trees, and Subspace KNN methods were employed, with specific configurations regarding the number of learners and the aggregation strategy.
Table 8.
Main hyperparameters of the ML classifiers used in the proposed DPCC diagnostic framework.
3.2. Discussion
This study aimed to develop and evaluate ML classifiers that could identify types of faults in electrical transformers using data generated according to the DPCC method and corresponding to the 16 fault zones. The dataset was constructed in a physically consistent manner. This took into account the relative proportions of dissolved gases, as well as the typical ranges reported in the literature in parts per million (ppm).
The experimental results show that all four of the analyzed classifier models perform very well overall: Wide NN, Fine Gaussian SVM, Weighted KNN and Ensemble Bagged Trees. The AUC values obtained in the ROC analysis were close to one unit for most classes, demonstrating the method’s excellent discriminatory capacity between defect types. However, a detailed analysis of the confusion matrices and precision–recall curves reveals the subtle differences between the models.
All of the ML models analyzed have a high capacity to classify the defects defined in the DPCC diagram, with most classes having an AUC value close to 1. The Fine Gaussian SVM classifier offers the best balance of performance, stability, and generalization. It is recommended for use in automated diagnostic applications. Classifier models based on decision trees, such as ensemble bagged trees, are a robust alternative with performance comparable to SVMs and good stability to data variations. NNs offer high expressive power but may exhibit slightly increased sensitivity in the boundary regions between physically overlapping classes. KNN methods are suitable for well-separated datasets, but are less robust in the presence of structural overlaps.
The persistent confusion among certain groups indicates the physical limitations of the DPCC method, rather than solely the algorithmic performance. This suggests that incorporating additional information, such as temporal trends in gas levels, could improve diagnostic performance.
Overall, the analysis confirms that the classifiers’ high performance is determined by the physical consistency of the generated dataset and the DPCC method’s well-defined geometric structure. However, a weighted ensemble approach is needed to further reduce uncertainty in border areas—one capable of combining the advantages of multiple classification paradigms.
Compared with ML methods reported in the literature for transformer fault diagnosis based on DGA, the proposed method presents several important advantages. Most existing approaches use either conventional geometric methods (Duval Triangle, Pentagon 1, or Pentagon 2) or individual classifiers such as ANN, SVM, or Random Forest applied directly to gas concentrations. In many cases, defects associated with electric arcs and insulation paper carbonization are not integrated into a unified geometric structure, while transition regions remain difficult to classify.
The proposed DPCC method extends the CDP approach by introducing a higher level of diagnostic granularity and integrating the subzones associated with electric arc defects and insulation paper carbonization into a single geometric representation. In addition, the use of a weighted probabilistic ensemble framework allows the combination of the advantages of multiple ML paradigms and leads to more robust classification in geometrically ambiguous regions.
The obtained results, characterized by high accuracy values and AUC values close to 1 for most classes, demonstrate that the proposed method provides competitive performance and superior defect separation capability compared with many previously reported ML methods in the literature. These comparisons are summarized in Table 9.
Table 9.
Comparative analysis of the proposed DPCC-Weighted Ensemble method and other ML-based transformer fault diagnosis approaches reported in the literature.
The obtained results confirm that the DPCC method offers advantages compared with conventional Duval Pentagon-based representations and existing hybrid ML approaches. The integration of the subzones associated with electric arc defects and insulation paper carbonization into a single geometric structure enables more precise defect localization and more detailed separation of diagnostic classes.
The robustness of the proposed method with respect to variations in gas concentrations is supported by the way the dataset used for training and validation was constructed. The dataset was generated in a physically consistent manner, respecting both the relative gas proportions and the realistic concentration ranges reported in the literature and in the analyzed real cases. By including distributions corresponding to transition regions between defects, the dataset naturally contains local variations in gas concentrations similar to the effects produced by measurement noise and uncertainties specific to real-world applications. Consequently, the classifiers were trained and validated under conditions close to class boundaries. The results obtained from the confusion matrices and precision–recall curves confirm that the classification difficulties are mainly concentrated in these boundary regions, particularly for the T1-O, C1, and T3-C classes. Furthermore, the weighted probabilistic ensemble mechanism reduces sensitivity to local fluctuations and contributes to improving the stability and robustness of the final diagnosis.
3.3. Implementation of a Weighted Ensemble Learning Framework for Classifying Transformer Faults Based on the DPCC Method
A Weighted Probabilistic Ensemble method was used to improve the robustness of defect classification based on dissolved gas analysis (DGA). This method combines four independent classifiers:
where C1—Wide NN classifier, C2—Fine Gaussian SVM classifier, C3—Weighted KNN classifier, and C4—Bagged Trees Ensemble classifier.
Each model provides a probability distribution for the different defect classes.
Let represent the validation accuracy of classifier Ci.
The weights are defined in proportion to the performance of each model based on the following formula:
where M = 4.
With the property
This ensures that each classifier’s contribution is normalized.
For each input sample x, a classifier provides a set of probabilities:
where represents a class (type of defect), and .
The overall score for each class is defined as follows:
This is a weighted average of the individual probability distributions.
The final class is determined by the following:
This rule selects the class with the highest overall score.
The confidence level associated with the prediction is defined as follows:
as a percentage:
This value reflects the weighted tuning among the classifiers. The implemented method can be interpreted as a simplified version of Bayesian model averaging (BMA), in which validation accuracy serves as an empirical estimate of a model’s correctness. Compared to Majority Voting, the weighted method penalizes low-performing models, reduces decision variance, and increases classification stability. It also improves robustness in ambiguous regions of Duval space. The following advantages apply when classifying defects within the space defined by the DPCC method: the boundaries between regions can be close to each other, models may behave differently in boundary regions, and the weighted ensemble reduces sensitivity to local fluctuations. Therefore, this method provides a more stable and consistent estimate of the defect type.
Although the individual classifiers achieved high performance, with accuracy values ranging between approximately 95% and 96.5%, the analysis of the confusion matrices and precision–recall curves shows that each model exhibits different sensitivities in transition regions between defects. For example, certain classes, such as T1-O, C1, and T3-C, generate different classification errors depending on the ML paradigm used.
The weighted probabilistic ensemble framework reduces these variations through the weighted aggregation of the probability distributions provided by the individual classifiers. As a result, the final decision becomes less dependent on the characteristics of a single model and more robust in the geometrically ambiguous regions of the DPCC representation. Therefore, the main advantage of the ensemble method lies in improving the stability and consistency of the diagnosis, as well as reducing ambiguities in boundary regions between classes, rather than simply increasing the overall accuracy.
4. Validation of the Proposed Method
The proposed method was validated by analyzing data from several real-world cases described in the literature. Additionally, the results obtained were compared to those reported for these situations.
The following section presents two cases that are characterized by critical defects. In the first case, the defect was identified in a timely manner. This allowed the transformer to be repaired and returned to service. In the second case, the transformer was severely damaged, requiring replacement.
4.1. Case 1
Case 1 refers to a 100 MVA transformer that was commissioned in 2002 [31]. It is equipped with a multigas analyzer that can detect seven gases.
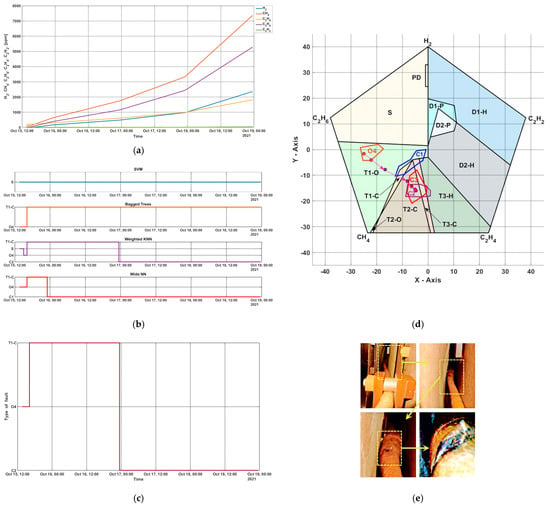
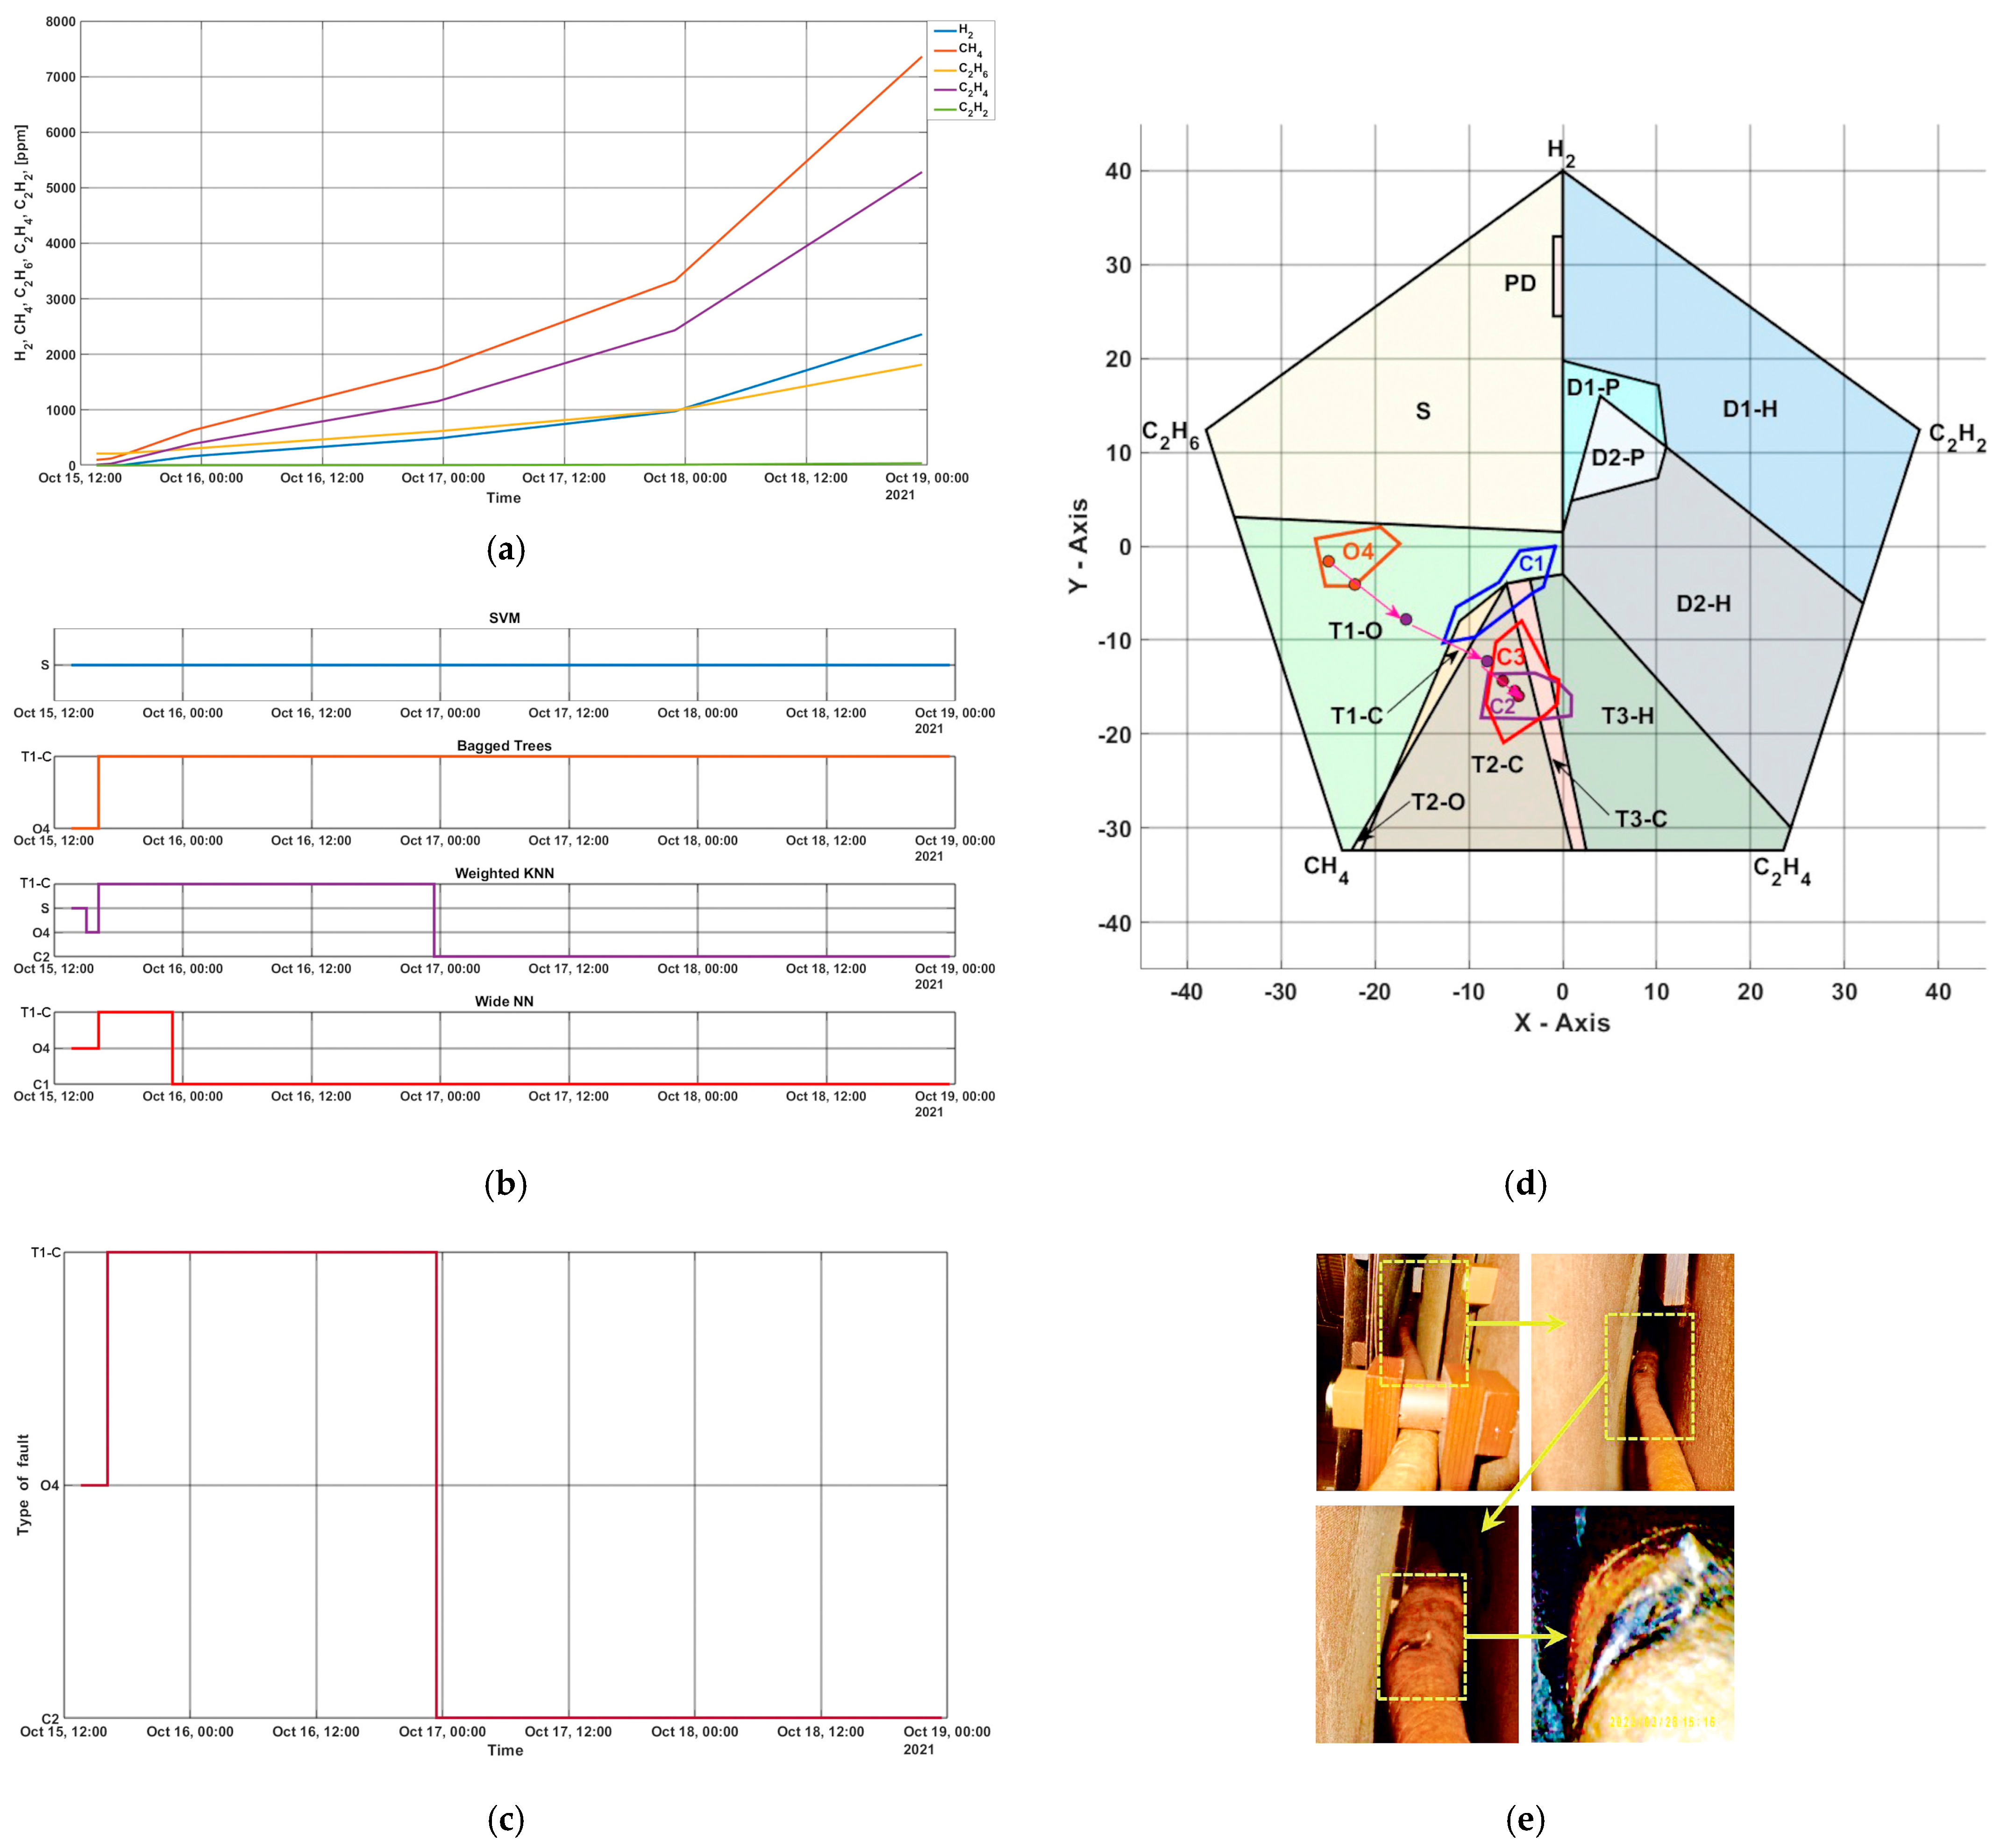
A rapid increase in the amount of gas forming in its tank was observed on 15 October 2021. As the issue became more pronounced, the transformer was taken out of service on October 19 for further investigation and offline electrical measurements. Production was unaffected by the redistribution of the load to other transformers. Table 10 displays the gas concentration readings from 15 to 19 October 2021. Figure 12a show the gas concentrations evolution.
Table 10.
Changes in gas concentrations from 15 to 19 October 2021 [31].
Figure 12.
Evolution of dissolved gas concentrations and identified defects—Case 1: (a) Gas concentrations evolution; (b) Faults evolution based on Wide NN, Fine Gaussian SVM, Weighted KNN, and Bagged Trees Ensemble; (c) Faults evolution based on Weighted Ensemble Learning Framework; (d) DPCC classification software interface with faults representation; (e) Internal visual inspection using a video endoscope.
When a defect is suspected, all available data is analyzed to determine the necessary course of action. For this purpose, various offline diagnostic tests are used to evaluate the condition of the transformer’s components.
In this case, attempts to locate the defect were inconclusive. The test results did not reveal any significant changes that clearly indicated its nature or location. An internal visual inspection was subsequently performed using a video endoscope, which revealed the following:
- A cable was identified between the medium-voltage coil and the bushing that clearly showed a point of failure;
- The probable cause is related to the welded joint;
- The high local temperature caused the paper-and-oil insulation to produce gas.
The faulty transformer was replaced within a few days. In the meantime, the other units took the load. A visual inspection confirmed the presence and location of the defect, which was consistent with the DGA diagnosis results.
Faults evolution based on Wide NN, Fine Gaussian SVM, Weighted KNN, and Bagged Trees Ensemble is presented in Figure 12b. Faults evolution based on Weighted Ensemble Learning Framework is presented in Figure 12c.
As shown in Figure 12d, applying the proposed method within the DPCC reveals that the evolution of gas concentrations caused the defect to transition from paper overheating without carbonization (O4) to a thermal defect accompanied by paper carbonization of the C2–C3 type. The characteristic points are located in the overlap zone of these subzones. This classification is also confirmed by the DPCC classification software (Figure 12). The analysis indicates that the defect is on the surface of a cable. This finding was confirmed by an internal visual inspection using a video endoscope (see Figure 12e) [31].
4.2. Case 2
The defect has progressed to such a severe stage that the transformer must be replaced [6]. Table 11 illustrates the trends in gas concentrations as determined by the analysis of oil samples collected from March 2017 to December 2018.
Table 11.
Evolution of gas concentrations from March 2017 to December 2018 [6].
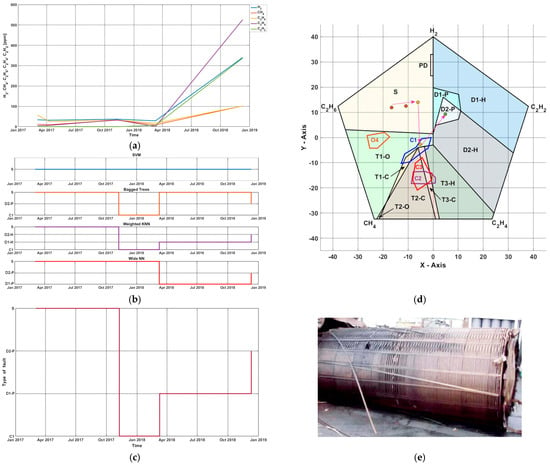
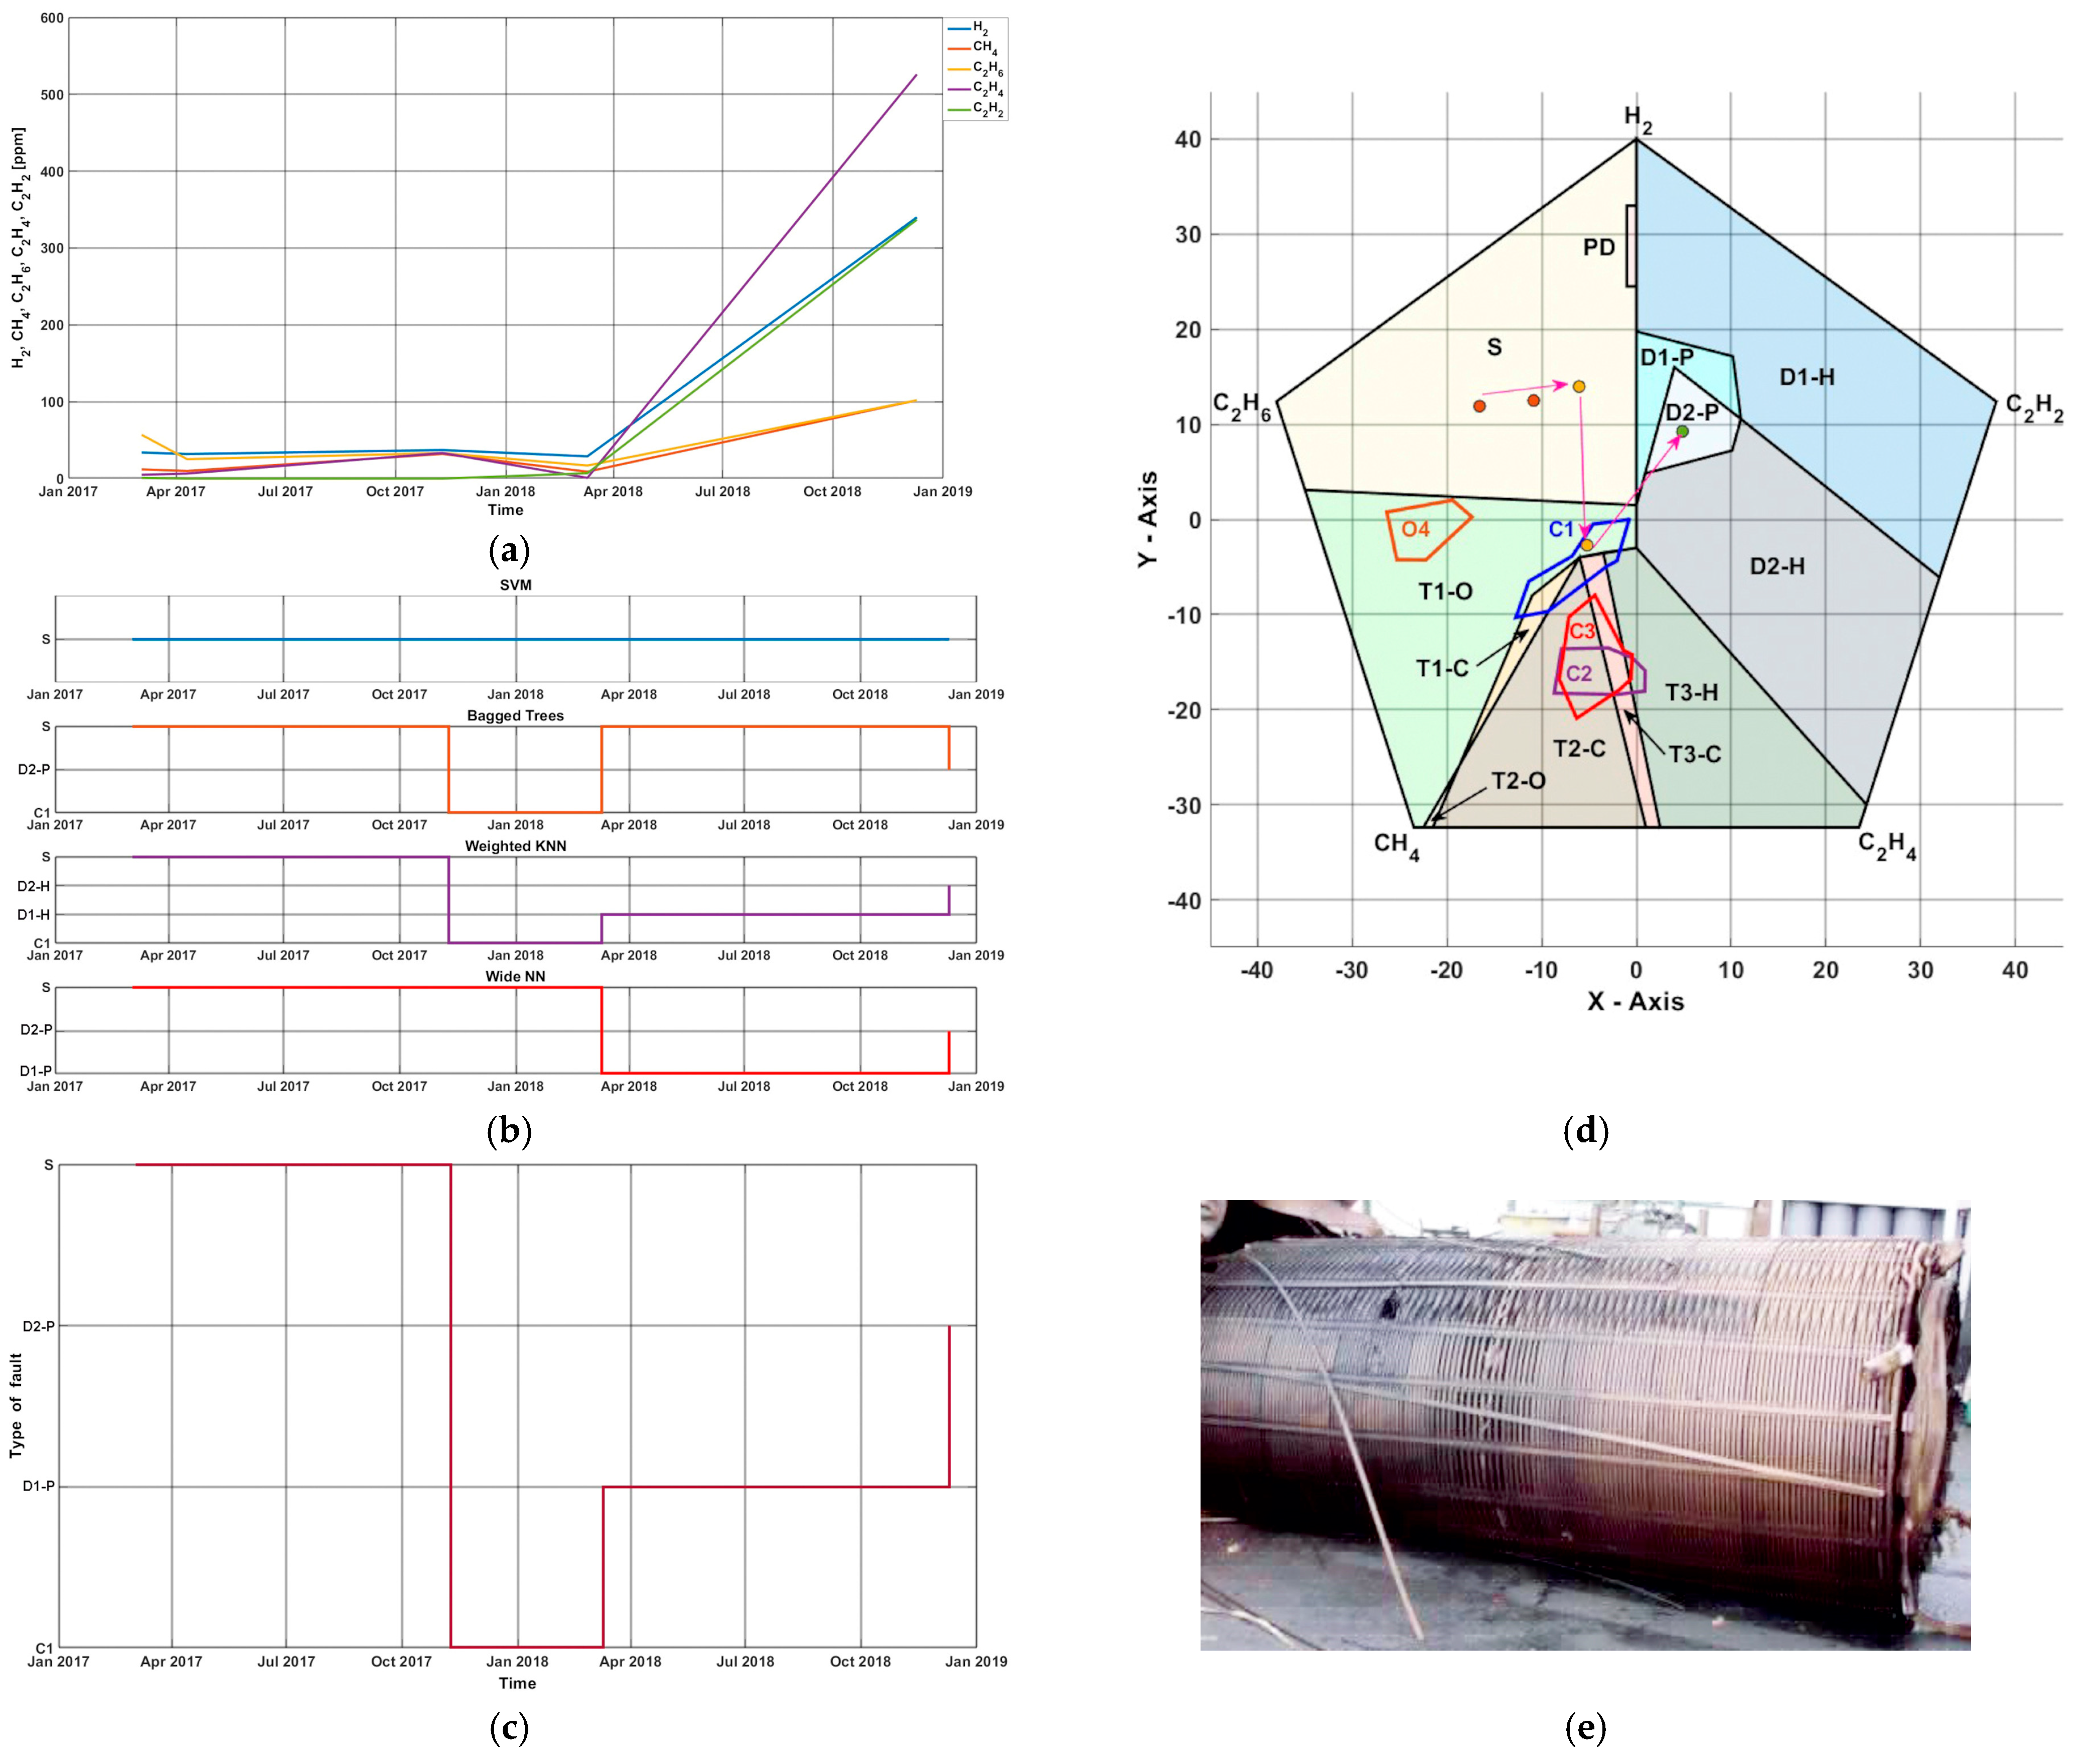
Figure 12a show the gas concentrations evolution. Faults evolution based on Wide NN, Fine Gaussian SVM, Weighted KNN, and Bagged Trees Ensemble is presented in Figure 13b. Faults evolution based on Weighted Ensemble Learning Framework is presented in Figure 13c.
Figure 13.
Evolution of gases and faults—Case 2: (a) Gas concentrations evolution; (b) Faults evolution based on Wide NN, Fine Gaussian SVM, Weighted KNN, and Bagged Trees Ensemble; (c) Faults evolution based on Weighted Ensemble Learning Framework; (d) DPCC classification software interface with faults representation; (e) Results of the postmortem analysis.
In April 2018, an analysis using the Pentagon 2 Duval method revealed a thermal defect involving paper charring of the O-C type. The defect was located at the boundary between zones O and C. However, the defect was not considered critical at the time. In December, a high-energy electric arc occurred, causing significant damage to the transformer. The postmortem analysis revealed that the defect was caused by the winding conductor’s inadequate insulation, which led to localized charring of the paper and ultimately to winding breakthrough (see Figure 13e) [6]. According to the gas concentration values in Table 7, the proposed method in the DPCC (Figure 13d) shows that the defect progresses from type S to type C1 (a thermal defect involving the carbonization of paper between turns or inside windings) and then to a D2-P type defect (a high-energy electric arc in paper). This evolution is also confirmed by the DPCC classification software application (Figure 13). Consequently, the defect is located within the windings. This finding was confirmed by the results of the postmortem analysis (Figure 13e) [6].
5. Conclusions
This paper proposes an integrated framework for diagnosing faults in power transformers. This framework combines the DPCC geometric model with modern ML techniques and a Weighted Probabilistic Ensemble strategy. The first stage involved developing the DPCC by integrating the areas from Duval Pentagons 1 and 2, as well as the electric arc and paper charring subzones, into a single geometric structure. This resulted in 16 distinct defect regions. This integration simplifies the use of the two pentagons separately and makes it easier to implement software for monitoring and predictive maintenance applications. A physically consistent dataset was generated based on this geometric structure, respecting the relative proportions of the key gases and realistic concentration ranges in parts per million (ppm). The comparative evaluation of the classifiers revealed high performance across all analyzed paradigms. Wide NN achieved the highest accuracy (96.53%), followed by Fine Gaussian SVM (96.07%), Bagged Trees Ensemble (96.26%), and Weighted KNN (95.74%). The AUC values close to 1 for most classes confirm the high separability of the regions defined by the DPCC.
A detailed error analysis revealed that the majority of classification difficulties occur in the transition regions between energetically close thermal faults and defects associated with paper charring, particularly for classes T1-O and C1. These overlaps are physically justified and accurately reflect the complexity of transformer degradation phenomena. To reduce uncertainty in decision-making in these regions, a Weighted Probabilistic Ensemble strategy was implemented. In this strategy, each classifier’s contribution is proportional to its validation performance. Weighted probability aggregation led to increased prediction stability and improved classification consistency, without significantly increasing computational complexity. The results show that combining DPCC geometric modeling with ML techniques and a weighted probabilistic aggregation mechanism creates a robust, scalable diagnostic system suitable for software applications that monitor power transformers online.
For future research, we propose validating the method using real-world industrial operation datasets, integrating continuous DGA data streams in real time, and investigating the use of deep learning methods to model defect temporal evolution.
Author Contributions
Conceptualization, A.-M.A., C.-I.N., M.-C.N. and M.N.; methodology, A.-M.A. and M.-C.N.; software, C.-I.N. and M.N.; validation, A.-M.A., C.-I.N. and M.N.; formal analysis, A.-M.A.; investigation, A.-M.A. and M.-C.N.; resources, A.-M.A. and M.-C.N.; data curation, A.-M.A. and M.-C.N.; writing—original draft preparation, A.-M.A.; writing—review and editing, A.-M.A., C.-I.N., M.-C.N. and M.N.; visualization, C.-I.N. and M.N.; supervision, A.-M.A. and M.-C.N.; project administration, M.-C.N.; funding acquisition, M.-C.N. All authors have read and agreed to the published version of the manuscript.
Funding
This paper was elaborated as part of the NUCLEU Program within the framework of the National Research, Development, and Innovation Plan for 2022–2027, developed with the support of the Ministry of Research, Innovation, and Digitization, Project No. PN 23 33 02 03.
Data Availability Statement
The original contributions presented in this study are included in the article. Further inquiries can be directed to the corresponding author.
Conflicts of Interest
The authors declare no conflicts of interest.
References
- Miladinović, N.; Polužanski, V.; Radin, V. The application of artificial intelligence methods for the interpretation of dissolved gas analysis results in transformer oil. In Proceedings of the E-Business Technologies Conferences, Belgrade, Serbia, 25–27 September 2025. [Google Scholar]
- CIGRÉ. CIGRÉ Technical Brochure No. 887—Life Extension of Oil Filled Transformers and Shunt Reactors; W.G. A2.55; CIGRE: Paris, France, 2022; ISBN 978-2-85873-592-1. [Google Scholar]
- CIGRÉ. CIGRÉ Technical Brochure No. 962—Guide for Transformer Maintenance; W.G. A2.69; CIGRÉ: Paris, France, 2025; ISBN 978-2-85873-667-6. [Google Scholar]
- Abdullaev, A.A.U.; Tuychiev, Z.Z.J.; Tulkin, K.; Kobilov, M.K.U.; Najmitdinov, Z.Z.U.; Sharipov, M.Z.U. A review on power transformer failures: Analysis of failure types and causative factors. Indones. J. Electr. Eng. Comp. Sci. 2025, 38, 713–722. [Google Scholar] [CrossRef] [Scilit]
- CIGRÉ. CIGRÉ Technical Brochure No. 761—Condition Assessment of Power Transformers; WG A2.49; CIGRÉ: Paris, France, 2019; ISBN 978-2-85873-463-4. [Google Scholar]
- CIGRÉ. CIGRÉ Technical Brochure No. 771—Advances in DGA Interpretation; JWG D1/A2.47; CIGRE: Paris, France, 2019; ISBN 978-2-85873-473-3. [Google Scholar]
- IEEE. IEEE Std C57.104™-2019—Guide for the Interpretation of Gases Generated in Mineral Oil-Immersed Transformers; Electronic; Institute of Electrical and Electronics Engineers: Piscataway, NJ, USA, 2019; ISBN 978-1-5044-5973-0. [Google Scholar]
- IEC. CEI/IEC 60599:2022—Mineral Oil-Filled Electrical Equipment in Service—Guidance on the Interpretation of Dissolved and Free Gases Analysis, 4th ed.; International Electrotechnical Commission: Geneva, Switzerland, 2022; p. 8. [Google Scholar]
- Nanfak, A.; Samuel, E.; Fofana, I.; Meghnefi, F.; Ngaleu, M.G.; Kom, C.H. Traditional fault diagnosis methods for mineral oil-immersed power transformer based on dissolved gas analysis: Past, present and future. IET Nanodielectr. 2024, 7, 97–130. [Google Scholar] [CrossRef] [Scilit]
- Duval, M. A review of faults detectable by gas-in-oil analysis in transformers. IEEE Electr. Insul. Mag. 2002, 18, 8–17. [Google Scholar] [CrossRef] [Scilit]
- Duval, M. The duval triangle for load tap changers, non-mineral oils and low temperature faults in transformers. IEEE Electr. Insul. Mag. 2008, 24, 22–29. [Google Scholar] [CrossRef] [Scilit]
- Duval, M.; Lamarre, L. The duval pentagon-a new complementary tool for the interpretation of dissolved gas analysis in transformers. IEEE Electr. Insul. Mag. 2014, 30, 9–12. [Google Scholar] [CrossRef] [Scilit]
- Aciu, A.-M.; Enache, S.; Nițu, M.-C. A Reviewed Turn at of Methods for Determining the Type of Fault in Power Transformers Based on Dissolved Gas Analysis. Energies 2024, 17, 2331. [Google Scholar] [CrossRef] [Scilit]
- Cheim, L.; Duval, M.; Haider, S. Combined Duval Pentagons: A Simplified Approach. Energies 2020, 13, 2859. [Google Scholar] [CrossRef] [Scilit]
- Hu, H.; Wang, D.; Fu, J.; Mao, Y.; Zhang, Z.; Wu, D. Software implementation of automatic fault identificationbased on the Duval Pentagon. J. Phys. Conf. Ser. 2020, 1633, 012135. [Google Scholar] [CrossRef] [Scilit]
- Zhang, Y. Application of Dissolved Gas Analysis Standards and Methods on Raw Gas Sample. Int. J. Front. Eng. Technol. 2022, 4, 64–67. [Google Scholar] [CrossRef] [Scilit]
- Abdelwahab, S.A.M.; Taha, I.B.; Fahim, R.; Ghoneim, S.S. Transformer fault diagnose intelligent system based on DGA methods. Sci. Rep. 2025, 15, 8263. [Google Scholar] [CrossRef] [Scilit] [PubMed]
- Yu, H.; Wang, X.; Chen, Q.; Yang, D.; Gao, X.; Du, H. Evaluation and optimization of the Duval Pentagon method for diagnosing various types of transformer faults. Electr. Eng. 2025, 107, 11431–11439. [Google Scholar] [CrossRef] [Scilit]
- Suwarno; Sutikno, H.; Prasojo, R.A.; Abu-Siada, A. Machine learning based multi-method interpretation to enhance dissolved gas analysis for power transformer fault diagnosis. Heliyon 2024, 10, e25975. [Google Scholar] [CrossRef] [Scilit] [PubMed]
- Benmahamed, Y.; Kherif, O.; Chiheb, S.; Teguar, M.; Ghoneim, S.; Boubakeur, A. A New Multi-Path Hybrid Classifier for Transformer Oil Fault Diagnostic. ENP Eng. Sci. J. 2025, 5, 29–38. [Google Scholar] [CrossRef] [Scilit]
- Kumar, D.; Dutta, S.; Keen Raymond, W.J.; Bin Illias, H.A.; Yee, Y.S.; Von, T.Y. Identifying Incompatibilities of the Pentagon Methods for Dissolve Gas Analysis using Validation Indices. In Proceedings of the Innovations in Power and Advanced Computing Technologies (i-PACT), Surabaya, Indonesia, 25–26 September 2025. [Google Scholar] [CrossRef] [Scilit]
- An, S.; Ahn, D. Hybrid AI Model for Predicting Transformer Failure Types and Diagnosing Anomalies Using Duval Characteristics. In Proceedings of the International Conference on Electronics, Information, and Communication (ICEIC), Macau, China, 18–21 January 2026. [Google Scholar] [CrossRef] [Scilit]
- Kashiwagi, F.N.; Michalski, M.A.d.C.; de Souza, G.F.M.; da Silva, H.J.B.; Côrtes, H.M. Probabilistic Prognostics and Health Management of Power Transformers Using Dissolved Gas Analysis Sensor Data and Duval’s Polygons. Sensors 2025, 25, 6520. [Google Scholar] [CrossRef] [Scilit] [PubMed]
- Prasojo, R.A.; Putra, M.A.A.; Apriyani, M.E.; Ekojono; Rahmanto, .A.N.; Ghoneim, S.S.; Mahmoud, K.; Lehtonen, M.; Darwish, M.M. Precise transformer fault diagnosis via random forest model enhanced by synthetic minority over-sampling technique. Electr. Power Syst. Res. 2023, 220, 109361. [Google Scholar] [CrossRef] [Scilit]
- Nițu, M.-C.; Aciu, A.-M.; Nicola, C.-I.; Nicola, M. Transformer Fault Detection Using DGA Based on Duval Combined Pentagons and ANN Classifiers. In Proceedings of the International Conference on Electrical Systems & Automation (ICESA), Troyes, France, 22–24 October 2025. [Google Scholar] [CrossRef] [Scilit]
- Aciu, A.-M.; Nicola, C.-I.; Nicola, M.; Nițu, M.-C. Complementary Analysis for DGA Based on Duval Methods and Furan Compounds Using Artificial Neural Networks. Energies 2021, 14, 588. [Google Scholar] [CrossRef] [Scilit]
- Moradi, E.; Elsisi, M.; Mahmoud, K.; Lehtonen, M.; Darwish, M.M.F. Robust deep neural networkbased internet of things for power transformer fault diagnosis under imbalanced data and uncertainties. Int. J. Electr. Power Energy Syst. 2025, 168, 110731. [Google Scholar] [CrossRef] [Scilit]
- Acikgoz, N.; Sazli, M.H.; Kosalay, I. A Comprehensive Review of Transformer Fault Diagnosis Studies Based on Dissolved Gas Analysis: Classical Methods, Historical Development of the Devices Used, Artificial Intelligence Based Methods, Accuracy of Classifications of Predictions. Elektron. Elektrotechnika 2025, 31, 4–21. [Google Scholar] [CrossRef] [Scilit]
- Duval, M.; Buchacz, J. Identification of Arcing Faults in Paper and Oil in Transformers—Part I: Using the Duval Pentagons. IEEE Electr. Insul. Mag. 2022, 38, 19–23. [Google Scholar] [CrossRef] [Scilit]
- Duval, M.; Buchacz, J. Detection of Carbonization of Paper in Transformers Using Duval Pentagon 2 and Triangle 5. IEEE Trans. Dielectr. Electr. Insul. 2023, 30, 1534–1539. [Google Scholar] [CrossRef] [Scilit]
- Leivo, S. Catastrophic transformer failure prevented with real time DGA, presented during the webinar: Lessons learned: How one power utility averted. Vaisala Webinar Team, 2 April 2024. Available online: https://www.vaisala.com/en/events/webinars/lp/lessons-learned-how-one-power-utility-averted-disaster-through-online-dga (accessed on 15 December 2025).

Disclaimer/Publisher’s Note: The statements, opinions and data contained in all publications are solely those of the individual author(s) and contributor(s) and not of MDPI and/or the editor(s). MDPI and/or the editor(s) disclaim responsibility for any injury to people or property resulting from any ideas, methods, instructions or products referred to in the content. |
© 2026 by the authors. Licensee MDPI, Basel, Switzerland. This article is an open access article distributed under the terms and conditions of the Creative Commons Attribution (CC BY) license.