


Abstract
Overall equipment effectiveness (OEE) is a consolidated metric for manufacturing performance, but the exponential growth of data generated by manufacturing execution systems (MES) in Industry 4.0 environments renders manual analysis impractical. This study investigates whether three freely available generative artificial intelligence (AI) tools—ChatGPT, Gemini, and Copilot—can support the diagnosis of OEE losses and the formulation of improvement actions in a real CNC machining cell. A single-case, mixed-method study was conducted in a Brazilian metalworking company from January 2023 to July 2025, using 31 months of MES-derived OEE data from a two-lathe U-shaped cell. The three large language models were queried under an identical prompt protocol, and their outputs were benchmarked against operationalized criteria of consistency, depth, and sensitivity, then validated by a cross-functional team of operations, maintenance, quality, and tooling experts. All three tools converged in identifying availability as the main loss driver (with setup-time growth as a secondary bottleneck), while differing in diagnostic depth and sensitivity. The validated diagnostics were consolidated into a five-phase strategic roadmap structured by the 5W2H method, producing expected ranges, derived from AI-projected scenarios and cross-functional team consensus, of approximately +18 percentage points in availability and +22 percentage points in cell OEE over a 90-day horizon. These ranges represent projections to be empirically validated in a planned longitudinal follow-up study, not post-intervention measurements. The study contributes a replicable low-cost framework for integrating free generative AI into OEE management and explicitly documents the limitations of non-deterministic, uncurated LLMs in industrial decision support.
1. Introduction
Global manufacturing faces a compound pressure of shorter product life cycles, tightening energy and raw-material costs, aggressive price points, and customer requirements for reliable, on-time delivery [1,2]. In this context, operational performance management—understood as the efficient allocation of labor, equipment, and time throughout the production process—has become central to business sustainability [3]. The principal metric used to quantify this performance is the overall equipment effectiveness (OEE), originally proposed by Nakajima [4] as the product of three orthogonal factors: availability, performance, and quality. OEE has consolidated as the cardinal indicator of total productive maintenance (TPM), of world-class manufacturing (WCM), and, more broadly, of lean production systems [5,6].
Historical approaches to OEE tracking relied on paper forms filled in by operators or basic spreadsheets, with well-documented limitations of transcription errors, delayed diagnostics, and noisy loss classification [7,8]. Industry 4.0 has remodeled this picture through the convergence of four enabling technologies: the industrial Internet of Things (IIoT) for on-machine sensing, cloud computing for scalable storage, big data analytics, and, more recently, artificial intelligence (AI) [9,10,11]. Manufacturing execution systems (MES) now automatically capture machine states, stoppage causes, cycle times, and production counts, storing them in time-series repositories that are orders of magnitude larger than what a human team can analyze manually [12,13].
Against this backdrop, generative AI based on large language models (LLMs) offers a new analytical layer. Unlike deterministic expert systems, LLMs can ingest numerical tables, contextualize them against the natural-language vocabulary of maintenance and operations, and generate both descriptive narratives and prescriptive recommendations [14,15,16]. Several works have suggested that such models can act as a synthesis agent between MES big data and managerial decisions [17,18]. However, three linked gaps still limit the evidence base for this argument.
First, the OEE-plus-AI literature remains predominantly conceptual or focused on supervised machine learning (regression, classification, deep learning for predictive maintenance) [18,19,20]; empirical evidence on the use of generative LLMs on historical OEE data in real CNC cells is scarce. Second, the few empirical studies that exist tend to rely on paid, fine-tuned, or enterprise-grade AI platforms [21,22], leaving the applicability of freely available generative tools—such as ChatGPT, Gemini, and Copilot—to small- and medium-sized manufacturers largely unexplored. Third, even when generative AI is used, its outputs are rarely cross-validated across different models or against multidisciplinary human experts, leaving the reliability of LLM-driven diagnostics an open issue [16,17,23].
These gaps are especially pressing for Latin American metalworking firms, which combine limited investment capacity with large volumes of MES-generated data. In Brazil, 42% of manufacturing firms with more than 100 employees reported using AI in 2024 [24], yet OEE remains the least-adopted lean indicator in the national industry, present in only 47% of transformation firms [25]. The asymmetry between data availability and analytical use suggests a concrete opportunity for low-cost, free-tool approaches that do not require capital-intensive AI platforms [26,27].
This paper addresses the three gaps through a single-case study conducted at a Brazilian metalworking company specializing in forging, machining, and assembly of mechanical transmissions for the agricultural segment. Historical OEE data from a two-machine CNC cell (two Index IT 600 lathes arranged in a U-shaped lean layout) were extracted from a commercial MES (CODI®) used by a metal-mechanical company located in Rio Grande, southern Brazil for the 31 months of January 2023–July 2025. The data were submitted, under an identical prompt protocol, to three freely available generative-AI tools (ChatGPT (GPT-5, OpenAI), Gemini (Gemini 2.5 Pro, Google DeepMind), and Microsoft Copilot (GPT-based assistant, Microsoft)). The outputs were benchmarked using three criteria adapted from the LLM-evaluation literature [16,23]—consistency, depth, and sensitivity—and further validated by a cross-functional team composed of the cell’s gerência, supervision, process engineering, quality, tooling, and setup specialists. The validated recommendations were consolidated into a five-phase strategic roadmap structured according to the 5W2H method, from which projected improvements in availability and OEE were derived.
The central research objective is to evaluate whether three freely available generative-AI tools, combined with MES historical OEE data and multidisciplinary human validation, can support reliable loss diagnosis and the formulation of an improvement plan for a CNC machining cell. This aim is decomposed into four specific objectives: (i) to extract and structure historical OEE data for a CNC cell and identify its main loss factors; (ii) to submit these data to three free generative-AI tools and compare their diagnostics on the three OEE pillars; (iii) to validate the AI-generated recommendations through a cross-functional team and operationalized benchmarking criteria; and (iv) to consolidate the validated outputs into a replicable five-phase strategic roadmap and a 5W2H action plan.
The study makes three contributions. Theoretically, it extends the OEE-plus-AI literature [18,19] by formalizing the concept of LLM-as-synthesis-agent through three articulated functions—(i) interpretation of structured numerical OEE data, (ii) synthesis with the tacit vocabulary of maintenance and operations, and (iii) prescriptive translation into managerial actions under human supervision—and by demonstrating that free LLMs can serve as synthesis agents between MES big data and decision-makers, provided that their non-deterministic, hallucination-prone outputs are subject to human supervision. Methodologically, it operationalizes the benchmarking criteria of consistency, depth, and sensitivity proposed in the NLP literature [16,23] into measurable artifacts for an industrial OEE context and complements them with an explicit mapping between LLM recommendations and Nakajima’s six big losses. Practically, it delivers a five-phase roadmap and a 5W2H plan grounded in a real CNC case that can be transferred to similar metalworking cells in other SMEs.
The remainder of the paper is organized as follows. Section 2 presents a concise theoretical background covering OEE, MES, and generative AI, and concludes with an explicit statement of the research gap. Section 3 details the materials and methods, including the full prompt protocol used to interact with each AI tool. Section 4 presents the results. Section 5 discusses theoretical and managerial implications and limitations. Section 6 offers the conclusions and directions for future work.
2. Theoretical Background
This section is deliberately concise and restricted to the theoretical blocks strictly necessary to read the empirical analysis. It covers: (i) OEE within TPM; (ii) MES as the data-generation layer; (iii) generative AI as an analytical layer; and (iv) the explicit research gap that frames the empirical study.
2.1. OEE Within Total Productive Maintenance
Nakajima [4] introduced OEE as a composite metric that quantifies how close a piece of equipment operates to its theoretical maximum by multiplying three factors: availability (the fraction of planned production time the equipment is actually running), performance (the ratio of actual throughput to rated throughput), and quality (the ratio of conforming output to total output). The canonical calculation is:
OEE = Availability × Performance × Quality
Availability is defined as A = (Planned Production Time − Unplanned Downtime)/Planned Production Time; Performance as P = (Cycle Time × Produced Units)/Run Time; Quality as Q = Good Units/Produced Units. The Japan Institute of Plant Maintenance (JIPM) benchmark considers an OEE of 85% (availability 90%, performance 95%, quality 99.9%) as world-class [28]. OEE values below 65% are commonly classified as unacceptable, 65–75% as acceptable, 75–85% as very good, and above 85% as excellent [5]. OEE directly addresses the “six big losses”—breakdowns, setup and adjustment, idling and minor stops, reduced speed, defects and rework, and reduced yield [4]—and is therefore central to the TPM philosophy [29,30]. Bamber et al. [5] further emphasize that successful OEE implementation depends on cross-functional teams, not on isolated maintenance departments, because improvement requires integrated action across operations, engineering, and quality.
2.2. MES and Industrial Big Data
Manufacturing execution systems (MES) are the software layer that connects ERP-level planning with shop-floor control and execution, collecting real-time data to support decision-making [31,32]. In Industry 4.0 environments, MES evolved from a passive recorder of events to an active enabler of strategic intelligence, converting raw machine signals into structured information [11,13]. The combination of IIoT-based sensing and cloud storage produces data volumes whose three classical Vs—volume, variety, and velocity—require dedicated analytical tools [9,10,33]. Ljungberg [7] and Jeong and Phillips [8] showed that manual data collection typically underestimates availability losses because operators tend to smooth or reclassify stops; automated MES capture eliminates this bias. The evolution of MES therefore creates the necessary substrate for AI-assisted OEE analysis: without automated, reliable data, any AI layer inherits the noise of the manual process [7,34].
2.3. Generative AI and Large Language Models in Manufacturing
AI has evolved in three waves: rule-based systems focused on knowledge representation [35]; machine-learning (ML) systems that learn statistical correlations from large datasets [36,37]; and, more recently, generative AI supported by deep-learning architectures such as the Transformer [14,15]. Large language models (LLMs), exemplified by ChatGPT, Gemini, and Copilot, are pre-trained on very large corpora and can be prompted to produce human-like text, summaries, classifications, and recommendations. Unlike deterministic expert systems, LLMs are probabilistic: the same prompt can yield different outputs across runs, posing new challenges for scientific validation [16,23].
Bang et al. [16] and Hacker et al. [23] argue that benchmarking LLMs in decision-support contexts must go beyond factual accuracy and must explicitly evaluate: (i) consistency, meaning the repeatability of the interpretation under repeated prompts or across rephrasings; (ii) diagnostic depth, meaning the capacity to connect surface patterns to plausible root causes; and (iii) sensitivity, meaning the ability to detect degradations, biases, toxicity and hallucinations. In industrial contexts, Bonada et al. [19] and Jamwal et al. [20] suggest that generative AI can complement—but not substitute—human expertise, acting as an augmented-intelligence layer between data and action [38]. Haridasan et al. [17] further emphasize that free versions of these tools lack fine-tuning on proprietary data, which limits their reliability in closed industrial domains and underscores the need for human validation loops.
The adoption of LLMs in manufacturing is part of a broader re-architecture of AI in enterprises identified by Oldemeyer et al. [24]: whereas early AI in SMEs was limited to predictive models confined to finance and IT, post-2023 LLMs have disseminated across operations, engineering, quality, and maintenance because they do not require dedicated ML infrastructure. The same authors, however, highlight that the maturity of governance and validation protocols has not kept pace with the adoption rate—a gap that industrial case studies like the present one are positioned to help close. Oldemeyer et al. [24] and Sjödin et al. [21] both emphasize that the distinctive feature of LLM value is the conversion of implicit, tacit knowledge into structured narratives that can be audited, revised, and transferred across teams, which is precisely the mechanism exploited by the prompt protocol of Section 3.
A complementary stream of research has examined prompt-engineering techniques as a primary lever to mitigate hallucinations and increase output reliability in industrial LLM applications. Chain-of-thought prompting, which instructs the model to render its intermediate reasoning steps before reaching a conclusion [39], and few-shot prompting, which seeds the conversation with worked examples from the same domain [40], have both been associated with more stable and auditable outputs in technical contexts. Self-consistency strategies—sampling multiple completions and retaining the modal answer—extend the same logic at the cost of additional queries [41]. In parallel, the explainable AI (XAI) literature on smart manufacturing under Industry 4.0/5.0 has argued that transparency, traceability, and trust are conditions for industrial deployment of AI [42]; in the absence of native explainability in free LLM interfaces, multidisciplinary human validation can functionally substitute as the explanatory and accountability layer. The protocol described in Section 3 borrows from both streams: it rotates pillar order across repetitions to mimic prompt perturbation, asks the models to justify causal chains (a chain-of-thought analogue), and substitutes XAI by a cross-functional team that audits, accepts, or refutes each LLM output before it enters the 5W2H plan.
2.4. Research Gaps
Synthesizing the literature, three interlinked gaps remain underexplored. (i) Empirical evidence of free generative AI applied to OEE in real CNC cells is scarce: most OEE-plus-AI work focuses on predictive maintenance with supervised ML [18,19,20], not on LLM-based diagnostics from historical OEE tables. (ii) Cross-model validation is rare: single-LLM studies dominate, and the triangulation of ChatGPT, Gemini, and Copilot outputs on the same industrial dataset is, to the best of our knowledge, unreported. (iii) Operationalization of LLM benchmarking criteria (consistency, depth, sensitivity) for industrial OEE contexts has not yet been proposed. The present paper addresses all three gaps through the empirical case described in Section 3.
To consolidate the contribution beyond a well-executed case study, this work proposes a conceptual framework that positions free generative LLMs as synthesis agents between MES big data and managerial decisions. The framework articulates three sequential functions. (a) Interpretation: the LLM reads structured numerical OEE tables and identifies trends, anomalies, and inversions that are not visible in monthly views. (b) Synthesis: the LLM converts these numerical observations into a narrative that uses the tacit vocabulary of maintenance and operations (MTBF, MTTR, SMED, lubrication regime, spare-parts strategy), connecting symptoms to plausible root causes. (c) Prescriptive translation: the LLM proposes managerial actions across short, medium, and long horizons, with projected ranges, that are then audited by a cross-functional team before entering the 5W2H plan. This framework differs from prior OEE+AI work in three ways: it does not aim at prediction (as supervised ML does), it does not require fine-tuning on proprietary data, and it embeds human validation as a constitutive—not optional—step of the analytical pipeline. The empirical case of Section 3 and Section 4 instantiates this framework and tests its operational viability in a real CNC cell.
3. Materials and Methods
This section provides sufficient detail on the empirical design to allow replication. It covers the research design, the case setting, the data source and preparation, the selection of AI tools with versions and dates, the prompt protocol, the evaluation criteria, the composition of the multidisciplinary team, and the construction of the strategic roadmap. A disclosure of the use of generative AI in this study is provided at the end of the section. Figure 1 summarizes the methodological flow, from MES data extraction to the construction of the strategic roadmap and the 5W2H action plan, so that the sequence of analytical and validation steps can be inspected at a glance.
Figure 1.
Methodological flowchart of the study.
All the steps are explained below.
- Step (i) MES historical OEE extraction (January 2023–July 2025);
- Step (ii) data pre-processing (removal of demand-driven and planned-maintenance events);
- Step (iii) identical prompt protocol applied to three free LLMs (ChatGPT, Gemini, Copilot), with four prompt blocks and three repetitions per tool;
- Step (iv) operationalized scoring (consistency, depth, sensitivity) by two independent evaluators;
- Step (v) consensus and cross-functional team validation in three structured sessions;
- Step (vi) construction of the urgency–importance matrix;
- Step (vii) five-phase strategic roadmap and 5W2H action plan;
- Step (viii) projection of expected ranges for 90-day and 540-day horizons.
3.1. Research Design
The study is framed as a single, exploratory mixed-method case study [43,44,45]. The quantitative component comprises 31 months of numerical OEE data from an instrumented CNC cell; the qualitative component comprises the narrative outputs of three LLMs, their operationalized benchmarking, and a validation round conducted by a cross-functional team. The single-case design is justified by the need to examine a contemporary phenomenon (LLM use in OEE management) in its real industrial context, where the boundary between phenomenon and context is not clearly defined [43]. Single cases also favor theoretical refinement when the phenomenon is emergent [44,45].
3.2. Case Setting
The partner company operates in the metalworking sector, specializing in forging, machining, assembly, and painting mechanical transmissions for the agricultural segment. Within its shop floor, a U-shaped CNC machining cell was selected as the pilot. The cell consists of two Index IT 600 turning centers (identified here as CNC-1 and CNC-2), already equipped with the CODI® MES installed on the bottleneck machine and operating under real-time OEE capture. The cell had previously undergone kaizen events aimed at increasing throughput, yet still failed to meet the customer volume demand for the forthcoming months, which motivated its selection as the pilot for the present study. The unit of analysis is the cell as an integrated production system, with the bottleneck machine’s cycle time taken as the reference following the Theory of Constraints [46].
3.3. Data Source and Preparation
Historical OEE data were extracted from the CODI® MES for the period January 2023–July 2025, totaling 31 months of monthly aggregates. For each month, the following fields were retrieved: hours under analysis (planned production time), unplanned downtime (h), setup time (h), availability (%), performance (%), quality (%), OEE (%), and OEE target (75%). The months of April and May 2024 were recorded as having zero hours because the company’s operations were interrupted by the regional floods in May 2024. The physical facility was not damaged, but a large share of the workforce had their homes flooded, which prevented regular production. These two months were included in the dataset for transparency but excluded from the availability and OEE averages.
Data were consolidated into yearly and half-yearly summaries to reveal seasonal and structural patterns. Before submission to the LLMs, the dataset was pre-processed to remove two classes of events that are not attributable to equipment effectiveness: (i) lack of production demand (absence of sales orders), classified externally; (ii) planned maintenance windows, removed to avoid double-counting. All other loss categories—corrective maintenance, lubrication, tool change, setup, quality adjustments, operator absence, etc.—were preserved and encoded using the MES event taxonomy.
3.4. AI Tool Selection, Versions, and Dates
The selection of AI tools was discussed jointly with the partner company’s IT department and guided by three practical criteria: (i) compatibility with existing Microsoft 365 infrastructure (Copilot); (ii) widespread prior use among engineers (ChatGPT); and (iii) integration with the Google productivity suite (Gemini). All three are available in free tiers. The specific versions accessed and the interaction window are listed in Table 1.
Table 1.
Generative AI tools used in the study: version, access mode, and consultation window.
All three tools were accessed via their respective web browser interfaces. Each query round was opened in a fresh private chat to avoid cross-contamination between prompts and to preserve the non-deterministic nature of the responses. Corporate data were shared only as de-identified numerical tables, without company or personnel names.
3.5. Prompt Protocol
An identical prompt protocol was applied to the three tools. The protocol consists of four prompt blocks that escalate from description to prescription. The full wording is reproduced in Appendix A; here, the structure is summarized:
- Block 1—Contextual framing: the role of the tool, the nature of the cell, the meaning of the OEE pillars, and the target of 75%.
- Block 2—Descriptive analysis: submission of the full monthly table of availability, performance, quality, and OEE, asking for an evolution analysis per year and per half-year.
- Block 3—Diagnostic analysis: request for probable root causes for the observed trend, broken down by pillar and by period.
- Block 4—Prescriptive analysis: request for improvement actions at short (0–60 days), medium (60–180 days), and long horizons (6–18 months), with projected ranges for each pillar.
Each block was repeated three times per tool on different days to assess consistency. The order of the pillars (availability, performance, quality) was rotated between rounds to mitigate framing effects. All responses were archived in text form for subsequent evaluation. The choice of n = 3 repetitions per tool was deliberate. In an exploratory single-case design with a multidisciplinary human panel, three runs balance two competing constraints: enough variation to detect non-deterministic drift in qualitative outputs (saturation was reached when the same root-cause set appeared in two of three rounds), while remaining feasible given the cognitive load of human validation of 4 prompt blocks × 3 tools × 3 rounds (~36 response files plus archives). Larger n is desirable in future replications and is listed as a limitation in Section 5.5. It is also important to note that the three LLMs were accessed through their free web interfaces, which do not expose generation parameters such as temperature, top-p, or seed. The lack of access to these parameters is an additional methodological limitation (Section 5.5) and is intrinsic to the choice of free-tier tools that the study sets out to evaluate.
3.6. Evaluation Criteria and Operationalization
Building on Bang et al. [16] and Hacker et al. [23], the three criteria were operationalized as follows. Consistency was scored on a 1–5 ordinal scale by comparing each tool’s output across the three repetitions of Block 3, with 5 denoting identical root-cause identifications and priority orderings across repetitions and 1 denoting contradictory outputs. Diagnostic depth was scored on the same scale by counting (a) the number of distinct root-cause hypotheses formulated, (b) the correct use of technical vocabulary (MTBF, MTTR, SMED, Poka-Yoke, lubrication, spare-parts strategy), and (c) the presence of causal chains linking a symptom to a managerial action. Sensitivity was scored by the tool’s ability to detect (a) the post-flood anomaly in 2024; (b) the inversion of the downtime-to-productive-time ratio in 2025; and (c) the disproportionate growth of setup time in 2025 relative to production volume. Two evaluators (the first author and an external process engineer) scored independently; disagreements were resolved by consensus. Operational thresholds were defined a priori as follows. For consistency: 5 = identical root-cause set and priority ordering in 3/3 rounds; 4 = identical in 2/3 rounds with partial convergence in the third; 3 = identical in 1/3 with partial overlap in the others; 2 = divergent but non-contradictory; 1 = contradictory factual content across rounds. For diagnostic depth: 5 = ≥5 root-cause hypotheses, ≥4 technical terms correctly used, explicit causal chain; 4 = 4 hypotheses, 3 terms, partial causal chain; 3 = 3 hypotheses, 2 terms, implicit causal chain; 2 = 2 hypotheses, ≤1 term, no causal chain; 1 = no usable hypothesis. For sensitivity: 5 = detected all three target anomalies (flood, downtime inversion, setup growth); 4 = detected two; 3 = detected one; 2 = mentioned anomalies without identifying them; 1 = missed all anomalies. To reduce residual rater bias, both evaluators were trained on a calibration set of 4 anonymized LLM responses unrelated to the study, agreed on score boundaries, and then scored the actual outputs blindly. The combination of explicit thresholds, blind scoring, and calibration is intended to make the scoring auditable, although it remains qualitative; the study’s limitation section discusses how automated metrics (BLEU, ROUGE, BERTScore, LLM-as-judge) could complement this protocol in future replications.
3.7. Multi-Functional Team and Validation
The cross-functional team that convened to analyze AI outputs comprised seven members: the area manager, the area supervisor, two process technicians, one quality technician, one tooling specialist, and one setup preparer. Their combined tenure in the cell exceeded 60 person-years. The team met in three structured sessions. Session 1 presented the consolidated AI outputs and collected initial reactions. Session 2 constructed a standard urgency–importance matrix [47] using consensus-based priority voting (a suggestion was accepted if at least five of the seven members supported it). Session 3 consolidated the prioritized suggestions into a draft roadmap, which was then escalated to company directors for strategic alignment. Disagreements that did not converge through majority voting were handled in three additional ways to reduce groupthink. (a) Minority dissent log: any member whose position was outvoted by 5–2 or 4–3 had the dissent recorded with rationale in a structured minutes document, so that the dissenting argument remained traceable for a later review cycle. (b) Evidence-triggered re-vote: if a dissenter pointed to specific MES data, AI output, or operational evidence not previously considered, the suggestion was returned to a second round of discussion in the following session, and a new vote was taken with the new evidence on the table. (c) Director-level arbitration: residual disagreements that survived (b) were escalated to the directors’ committee as open issues, with both majority and minority views documented, rather than closed by simple voting. We acknowledge that the panel was internal to the partner company, which carries a residual risk of confirmation bias; an external peer-review of the prioritization, by independent operations specialists from outside the company, is identified in Section 5.5 as a future-research extension that would further harden the validation step.
3.8. Roadmap Construction
The final roadmap follows a staged model with five phases: (Phase 1) Pre-project—team formation and data baseline; (Phase 2) Current state—validated diagnosis of losses; (Phase 3) Strategic actions—structured by the 5W2H method (What, Why, When, Where, Who, How, How much) [48]; (Phase 4) Process optimization—weekly follow-up and visual management; (Phase 5) Sustaining and improving—integration of predictive maintenance, tool-wear monitoring and Bluetooth-enabled dimensional control. The 5W2H artifact is presented in full in Section 4.
3.9. Disclosure of Generative-AI Use
In compliance with the journal’s policy, generative AI was used in this study in two distinct roles. First, as the object of study: ChatGPT, Gemini, and Copilot were the tools whose diagnostic outputs were compared against OEE data (Section 3.4, Section 3.5 and Section 3.6). Second, as a writing aid: during the preparation of the manuscript, generative-AI tools were used exclusively for superficial text editing (grammar, spelling, punctuation, and formatting), which, according to the journal’s policy, does not require declaration. All analytical results, interpretations, and conclusions are the sole responsibility of the authors. To support full reproducibility, the complete archive of LLM responses (approximately 36 response files, four prompt blocks × three repetitions × three tools, with the corresponding prompt headers and the input OEE tables). The hallucination event observed with Gemini in round 1 is documented in Appendix A.2 (full transcripts) so that the detection-and-correction trajectory can be inspected by readers.
4. Results
This section presents the results in four linked layers: (i) the descriptive analysis of the OEE historical series; (ii) the diagnostics produced by each AI tool for each OEE pillar; (iii) the operationalized cross-model benchmarking; and (iv) the consolidated critical analysis, prioritized action matrix, strategic roadmap, 5W2H action plan, and projected improvements.
4.1. Descriptive Analysis of Historical OEE
Table 2 reports the consolidated OEE and its three pillars for each year, with 2025 closing in July.
Table 2.
Consolidated OEE and pillars per year (2025 up to July).
Table 3 breaks the same values by half-year, which is more informative than the annual aggregate because of the flood-interrupted semester of 2024.
Table 3.
Consolidated OEE and pillars per half-year.
Three empirical patterns stand out. (1) Downtime inversion in 2025. In the first half of 2025, unplanned downtime (481 h) amounted to roughly 64% of the effective productive time (753 h). By comparison, the best prior semester (2023/2) showed a downtime-to-productive ratio of only 28%, and 2024/1 (before the floods) closed with an OEE of 84.7%, well above target. (2) Absence of a true seasonal pattern. The big difference between 2024/1 (84.7%) and 2025/1 (54.1%) cannot be attributed to seasonality and instead suggests the emergence of structural issues in maintenance and setup. (3) Hidden setup bottleneck. Setup time in 2025/1 (71 h) already exceeded that of semesters with significantly larger production volumes, such as 2023/2 (50 h). This signals a breakdown in standardization of tool-change procedures rather than a mere volume effect.
These three patterns were confirmed through the consolidated monthly series, reproduced in Figure 2. The figure shows a steep drop in availability beginning in May 2025—before any of the interventions proposed later in the project were implemented. Performance remained close to or above 100% throughout. In comparison, quality remained above 95% in all analyzed months, except for a temporary drop to 83% in May 2025, which coincided with a short-run product changeover and was later recovered.
Figure 2.
Monthly evolution of OEE and its three pillars (January 2023–July 2025). The shaded band corresponds to the flood-related interruption of April–May 2024. The May 2025 breakdown is annotated as the availability trigger that motivated the present study.
4.2. AI Diagnostics on the Availability Pillar
Table 4 summarizes the diagnostic outputs of the three AI tools for the availability pillar. All three tools converged in identifying availability as the main driver of the OEE decline in 2025, but with noticeable differences in diagnostic framing.
Table 4.
AI-generated diagnostics on the availability pillar (2023–2025).
ChatGPT prioritized the mitigation of critical failures and the reduction of downtime through a structured maintenance-management approach; Gemini adopted a systemic framing that combined maintenance with setup optimization; Copilot emphasized a continuous-improvement culture as a prerequisite for the sustainability of the gains.
In the first run, Gemini reported a 2024 average availability of 71.4% and an OEE of 70.2%—values that did not appear anywhere in the input (the actual 2024 figures, excluding the flood months, were 77.8% and 77.7% respectively, as shown in Table 2). The discrepancy was detected by direct comparison between the input table and the LLM output by the first author, and confirmed by the second evaluator before scoring. Two corrective prompt refinements were then applied in rounds 2 and 3: (a) an explicit instruction—“compute every figure strictly from the rows provided in the table; do not infer values that are not present”—and (b) a confirmation request—“repeat back the 2023, 2024, and 2025 average availability and OEE before continuing the diagnosis.” After the refinement, Gemini reproduced the correct values and its diagnoses in rounds 2 and 3 converged with the other two tools on availability as the main loss driver. The full transcripts of the affected run and the corrective prompts are reproduced in Appendix A.2 to allow inspection of the detection-and-correction trajectory. ChatGPT and Copilot did not exhibit similar fabrications across the three rounds.
4.3. AI Diagnostics on the Performance Pillar
The results of the performance pillar remained above 98% across the analyzed period and were not identified by any of the three tools as the main cause of the OEE decline. ChatGPT and Gemini were considered to have stable, adequate performance, with no urgent intervention required. Copilot, while in agreement with the general stability, was the only model to flag the small performance drop observed in 2025 as a potential early signal of tool wear, minor stoppages, or inconsistent pacing, and recommended monitoring to prevent future impact.
4.4. AI Diagnostics on the Quality Pillar
Quality stayed above 96% throughout the series, with the temporary dip noted in Section 4.1. All three tools classified quality as stable and not responsible for the OEE decline. Copilot again distinguished itself by hypothesizing that the slight downward trend in 2025 could signal recurring inspection issues or equipment wear, and recommended active monitoring to keep the pillar above 97% and avoid hidden rework losses.
4.5. Convergent Root-Cause Analysis
The three tools converged on the same top-level diagnosis: the 2025 OEE decline is driven by a deterioration of availability, caused by (i) a predominantly corrective—rather than preventive—maintenance strategy, (ii) a sub-optimal spare-parts strategy for critical replacements, (iii) evidence of lubrication gaps in the Index IT 600 machines, and (iv) a disproportionate growth in setup time that suggests loss of standardization in tool-change procedures and over-reliance on the tacit knowledge of a few senior operators. This last point highlights an institutional vulnerability: the absence or disuse of standard work instructions means that setup efficiency is locked to individual skills, compromising both scalability and availability.
It is worth underlining that this convergent diagnosis was not obvious from a superficial reading of the monthly OEE values. The naked-eye inspection of Table 2 could suggest a simple volume-driven decline in 2025, or residual effects of the 2024 flood. Only when the half-yearly decomposition of Table 3 and the downtime-to-productive ratio were considered together did the structural nature of the degradation become visible. The three LLMs effectively forced the evaluator to cross-reference these views. The cross-functional team recognized this cognitive acceleration as one of the most valuable contributions of the LLM-assisted process: the tools did not invent new hypotheses. Still, they systematically assembled the team’s individually held hypotheses into an organized causal map that justified allocating recovery effort to availability rather than to performance or quality.
Mapping AI Recommendations onto Nakajima’s Six Big Losses
To strengthen the theoretical link between LLM-generated recommendations and the TPM tradition, the validated suggestions were re-coded against Nakajima’s six big losses [4]. Table 5 reports the mapping. For each big loss, the table indicates the LLM that surfaced it most clearly, the recommended action, and the OEE pillar affected. The mapping confirms that breakdowns and setup/adjustment losses concentrate the bulk of the recommendations, consistent with the empirical finding that availability is the dominant driver of the 2025 OEE decline.
Table 5.
Mapping between Nakajima’s six big losses and the validated AI-generated recommendations.
Two patterns are notable. First, four of the six losses (breakdowns, setup/adjustment, idling/minor stops, reduced speed) map onto availability and performance—that is, the pillars where the cell shows degradation—while the two quality-related losses (defects/rework and reduced yield) were addressed with preventive rather than reactive actions, consistent with quality remaining above 96% across the series. Second, the LLMs were complementary not just in scoring but also in coverage: ChatGPT predominantly addressed breakdowns and yield losses, Copilot covered setup, micro-stops, and quality issues, while Gemini’s contribution was more concentrated on reduced speed. The cross-functional team interpreted this complementarity as further support for a portfolio-of-tools approach.
4.6. Cross-AI Benchmarking
The three tools were benchmarked on consistency, depth, and sensitivity as defined in Section 3.6. The inter-rater agreement between the two evaluators before consensus was acceptable (simple agreement: 78%; Cohen’s κ ≈ 0.62, which corresponds to low-to-moderate agreement on the Landis–Koch scale and is acceptable for exploratory work but warrants stronger evaluation protocols—such as calibration sessions, a third evaluator, or automated NLP metrics—in future replications). Table 6a reports the individual scores assigned by each evaluator before consensus, and Table 6b reports the consolidated post-consensus scores.
Table 6.
(a) Individual scores assigned by the two independent evaluators (E1 = first author; E2 = external process engineer) before consensus, on the 1–5 scale defined in Section 3.6. (b) Operationalized benchmarking of the three generative-AI tools (1–5 scale), post-consensus values.
The pattern reveals complementarity rather than dominance. ChatGPT delivered the most consistent and technically deep diagnostics; Copilot was the most sensitive to subtle anomalies and data inconsistencies; Gemini required prompt refinement to recover from initial hallucinations, but, once refined, reinforced the other two. Figure 3 visualizes the scores as a radar chart with three axes (consistency, diagnostic depth, sensitivity) and three traces (one per LLM), making the complementarity between tools immediately visible: no single tool dominates all three criteria. All three tools reached the same top-level conclusion (availability is the critical pillar), which supports the value of cross-model triangulation as a mitigation strategy against non-determinism and hallucination risk [16,17,23].
Figure 3.
Radar-chart cross-model benchmarking of the three generative-AI tools under the three operationalized criteria (consistency, diagnostic depth, and sensitivity), scored on a 1–5 scale by two independent evaluators (post-consensus values; individual scores are reported in Table 6a).
4.7. Strategic Prospection and Future-State Ranges
The three tools were then queried with a prescriptive prompt asking for improvement actions over short (0–60 days), medium (60–180 days), and long (6–18 months) horizons, with projected ranges for each OEE pillar. Table 7 compiles the ranges suggested by each tool. Each cell of Table 7 contains the lower and upper bounds of the projected range reported by the corresponding tool for each combination of pillar and horizon (30, 90, and 540 days). When the three repetitions of a given block produced slightly different ranges, the union of the reported intervals was retained, so that the table reflects the broadest projection the tool was willing to defend across rounds. The projected ranges must be read as expectations, not as empirical measurements; the cross-functional team later used them as targets against which the 5W2H plan was calibrated.
Table 7.
Projected future-state ranges for each OEE pillar by tool and horizon.
4.8. Critical Analysis and Priority Matrix
The cross-functional team assessed the suggestions from the three tools against their tacit knowledge of the cell and compiled an urgency–importance matrix. The priorities that emerged from the matrix are summarized in Table 8.
Table 8.
Priority actions per OEE pillar after cross-functional validation. Priority bands (high/medium/low) were derived from the urgency–importance matrix built in Session 2 of the cross-functional workshop: each suggestion received an urgency score (1–5) and an importance score (1–5); the product (urgency × importance) was mapped to high (≥16), medium (8–15), and low (<8). Numbering inside each pillar reflects the ranking within that priority band, not an absolute ranking across pillars.
4.9. Strategic Roadmap
The validated diagnostics and priorities were consolidated into a five-phase strategic roadmap that ascends in maturity from diagnosis to predictive sustainment. Figure 4 provides the visual map of the roadmap, with each phase represented by an ascending node along a dashed maturity axis; the descriptions of each phase follow.
Figure 4.
Strategic roadmap for OEE recovery in the CNC cell, organized in five ascending phases. The growing size of the nodes reflects the expected growth in organizational maturity and the robustness of the analytical–operational infrastructure across the program.
Phase 1—Pre-project. Formation of the cross-functional team and extraction of the MES big data; AI-assisted diagnostic baseline; formalization of the current state.
Phase 2—Current state. Presentation of the diagnostic to the directors’ committee, definition of the recovery target (restore the 2024 OEE level within the fourth quarter of 2025 and the first semester of 2026), and explicit prioritization of availability and performance.
Phase 3—Strategic actions. Execution of the 5W2H plan (Table 9), led by the maintenance manager with dedicated specialists in planning, preventive maintenance, and setup standardization.
Table 9.
5W2H action plan consolidating the validated AI-driven suggestions.
Phase 4—Process optimization. Weekly follow-up meetings, visual-management boards, real-time auditing of OEE against targets, and redirection of actions whose expected effect was not observed within the follow-up horizon.
Phase 5—Sustaining and improving. Migration to a predictive posture: online tool-wear monitoring, Bluetooth-enabled dimensional control with automatic interlock of the machine upon detection of non-conformities, and deployment of machine-learning models for continuous asset-health monitoring.
4.10. Expected Ranges Based on AI Scenarios and Team Consensus
Based on the validated diagnostics, the priority matrix, and the 5W2H plan, projections were built for two scenarios: (i) a 90-day horizon for short-term actions (corrective blitz, spare-parts stock, lubrication revision) and (ii) a 540-day horizon for the full roadmap. Under the 90-day scenario, the cross-functional team—using the AI-projected ranges of Table 7 as boundary conditions—projects an increase of approximately 18 percentage points in availability (from the 2025/1 baseline of 54.3% towards the 72–78% range) and of approximately 22 percentage points in cell OEE (from 54.1% towards the 72–82% range), returning the cell close to its 2023/2 performance. Under the 540-day scenario, if predictive maintenance and Bluetooth-enabled dimensional control are fully operational, the roadmap projects OEE values in the 83–88% range, approaching the JIPM world-class benchmark of 85%. Figure 5 shows the historical OEE and availability series together with the projection bands (no point estimates) for the two horizons, emphasizing the projective nature of the values.
Figure 5.
Historical half-yearly trajectory of OEE and availability (2023/1 to 2025/1) and projection bands (instead of point estimates) for the 90-day (2025/2) and 540-day (2026/1) horizons. The red shaded band represents the projected OEE range and the blue shaded band represents the projected availability range, both derived from the cross-model lower–upper bounds reported by the three generative-AI tools after cross-functional validation; they are not post-intervention measurements and are to be empirically tested in the planned longitudinal follow-up.
It must be emphasized that these values are projections derived from the AI-generated ranges and the cross-functional team’s confidence intervals. They are not empirical post-intervention measurements: at the time of manuscript preparation, the 5W2H plan’s short-term actions were only at the start of execution. A longitudinal follow-up study is envisaged to quantify the actual improvement and compare it with these projections.
5. Discussion
The results support three main discussion points: the reliability of free generative AI tools for OEE diagnostics, the value of cross-model triangulation, and the managerial consequences of embedding LLMs into the OEE management cycle. This section concludes with an honest declaration of the study’s limitations.
5.1. Reliability of Free Generative AI in OEE Diagnostics
A recurring concern in the LLM-evaluation literature is that probabilistic generation can produce hallucinations—outputs that are linguistically plausible but factually wrong [16,23]. Our operationalized benchmarking confirms this risk: Gemini initially produced numerical values that did not match the input table, and it required iterative prompt refinement to recover. However, the ChatGPT consistency score (5/5) and the post-refinement consistency of the other two tools suggest that, under a disciplined prompt protocol with rotation of pillar order and repetition across days, free LLMs can deliver reliable qualitative diagnostics of OEE data. These findings extend prior work on predictive-maintenance ML [18,19] and align with emerging evidence on LLM industrial applications [17,22].
The observation that all three tools converged on the same top-level diagnosis—availability is the principal driver of the 2025 OEE decline—is consistent with the TPM literature’s emphasis on availability as the structurally most volatile pillar [4,28,29]. This convergence is important evidence that, when the underlying pattern is strong, free LLMs do capture it robustly; the non-determinism shows up mostly in the nuances (the exact ranking of secondary causes, the framing of recommendations).
5.2. Cross-Model Triangulation as a Mitigation Strategy
The benchmarking clearly shows complementarity: ChatGPT’s depth, Copilot’s sensitivity, and Gemini’s post-refinement synthesis. No single tool dominated all three criteria. This suggests that cross-model triangulation is not a luxury but a necessary mitigation against the non-deterministic nature of LLMs, especially when they are used on free tiers without fine-tuning on proprietary data [17]. Copilot’s unique ability to flag the 2024–2025 inconsistency and the disproportionate growth in setup time illustrates how a single-model approach would have left a blind spot in the diagnostic. The practical implication is that industrial users of free LLMs should treat tool selection as a portfolio problem rather than a single-vendor choice.
5.3. Managerial and Theoretical Implications
Theoretically, the study contributes to the OEE-plus-AI literature in three ways. First, it extends the prescriptive scope of AI from supervised-ML predictive maintenance [18,19] to LLM-assisted diagnostic synthesis, which is closer to the augmented-intelligence paradigm [38] than to full automation. Second, it operationalizes the LLM-benchmarking criteria of Bang et al. [16] and Hacker et al. [23] into measurable artifacts in an industrial context (root-cause count, vocabulary usage, anomaly detection). Third, it shows that free LLMs can serve as a bridge between big data and human decision-making, provided that multidisciplinary validation is explicitly ensured, which aligns with the Industry-5.0 narrative of human–machine collaboration [49].
Managerially, the study makes three contributions. First, it repositions maintenance from a cost center to a strategic function: when availability is the pillar that drives OEE recovery, investments in preventive maintenance, spare parts strategy, and lubrication yield disproportionate returns. Second, it demonstrates that digital advantage [50] can be achieved with zero-cost tools, a critical finding for SMEs with tight capital budgets. Third, it delivers a replicable artifact—the five-phase roadmap and the 5W2H plan—that connects strategic intent to executable actions and is agnostic to the specific LLM vendor, protecting the organization from vendor lock-in.
Replication conditions. Based on the validation workshop with company directors, three conditions are critical to replicate the roadmap in other cells: (i) uniformity and quality of the MES data across cells, so that the same prompt protocol can be applied; (ii) modular software/hardware architecture, allowing progressive improvement without rebuilding the system; (iii) an organizational culture that embraces experimentation, continuous learning from AI feedback, and close collaboration between IT, operations and engineering. Without these, the potential of the LLM-assisted approach is easily diluted. It is equally important to articulate the boundary conditions under which the framework is unlikely to deliver value, so that the contribution is not over-generalized. Four such conditions are particularly relevant. (a) Immature or noisy MES data: when downtime reasons are entered inconsistently or productive time is mis-recorded, the LLMs synthesize misleading narratives that the cross-functional team cannot easily refute, because the numerical baseline itself is unreliable. (b) Absence of a cross-functional team with combined operational, maintenance and quality expertise: without this audit layer, hallucinations and surface-level recommendations are likely to be accepted at face value. (c) Organizations operating in regulated environments (defense, medical devices, pharmaceuticals) where MES data cannot be sent to third-party LLMs through free web interfaces: in such cases, the same protocol would have to be ported to enterprise LLMs hosted internally, which voids the “zero cost” argument that motivates the study. (d) High-mix, low-volume settings with insufficient time series to make trend detection meaningful: with fewer than roughly 12 months of stable MES history, the LLM cannot distinguish structural degradation from one-off variation, and the consistency advantage observed here vanishes. Replication beyond these boundaries is therefore conditional, not automatic.
5.4. Implications for SMEs in Emerging Economies
A recurring argument in the SME-oriented AI literature is that the main adoption barrier is not the cost of the tools themselves but the cost of the skills required to operate them productively [24,27]. The present case is consistent with this argument. The three LLMs used in this study are free at the point of access; the capital investment foreseen in the 5W2H plan (Table 9) is concentrated in maintenance reinforcement, spare parts stock, and SMED training, not in AI platforms. The bottleneck, therefore, is organizational: the cross-functional team’s ability to formulate disciplined prompts, operationalize evaluation criteria, and integrate LLM outputs into a priority matrix. This is a training problem, not a software-licensing problem, and it can be addressed through relatively inexpensive internal workshops.
For SMEs in emerging economies—where 58% of firms still do not use AI and only 47% of Brazilian manufacturers measure OEE [24,25]—the trajectory suggested by this study is: (a) stabilize automated OEE data capture through MES; (b) train a cross-functional core team on disciplined prompting; (c) apply multi-model triangulation as a default analytical posture; (d) escalate validated insights through a 5W2H-structured roadmap. This trajectory neither demands capital-intensive enterprise AI platforms nor waits for LLM regulatory maturity; it works with tools already deployed in commercial productivity suites and already part of the everyday digital experience of most operations staff.
A complementary lens on these findings is offered by the explainable AI (XAI) literature on smart manufacturing under Industry 4.0/5.0 [42], which argues that transparency, traceability, and trust are necessary conditions for the industrial deployment of AI. The free LLM interfaces used in this study do not expose any of these properties natively: there is no access to attention maps, no token-level provenance, no calibrated uncertainty, and no audit log of the underlying decision process. In their absence, the protocol described in Section 3 functionally substitutes for XAI by inserting a cross-functional human audit between the LLM output and the managerial action. The two-evaluator scoring, the rotation of pillar order, the explicit hallucination-detection step documented in Section 4.2, and the urgency–importance matrix collectively act as the explanatory and accountability layer that the free-tier tools do not provide. We interpret this as evidence that, in SMEs that cannot afford XAI-enabled enterprise stacks, structured human validation is not a second-best but a first-order design choice—at least until free LLMs incorporate native explainability features.
5.5. Limitations
The study has several limitations that must be made explicit. (i) Single-case design limits the statistical generalizability of the findings; the results speak to analytic generalization [43] rather than to population inference. (ii) The 90-day and 540-day improvement figures are projections based on LLM ranges and team consensus, not post-intervention empirical measurements; a longitudinal follow-up study of 12–18 months—already approved by the partner company and starting with monthly OEE re-measurements after Phase 1 of the roadmap—is required to compare the projected +18 pp/+22 pp/83–88% ranges against empirical post-intervention values. (iii) Free-tier LLMs were used without fine-tuning on proprietary data; paid or fine-tuned versions may alter the consistency and depth scores. Moreover, the free web interfaces of ChatGPT, Gemini, and Copilot do not expose generation parameters such as temperature, top-p, or seed, which precluded a controlled study of stochastic variability; future replications should either negotiate API-level access or report parameter values explicitly when these become available in free interfaces. (iv) The evaluation criteria, although grounded in the LLM-benchmarking literature [16,23], rely on expert judgment and are therefore subject to residual rater bias, mitigated but not eliminated by inter-rater agreement assessment; in future work the qualitative 1–5 scoring could be complemented with automated NLP metrics (e.g., BLEU, ROUGE, BERTScore) or with an LLM-as-judge protocol so that consistency, depth, and sensitivity become at least partially machine-quantifiable. (v) The cross-functional team, while multidisciplinary, is internal to the company and therefore subject to a potential confirmation-bias effect; external expert review would strengthen the validity of the prioritization. (vi) The number of repetitions per tool was set at n = 3, which is a pragmatic floor for an exploratory study with intensive human validation but does not span the full space of stochastic variability of the underlying models; future replications should test n ≥ 5 and ideally distribute the repetitions across more than one geographic IP and account, to control for personalization effects in the free interfaces. (vii) The study was conducted in a single national context (Brazil) and a single sector (agricultural metalworking); replication across other regions and sectors—especially regulated environments where MES data cannot leave the firewall—is needed before the framework can be considered broadly transferable. These limitations are, in turn, natural research opportunities for future work.
6. Conclusions
This paper investigated whether three freely available generative-AI tools—ChatGPT, Gemini, and Copilot—can support OEE diagnosis and improvement planning in a real CNC machining cell. Using 31 months of MES-derived OEE data from a U-shaped two-lathe cell in a Brazilian metalworking company, the study submitted the same dataset to the three tools under an identical prompt protocol, operationalized three LLM-benchmarking criteria (consistency, depth, sensitivity) into measurable artifacts, and validated the outputs through a cross-functional team. The validated diagnostics were consolidated into a five-phase strategic roadmap and a 5W2H action plan.
The four specific objectives set in the introduction were addressed. First, the extraction and structuring of historical OEE data revealed three empirical patterns that traditional monthly views had masked: the 2025 downtime inversion, the absence of a true seasonal pattern, and the hidden setup bottleneck. Second, submitting the data to the three tools produced convergent top-level diagnostics—availability is the driver of the OEE decline—but divergent nuances. Third, the operationalized cross-model benchmarking showed that the three tools are complementary rather than equivalent: ChatGPT was the most consistent and technically deep, Copilot the most sensitive to anomalies, and Gemini the most variable but valuable after prompt refinement. Fourth, the consolidated roadmap and 5W2H plan translated the validated insights into an executable program with explicit budgets, responsibilities, and timelines.
Over a 90-day horizon, the roadmap produces an expected range, derived from AI-projected scenarios and cross-functional team consensus, of approximately +18 percentage points in availability and +22 percentage points in cell OEE; over a 540-day horizon, the projected OEE band reaches 83–88%, approaching the JIPM world-class benchmark. These ranges are projections, not post-intervention measurements, and are intended to be empirically tested in the planned 12–18-month longitudinal follow-up study, which is identified as the primary next step. Three contributions follow from the study. Theoretically, it formalizes the concept of LLM-as-synthesis-agent (interpretation, synthesis, prescriptive translation), maps LLM-generated recommendations against Nakajima’s six big losses, and extends the OEE-plus-AI literature towards LLM-based diagnostic synthesis and operationalizes the Bang–Hacker benchmarking criteria for industrial OEE use. Methodologically, it shows how cross-model triangulation can mitigate the non-determinism of free LLMs. In practice, it delivers a replicable artifact that enables SMEs to capture digital advantage at virtually zero tool cost, provided that human multidisciplinary validation remains the final filter.
The principal limitation of the study—the projection nature of the improvement figures and the single-case design—points directly to the main avenue for future work: a longitudinal follow-up that measures realized post-intervention OEE and compares it with the projections, together with replication of the protocol across multiple cells and sectors. The results open four additional lines of future research. First, the development of an MES-embedded chatbot that acts as an on-floor assistant, providing operators and supervisors with contextualized, real-time answers to operational queries. Second, the design of AI models explicitly oriented to decision support at the managerial level, capable of simulating scenarios, prioritizing interventions, and allocating resources within production, demand, and capacity constraints. Third, the incorporation of computer-vision-based quality inspection using ML and deep learning, enabling automatic detection of nonconformities and traceability of defect patterns. Fourth, the integration of collaborative robots (cobots) into CNC machining cells will require more rigorous tool-wear monitoring, online condition tracking, and measurement-system integration—all of which broaden the systemic view of the OEE pillars.
In summary, the study shows that free generative AI is already a credible analytical ally for OEE management, provided that it is used with methodological discipline—disciplined prompting, cross-model triangulation, operationalized benchmarking, and multidisciplinary validation. The era in which AI is the final product is giving way to an era in which AI is a highly effective means: the responsibility for the outcome remains, inescapably, with human experts.
Author Contributions
Conceptualization, G.H. and I.C.B.; methodology, G.H. and I.C.B.; software, G.H. and I.C.B.; validation, G.H. and I.C.B.; formal analysis, G.H. and I.C.B.; investigation, G.H. and I.C.B.; resources, G.H. and I.C.B.; data curation, G.H. and I.C.B.; writing—original draft preparation, G.H., I.C.B., J.L.B.M., L.V.B. and L.R.T.; writing—review and editing, I.C.B., J.L.B.M., L.V.B. and L.R.T.; visualization, I.C.B., J.L.B.M., L.V.B. and L.R.T.; supervision, I.C.B.; project administration, I.C.B.; funding acquisition, I.C.B. All authors have read and agreed to the published version of the manuscript.
Funding
National Council for Scientific and Technological Development: 306357/2024-0.
Institutional Review Board Statement
Not applicable.
Informed Consent Statement
Not applicable.
Data Availability Statement
Data will be made available on request.
Conflicts of Interest
The authors declare no conflicts of interest.
Abbreviations
The following abbreviations are used in this manuscript:
| AI | Artificial Intelligence |
| CNC | Computer Numerical Control |
| IIoT | Industrial Internet of Things |
| JIPM | Japan Institute of Plant Maintenance |
| LLM | Large Language Model |
| MES | Manufacturing Execution System |
| MTBF/MTTR | Mean Time Between Failures/Mean Time to Repair |
| NLP | Natural Language Processing |
| OEE | Overall Equipment Effectiveness |
| PPC | Production Planning and Control |
| SMED | Single-Minute Exchange of Die |
| TPM | Total Productive Maintenance |
| WCM | World-Class Manufacturing |
| 5W2H | What, Why, When, Where, Who, How, How much |
Appendix A
Appendix A.1. Prompt Protocol
The full prompt protocol applied to each of the three LLMs is reproduced below. Each block was opened in a fresh private chat. All prompts were written in English; the three tools were also tested with Portuguese translations of the same prompts, with no meaningful differences in the resulting diagnostics after refinement.
- Block 1—Contextual framing
“You are acting as a continuous-improvement analyst in a manufacturing company. The cell under analysis is a U-shaped CNC machining cell composed of two identical turning centers (Index IT 600). OEE is calculated on the bottleneck machine. The company uses a commercial MES that records downtime events, setup events, and produces monthly OEE reports. The OEE target is 75%. Availability, performance, and quality are reported as percentages. Please confirm that you have understood the context before continuing.”
- Block 2—Descriptive analysis
“I will now provide you with a monthly table of OEE pillars for the period January 2023–July 2025. The columns are: year-month, hours under analysis, downtime hours, setup hours, availability, performance, quality, OEE, and target OEE. Please analyze the evolution of the pillars by year and by half-year, and highlight any structural patterns, seasonality, or anomalies. Note that April and May 2024 correspond to a regional flood and should be excluded from averages.” [Table of monthly values].
- Block 3—Diagnostic analysis
“For each OEE pillar, list the most probable root causes of the trend observed between 2023 and 2025. Use the vocabulary of maintenance engineering (MTBF, MTTR, lubrication, spare-parts strategy, SMED, Poka-Yoke) when relevant. Rank the causes from most to least likely, and justify the ranking with evidence from the table.”
- Block 4—Prescriptive analysis
Propose improvement actions to reduce machine stoppages and raise equipment efficiency. Organize the actions in three horizons: short term (0–60 days), medium term (60–180 days), and long term (6–18 months). For each pillar and horizon, provide a projected range of attainable values. Explicitly justify each action with a causal link to the diagnostics from Block 3. Each of the four blocks was run three times per tool on different days; the order of the pillars in the questions was rotated between runs to mitigate framing effects. The full output archive of approximately 36 response files (4 blocks × 3 repetitions × 3 tools, plus prompt headers and input OEE tables) remains available from the corresponding author on request.
Appendix A.2. Hallucination Event Log (Gemini, Block 3, Round 1)
This appendix reproduces the relevant excerpts from the round-1 Gemini interaction in which fabricated numerical values were produced, together with the two corrective prompt refinements applied in rounds 2 and 3 and the post-refinement output. The transcripts are reproduced verbatim and lightly trimmed to remove non-substantive turns; ellipses indicate omitted passages.
- (1)
- Round 1 output (problematic). After being given the consolidated half-yearly OEE table (the same input shown to ChatGPT and Copilot), Gemini answered Block 3 with the following passage (excerpt): “In 2024 the cell averaged an availability of approximately 71.4% and an OEE of 70.2%, indicating a clear deterioration relative to 2023. This suggests that the cell entered a slow degradation phase in 2024, before the steep 2025 drop.” However, the input table reports 2024 availability of 77.8% and OEE of 77.7% (excluding the flood-affected April–May 2024 months); the 71.4% and 70.2% figures do not appear in the dataset.
- (2)
- Detection. Cross-checking the LLM output against the input table immediately revealed the discrepancy. The first author flagged the fabrication; the second evaluator (external process engineer) independently confirmed it before any scoring took place.
- (3)
- Corrective prompt refinements (Round 2). The Block-3 prompt was prepended with two explicit guards: (i) “Compute every figure strictly from the rows provided in the table; do not infer, estimate, or imagine values that are not present,” and (ii) “Before continuing the diagnosis, repeat back to me the average availability and OEE for 2023, 2024, and 2025 exactly as they appear in the table.”
- (4)
- Post-refinement output (Rounds 2 and 3). Gemini correctly reproduced the table values (2023 availability ≈ 75.4%, 2024 availability ≈ 77.8% excluding flood months, 2025/1 availability = 54.3%) and proceeded to diagnose availability as the critical pillar, with a narrative consistent with the diagnoses produced by ChatGPT and Copilot. No fabricated values were observed in rounds 2 and 3.
- (5)
- Scoring consequence. Because round 1 produced fabricated numbers and rounds 2–3 produced correct, convergent diagnoses, Gemini received a consistency consensus score of 3 (Table 6b), corresponding to “identical in 1/3 with partial overlap in the others” on the operational threshold defined in Section 3.6. ChatGPT and Copilot did not exhibit fabricated values across the three rounds and received consistency scores of 5 and 4, respectively.
References
- Ullah, S.; Kiani, U.S.; Raza, B.; Mustafa, A. Consumers’ intention to adopt m-payment/m-banking: The role of their financial skills and digital literacy. Front. Psychol. 2022, 13, 873708. [Google Scholar] [CrossRef] [Scilit]
- Suryaprakash, M.; Prabha, M.G.; Yuvaraja, M.; Revanth, R.R. Improvement of overall equipment effectiveness of machining centre using tpm. Mater. Today Proc. 2021, 46, 9348–9353. [Google Scholar] [CrossRef] [Scilit]
- Brettel, M.; Bendig, D.; Keller, M.; Friederichsen, N.; Rosenberg, M. Effectuation in manufacturing: How entrepreneurial decision-making techniques can be used to deal with uncertainty. Procedia CIRP 2014, 17, 611–616. [Google Scholar] [CrossRef] [Scilit]
- Nakajima, S. Introduction to TPM: Total Productive Maintenance; Productivity Press: Cambridge, MA, USA, 1988. [Google Scholar]
- Bamber, C.J.; Castka, P.; Sharp, J.M.; Motara, Y. Cross-functional team working for Overall Equipment Effectiveness (OEE). J. Qual. Maint. Eng. 2003, 9, 223–238. [Google Scholar] [CrossRef] [Scilit]
- Murino, T.; Naviglio, G.; Romano, E.; Guerra, L.; Revetria, R.; Mosca, R.; Cassettari, L. A World Class Manufacturing implementation model. Appl. Math. Inf. Sci. 2012, 6, 69–78. [Google Scholar]
- Ljungberg, Õ. Measurement of overall equipment effectiveness as a basis for TPM activities. Int. J. Oper. Prod. Manag. 1998, 18, 495–507. [Google Scholar] [CrossRef] [Scilit]
- Jeong, K.-Y.; Phillips, D.T. Operational efficiency and effectiveness measurement. Int. J. Oper. Prod. Manag. 2001, 21, 1404–1416. [Google Scholar] [CrossRef] [Scilit]
- Carvalho, N.; Chaim, O.; Cazarini, E.; Gerolamo, M. Manufacturing in the fourth industrial revolution: A positive prospect in sustainable manufacturing. Procedia Manuf. 2018, 21, 671–678. [Google Scholar] [CrossRef] [Scilit]
- Schwab, K. The Fourth Industrial Revolution; Crown Business: New York, NY, USA, 2017. [Google Scholar]
- Calandreli, P.R.; Valle, P.D.; Deschamps, F. Maximising operational efficiency with Industry 4.0 technology: Integrating OEE as a performance indicator. Int. J. Adv. Manuf. Technol. 2025, 138, 855–872. [Google Scholar] [CrossRef] [Scilit]
- Terzi, S.; Cavalieri, S. Simulation in the supply chain context: A survey. Comput. Ind. 2004, 53, 3–16. [Google Scholar] [CrossRef] [Scilit]
- Shah, J.H. MES-Enabled Cyber-Physical Production Systems: Accelerating Automotive Line Efficiency via Real-Time Decision Frameworks. Int. J. Emerg. Res. Eng. Technol. 2023, 4, 87–94. [Google Scholar]
- Kalla, D.; Smith, N. Study and analysis of ChatGPT and its impact on different fields of study. Int. J. Innov. Sci. Res. Technol. 2023, 8, 827–833. [Google Scholar]
- Ariyaratne, H. ChatGPT and intermediary liability: Why section 230 does not and should not protect generative algorithms. SSRN 2023, 1, 1–28. [Google Scholar] [CrossRef] [Scilit]
- Bang, Y.; Cahyawijaya, S.; Lee, N.; Dai, W.; Su, D.; Wilie, B.; Lovenia, H.; Ji, Z.; Yu, T.; Chung, W.; et al. A multitask, multilingual, and multimodal evaluation of ChatGPT on reasoning, hallucination, and interactivity. In Proceedings of the 13th International Joint Conference on Natural Language Processing and the 3rd Conference of the Asia-Pacific Chapter of the Association for Computational Linguistics, Nusa Dua, Bali, Indonesia, 1–4 November 2023; pp. 675–718. [Google Scholar] [CrossRef] [Scilit]
- Haridasan, P.K.; Jawale, H. Generative AI in Manufacturing: A Review of Innovations, Challenges and Future Prospects. J. Artif. Intell. Mach. Learn. Data Sci. 2024, 2, 1418–1424. [Google Scholar] [CrossRef] [Scilit]
- Cadavid, J.P.U.; Lamouri, S.; Grabot, B.; Pellerin, R.; Fortin, A. Machine learning applied in production planning and control: A state-of-the-art in the era of Industry 4.0. J. Intell. Manuf. 2020, 31, 1531–1558. [Google Scholar] [CrossRef] [Scilit]
- Bonada, F.; Echeverria, L.; Domingo, X.; Anzaldi, G. AI for improving the Overall Equipment Efficiency in manufacturing industry. In New Trends in the Use of Artificial Intelligence for the Industry 4.0; IntechOpen: London, UK, 2020. [Google Scholar] [CrossRef] [Scilit]
- Jamwal, A.; Agrawal, R.; Sharma, M.; Kumar, A.; Kumar, V.; Garza-Reyes, J.A.A. Machine learning applications for sustainable manufacturing: A bibliometric-based review for future research. J. Enterp. Inf. Manag. 2022, 35, 566–596. [Google Scholar] [CrossRef] [Scilit]
- Sjödin, D.; Parida, V.; Palmié, M.; Wincent, J. How AI capabilities enable business model innovation: Scaling AI through co-evolutionary processes and feedback loops. J. Bus. Res. 2021, 134, 574–587. [Google Scholar] [CrossRef] [Scilit]
- Haefner, N.; Wincent, J.; Parida, V.; Gassmann, O. Artificial intelligence and innovation management: A review, framework, and research agenda. Technol. Forecast. Soc. Change 2021, 162, 120392. [Google Scholar] [CrossRef] [Scilit]
- Hacker, P.; Engel, A.; Mauer, M. Regulating ChatGPT and other large generative AI models. In Proceedings of the 2023 ACM Conference on Fairness, Accountability, and Transparency (FAccT ‘23), Chicago, IL, USA, 12–15 June 2023; pp. 1112–1123. [Google Scholar] [CrossRef] [Scilit]
- Oldemeyer, L.; Jede, A.; Teuteberg, F. Investigation of artificial intelligence in SMEs: A systematic review of the state of the art and the main implementation challenges. Manag. Rev. Q. 2024, 75, 1185–1227. [Google Scholar] [CrossRef] [Scilit]
- Basak, S.; Baumers, M.; Holweg, M.; Hague, R.; Tuck, C. Reducing production losses in additive manufacturing using overall equipment effectiveness. Addit. Manuf. 2022, 56, 102904. [Google Scholar] [CrossRef] [Scilit]
- Benardos, P.G.; Vosniakos, G.-C. Prediction of surface roughness in CNC face milling using neural networks and Taguchi’s design of experiments. Robot. Comput.-Integr. Manuf. 2002, 18, 343–354. [Google Scholar] [CrossRef] [Scilit]
- Zheng, T.; Ardolino, M.; Bacchetti, A.; Perona, M. The applications of Industry 4.0 technologies in manufacturing context: A systematic literature review. Int. J. Prod. Res. 2021, 59, 1922–1954. [Google Scholar] [CrossRef] [Scilit]
- Ullah, M.R.; Molla, S.; Siddique, I.M.; Siddique, A.A.; Abedin, M.M. Optimizing performance: A deep dive into overall equipment effectiveness (OEE) for operational excellence. J. Ind. Mech. 2023, 8, 26–40. [Google Scholar] [CrossRef] [Scilit]
- Chan, F.T.S.; Lau, H.C.W.; Ip, R.W.L.; Chan, H.K.; Kong, S. Implementation of total productive maintenance: A case study. Int. J. Prod. Econ. 2005, 95, 71–94. [Google Scholar] [CrossRef] [Scilit]
- Jonsson, P.; Lesshammar, M. Evaluation and improvement of manufacturing performance measurement systems—The role of OEE. Int. J. Oper. Prod. Manag. 1999, 19, 55–78. [Google Scholar] [CrossRef] [Scilit]
- Kletti, J. Manufacturing Execution Systems—MES; Springer: Berlin/Heidelberg, Germany, 2007. [Google Scholar] [CrossRef] [Scilit]
- Meyer, H.; Fuchs, F.; Thiel, K. Manufacturing Execution Systems: Optimal Design, Planning, and Deployment; McGraw-Hill: New York, NY, USA, 2009. [Google Scholar]
- Khan, W.Z.; Rehman, M.H.; Zangoti, H.M.; Afzal, M.K.; Armi, N.; Salah, K. Industrial internet of things: Recent advances, enabling technologies and open challenges. Comput. Electr. Eng. 2020, 81, 106522. [Google Scholar] [CrossRef] [Scilit]
- Wang, Y.; Ma, H.-S.; Yang, J.-H.; Wang, K.-S. Industry 4.0: A way from mass customisation to mass personalisation production. Adv. Manuf. 2017, 5, 311–320. [Google Scholar] [CrossRef] [Scilit]
- Dreyfus, H.L.; Dreyfus, S.E. Making a mind versus modelling the brain: Artificial intelligence back at a branchpoint. Daedalus 1988, 117, 15–43. [Google Scholar]
- Russell, S.J.; Norvig, P. Artificial Intelligence: A Modern Approach, 4th ed.; Pearson: Hoboken, NJ, USA, 2022. [Google Scholar]
- Goodfellow, I.; Bengio, Y.; Courville, A. Deep Learning; MIT Press: Cambridge, MA, USA, 2016. [Google Scholar]
- Davenport, T.H. The AI Advantage: How to Put the Artificial Intelligence Revolution to Work; MIT Press: Cambridge, MA, USA, 2018. [Google Scholar]
- Wei, J.; Wang, X.; Schuurmans, D.; Bosma, M.; Ichter, B.; Xia, F.; Chi, E.; Le, Q.; Zhou, D. Chain-of-thought prompting elicits reasoning in large language models. Adv. Neural Inf. Process. Syst. 2022, 35, 24824–24837. [Google Scholar]
- Brown, T.B.; Mann, B.; Ryder, N.; Subbiah, M.; Kaplan, J.; Dhariwal, P.; Neelakantan, A.; Shyam, P.; Sastry, G.; Askell, A.; et al. Language models are few-shot learners. Adv. Neural Inf. Process. Syst. 2020, 33, 1877–1901. [Google Scholar]
- Wang, X.; Wei, J.; Schuurmans, D.; Le, Q.; Chi, E.; Narang, S.; Chowdhery, A.; Zhou, D. Self-consistency improves chain of thought reasoning in language models. In Proceedings of the 11th International Conference on Learning Representations (ICLR 2023), Kigali, Rwanda, 1–5 May 2023. [Google Scholar]
- Anikiforidis, K.; Kyrtsoglou, A.; Vafeiadis, T.; Kotsiopoulos, T.; Nizamis, A.; Ioannidis, D.; Votis, K.; Tzovaras, D.; Sarigiannidis, P. Enhancing transparency and trust in AI-powered manufacturing: A survey of explainable AI (XAI) applications in smart manufacturing in the era of industry 4.0/5.0. ICT Express 2025, 11, 135–148. [Google Scholar] [CrossRef] [Scilit]
- Yin, R.K. Case Study Research and Applications: Design and Methods, 6th ed.; SAGE Publications: Los Angeles, CA, USA, 2018. [Google Scholar]
- Eisenhardt, K.M. Building theories from case study research. Acad. Manag. Rev. 1989, 14, 532–550. [Google Scholar] [CrossRef] [Scilit]
- Siggelkow, N. Persuasion with case studies. Acad. Manag. J. 2007, 50, 20–24. [Google Scholar] [CrossRef] [Scilit]
- Goldratt, E.M.; Cox, J. The Goal: A Process of Ongoing Improvement, 30th ed.; North River Press: Great Barrington, MA, USA, 2014. [Google Scholar]
- Rusev, S.J.; Salonitis, K. Operational excellence assessment framework for manufacturing companies. Procedia CIRP 2016, 55, 272–277. [Google Scholar] [CrossRef] [Scilit]
- Andrade, D.F. Gestão pela Qualidade; Editora Poisson: Belo Horizonte, Brazil, 2018. [Google Scholar]
- Muhammad, A.; Awan, U.; Kraslawski, A.; Huseyin, O. Industry 5.0: Human-centric, resilient and sustainable manufacturing. J. Manuf. Syst. 2024, 72, 350–368. [Google Scholar]
- Westerman, G.; Bonnet, D.; McAfee, A. Leading Digital: Turning Technology into Business Transformation; Harvard Business Review Press: Boston, MA, USA, 2014. [Google Scholar]
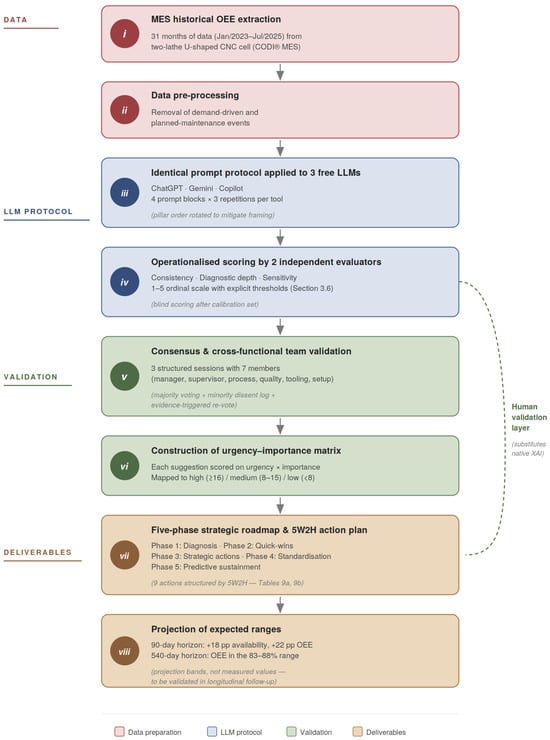
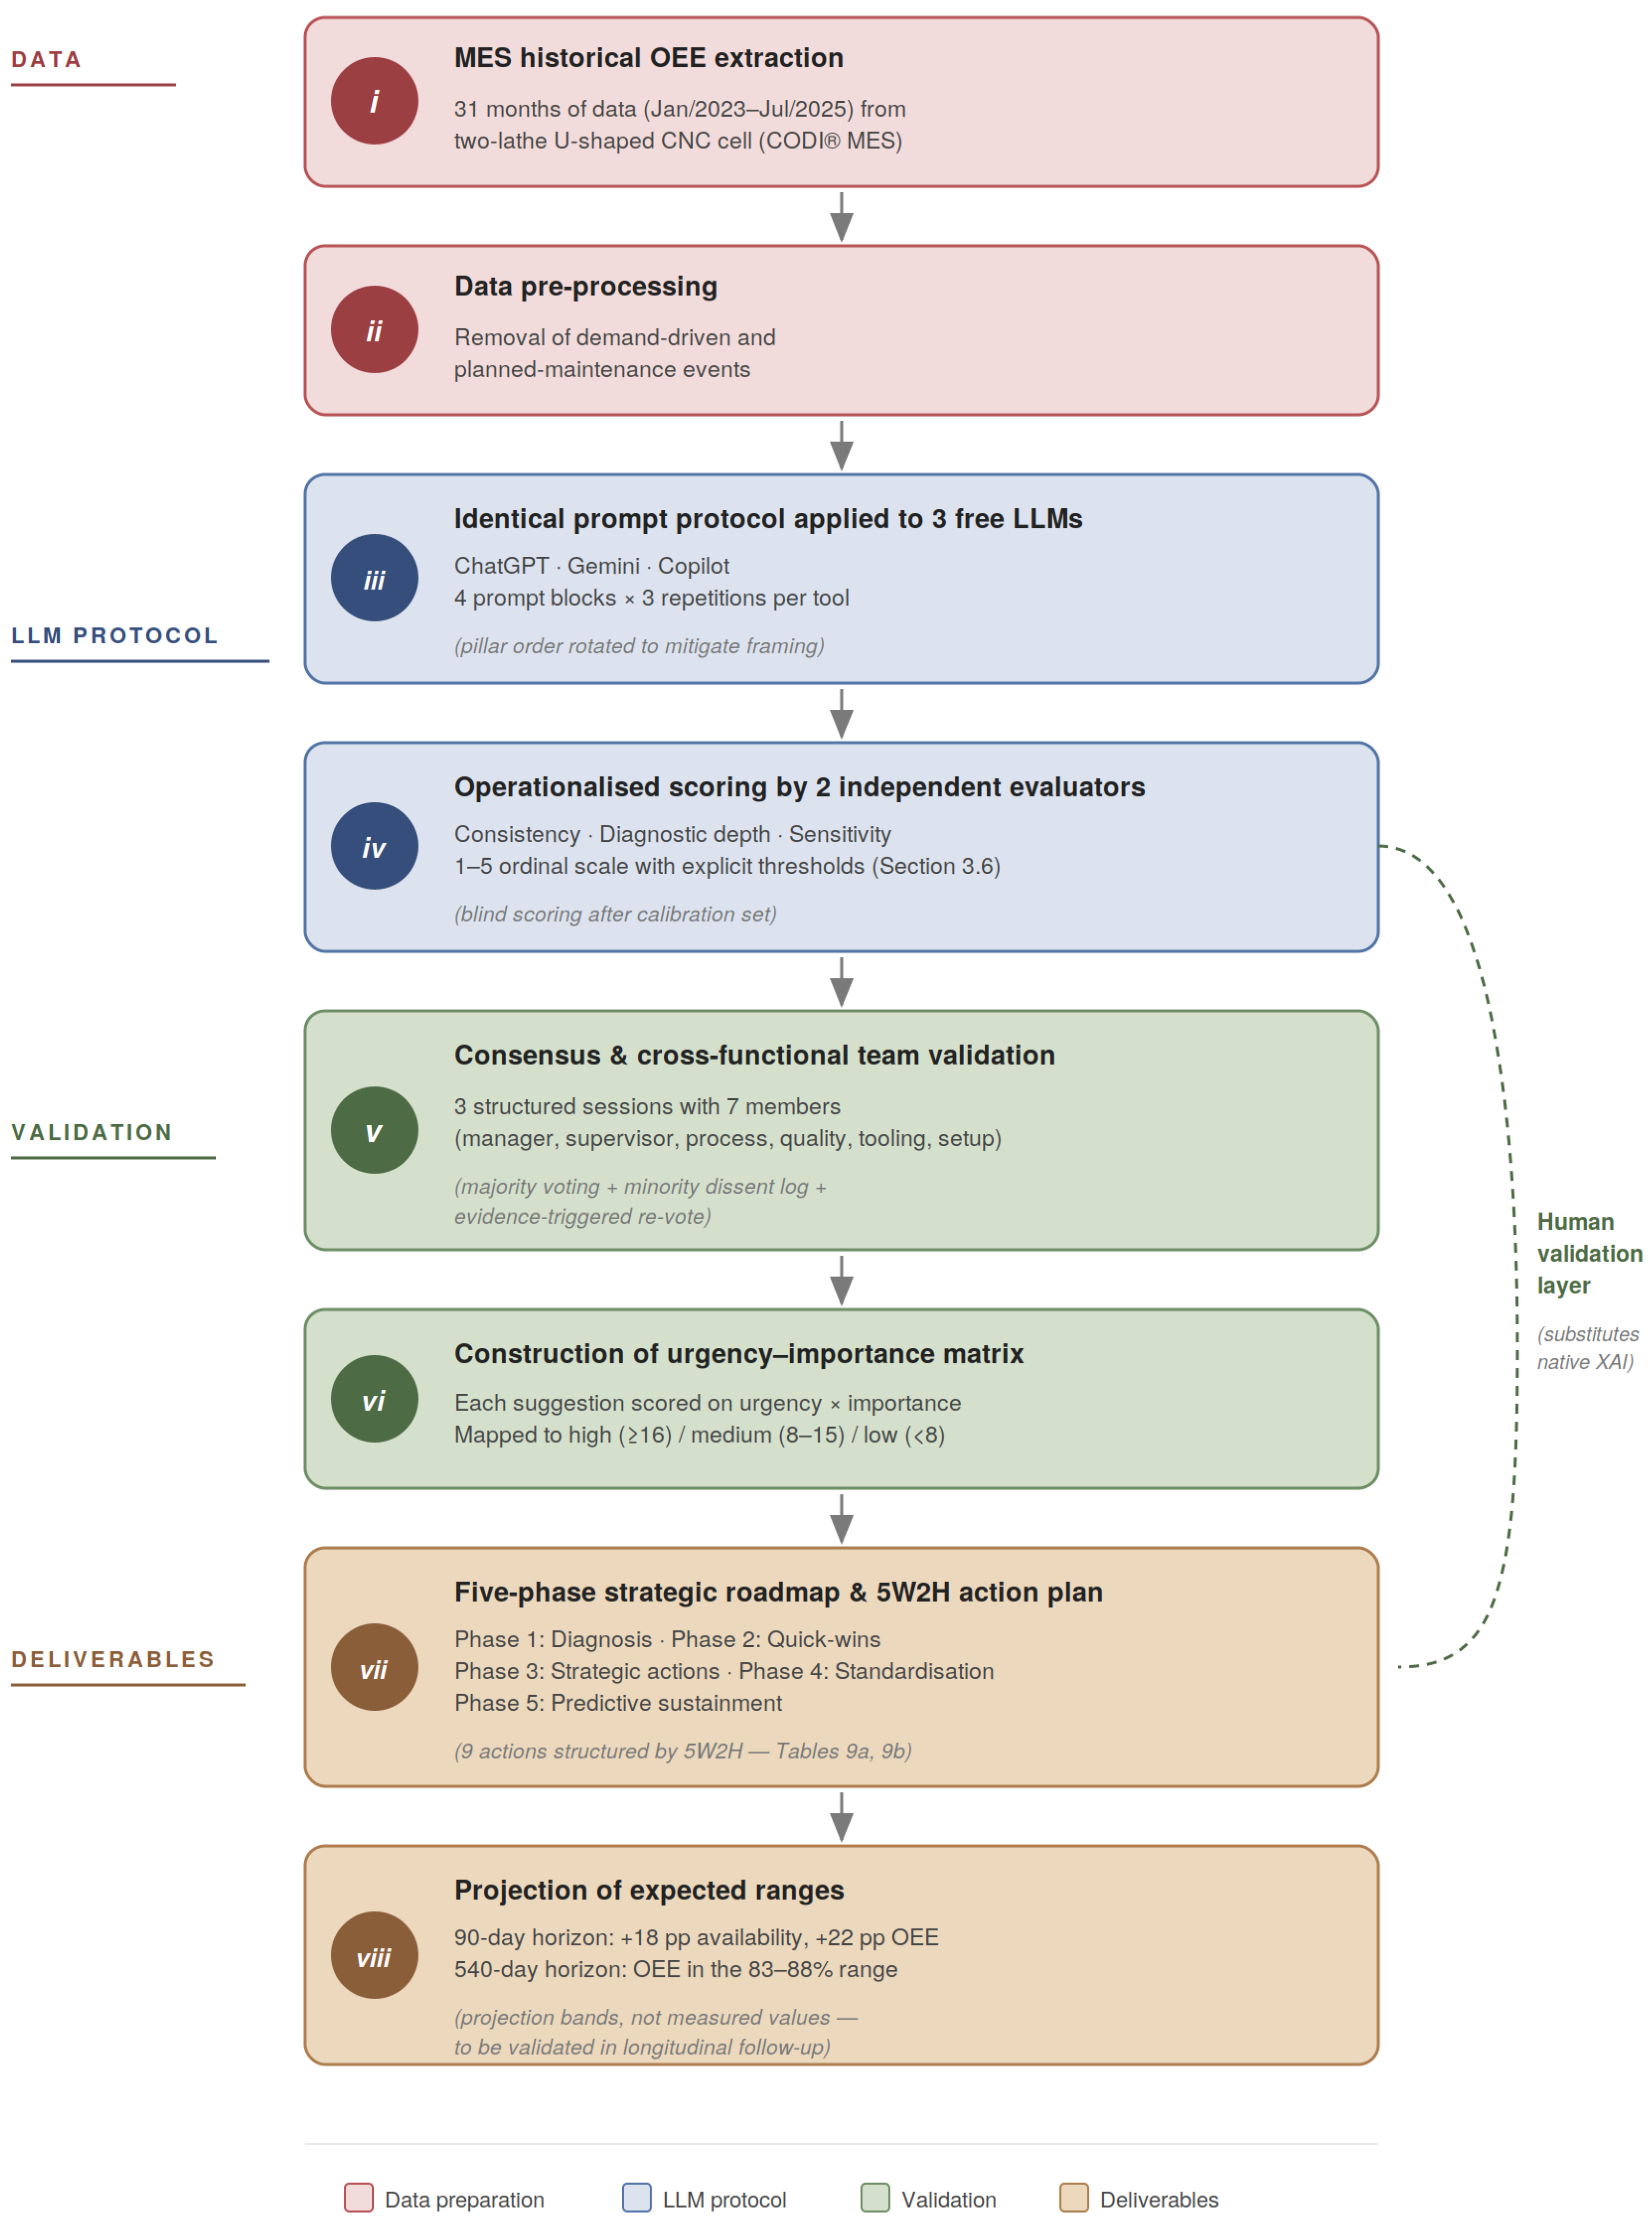
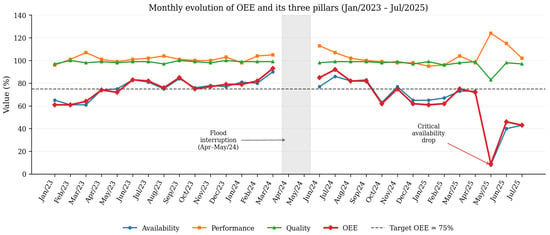
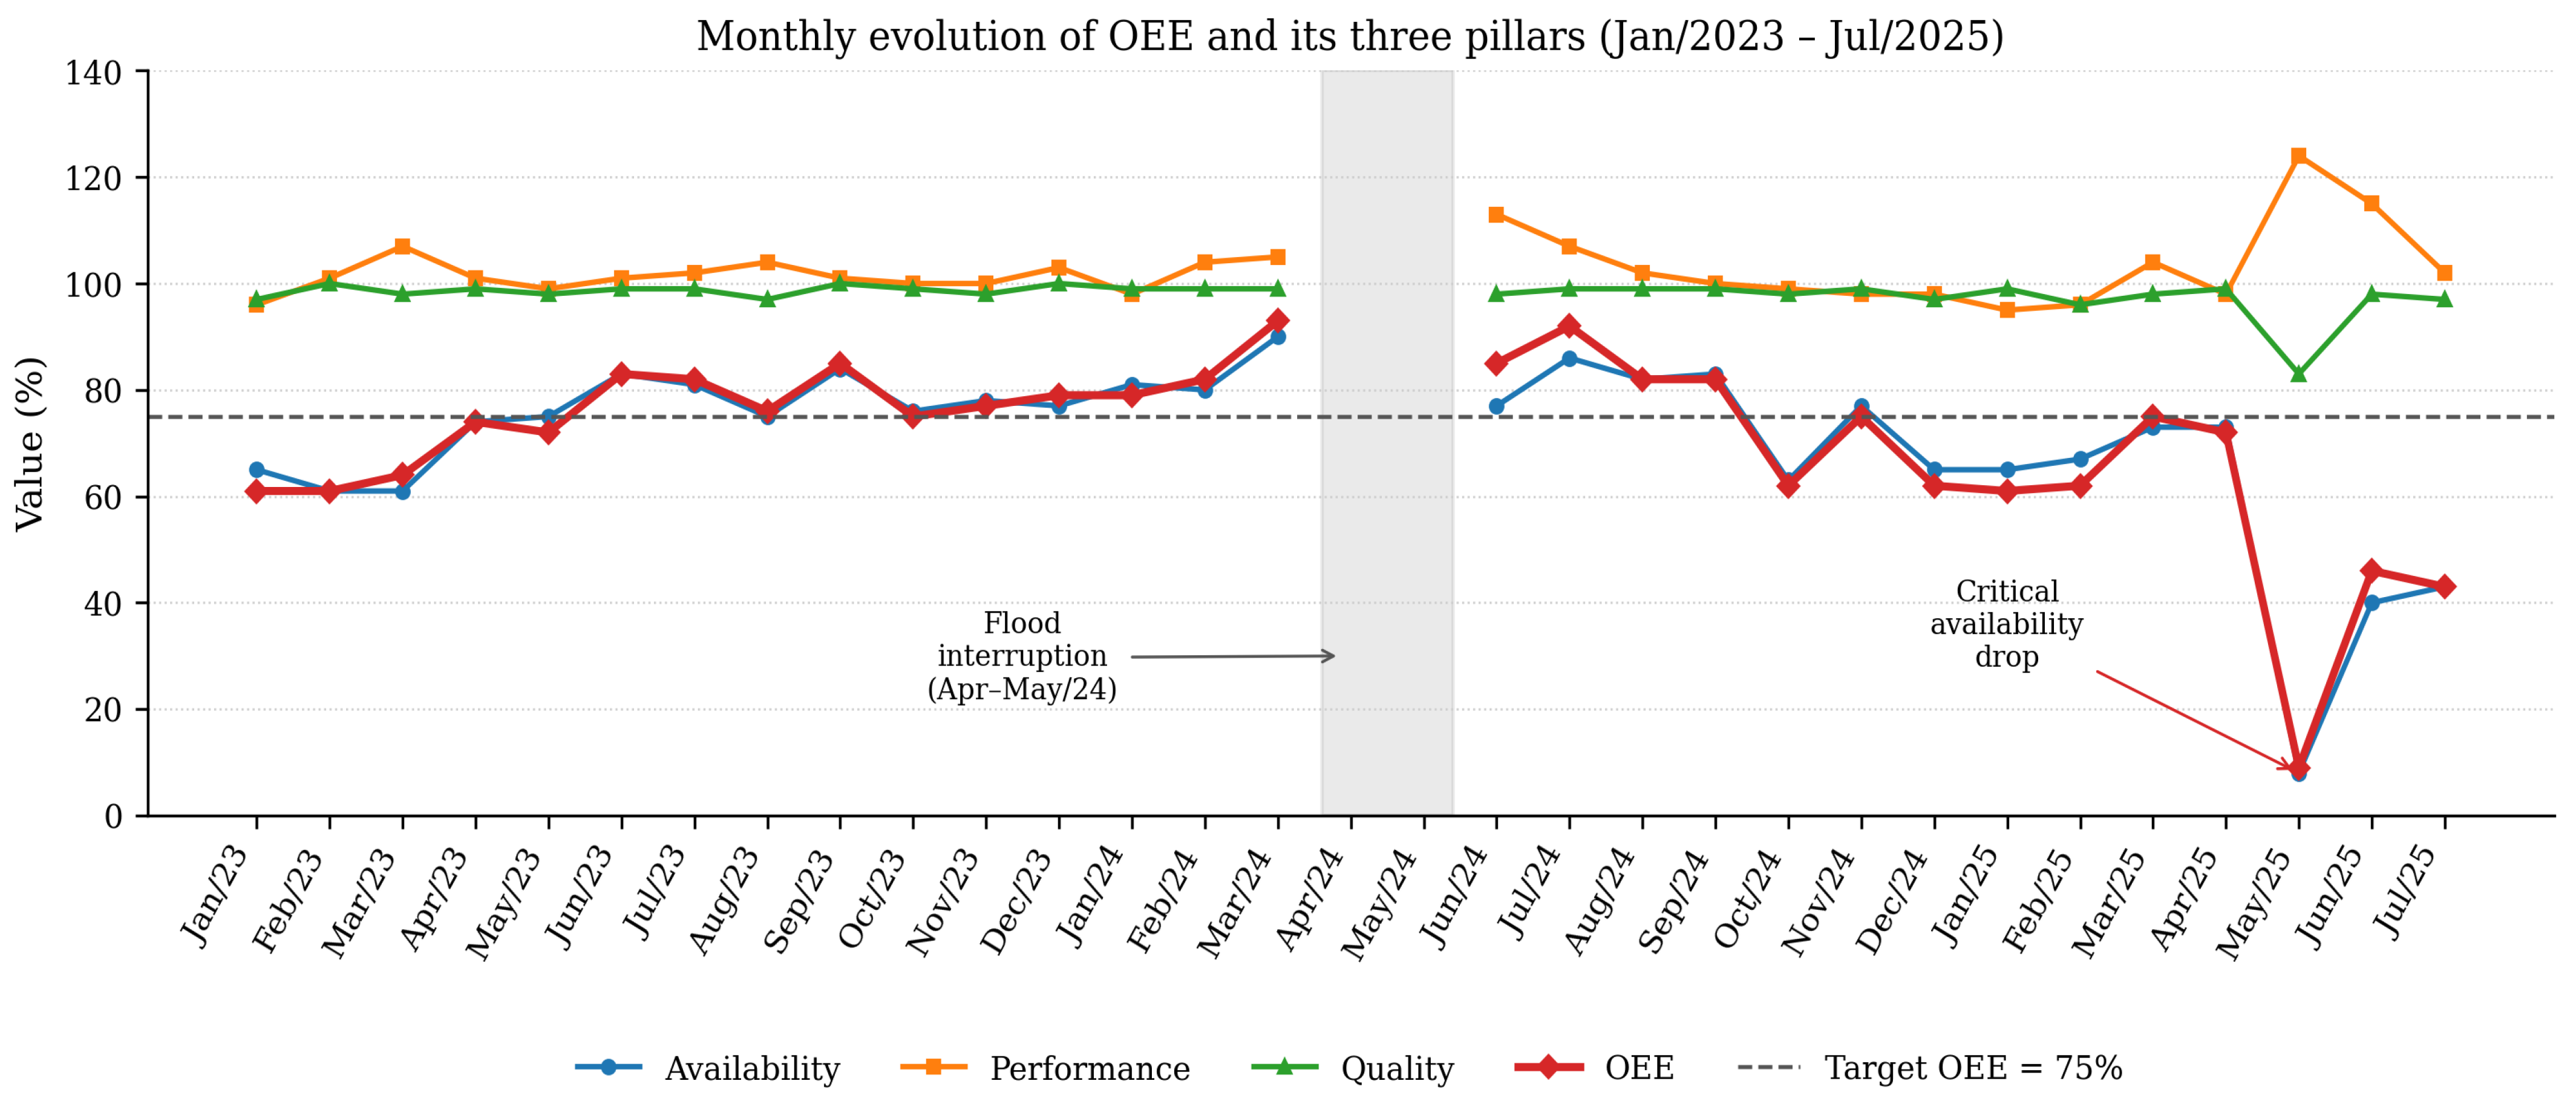
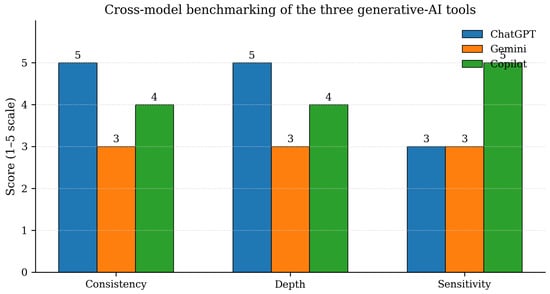
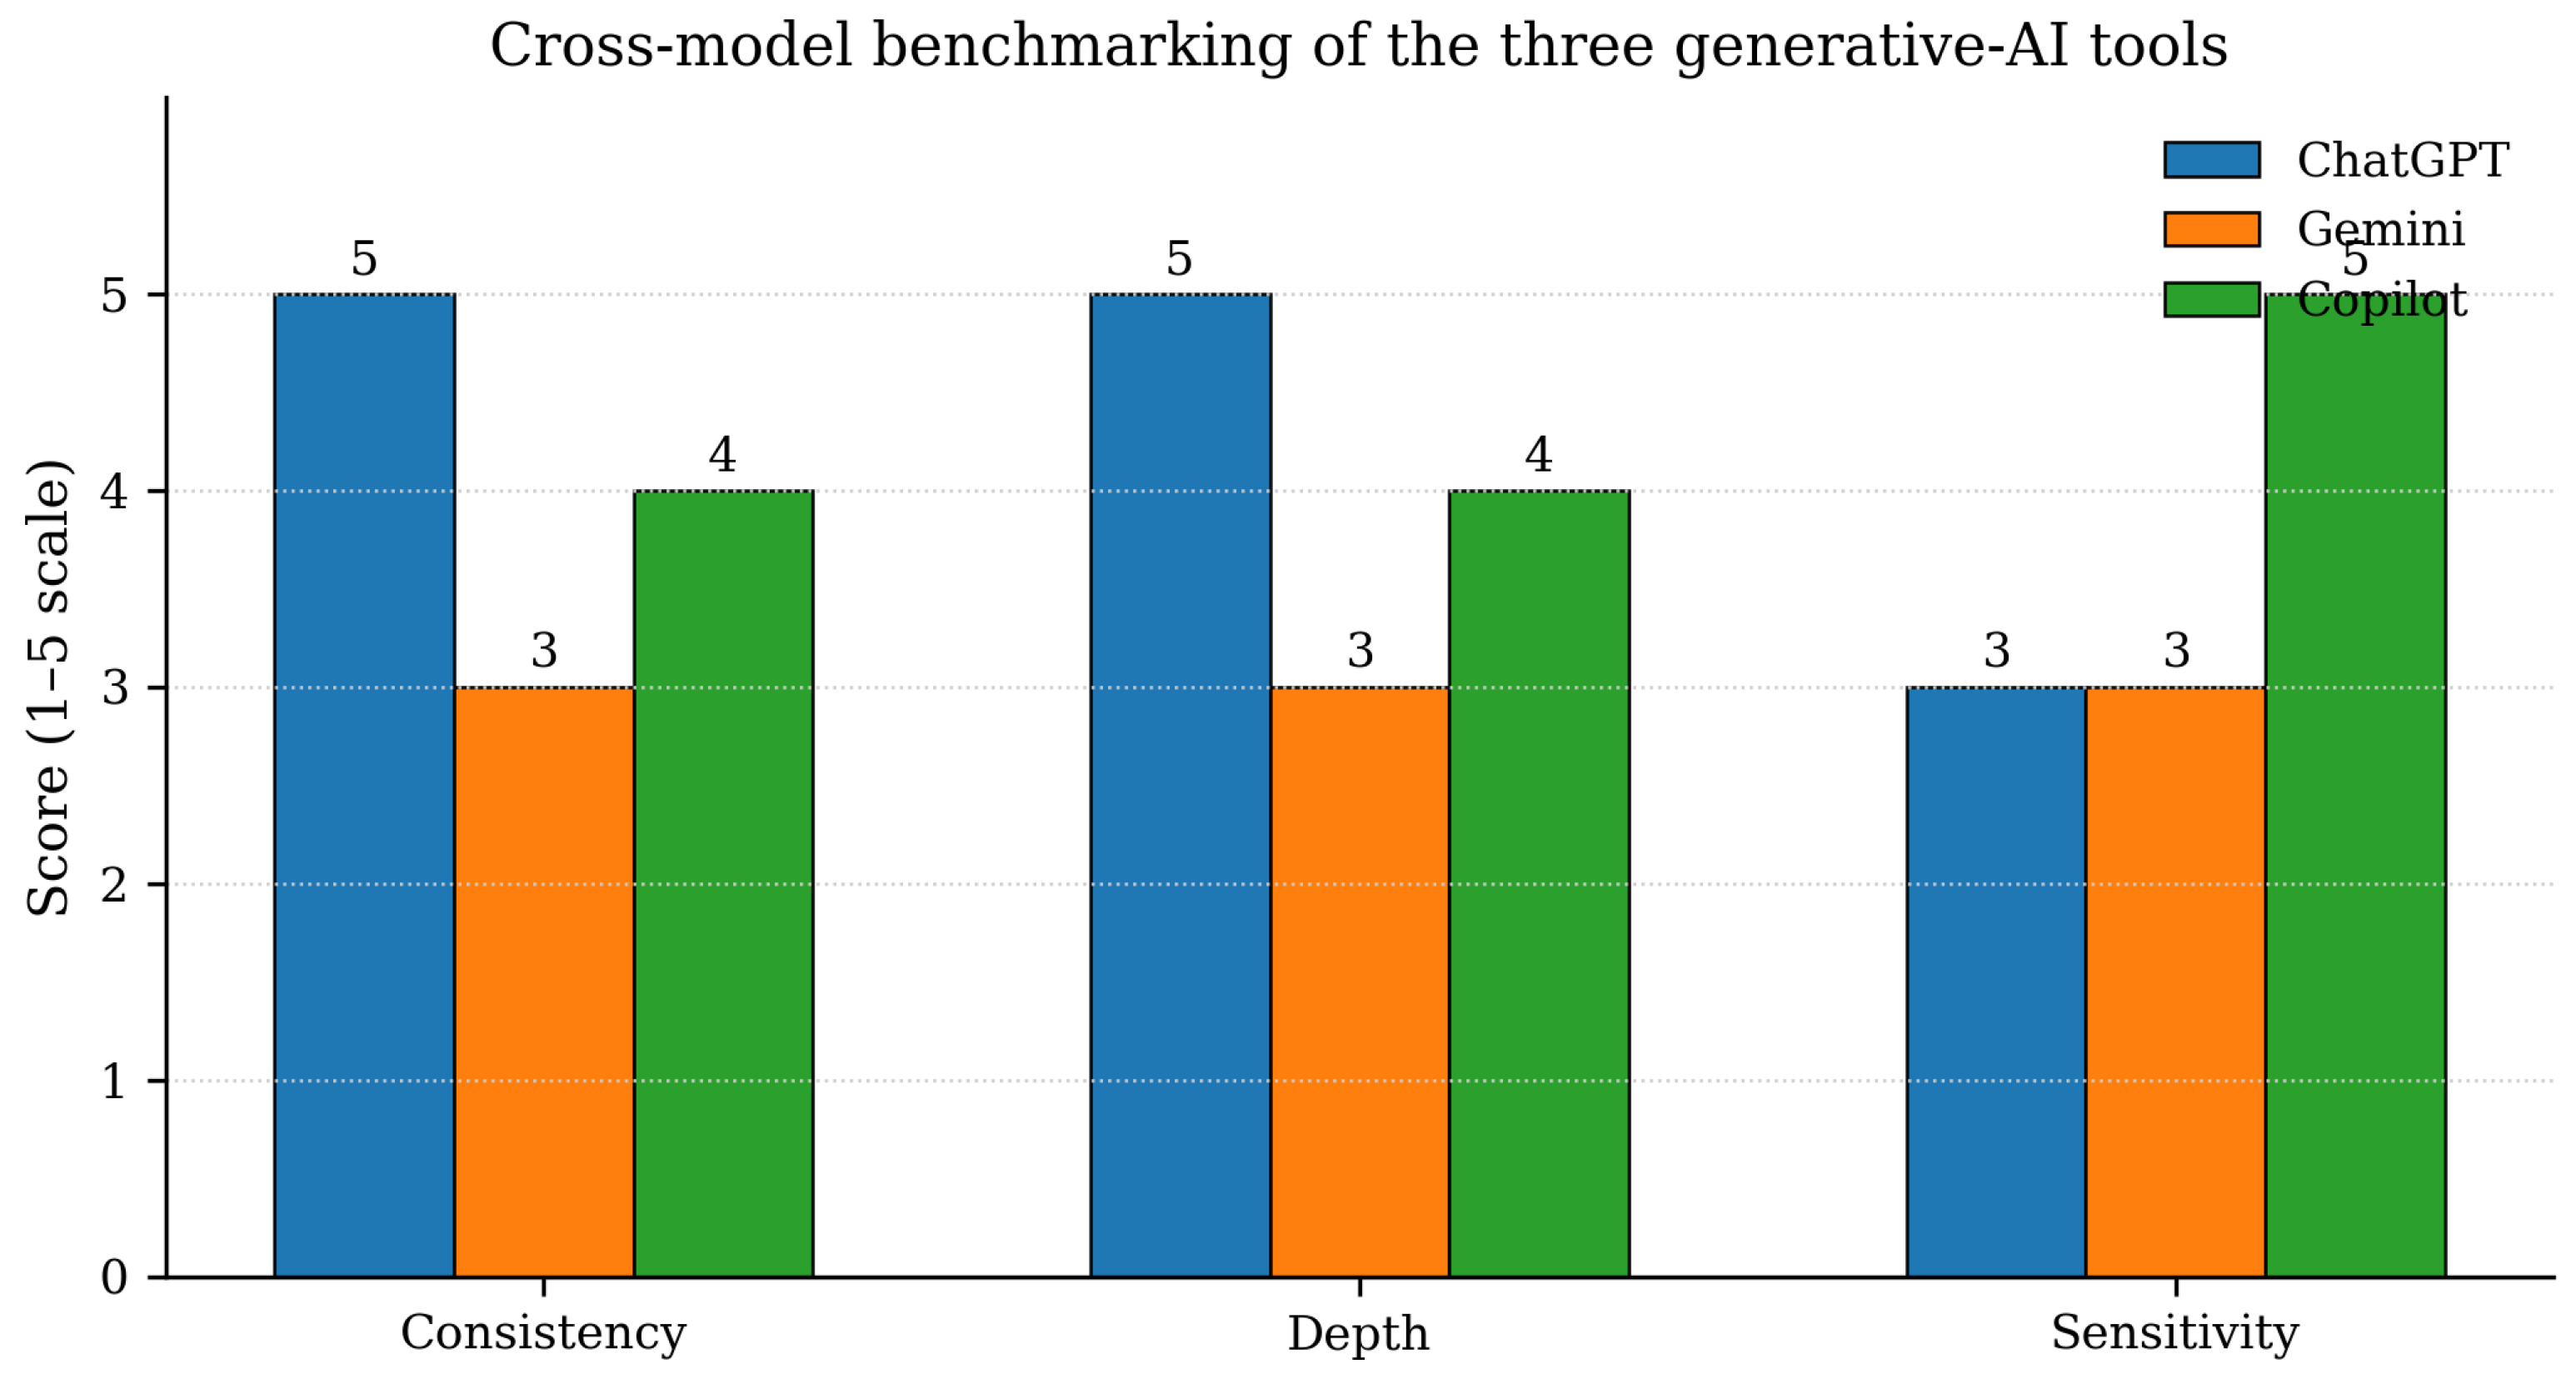
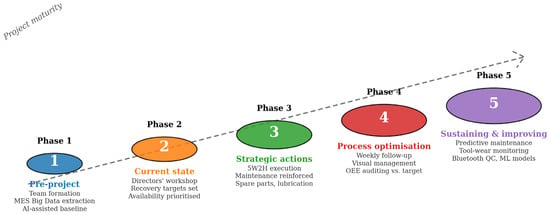
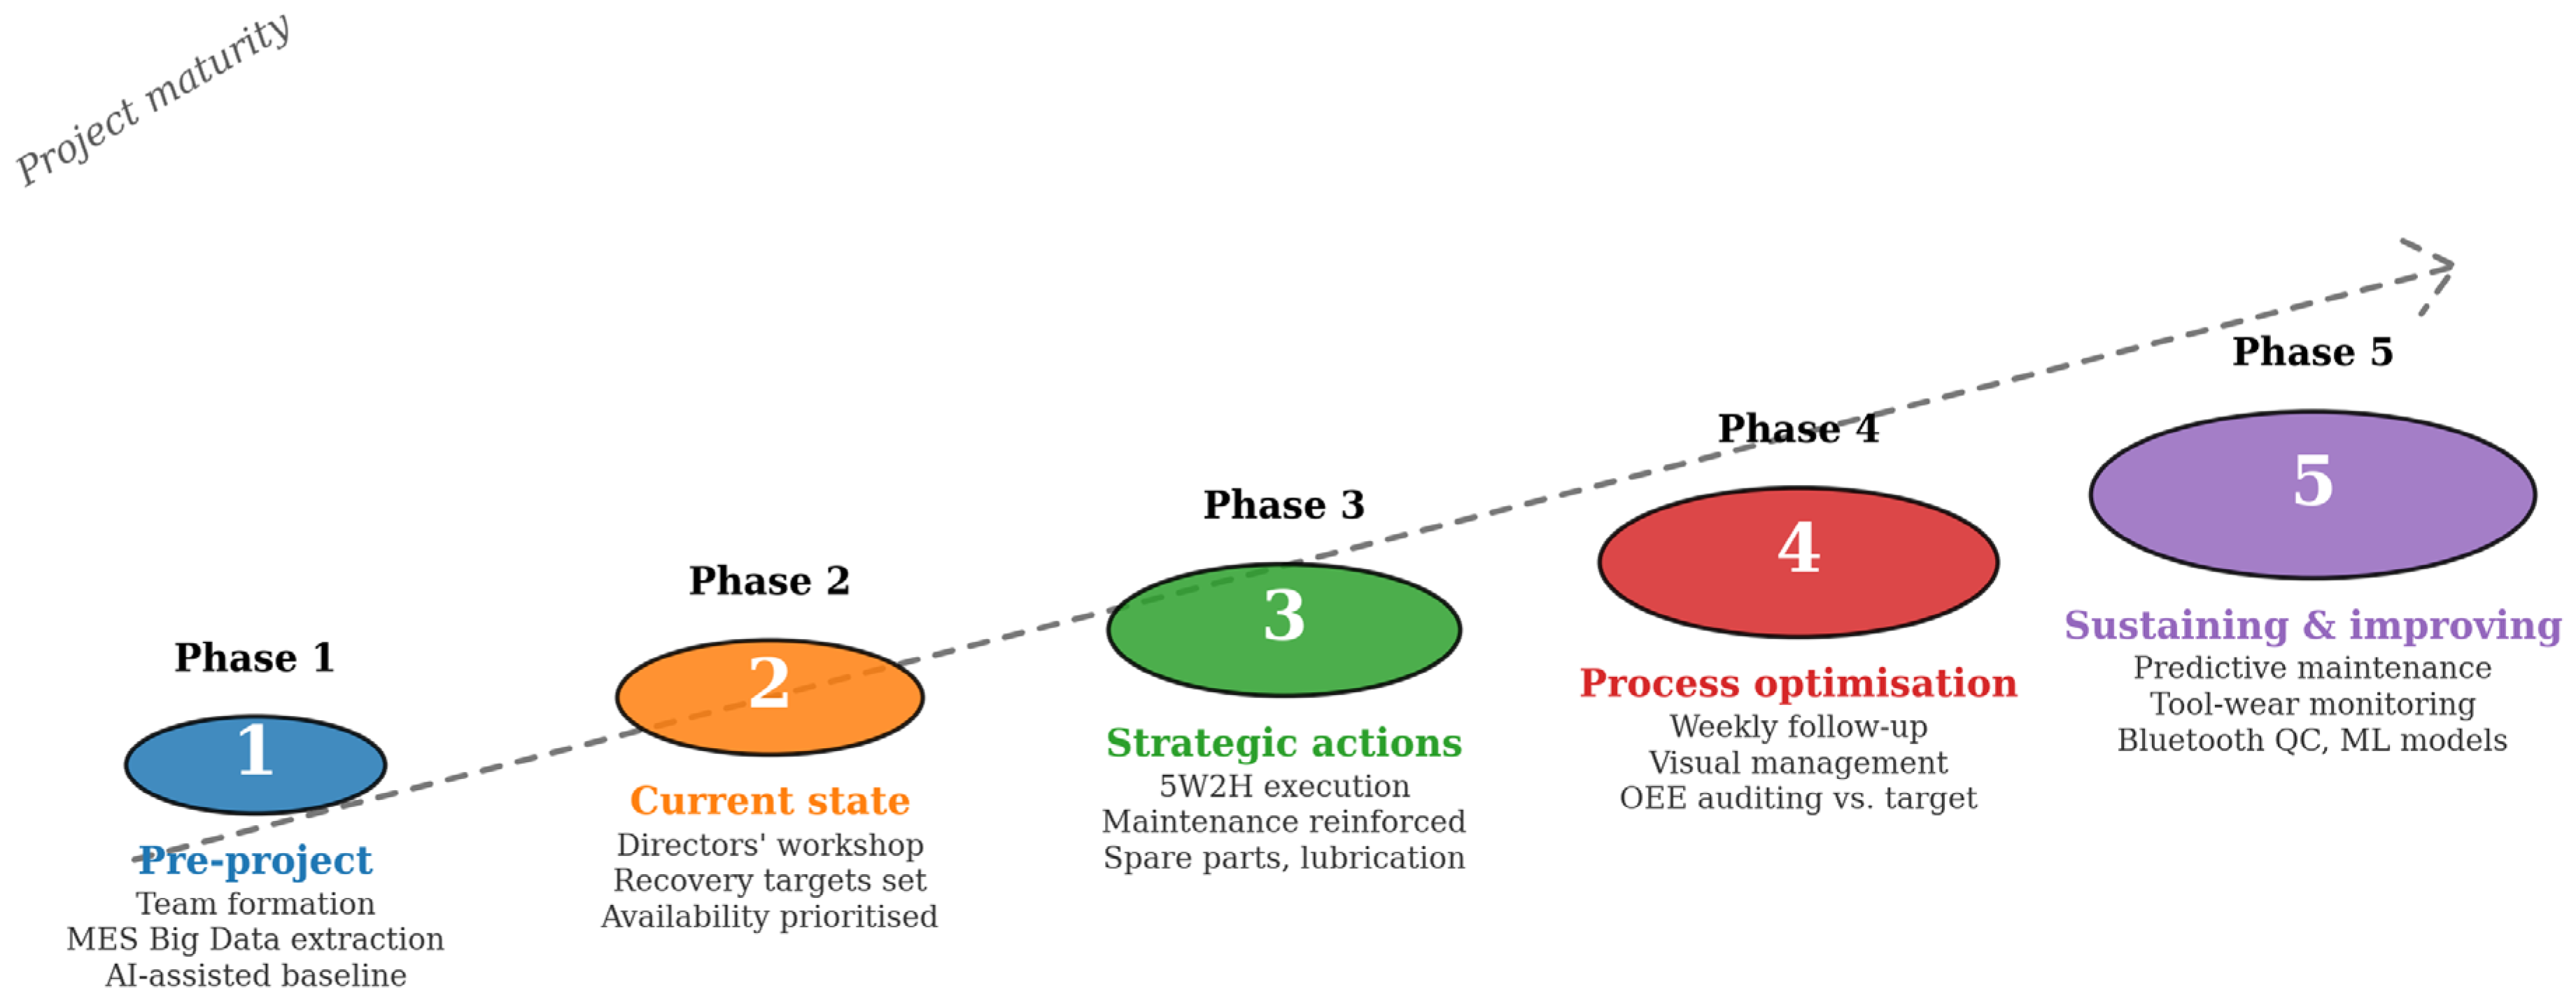
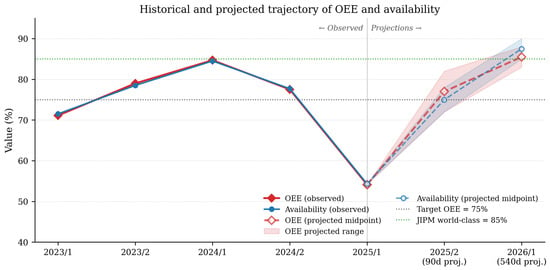
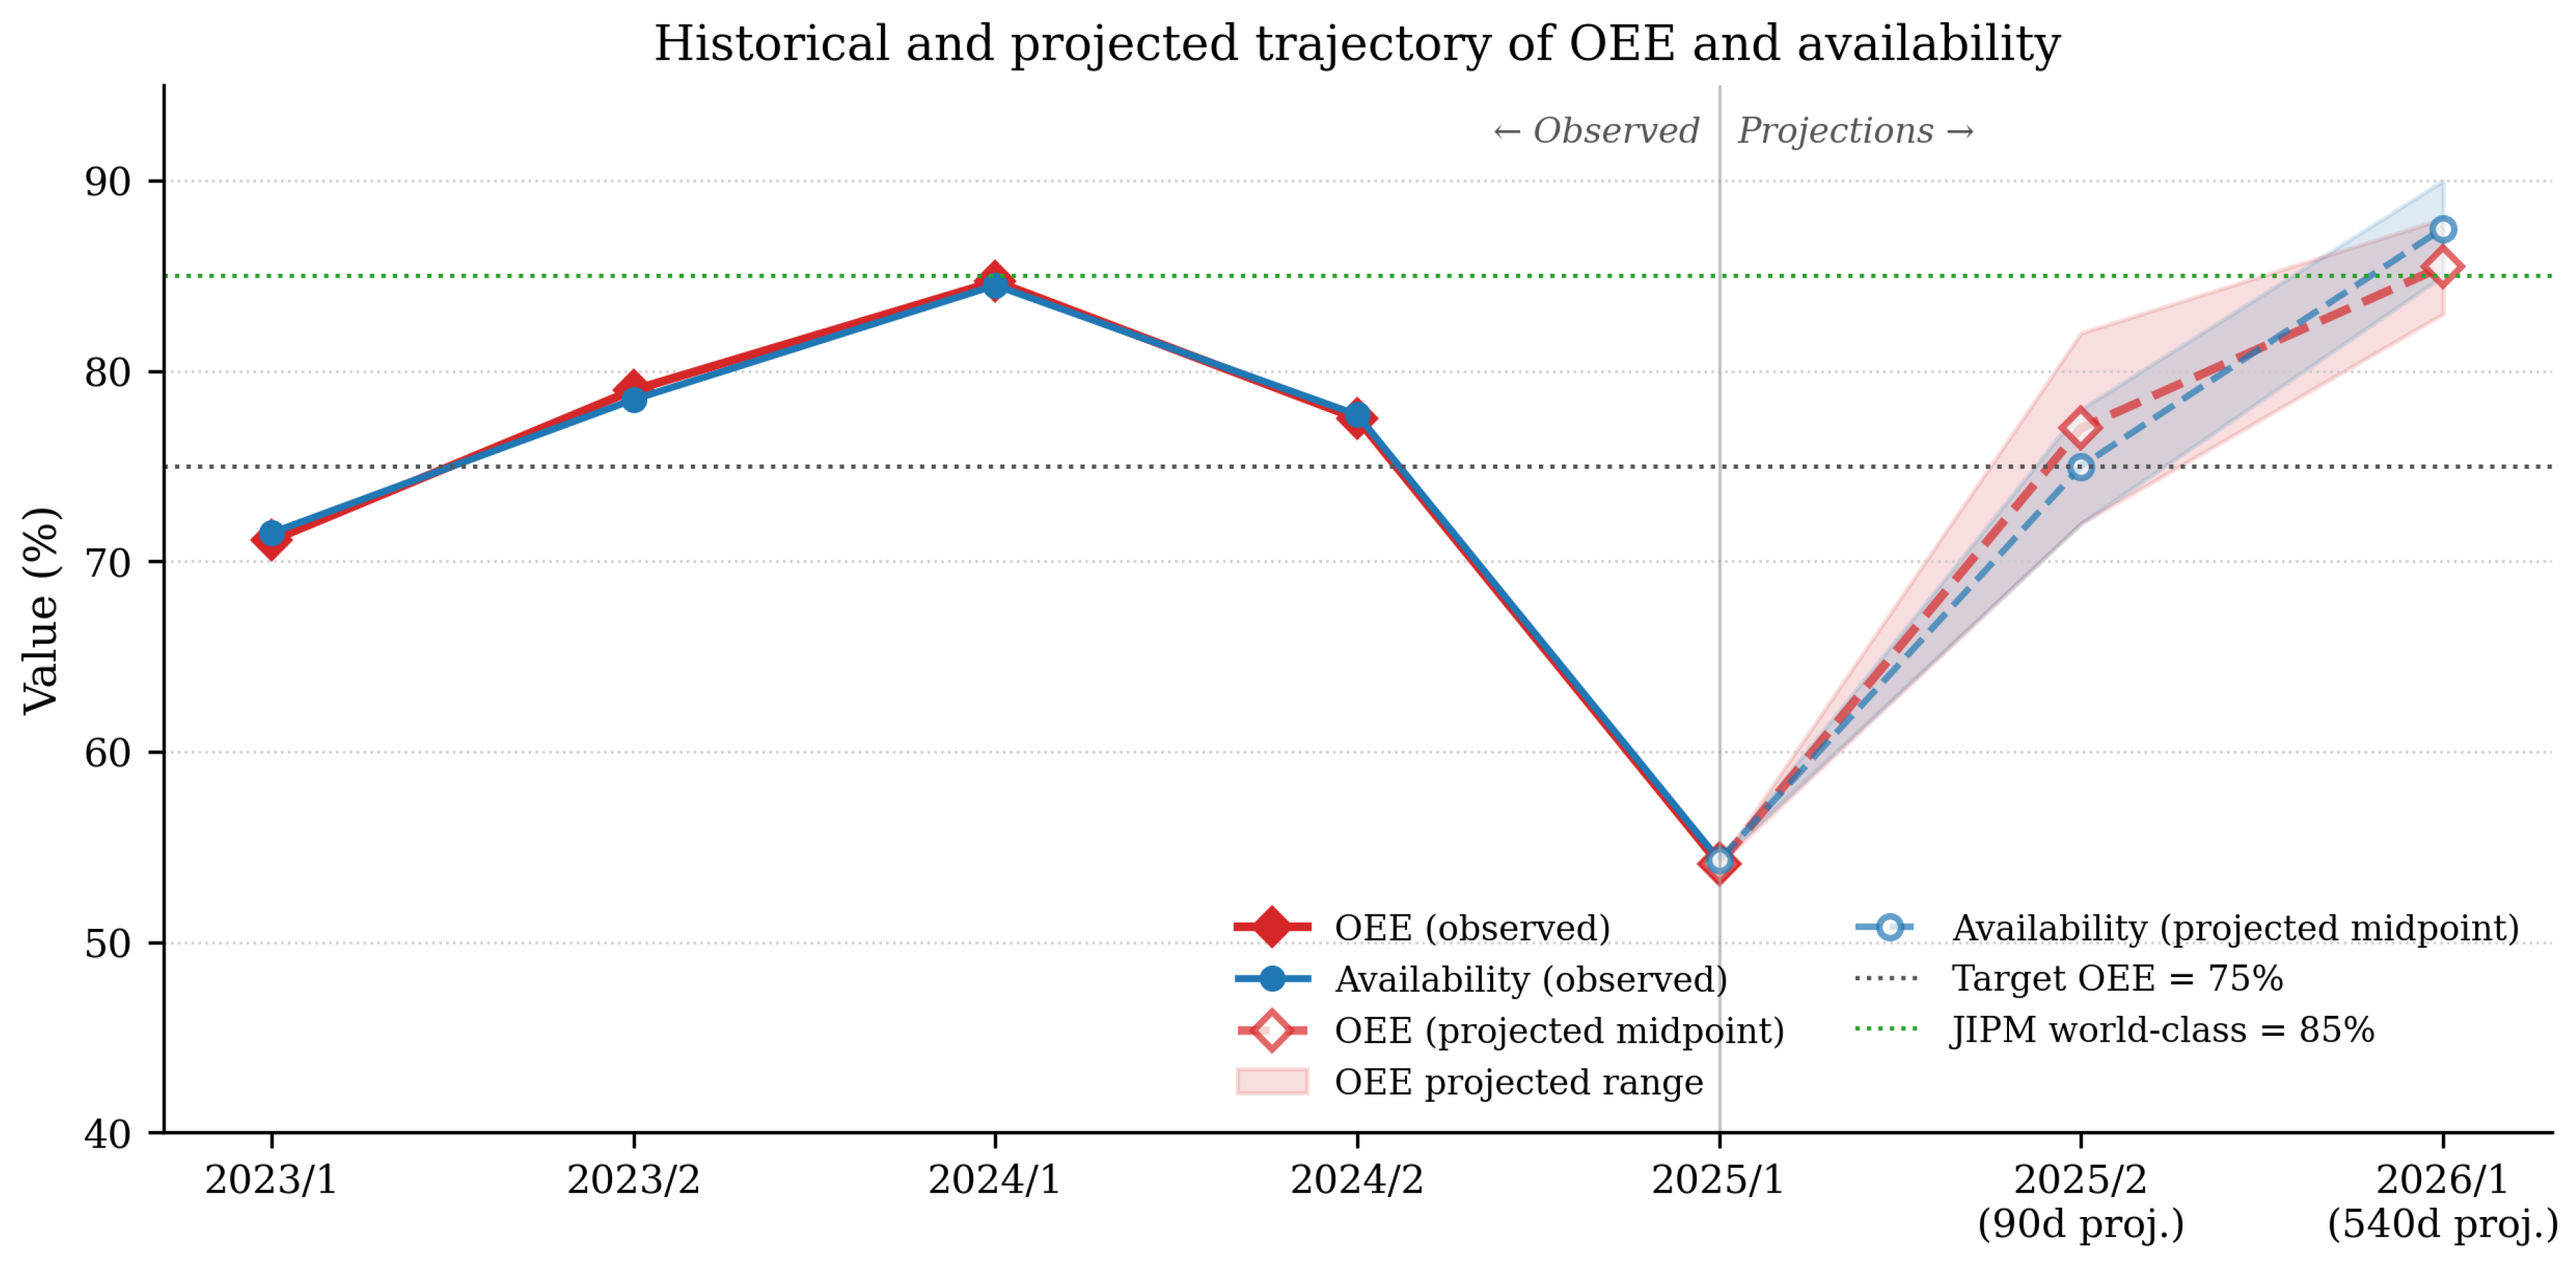

Disclaimer/Publisher’s Note: The statements, opinions and data contained in all publications are solely those of the individual author(s) and contributor(s) and not of MDPI and/or the editor(s). MDPI and/or the editor(s) disclaim responsibility for any injury to people or property resulting from any ideas, methods, instructions or products referred to in the content. |
© 2026 by the authors. Licensee MDPI, Basel, Switzerland. This article is an open access article distributed under the terms and conditions of the Creative Commons Attribution (CC BY) license.