Article

An AI-Based Framework Combining Categorical Alarm and Continuous Data for Power Estimation and Anomaly Detection in Photovoltaic Systems


1
CNRS, CRAN, Université de Lorraine, 54000 Nancy, France
2
Feedgy Group, 44 Rue Lucien Sampaix, 75010 Paris, France
3
Université de Technologie de Compiègne, CS 60319, CEDEX, 60203 Compiègne, France
4
SyCoIA, IMT Mines Ales, 30100 Ales, France
*
Author to whom correspondence should be addressed.
Machines 2026, 14(5), 551; https://doi.org/10.3390/machines14050551
Submission received: 2 April 2026 / Revised: 6 May 2026 / Accepted: 11 May 2026 / Published: 14 May 2026
(This article belongs to the Special Issue AI-Driven Reliability Analysis and Predictive Maintenance)

Abstract

This study investigates the integration of categorical inverter alarm data into data-driven frameworks for photovoltaic (PV) system monitoring. While most existing approaches rely exclusively on continuous SCADA measurements, the potential of categorical operational data remains largely unexplored. In this work, categorical alarm signals are incorporated into power forecasting to enable anomaly detection. The proposed approach is evaluated on a large-scale real-world dataset comprising multiple PV plants and more than 100 inverters, representing over 1000 inverter-years of operation. The four most popular time series forecasting models, including Multi-Layer Perceptron, Long Short-Term Memory, Extreme Gradient Boosting, and Mamba, are used to estimate power output from continuous inputs, while categorical variables are integrated using one-hot encoding and entity embeddings. Anomaly detection is performed by analyzing residuals between predicted and measured power output. The results show that categorical alarm data contain relevant operational information and can be effectively incorporated into forecasting-based monitoring frameworks. However, their impact on predictive performance varies depending on the encoding strategy and model choice, highlighting important trade-offs between model complexity and feature representation. By providing a systematic evaluation of categorical data integration across a large, diverse dataset, this work addresses a gap in the literature and establishes a benchmark for future research on hybrid continuous–categorical approaches for PV inverter monitoring.

1. Introduction

The transition towards a low-carbon energy system has led to a rapid deployment of photovoltaic (PV) installations worldwide. As PV systems scale, reducing operation and maintenance (O&M) costs while ensuring high system availability becomes increasingly important. Among system components, inverters play a critical role because their failures directly affect energy production and system reliability.
A wide range of fault types can affect grid-connected photovoltaic (PV) systems, spanning both the DC and AC sides as well as multiple system components. According to Kurukuru et al. [1], failures frequently originate in power electronic converters, particularly inverters, which are responsible for a significant proportion of system faults due to the vulnerability of semiconductor devices such as IGBTs and DC-link capacitors. These failures can be broadly categorized into sudden (catastrophic) events, such as overvoltage, overcurrent, or thermal overstress, and progressive (wear-out) mechanisms driven by aging, thermal cycling, and material degradation. In addition, faults may occur in auxiliary components such as capacitors and diodes, where degradation processes (e.g., electrolyte evaporation or thermal stress) can lead to efficiency losses or complete system shutdown. Environmental and operational factors further contribute to failure occurrence, including temperature variations, mechanical stress, and human errors such as incorrect installation or maintenance practices. Overall, these fault types manifest through deviations in electrical behavior, such as distorted voltage and current waveforms or reduced power output, which form the basis for data-driven monitoring and anomaly detection approaches.
To address these challenges, a wide range of prognostics and health management (PHM) approaches have been developed for PV systems, particularly using data-driven techniques based on SCADA measurements. These methods typically rely on modeling normal system behavior and detecting deviations as potential anomalies. However, anomaly detection remains challenging due to the scarcity of labeled failure data and the resulting class imbalance.
Most existing approaches rely exclusively on continuous SCADA variables, while the use of categorical information generated by inverters, such as alarm codes, remains largely unexplored. These alarm signals provide direct information about the inverter’s operational state and may contain valuable diagnostic insights not captured by continuous measurements alone.
This paper explored a unified data-driven framework for PV inverter monitoring that enables the joint use of continuous and categorical data for both power forecasting and anomaly detection. The framework combines (i) power estimation models trained on continuous SCADA variables, (ii) the integration of categorical alarm data through multiple embedding strategies and (iii) residual-based anomaly detection. To the best of the authors’ knowledge, this is the first work that studies the inclusion of categorical data in an anomaly detection setting in PV systems.
The proposed approach is evaluated using real-world operational data collected from multiple PV plants and inverters. Several forecasting models, including Multi-Layer Perceptron, Extreme Gradient Boosting, Long Short-Term Memory, and Mamba, are used to assess the framework’s robustness. Different encoding strategies for categorical alarm data, such as one-hot encoding, entity embeddings, and feature engineering from common patterns identified through data mining techniques, are also compared.
The remainder of this document is organized as follows: Section 2 presents the related work in the field, identifies the research gap and finally presents the scientific contribution from this work. Section 3 describes the dataset, the available input data, how the labels are constructed, an analysis of the dataset and the problem definition.
Section 4 details the proposed methodology, including data pre-processing, feature engineering and anomaly warning logic. It also describes the systematic model-training process for power prediction, including hyperparameter tuning and model validation.
Section 5 presents the experimental results. Forecasting performance is evaluated using Mean Absolute Error (MAE) and Root Mean Squared Error (RMSE), while anomaly detection performance is assessed through precision, recall, and F1 score. Finally, Section 6 summarizes the main conclusions of the study.

2. Related Work and Scientific Contribution

2.1. Anomaly Detection in PV Systems Using AI

The rapid growth of AI-based monitoring for PV systems is reflected in several recent comprehensive surveys. Aghaei et al. [2] argue that scalable condition monitoring of large PV fleets requires integrating AI, ML, DL, IoT, UAV inspection and big-data analytics into a single autonomous framework, and identify model complexity, system unpredictability and adaptation to varying environmental conditions as the central barriers that must be solved if PV monitoring is to support the projected terawatt transition. Beyond predictive accuracy, the authors emphasize that the operational value of such automation lies in reduced downtime, lower dependency on human inspection, and increased energy yield for plant operators. From a more quantitative angle, Vichare and Gaikwad [3] screen 122 PV predictive-maintenance publications between January 2023 and May 2025 and report that deep-learning architectures such as LSTM autoencoders and CNN ensembles, gradient-boosting and tree-based ensemble methods, and integrated frameworks combining SCADA, IoT, UAV imaging and digital twins now dominate the field. Their review consistently identifies limited and imbalanced datasets and poor model explainability as the main obstacles to industrial deployment (observations that directly motivate the large-scale evaluation and the systematic comparison of models and categorical encoding strategies pursued in the present work).
A widely adopted approach for anomaly detection in PV systems relies on image-based inspection of PV modules. In these methods, imaging techniques capture visual signatures of defects, which are then analyzed using DL models. For instance, the authors in [4] propose a transfer-learning-based framework that automatically identifies defective modules in infrared (IR) images using CNNs. Similar approaches combining IR thermography with CNN architectures have also been proposed for automated fault detection in PV modules [5]. In addition to infrared imaging, electroluminescence (EL) images have been employed for anomaly detection, typically analyzed with CNN models to identify structural defects within the modules [6]. More recent studies propose an attention-enhanced CNN architecture [7] for anomaly detection in thermal and visual images of PV modules, reporting improved performance over baseline image-classification models. Similarly, Pinho et al. [8] developed a multimodal aerial inspection framework combining thermal and visual images acquired by an autonomous aerial vehicle, and showed that recent object-detection architectures such as YOLOv11 and RT-DETR can achieve high detection accuracy for module-level defects in real PV plants. Overall, most image-based fault detection techniques in PV systems rely on CNN architectures due to their strong ability to extract spatial features from visual data.
Although these imaging-based approaches have demonstrated strong performance in identifying physical defects in PV modules, they require specialized inspection equipment and are typically applied during dedicated inspection campaigns rather than continuous monitoring. Furthermore, they are generally limited to identifying faults at the module level. Consequently, a growing body of research has focused on anomaly detection methods based on operational data collected through PV system monitoring infrastructure.
A recent example of forecasting-based anomaly detection in operational PV data is the work of Wan Suhaimi et al. [9], who proposed a Temporal Convolutional Network (TCN) for predictive maintenance in large-scale PV systems. Their method uses environmental variables and DC power data to model string-level behavior and detect anomalies from temporal patterns, and was compared against an LSTM baseline. This study further supports the relevance of sequence models for PV monitoring. However, it was evaluated on a more limited dataset collected from a single zone over a period of several months and focused on string-level DC output, whereas the present work addresses inverter-level monitoring using multi-year SCADA data collected across multiple plants.
Ibrahim et al. [10] investigated the use of several ML methods for anomaly detection in PV power plants using operational time-series data. The authors compared three approaches: AutoEncoder-LSTM, Facebook Prophet, and Isolation Forest. These models were trained on inverter measurements, such as AC power, DC power, irradiance, and module temperature, to learn the system’s normal behavior and detect deviations that indicate faults. Their results showed that the AE-LSTM model achieved the highest detection accuracy and significantly reduced false positives compared with Prophet and Isolation Forest. This study highlights the effectiveness of DL architectures that model temporal dependencies for anomaly detection in PV systems. However, a limitation of this work is the relatively small dataset, which consists of only two inverters and thirteen known anomalies.
Similarly, De Benedetti et al. [11] proposed a data-driven anomaly detection framework for PV systems to support predictive maintenance. In their approach, an artificial neural network is trained to model the PV system’s expected AC power output, using solar irradiance and module temperature as inputs. Anomalies are then identified by analyzing the residuals between the predicted and measured power values. The residual signals are aggregated and processed using moving-average techniques to detect long-term degradation trends, enabling the generation of predictive maintenance alerts several days before failures occur. Experimental results from a real PV plant with 13 installed inverters demonstrated a predictive fault-detection rate greater than 90%.
In addition, Marangis et al. [12] developed a data-driven predictive maintenance workflow for PV power plants combining performance modeling, anomaly detection, and trend forecasting. The approach was validated on a real dataset composed of four inverters and 37 labeled faulty days. The methodology uses an XGBoost model to estimate the expected electrical behavior of the PV system based on meteorological inputs, while a one-class SVM is used to detect anomalies by identifying deviations between predicted and measured electrical indicators. Predictive maintenance alerts are then generated through trend forecasting using the Facebook Prophet algorithm. Their model achieved high precision in fault detection.
In a complementary review focused on the maintenance lifecycle itself, the same group [13] formalizes PV maintenance strategies into corrective, preventive, predictive and extraordinary categories and treats the choice of strategy as fundamentally an economic optimization problem. Drawing on classical reliability-engineering tools such as Failure Modes and Effects Analysis (FMEA) and Cost Priority Number (CPN), combined with cost-based criticality scoring, the authors rank failure modes by their impact on the levelized cost of energy (LCOE) of the asset, identifying connectors, front-glass breakage and improperly mated connections as the components contributing most to revenue losses, and humidity and repetitive thermal cycling as the dominant stressors of power-electronic devices such as inverters. Their analysis quantifies how predictive analytics, supported by IoT and AI, can significantly reduce unexpected downtime and lower the LCOE, providing the economic rationale for data-driven anomaly detection frameworks of the type proposed in the present study, particularly when applied to inverter-level monitoring.
Syamsuddin et al. [14] proposed a predictive maintenance framework for PV systems based on anomaly detection using an LSTM-AE. The model is trained to learn normal operating patterns of inverter power production using SCADA measurements of solar irradiance, ambient temperature, wind conditions, and AC active power output. Anomalies are detected by analyzing reconstruction errors between predicted and observed system behavior, while additional filtering and trend analysis are applied to reduce false positives and generate predictive maintenance alerts. The method was validated using real operational data collected from 18 inverters.
More recently, Pang et al. [15] introduced a hybrid model combining a graph neural network for spatial topology learning at the PV-array level with a Transformer using multi-head attention for temporal dependency modeling. Evaluated on real data from the Desert Knowledge Australia Solar Center and a Belgian PV system, complemented by synthetic faults generated through Monte Carlo simulations of a single-diode model, the architecture achieves a classification accuracy of 98.6% while reducing inference time by 40% relative to LSTM, CNN and message-passing baselines. While this work focuses on array-level DC electrical signatures rather than inverter-level alarms and SCADA data, it confirms that the temporal-modeling rationale underlying the LSTM and Mamba architectures considered in the present study is consistent with the most recent state of the art in PV fault detection.
Recent work has also explored anomaly detection in PV systems from the perspective of sensor reliability. Harrou et al. [16] proposed an unsupervised statistical monitoring framework based on Improved Independent Component Analysis, Kantorovich Distance, and kernel density estimation to detect sensor anomalies in PV measurements. Their approach is designed to identify distributional changes associated with bias, drift, and intermittent sensor faults, and shows the value of multivariate statistical monitoring for PV diagnostics. However, its focus is sensor fault detection rather than inverter-level anomaly detection, and it does not investigate the use of inverter-generated categorical alarm signals as predictive features.
Beyond residual- and reconstruction-based approaches, Snytko et al. [17] propose a validated industrial SCADA framework for accelerated fault diagnosis of PV systems, based on real-time visualization of energy-flow indicators such as the Self-Consumption Ratio and the Self-Sufficiency Ratio. This work shows that SCADA-based monitoring can also support diagnostic schemes built on aggregated production indicators rather than on residuals from a learned power-prediction model, offering a complementary industrial perspective to the residual-based formulation adopted in the present study.

2.2. Research Gap

Despite the growing body of research on anomaly detection and predictive maintenance in PV systems, several limitations remain in the current literature.
First, many existing studies are evaluated on relatively small datasets, often consisting of a limited number of inverters or relatively short observation periods. For example, Ibrahim et al. [10] evaluate their approach on a dataset composed of only two inverters and a small number of labeled anomalies, while other works rely on single-plant deployments with a limited number of monitored devices [12,14]. Furthermore, the work by Suhaimi et al. [9] is performed on a single inverter, which includes 18 strings. While these studies demonstrate the feasibility of ML approaches for anomaly detection in PV systems, the scalability and robustness of these methods remain insufficiently explored in large-scale PV fleets with hundreds of inverters.
Second, most anomaly detection methods in PV systems rely almost exclusively on continuous operational variables, such as power output, irradiance, temperature, or electrical measurements. However, modern inverter monitoring systems continuously generate categorical information, in the form of alarm and warning codes, that describes the equipment’s internal operational state. These alarm streams contain potentially valuable diagnostic information related to faults, degradation processes, and abnormal operating conditions. Despite their potential relevance to PHM, such categorical signals have received little attention in the anomaly detection literature for PV systems, where most work focuses primarily on numerical SCADA measurements. Furthermore, although several studies employ ML or DL models for anomaly detection, relatively few studies investigate how different modeling approaches and feature encoding strategies affect predictive performance, particularly in settings with heterogeneous data types that combine continuous and categorical variables.
These limitations highlight the need for studies that evaluate anomaly detection methods on large-scale, real-world datasets and explore the integration of categorical operational signals generated by PV inverters.
Preliminary analysis of inverter monitoring data further supports the potential value of such information. When the dataset used in this study is labeled as normal or abnormal operating periods, the distribution of alarm codes across these two classes shows that certain error codes occur more frequently during abnormal conditions. This observation suggests that inverter alarms may contain meaningful information about system degradation or failure events and, therefore, could help improve PHM models. Moreover, the inverter continuously generates and transmits alarm signals during operation, so this information can be exploited without additional sensors or monitoring equipment, making it an attractive option from an industrial perspective.
The use of categorical or event-based operational data for predictive maintenance has already demonstrated value in other industrial domains. For instance, Bezerra et al. [18] highlight that alarm and event logs constitute an important source of operational information that is often underutilized in industrial systems. Their study shows that even relatively simple techniques, such as exploratory data analysis (EDA), can reveal valuable insights from real-world industrial alarm data without requiring strong prior assumptions about system behavior.
Beyond exploratory analysis, several studies have incorporated categorical operational records directly into prognostics and predictive maintenance frameworks. Luo et al. [19], for example, propose a framework for constructing degradation models that predict equipment failures using categorical data generated by manufacturing systems. Their approach combines ant colony optimization and Pareto profile techniques to extract degradation patterns from discrete operational records. Similarly, Gutschi et al. [20] investigate the use of machine log messages, event logs, and operational information to estimate the probability of machine breakdown in manufacturing systems. Their work integrates data mining, feature extraction, and ML methods, demonstrating that machine failures can indeed be predicted using such event-based information.
Despite these advances in other industrial domains, the exploitation of categorical alarm data for PHM remains largely unexplored in PV systems. In particular, inverter-generated alarm streams have rarely been considered as predictive features in anomaly detection or performance modeling tasks. Addressing this gap requires evaluating anomaly detection methods on large-scale PV datasets while investigating how categorical alarm information can be integrated into data-driven monitoring frameworks.

2.3. Scientific Contribution

To address the aforementioned limitations, this work proposes an anomaly detection framework for PV inverter monitoring that integrates categorical alarm information with operational time-series data and evaluates its performance on a large-scale dataset. The main scientific contributions of this work are the following:
  • Systematic exploration of categorical inverter alarm data for PV monitoring. This study investigates an underutilized source of information generated by inverter monitoring systems: categorical alarm signals, including error codes, warning codes, and inverter state messages. While these signals are routinely recorded in operational databases, they have rarely been incorporated into data-driven predictive maintenance approaches in the PV domain. In this work, an exploratory analysis of these categorical variables is conducted, and their integration into ML-based monitoring models is evaluated, thereby establishing a baseline for future research on the use of categorical operational data in PV systems.
  • Evaluation on a large-scale PV dataset. The proposed methodology is validated on a large real-world dataset comprising operational data from 126 PV inverters across multiple plants, with an approximate total installed capacity of 33.2 megawatts. This dataset is significantly larger than those typically used in previous studies, enabling a more robust evaluation of anomaly detection models under realistic operating conditions.
  • Systematic comparison of ML models and categorical feature encoding strategies. This study compares the performance of several ML architectures for power prediction and anomaly detection, including both classical models and DL approaches. In addition, different encoding strategies for categorical alarm data are investigated, including one-hot encoding and embedding-based representations, providing insights into the impact of categorical data representation on model performance.
  • Development of a hybrid labeling strategy and quantification of label incompleteness in O&M records. This work proposes a labeling methodology that combines O&M ticket records, rule-based shutdown detection, and expert validation through visual inspection of SCADA signals. The resulting analysis reveals that a large proportion of failure events are not documented in O&M ticketing systems and can only be identified through signal-based analysis. This result exposes a key limitation of maintenance-based labeling approaches and demonstrates the necessity of integrating data-driven methods to construct reliable ground truth datasets for PV monitoring applications.

3. Dataset and Problem Statement

3.1. Dataset Overview

The dataset used in this study consists of real-world operational measurements collected at the inverter level from PV plants located in Germany. A total of 13 PV plants and 126 Conergy inverters are analyzed. On average, each inverter provides approximately 8.3 years of operational data, resulting in an aggregated observation period of roughly 1045 inverter-years. The operational lifespan of the inverters varies considerably, ranging from 164 to 3492 days. A summary of the inverter ages and operational periods across the different plants is presented in Table 1.
The data is collected with a 10 min frequency recording over 20 million data points in total.

3.2. Available Input Data

For each inverter, the continuous features gathered are the following:
  • Irradiance: The amount of power generated by the PV modules is directly linked with the magnitude of the solar irradiance received. This is collected from pyranometers placed at ground level at each PV plant.
  • Temperature of the inverter: There is a relationship between the degradation of the inverter’s performance, and the failure of the internal components (mainly the IGBTs) and the temperature at which the inverter operates [21]. This information is collected from internal sensors inside the inverter.
  • Module temperature: During high irradiance periods, it is expected to have both a large power output and high temperatures recorded in the modules. However, modules operate at lower efficiency under high-temperature conditions; therefore, it is important to monitor this measurement. This information is collected by temperature sensors mounted at the back of the module.
  • Internal voltage: All of the inverters studied in this work are tri-phase inverters. The voltage in every line is measured by internal sensors inside the inverter.
  • Degradation over time: Just as in every other system, in the PV field, there is degradation over time. And to accurately assess the performance of these systems over long periods (years), it is important to account for this factor. Different PV module technologies and manufacturers exhibit different degradation rates; this analysis assumes a 0.5 % degradation per year [22], a safe assumption for PV systems installed in cooler climates like North-Central Europe, where the studied systems are located.
Furthermore, grid-connected solar inverters can transmit information about their current state as a numeric code. These codes have been recorded in our dataset into five different categories, which can be seen next to their cardinality in Table 2.
The categorical data considered in this work consist of numerical identifiers corresponding to inverter warning codes, error codes, and operational state messages. Although textual descriptions for these codes were not available, these signals are expected to reflect internal inverter conditions and operational events. Consequently, some codes may occur more frequently during abnormal operating periods than during normal operation.
The dataset used in this work is limited to the inverter-level SCADA signals listed above, the categorical alarm and state codes generated by each inverter, and the corresponding O&M ticket records. More granular information regarding the physical configuration of each plant, like electrical information of PV strings or layout of combiner boxes, was not available. The framework proposed in this paper has therefore been deliberately formulated at the inverter level and does not assume access to such granular signals.

3.3. Labeling Construction

The labels used in this study were derived from three complementary sources:
  • Information from the O&M ticketing system, which records interventions and reported failures in the PV system.
  • A rule-based detection method designed to identify complete inverter shutdowns. Specifically, a day was labeled a failure when the inverter output remained at zero for a sustained period while the measured irradiance exceeded a predefined threshold, indicating the inverter was not producing power despite sufficient solar input.
  • Manual inspection of power and irradiance time series. During model development, days flagged as anomalous by the algorithm were visually inspected. When clear abnormal patterns were observed, such as significantly lower output than expected given the irradiance, indication of string disconnection, or partial shutdown, those days were also labeled as abnormal.
The O&M records consist of the maintenance logs of the crew responsible for repairs to the different PV systems within the scope of this study. These tickets have the following categories: affected component, start timestamp, end timestamp, and description. To efficiently read through and process the maintenance tickets, they are filtered using search keywords.
If either the affected component or the initial timestamps are missing from the record, the ticket is discarded because the information is uncertain. In cases where the end timestamp is missing, we assume the issue persists only on the day it was notified and log it as ending at 23:50 on the same day. Using these records, we define five different categories of tickets:
  • Inverter failures.
  • Isolation defects.
  • System failures.
  • Maintenance days.
  • Communication failure.
The first three cases are labeled as failures, whereas the last two are excluded from the analysis.
The second labeling method is a rule-based approach designed to identify inverter shutdowns. Consecutive periods of operation during which the inverter output power is equal to zero while irradiance measurements exceed 5 Wm−2 are detected. When such periods persist for longer than 12 h, they are labeled as failures. This duration threshold was chosen to avoid short temporary drops in production caused by sensing errors, communication issues, or even curtailment. This rule allows the identification of prolonged shutdown events, which are typically associated with inverter malfunctions or operational faults.
The final labeling step consisted of manual validation of candidate anomalous events. After training and evaluating each model configuration, the days flagged as anomalous were visually inspected using the corresponding power production, irradiance, and inverter voltage time series. A day was labeled as a failure when clear abnormal operating patterns were observed. These included sustained underperformance relative to the available irradiance, complete inverter shutdown during periods of sufficient irradiance, and characteristic patterns associated with string disconnections or derating.
This validation procedure was repeated for each model architecture and each input configuration tested in this study (continuous variables only, one-hot encoded categorical variables, and entity embeddings). By applying the same inspection process to the anomalies detected by each model configuration, the labeling procedure ensured that no particular model or feature representation was favored during the construction of the ground truth dataset.
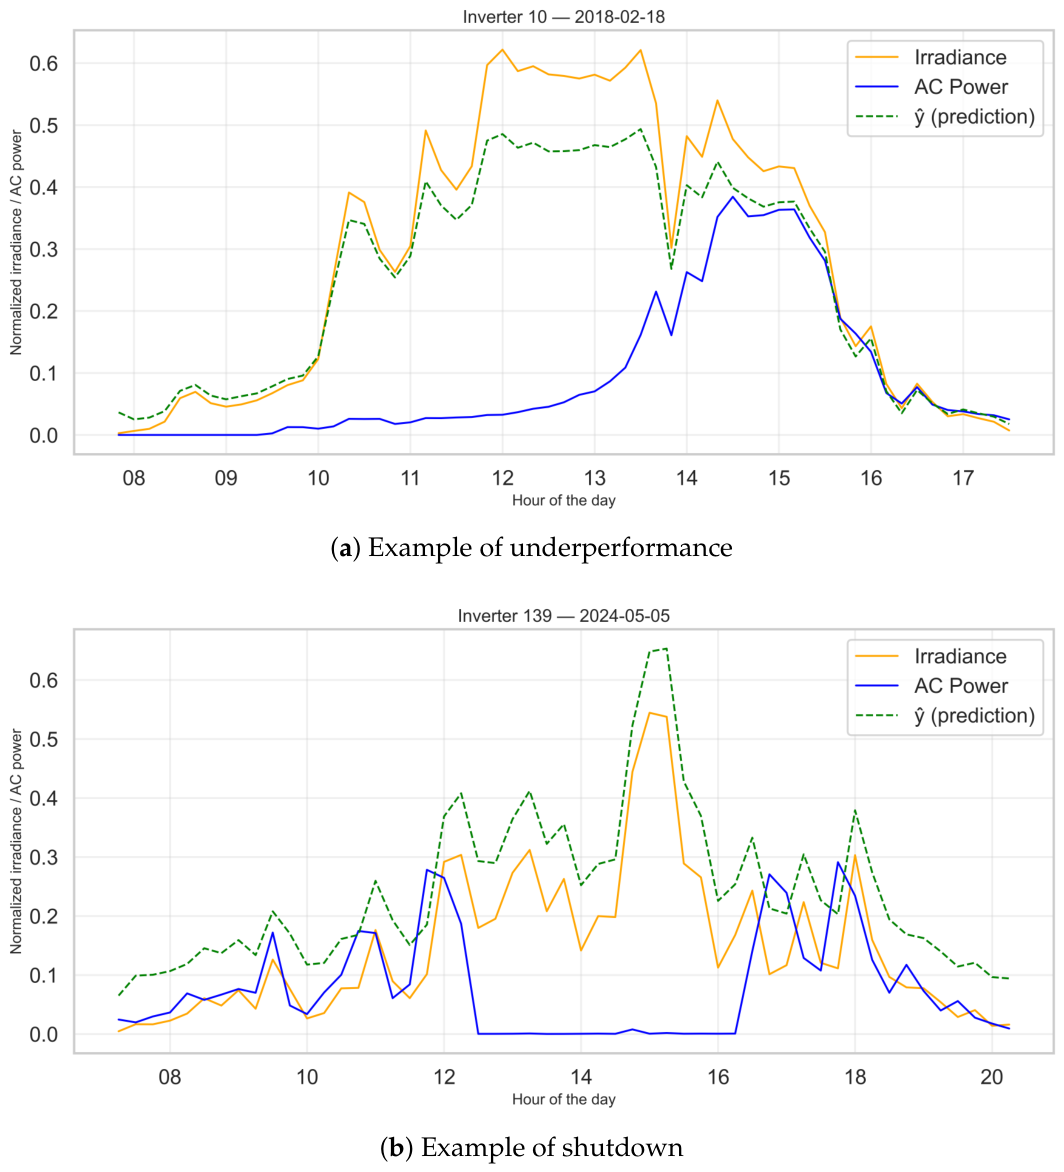
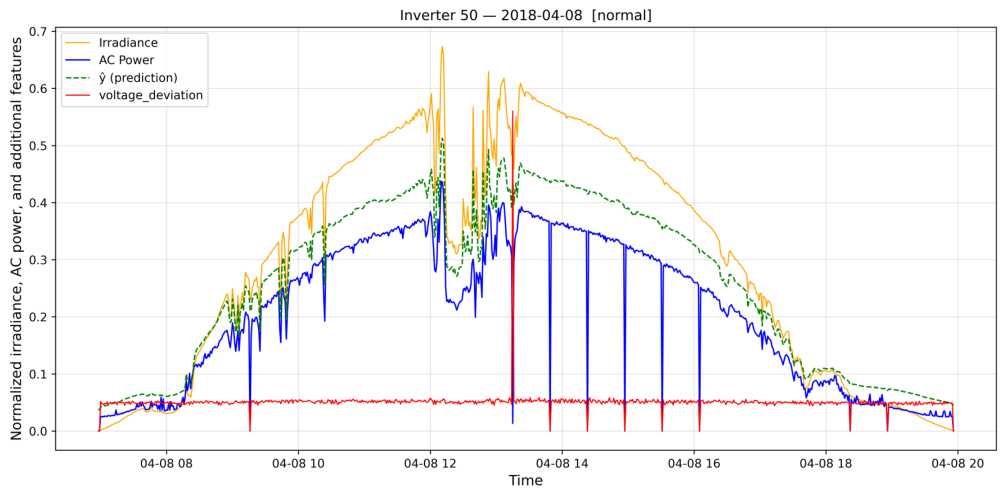
Examples of failure patterns identified through this process are presented in Figure 1, in addition, different failure modes can be seen in the Appendix B.

3.4. Dataset Analysis

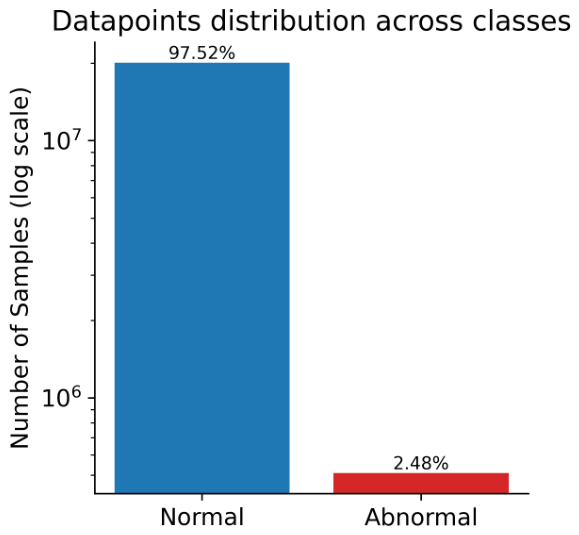
The highly imbalanced nature of the dataset becomes apparent after labeling, as shown in Table 3 and Figure 2. The class imbalance ratio is roughly 39.5:1. This distribution will affect the approach and the steps for generating anomaly classification alarms.
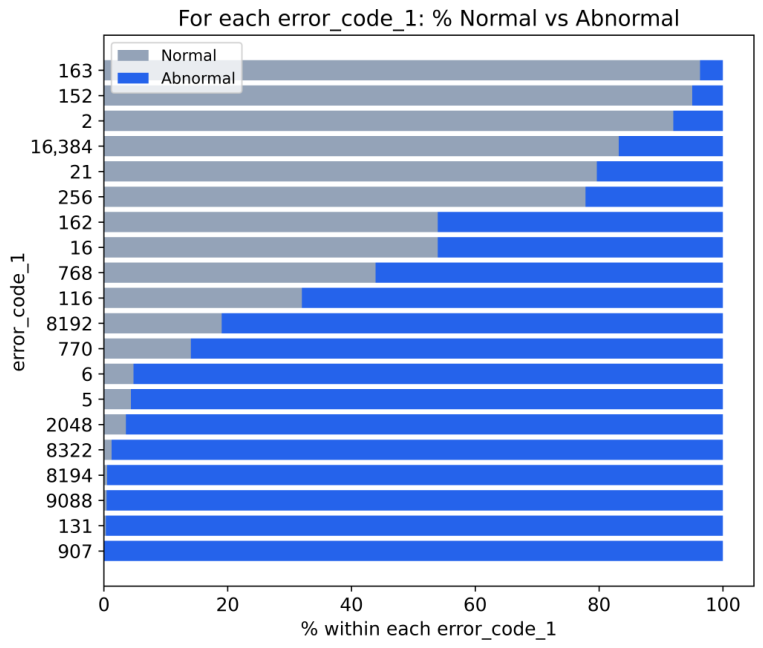
This analysis also highlights differences in the frequency of specific error codes between the two labels. Figure 3 illustrates this by showing the class distribution (normal vs. abnormal) for the 20 most frequent values of error code 1. For each error code, the stacked bars represent the proportion of occurrences associated with normal and abnormal periods. The results indicate that certain error codes are more prevalent during abnormal operation, suggesting that categorical alarm signals may carry valuable diagnostic information.
This observation is particularly noteworthy given the strong class imbalance in the dataset (Figure 2), in which normal operation constitutes the majority of observations. Despite this imbalance, differences in the distribution of certain alarm codes between normal and abnormal periods remain clearly observable.
These observations suggest that categorical inverter alarm data may provide valuable complementary information for PHM applications in PV systems. Importantly, this information is generated internally by the inverter monitoring system and therefore does not require additional sensors or hardware. As a result, leveraging this data can improve monitoring capabilities without increasing instrumentation costs, thereby enhancing its practical value for industrial deployments.
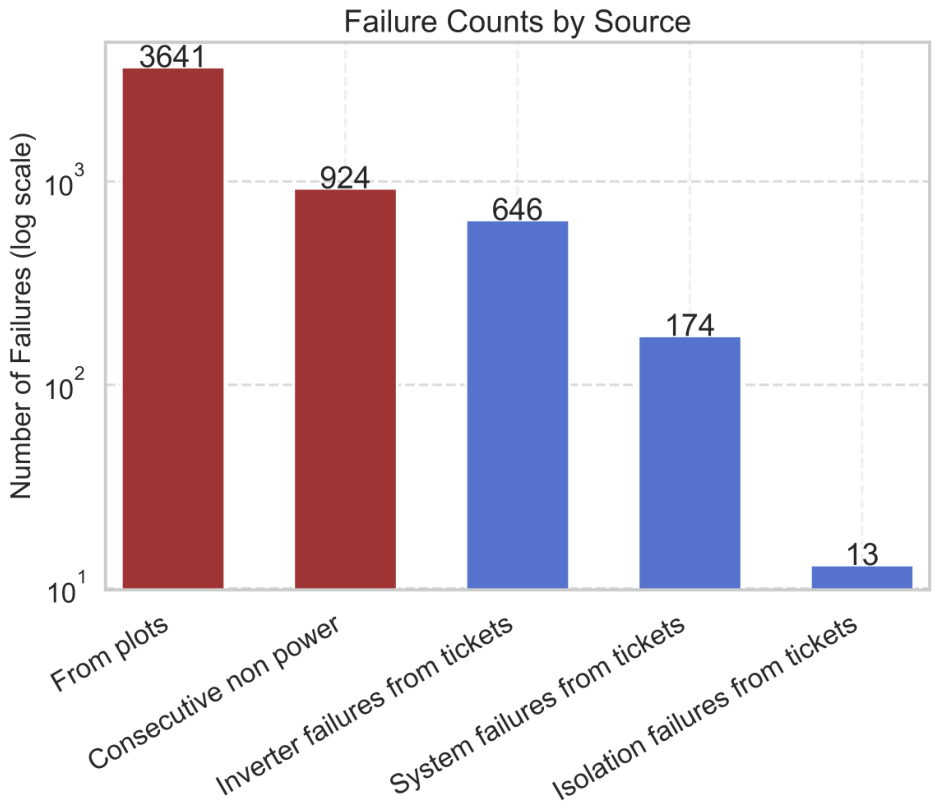
Figure 4 presents the distribution of identified failures according to their source. Failures highlighted in red correspond to events detected through the analysis of inverter power and irradiance curves, whereas those in blue originate from O&M ticket records. The figure reveals a clear imbalance between these sources, with most failures identified through data-driven curve analysis rather than documented in operational tickets. This discrepancy underscores both the inherent uncertainty in the dataset and the challenges associated with reliable failure labeling. In particular, it highlights the limited completeness of O&M records and emphasizes the need to leverage SCADA-based analytical methods to obtain a more comprehensive representation of system failures.
The resulting labels are generated from a combination of operational records, rule-based detection, and expert validation, reflecting both the limitations of available data sources and the need for domain-informed interpretation.

3.5. Problem Statement

Beyond the specific characteristics of PV systems, anomaly detection in PV monitoring shares several fundamental challenges with other condition monitoring and fault diagnosis domains. These include a strong class imbalance between normal and abnormal operating conditions, the need to integrate heterogeneous data sources, and the requirement for continuous and real-time monitoring. Such challenges have been widely reported in the broader fault diagnosis literature [23].
In the context of PV systems, these issues are further exacerbated by the large volume of SCADA data, the sparsity and limited interpretability of alarm signals, and the scarcity of reliable failure labels. Addressing these challenges is therefore central to the development of robust and scalable anomaly detection frameworks.
The objective of this study is to detect abnormal operating conditions in PV systems using real-world monitoring data. In practice, this task is challenging due to the scarcity of labeled failure events and the strong class imbalance inherent to PV systems, where normal operation represents the vast majority of observations. Furthermore, failure annotations derived from operational records are often incomplete or uncertain, making it difficult to formulate the problem as a conventional supervised classification task.
To address these limitations, the problem is formulated as a data-driven anomaly detection task that models normal system behavior. Specifically, for each inverter and timestamp, the goal is to estimate the expected active power output using available operational data. The input space consists of both continuous SCADA variables, such as irradiance, temperature, and electrical measurements, and categorical signals generated by the inverter in the form of alarm and state codes. These categorical variables are treated as discrete identifiers without prior semantic interpretation, requiring the model to infer relationships directly from their statistical patterns.
Anomalies are identified by analyzing the deviation between predicted and measured power output. Under normal operating conditions, the model is expected to accurately capture the relationship between environmental conditions and power production. Significant deviations from this expected behavior are therefore interpreted as indicators of abnormal operation, including potential faults, degradation effects, or system inefficiencies. This residual-based formulation allows the detection of a wide range of anomalous behaviors without requiring exhaustive labeled examples for each failure mode.
In addition to anomaly detection, this work aims to improve the practical usability of the generated warnings for O&M teams. To this end, a second processing stage is introduced, in which categorical alarm data are used to identify patterns that occur more frequently during abnormal operating periods. These patterns are leveraged to filter and prioritize the detected anomalies, enabling the definition of a two-level warning system. The first level comprises all anomalies detected via residual analysis, while the second level identifies a subset of high-confidence alerts associated with characteristic alarm patterns.
Overall, the problem addressed in this work can be summarized as the joint modeling of continuous and categorical inverter data to (i) estimate expected system behavior, (ii) detect deviations indicative of abnormal operation, and (iii) prioritize warnings using pattern-based information extracted from categorical alarm signals. This formulation reflects both the constraints of real-world PV monitoring data and the operational requirements of scalable predictive maintenance systems.

4. Methodology

4.1. Framework for Anomaly Detection in PV Systems Implementing Categorical Data: An Overview

This subsection provides an overview of the proposed framework; the following subsections provide more details on each step.
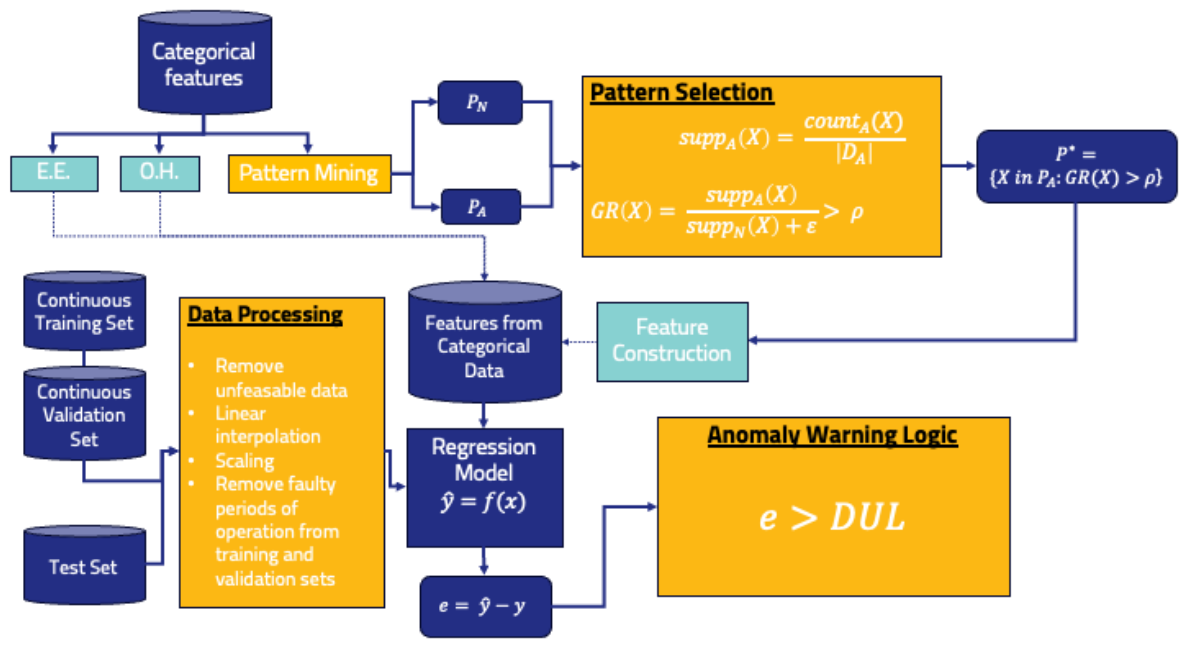
Section 4.2 shows the pre-processing steps performed on the continuous data. Section 4.3 shows the data mining and feature engineering processes executed. Next, the anomaly warning logic based on the residuals of the regression models is presented in Section 4.4, as well as the use of a second discriminative layer to increase the precision of the framework and generate high-confidence alarms. Finally, the training and validation steps are shown in Section 4.5. The proposed framework is divided into three distinct parts:
  • Power estimation with continuous data: Continuous SCADA measurements are first pre-processed by removing outliers, imputing missing values, and scaling the features. In addition, the training and validation data are filtered in the irradiance–power space to retain only samples representative of normal operating conditions. Four regression models (MLP, XGBoost, LSTM, and Mamba) are trained to estimate the expected power output. Residuals between predicted and measured power are then computed, and inverter-specific thresholds are defined. A warning is triggered when these thresholds are exceeded.
  • Study of the impact of categorical data in the regression model: Additional features are derived from categorical signals generated by the inverter, including error codes, warning codes, and operational states. Since these variables cannot be directly used by most models, three transformation strategies are investigated: one-hot encoding, entity embeddings, and pattern-based feature extraction using PrefixSpan. These features are then used as input to the regression models.
The framework can be visualized in Figure 5, where dark blue boxes denote data objects, intermediate artifacts, or outputs; yellow boxes represent processes; and light blue boxes denote optional pre-processing operations, of which at most one may be applied. E.E. stands for entity embeddings; O.H. stands for one-hot encoding. P N and P A denote the sets of patterns mined from normal and abnormal data, respectively, and P is the selected emerging patterns that satisfy the growth rate criterion G R ( X ) > ρ . s u p p N ( X ) is the support of pattern ( X ) in abnormal and normal states, ϵ is a small regularization constant, e is the prediction residual, and D U L is the daily upper limit threshold for said residual used in the warning logic.
In this study, four machine learning models were selected to evaluate the proposed framework, covering a range of commonly used approaches for anomaly detection and time-series modeling in photovoltaic systems. First, three widely adopted model families in PV monitoring applications were considered, namely feed-forward neural networks (MLP), recurrent neural networks (LSTM), and tree-based methods (XGBoost), as these represent standard baselines in the literature [24].
The MLP was selected as a general-purpose model that does not impose any explicit temporal structure, allowing the evaluation of the predictive capacity of the input features alone. The LSTM was included due to its widespread use in time-series modeling and its ability to capture temporal dependencies in sequential data. XGBoost was selected as a representative tree-based method, offering a complementary modeling paradigm with strong performance in tabular data settings.
In addition, the Mamba architecture was considered a recent state-of-the-art sequence modeling approach, enabling the assessment of the proposed framework with modern structured state-space models. This selection provides a diverse yet representative set of models to evaluate the robustness of the proposed methodology across different modeling paradigms.

4.2. Pre-Processing of Continuous Data

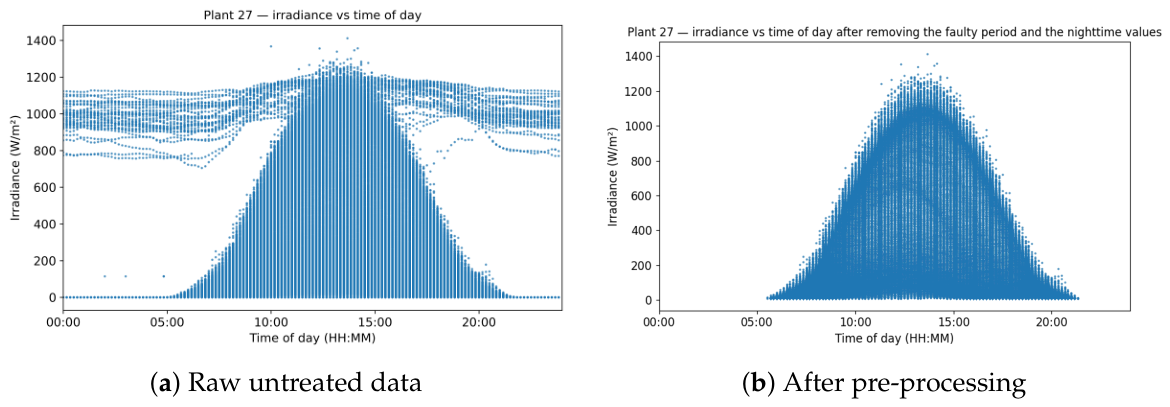
Continuous SCADA measurements are pre-processed to ensure data quality and consistency. Outliers and physically infeasible values are removed, and short gaps (less than 30 min) are filled using linear interpolation. Days containing larger missing intervals are excluded from the analysis. Night-time data points, corresponding to periods with no solar production, are removed, as they do not provide useful information for modeling inverter behavior. The effects of these pre-processing steps can be seen in Figure 6. In the raw data (Figure 6a), several irregular patterns are observed, including non-zero irradiance values during night-time periods and distorted daily profiles caused by faulty measurements. After pre-processing (Figure 6b), these artifacts are removed, revealing a smooth and physically consistent irradiance distribution that follows the expected daily solar cycle. This cleaning step is essential to ensure that the models are trained on representative operating conditions and are not influenced by sensor errors or abnormal measurements.
Finally the continuous features are scaled between 0 and 1 using Equation (1).
x scaled = x x min x max x min

4.3. Feature Engineering

4.3.1. Pattern Mining by PrefixSpan

Error codes coming from the inverter show a different frequency of appearance in the different operational states (Figure 3). Indicating potential anomaly detection capabilities in employing them.
Categorical inverter signals are analyzed to extract patterns associated with system behavior. Sequential pattern mining is performed using the PrefixSpan algorithm, which identifies frequent ordered sequences of alarm codes.
The most common patterns are identified using PrefixSpan, and interesting emerging patterns are identified, following the work by [25]. Let I denote the set of all items in the encoding dataset D. A set X of items is defined as a subset of I. Any instance S contains an itemset X if X S . The support of an itemset X in a dataset D is
s u p p D = c o u n t D ( X ) | D |
where c o u n t D ( X ) is the number of instances S in D that contain X. With two data classes D 1 and D 2 , the growth of an itemset X in favor of D 2 is defined as
G r o w t h R a t e ( X ) = G R ( X ) = s u p p D 2 ( X ) s u p p D 1 ( X ) + ϵ
where we added a small value ϵ to avoid an infinite G R . An emerging pattern favoring D 2 is an itemset whose growth rate from D 1 to D 2 is at least ρ ( ρ > 1 ) .
This allows us to identify the emerging patterns X during abnormal periods D a b n o r m a l even if the data is highly imbalanced and the vast majority of instances S occur during normal periods D n o r m a l .

4.3.2. Feature Construction

The selected patterns to generate the new features are the top 10 patterns with the largest G R favoring D a b n o r m a l ; these aim to increase the model’s performance in prediction during abnormal periods, as well as the top 5 patterns with the largest support; these are to aid the model in generalizing normal behavior of the inverter. This number of patterns was selected to prevent the number of input features from exploding, since each will then be transformed into 4 features.
For each selected pattern, we create the following features. At each timestamp t we compute the following:
  • If the pattern is currently active.
  • Count of times the pattern has occurred in the previous three days.
  • Days since the pattern was last active.
  • Has the pattern occurred before?
To prevent features with large magnitudes from dominating the optimization process in neural network models (e.g., MLP or LSTM), the new features, which contain a large number of zeros, are transformed using a logarithmic compression [26]:
x ˜ j = l n ( 1 + x j )
which reduces the skewness and improves model performance [27]. Subsequently, min-max normalization is applied, following Equation (1), to ensure all features lie within the interval [0,1].
These features are fed into the regression model.

4.4. Anomaly Warning Logic

Anomaly detection is performed by feeding the new input sequence into one of the previously described trained models, which then estimates the expected output power for that period. If the difference between the expected power and real power (we call this the residuals) is significant, an anomalous behavior alarm is raised.
Finding these thresholds and generating the alarms is a process divided into three steps:
  • Clipping the residuals to zero.
  • Finding the threshold of anomalous behavior by the inverter.
  • Raising daily alarms.
The first step is to compute the residuals as the difference between the expected and actual power at each time point t. If the real power is larger than the expected power, this is not considered underperforming by the inverter, and therefore, we set the residual to zero. This is reflected in Equation (5):
r t = max 0 , y ^ t y t
where r t is the residual, y ^ t is the expected power and y t is the actual power, all at the same instance t. The residuals for each day and inverter are then grouped and summed.
The second step, finding the limits, is done by measuring the standard deviation of the daily residuals for each inverter. We set a daily lower limit (DLL) at three standard deviations and a daily upper limit (DUL) at five standard deviations, as described by Equations (6) and (7). This simple method is inspired by [11] and was more recently employed in [14].
D L L = 3 σ d a i l y
D U L = 5 σ d a i l y
The final step, for each day that the residual value exceeds the DUL, we raise an alarm (value of 1); each time the DLL is crossed (but not the DUL), a warning is raised (value of 0.5).

4.5. Training and Validation

Training

A regression model is trained independently for each inverter. For each device, the first year of operation is used as the training dataset to represent normal operating conditions. The following two months of data are used as the validation set.
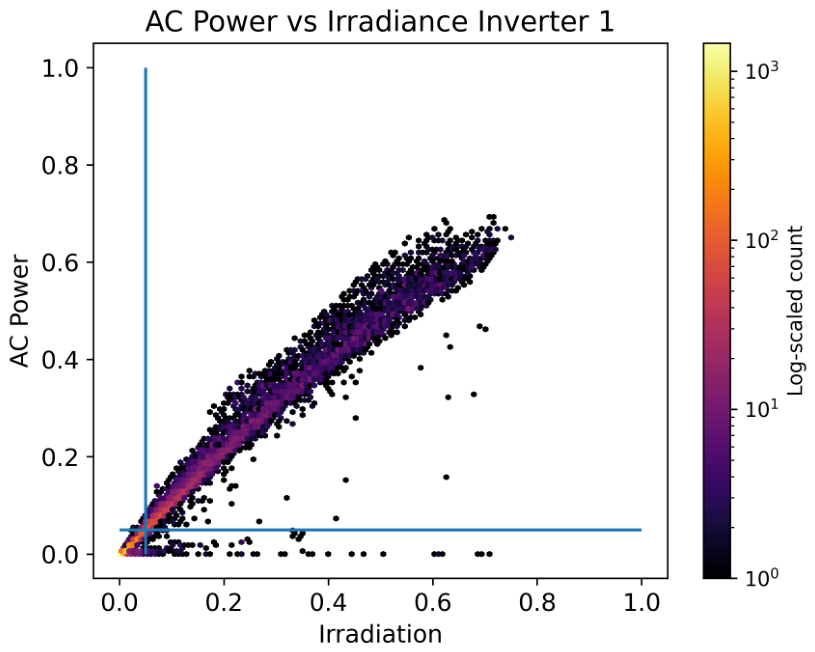
Both datasets are filtered to resemble normal operation. First, data points where either the power output or the irradiance is below 0.05 are removed, as illustrated in Figure 7. This step removes measurements corresponding to night-time conditions or very low irradiance levels, where the relationship between power and irradiance is not informative. In Figure 7, these filtered regions correspond to the dense cluster of points near the origin, as well as observations with near-zero power despite non-zero irradiance. Such points are typically associated with non-operational periods, sensor noise, or abnormal system behavior. If retained, they would distort the learning process by introducing a large number of samples that do not follow the expected physical relationship between irradiance and power. By restricting the training data to the region where a clear monotonic relationship exists, the model is better able to learn the underlying mapping between environmental conditions and inverter output under normal operation.
Next, any periods labeled as failures are removed from both the training and validation datasets. This pre-processing step ensures that the model is trained only on data representing normal inverter behavior. Such an approach, where anomalous or failure events are excluded from the training data, is commonly adopted in predictive maintenance studies for PV systems [11].
After pre-processing, the training set contains a total of 2,468,354 samples, and the validation set contains 350,071 samples. Across the 126 inverters considered in this study, this corresponds to an average of appropixametely 19,950 training samples and 2778 validation samples per inverter.
The model hyperparameters are optimized using the Optuna library to minimize MAE on the validation set when estimating inverter output power. Once the optimization process is complete, the configuration achieving the lowest MAE on the validation set is selected and used to generate predictions on the test set. This procedure is repeated independently for each inverter.
The hyperparameter search explored a wide range of configurations, including learning rate, dropout, number of layers, neurons per layer, number of previous timestamps retained, batch size, and number of training epochs, as well as model-specific parameters.
During hyperparameter tuning, validation MAE values below 0.020 were frequently achieved. These values are substantially lower than those observed on the test set (see Table 4), as expected, since the hyperparameters are explicitly optimized to minimize validation error.
During Mamba model training, we observed numerical instability in several trials. In some cases, the model produced NaN predictions or extremely large output values, which disrupted the optimization process. To improve robustness, we introduced several stabilization mechanisms.
First, we applied gradient clipping to limit the gradient norm during backpropagation. This prevents occasional gradient spikes from causing exploding updates and helps the optimizer progress more steadily. This approach was also used in the original Mamba paper [28], where the gradient clip value was set to 1 in several experiments.
Second, we added a sigmoid activation function at the output layer to constrain predictions to a valid range. This ensures that the model outputs remain consistent with the expected scale of the target variable and helps smooth the loss landscape, making optimization more stable.
Finally, we reduced the learning rate to decrease the magnitude of parameter updates during training. Smaller update steps reduce the risk of overshooting minima and help prevent the amplification of noisy gradients, particularly during the early stages of training. The learning rate search space was restricted to the range [ 10 4 , 10 3 ] , following the experimental settings reported in the original Mamba study. Together, these modifications significantly reduced the magnitude and frequency of extreme prediction outliers.
This helped stabilize the training process for several inverters; however, some models produced extremely large predictions (on the order of 1 × 1029). Mamba is a sequence model with recurrent/state-space dynamics, so any excessively large update can propagate through time and amplify across layers. With a high learning rate or unnormalized inputs, a single large gradient can push weights into a regime where activations grow exponentially. In floating-point arithmetic, this growth can rapidly move into very large magnitudes, even before it becomes NaN. In short, a few unstable updates can blow up internal states, causing the model to output values orders of magnitude larger than the target scale.
This variability in the performance of Mamba has been observed before, such as in the work by Pessoa et al. [29], where they mention that the model showed pronounced deviations. The explanation for this behavior is that SSMs are designed primarily for capturing deterministic latent structures and may now be well suited for representing stochasticity. Highlighting the challenge of learning purely stochastic processes with state-space models.
In the context of PV systems, power production is primarily dependent on instantaneous environmental variables such as irradiances and temperatures, rather than on latent dynamical processes evolving over time. As a result, the assumptions underlying SSM-based models are not fully satisfied [29].

4.6. Validation

The performance of the models is evaluated using two complementary criteria: (i) their ability to accurately model the inverter power output and (ii) their capability to detect anomalies. The first objective is a regression problem, in which the predicted inverter output is compared with the measured values. To quantify the prediction accuracy, two widely used regression metrics are employed: Mean Absolute Error (MAE) and Root Mean Squared Error (RMSE) [30]. These two metrics are complementary: MAE provides a robust estimate of the average absolute deviation between predicted and observed values, while RMSE places a higher penalty on large errors due to its quadratic formulation and is therefore more sensitive to outliers. Reporting both metrics characterizes the typical and the worst-case behavior of the regression model. MAE and RMSE are commonly reported in power-forecasting and PV anomaly detection studies, including the works of Wan Suhaimi et al. [9] and Syamsuddin et al. [14]. Closely related quantities, such as the Mean Squared Error reported by Ibrahim et al. [10] and the normalized RMSE reported by Marangis et al. [12], are also frequently used and provide directly comparable information.
M A E = 1 N i = 1 N ( y ^ i y i )
R M S E = 1 N i = 1 N ( y ^ i y i ) 2
where y and y ^ denote the real and predicted value, respectively, and N represents the total number of samples.
The second evaluation criterion assesses the anomaly detection capability of the proposed approach. In this context, the problem is formulated as a binary classification task where the system state is classified as either normal or abnormal. Three metrics are reported: precision, recall, and F1 score. Precision quantifies the fraction of detected anomalies that correspond to true failures, i.e., the reliability of the alarms generated by the model. Recall, also reported by Marangis et al. [12], measures the fraction of true failures correctly identified. The F1 score is the harmonic mean of precision and recall and provides a single balanced indicator of detection performance.
These metrics are particularly suited to highly imbalanced classification problems such as anomaly detection in PV systems, where normal operation accounts for more than 97% of observations (Table 3). Under such an imbalance, accuracy is not informative because a trivial classifier predicting “normal” at all times would already exceed 97% accuracy without detecting any anomaly. Precision, recall, and F1 score have already been adopted in PV anomaly detection studies such as Ibrahim et al. [10] and in the broader fault-diagnosis literature [23], which allows direct comparison with established benchmarks.
P r e c i s i o n = T P T P + F P
R e c a l l = T P T P + F N
F 1 = 2 × P r e c i s i o n × R e c a l l P r e c i s i o n + R e c a l l
where T P , F P , and T N represent true positive, false positive, and true negative, respectively.

5. Results

Table 4 summarizes the forecasting and anomaly detection performance obtained by the different models under the various categorical feature encoding strategies. Two tasks are evaluated: the models’ ability to accurately forecast inverter power output, measured by MAE and RMSE, and the effectiveness of the anomaly detection method, measured by precision, recall, and F1 score. In the following, the models’ forecasting performance is first analyzed, followed by a discussion of their anomaly detection capabilities.

5.1. Power Forecasting Results

For the MLP model, the best forecasting performance is obtained when entity embeddings are used to represent the categorical alarm features. This configuration achieves the lowest MAE among all MLP variants. However, the model without categorical features performs similarly, indicating that the additional categorical information provides only limited benefit for this task. In contrast, the use of one-hot-encoded categorical features slightly degrades forecasting performance. This behavior can be attributed to the high dimensionality and sparsity introduced by one-hot encoding, which adds hundreds of sparse input variables, making the training process less efficient. Entity embeddings alleviate this issue by learning dense vector representations of categorical values, allowing the neural network to capture relationships between alarm states while maintaining a compact input representation. The introduction of prefix features, which also significantly increases the number of features, does not improve the performance.
The XGBoost model exhibits very similar forecasting performance when no categorical variables or one-hot encoded features are used. This suggests that tree-based models are better suited to handle high-dimensional, sparse inputs than neural networks. The introduction of prefix features or entity embeddings does not significantly improve the model’s forecasting capability and, in some cases, slightly increases error metrics. Overall, the impact of categorical variables on XGBoost’s forecasting accuracy remains limited.
For the LSTM model, the inclusion of categorical features generally degrades forecasting performance. This effect is particularly noticeable when categorical variables are represented through one-hot encoding, where the MAE and RMSE increase substantially. Using entity embeddings mitigates this effect and yields better results than one-hot encoding, although forecasting performance remains worse than when no categorical variables are included. This indicates that the additional categorical information does not provide substantial predictive value in modeling the inverter’s short-term power output.
The Mamba model demonstrates strong forecasting capability across all input configurations, achieving among the lowest MAE values among the evaluated models. As with the previous models, the inclusion of categorical variables does not improve forecasting performance and, in some cases, slightly increases prediction error. The higher RMSE observed for the best-performing Mamba configuration is mainly due to a few large prediction errors. These outliers increase the RMSE while having a more limited impact on the MAE.
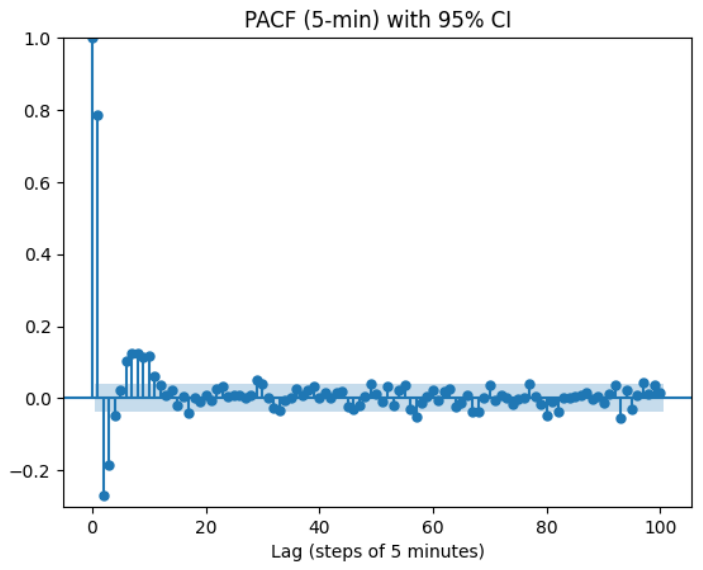
When comparing all models, both the MLP with entity embeddings and the Mamba model without categorical variables achieve the best overall forecasting performance. The strong performance of the relatively simple MLP model suggests that long temporal dependencies are not particularly important for predicting PV inverter power output. This observation is supported by the partial autocorrelation function shown in Figure 8, where a strong correlation is observed with the immediately preceding power value, while correlations with longer lags quickly diminish.
This behavior can be explained by the physical nature of PV systems. Power production is primarily driven by instantaneous exogenous environmental conditions that can rapidly change, particularly solar irradiance and temperature, rather than by long historical sequences. As a result, the information required to estimate power output is largely contained in the current input variables, with only limited additional value from past observations.
Finally, the increased complexity of sequence-based architectures introduces additional parameters and optimization challenges, which may lead to overfitting or reduced generalization when the underlying temporal structure is weak. In addition, these models typically involve a larger and more sensitive hyperparameter space, requiring more extensive optimization to reach well-performing configurations. Under practical constraints and a limited search space on hyperparameters, this can make it more difficult to consistently identify optimal settings compared to simpler models.
Consequently, MLP architecture performed better at this task, as it effectively captured the relationship between inputs and output while remaining easier to train and tune, without imposing unnecessary temporal modeling assumptions.
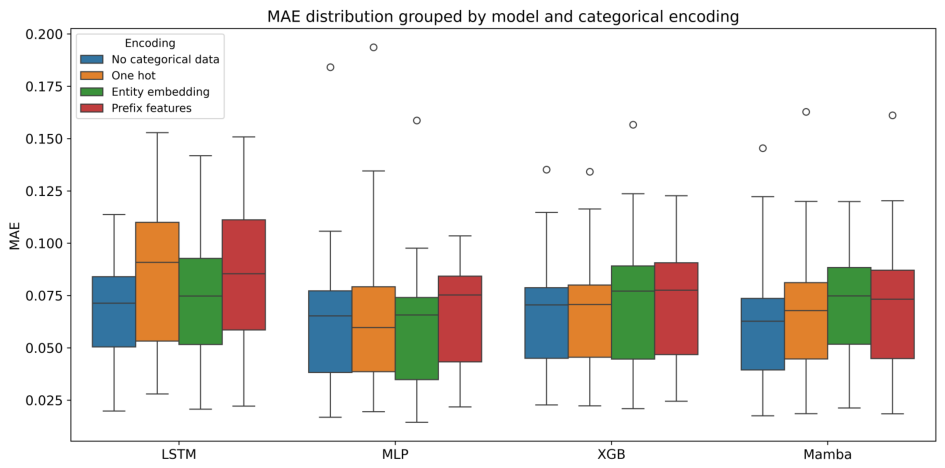
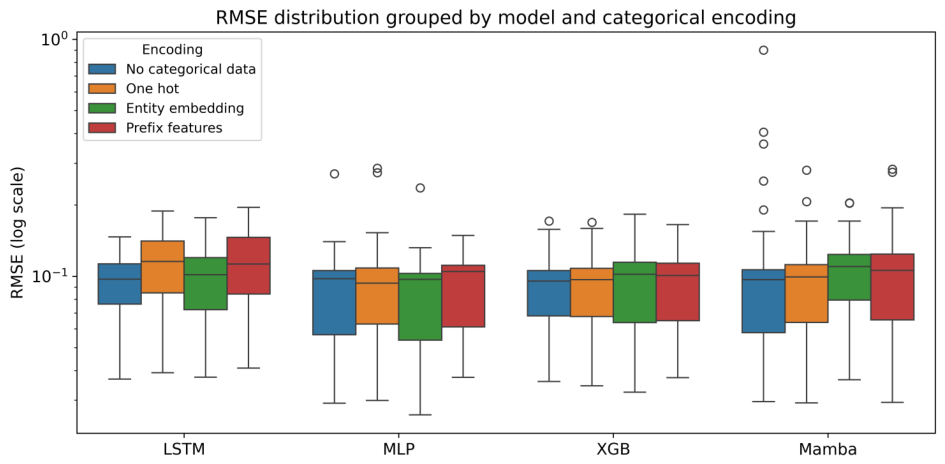
The MAE and RMSE distributions across all inverters can be seen in Figure 9 and Figure 10.
The distributions presented in Figure 9 and Figure 10 complement the average values of Table 4 and reveal additional aspects of model behavior that are not visible from aggregate metrics alone.
First, both figures show substantial variability across inverters regardless of the model and encoding strategy. The interquartile range of the MAE corresponds to a Q3/Q1 ratio close to two for most configurations, meaning that the inverter at the 75th percentile has roughly twice the prediction error of the inverter at the 25th percentile, indicating that inverter-specific factors influence predictability more strongly than the choice of encoding. As a consequence, no single model–encoding combination yields uniformly low errors across the entire fleet.
Second, the figures highlight the differing sensitivities of each model to the encoding strategy. The LSTM model exhibits the highest median MAE and the widest spread, particularly under one-hot and prefix features, where its distributions both shift upward and widen relative to the non-categorical and entity embedding configurations. By contrast, MLP, XGBoost and Mamba display more compact boxes, suggesting that they are less affected by the introduction of high-dimensional categorical inputs. The MLP architecture in particular achieves the lowest medians and the tightest distributions, supporting its selection as the most robust configuration for this task.
Finally, the log-scale of Figure 9 reveals several extreme RMSE outliers, most prominently for the Mamba model. These outliers correspond to the numerical instabilities discussed in Section 4.5 and also explain the relatively high standard deviation reported for the Mamba RMSE in Table 4.
Several studies in the time-series forecasting literature report that relatively simple models, such as Multi-Layer Perceptrons (MLPs), can outperform more complex architectures, including recurrent networks and attention-based models, particularly in settings with limited temporal dependencies or moderate dataset sizes. For instance, work like [31] shows that simpler architectures can match or exceed the performance of sophisticated sequence models. The main reasons highlighted include reduced risk of overfitting, easier optimization, and the fact that many real-world time series do not exhibit strong long-range dependencies, making complex temporal modeling unnecessary. In our case, this aligns with the observed partial autocorrelation structure (Figure 8), where dependencies are concentrated in the short term. As a result, the inductive biases of sequence-specific models (e.g., memory mechanisms in LSTMs) provide limited additional value, while a feedforward MLP is sufficient to capture the relevant relationships between recent inputs and the target variable.

5.2. Anomaly Detection Performance

In the anomaly detection task, the inclusion of categorical variables does not lead to a systematic improvement in performance across the evaluated models. Precision values are generally high, while recall remains moderate. This behavior can largely be explained by the strong class imbalance in the dataset, in which the PV system operates under normal conditions for the vast majority of the time. Furthermore, the training data used for the forecasting models is primarily composed of normal operating conditions, limiting the models’ ability to learn patterns associated with abnormal behavior, which will, for the most part, be absent from the training set.
For the MLP model, the highest precision and F1 score are obtained when no categorical variables are included. Nevertheless, the use of entity embeddings performs better than one-hot encoding. This again highlights the advantage of dense learned representations over sparse categorical encodings. Entity embeddings allow the model to capture similarities between categorical values while avoiding the high-dimensional sparse input space created by one-hot encoding.
The XGBoost model shows very similar anomaly detection performance across the different encoding strategies. The model’s robustness to sparse input features is again evident, as the one-hot-encoded representation does not significantly degrade performance. Interestingly, the configuration that produces the largest forecasting error also achieves the highest precision and F1 score in the anomaly detection task. This behavior indicates that the model tends to overestimate expected power output under abnormal operating conditions, resulting in larger deviations between predicted and observed values, thereby facilitating the identification of anomalies.
For the LSTM model, anomaly detection metrics improve when entity embeddings are used compared to one-hot-encoded categorical variables. However, the overall performance remains comparable to that of the MLP model. Although the forecasting error increases when categorical features are included, the resulting deviations between predicted and observed power values can still improve the detection of abnormal events.
Finally, the Mamba model achieves high precision across all input configurations, demonstrating strong capability in identifying anomalous behavior. In this case, the configuration without categorical variables yields the best anomaly detection performance. The inclusion of categorical inputs slightly reduces both precision and recall, suggesting that the categorical alarm information does not provide significant additional discriminative power for anomaly detection in this context.
To further contextualize the performance of the proposed approach, a comparison was conducted with a representative residual-based anomaly detection method from the literature [11]. This method was selected due to its conceptual similarity, as it also relies on deviations between predicted and observed power to identify abnormal behavior.
The comparison results show that the proposed framework achieves a significantly higher precision, while the reference method attains a slightly higher recall. This difference can be explained by the formulation of the residual used in each approach. In the proposed method, the residual is defined as r t = m a x ( 0 , y ^ t y t ) , meaning that only underperformance events are considered. In contrast, the reference method evaluates deviations in both directions, which increases sensitivity but also introduces a larger number of false positives. The results can be seen in Table 5.
From a practical perspective, this design choice is aligned with the requirements of PV system monitoring, given that underperformance relative to expected production is directly associated with faults or degradation. As a result, the proposed method provides a more reliable set of alarms for operational decision-making, favoring precision over recall.

6. Conclusions

This work investigates the potential value of categorical inverter alarm data in data-driven monitoring frameworks for PV systems. To the best of the authors’ knowledge, this study is among the first systematic efforts to incorporate inverter alarm codes as categorical inputs into machine learning models for both power prediction and anomaly detection.
The four scientific contributions outlined in Section 2.3 can be revisited in light of the experimental results obtained as follows:
(i)
Systematic exploration of categorical inverter alarm data for PV monitoring. Categorical alarm signals (including error codes, warning codes, and inverter state messages) were integrated into a data-driven monitoring framework. The exploratory analysis presented in Section 3.4 (Figure 3) shows that certain alarm codes occur disproportionately during abnormal operating periods, confirming that they carry diagnostic information complementary to continuous SCADA measurements. Three encoding strategies (one-hot, entity embeddings, and PrefixSpan-derived pattern features) were proposed and systematically evaluated in Section 4.3 and Section 5, establishing the baseline targeted by this contribution.
(ii)
Evaluation on a large-scale PV dataset. The methodology was validated on operational data from 126 inverters distributed across 13 plants, with an aggregated installed capacity of 33.2 MW and approximately 1045 inverter-years of operation (Table 1). This dataset is substantially larger than those used in comparable studies and made it possible to characterize model performance across heterogeneous operating conditions, as reflected by the inter-inverter variability visible in Figure 9 and Figure 10.
(iii)
Systematic comparison of ML models and categorical feature encoding strategies. Four architectures (MLP, XGBoost, LSTM, and Mamba) were compared under four input configurations (no categorical, one-hot, entity embeddings, prefix features). The resulting forecasting and anomaly detection metrics, summarized in Table 4 and discussed in Section 5, identify the relative trade-offs of each combination. The results show that entity embeddings outperform one-hot encoding for high-cardinality categorical inputs and that the simpler MLP architecture is the most robust across the fleet, achieving the best anomaly detection performance.
(iv)
Development of a hybrid labeling strategy and quantification of label incompleteness in O&M records. A three-step labeling procedure combining O&M ticket records, rule-based shutdown detection, and expert visual validation was proposed in Section 3.3. The analysis presented in Figure 4 quantifies the limited completeness of O&M-based labels, showing that most of the failures identified in this study were detected through SCADA signal analysis rather than from ticket records. This finding exposes a key limitation of maintenance-based labeling and motivates the use of hybrid, data-driven labeling pipelines for PV monitoring applications.
From a practical perspective, the proposed framework demonstrates several advantages, including high precision in anomaly detection, scalability to large PV fleets, and the ability to leverage existing inverter data without additional instrumentation.
Several modeling approaches were evaluated, including classical ML methods and DL architectures: MLP, XGBoost, LSTM, and Mamba. Across different experimental settings, relatively simple architectures consistently provided competitive, and in several cases superior, performance compared to more complex models. In particular, the MLP model trained exclusively on continuous operational variables achieved the best performance in the anomaly detection task. At the same time, the same architecture incorporating entity embeddings of the categorical alarms yielded the strongest results in power prediction. These findings suggest that, for the type of data considered in this study, increased model complexity does not necessarily translate into improved performance, and that simpler models remain strong baselines for PV monitoring applications.
Different encoding strategies for categorical alarm data were also assessed in order to evaluate how inverter-generated signals can be effectively integrated into ML models. Entity embeddings generally outperformed one-hot encoding, confirming the advantage of dense, learned representations for handling high-cardinality categorical variables.
Despite the positive results of the framework in its capabilities, especially precision, to detect anomalies in the PV system, the inclusion of categorical alarm signals did not consistently improve performance in either power forecasting or anomaly detection tasks. This behavior can be attributed to several factors, including the highly imbalanced distribution of alarm occurrences and the limited frequency of many individual codes, which restricts the model’s ability to learn robust representations. Additionally, the absence of semantic information associated with the alarm codes prevents the identification of the most informative signals and may introduce noise into the learning process.
Despite these limitations, the exploratory analysis of alarm distributions highlights that certain error codes occur disproportionately during abnormal operating periods. This observation indicates that categorical inverter alarms do contain relevant diagnostic information regarding system behavior. Importantly, these signals are inherently available in inverter monitoring systems and do not require additional sensing infrastructure, making them an attractive, low-cost source of information for industrial applications.
Overall, this work establishes a baseline for integrating categorical inverter alarm data into PV monitoring models and provides a first quantitative assessment of their impact across multiple modeling approaches and encoding strategies. The proposed framework achieves high anomaly detection performance, with precision approaching 0.93, while highlighting both the potential and current limitations of directly incorporating alarm signals into data-driven frameworks.
Future work will focus on improving the exploitation of categorical operational data. In particular, enhancing the interpretability of alarm codes would enable a more informed selection of relevant inputs and reduce the impact of noisy or non-informative signals. Alternatively, improved labeling of the faults in the system would allow exploration of a supervised learning method to directly classify the power and meteorological curves into abnormal or normal behavior. Furthermore, alternative strategies for incorporating categorical information, such as integrating alarm signals directly into the anomaly detection decision process, represent a promising direction for future research. Finally, future work will also focus on incorporating finer-grained plant-level information such as per-string DC currents and voltages, combiner box layouts, status of DC fuses, etc. Such information would enable string-level anomaly localization and enhance anomaly classification and complement the alarm-based diagnostic approach proposed in this paper.   

Author Contributions

Conceptualization, J.R.A.; Methodology, H.-C.V., P.D. and M.P.; Validation, H.-C.V., P.D. and M.P.; Formal analysis, H.-C.V.; Investigation, J.R.A.; Resources, H.-C.V., P.D. and M.P.; Writing—original draft, J.R.A., H.-C.V. and P.D.; Writing—review & editing, J.R.A., H.-C.V. and P.D.; Visualization, H.-C.V., P.D. and M.P.; Supervision, H.-C.V., P.D. and M.P.; Project administration, P.D.; Funding acquisition, P.D. and M.P. All authors have read and agreed to the published version of the manuscript.

Funding

This work was funded in part by the ANRT (Association Nationale de la Recherche et de la Technologie) with a CIFRE n° 2023/0115.

Data Availability Statement

The datasets presented in this article are not readily available due to confidentiality constraints.

Conflicts of Interest

The authors Jorge Ruiz Amantegui and Marko Pavlov were employed by the company Feedgy Group. The remaining authors declare that the research was conducted in the absence of any commercial or financial relationships that could be construed as a potential conflict of interest.

Appendix A. Pseudo-Code of the Proposed Framework

Algorithm A1: Residual-based anomaly detection pipeline
  • Input:
D: time-series data for all inverters
F: selected explanatory variables
y: measured AC power
M: forecasting model family
K: candidate lag/window sizes
theta_low, theta_high: anomaly thresholds, e.g., 3 σ and 5 σ
  • Output:
A: daily anomaly table with anomaly_level
    1.
Initialize A as an empty table.
    2.
For each inverter i in D:
2.1.
Extract the time series Di corresponding to inverter i.
2.2.
Sort Di chronologically.
2.3.
Split Di into:
-
training period
-
validation period
-
test period
2.4.
Remove physically inconsistent operating points from the training and validation sets, for example points with very low irradiance or very low measured AC power.
2.5.
For each candidate lag/window size k in K:
2.5.1.
Construct the input matrix Xi,k using the selected variables F and their lagged values up to k.
2.5.2.
Construct the target vector yi from the measured AC power.
2.5.3.
Train model M on the training set.
2.5.4.
Evaluate M on the validation set.
2.6.
Select the model configuration with the best validation performance.
2.7.
Refit or retain the selected model using the chosen configuration.
2.8.
Predict the AC power on the test period:
y _ hat ( t ) = M ( X _ test ( t ) )
2.9.
Compute the positive residual at each timestamp:
r ( t ) = max ( y _ hat ( t ) hbox y ( t ) , 0 )
This keeps only cases where the expected production is higher than the measured production.
2.10.
Aggregate residuals by day:
R ( d ) = sum over t in day d of | r ( t ) |
2.11.
Estimate the daily residual dispersion for inverter i:
sigma _ i = standard _ deviation ( R ( d ) )
2.12.
Define two inverter-specific daily anomaly limits:
lower _ limit _ i = theta _ low sigma _ i
upper _ limit _ i = theta _ high sigma _ i
2.13.
Assign a daily anomaly level:
 if R(d) < lower_limit_i:
   anomaly_level(d) = 0
 else if lower_limit_i <= R(d) < upper_limit_i:
   anomaly_level(d) = 0.5
 else:
   anomaly_level(d) = 1
2.14.
Append the daily anomaly levels for inverter i to A.
    3.
Return A.

Appendix B. Additional Failures

An additional case of an abnormality identified by the framework can be seen in Figure A1. The figure shows voltage, power and irradiance measurements fluctuations as well as drops in power output within one day.
Figure A1. Power and voltage fluctuations leading to power shutdowns.
Machines 14 00551 g0a1

References

  1. Kurukuru, V.S.B.; Khan, M.A.; Malik, A. Failure mode classification for grid-connected photovoltaic converters. In Reliability of Power Electronics Converters for Solar Photovoltaic Applications; Institution of Engineering and Technology (IET): London, UK, 2021; Volume 170. [Google Scholar]
  2. Aghaei, M.; Kolahi, M.; Nedaei, A.; Venkatesh, N.; Esmailifar, S.; Moradi Sizkouhi, A.; Aghamohammadi, A.; Oliveira, A.; Eskandari, A.; Parvin, P.; et al. Autonomous Intelligent Monitoring of Photovoltaic Systems: An In-Depth Multidisciplinary Review. Prog. Photovolt. Res. Appl. 2025, 33, 381–409. [Google Scholar] [CrossRef]
  3. Vichare, R.V.; Gaikwad, S.R. AI-based predictive maintenance of solar photovoltaics systems: A comprehensive review. Energy Inform. 2025, 8, 128. [Google Scholar] [CrossRef]
  4. Akram, M.W.; Li, G.; Jin, Y.; Chen, X.; Zhu, C.; Ahmad, A. Automatic detection of photovoltaic module defects in infrared images with isolated and develop-model transfer deep learning. Sol. Energy 2020, 198, 175–186. [Google Scholar] [CrossRef]
  5. Le, M.; Luong, V.S.; Nguyen, D.K.; Dao, V.D.; Vu, N.H.; Vu, H.H.T. Remote anomaly detection and classification of solar photovoltaic modules based on deep neural network. Sustain. Energy Technol. Assess. 2021, 48, 101545. [Google Scholar] [CrossRef]
  6. Akram, M.W.; Li, G.; Jin, Y.; Chen, X.; Zhu, C.; Zhao, X.; Khaliq, A.; Faheem, M.; Ahmad, A. CNN based automatic detection of photovoltaic cell defects in electroluminescence images. Energy 2019, 189, 116319. [Google Scholar] [CrossRef]
  7. Qader, M.R.; Albalooshi, F.A. Boosting Solar Panel Reliability: An Attention-Enhanced Deep Learning Model for Anomaly Detection. Energies 2025, 18, 6591. [Google Scholar] [CrossRef]
  8. Pinho, L.S.; Sousa, T.D.; Pereira, C.D.; Pinto, A.M. Anomaly Detection for PV Modules Using Multi-Modal Data Fusion in Aerial Inspections. IEEE Access 2025, 13, 88762–88779. [Google Scholar] [CrossRef]
  9. Wan Suhaimi, W.S.H.; Dahlan, N.Y.; Abdul Jalil, M.A. Developing An Anomaly Detection Model for Predictive Maintenance in Large-Scale PV Systems Using Temporal Convolutional Network. PaperASIA 2025, 41, 569–579. [Google Scholar] [CrossRef]
  10. Ibrahim, M.; Alsheikh, A.; Awaysheh, F.; Alshehri, M. Machine Learning Schemes for Anomaly Detection in Solar Power Plants. Energies 2022, 15, 1082. [Google Scholar] [CrossRef]
  11. De Benedetti, M.; Leonardi, F.; Messina, F.; Santoro, C.; Vasilakos, A. Anomaly detection and predictive maintenance for photovoltaic systems. Neurocomputing 2018, 310, 59–68. [Google Scholar] [CrossRef]
  12. Marangis, D.; Livera, A.; Tziolis, G.; Makrides, G.; Kyprianou, A.; Georghiou, G.E. Trend-Based Predictive Maintenance and Fault Detection Analytics for Photovoltaic Power Plants. Sol. RRL 2024, 8, 2400473. [Google Scholar] [CrossRef]
  13. Marangis, D.; Tziolis, G.; Livera, A.; Makrides, G.; Kyprianou, A.; Georghiou, G.E. Intelligent Maintenance Approaches for Improving Photovoltaic System Performance and Reliability. Sol. RRL 2025, 9, 2500289. [Google Scholar] [CrossRef]
  14. Syamsuddin, A.; Adhi, A.C.; Kusumawardhani, A.; Prahasto, T.; Widodo, A. Predictive maintenance based on anomaly detection in photovoltaic system using SCADA data and machine learning. Results Eng. 2024, 24, 103589. [Google Scholar] [CrossRef]
  15. Pang, W.; E-Alam, M.N.; Islam, M.A. Photovoltaic array fault detection using a hybrid graph neural network and transformer architecture with multi-head attention. J. Renew. Sustain. Energy 2025, 17, 063502. [Google Scholar] [CrossRef]
  16. Harrou, F.; Kini, K.R.; Madakyaru, M.; Sun, Y. Anomaly Detection in Photovoltaic Systems Using Improved Independent Component Analysis. IEEE Access 2025, 13, 144307–144324. [Google Scholar] [CrossRef]
  17. Snytko, A.; Jiménez-Castillo, G.; Muñoz-Rodríguez, F.J.; Rus-Casas, C. Fault Diagnosis for Photovoltaic Systems: A Validated Industrial SCADA Framework. Appl. Sci. 2025, 15, 12656. [Google Scholar] [CrossRef]
  18. Bezerra, A.; Silva, I.; Guedes, L.A.; Silva, D.; Leitão, G.; Saito, K. Extracting Value from Industrial Alarms and Events: A Data-Driven Approach Based on Exploratory Data Analysis. Sensors 2019, 19, 2772. [Google Scholar] [CrossRef]
  19. Luo, M.; Li, X.; Zhang, D.; Zhao, Y.; Lim, P. Categorical data analysis for equipment failure prediction. In Proceedings of the 2008 34th Annual Conference of IEEE Industrial Electronics, Orlando, FL, USA, 10–13 November 2008; Institute of Electrical and Electronics Engineers (IEEE): New York, NY, USA, 2008; pp. 1473–1478. [Google Scholar] [CrossRef]
  20. Gutschi, C.; Furian, N.; Suschnigg, J.; Neubacher, D.; Voessner, S. Log-based predictive maintenance in discrete parts manufacturing. Procedia CIRP 2019, 79, 528–533. [Google Scholar] [CrossRef]
  21. Ruiz Amantegui, J.; Do, P.; Vu, H.C.; Pavlov, M.; Favrot, N. On the Construction of Energy Efficiency-based Degradation Indicator for Photovoltaic Solar Inverters. Annu. Conf. PHM Soc. 2024, 16, 1–10. [Google Scholar] [CrossRef]
  22. Jordan, D.C.; Anderson, K.; Perry, K.; Muller, M.; Deceglie, M.; White, R.; Deline, C. Photovoltaic fleet degradation insights. Prog. Photovolt. Res. Appl. 2022, 30, 1166–1175. [Google Scholar] [CrossRef]
  23. Wang, Q.; Huang, R.; Xiong, J.; Yang, J.; Dong, X.; Wu, Y.; Wu, Y.; Lu, T. A survey on fault diagnosis of rotating machinery based on machine learning. Meas. Sci. Technol. 2024, 35, 102001. [Google Scholar] [CrossRef]
  24. Hamza, A.; Ali, Z.; Dudley, S.; Saleem, K.; Uneeb, M.; Christofides, N. A multi-stage review framework for AI-driven predictive maintenance and fault diagnosis in photovoltaic systems. Appl. Energy 2025, 393, 126108. [Google Scholar] [CrossRef]
  25. Fan, H.; Ramamohanarao, K. Efficiently Mining Interesting Emerging Patterns. In Advances in Web-Age Information Management; Goos, G., Hartmanis, J., Van Leeuwen, J., Dong, G., Tang, C., Wang, W., Eds.; Lecture Notes in Computer Science; Springer: Berlin/Heidelberg, Germany, 2003; Volume 2762, pp. 189–201. [Google Scholar] [CrossRef]
  26. Kan, J.C.; Passos, M.V.; Destouni, G.; Barquet, K.; Ferreira, C.S.; Kalantari, Z. Forecasting heat-related impacts with multivariate multi-step time series models using advanced deep learning. Sustain. Cities Soc. 2026, 137, 107142. [Google Scholar] [CrossRef]
  27. Ebtehaj, I.; Bonakdari, H.; Zeynoddin, M.; Gharabaghi, B.; Azari, A. Evaluation of preprocessing techniques for improving the accuracy of stochastic rainfall forecast models. Int. J. Environ. Sci. Technol. 2020, 17, 505–524. [Google Scholar] [CrossRef]
  28. Gu, A.; Dao, T. Mamba: Linear-Time Sequence Modeling with Selective State Spaces. arXiv 2024, arXiv:2312.00752. [Google Scholar] [CrossRef]
  29. Pessoa, P.; Campitelli, P.; Shepherd, D.P.; Ozkan, S.B.; Pressé, S. Mamba time series forecasting with uncertainty quantification. Mach. Learn. Sci. Technol. 2025, 6, 035012. [Google Scholar] [CrossRef]
  30. Kim, J.; Kim, H.; Kim, H.; Lee, D.; Yoon, S. A comprehensive survey of deep learning for time series forecasting: Architectural diversity and open challenges. Artif. Intell. Rev. 2025, 58, 216. [Google Scholar] [CrossRef]
  31. Oreshkin, B.N.; Carpov, D.; Chapados, N.; Bengio, Y. N-BEATS: Neural basis expansion analysis for interpretable time series forecasting. arXiv 2020, arXiv:1905.10437. [Google Scholar] [CrossRef]
Figure 1. Positive cases of detected failures through the anomaly detection framework.
Machines 14 00551 g001
Figure 2. Highly imbalanced dataset, less than 3% of the data is classified in the class “Abnormal”.
Machines 14 00551 g002
Figure 3. Comparative distribution of inverter error codes during normal and abnormal operation. The heterogeneity and concentration of specific alarms during abnormal periods suggest that categorical alarm information is valuable for predicting abnormal behavior.
Machines 14 00551 g003
Figure 4. Summary of label contributions.
Machines 14 00551 g004
Figure 5. Anomaly detection flowchart.
Machines 14 00551 g005
Figure 6. Histogram by time of day of irradiance of plant 27: (a) raw data, (b) pre-processed.
Machines 14 00551 g006
Figure 7. Removed data points to resemble normal operation.
Machines 14 00551 g007
Figure 8. Partial auto-correlation function of the power output of an inverter.
Machines 14 00551 g008
Figure 9. Box plot of MAE of the power prediction of the different models with different categorical data as input.
Machines 14 00551 g009
Figure 10. Box plot of RMSE of the power prediction of the different models with different categorical data as input.
Machines 14 00551 g010
Table 1. Summary of PV plants, operational period, and installed power.
Plant IDNo. InvertersFirst DateLast DateInstalled Power (MW)
112016-022025-090.28
16622017-032025-0917.36
1932016-112025-090.84
2782016-112025-072.24
3152016-102025-091.40
3792016-102025-032.14
3852016-102025-091.40
3982016-102025-091.44
4032018-072025-060.84
4162016-102025-091.68
4282016-102025-091.80
4342016-102025-090.88
5742016-122025-090.90
Table 2. Available categorical features and their cardinality.
CategoryCardinality
Error code 168
Error code 2211
Warning code 111
Warning code 213
State of the inverter21
Table 3. Class distribution of the dataset.
ClassCountPercentage (%)
Normal20,093,81197.53
Shutdown508,4262.47
Table 4. Average MAE and RMSE for different models with and without discrete variables. Precision, recall and F1 score of the anomaly detection method.
ModelInput TypeAvg. MAEAvg. RMSEPrecisionRecallF1
MLPWithout discrete0.058 ± 0.0260.085 ± 0.0330.9290.5930.706
One-Hot Encoded0.062 ± 0.0280.090 ± 0.0400.8740.5440.648
Entity Embedding0.057± 0.0240.083 ± 0.0310.9150.5770.686
Prefix Features0.066 ± 0.0240.091 ± 0.0280.8370.5170.613
XGBoostWithout discrete0.065 ± 0.0280.090 ± 0.0320.8240.4910.600
One-Hot Encoded0.066 ± 0.0250.090 ± 0.0300.8380.5140.623
Entity Embedding0.070 ± 0.0290.094 ± 0.0340.8690.5190.639
Prefix Features0.070 ± 0.0260.094 ± 0.0300.0840.5020.609
LSTMWithout discrete0.069 ± 0.0230.094 ± 0.0270.8810.5460.646
One-Hot Encoded0.085 ± 0.0330.113 ± 0.0390.8790.5900.673
Entity Embedding0.074 ± 0.0280.099 ± 0.0320.8990.5660.664
Prefix Features0.085 ± 0.0330.114 ± 0.0400.7980.4970.595
MambaWithout discrete0.057 ± 0.0240.099 ± 0.0910.9240.5690.679
One-Hot Encoded0.062 ± 0.0240.094 ± 0.0360.8960.5570.668
Entity Embedding0.070 ± 0.0230.105 ± 0.0330.8890.5540.655
Prefix Features0.067 ± 0.0280.102 ± 0.0450.8100.4570.554
Table 5. Comparison of anomaly detection performance between the proposed method and a reference residual-based approach.
MethodPrecisionRecallF1 Score
Proposed method0.930.680.78
Reference method [11]0.380.750.47
Disclaimer/Publisher’s Note: The statements, opinions and data contained in all publications are solely those of the individual author(s) and contributor(s) and not of MDPI and/or the editor(s). MDPI and/or the editor(s) disclaim responsibility for any injury to people or property resulting from any ideas, methods, instructions or products referred to in the content.