


Abstract
The transition toward renewable energy sources has positioned wind energy as a critical technology for achieving global carbon neutrality targets. While large-scale wind farms dominate current installations, micro-scale horizontal-axis wind turbines present significant potential for distributed energy generation in remote and rural areas. This study presents a comprehensive methodology for designing micro-scale wind turbine blades through comparative analysis of three computational approaches: classical blade element momentum theory (BEMT), QBlade 2.0.9.6 software, and Computational Fluid Dynamics (CFD) simulations, with the design methodology selected based on a trade-off between accuracy and computational cost. A numerical campaign for airfoil assessment was conducted to identify optimal blade geometries, with performance evaluated based on power coefficient distribution, peak power output, and cut-in wind speed. The investigation reveals that steady CFD simulations predict peak power coefficients 23.34% higher than those predicted by BEMT and 22.46% higher than those predicted by QBlade due to three-dimensional effects, including rotational stall delay. Considering unsteady effects, the CFD simulations show a decrease of 4.08% with respect to steady simulations. The addition of endplates to the optimized blade design demonstrates significant performance improvements. This multi-fidelity approach provides a robust framework for micro-scale wind turbine design, balancing computational efficiency with accuracy requirements, and examines the impact of adding endplates.
1. Introduction
The global imperative for carbon emission reduction has accelerated the deployment of renewable energy technologies. In this global context, wind energy presents itself as a key factor for achieving international climate targets. The Paris Agreement of 2015 [1] established the goal of limiting global temperature increase to well below 2 °C above pre-industrial levels, subsequently strengthened by the Glasgow Climate Pact in 2021 [2], which aims for a 1.5 °C limit. To meet these targets, countries worldwide have committed to a decarbonization goal, with China targeting carbon neutrality by 2060, as stated by Huang and Zhai [3], and the European Union by 2050 as established by European Commission Directorate-General for Climate Action [4], among others.
Wind energy capacity has recently experienced continuous growth, with global installations continuing to expand both onshore and offshore, as stated by the Global Wind Energy Council [5]. However, the benefits of wind energy must extend beyond large-scale centralized wind farms in order to encompass distributed generation systems that can serve remote and rural communities lacking access to the centralized electrical grid or adequate infrastructure for large-scale installations. Micro-scale horizontal-axis wind turbines (HAWTs), commonly defined by a rated power output below 1.5 kW, as stated by James and Bahaj [6], represent a critical component of this distributed energy strategy and are also a key factor in advancing Sustainable Development Goal 7: Affordable and Clean Energy [7].
The design philosophy for micro-scale wind turbines fundamentally differs from their large-scale counterparts, emphasizing modularity, simplicity, and reduced maintenance requirements. Traditional pitch control systems, while effective for large turbines, introduce complexity and costs that are often prohibitive for small installations. Consequently, passive optimization strategies focusing on aerodynamic blade design combined with electrical control systems such as Maximum Power Point Tracking (MPPT) have become the preferred approach, as observed by Barzegar-Kalashani et al. [8]. The implementation of this control method must be coupled with a sufficiently wide operational range of maximum or near-maximum efficiency to avoid losses associated with reduced efficiency, as stated by Abad et al. [9]. These systems maximize power extraction by regulating the working tip speed ratio through generator control, eliminating the need for complex mechanical pitch mechanisms.
The aerodynamic design of micro-scale wind turbine blades presents unique challenges that require careful consideration of computational methods and their inherent limitations. The classical Blade Element Momentum Theory (BEMT) has been the cornerstone of wind turbine design due to its computational efficiency and reasonable accuracy, and it has been extensively used in the literature, where different authors have used this method in order to optimize the chord and twist distribution along the blade such as Akour et al. [10] or Bavanish and Thyagarajan [11], since it improves wind-turbine performance with respect to a non-optimized blade as proved by Lee et al. [12]. However, the fundamental assumption of BEMT is two-dimensional flow, which neglects significant three-dimensional effects that can impact wind turbine performance. Recent advances in computational tools have provided alternatives to traditional BEMT approaches, aiming to increase the fidelity with which those three-dimensional effects are studied. For instance, the open-source wind turbine design software QBlade, developed by Marten et al. [13], incorporates corrections for three-dimensional effects while maintaining computational efficiency. For this reason, QBlade has recently started to be used in the literature as a design and validation tool by Islam et al. [14], Altmimi et al. [15] or Cao et al. [16] among others, and validated by comparing the results obtained with those of classical BEMT and experimental data as reported by Monteiro et al. [17] and Umar et al. [18]. The corrections included by this software, developed by Snel et al. [19], address some of the limitations of classical BEMT by incorporating boundary layer analysis and rotational effects into the momentum theory framework. For cases requiring higher fidelity, three-dimensional Computational Fluid Dynamics (CFD) simulations can be used in order to analyze bio-inspired designs, as implemented by Peng et al. [20], capture complex phenomena such as rotational stall delay, tip vortex formation, and blade-wake interactions, as shown by Lee et al. [12], Sumner et al. [21] and Zhang et al. [22], or to study complex working conditions such as wind gusts, as described by Menegozzo et al. [23]. These methodologies are often used in the design process by authors such as Torregrosa et al. [24] or Bekkai et al. [25], allowing the creation of an optimal design.
The reduced scale of micro-scale wind turbines allows different methods of improving aerodynamic performance to be proposed, such as the addition of tubercles on the leading edge, as studied by Demırcı et al. [26], the combination of wind turbines in tandem configuration, as analyzed by Amoretti et al. [27] or Bontempo and Manna [28], or different blade-tip designs relative to the larger-scale options, such as backwards or forwards swept blades, as developed by Kaya et al. [29], and the design of different kinds of winglets, which are blade deformations that preserve the cross-sectional profile, such as winglets oriented toward the blade suction side, as tested by Khaled et al. [30], or aligned with the flow direction, as studied by Iswahyudi et al. [31], aiming to reduce wingtip vortices by modifying the blade geometry to influence the flow behavior near the tip. Particularly, endplates (the simplest version of a winglet in geometry and manufacturing characteristics) have also been studied in the case of vertical-axis wind turbines by Madrigal Avalos et al. [32].
Yet, to the author’s knowledge, the literature does not address the impact of endplates for a horizontal-axis wind turbine, although endplates are a feature that could increase the aerodynamic performance of HAWTs without significantly increasing their manufacturing or design costs.
While the literature examines the differences between the analysis methods presented in the works done by Abbas et al. [33] or Koc et al. [34], it is necessary to determine a trade-off between their fidelity and computational cost in order to establish an efficient yet functional design methodology, aiming to capture the three-dimensional effects. The present study addresses the critical need for a comprehensive design methodology that systematically compares these computational approaches while optimizing blade geometry for micro-scale HAWTs.
This work develops a multi-fidelity design framework comparing BEMT, QBlade, and CFD methodologies. Within this framework, a systematic optimization of blade geometry is conducted through a numerical campaign. The study also focuses on the quantification of the three-dimensional effects on performance predictions. Finally, the effectiveness of endplates will be investigated as a strategy for aerodynamic performance enhancement.
This article first describes the implementation of the BEMT methodology and its three-dimensional corrections in Section 2.1. Next, the CFD model setup and its meshing and validation are addressed in Section 2.2. Then, the following design procedure, starting with the comparison of the different computational methods used, and finally the effects of the endplates on the blade performance are presented in Section 3. Finally, some concluding remarks are provided in Section 4.
2. Materials and Methods
The design and analysis procedures outlined in this study employ various numerical methodologies whose proper configuration and implementation are critical for ensuring reliable results. This section presents the detailed setup and procedures employed for each computational approach.
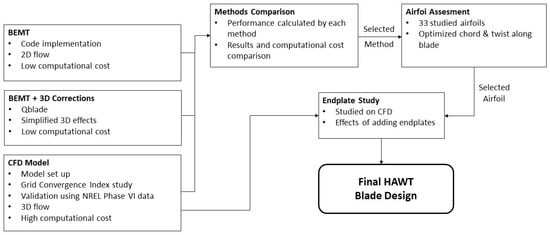
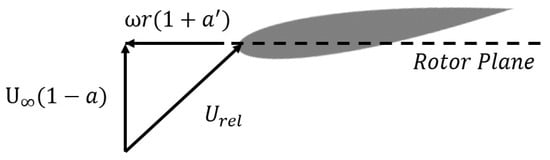
As shown in Figure 1, the design process is divided into different steps. The design and analysis methodologies are described in Section 2.1 and Section 2.2. Then, the methods are compared in Section 3.1, and a method is selected in order to perform the airfoil assessment study, which is presented in Section 2.3. Finally, a geometry is selected, and the effects of adding an endplate are studied in Section 3.3.
Figure 1.
Schematic representation of the workflow followed.
2.1. Blade Element Momentum Theory Implementation
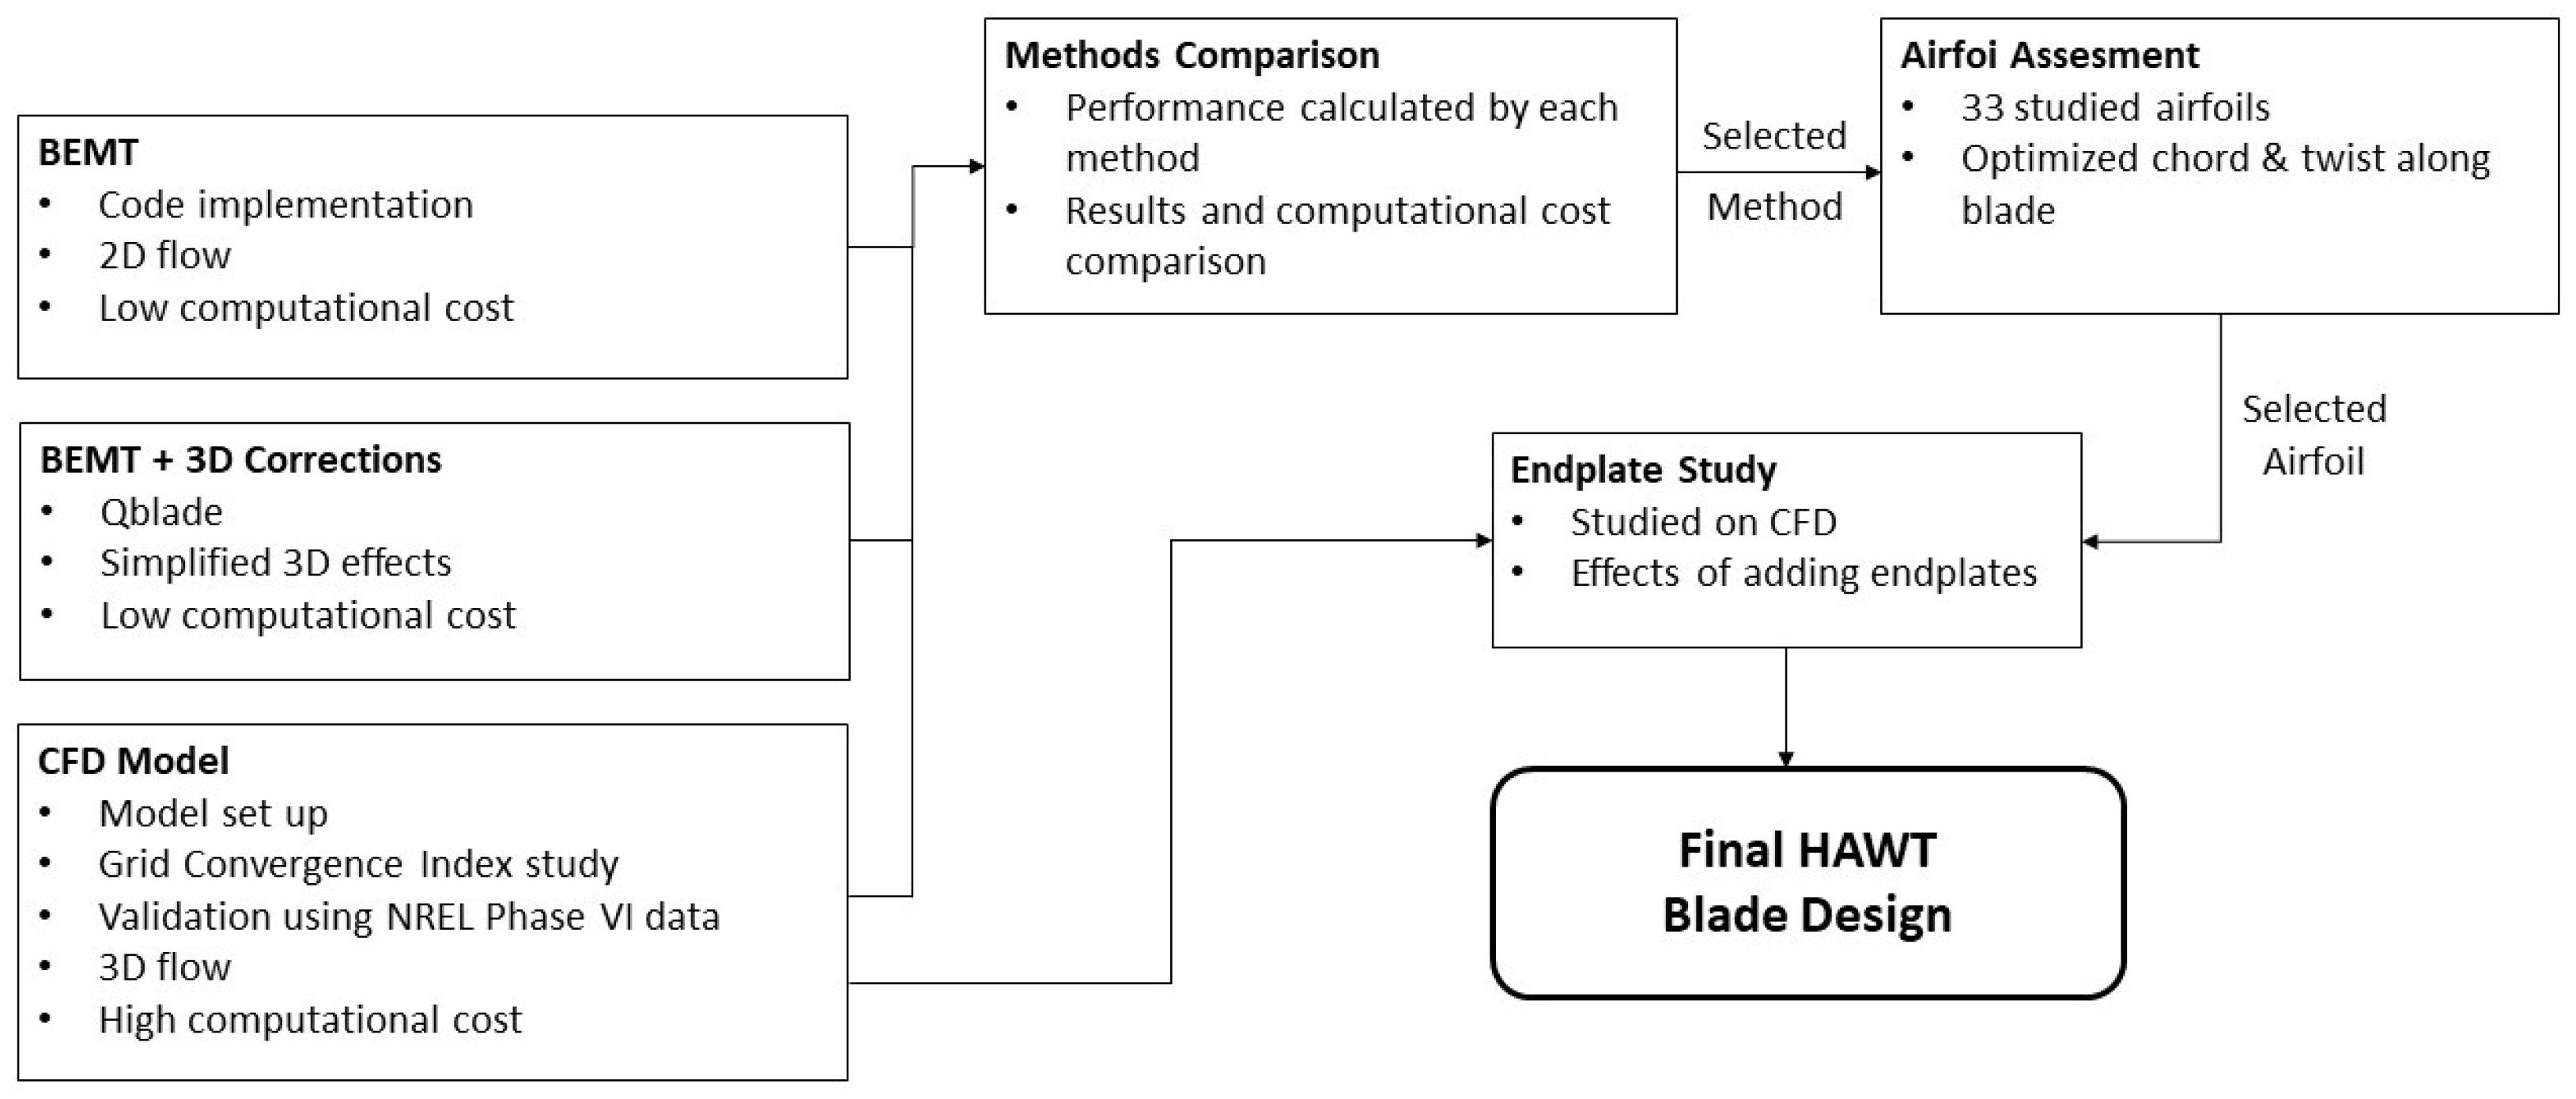
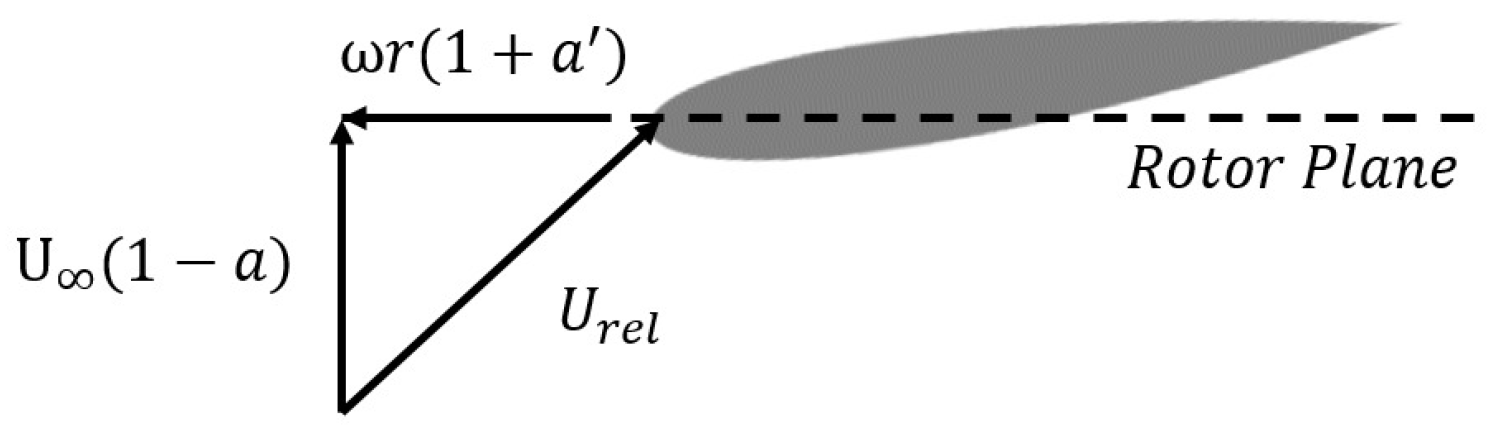
This method discretizes the rotor blades into independent sections, each assumed to generate a constant force on the flow field. The theory employs two fundamental induction factors: the axial induction factor (a) and the rotational induction factor (), which, together with the air velocity and the rotational speed, , define the velocity triangle experienced by each blade section, as observed in Figure 2, creating the relative velocity . These parameters are essential for determining the resultant angle of attack, following established methodologies by Hansen [35]. This approach inherently neglects three-dimensional flow effects. Additionally, the implementation requires lift and drag coefficient databases as functions of angle of attack for each of the blade sections studied. The angle of attack used in this paper was obtained using XFoil, developed by Drela [36], which calculates lift by means of an inviscid linear-vorticity panel method, whereas drag considers the viscous effects through a distributed source model superimposed on the airfoil and wake geometry. These databases allow the calculation of the loads at each section. To enhance accuracy, Prandtl tip loss and Glauert corrections were implemented, aiming to account for finite-blade-number effects and induction factors exceeding the critical value (usually defined as 1/3), respectively, as stated by Hansen [35].
Figure 2.
Velocity triangle configuration established by the BEMT methodology with NACA0015 airfoil as an example.
Furthermore, other corrections aiming to model three-dimensional effects can be added. QBlade, an open-source wind turbine design and analysis platform developed by Marten et al. [13], incorporates a three-dimensional correction to classical BEMT. This correction, named “3D Correction” in the software, employs boundary layer equation magnitude analysis for high aspect ratio rotating blades under both attached and separated flow conditions developed by Snel et al. [19], yielding simplified equations that are integrated into BEMT computations without significant computational cost increase. This software also allows the creation of 3D models of blades, optimizing the chord and twist distributions based on the BEMT method.
The classical BEMT and the QBlade implementation both allow the assessment of wind turbine performance by calculating the power and torque coefficients, which are dimensionless values of power and torque, as a function of the tip speed ratio, which is the ratio of the rotational and lineal speeds perceived by the blade tip. These coefficients are defined, respectively, in Equations (1) and (2), and the tip speed ratio is defined in Equation (3).
2.2. Computational Fluid Dynamics
While CFD provides enhanced fidelity in three-dimensional flow modeling compared to BEMT, this advantage comes at increased computational expense. To achieve this increase in fidelity, the full geometry must be solved in a three-dimensional manner, omitting hybrid models such as the actuator disk. The model setup and meshing strategy will be discussed and validated using an NREL reference case.
2.2.1. CFD Simulation Setup
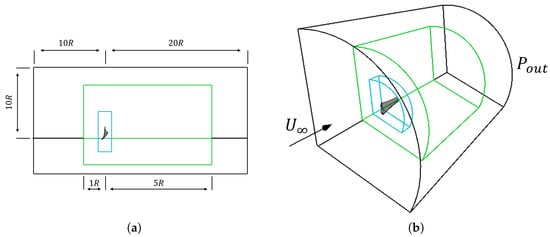
The computational fluid simulations are performed using the software StarCCM+ 2406 (19.04.007). Multiple control volumes were established to ensure well-defined computational domains, as illustrated in Figure 3. The configuration for a three-bladed HAWT in a steady approach uses one-third of a cylinder as the domain, with periodic boundary conditions phased at 120°, neglecting tower effects for computational simplification. For the unsteady simulations, the whole cylinder will be used. The fluid is modeled as dry air at sea-level conditions.
Figure 3.
(a) CFD steady simulation domain and refinement volumes (not to scale), side view; (b) CFD steady simulation domain and refinement volumes (not to scale), perspective view. The refinement of each coloured volume is explained in Section 2.2.2.
The main factors affecting the turbine performance are the wind speed and the turbine rotational speed. The desired flow velocity is imposed normal to the domain inlet, while atmospheric pressure at sea level is imposed at the outlet, as seen in Figure 3. The curved sides of the domain are established as symmetry planes. This symmetry condition, while not physically representative, is commonly employed to simulate extended domains while avoiding wall interaction effects, as reported by Sezer-Uzol and Long [37]. For the steady-state approach, the rotation of the wind turbine is modeled through the moving reference frame (MRF) methodology, applied to the innermost volume observed in Figure 3. In the case of the unsteady simulations, the approach followed is a sliding mesh (SM) method. Domain dimensions were established to ensure convergence by minimizing the influence of the boundary conditions on the region of interest.
A segregated solver was employed, given Mach numbers below 0.3, enabling incompressible flow assumptions. Flow modeling utilized Reynolds-Averaged Navier–Stokes (RANS) equations under steady-state and unsteady conditions. The turbulence model was selected based on similar models found in the literature, such as the works developed by Krogstad and Lund [38] or Sumner et al. [21]. The described methodology is consistent with practices established by Budanko and Guzović [39] among others. The unsteady simulations will be solved using an implicit solver and setting a time step equivalent to one degree of rotation, in order to ensure that all the phenomena are properly calculated and that a valid Courant number distribution is obtained, as indicated by Cai et al. [40].
2.2.2. Mesh Generation
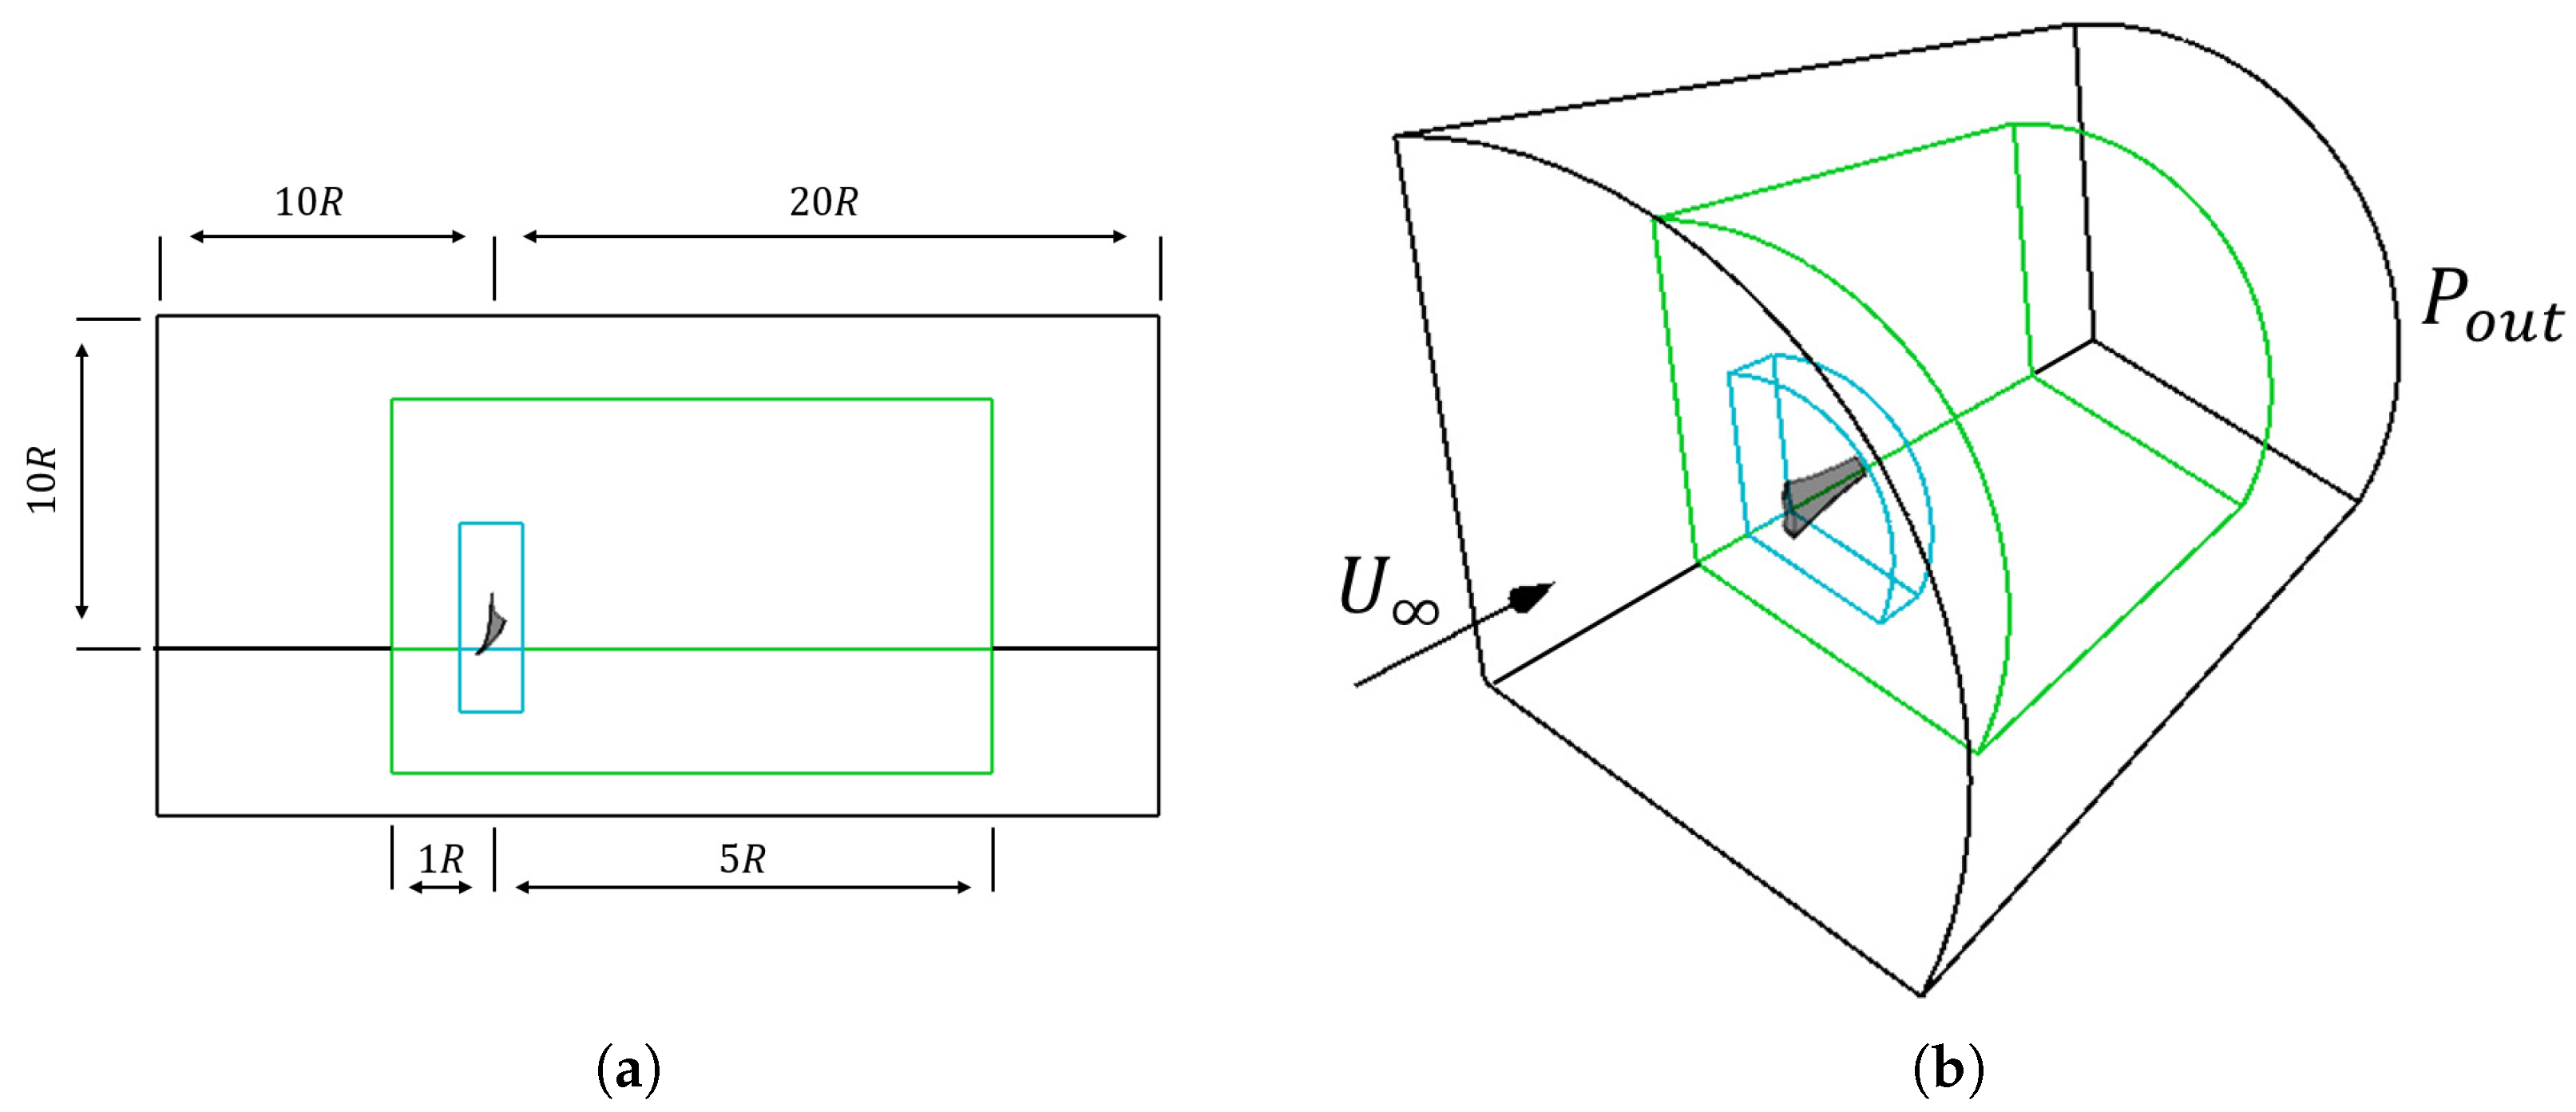
The domain is discretized using polyhedral cells. The mesh includes a 1.4 mm global-thickness prism-layer mesh consisting of seven layers, as well as local refinements at the blade surface and its surroundings, including the rotating region. The surface refinement consists of increasing the maximum curvature allowed for the cells on the blade surface to a value of 168 and imposing a cell size equal to 1% of the cell size imposed on the global domain. The volumetric controls can be seen in Figure 3 and consist of reducing the cell size to 15% of the global domain cell size for the outermost volume and to 5% for the innermost one.
A grid convergence index (GCI) analysis was conducted to quantify the error relative to the asymptotic solution. This methodology involves multiple simulations with varying mesh densities in order to determine the order of approximation of the solution and to establish an appropriate base size for maintaining the desired error tolerance as stated by Celik et al. [41]. The results of these simulations can be seen in Table 1; the refinement rate chosen is 1.25. The difference in the number of elements was calculated relative to the finest mesh. In addition, the Richardson extrapolation was employed as developed by Roache [42] to estimate the asymptotic value of the power coefficient, which serves as a reference value for the error evaluation.
Table 1.
GCI study results.
Asymptotic range validation of the obtained results can be confirmed through the expression shown in Equation (4) as stated by Ghaderi et al. [43], confirming the abatement of discretization error.
Based on the simulation results, the order of approximation of the solution can be calculated. Next, a target error of 5% is imposed. The required base cell size for keeping the error within the desired range can then be calculated, as described by Celik et al. [41], and is found to be 0.178 m. The final mesh, consisting of cells, can be seen in Figure 4.
Figure 4.
CFD mesh side view close-up (in red) to the interest zone. Additional close-ups of the blade refinement volume and prism layer.
While this analysis was performed for a representative geometry in steady state due to the high computational cost of unsteady simulations, the calculated base size was applied to all simulations due to the equivalent nature of the flow phenomena across configurations.
In order to ensure proper wall resolution and mesh quality, a wall Y+ and cell aspect ratio analysis was performed. The distribution demonstrates values of wall Y+ below 5 for all cells and below 1 for 57.42% of the cells, confirming mesh adequacy according to established criteria by Moshfeghi et al. [44] among others. In the case of cell aspect ratio, all cells have a value above 0.05, with 75.53% of the cells having a value above 0.95.
2.2.3. CFD Model Validation
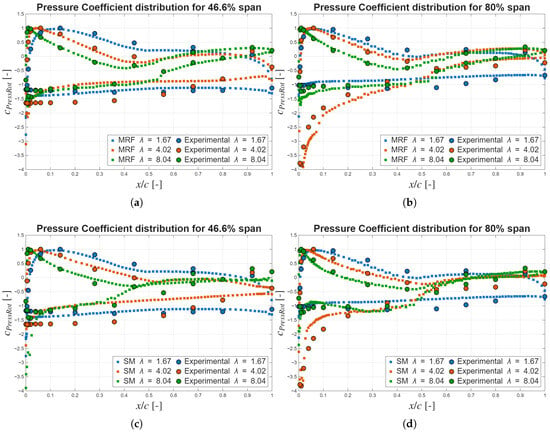
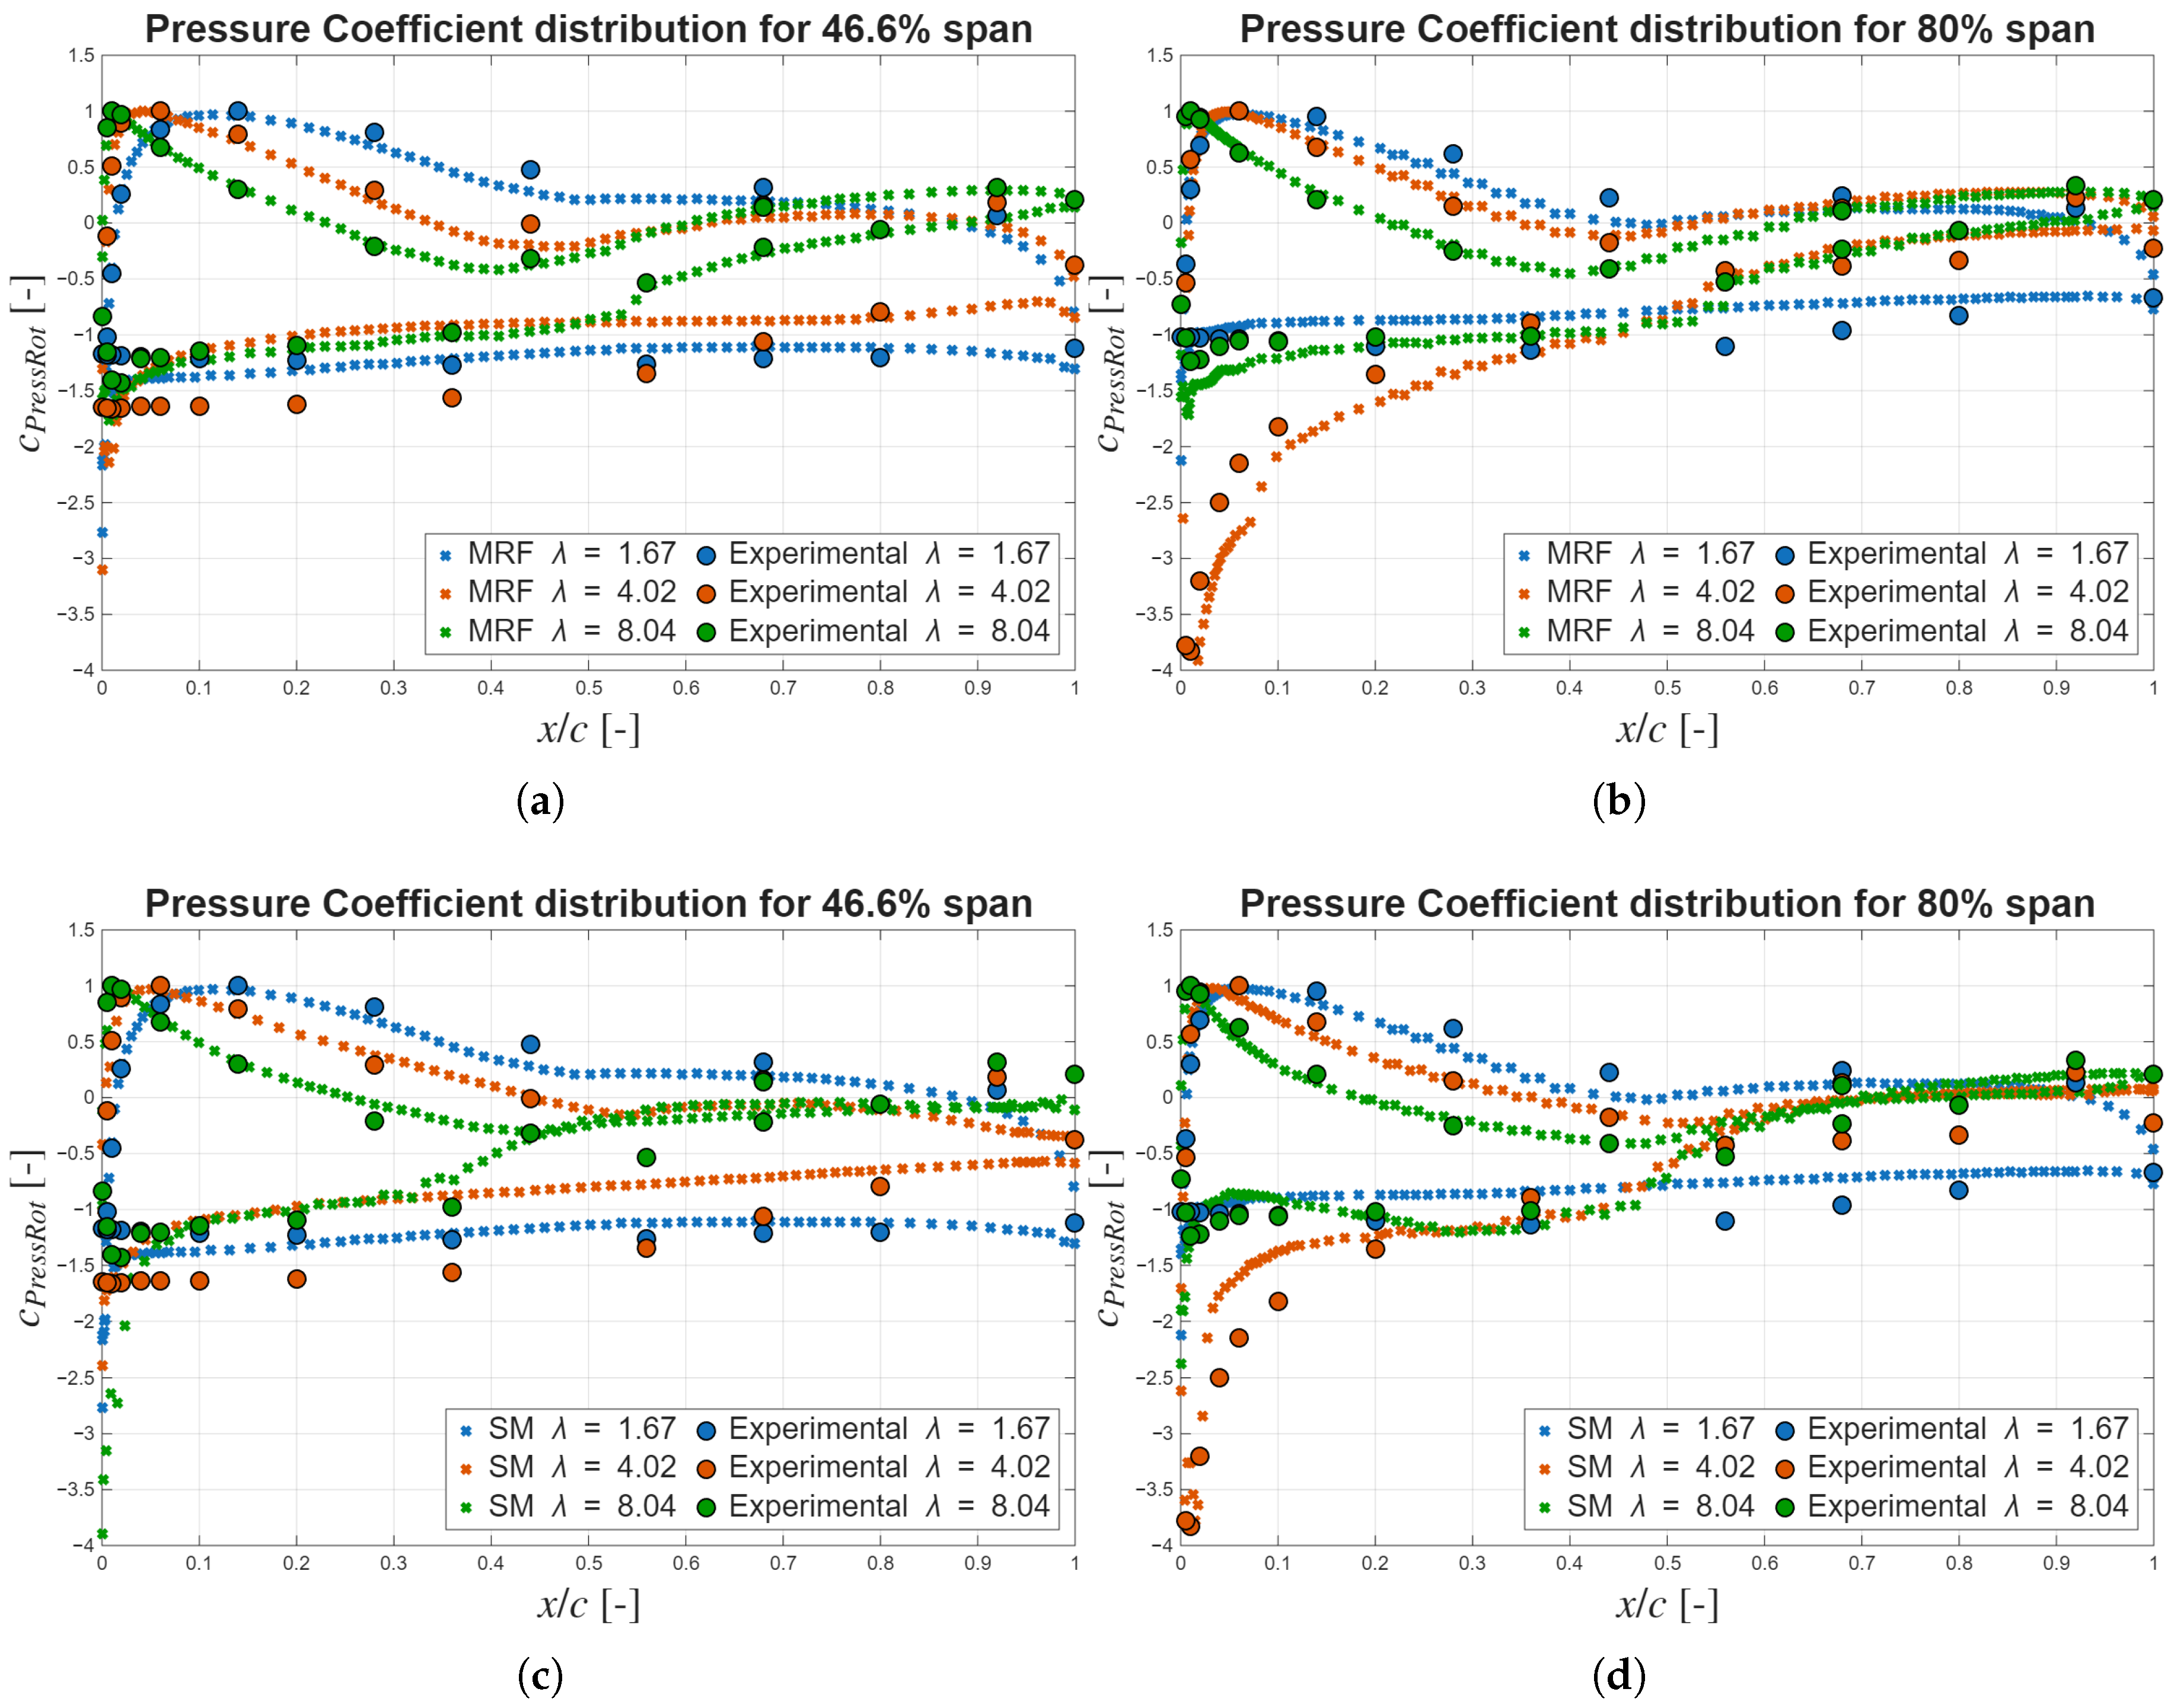
The validation of both steady and unsteady CFD models was conducted using the NREL Phase VI rotor geometry. Scaled computational domains were defined to preserve consistent blade-to-volume ratios, and prism-layer remeshing was applied to ensure that the wall Y+ values remained within the recommended range. The selected experimental dataset corresponds to Sequence I, characterized by a series of wind speeds ranging from 5 m/s to 24 m/s, a constant rotational speed of 72 rpm, and zero yaw angle. This sequence was selected since it represents the conditions studied in this paper. Numerical calculations of the pressure coefficient distribution along the blade chord at selected spanwise positions were compared against available experimental measurements performed by Hand et al. [45] at three different working tip speed ratios. Defining the pressure coefficient as seen in Equation (5), the comparisons are presented in Figure 5. The pressure coefficient distributions along the chord calculated by the CFD show the same tendencies as those measured experimentally, demonstrating the capability of the CFD to properly estimate the experimental data and tendencies at different working conditions.
Figure 5.
Pressure coefficient distributions along the chord at different working conditions for (a) MRF simulations at a 46.6% span; (b) MRF simulations at 80% span; (c) SM simulations at 46.6% span; and (d) SM simulations at 80% span.
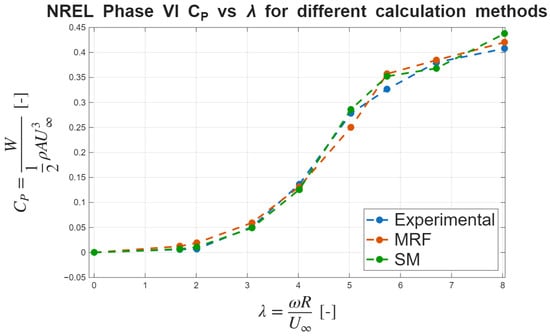
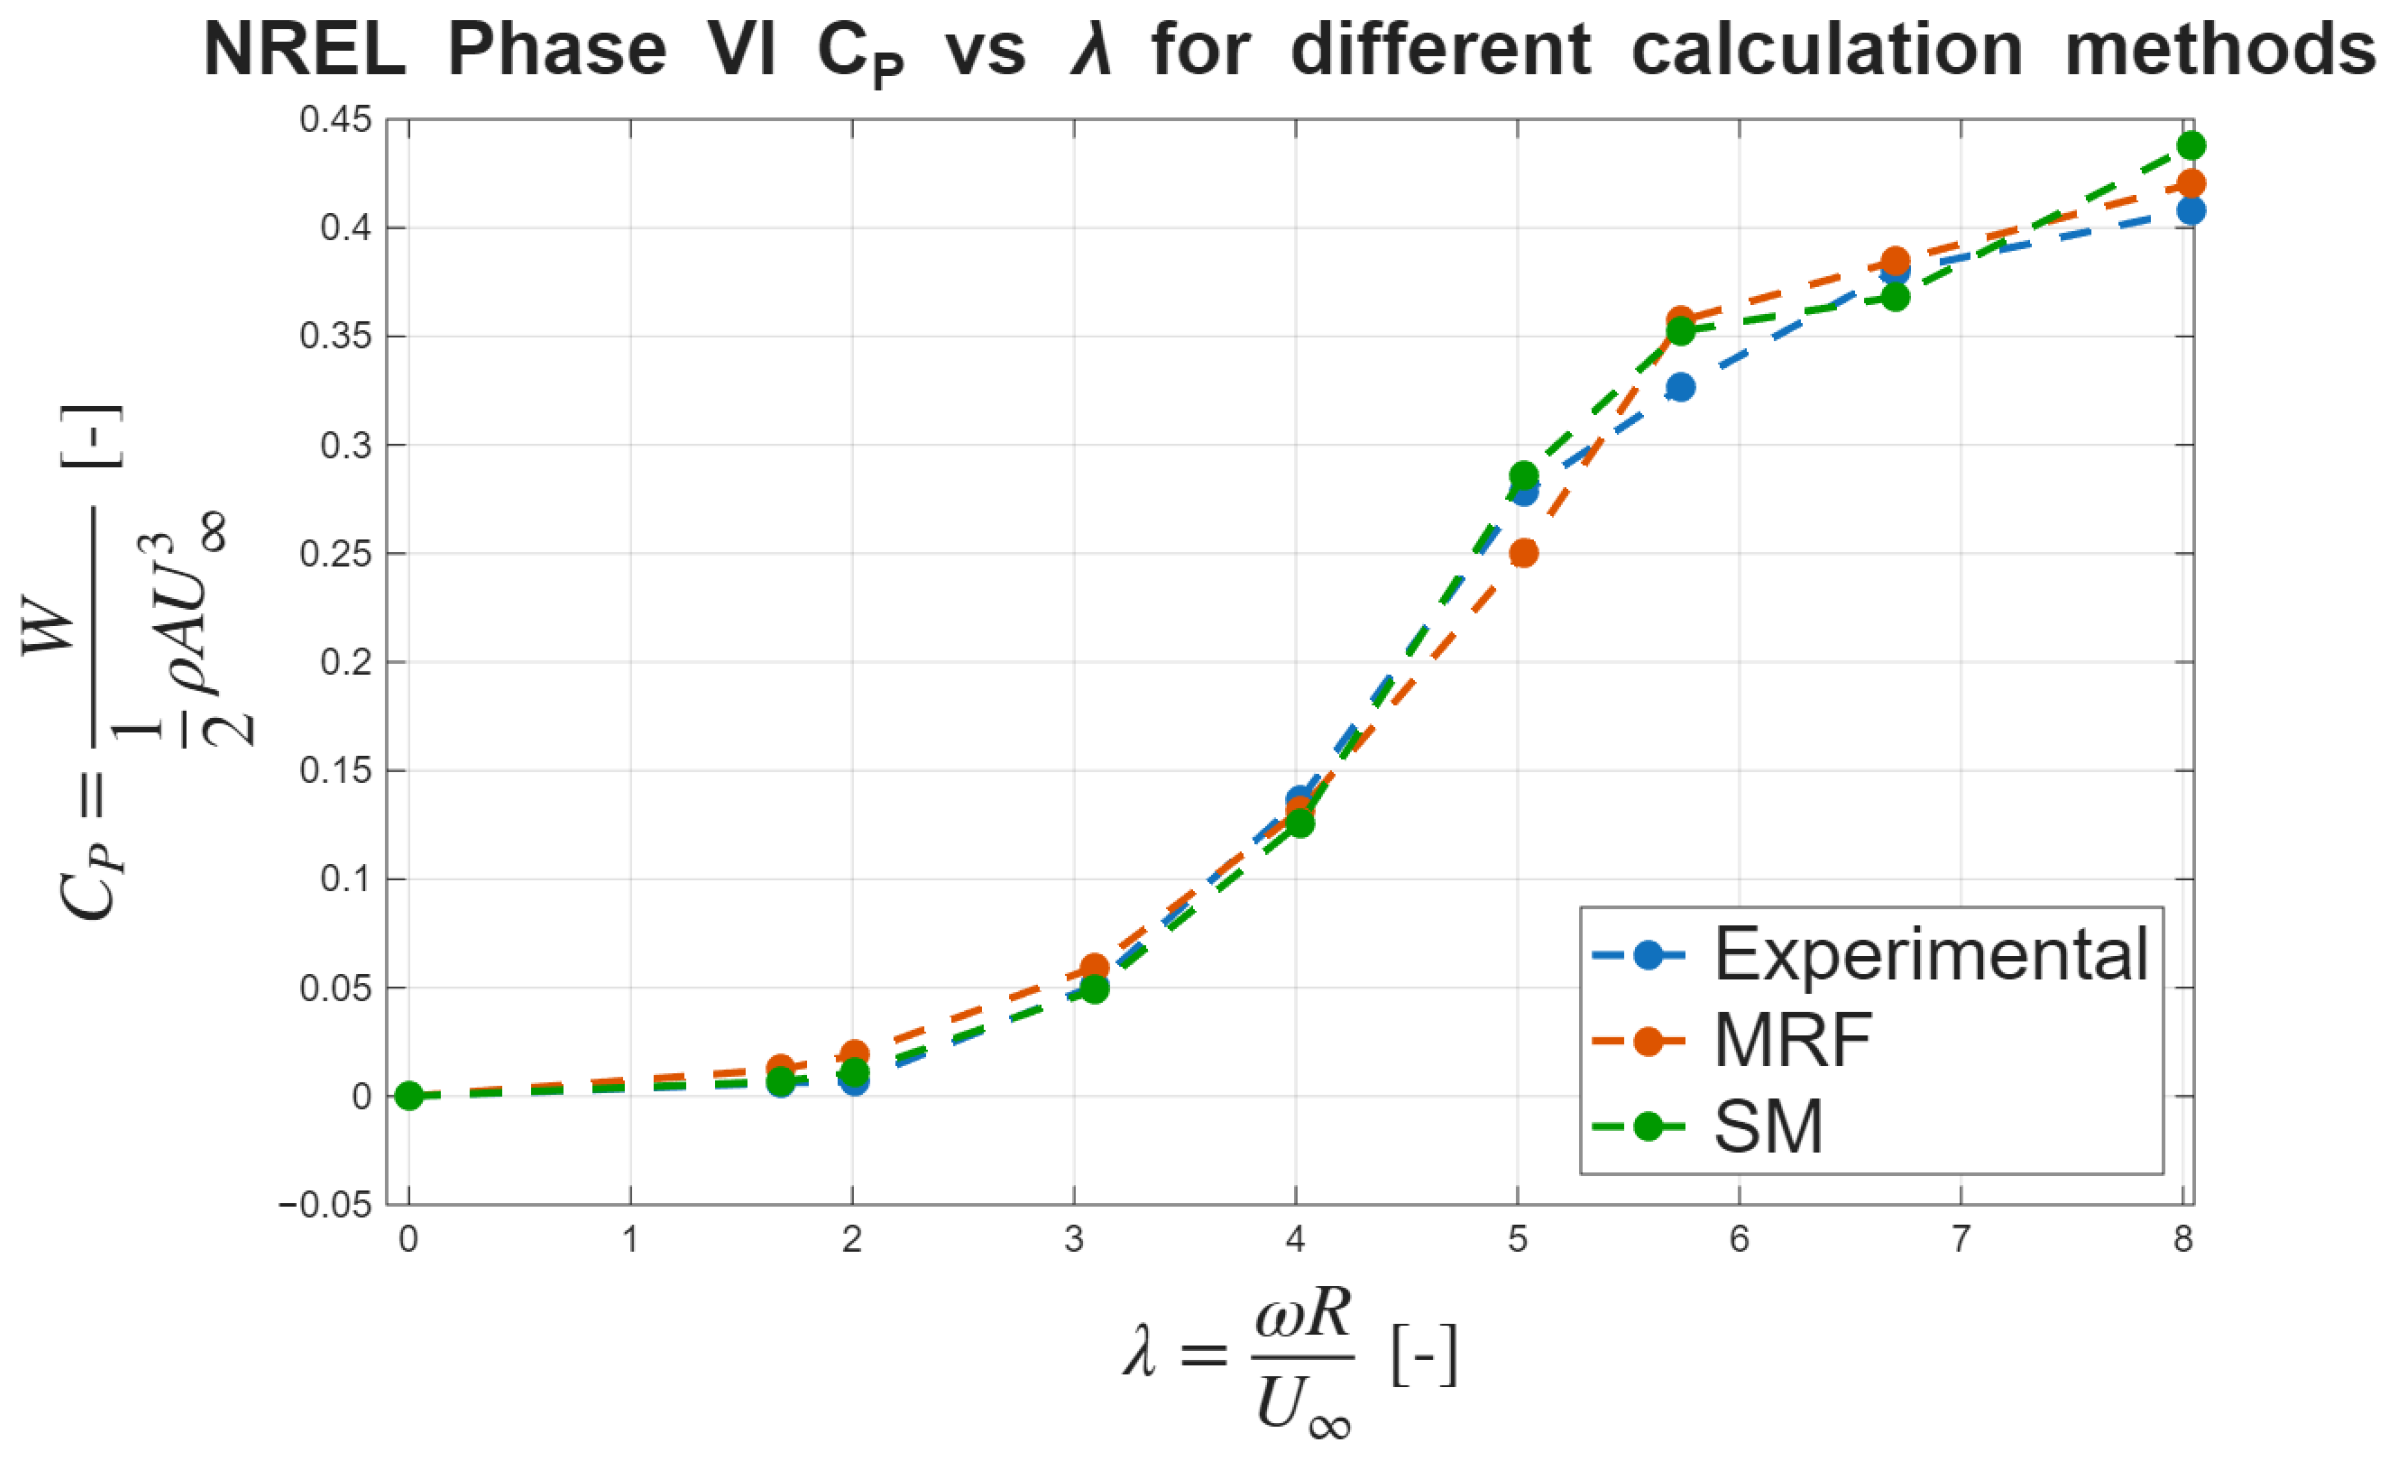
In addition to the pressure coefficient distributions, the power coefficient vs tip speed ratio curve was calculated from the computational pressure coefficient data following the procedure established in the experimental report from Hand et al. [45]. The results, which can be seen in Figure 6, show a similar power coefficient distribution for the different calculation methods. The most noticeable discrepancies for MRF appear at and , which are 10.03% lower and 9.45% higher, respectively, when calculated from data extracted from the CFD steady simulations. In the case of the unsteady simulations, the most noticeable discrepancies appear at and and are 7.93% and 7.31% higher when calculated from the CFD unsteady simulations. In all cases, the calculated errors remain within an acceptable margin.
Figure 6.
Power coefficient versus tip speed ratio curves for the NREL Phase VI blade geometry obtained using different calculation methods.
2.3. Numerical Campaign
A numerical campaign was formulated to systematically evaluate all feasible design configurations. The campaign framework was structured to assess three primary performance criteria:
- Peak power coefficient maximization.
- Power coefficient distribution as a function of tip speed ratio, targeting low stall tip speed ratios, which imply a lower maximum rotational speed for a given wind speed, thus increasing overall safety, while maintaining an adequate optimal operating range to mitigate efficiency losses associated with maximum power point tracker (MPPT) system imperfections, as stated by Abad et al. [9].
- Torque coefficient at a tip speed ratio of zero, serving as an indicator of cut-in wind speed.
The cut-in wind speed is calculated as shown in Equation (6)
where represents the generator starting torque, assumed to be 0.5 Nm for this analysis. The torque coefficient is determined at zero tip speed ratio according to Equation (7).
The design variable will be the airfoil used along the span. The same airfoil will be used along the whole span, as commonly used in the design of micro-scale wind turbines by authors such as Budanko and Guzović [39] or Rosato et al. [46]. The different airfoils are obtained from an airfoil database from the University of Ilinois Department of Aerospace [47], filtering to obtain those designed specifically for wind turbines and a NACA0015, making a total of 33 different airfoils. The selected families are the Bergey, Selig, Althaus, Martin-Hepperle, Jacobs, and Wortmann, aslo used in the literature by Lyon et al. [48] or Mamadaminov [49].
The following design constraints were imposed to ensure practical feasibility:
- A rotor radius of 0.8 m, representing a balance between compactness and power output capability (estimated maximum of 1 kW, as stated by Umar et al. [18]).
- A blade number of three, providing a compromise between power extraction, operational stability, and manufacturing costs, as observed by Adeyeye et al. [50].
- A design tip speed ratio of 3.0, selected to enhance low-wind-speed performance while reducing structural loading requirements, as established by Tummala et al. [51].
- Solidity at the root was kept lower than one, established to prevent inter-blade interference, given the tendency for chord increase at the root during optimization, and achieved by imposing a chord at the root of 0.2 m.
The chord and twist distributions along the span for the different geometries are not considered variables since they will be optimized based on the BEMT method. Each blade is designed by selecting its airfoil and optimizing the chord and twist distribution along the span based on the BEMT method, after which it is evaluated.
3. Results & Discussion
This section presents the results obtained through the different methodologies employed in this study. Initially, a comparative analysis between computational methods is conducted to establish the most suitable approach for the numerical campaign. Subsequently, the campaign results and associated analyses are presented and discussed. Finally, endplates are implemented in the geometry aiming to improve blade performance.
3.1. Comparative Analysis of Computational Methods
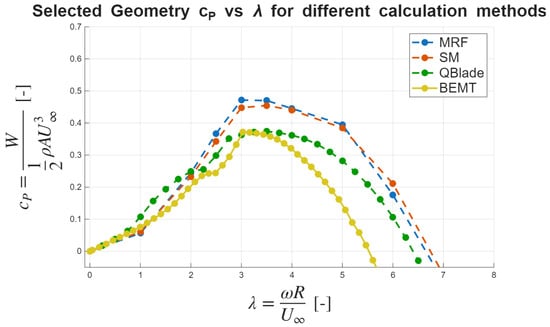
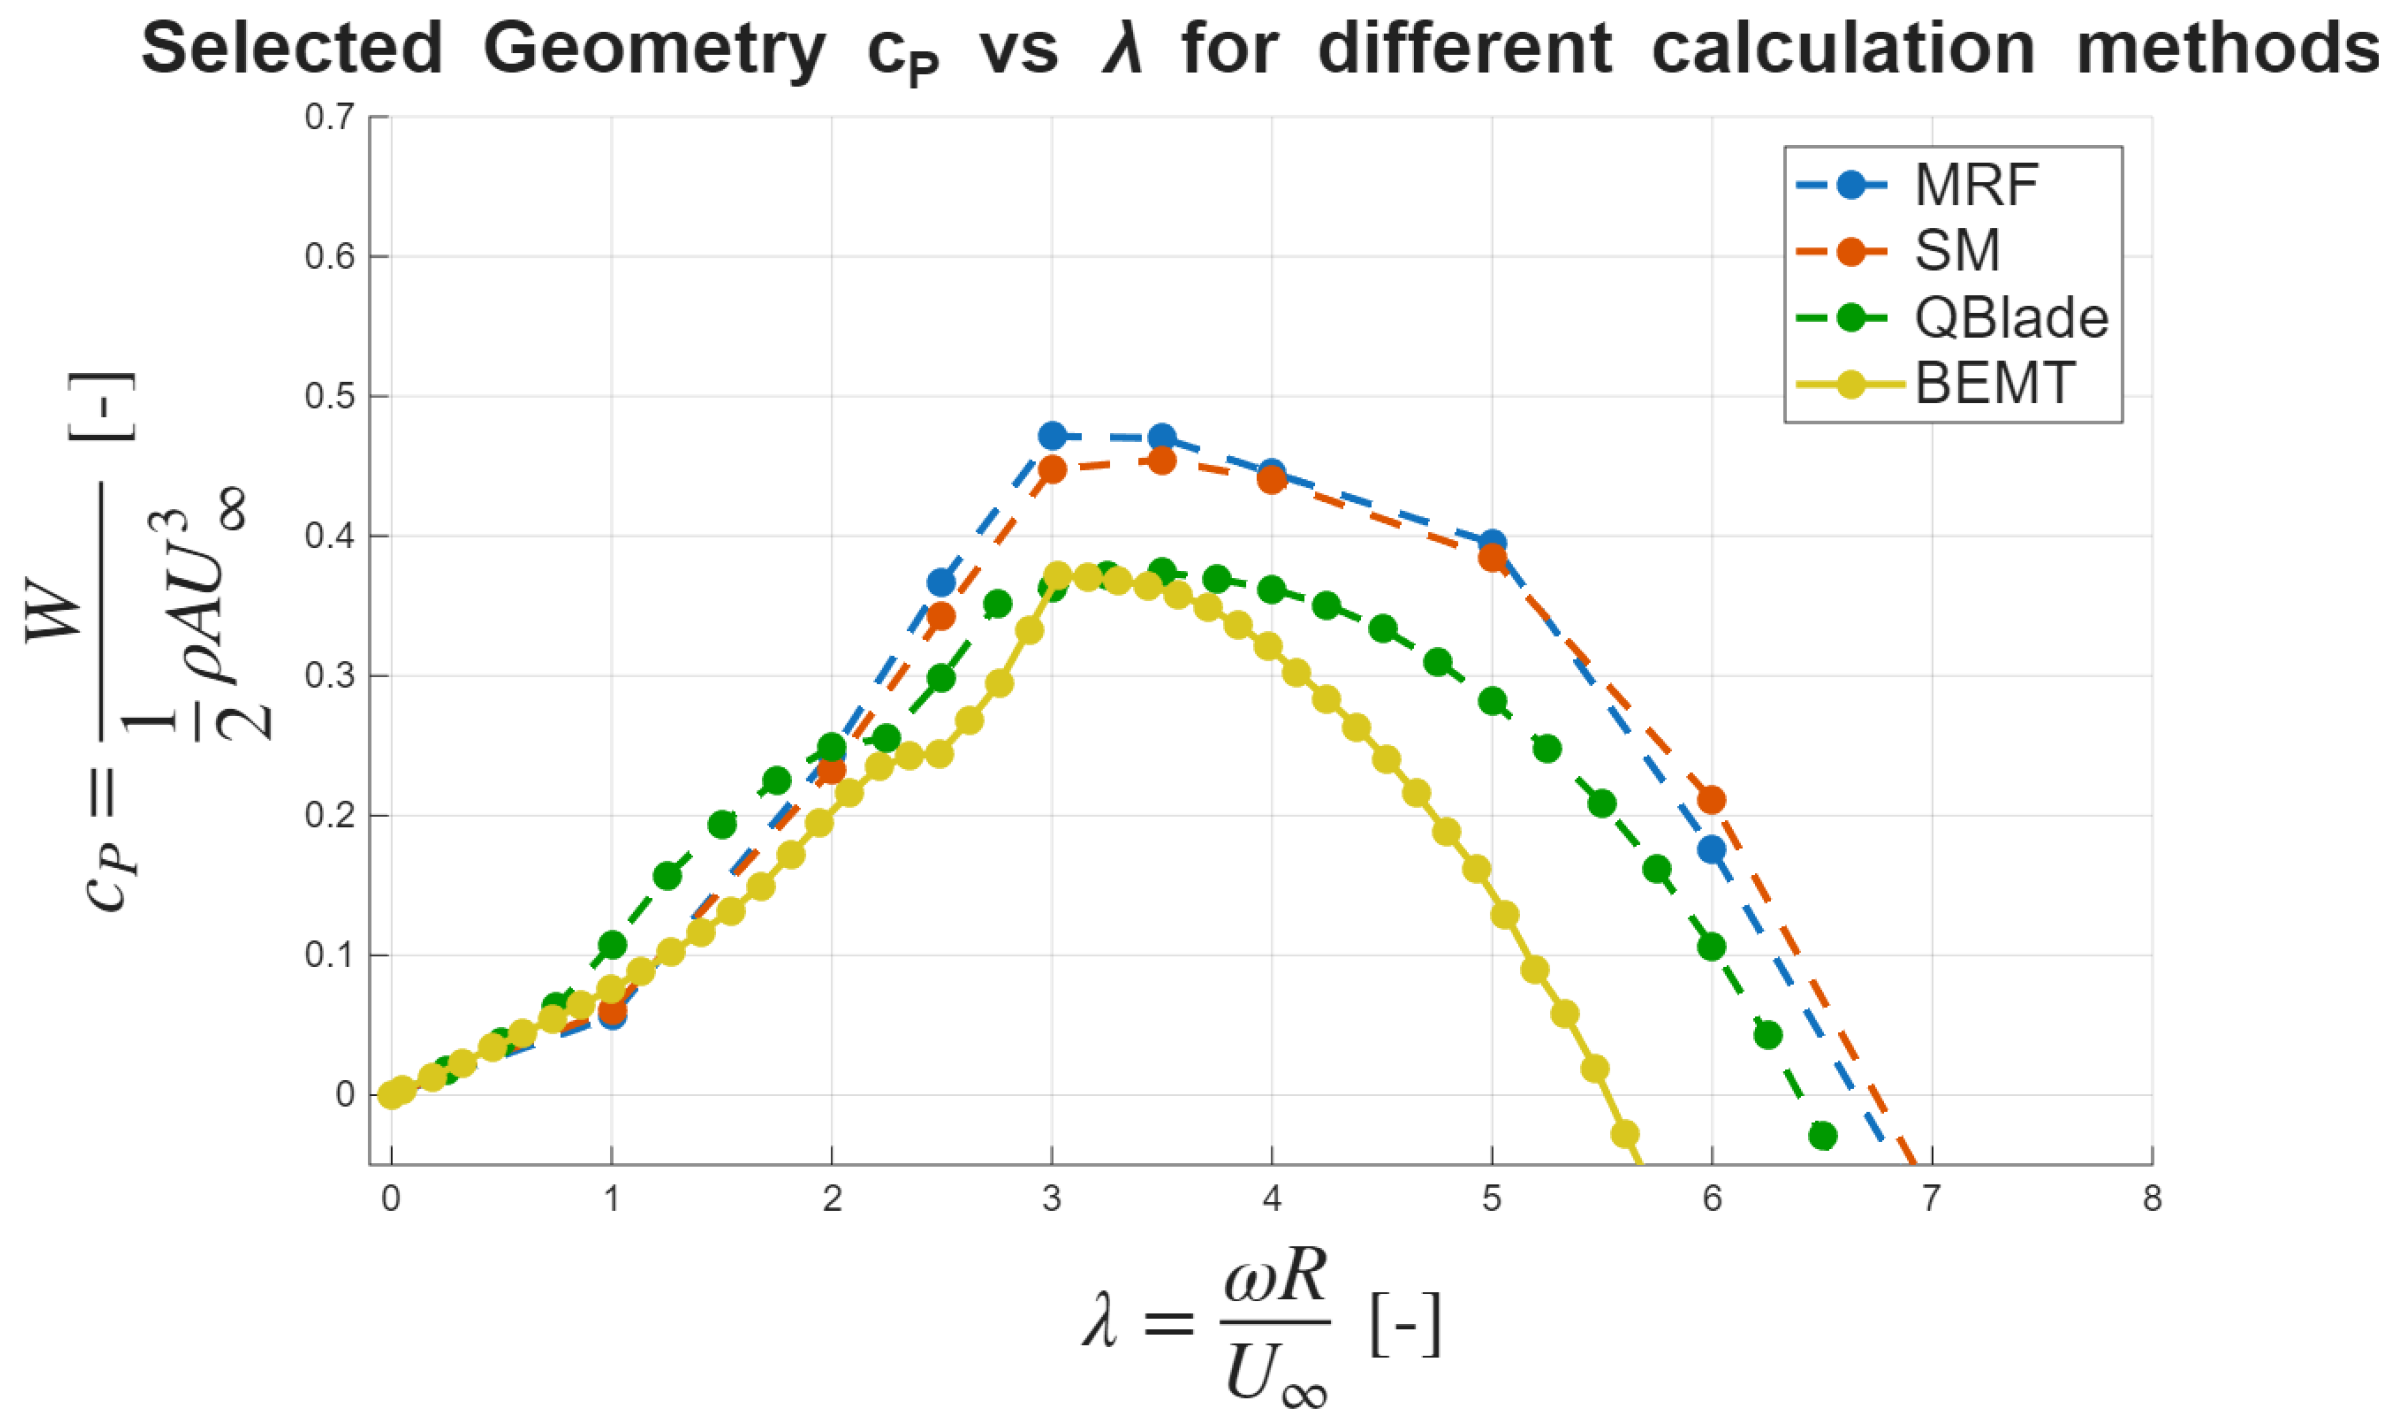
To evaluate the performance and computational cost of the different approaches, a reference blade geometry based on the Bergey BW-3 airfoil, developed by “Bergey Wind Power Co., Norman, OK, USA” for their wind turbines was selected for comparative analysis. This airfoil has been widely used in small-scale wind energy applications by authors such as Shin and Kim [52] or Suresh and Rajakumar [53], and studied as a benchmark case by Selig et al. [54]. The power coefficient characteristics of this blade were calculated using the three methodologies described in Section 2. The comparative results are presented in Figure 7.
Figure 7.
Power coefficient versus tip speed ratio curves for the Bergey blade geometry obtained using different computational methods.
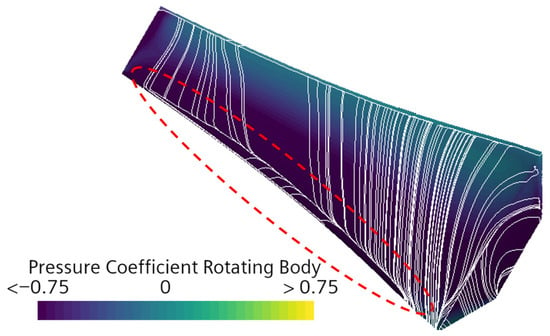
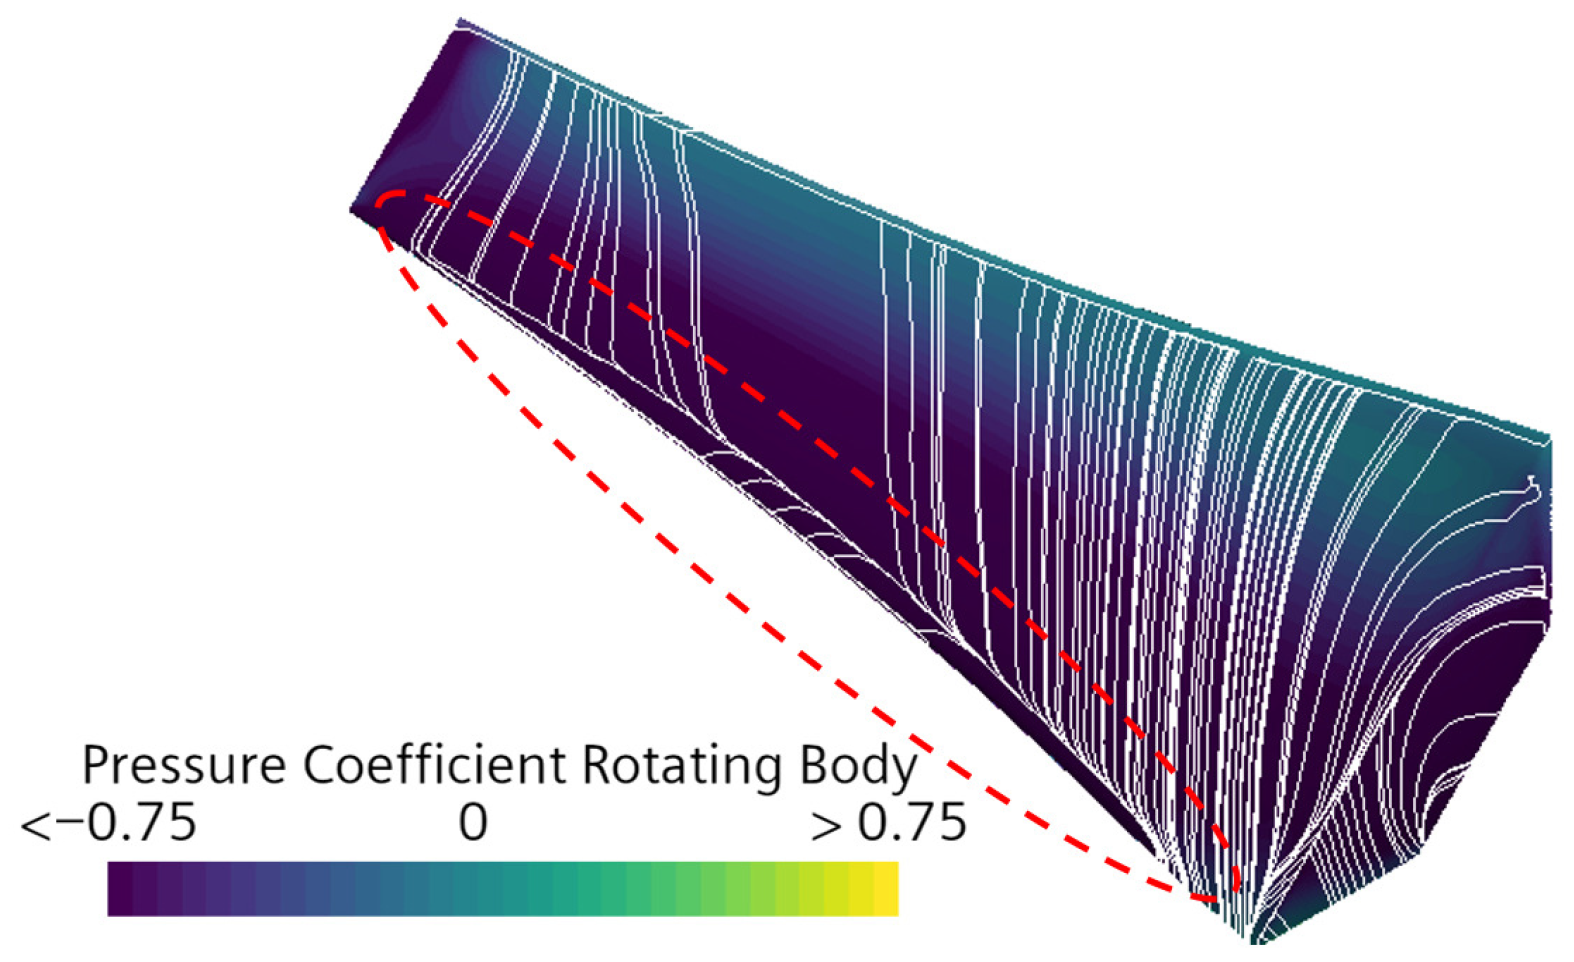
The observed discrepancies between the computational methods can be attributed to three-dimensional flow effects, which are neglected by the BEMT and simplified by QBlade, as observed by Boatto et al. [55]. These effects result in significant differences in the predicted power coefficient distribution and peak value: 23.34% between CFD using MRF and BEMT, and 22.46% between MRF and QBlade, with CFD yielding the highest peak power coefficient. The three-dimensional flow structures responsible for these discrepancies are visualized in Figure 8. The unsteady nature of these flow structures implies that they are resolved differently in unsteady simulations. This, together with a higher-fidelity wake resolution, affects the peak power coefficient, reducing it by 4.08%. This difference is of the same order of magnitude as those reported in the literature by Aular et al. [56].
Figure 8.
Wall shear stress streamlines with pressure coefficient colormap on the suction side of the Bergey blade at . Detachment region highlighted in red.
The three-dimensional effects observed are primarily associated with the phenomenon of rotational stall delay, whereby the airfoil stall condition is postponed due to centrifugal and Coriolis forces acting on the rotating blade. This mechanism has been demonstrated to be relevant in wind turbine applications by Hu et al. [57]. Figure 8 illustrates wall-shear-stress streamlines with pressure coefficient colormap at the design tip speed ratio (). It is observed that the flow detaches from the blade near the leading edge on the suction side, corresponding to the region of maximum suction, and reattaches at higher chord values. This behavior is associated with the formation of a recirculation zone, indicative of complex three-dimensional flow structures. Such flow features enhance suction, leading to higher power coefficients than those predicted by methods that neglect three-dimensional effects, as illustrated in Figure 7. This phenomenon also highlights the limitations of classical BEMT methods used to optimize chord and twist distributions. More accurate optimized designs should account for three-dimensional effects in a more comprehensive manner, for instance, by using CFD as an optimization tool, despite its higher computational cost.
From a computational cost perspective, the steady CFD simulations required an average of 27 h to generate complete power coefficient curves when run on a 15-core cluster, representing a computational cost approximately 810 times higher than that of BEMT or QBlade, which completed the same calculations in approximately 2 min on average using an 8-core laptop. For the unsteady simulations, the computational cost increases drastically, requiring several days to complete a whole curve.
Considering the trade-off between computational accuracy and cost, and acknowledging that the significance of three-dimensional effects has been established, QBlade was selected as the primary computational tool for the numerical campaign on turbine blade airfoil assessment. This decision was based on its substantially lower computational cost compared to CFD, while still considering three-dimensional effects, albeit in a simplified form. For the same reason, when CFD analysis is required, the steady approach using MRF should be used.
3.2. Numerical Campaign Results and Analysis
A numerical campaign to evaluate the suitability of 33 different airfoils for the design of turbine blades was conducted using QBlade, according to the methodology described in Section 2.
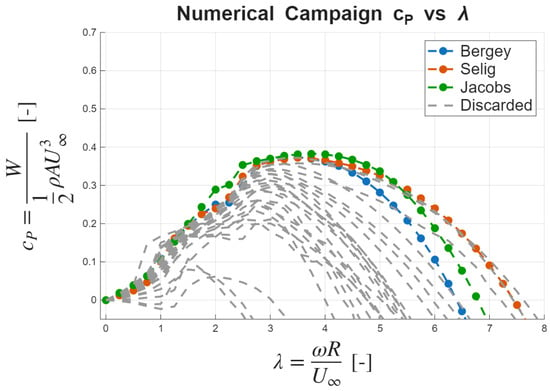
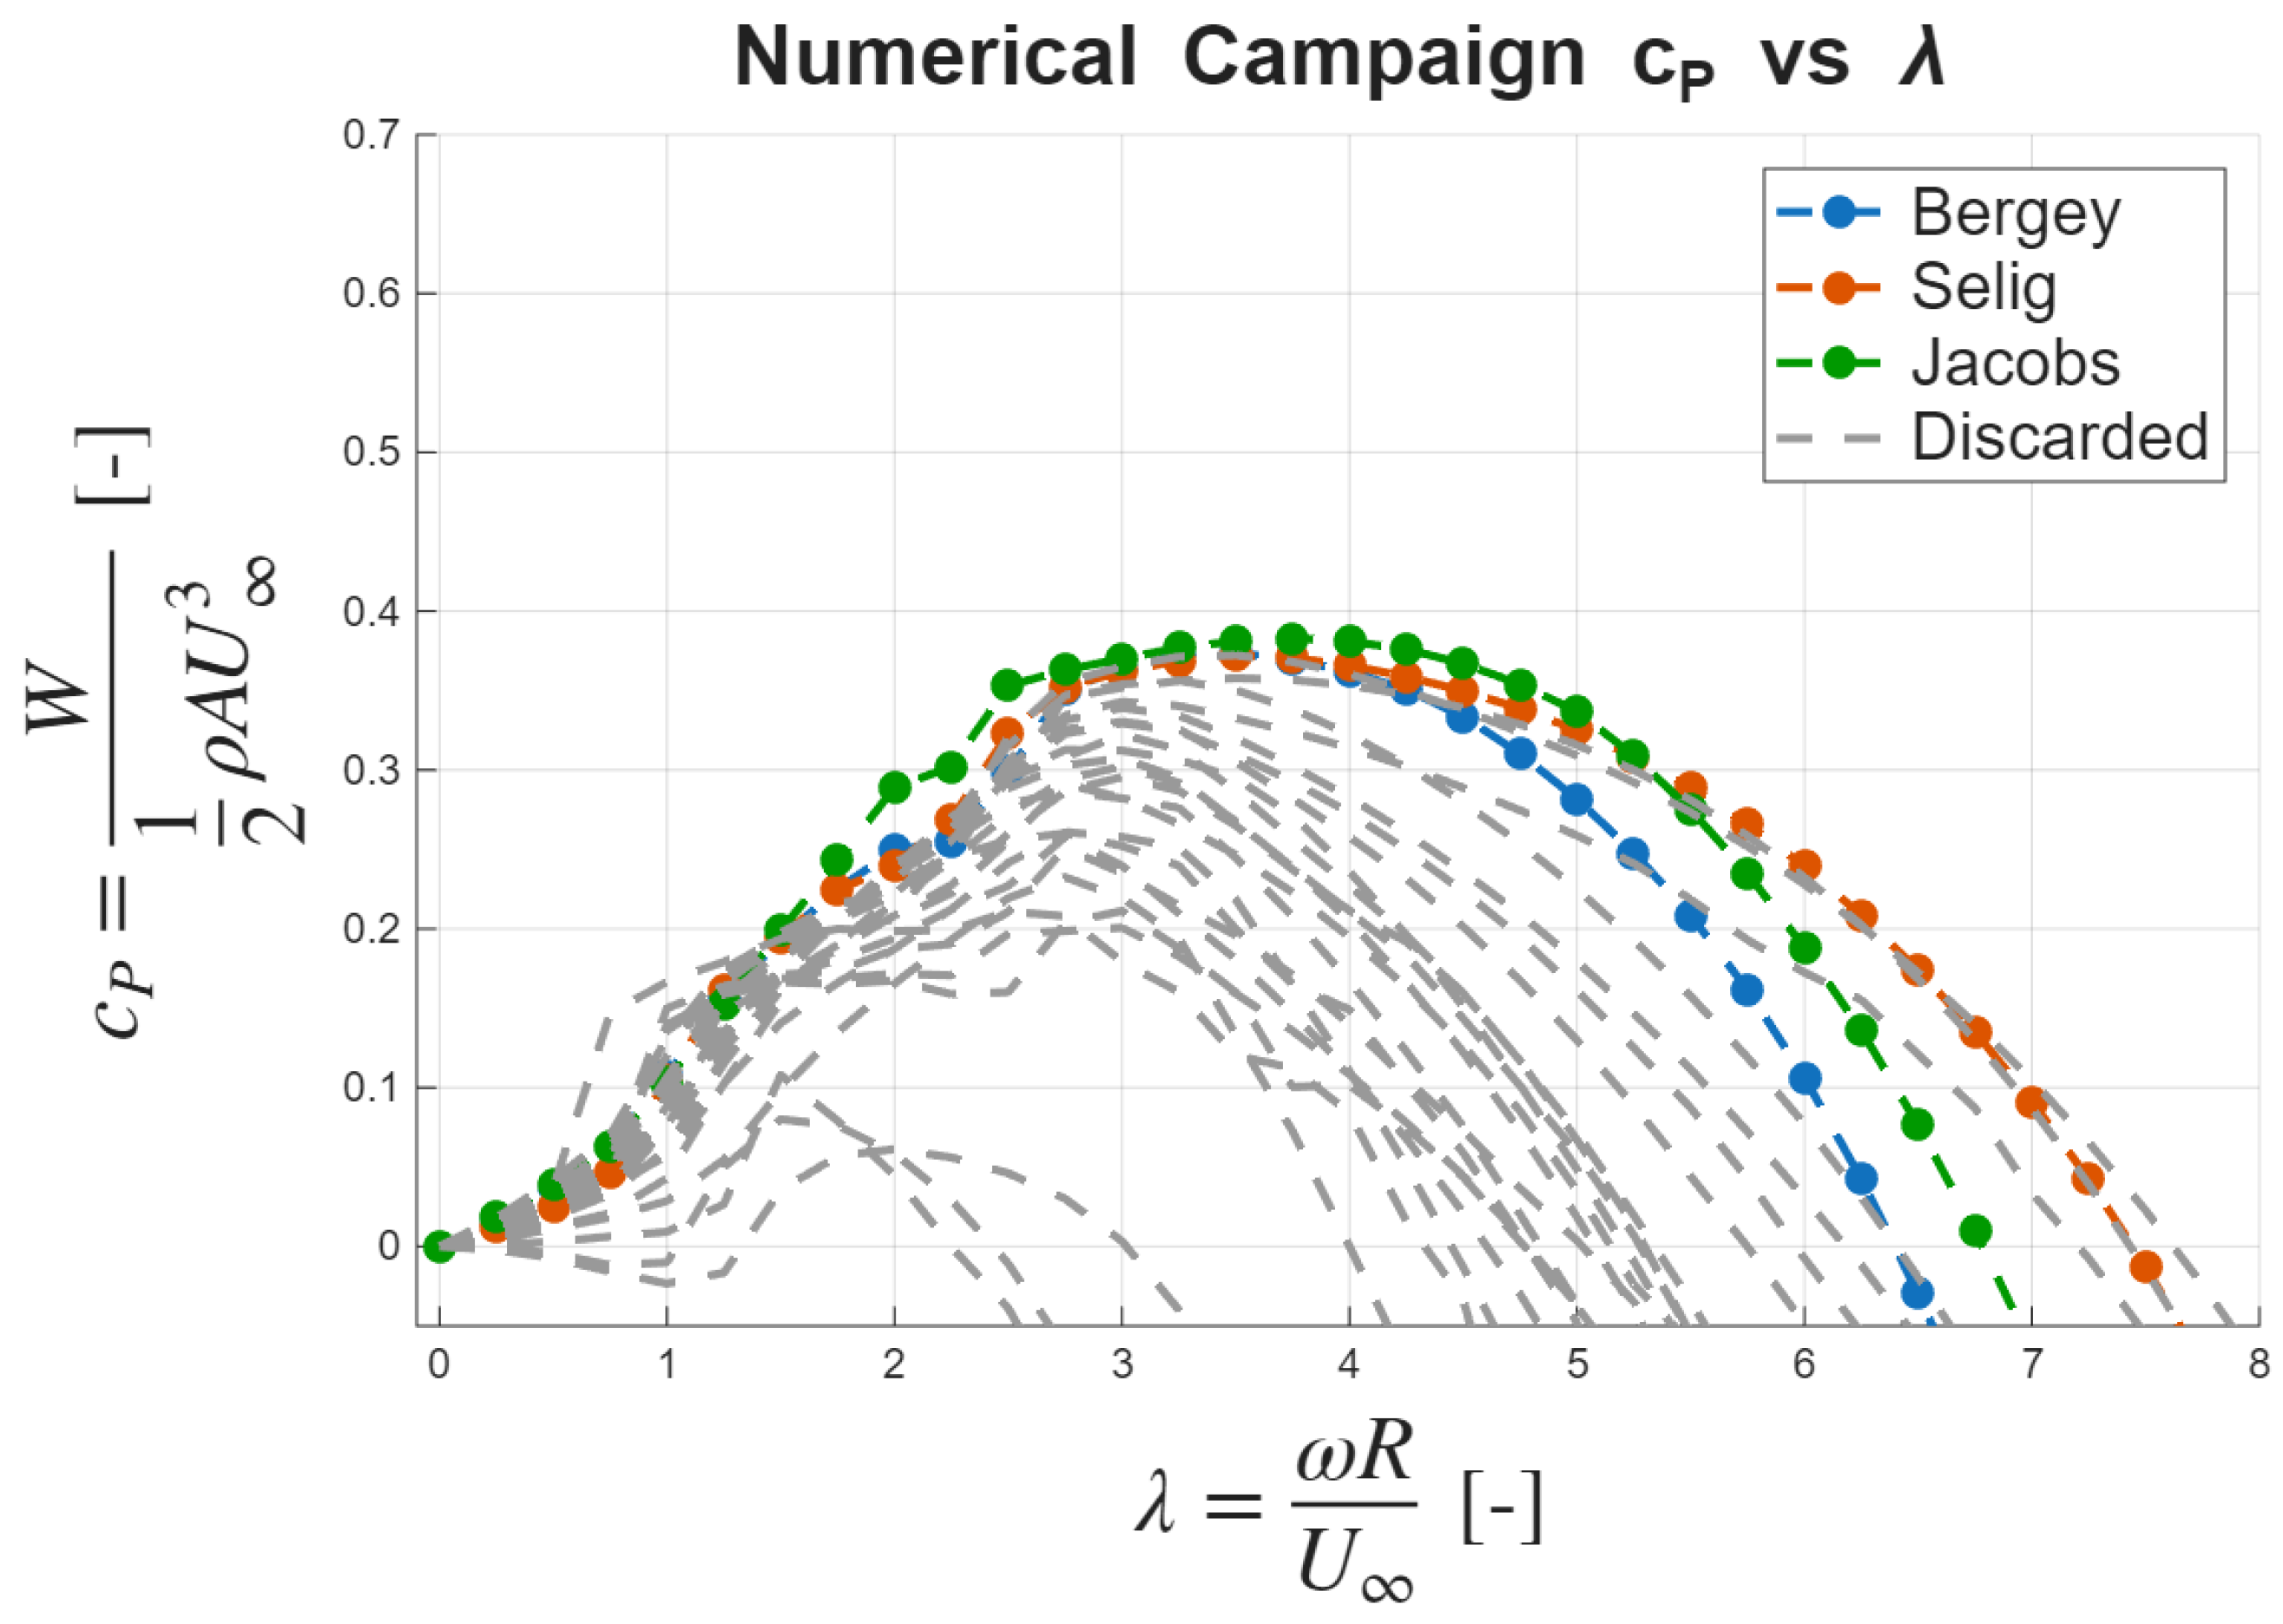
Based on the selection criteria established in the methodology section, the three highest-performing geometries were identified from the campaign results. A peak power coefficient higher than 0.35 was used as a first filter in the selection process. Among these candidates, the options showing a lower stall tip speed ratio were selected. These candidate configurations demonstrate superior aerodynamic performance characteristics based on the criteria previously established, as illustrated in Figure 9.
Figure 9.
Power coefficient versus tip speed ratio curves for the three selected candidate geometries (color) and discarded airfoils (grey).
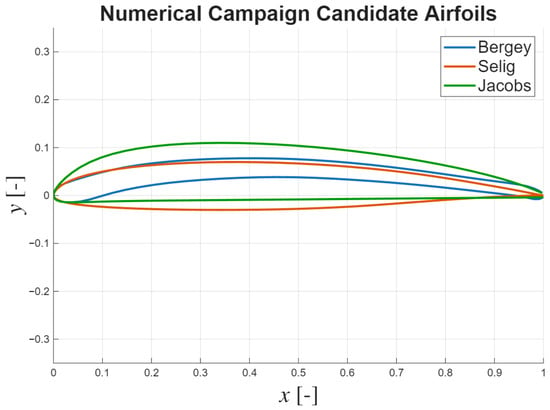
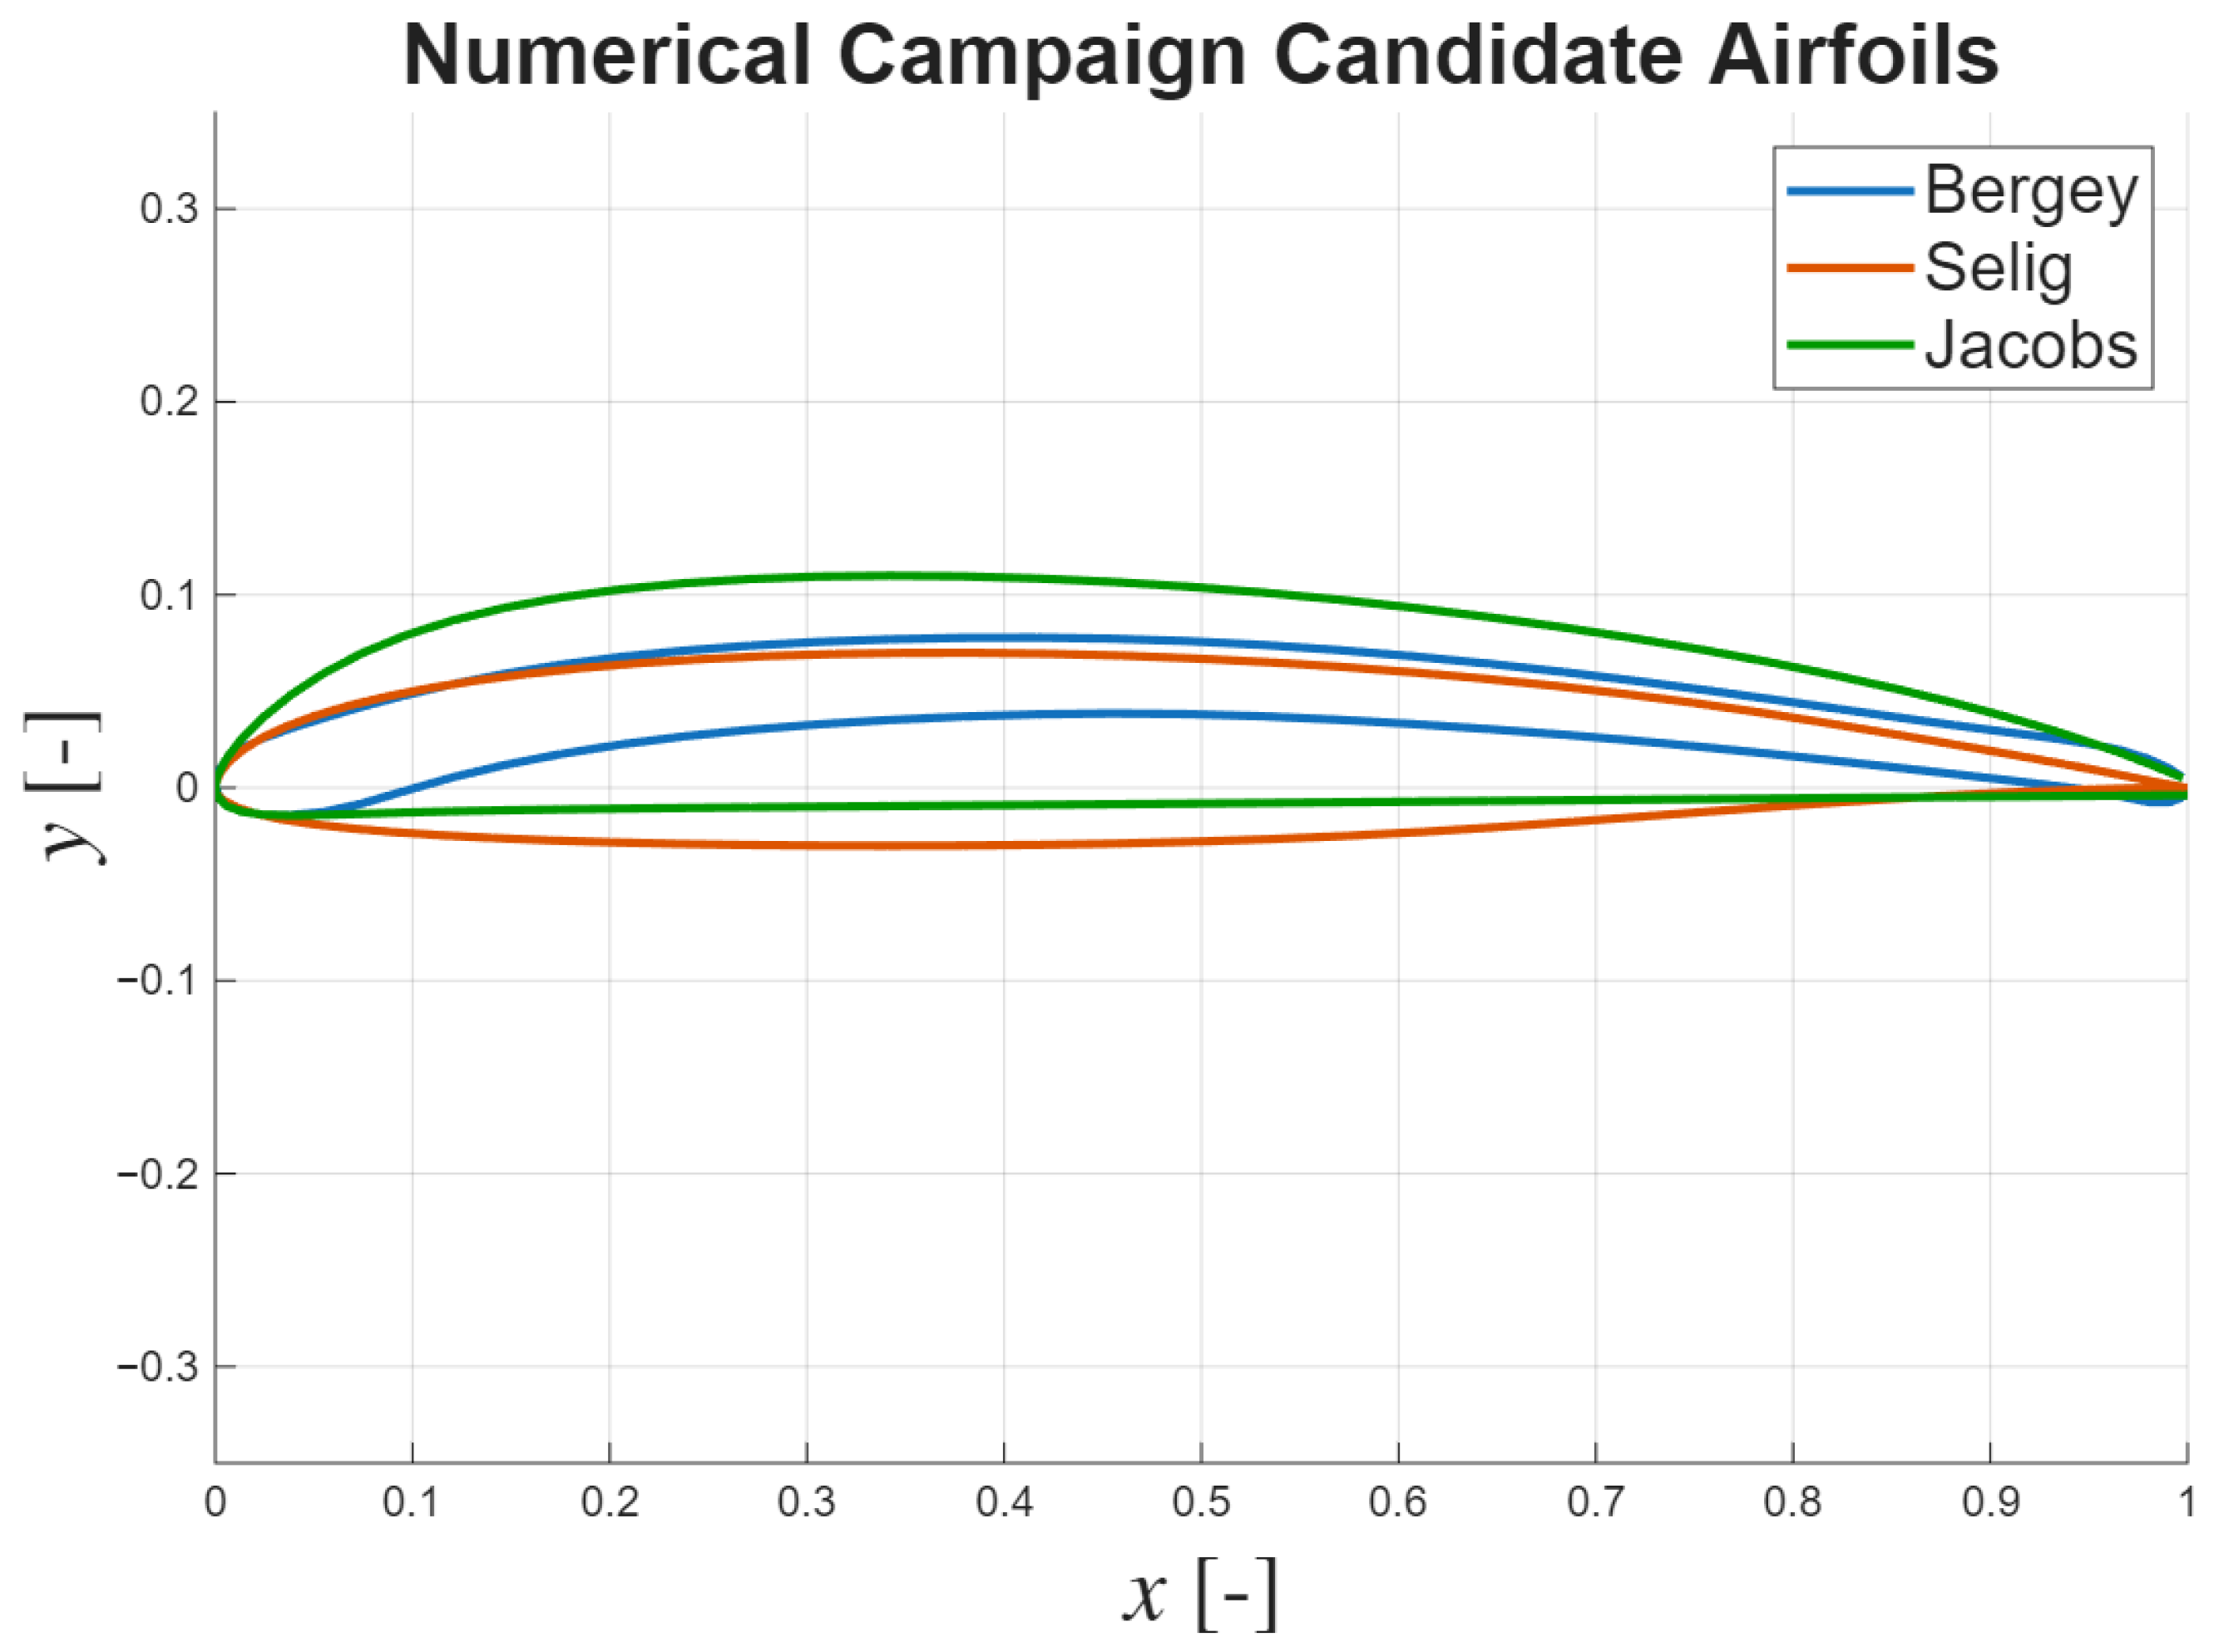
The airfoil profiles corresponding to each candidate geometry are presented in Figure 10. It should be noted that the blade nomenclature refers to the airfoil family employed in each design configuration.
Figure 10.
Airfoil profiles of the three numerical campaign candidate geometries.
3.2.1. Cut-In Wind Speed Analysis
The remaining performance criterion evaluated for the candidate geometries is the cut-in wind speed, with preference given to configurations exhibiting the lowest values.
The lowest cut-in speed was achieved by the Jacobs blade, featuring a USNPS4 airfoil, at 3.10 m/s. The highest cut-in speed was obtained for the Selig blade, featuring a SG6041 airfoil, at 3.59 m/s. The Bergey blade, consisting of the BW-3 airfoil, achieved a cut-in speed of 3.12 m/s.
3.2.2. Final Geometry Selection
Following a comprehensive evaluation of the aerodynamic performance metrics and cut-in wind speed characteristics, the Bergey blade configuration emerges as the selected design candidate. This selection is justified by its performance characteristics, including the lowest stall tip speed ratio, a peak power coefficient similar to those of the other candidates, and competitive cut-in wind speed performance.
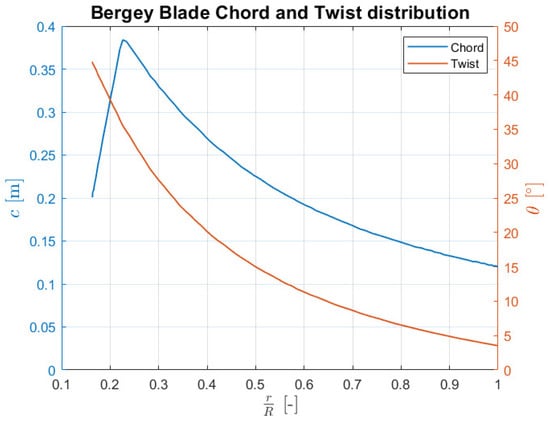
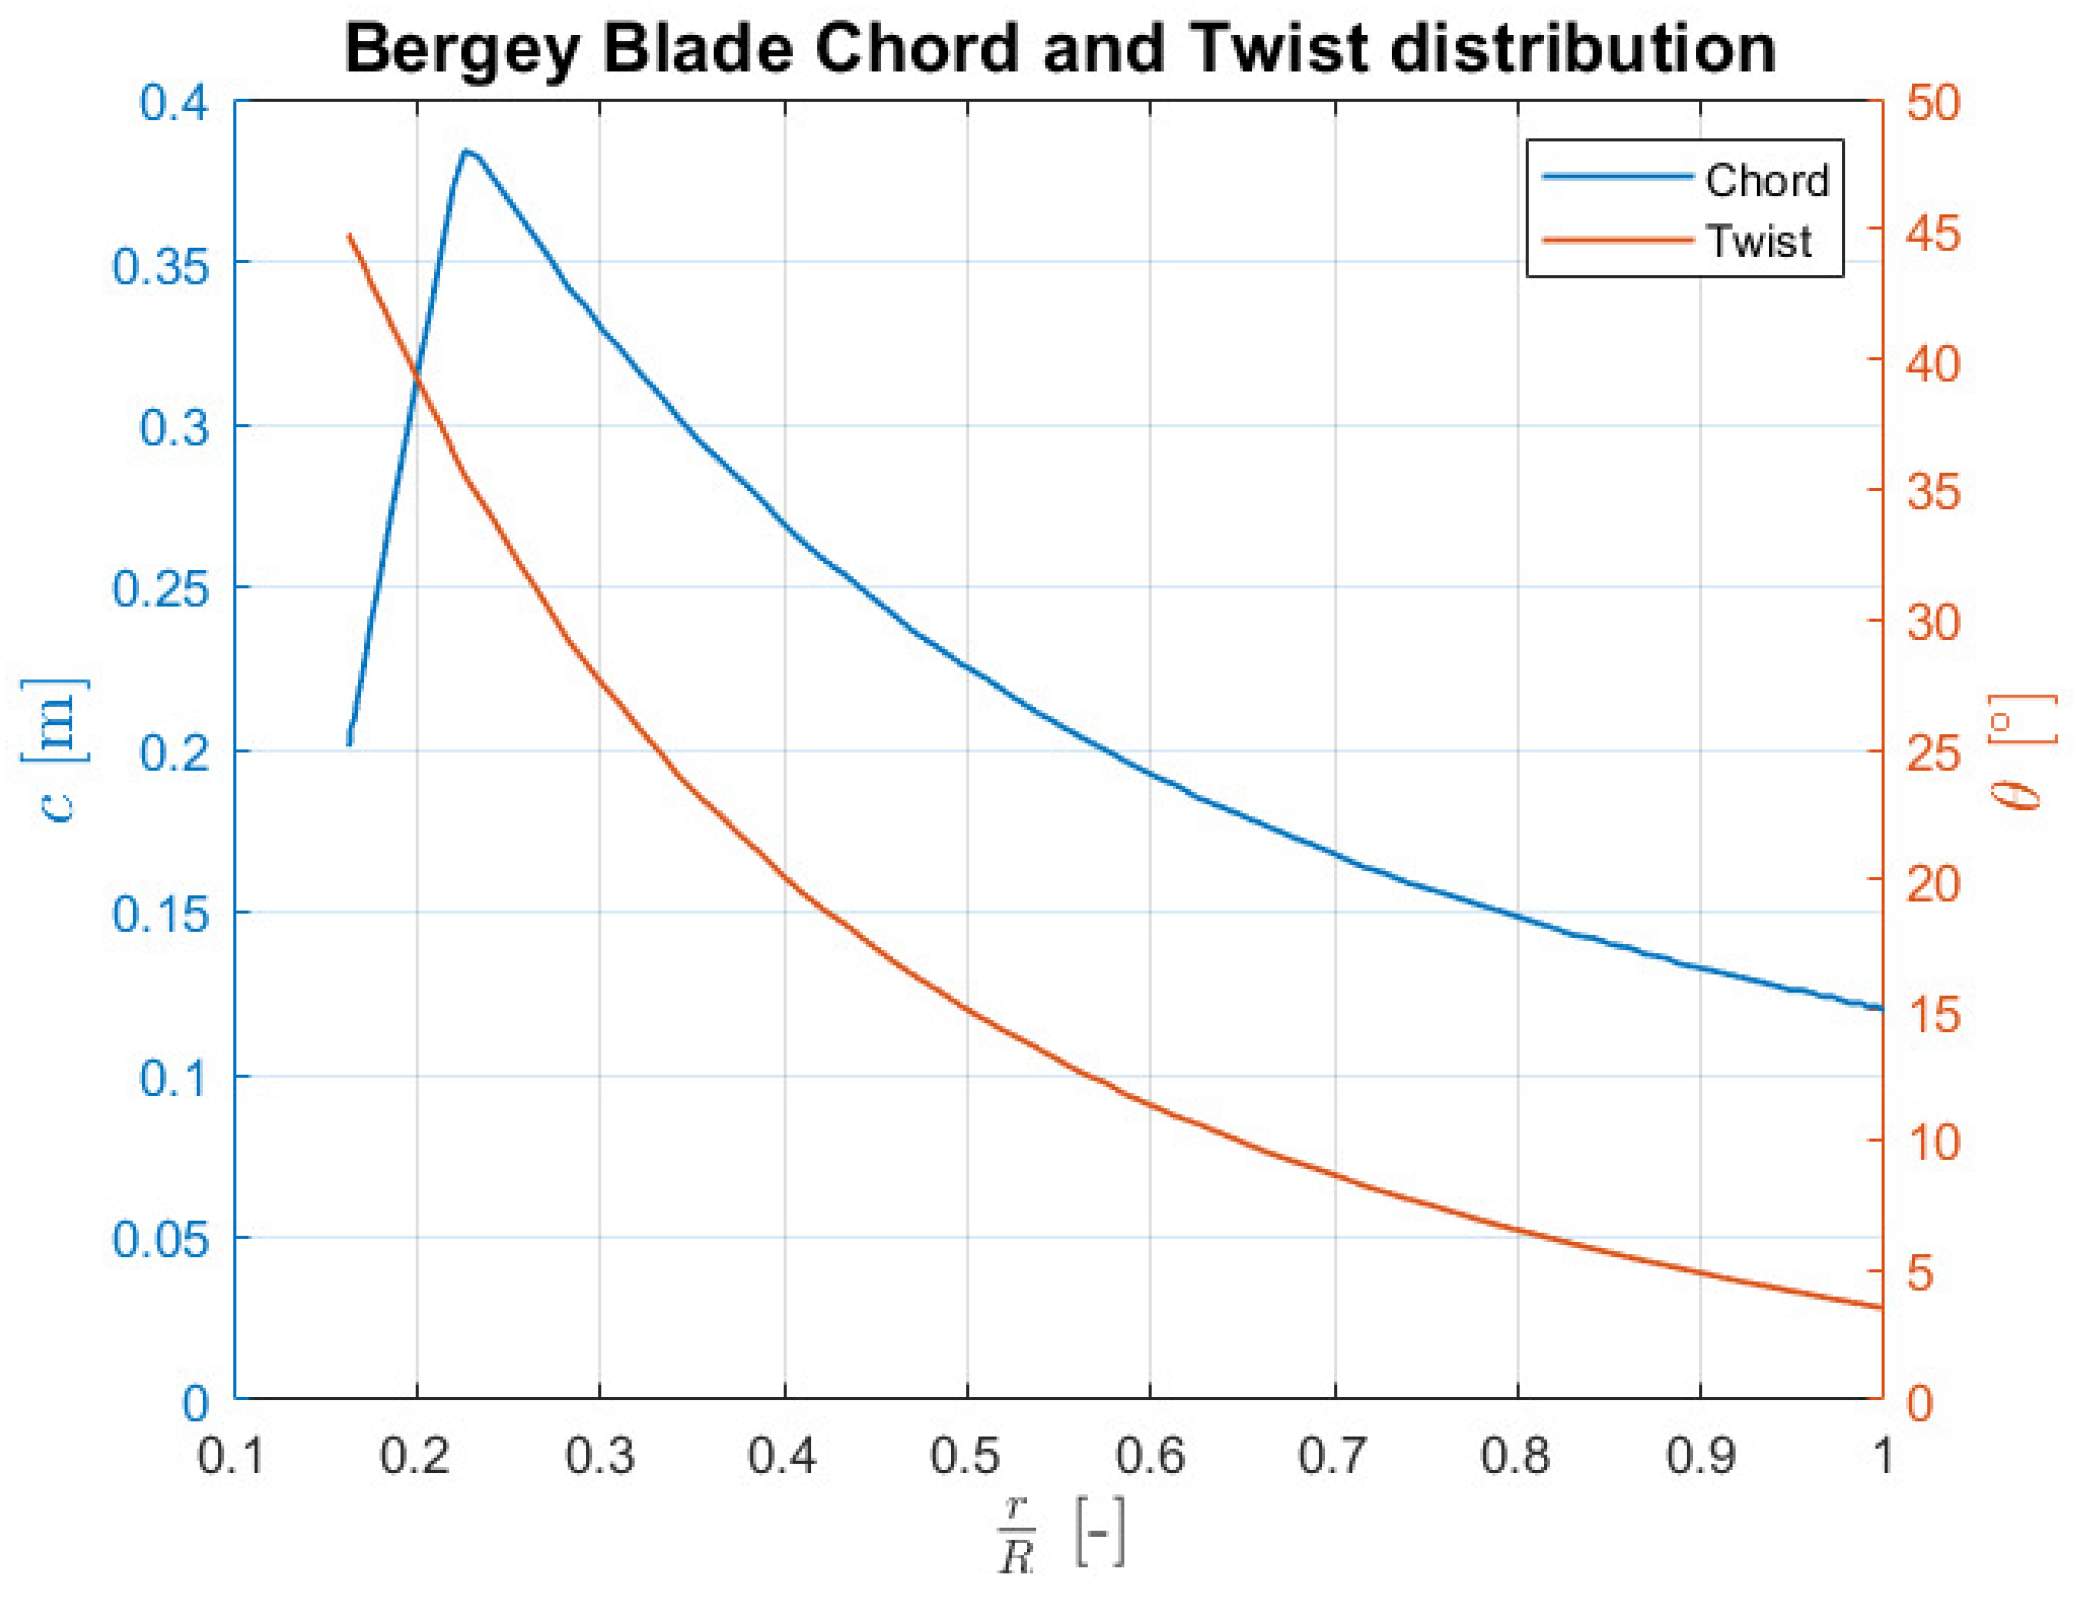
The optimized chord and twist distributions along the blade span, obtained through the QBlade BEMT-based optimization algorithm, are presented in Figure 11. These distributions represent the geometric parameters that maximize aerodynamic efficiency while satisfying the design constraints imposed during the optimization process.
Figure 11.
Chord and twist distributions along the span of the Bergey blade.
3.3. Effects on Performance Due to Endplate Addition
Endplates are flat surfaces attached to the blade tip. Their main objective is to prevent the formation of recirculation vortices at the blade tip, thereby increasing the torque generation and consequently improving the power coefficient.
To enhance the fidelity of the computational simulations, additional geometric features, including a hemispherical nose and a cylindrical nacelle, were incorporated into the model. Preliminary analysis confirmed that these features have a negligible impact on the calculated power coefficient curves, while providing a more realistic representation of the complete turbine geometry.
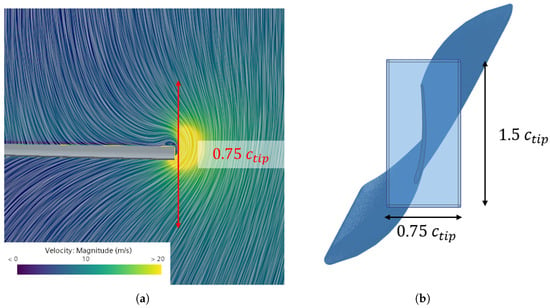
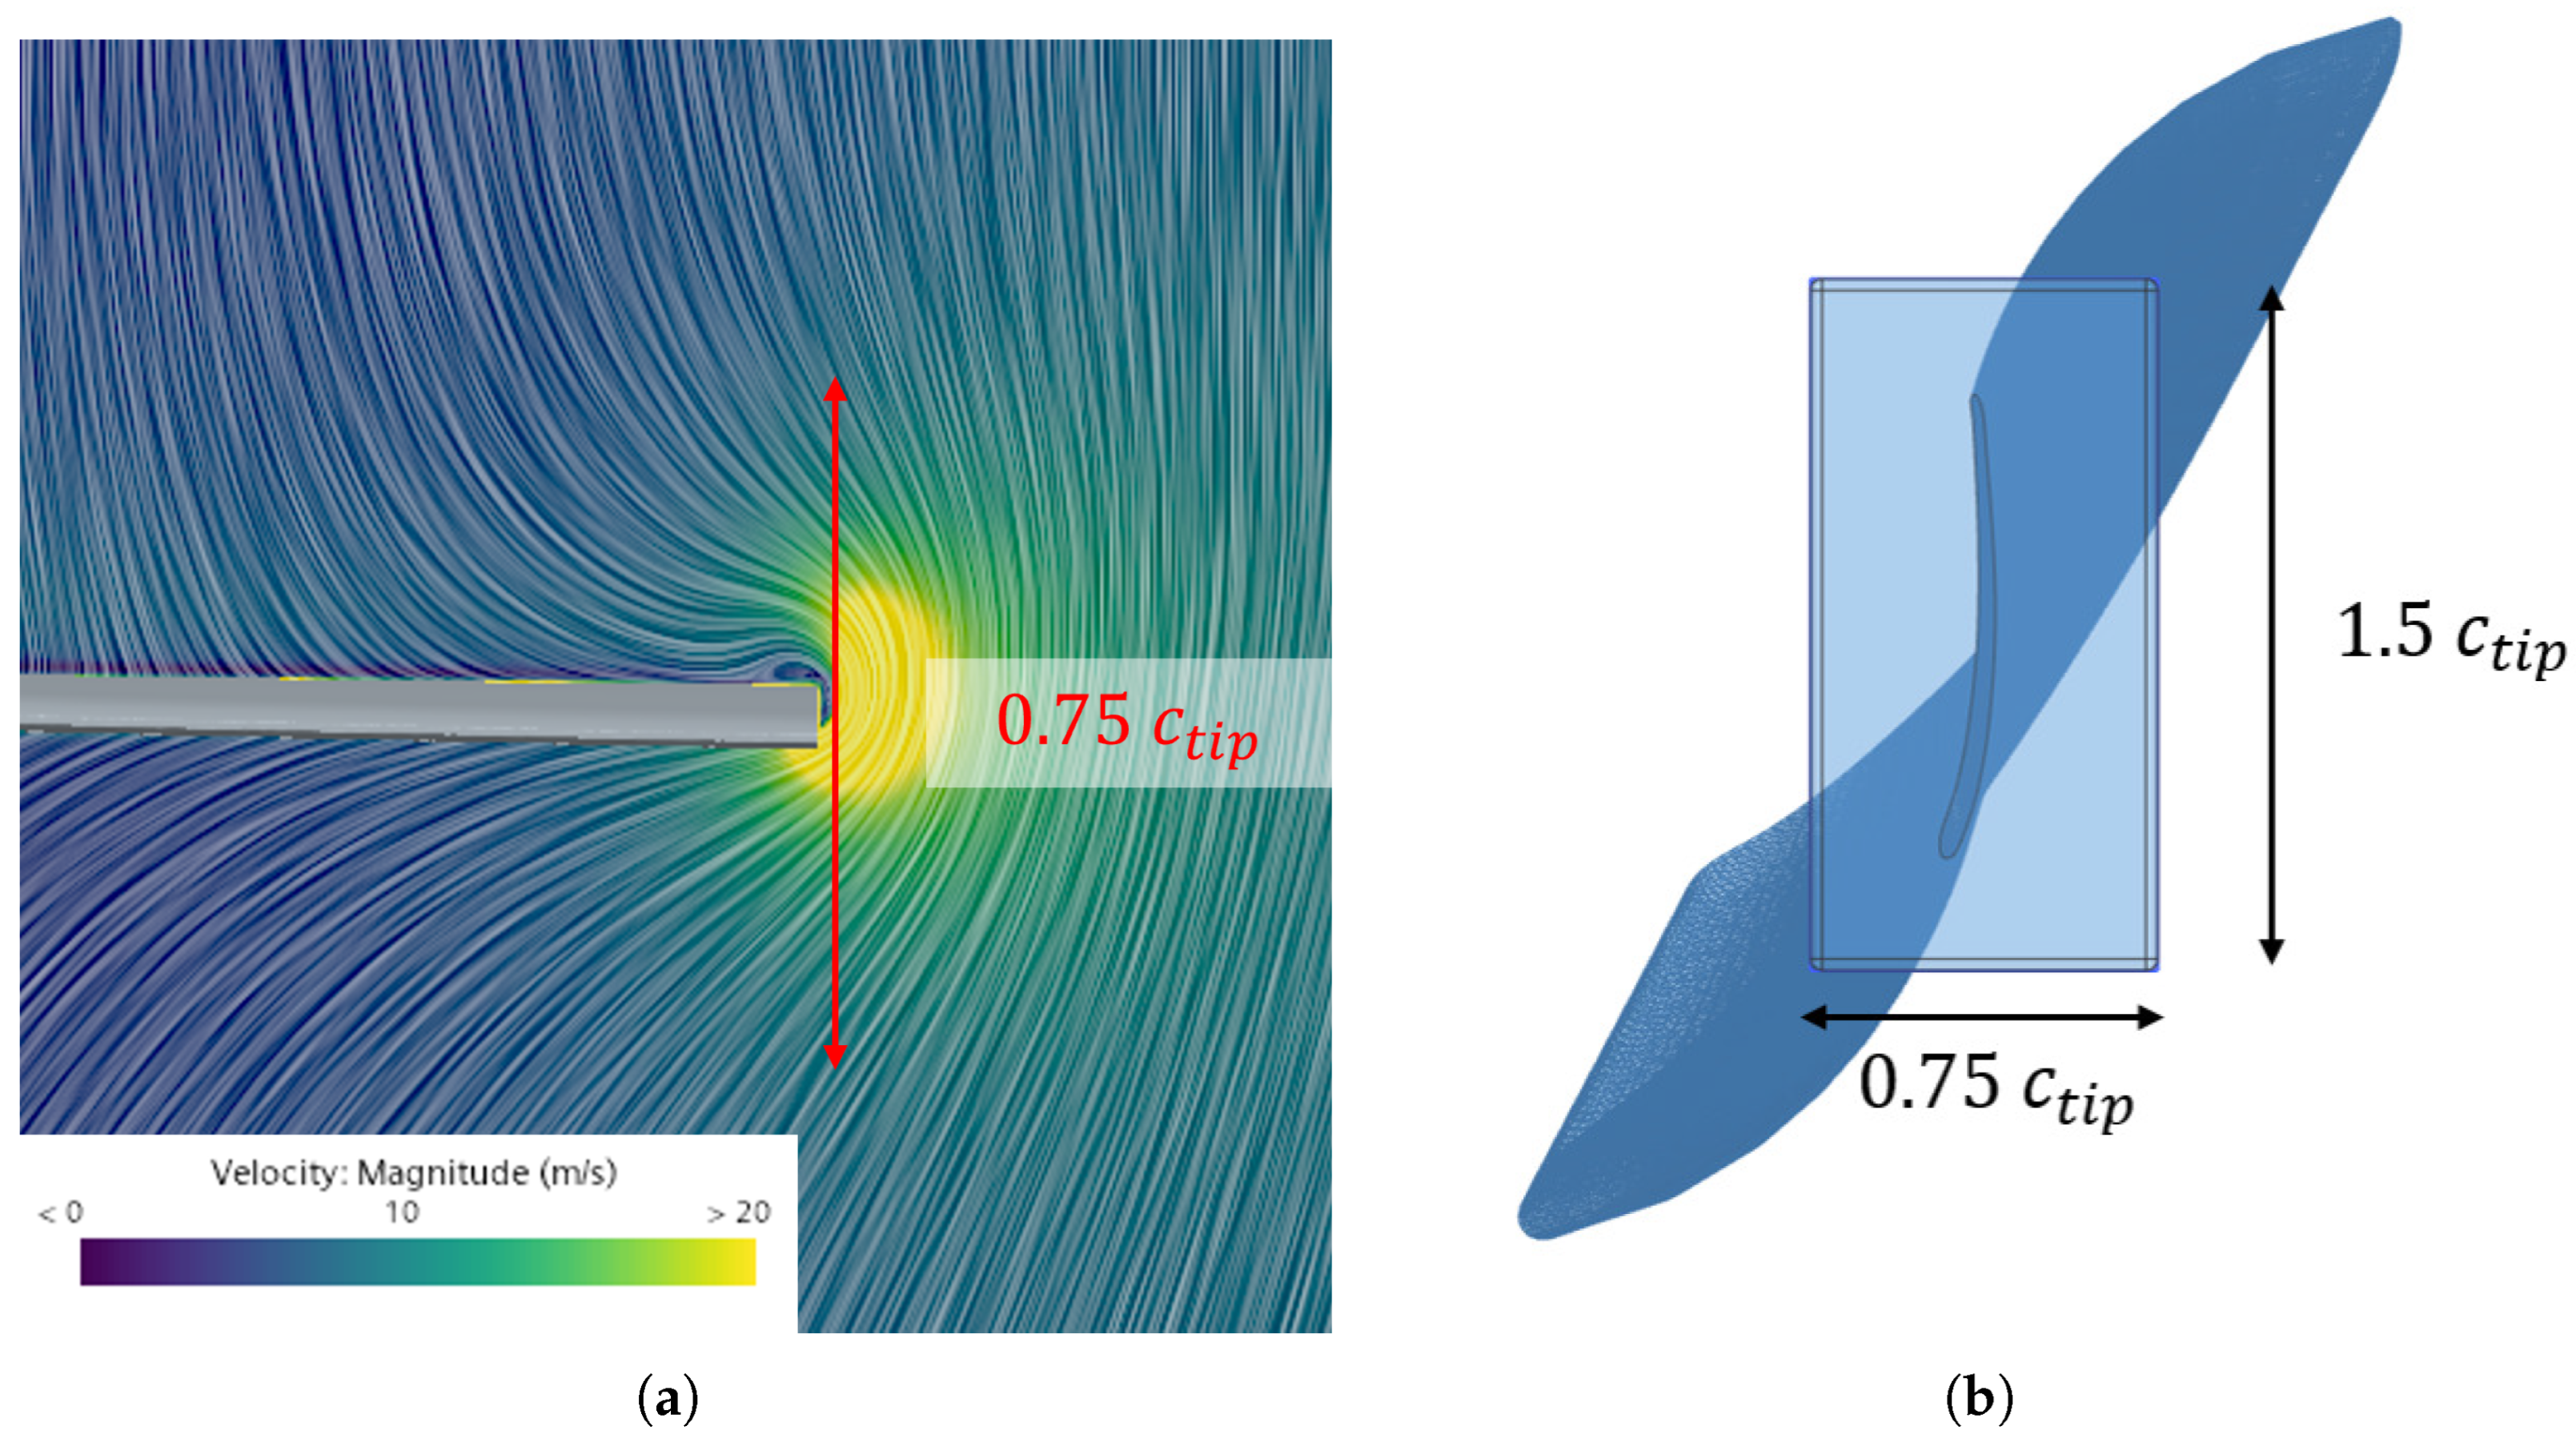
Since the primary purpose of the endplates is to prevent wingtip recirculation, the velocity contour on a spanwise plane, shown in Figure 12a, is used to estimate the minimum required size. The dimensions of the endplates employed are illustrated in Figure 12b.
Figure 12.
(a) Velocity field at spanwise plane at with endplate dimension remarked in red. (b) Endplate geometric specifications.
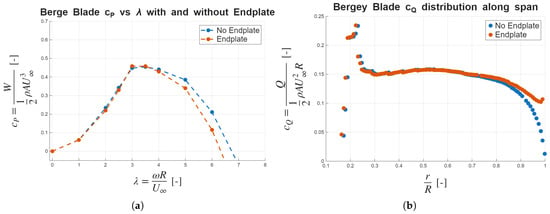
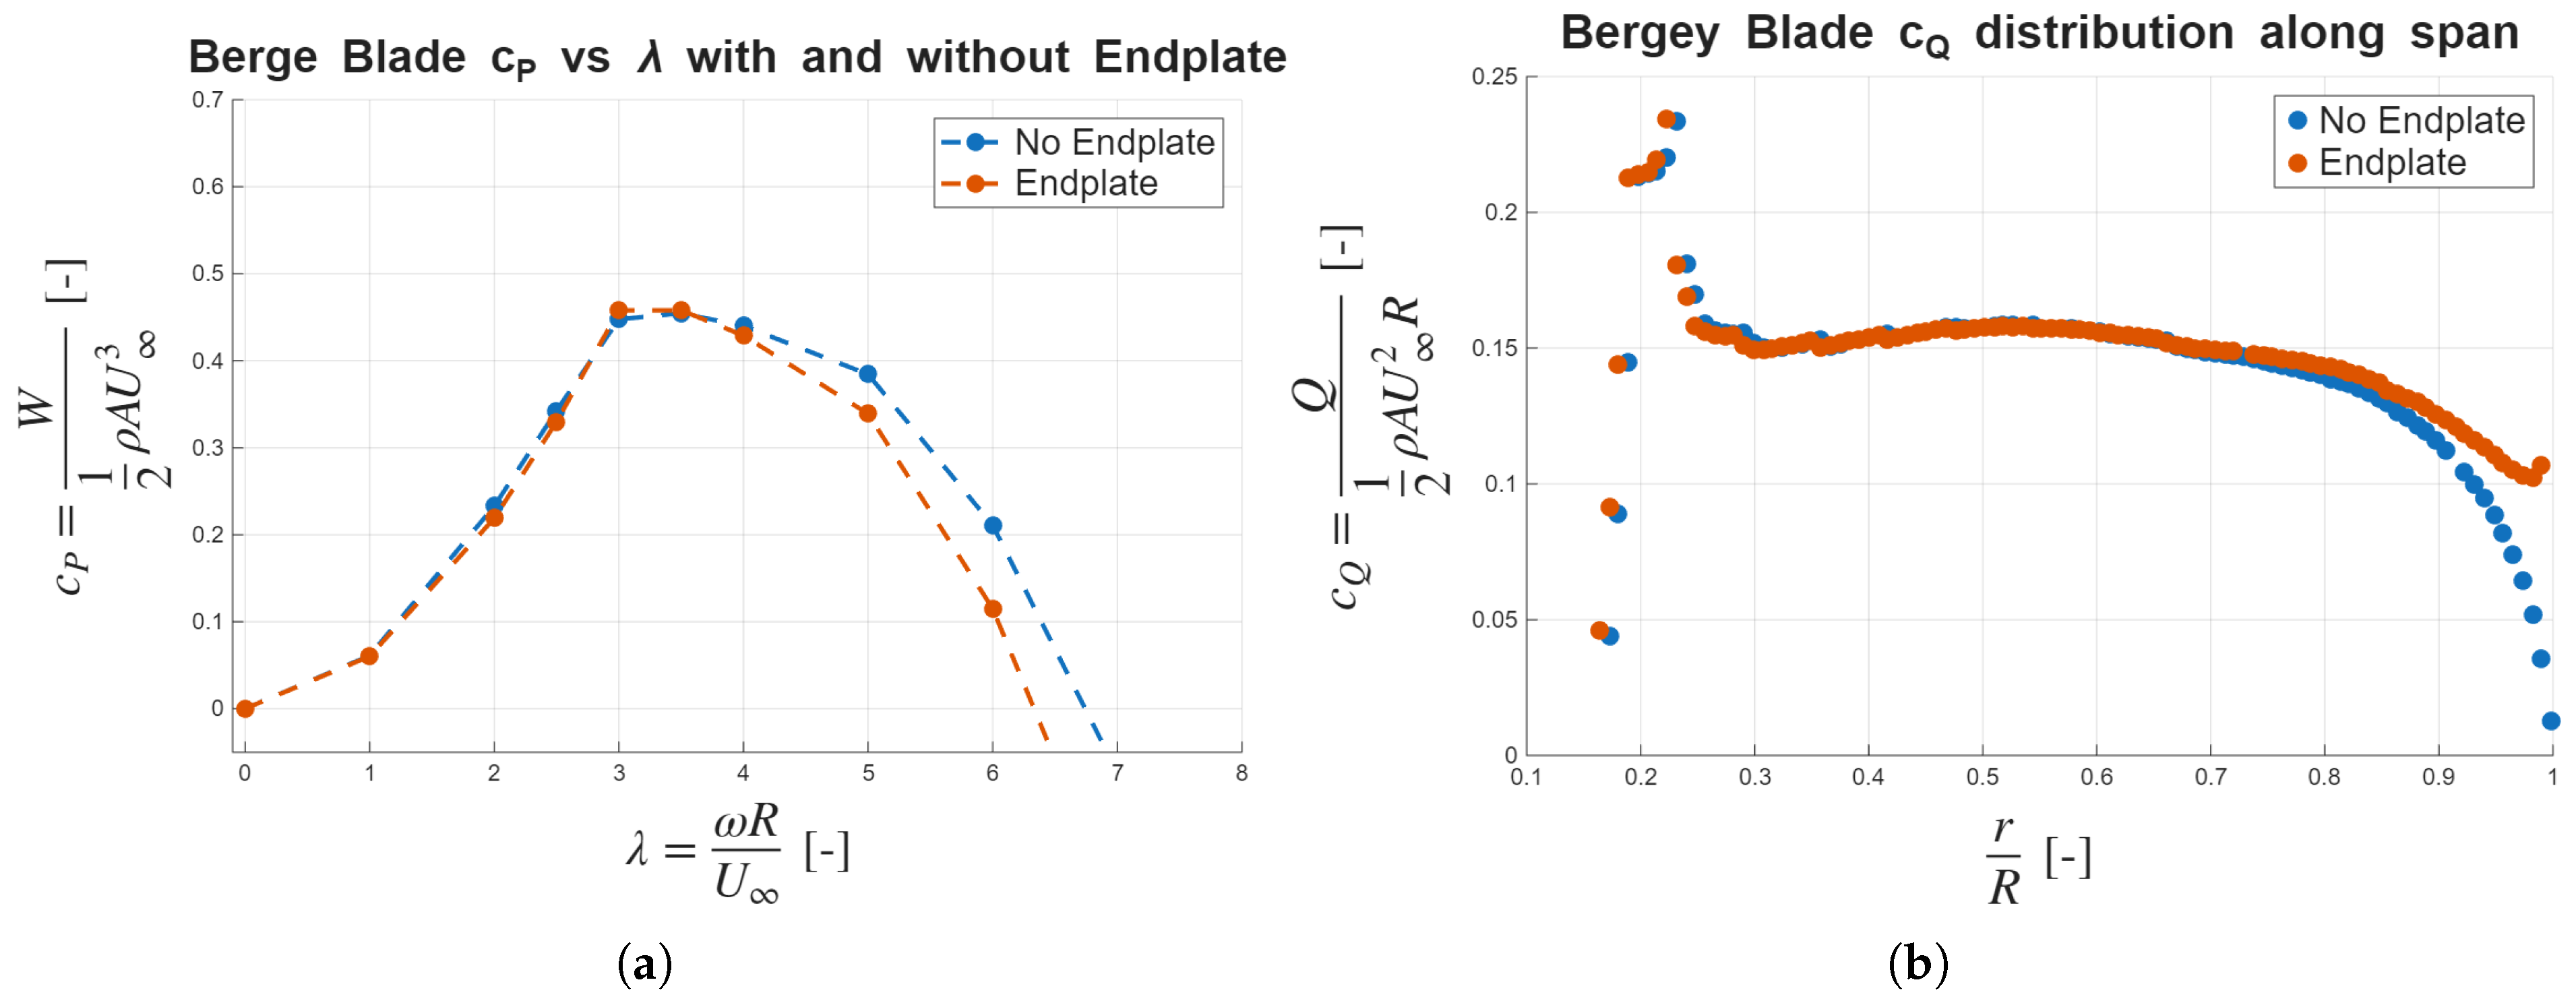
The aerodynamic impact of the endplate implementation on the power coefficient characteristics is presented in Figure 13. The results demonstrate significant modifications in the turbine operational behavior across different tip speed ratios.
Figure 13.
(a) Power coefficient versus tip speed ratio curves for the Bergey blade with different wingtip configurations. (b) Spanwise distribution of torque coefficient for different wingtip configurations at .
The most notable effect observed is the increase in the negative slope in the power coefficient curve for tip speed ratios exceeding the design value. This characteristic is advantageous from a safety perspective, as it reduces the maximum achievable rotational velocity. Additionally, the endplate configuration results in an increase in the peak power coefficient of 2.3%. The increase in peak power coefficient provided by the endplate is of the same order of magnitude as other tip treatments reported in the literature by Kaya et al. [29] and Khaled et al. [30], which range from 2% to 8% for more complex options. However, the effects on the power coefficient distribution are not observed with other types of wingtip configurations. Regarding the cut-in speed, there are no relevant changes. It is important to consider that adding an endplate would mean an increase in inertia, so the cut-in speeds could be increased.
In order to discard the impact of numerical error in peak power coefficient increase, the simulations were re-run using a finer mesh, with approximately 24 cells. This refined simulation shows an increase of 2.61% in peak power output compared to the case without an endplate, similar to the previously reported 2.3% increase with the original 6 cells mesh. Moreover, several flow analyses are performed to explain the observed increase in power coefficient. Firstly, the torque coefficient along the radius is shown in Figure 13, indicating an increase in the torque generated towards the tip when adding the endplate.
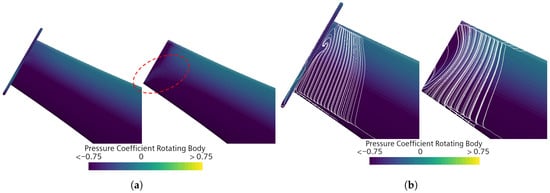
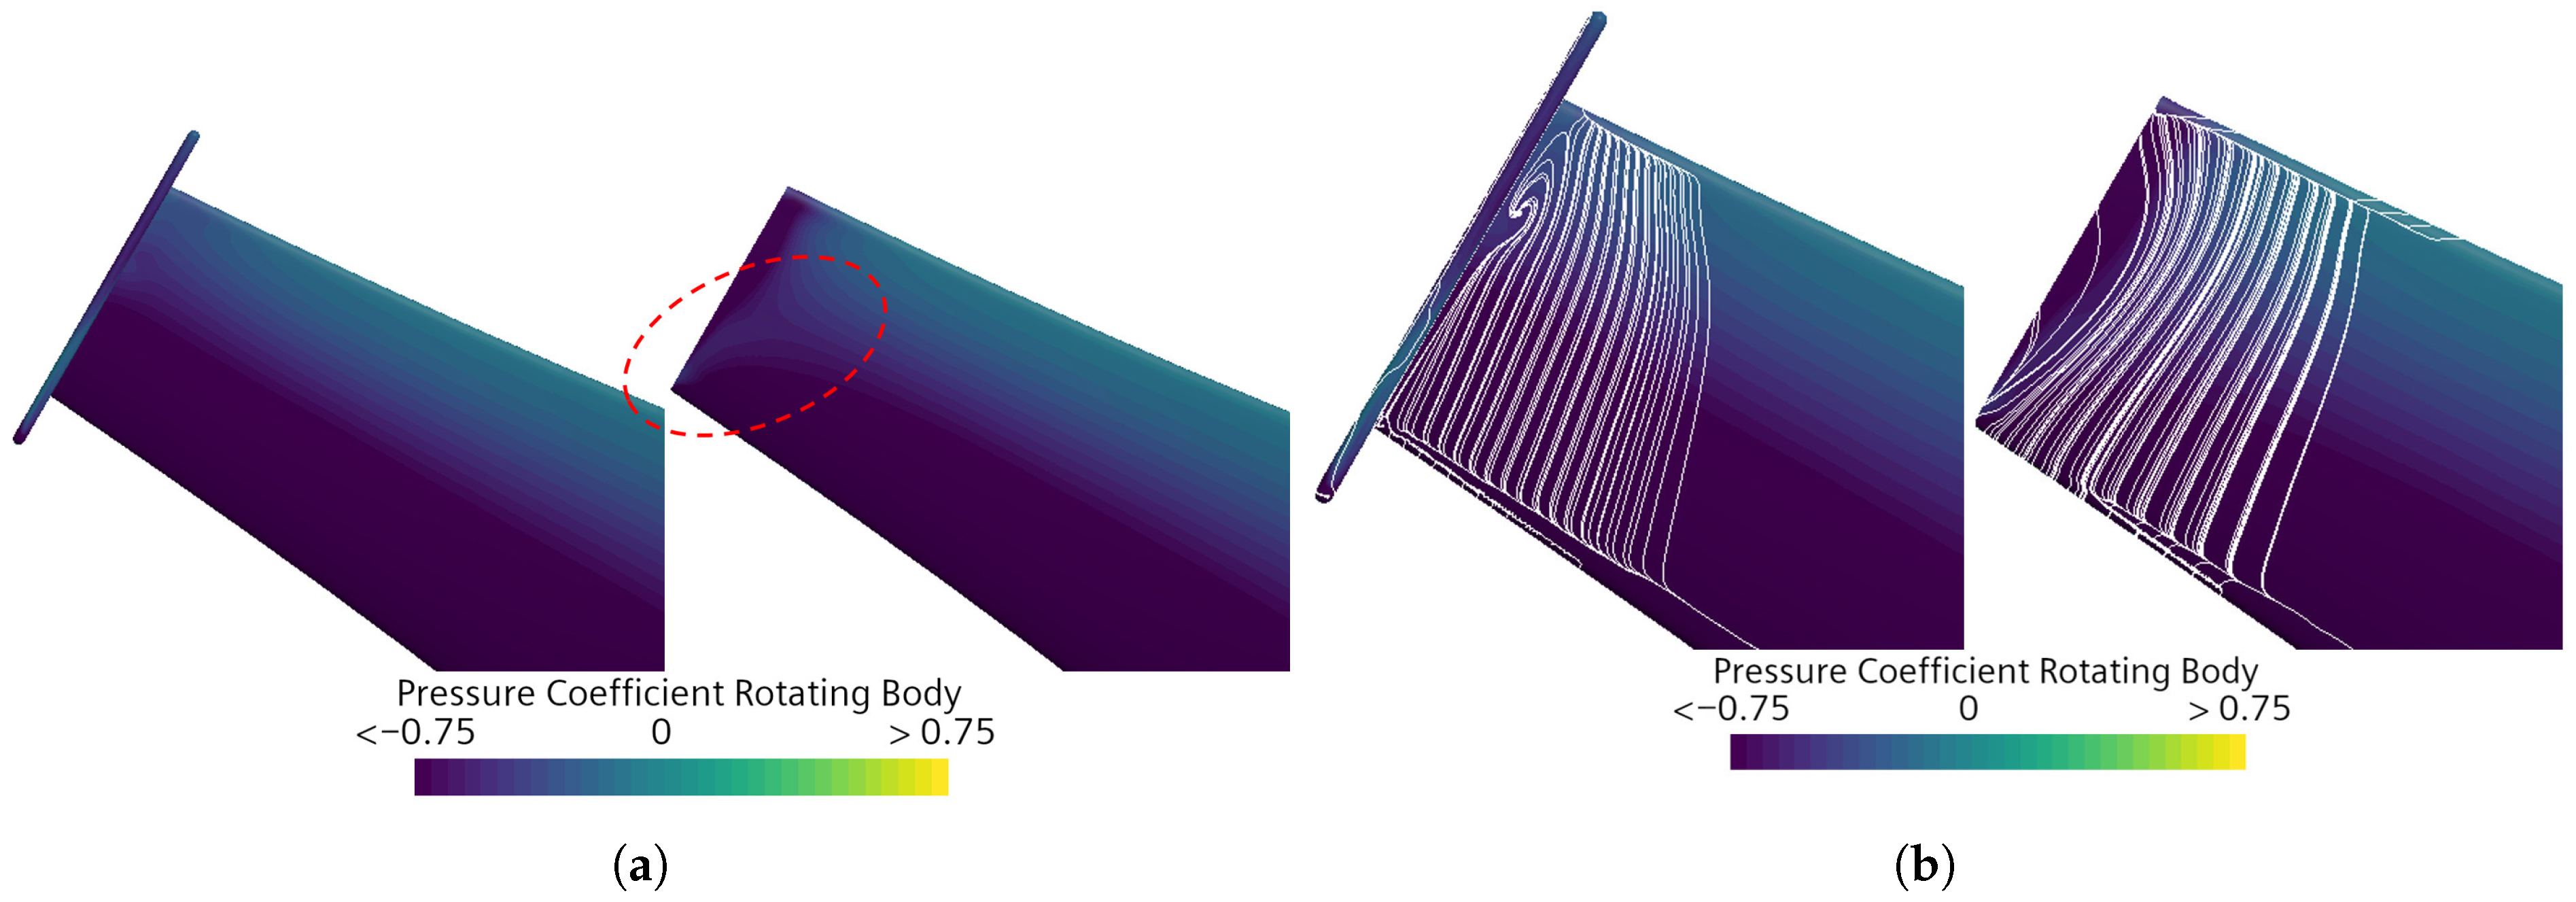
The enhanced torque generation is further corroborated by the pressure coefficient distribution analysis on the blade suction surface, as shown in Figure 14, where an increase in suction can be observed. The observed improvements in both pressure coefficient and tip torque generation are attributed to the endplate’s ability to suppress tip vortex formation at the blade tip, effectively relocating the vortical structures to the upper region of the endplate. This phenomenon can be visualized through wall-shear-stress streamlines superimposed on the pressure coefficient distribution already shown, as presented in Figure 14, showing that the flow remains attached along the entire blade when an endplate is added.
Figure 14.
(a) Pressure coefficient distribution at the tip of the blade suction side with (left) and without (right) endplate at . Main differences highlighted in red. (b) wall-shear-stress streamlines with pressure coefficient colormap at the tip of the blade suction side with (left) and without (right) endplate at .
These visualizations demonstrate that the endplate size is a critical factor in its performance. Undersizing the endplate could result in decreased efficiency due to the proximity of tip vortices to the blade surface, negatively impacting aerodynamic performance. Conversely, oversizing the endplate could introduce unnecessary structural loads due to increased weight without providing additional aerodynamic benefits, as the tip vortex effects on the blade would remain unchanged.
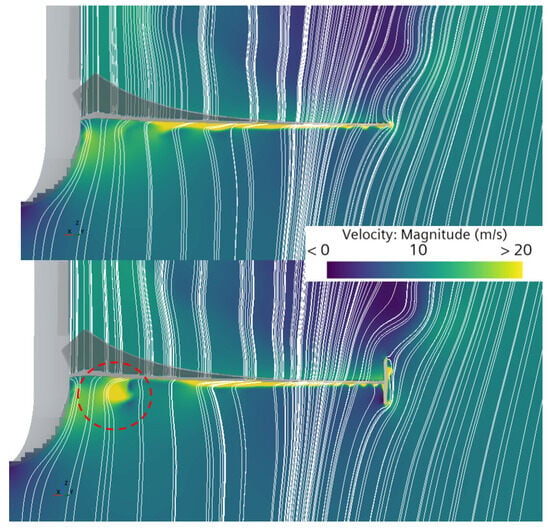
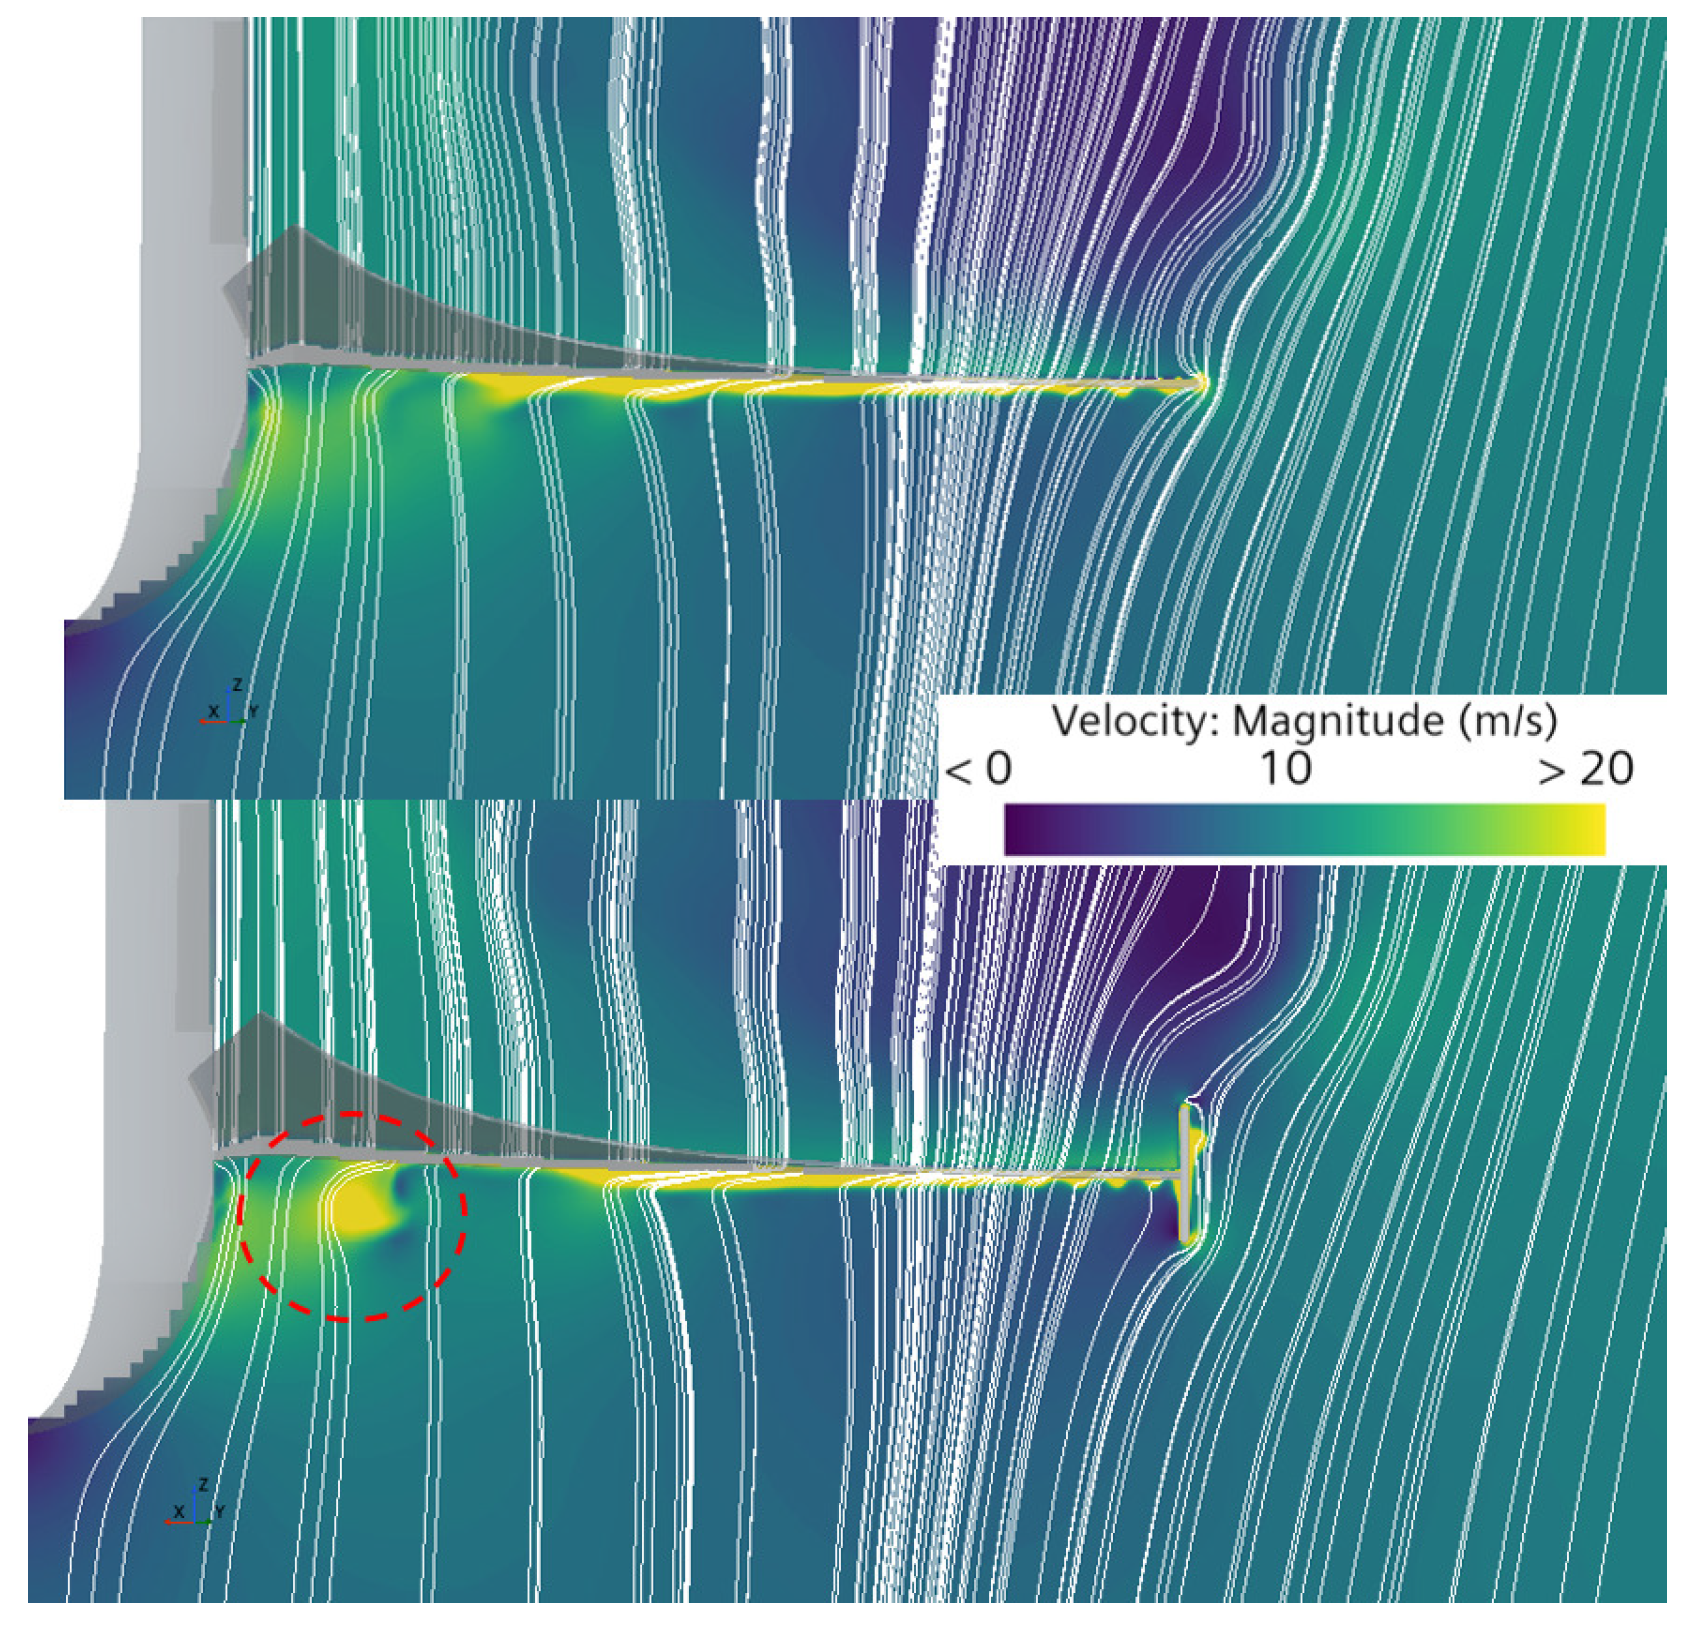
The change in the power coefficient versus tip speed ratio distribution can be explained by the underlying flow physics analysis. In the baseline configuration without endplates, flow recirculation around the blade tip enhances the radial velocity component. The endplate implementation suppresses this recirculation, consequently reducing the radial flow component. At elevated tip speed ratios, flow separation occurs at the nose region, generating vortical structures. The reduced radial flow component allows the vortical structures to develop and extend until reaching the blade pressure side, negatively affecting the blade performance. As a result, the maximum operational tip speed ratio is reduced, effectively increasing the overall operational safety. This behavior is illustrated in Figure 15, where streamlines are superimposed on a velocity contour, highlighting both the recirculation zone and the influence of the endplates on the radial flow component.
Figure 15.
Velocity magnitude colormap with streamlines in spanwise view at for configurations without (top) and with (bottom) the endplate. Recirculation zone highlighted in red.
An additional consideration in endplate design is the manufacturing method, as the added mass of the endplates can increase rotor inertia and, consequently, the actual cut-in speed, even though aerodynamic performance shows no significant change. To minimize endplate mass, and given the relatively low loads expected on this component, composite materials are recommended. For example, a sandwich configuration with an aluminum honeycomb core and a layer of carbon fiber-reinforced plastic results in an estimated mass of 8.18 g. In terms of inertia, and assuming the blade is a sandwich structure with a PVC foam core and four layers of carbon fiber-reinforced plastic, the addition of the endplate would increase inertia by approximately 3.46%. In contrast, other wingtip modifications involve blade deformations and cannot be manufactured as independent components. Therefore, endplates provide both a simpler manufacturing process and a lighter solution. Further analysis is recommended to accurately quantify the mass and inertia effects based on the chosen manufacturing method.
4. Concluding Remarks
This study presents an original, comprehensive methodology for the design and analysis of micro-scale horizontal-axis wind turbine blades, demonstrating the critical importance of the selection of computational methods and the consideration of three-dimensional effects in achieving optimal aerodynamic performance.
The systematic comparison of the traditional BEMT formulation, QBlade, and CFD methodologies reveals significant performance prediction differences, with CFD steady simulations indicating power coefficients 23.34% higher than those of classical BEMT and 22.46% higher than those of QBlade. In the case of the unsteady simulations, the maximum power coefficient in the unsteady simulations is 4.08% lower than that of the steady approach. The disparity between CFD and the other methods used stems from three-dimensional effects, particularly rotational stall delay, which are inadequately captured by the two-dimensional assumptions inherent in BEMT. The QBlade software, incorporating 3D corrections, provides an intermediate solution that balances computational efficiency with improved accuracy, making it suitable for initial design optimization phases. In terms of computational cost, using QBlade results in a computational cost approximately 810 times lower than that associated with CFD in the design phase.
The numerical campaign utilizing 33 airfoils successfully identified optimal blade configurations. The Bergey BW-3 airfoil emerged as the superior choice, demonstrating the lowest stall tip speed ratio and a favorable cut-in wind speed of 3.12 m/s while maintaining a similar peak power coefficient with respect to the other candidates. This systematic approach proves effective for informing design decisions, providing quantitative performance metrics across diverse airfoil geometries.
The addition of endplates to the optimized blade design yields substantial improvements in both power coefficient magnitude and distribution characteristics. The endplates effectively mitigate tip vortex formation, redirecting flow recirculation away from the blade tip and increasing tangential force generation. Most significantly, the endplates reduce the stall tip speed ratio, thereby reducing the maximum rotational speed and increasing overall safety. This passive enhancement, which is innovative in the field of horizontal-axis wind turbines, requires minimal additional manufacturing complexity while providing measurable performance benefits, with an estimated increase of approximately 3.46% in inertia, assuming a composite-material-based manufacturing approach.
The investigation confirms that three-dimensional effects play a crucial role in micro-scale wind turbine performance. CFD visualizations reveal complex recirculation zones that cannot be captured by two-dimensional analysis. The quantification of these effects through wall-shear-stress streamlines provides valuable insights into the underlying flow physics governing wind turbine performance.
The developed multi-fidelity design framework offers a practical approach for micro-scale wind turbine optimization, beginning with efficient QBlade-based numerical studies and culminating in CFD analysis. This original methodology addresses the computational cost–accuracy trade-off inherent in wind turbine design, providing designers with a systematic approach for achieving optimal performance within practical constraints.
While this study provides significant advances in micro-scale wind turbine design methodology, several limitations warrant acknowledgment. The blade optimization was performed using BEMT-based methods, potentially limiting the consideration of three-dimensional effects during the initial design phase. Moreover, any unsteady effects, as well as tower-shadowing and yawed-wind effects, have also been neglected in the design process due to computational cost. Future research should investigate CFD-based optimization approaches, despite their computational intensity, as well as more complex and complete wind turbine models and operating conditions, along with experimental validation, to validate the effects of the added endplates. In addition, an endplate sizing sensitivity analysis should also be carried out. Furthermore, given the intended application of micro-scale wind turbines, acoustic emissions should be incorporated as a design criterion during the design stage. Finally, although new composite materials could provide an extremely light manufacturing option for the endplates, the effects of their mass and inertia should also be studied since, in extreme cases, they could outweigh the aerodynamic improvement.
The results presented demonstrate that careful consideration of computational methods and three-dimensional effects can yield substantial performance improvements in micro-scale wind turbine design. The developed methodology provides a foundation for future research in distributed wind energy systems, supporting the broader transition toward sustainable energy infrastructure.
Author Contributions
Conceptualization, N.A.-B.; methodology, N.A.-B.; software, N.A.-B.; validation, N.A.-B.; formal analysis, N.A.-B.; investigation, N.A.-B.; resources, N.A.-B.; writing—original draft preparation, N.A.-B.; writing—review and editing, P.V., P.Q. and R.N.; visualization, N.A.-B.; supervision, P.V., P.Q. and R.N.; project administration, P.V., P.Q. and R.N.; funding acquisition, P.V., P.Q. and R.N. All authors have read and agreed to the published version of the manuscript.
Funding
This work was partly sponsored by grant PID2022-142018OA-I00 Experimental and Numerical Optimization to Lower UAV Acoustical pollution (ENOLA) funded by MCIN/AEI/10.13039/501100011033 and by ERDF, EU. The work was also partially funded by the Universitat Politècnica de València through grant FPI-2022-S2-110996.
Data Availability Statement
The results shown in this paper are based solely on the models, parameters, and simulation conditions described in this manuscript.
Acknowledgments
Part of the computational resources used in this work were provided by the Supercomputing Center Rigel of Universitat Politècnica de València, which is thus gratefully acknowledged.
Conflicts of Interest
The authors declare no conflicts of interest.
Abbreviations
The following abbreviations are used in this manuscript:
| CFD | Computational Fluid Dynamics |
| BEMT | Blade Element Momentum Theory |
| NREL | National Renewable Energy Laboratory |
| GCI | Grid Convergence Index |
| HAWT | Horizontal-Axis Wind Turbine |
| MRF | Moving Reference Frame |
| SM | Sliding Mesh |
| PVC | Polyvinyl Chloride |
| CFRP | Carbon Fiber-Reinforced Plastic |
References
- United Nations Framework Convention on Climate Change. Adoption of the Paris Agreement. 2015. Available online: https://unfccc.int/sites/default/files/english_paris_agreement.pdf (accessed on 15 April 2025).
- United Nations Framework Convention on Climate Change. Report of the Conference of the Parties Serving as the Meeting of the Parties to the Paris Agreement on Its Third Session, Held in Glasgow from 31 October to 13 November 2021. 2021. Available online: https://unfccc.int/sites/default/files/resource/cma2021_10_add1_adv.pdf (accessed on 15 April 2025).
- Huang, M.T.; Zhai, P.M. Achieving Paris Agreement temperature goals requires carbon neutrality by middle century with far-reaching transitions in the whole society. Adv. Clim. Change Res. 2021, 12, 281–286. [Google Scholar] [CrossRef] [Scilit]
- European Commission. Going Climate-Neutral by 2050—A Strategic Long-Term Vision for a Prosperous, Modern, Competitive and Climate-Neutral EU Economy. 2019. Available online: https://data.europa.eu/doi/10.2834/02074 (accessed on 15 April 2025).
- Global Wind Energy Council. Global Wind Workload Outlook 2024–2028. 2024. Available online: https://www.gwec.net/reports/global-wind-workforce-outlook/2024-2028 (accessed on 15 April 2025).
- James, P.A.; Bahaj, A.S. Chapter 9—Small-scale wind turbines. In Wind Energy Engineering, 2nd ed.; Letcher, T.M., Ed.; Academic Press: Cambridge, MA, USA, 2023; pp. 99–120. [Google Scholar] [CrossRef] [Scilit]
- United Nations. Sustainable Development Goals. Available online: https://sdgs.un.org/goals (accessed on 27 November 2025).
- Barzegar-Kalashani, M.; Seyedmahmoudian, M.; Mekhilef, S.; Stojcevski, A.; Horan, B. Small-scale wind turbine control in high-speed wind conditions: A review. Sustain. Energy Technol. Assess. 2023, 60, 103577. [Google Scholar] [CrossRef] [Scilit]
- Abad, G.; Plaza, A.; Kerejeta, G. Performance Evaluation of Small Wind Turbines Under Variable Winds of Cities: Case Study Applied to an Ayanz Wind Turbine with Screw Blades. Smart Cities 2024, 7, 3241–3288. [Google Scholar] [CrossRef] [Scilit]
- Akour, S.N.; Al-Heymari, M.; Ahmed, T.; Khalil, K.A. Experimental and theoretical investigation of micro wind turbine for low wind speed regions. Renew. Energy 2018, 116, 215–223. [Google Scholar] [CrossRef] [Scilit]
- Bavanish, B.; Thyagarajan, K. Optimization of power coefficient on a horizontal axis wind turbine using bem theory. Renew. Sustain. Energy Rev. 2013, 26, 169–182. [Google Scholar] [CrossRef] [Scilit]
- Lee, M.H.; Shiah, Y.; Bai, C.J. Experiments and numerical simulations of the rotor-blade performance for a small-scale horizontal axis wind turbine. J. Wind. Eng. Ind. Aerodyn. 2016, 149, 17–29. [Google Scholar] [CrossRef] [Scilit]
- Marten, D.; Saverin, J.; Behrens de Luna, R.; Perez-Becker, S. QBlade CE v2.0.7.7 Beta. 2025. Available online: https://docs.qblade.org/ (accessed on 30 October 2025).
- Islam, M.R.; Bashar, L.B.; Rafi, N.S. Design and simulation of a small wind turbine blade with qblade and validation with MATLAB. In Proceedings of the 2019 4th International Conference on Electrical Information and Communication Technology (EICT); IEEE: New York, NY, USA, 2019; pp. 1–6. [Google Scholar]
- Altmimi, A.I.; Aws, A.; Jweeg, M.J.; Abed, A.M.; Abdullah, O.I. An investigation of design and simulation of horizontal axis wind turbine using QBlade. Meas. Sci. Rev. 2022, 22, 253–260. [Google Scholar] [CrossRef] [Scilit]
- Cao, G.; Fei, Z.; Vogel, C. Uncertainty quantification analysis in the blade element momentum method. Renew. Energy 2025, 250, 123181. [Google Scholar] [CrossRef] [Scilit]
- Monteiro, J.P.; Silvestre, M.R.; Piggott, H.; André, J.C. Wind tunnel testing of a horizontal axis wind turbine rotor and comparison with simulations from two Blade Element Momentum codes. J. Wind. Eng. Ind. Aerodyn. 2013, 123, 99–106. [Google Scholar] [CrossRef] [Scilit]
- Umar, D.A.; Yaw, C.T.; Koh, S.P.; Tiong, S.K.; Alkahtani, A.A.; Yusaf, T. Design and optimization of a small-scale horizontal axis wind turbine blade for energy harvesting at low wind profile areas. Energies 2022, 15, 3033. [Google Scholar] [CrossRef] [Scilit]
- Snel, H.; Houwink, R.; Piers, W. Sectional Prediction of 3D Effects for Separated Flow on Rotating Blades. Presented at the European Rotorcraft Forum (18th), Avignon, France, 15–18 September 1992. [Google Scholar]
- Peng, H.; Chu, Y.; Lam, H.; Liu, H.; Sun, S. Static aerodynamic analysis of bio-inspired wind turbine efficiency: Modeling Borneo camphor seed blade designs and their parallel plate arrangements. Energy Convers. Manag. 2025, 331, 119681. [Google Scholar] [CrossRef] [Scilit]
- Sumner, J.; Watters, C.S.; Masson, C. CFD in wind energy: The virtual, multiscale wind tunnel. Energies 2010, 3, 989–1013. [Google Scholar] [CrossRef] [Scilit]
- Zhang, D.; Liu, Z.; Li, W.; Cheng, L.; Hu, G. Numerical investigation of wind turbine wake characteristics using a coupled CFD-CSD method considering blade and tower flexibility. J. Wind. Eng. Ind. Aerodyn. 2024, 244, 105625. [Google Scholar] [CrossRef] [Scilit]
- Menegozzo, L.; Dal Monte, A.; Benini, E.; Benato, A. Small wind turbines: A numerical study for aerodynamic performance assessment under gust conditions. Renew. Energy 2018, 121, 123–132. [Google Scholar] [CrossRef] [Scilit]
- Torregrosa, A.; Gil, A.; Quintero, P.; Tiseira, A. Enhanced design methodology of a low power stall regulated wind turbine. BEMT and MRF-RANS combination and comparison with existing designs. J. Wind. Eng. Ind. Aerodyn. 2019, 190, 230–244. [Google Scholar] [CrossRef] [Scilit]
- Bekkai, R.; Laouar, R.; Mdouki, R. Design optimization of three-dimensional geometry of a micro horizontal axis wind turbine blade using the response surface method. PAMM 2024, 24, e202300248. [Google Scholar] [CrossRef] [Scilit]
- Demırcı, V.; Kan, F.E.; Seyhan, M.; Sarıoğlu, M. The effects of the location of the leading-edge tubercles on the performance of horizontal axis wind turbine. Energy Convers. Manag. 2025, 324, 119178. [Google Scholar] [CrossRef] [Scilit]
- Amoretti, T.; Huet, F.; Garambois, P.; Roucoules, L. Configurable dual rotor wind turbine model based on BEM method: Co-rotating and counter-rotating comparison. Energy Convers. Manag. 2023, 293, 117461. [Google Scholar] [CrossRef] [Scilit]
- Bontempo, R.; Manna, M. Optimum design of contra-rotating wind turbines with adjacent rotors. Energy Convers. Manag. 2025, 324, 119267. [Google Scholar] [CrossRef] [Scilit]
- Kaya, M.N.; Kose, F.; Ingham, D.; Ma, L.; Pourkashanian, M. Aerodynamic performance of a horizontal axis wind turbine with forward and backward swept blades. J. Wind. Eng. Ind. Aerodyn. 2018, 176, 166–173. [Google Scholar] [CrossRef] [Scilit]
- Khaled, M.; Ibrahim, M.M.; Hamed, H.E.A.; AbdelGwad, A.F. Investigation of a small Horizontal–Axis wind turbine performance with and without winglet. Energy 2019, 187, 115921. [Google Scholar] [CrossRef] [Scilit]
- Iswahyudi, S.; Sutrisno; Prajitno; Wibowo, S.B. Effect of blade tip shapes on the performance of a small HAWT: An investigation in a wind tunnel. Case Stud. Therm. Eng. 2020, 19, 100634. [Google Scholar] [CrossRef] [Scilit]
- Madrigal Avalos, G.; Rosado Hau, N.; Quintal-Palomo, R.; Ordóñez López, E.; Gamboa-Marrufo, M.; Escalante Soberanis, M. Aerodynamic techniques to mitigate the 3D loss in the power coefficient of vertical axis wind turbines. Energy Convers. Manag. 2024, 311, 118507. [Google Scholar] [CrossRef] [Scilit]
- Abbas, W.K.; Abbasalizadeh, M.; Khalilarya, S. Optimizing of horizontal axis wind turbine blades using MATLAB-based blade element momentum theory with validation in QBlade and CFD software. Wind. Eng. 2025, 49, 968–993. [Google Scholar] [CrossRef] [Scilit]
- Koc, E.; Gunel, O.; Yavuz, T. Mini-Scaled Horizontal Axis Wind Turbine Analysis by Qblade and CFD. Int. J. Energy Appl. Technol. 2016, 3, 87–92. [Google Scholar]
- Hansen, M.O.L. Aerodynamics of Wind Turbines; Routledge: New York, NY, USA, 2008. [Google Scholar]
- Drela, M. XFOIL: An analysis and design system for low Reynolds number airfoils. In Proceedings of the Low Reynolds Number Aerodynamics: Proceedings of the Conference Notre Dame, Indiana, USA, 5–7 June 1989; Springer: Berlin/Heidelberg, Germany, 1989; pp. 1–12. [Google Scholar]
- Sezer-Uzol, N.; Long, L. 3-D time-accurate CFD simulations of wind turbine rotor flow fields. In Proceedings of the 44th AIAA Aerospace Sciences Meeting and Exhibit, Reno, NV, USA, 9–12 January 2006; p. 394. [Google Scholar]
- Krogstad, P.Å.; Lund, J. An experimental and numerical study of the performance of a model turbine. Wind Energy 2012, 15, 443–457. [Google Scholar] [CrossRef] [Scilit]
- Budanko, M.; Guzović, Z. Design Methodology and Economic Impact of Small-Scale HAWT Systems for Urban Distributed Energy Generation. Machines 2024, 12, 886. [Google Scholar] [CrossRef] [Scilit]
- Cai, X.; Gu, R.; Pan, P.; Zhu, J. Unsteady aerodynamics simulation of a full-scale horizontal axis wind turbine using CFD methodology. Energy Convers. Manag. 2016, 112, 146–156. [Google Scholar] [CrossRef] [Scilit]
- Celik, I.; Ghia, U.; Roache, P.; Freitas, C.; Coloman, H.; Raad, P. Procedure of Estimation and Reporting of Uncertainty Due to Discretization in CFD Applications. J. Fluids Eng. 2008, 130, 078001. [Google Scholar] [CrossRef] [Scilit]
- Roache, P.J. Verification and Validation in Computational Science and Engineering; Hermosa Publishers: Albuquerque, NM, USA, 1998; Volume 895. [Google Scholar]
- Ghaderi, A.; Dasineh, M.; Aristodemo, F.; Aricò, C. Numerical simulations of the flow field of a submerged hydraulic jump over triangular macroroughnesses. Water 2021, 13, 674. [Google Scholar] [CrossRef] [Scilit]
- Moshfeghi, M.; Song, Y.J.; Xie, Y.H. Effects of near-wall grid spacing on SST-K-ω model using NREL Phase VI horizontal axis wind turbine. J. Wind. Eng. Ind. Aerodyn. 2012, 107, 94–105. [Google Scholar] [CrossRef] [Scilit]
- Hand, M.; Simms, D.; Fingersh, L.; Jager, D.; Cotrell, J.; Schreck, S.; Larwood, S. Unsteady Aerodynamics Experiment Phase VI: Wind Tunnel Test Configurations and Available Data Campaigns; National Renewable Energy Laboratory: Golden, CO, USA, 2001.
- Rosato, A.; Perrotta, A.; Maffei, L. Commercial small-scale horizontal and vertical wind turbines: A comprehensive review of geometry, materials, costs and performance. Energies 2024, 17, 3125. [Google Scholar] [CrossRef] [Scilit]
- University of Illinois Urbana-Champaign, Department of Aerospace Engineering. Airfoils Database. 2025. Available online: https://m-selig.ae.illinois.edu/ads/coord_database.html#A (accessed on 16 April 2025).
- Lyon, C.; Broeren, A.; Giguère, P.; Gopalarathnam, A.; Selig, M. Summary of Low Speed Airfoil Data: Volume 3; SoarTech Publications: El Cajon, CA, USA, 1997. [Google Scholar]
- Mamadaminov, U. Review of airfoil structures for wind turbine blades. Dep. Electr. Eng. Renew. Energy REE 2013, 515, 1–8. [Google Scholar]
- Adeyeye, K.A.; Ijumba, N.; Colton, J. The effect of the number of blades on the efficiency of a wind turbine. In Proceedings of the IOP Conference Series: Earth and Environmental Science; IOP Publishing: London, UK, 2021; Volume 801, p. 012020. [Google Scholar]
- Tummala, A.; Velamati, R.K.; Sinha, D.K.; Indraja, V.; Krishna, V.H. A review on small scale wind turbines. Renew. Sustain. Energy Rev. 2016, 56, 1351–1371. [Google Scholar] [CrossRef] [Scilit]
- Shin, P.; Kim, K. Aerodynamic performance prediction of SG6043 airfoil for a horizontal-axis small wind turbine. J. Phys. Conf. Ser. 2020, 1452, 012018. [Google Scholar] [CrossRef] [Scilit]
- Suresh, A.; Rajakumar, S. Design of small horizontal axis wind turbine for low wind speed rural applications. Mater. Today Proc. 2020, 23, 16–22. [Google Scholar] [CrossRef] [Scilit]
- Selig, M.; Guglielmo, J.; Broeren, A.; Giguère, P. Summary of Low-Speed Airfoil Data: Volume 1; SoarTech Publications: El Cajon, CA, USA, 1995. [Google Scholar]
- Boatto, U.; Bonnet, P.A.; Avallone, F.; Ragni, D. Assessment of Blade Element Momentum Theory-based engineering models for wind turbine rotors under uniform steady inflow. Renew. Energy 2023, 214, 307–317. [Google Scholar] [CrossRef] [Scilit]
- Aular, L.; Quintero, P.; Navarro, R.; Tiseira, A.; Prothin, S. Assessing the Fidelity of Steady-State MRF Modeling for UAV Propeller Performance in Non-Axial Inflow. Aerospace 2026, 13, 198. [Google Scholar] [CrossRef] [Scilit]
- Hu, D.; Hua, O.; Du, Z. A study on stall-delay for horizontal axis wind turbine. Renew. Energy 2006, 31, 821–836. [Google Scholar] [CrossRef] [Scilit]

Disclaimer/Publisher’s Note: The statements, opinions and data contained in all publications are solely those of the individual author(s) and contributor(s) and not of MDPI and/or the editor(s). MDPI and/or the editor(s) disclaim responsibility for any injury to people or property resulting from any ideas, methods, instructions or products referred to in the content. |
© 2026 by the authors. Licensee MDPI, Basel, Switzerland. This article is an open access article distributed under the terms and conditions of the Creative Commons Attribution (CC BY) license.