


Abstract
Accurate reciprocating tribological testing depends on the mechanical design, kinematic stability, and load application strategy of the testing apparatus. This paper presents the design, construction, and validation of a custom-built linear reciprocating tribometer developed for controlled laboratory testing. The tribometer provides a programmable stroke of up to 500 mm and a sliding-velocity range of 0.1–50 mm/s. The tribometer was validated through finite element analysis, repeated friction tests, and noise measurements. FEM results showed a maximum displacement of 0.1664 mm and a maximum von Mises stress of 7.47 MPa for the moving plate assembly under a 100 N load, while the loading portal exhibited a maximum localized displacement of 0.017 mm and a maximum stress of approximately 13 MPa under combined loading. These conditions correspond to the maximum design load of the developed tribometer. Repeated tests at 10, 15, and 20 mm/s yielded coefficients of variation of 2.84%, 5.90%, and 14.62%, respectively. Acoustic measurements showed standard deviation values in the range 1.868–3.119 dB. The obtained results confirm stable operation, limited structural deformation, and satisfactory repeatability within the analyzed operating range, indicating that the developed tribometer is suitable for controlled reciprocating tribological experiments under representative laboratory conditions.
1. Introduction
Tribometers serve as key experimental instruments for systematic investigation of frictional behavior by reproducing representative contact configurations and motion regimes relevant to engineering applications. The reliability and interpretability of the obtained data strongly depend on the mechanical design, structural rigidity, and measurement stability of the testing device. Simplified laboratory configurations such as pin-on-disk, ball-on-disk, and reciprocating tribometers are widely adopted due to their versatility and standardization, enabling systematic comparison of tribological behavior across different material systems [1,2,3]. In reciprocating tribological testing, dynamic effects including acceleration, inertia, stiffness, and damping can significantly influence measured friction forces. Since friction is inferred from system response rather than measured directly, the dynamic characteristics of the testing apparatus become an integral part of the measurement process [4]. Previous studies have shown that tribometer architecture, contact kinematics, and alignment quality directly affect repeatability and data dispersion, confirming that optimized mechanical design is essential for reliable tribometry [5]. Accordingly, recent developments increasingly focus on purpose-built reciprocating pin-on-plate systems with improved structural stiffness and vibration control to enhance measurement reproducibility [6]. Reviews of contemporary tribometric approaches indicate that commercially available systems do not always faithfully simulate real contact conditions, particularly in low-speed linear reciprocating motion typical of many engineering applications [7]. Moreover, cyclic loading and frequency effects have been shown to significantly influence wear behavior, underscoring the importance of tribometers capable of controlled dynamic loading conditions [8]. Systematic engineering approaches to tribometer development emphasize clearly defined functional requirements, modular mechanical architecture, and integration of friction force measurements into robust kinematic systems [9,10]. Industrial and research approaches indicate that faithful simulation of slow reciprocating sliding requires stable load application, precise motion control and reliable capture of system dynamic effects [11,12]. Accordingly, the friction coefficient does not represent a material constant but a system response determined by contact geometry, load, movement, environmental conditions and structural compliance [13], whereby structural dynamics and resonance effects can influence the distortion of measured signals, which imposes the need for vibration control and appropriate dynamic analysis in the design process [14,15]. Contemporary trends further emphasize the importance of modular, affordable and experimentally validated tribometers suitable for academic research, especially in order to generate reliable data sets for advanced modeling and data-driven approaches [16,17,18].
In this context, the present study addresses the need for a purpose-built, laboratory-scale linear reciprocating tribometer designed to provide reliable friction and wear measurements under well-defined kinematic and loading conditions. The developed tribometer was designed in methodological alignment with ASTM G133 [19] and ISO 7148-2 [20], which provide widely recognized recommendations for reciprocating tribological testing, while incorporating controlled adaptations appropriate for laboratory-scale investigations and modular contact configurations. The system enables precise adjustment of normal load, sliding speed, stroke length, and test duration, while ensuring mechanical rigidity, alignment stability during laboratory tests, and measurement reliability. The novelty of the proposed tribometer lies in the integration of a spindle-driven reciprocating mechanism with enhanced inherent damping characteristics, a gravity-based counterweight-assisted loading system designed to minimize parasitic forces and misalignment effects, and a dual-microcontroller architecture that separates motion control from data acquisition in order to reduce signal interference.
The aim of this study was to design, construct, and experimentally validate a custom linear reciprocating tribometer intended for controlled laboratory investigations of friction and wear. The main contribution of the paper lies in the development of a modular tribometer architecture with programmable stroke and sliding velocity, dead-weight-based normal load application, and integrated real-time friction force acquisition. Validation was performed through finite element analysis, repeated friction tests, and noise measurements. Thus, the study provides both a functional engineering solution and quantitative evidence of the mechanical stability and repeatability of the developed system.
2. Design Concept and Development Methodology
2.1. Functional Requirements and Design Concept
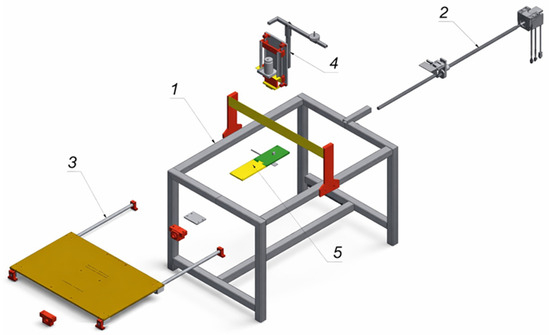
The primary objective of the developed tribometer was to enable controlled linear reciprocating sliding under well-defined mechanical and tribological conditions. Manufacturability and cost efficiency were defined as key secondary design criteria. Structural components were fabricated using conventional processes, while standard commercially available elements including linear guides, bearings, ball screw assemblies, couplings, and fasteners were used. This approach reduces production cost, simplifies maintenance, and improves system reproducibility. In the present design (Figure 1), dynamic stability is ensured through structural rigidity, controlled motion profiles, and proper alignment of the spindle–nut interface, which is essential for repeatable motion and reliable friction measurements. The contact interface is modular and interchangeable, enabling the use of various contact configurations, thereby allowing for variation in nominal contact area and specific contact pressure. To fulfill this objective, the tribometer was required to provide stable bidirectional linear motion with adjustable sliding velocity, precise and repeatable application of normal load using calibrated masses, and reliable real-time measurement of friction force with sufficient resolution and minimal signal noise. Based on typical operating conditions relevant to polymeric and metallic tribological pairs, the tribometer was designed to operate within low to moderate ranges of normal load and sliding speed. This operating window ensures suitability for laboratory-scale investigations while maintaining relevance to practical engineering applications. The main technical specifications and operating characteristics of the developed tribometer are summarized in Table 1.
Figure 1.
Exploded view of the developed linear reciprocating tribometer with principal functional subsystems: (1) load-bearing frame; (2) horizontal reciprocating drive system; (3) horizontal moving system assembly; (4) vertical loading assembly; (5) friction force measurement system.
Table 1.
Main technical and geometrical specifications of the developed tribometer.
The overall dimensions of the developed linear reciprocating tribometer were defined in accordance with structural stiffness requirements, modularity, and laboratory-scale applicability. The welded steel frame (position 1 in Figure 1) has nominal dimensions of 1200 mm × 800 mm × 750 mm. The complete assembled system, including the vertical loading mechanism (position 4 in Figure 1) and support structure (positions 1, 2, 3 and 5 in Figure 1), reaches an overall width of 1400 mm and an overall height of 1310 mm. The total mass of the assembled system is approximately 114 kg. The horizontal moving system (3) is based on linear guide rails with a nominal length of 1040 mm. The moving plate mounted on the carriage has dimensions of 500 mm in the sliding direction and 794 mm in the transverse direction. The maximum geometric carriage travel is 540 mm, obtained from the difference between the guide length (1040 mm) and the moving plate length (500 mm). Considering safety margins and mechanical clearances, the effective usable stroke was conservatively limited to 500 mm. Material selection was based on mechanical strength, wear resistance, and availability. Structural components were manufactured from carbon steel, while the test plate was made of hardened steel to ensure durability under repeated sliding conditions.
The horizontal reciprocating drive system (2) generates controlled bidirectional linear motion. An electric motor transmits rotational input through a flexible coupling to a ball screw (SF2005, HIWIN, Taichung, Taiwan, lead p = 5 mm/rev), which converts it into linear displacement of the carriage. Linear guides constrain motion along the reciprocating axis, minimizing lateral deviation and parasitic resistance, while bearing supports ensure proper alignment of the screw–guide assembly. The ball nut housing connects the drive system to the moving plate, enabling reliable motion transmission. Mechanical decoupling of the vertical loading system prevents inertial effects from influencing normal load application during acceleration and deceleration. The horizontal moving assembly (3) supports the tribological contact and integrates friction force measurement. A rigid base plate carries a hardened testing plate acting as the sliding track, while precision linear guides maintain rectilinear motion. A strain-gauge load cell is integrated to measure tangential friction force. The system enables controlled adjustment of stroke length and sliding velocity through the spindle-driven mechanism. The vertical loading assembly (4) applies a controlled normal force using calibrated dead weights. It consists of a vertically guided carriage, a force transmission plate, and a specimen holder. The pin is rigidly attached to the specimen holder using a bolted connection aligned with the direction of linear reciprocating motion. A counterweight compensates for the mass of moving vertical components, ensuring that only the applied masses contribute to the normal load. The normal load can be adjusted by changing the attached calibrated masses. The sliding track and specimen assembly (5) form the tribological contact pair in a pin-on-plate configuration. Reciprocating motion of the plate relative to the stationary specimen generates controlled sliding under defined normal load and velocity conditions, enabling systematic investigation of friction and wear under dry and lubricated regimes.
2.2. Conceptual Layout and Kinematic Principle
The conceptual design of the tribometer is based on the conversion of rotary motion into linear reciprocating motion using a simple and robust kinematic chain. Reciprocating motion is achieved by reversing the direction of screw rotation, enabling controlled bidirectional sliding with programmable stroke length and velocity.
The kinematic behavior of the system is defined by the screw lead of 5 mm per revolution, which directly determines the relationship between motor rotation and linear displacement. Since the tribometer operates in feed rate mode (mm/min), the sliding velocity is directly controlled through the programmed feed rate.
where v is the sliding velocity and f is the feed rate.
For the maximum programmed feed rate of 3000 mm/min, the corresponding maximum sliding velocity is 50 mm/s. Typical experimental conditions include feed rates of 600, 900, and 1200 mm/min, corresponding to sliding velocities of 10, 15, and 20 mm/s, respectively. Accordingly, the operational velocity range of the developed tribometer is
0 < v ≤ 50
2.3. Dynamic Analysis of the Drive System: Inertial Forces of the Moving Components
During reciprocating operation, acceleration and deceleration of the moving components, particularly at stroke reversal points, generate inertial forces that contribute to the total driving force. These effects are transient and do not influence motion at constant velocity. The inertial response of the system is governed by the total translational mass of all components that undergo linear motion. Based on CAD mass property analysis of the moving subassembly (including the sliding plate, carriage, nut housing, and fastening elements), the translational mass of the moving components is determined as
The maximum inertial force of the moving assembly can be estimated as
A parametric analysis was performed for representative acceleration times and sliding velocities (10, 15 and 20 mm/s). The results (Table 2) show that inertial forces remain within a few newtons, even under conservative conditions.
Table 2.
The calculations were performed using a translational mass of the moving assembly and a trapezoidal velocity profile.
The total driving force can be expressed as:
Under constant-velocity conditions, the driving force is dominated by system resistance, while inertial contributions are limited to short-duration peaks during motion reversal.
2.4. Design Validation Approach
The development methodology emphasized experimental validation as an integral part of the design process. Accordingly, the tribometer was conceived not only as a mechanical device but as a complete measurement system whose performance must be verified through calibration, repeatability assessment, and representative tribological testing.
Validation procedures include calibration of the force measurement system, evaluation of motion repeatability and stability, and comparative testing under different loading, speed, and lubrication conditions. These procedures ensure that the developed tribometer provides reliable and reproducible data suitable for scientific analysis and comparison with existing tribological studies. Beyond the baseline validation presented in this study, the developed tribometer has been employed in extended tribological experiments involving material and lubrication effects, the results of which have been reported elsewhere by the same authors [21]. A reciprocating tribometer based on the same linear sliding principle has also been employed in recent doctoral research on aluminum-based composite materials, confirming the applicability of this testing configuration in advanced tribological investigations [3].
3. Manufacturing of the Linear Reciprocating Tribometer
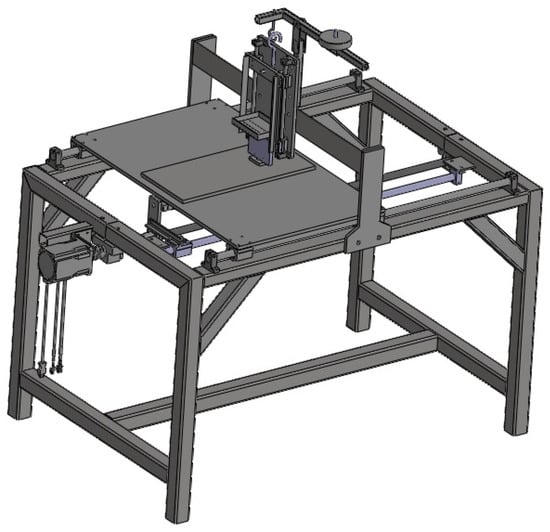
The linear reciprocating tribometer was designed as a modular mechanical system for controlled bidirectional reciprocating motion under defined normal loading conditions. A general view of the complete assembly modeled in Autodesk Inventor is shown in Figure 2. The overall layout consists of a rigid supporting frame, a horizontal drive system responsible for generating reciprocating motion, a vertical loading mechanism for applying the normal force, and an interchangeable specimen holder allowing for different contact configurations. The modular architecture facilitates assembly, maintenance, and future upgrades, while also supporting the stiffness and alignment accuracy required for reliable tribological measurements. The overall assembly was designed to provide high structural rigidity while maintaining clear separation between the motion generation, load application, and measurement subsystems, thereby improving alignment stability and experimental repeatability.
Figure 2.
Overall assembly of the linear reciprocating tribometer.
The load-bearing frame constitutes the structural foundation of the device. Its primary function is to support all mechanical components and to attenuate operational vibrations generated during reciprocating motion. The frame is fabricated from welded square-profile steel tubes with cross-sectional dimensions of 50 mm × 50 mm and a wall thickness of 2.9 mm, providing high structural stiffness and geometric stability. The rigid configuration was selected to reduce vibration during stroke reversals and to improve motion stability and measurement repeatability. An integrated electric motor holder, manufactured from 40 mm × 40 mm square-profile tubing of identical wall thickness, provides rigid fixation of the drive unit and contributes to alignment accuracy. The structural assembly includes horizontal and vertical members, interconnecting elements, and diagonal braces, forming a mechanically stable open-frame architecture.
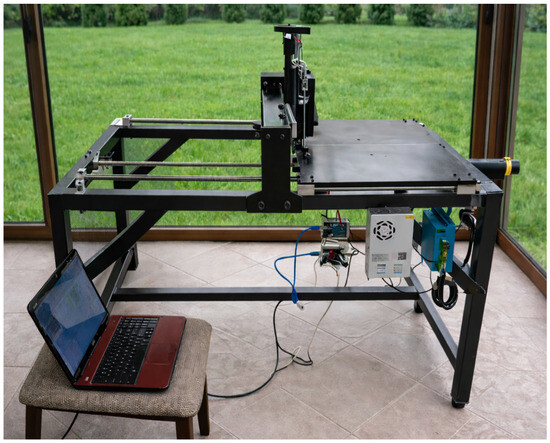
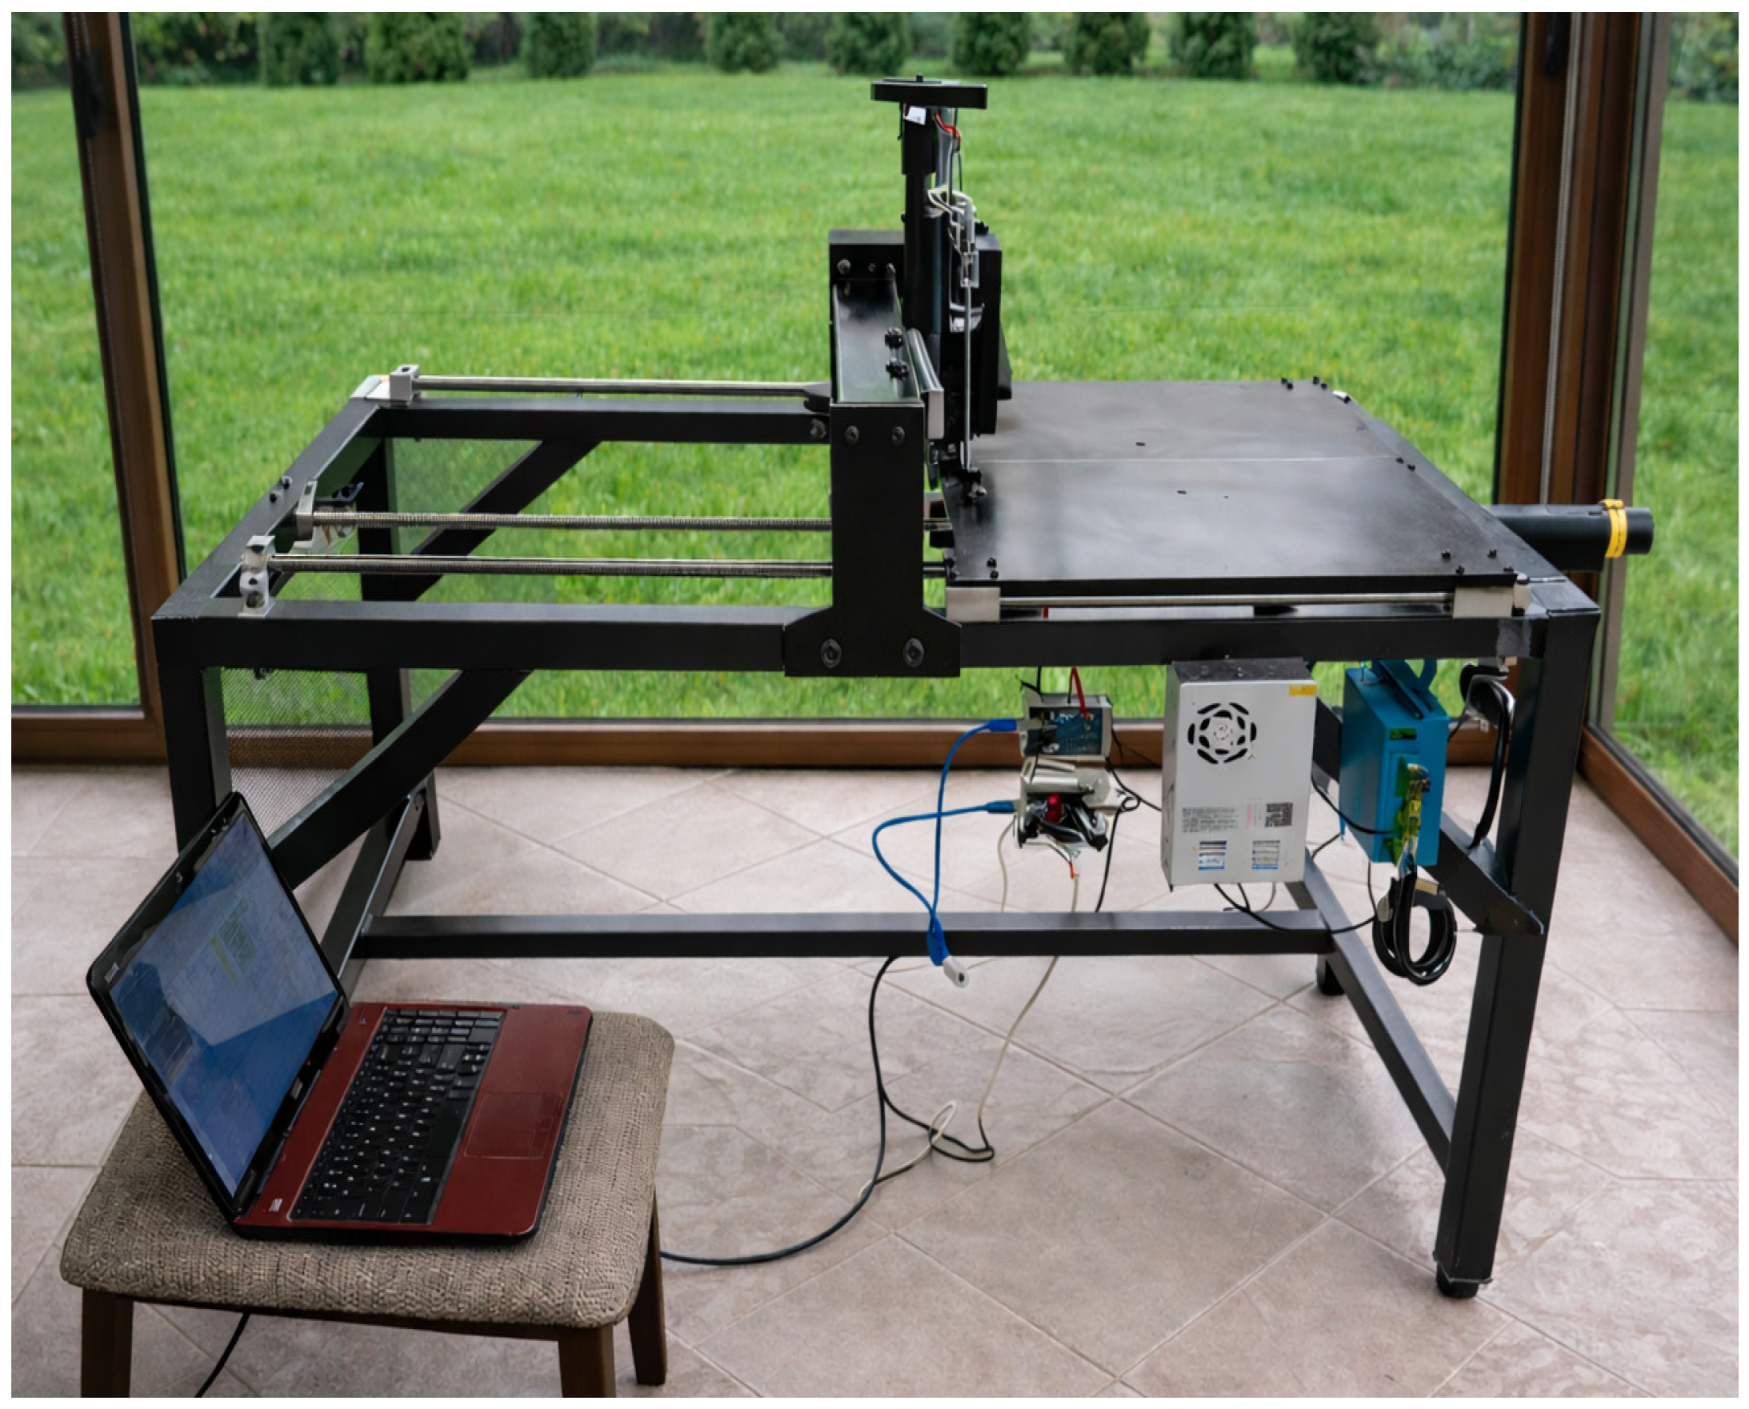
Figure 3 presents the developed linear reciprocating tribometer in its realized experimental configuration. The photograph illustrates the complete mechanical assembly, including the supporting frame, reciprocating motion subsystem, and vertical loading module, integrated into a functional laboratory setup. The control and data acquisition units are positioned within the structural frame, enabling compact system architecture and practical operability. The presented configuration confirms the successful realization of the CAD-based design into a fully operational experimental device for controlled reciprocating tribological testing.
Figure 3.
Fully assembled linear reciprocating tribometer in experimental configuration.
The manufactured configuration shown in Figure 3 confirms that the adopted construction concept enables practical realization of the designed system while preserving the structural rigidity and alignment stability required for reliable tribological measurements.
4. Control System and Operating Principle
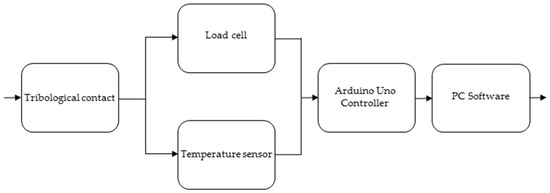
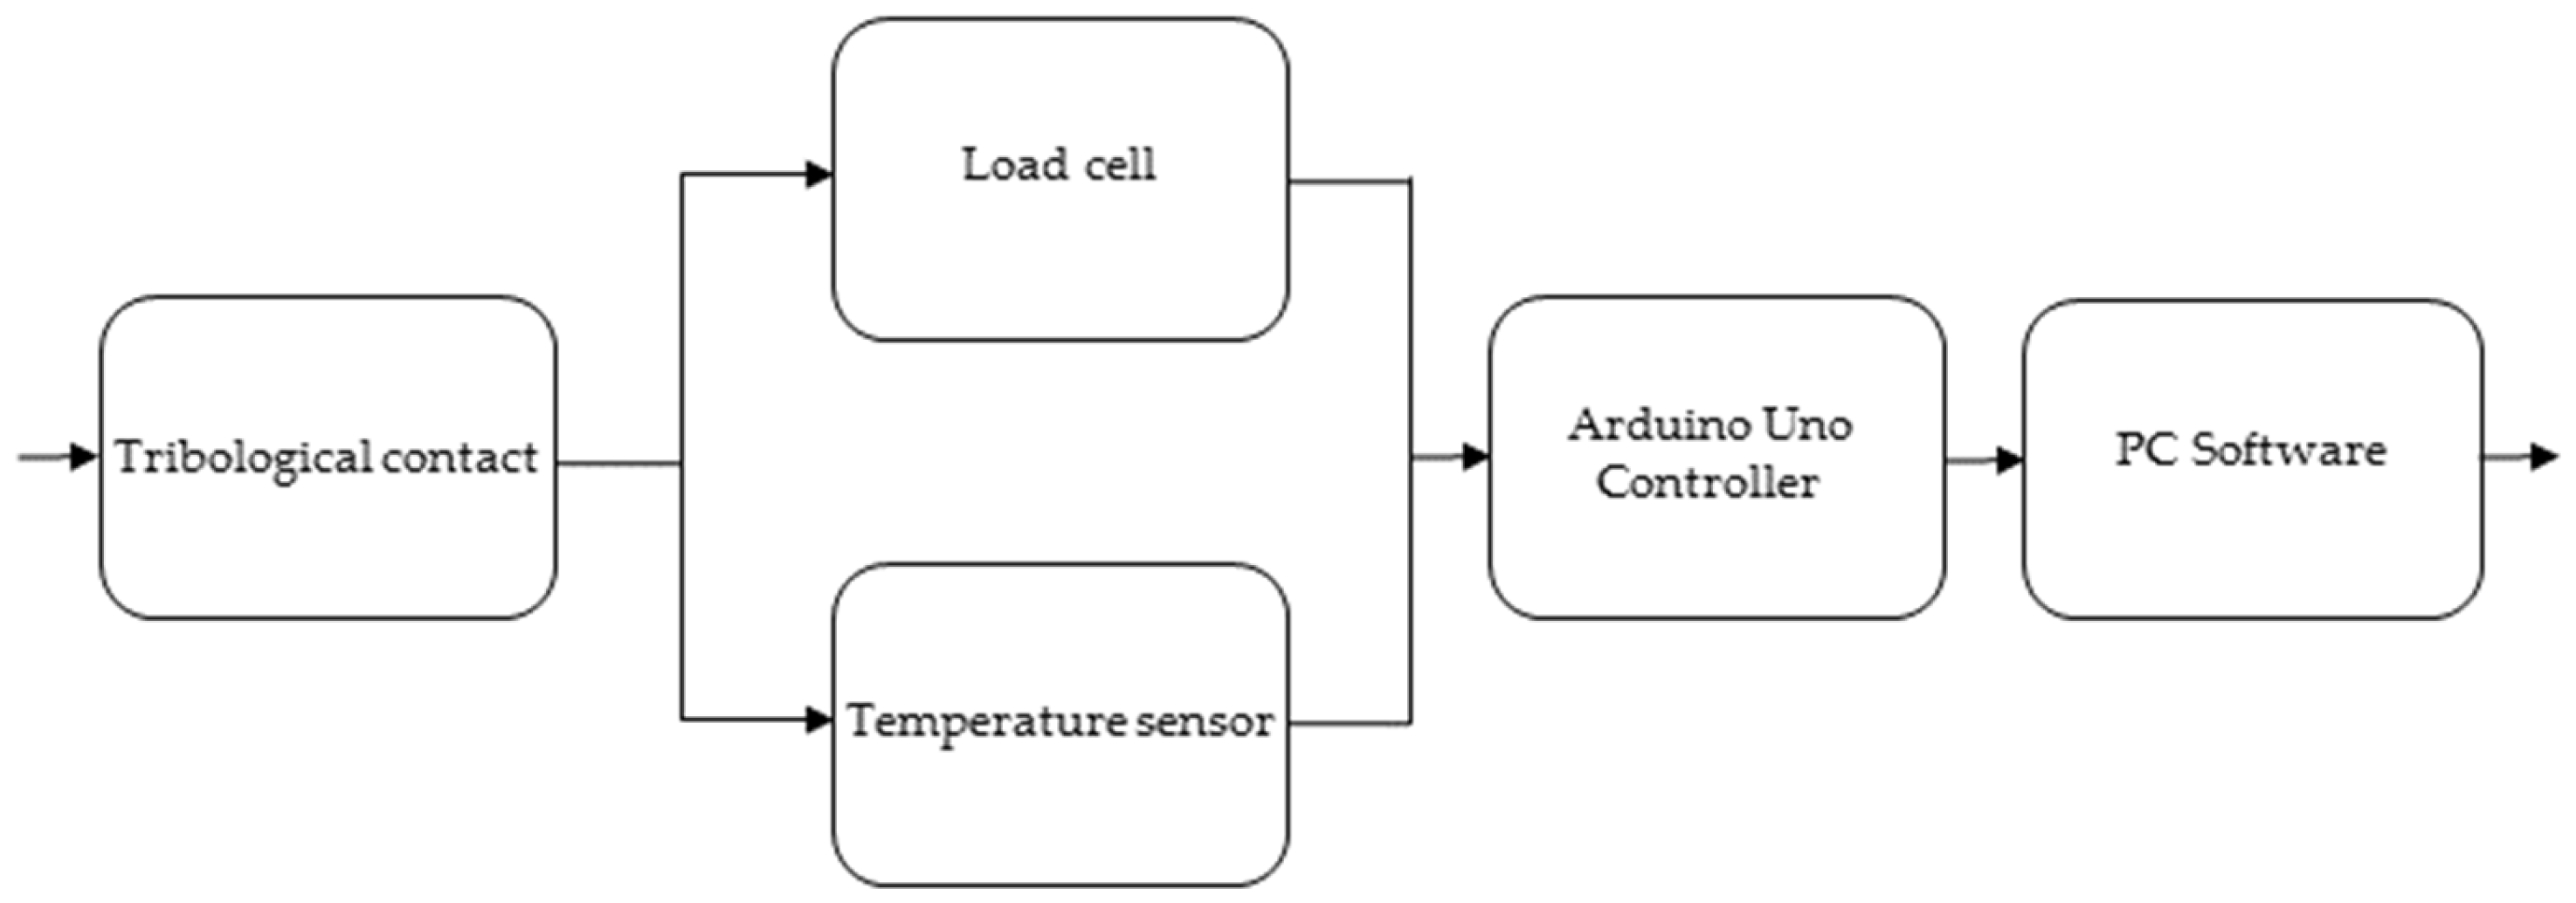
The control architecture of the tribometer employs two independent microcontroller units: one dedicated to motion control (Figure 4) and the other to data acquisition (Figure 5). This separation was intentionally implemented to minimize electrical noise and signal interference between motor driving circuits and sensitive sensor signals. Motion control is implemented using an Arduino-based controller and open-source G-code 2.1.13 software, enabling programmable control of stroke length and sliding velocity. The Arduino platform was selected due to its reliability, wide availability, and suitability for open and reproducible laboratory-scale experimental systems. The recorded force signals are exported and analyzed using dedicated data processing software, enabling continuous evaluation of friction behavior throughout the entire reciprocating cycle and facilitating identification of transient effects such as running-in behavior or lubrication regime transitions.
Figure 4.
Block diagram of the motion control architecture of the developed linear reciprocating tribometer.
Figure 5.
Block diagram of the data acquisition and signal processing architecture of the developed tribometer.
Figure 4 illustrates the block diagram of the motion control chain of the tribometer. The horizontal reciprocating motion of the tribometer is controlled by an Arduino-based controller connected to a personal computer via a USB interface. Within this software environment, the kinematic parameters of the test such as stroke length, sliding speed, and direction reversal are defined through G-code instructions. During operation, the Arduino executes the predefined motion sequence by driving the motor controller, thereby generating the required linear reciprocating movement of the test plate. Motion commands defined on the PC are transmitted to the Arduino Uno controller, which generates STEP, DIR, and EN signals for the stepper driver. The driver converts these control signals into regulated phase currents (A+, A−, B+, and B−) required for stepper motor actuation. The motor drives the threaded spindle, transforming rotational motion into controlled linear displacement of the carriage. This kinematic chain establishes programmable reciprocating motion at the tribological contact.
A second independent Arduino microcontroller (Figure 5) is dedicated exclusively to data acquisition. Friction force measurement is performed using a strain-gauge load cell integrated into the horizontal moving system assembly. A strain-gauge load cell of the S-CZL301 type, with a nominal capacity of 100 kg, was employed for measurement of friction forces generated during reciprocating sliding. Sensor signals are continuously acquired and transmitted to the computer in real time using the Telemetry Viewer. The selected load cell capacity represents a compromise between sufficient measurement range and signal resolution, while ensuring robustness and a linear response under low-load reciprocating conditions. The sensor provides high measurement accuracy, signal stability, and a linear response within the applied loading range, making it suitable for low-load tribological experiments. The load cell was calibrated using dead weights prior to testing. This calibration step was necessary to ensure reliable friction force acquisition under low-load reciprocating conditions.
The specifications summarized in Table 3 indicate that the selected load cell is suitable for stable and reliable friction force acquisition under the low-load reciprocating conditions considered in this study.
Table 3.
Technical specifications of the load-cell CZL-301 [22].
5. Results and Discussion
This section presents the validation results of the developed linear reciprocating tribometer in terms of structural stiffness, repeatability of friction measurements, and operating noise. Validation included finite element analysis of the key load-bearing components, repeated friction tests at different sliding velocities, and acoustic measurements under representative operating conditions. Together, these results confirm the functionality and reliability of the proposed tribometer design.
5.1. FEM Analysis of Custom Linear Reciprocating Tribometer
5.1.1. Structural Stiffness of the Supporting Plate with the Sliding Plate
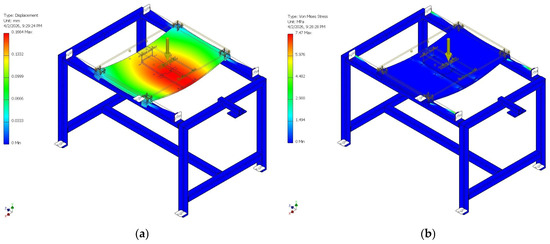
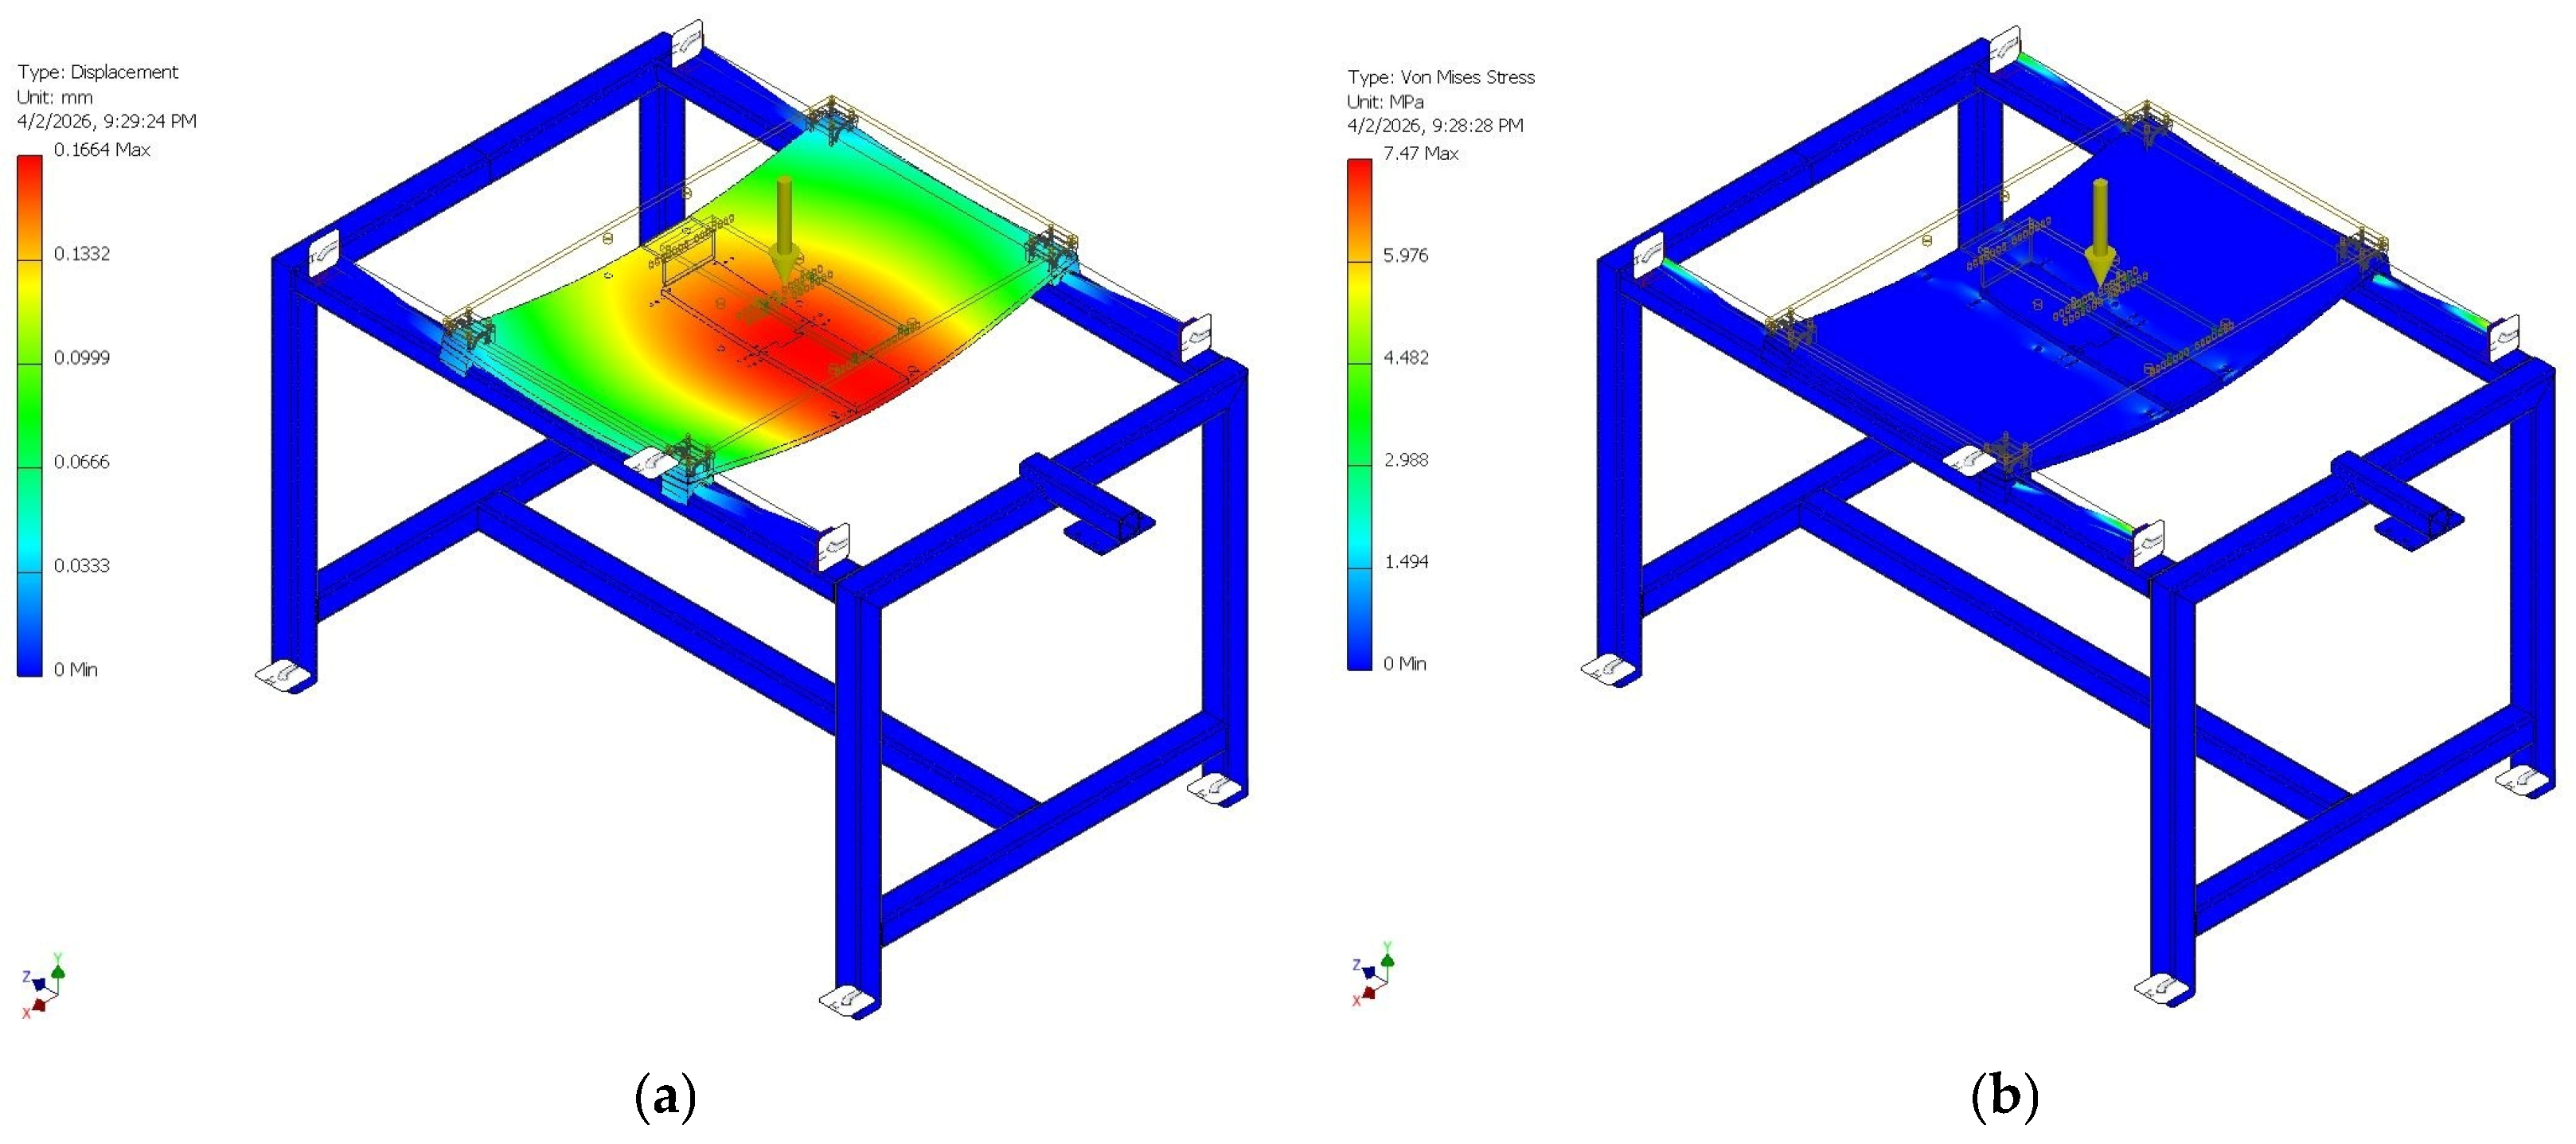
As part of the structural stiffness assessment of the tribometer, a static finite element analysis was first performed for the supporting plate with the sliding track. The analysis was conducted using the Autodesk Inventor FEM environment, considering the most unfavorable operating condition in which the supporting plate is positioned at the midpoint of the stroke. In the model, the legs of the supporting frame were fixed against displacement, while the linear guides were constrained in the axial direction within their supports, in accordance with the actual boundary conditions of the assembly. A maximum load of 100 N (10 kg) was applied at the center of the plate, corresponding to the contact zone. The distribution of total displacement is shown in Figure 6a, while the distribution of equivalent von Mises stress is presented in Figure 6b. The results indicate that the maximum total displacement is 0.1664 mm, with the largest deflection occurring in the central region of the loaded plate. At the same time, the maximum equivalent von Mises stress is 7.47 MPa, with elevated stress values primarily localized in the support and joint regions. The maximum deformation is concentrated in the central part of the plate, whereas the remaining structure shows substantially lower displacement levels. These results indicate that the supporting plate provides sufficient stiffness under the maximum considered load. Although a certain deflection is observed in the central region, its magnitude is small relative to the characteristic dimensions of the assembly and does not indicate the potential for significant disturbance of the contact conditions during testing. The allowable deflection of the supporting plate can be estimated as L/500 = 1.596 mm, whereas the FEM analysis yields a value nearly ten times lower. This confirms that the horizontal moving assembly provides a stable mechanical foundation for performing tribological measurements within the analyzed load range.
Figure 6.
Static FEM analysis of the moving plate assembly under a centrally applied load of 100 N: (a) total displacement distribution; (b) von Mises stress distribution.
5.1.2. Structural Stiffness of the Portal Frame for Vertical Loading Assembly
In the second boundary case, static FEM analysis was performed for the portal frame supporting the vertical loading assembly. The objective was to evaluate its mechanical stability under the most unfavorable operating condition, since portal deformation may directly affect contact stability and the reliability of friction force measurements. In the model, the portal frame was fixed at the bolt holes through which it is connected to the main tribometer frame, thereby defining boundary conditions consistent with the actual assembly constraints. The linear guides were modeled in the same manner as in the previously analyzed case, with axial displacement restricted within their supports. The most unfavorable loading condition was defined as a combined action of a normal force of 100 N and a friction force of 50 N, simulating the simultaneous presence of vertical and tangential loads in the contact zone.
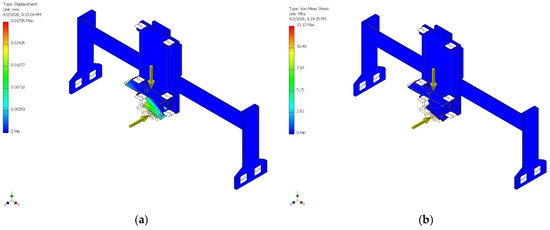
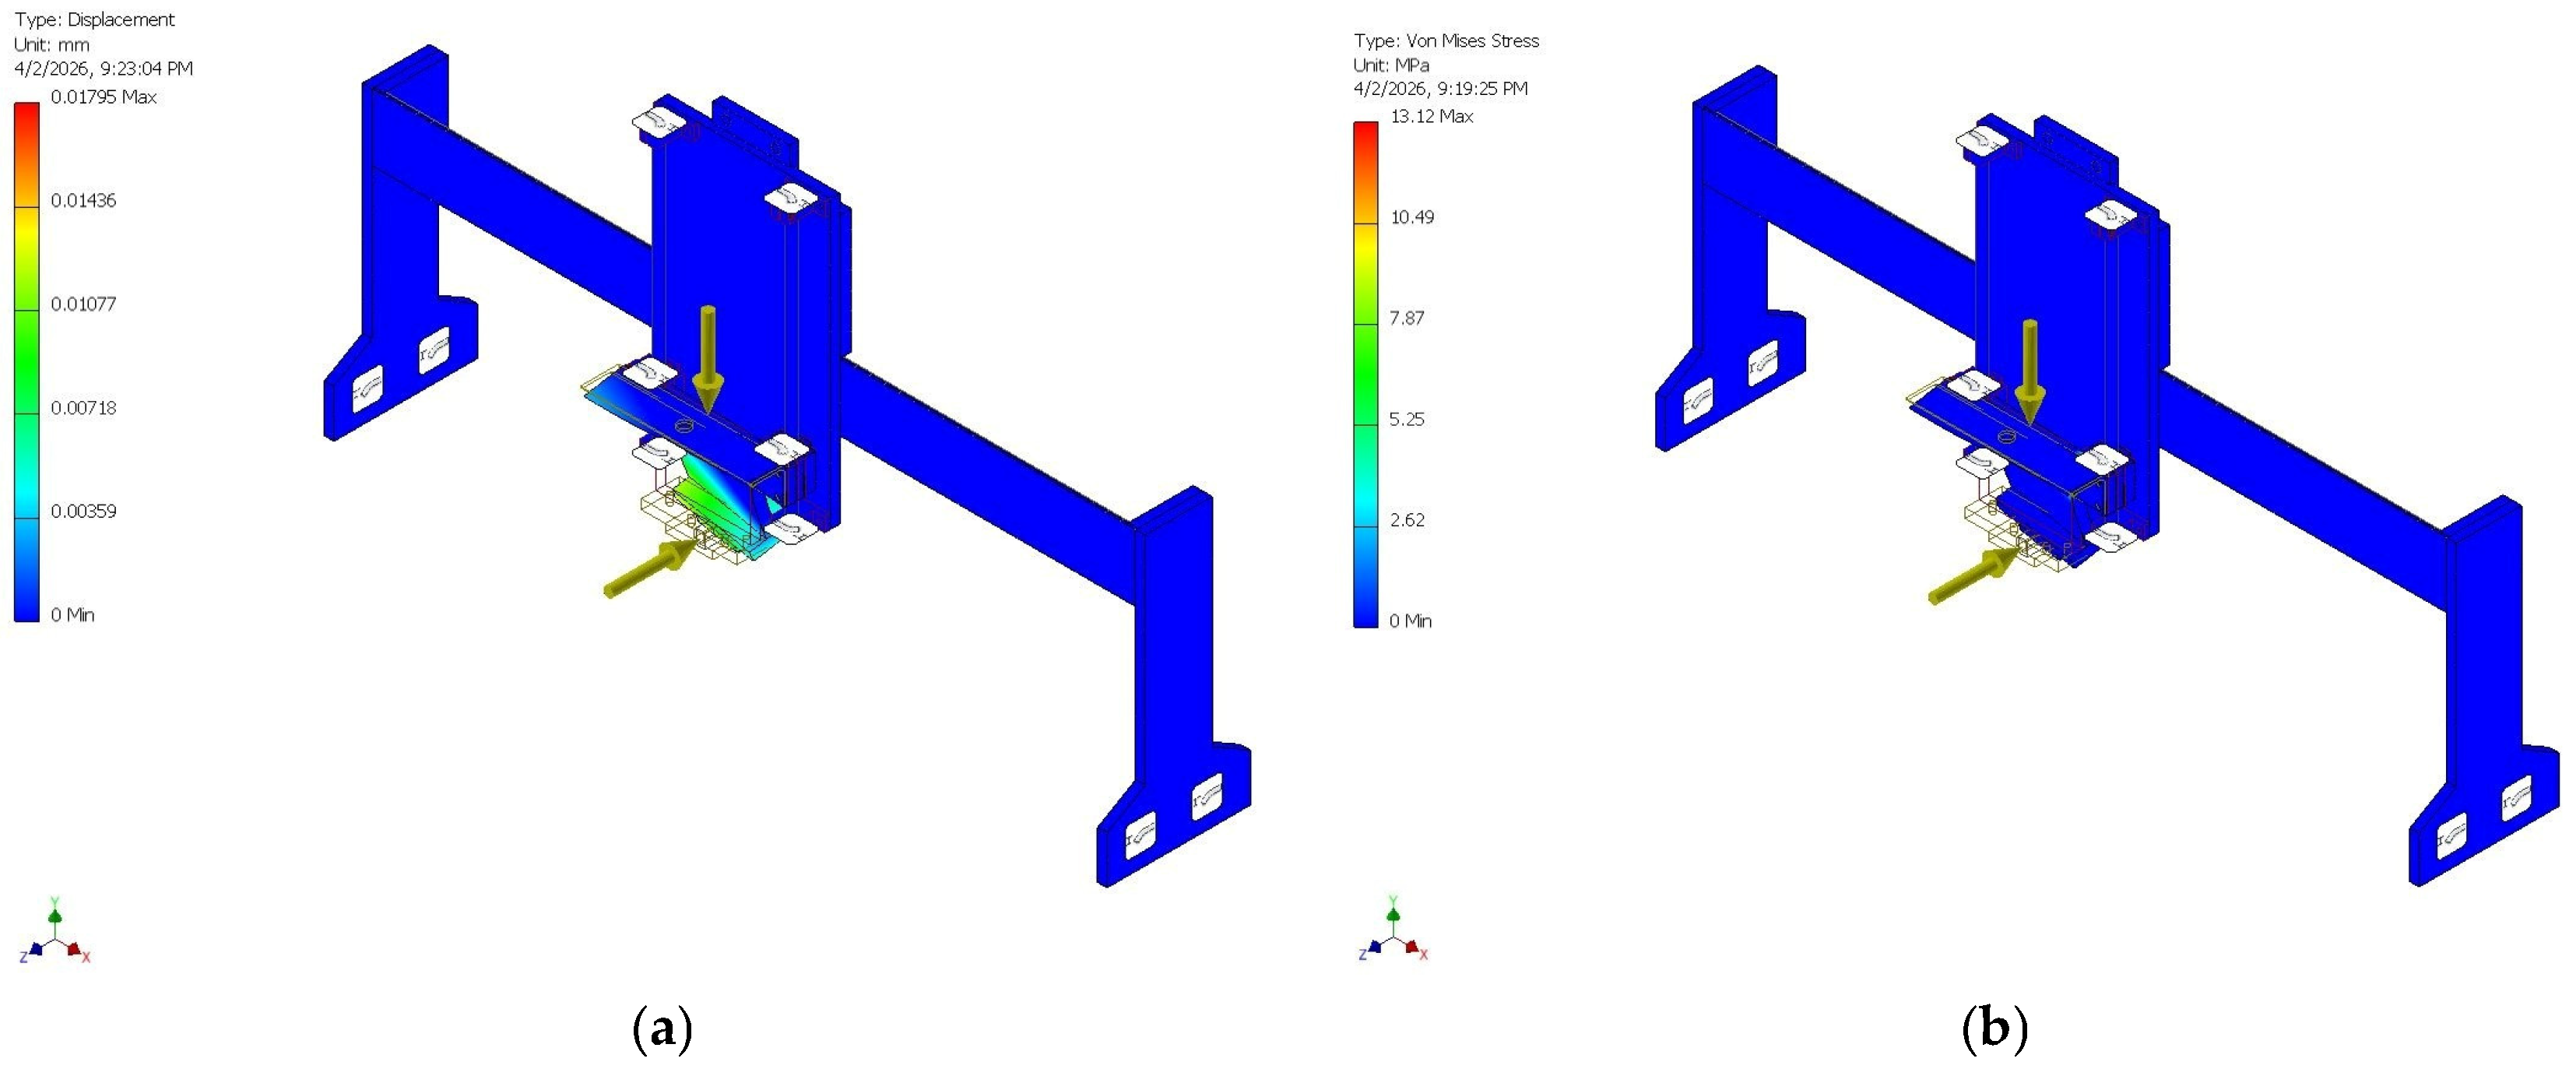
The distribution of total displacement is shown in Figure 7a, while the distribution of equivalent von Mises stress is presented in Figure 7b. This loading approach provides a more realistic assessment of the portal behavior compared to a purely normal loading case, as it includes the horizontal component arising from friction during tribometer operation. Particular attention was paid to the total displacement in the block holder region and the stress distribution in the load-bearing elements of the portal, as these parameters most directly indicate the ability to maintain geometric stability and proper alignment of the contact pair during testing. Based on the obtained results, it can be concluded that the portal structure for normal load application exhibits sufficient stiffness for its intended use. The recorded localized displacements are small, with a maximum value of 0.017 mm, indicating that no significant deviation of the pin position relative to the sliding track occurs. This is particularly important for maintaining stable contact conditions and ensuring experimental repeatability. In this context, the FEM analysis of the portal represents an important part of the system validation, confirming that the vertical load-bearing assembly can reliably transmit combined operational loads without significantly affecting the accuracy of tribological measurements.
Figure 7.
Static FEM analysis of the loading portal under the most unfavorable operating case: (a) total displacement distribution and (b) von Mises stress distribution, for a combined normal load of 100 N and friction force of 50 N.
The obtained results indicate that the portal structure provides sufficient stiffness for normal load application. The maximum localized displacement is 0.017 mm, while the maximum von Mises stress is approximately 13 MPa, which is well below the yield strength of structural steel.
5.2. Coefficient of Friction Measurements and Repeatability Analysis
Following the numerical validation of the structural stiffness of the tribometer, an experimental validation of its functional performance was carried out through measurements of the coefficient of friction under repeated testing conditions. The objective of this part of the study was not a detailed tribological analysis of the investigated contact pair but rather a verification of the capability of the developed device to provide stable reciprocating motion, reliable friction force measurement, and satisfactory repeatability of results under representative operating conditions. To this end, the tests were conducted at three different sliding velocities, with three repetitions performed for each condition. This experimental design enabled the assessment of the influence of sliding velocity on the shape and stability of the COF curves, as well as the evaluation of measurement repeatability under identical testing conditions.
5.2.1. Experimental Conditions
The experimental validation of the developed linear reciprocating tribometer was performed to assess its mechanical functionality, operational stability, and measurement reliability under representative operating conditions. The evaluation focused on the stability of reciprocating motion and the quality and repeatability of the friction force signal. Three baseline tests were conducted at sliding velocities of 10 mm/s, 15 mm/s, and 20 mm/s. For each test, a total sliding distance of 50 m was imposed by appropriately selecting the stroke length and test duration. The corresponding test durations were 1.23 h for 10 mm/s, 55 min for 15 mm/s, and 41 min for 20 mm/s. Force signals were continuously recorded at a sampling rate of 10,000 samples per second. During no-load operation, the measured force signal exhibited stable, periodic behavior associated with the reciprocating motion. A summary of the baseline test parameters and measured force and temperature levels is provided in Table 4.
Table 4.
Summary of the baseline test parameters.
Following the experimental validation of the developed tribometer under no-load conditions, tribological tests were performed under controlled normal loading of 19.62 N and sliding velocities of 10, 15, and 20 mm/s to investigate the frictional behavior of additively manufactured polycarbonate via fused filament fabrication (FFF). In these tribological tests, the contact surface of the polymer specimens corresponded to the as-printed texture generated by the build plate during the FFF process. Additionally, three repeated measurements were performed for each sliding velocity. The tribological testing conditions, as well as the measured coefficient of friction for each contact configuration and sliding condition, along with statistical parameters including standard deviation (SD) and coefficient of variation (%CV), are presented in Table 5. Previous studies [1,5] have shown that %CV values on the order of 10–15% can be considered satisfactory, as they include contributions from wear evolution, surface interactions, and dynamic effects during sliding. Therefore, %CV should be interpreted as a combined indicator of measurement system quality and tribological process stability rather than solely as a measure of experimental error.
Table 5.
Statistical analysis of the mean coefficient of friction, standard deviation and %CV.
Standard deviation (SD) values increase with sliding velocity, from 0.002 at 10 mm/s to 0.010 at 20 mm/s, indicating a gradual increase in signal dispersion. A similar trend is observed for %CV, which rises from 2.84% to 14.62%, showing reduced repeatability at higher sliding speeds. While the lowest velocity demonstrates very good repeatability, the highest velocity exhibits increased variability, although still within acceptable limits for tribological measurements.
5.2.2. Coefficient of Friction at Different Sliding Velocities
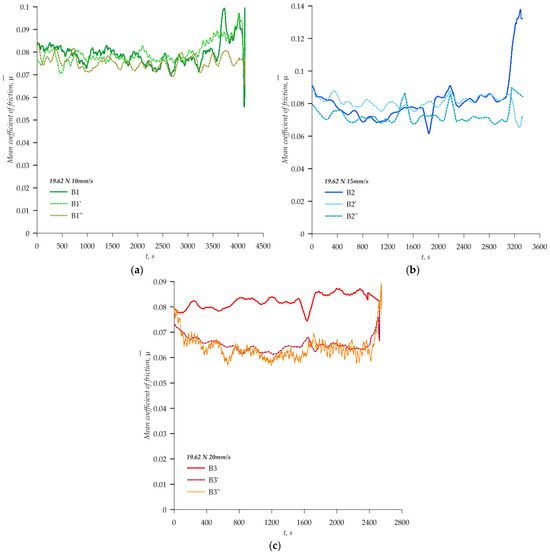
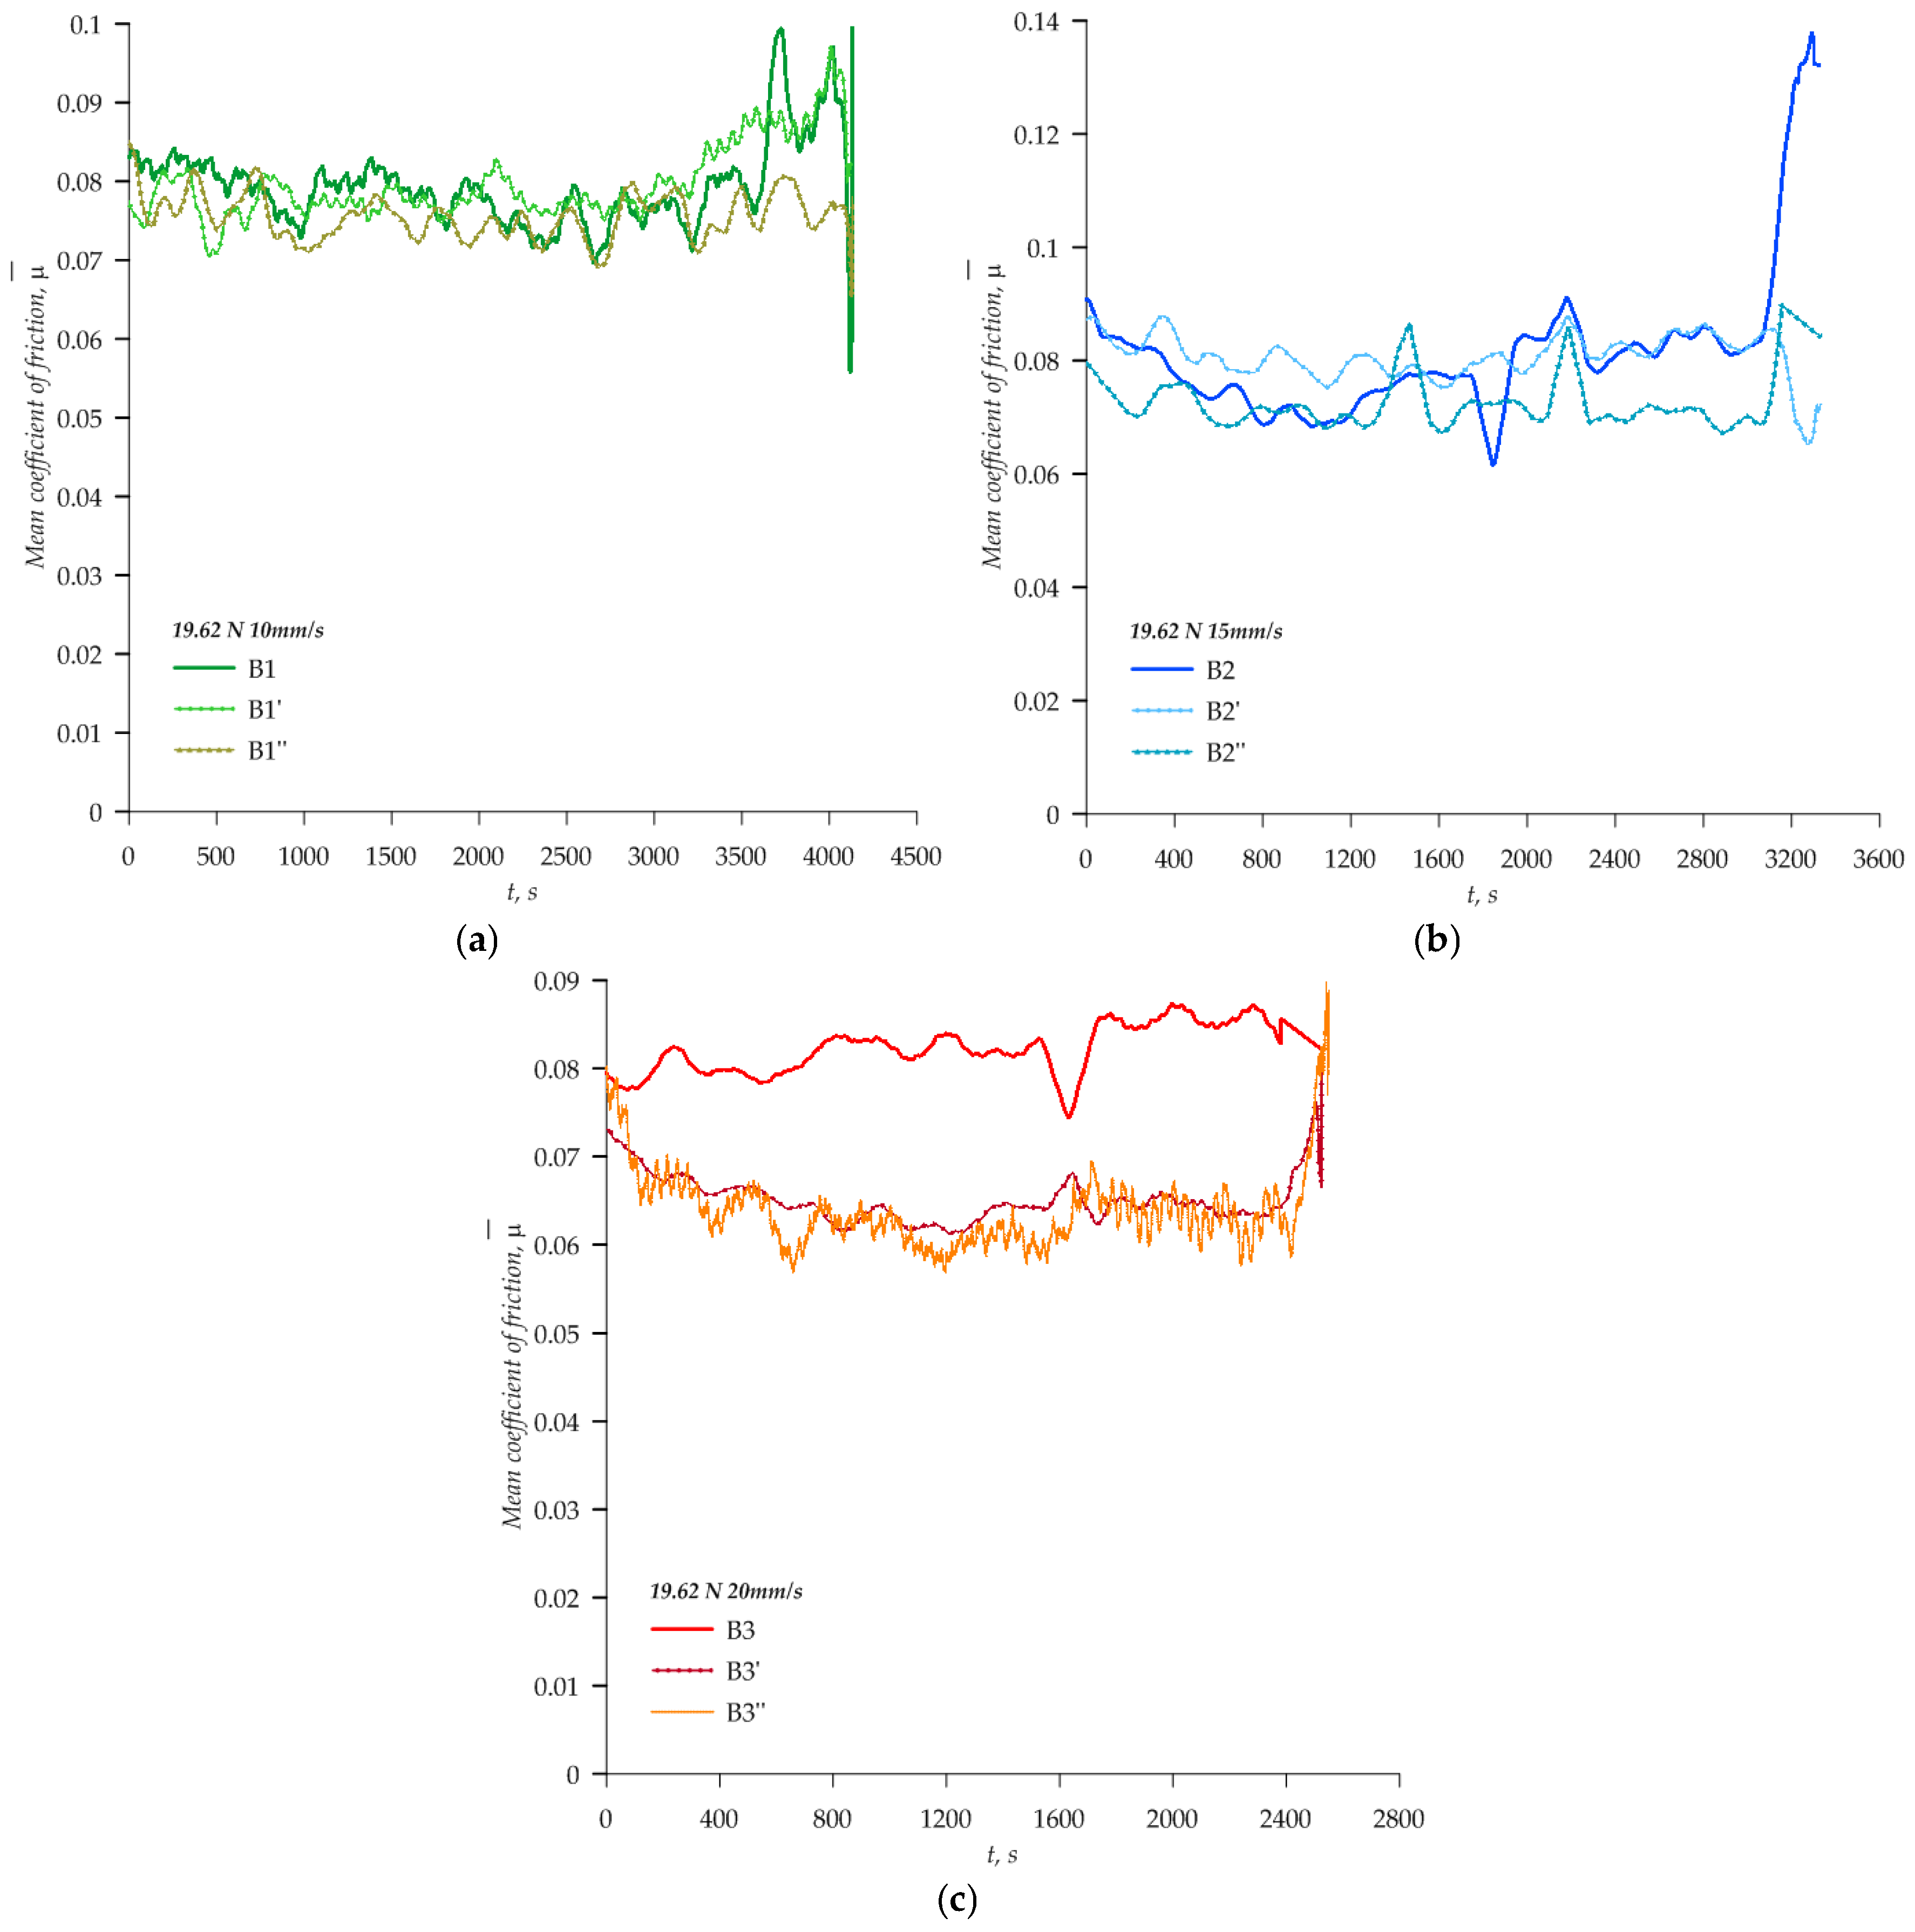
Figure 8 shows the experimentally obtained coefficient of friction curves for three different sliding velocities: 10 mm/s in Figure 8a, 15 mm/s in Figure 8b, and 20 mm/s in Figure 8c. For each operating condition, three repeated measurements are shown, enabling direct assessment of signal stability and repeatability under identical testing conditions.
Figure 8.
Coefficient of friction curves obtained during repeated tribological tests at different sliding velocities under a normal load of 19.62 N: (a) 10 mm/s, (b) 15 mm/s, and (c) 20 mm/s.
From the diagrams (Figure 8), it can be observed that the developed tribometer enables stable recording of the coefficient of friction during reciprocating motion. For each analyzed operating condition, good agreement in the overall shape of the COF curves is observed, although local deviations and oscillations of varying intensity are present in certain parts of the tests. This behavior can be attributed to the fact that the sliding track was manufactured in two parts and subsequently joined due to dimensional limitations of the 3D printing process. In all cases, an initial transient region can be identified, followed by a more stable operating region with reduced variations in the coefficient of friction. This response indicates that the mechanical structure, measurement system, and kinematic subsystem of the tribometer operate in a coordinated manner, without significant disturbances that could compromise friction force measurement. At a sliding velocity of 10 mm/s, shown in Figure 8a, very good overlap of repeated measurements is observed throughout most of the test, with a relatively low level of oscillations and limited separation between the curves. This result indicates stable operation of the tribometer at lower sliding speeds and good reproducibility of the measured COF signal. In Figure 8b, corresponding to a sliding velocity of 15 mm/s, satisfactory agreement between repeated measurements is also observed, although local oscillations and occasional deviations between individual curves are somewhat more pronounced compared to the 10 mm/s case. Nevertheless, the overall shape of the curves remains consistent, confirming that the tribometer provides stable reciprocating motion and reliable friction force measurement under these conditions as well. At the highest analyzed sliding velocity of 20 mm/s, shown in Figure 8c, a greater separation between the curves and increased dynamic variability of the signal can be observed. This behavior indicates that increasing sliding velocity leads to a more complex dynamic response of both the system and the contact process. However, even in this case, good agreement in the overall trend of the curves is maintained, without the occurrence of irregular or uncontrolled deviations, confirming that the tribometer can operate reliably at higher sliding regimes within the analyzed range. Overall, Figure 8 confirms that the developed tribometer enables stable and sufficiently repeatable friction force acquisition across the analyzed sliding-velocity range.
5.3. Noise Measurements Under Different Operating Conditions of the Custom Linear Reciprocating Tribometer
In addition to structural stiffness and repeatability of friction measurements, the acoustic behavior of the developed tribometer was also analyzed as part of the validation procedure. Noise measurements were performed at three representative sliding velocities (10, 15, and 20 mm/s) and at three distances from the contact zone (0.5, 1, and 2 m), resulting in nine testing conditions summarized in Table 6.
Table 6.
Overview of the noise-measurement conditions.
Noise measurements were performed using a Trust Van Barcelona 600 microphone, which was positioned at predefined distances from the tribometer contact zone during testing. This setup enabled comparison of noise levels not only as a function of the operating speed of the device but also as a function of the distance from the location of dominant acoustic emission. The aim of these measurements was to determine whether an increase in operating speed leads to changes in the level of emitted noise, as well as to evaluate how the noise level varies with distance from the contact zone. In this context, noise analysis serves as an additional indicator of the dynamic behavior of the tribometer and its operational characteristics under realistic laboratory conditions.
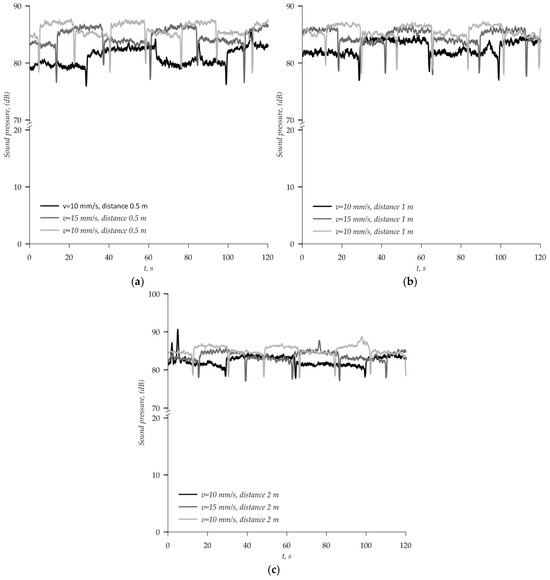
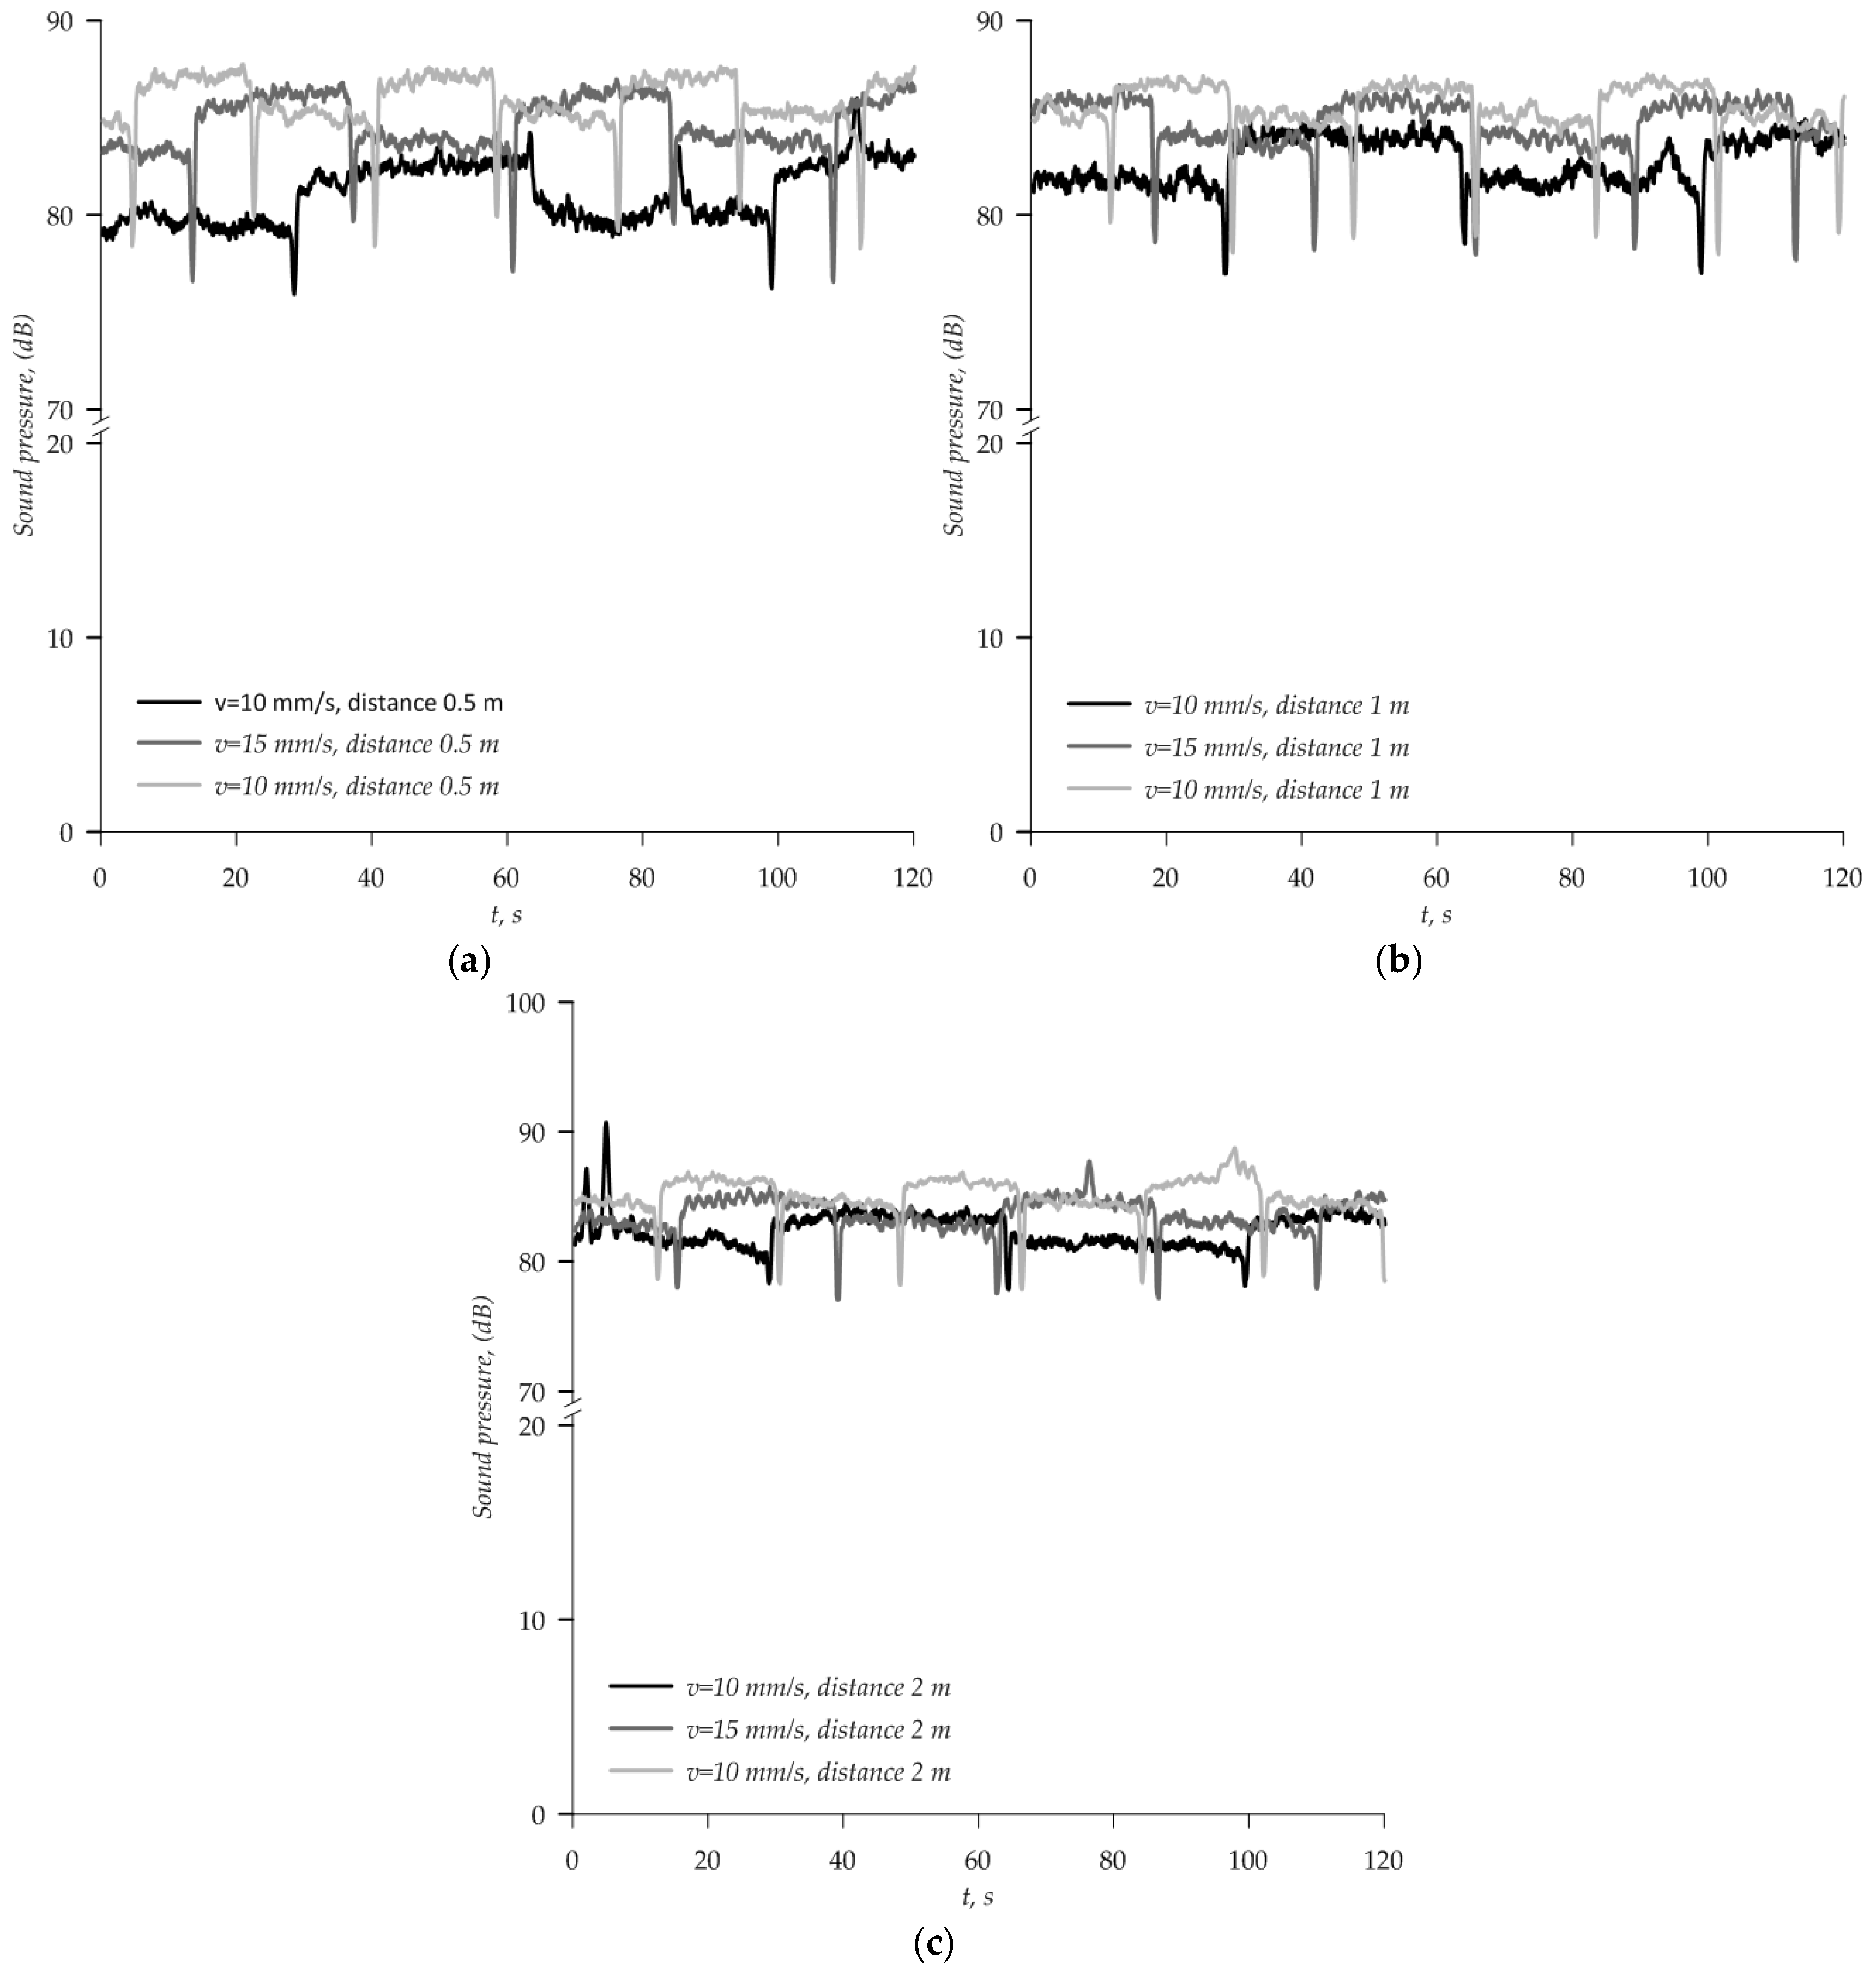
The results of noise measurements under different operating conditions are presented in Table 7 and Figure 9. Based on the obtained values, it can be observed that the developed tribometer generates a measurable and stable acoustic response during operation, with the noise level varying as a function of both the reciprocating velocity and the distance from the contact zone. At a sliding velocity of 10 mm/s, the recorded noise levels ranged from 65.228 dB to 91.584 dB; at 15 mm/s, they ranged from 64.708 dB to 90.628 dB; and at 20 mm/s, they ranged from 66.096 dB to 89.362 dB.
Table 7.
Summary of measured noise level characteristics, including minimum and maximum values and standard deviation, for different sliding velocities and measurement distances.
Figure 9.
The results of noise measurements under different sliding velocities and distances from the contact zone: (a) 0.5 m, (b) 1 m and (c) 2 m.
The obtained results indicate that increasing sliding velocity does not lead to a pronounced monotonic increase in emitted noise, as the values remain within a similar range with minor variations influenced by the measurement distance. At a distance of 0.5 m, the maximum noise level increases from 87.514 dB at 10 mm/s to 89.401 dB at 15 mm/s and then remains nearly unchanged at 20 mm/s (89.302 dB). At distances of 1 m and 2 m, smaller fluctuations are observed, while the standard deviation for all operating conditions ranges between 1.868 dB and 3.119 dB. At the same time, the absence of sudden or irregular spikes in noise levels indicates that the system does not exhibit significant mechanical instabilities, impacts, or other disturbances during operation that could suggest unfavorable dynamic behavior of the structure.
The analysis of noise levels indicates that the developed tribometer maintains stable acoustic behavior under all tested operating conditions, without the occurrence of pronounced anomalies that would indicate mechanical instability of the system. In this context, the noise measurement results can be considered as an additional confirmation of the proper operation of the drive system, linear guides, and moving assemblies during reciprocating motion. The variation in noise levels with increasing sliding velocity can be attributed to increased dynamic activity of the moving components and more intensive operation of the drive system, while the obtained standard deviation values in the range of 1.868 dB to 3.119 dB indicate a stable acoustic response of the system. Overall, the results presented in this chapter confirm that the developed linear reciprocating tribometer, in addition to satisfactory structural stiffness and repeatability of tribological measurements, also exhibits acceptable acoustic performance within the analyzed range of operating speeds. In this way, noise analysis represents an additional element of experimental validation and contributes to a more comprehensive evaluation of the device functionality in laboratory applications.
5.4. Comparison with Previously Reported Reciprocating Tribometers
In order to further position the developed tribometer within the context of previously reported reciprocating testing systems, a comparative overview is presented in this section. The comparison includes several tribometers described in the literature and considers the main functional and operating characteristics, including motion type, contact configuration, maximum stroke length, sliding velocity, and normal load capacity. Such a comparison makes it possible to highlight the practical capabilities of the developed device and to better assess its relevance for controlled laboratory-scale tribological investigations. Table 8 shows a comparison of the developed tribometer with previously reported reciprocating tribometers.
Table 8.
Comparison of the developed tribometer with previously reported reciprocating tribometers.
As shown in Table 8, the developed tribometer provides a balanced combination of stroke length, sliding-velocity range, and normal-load capacity compared with previously reported reciprocating tribometers. Although some systems described in the literature offer higher maximum loads or broader operating ranges, they are often more complex or more strongly tailored to specific applications. In contrast, the tribometer developed in this study was conceived as a laboratory-scale system that combines modular contact configuration, controlled reciprocating motion, and reliable friction force acquisition. The obtained validation results additionally confirm that the proposed design ensures stable operation, limited structural deformation, and satisfactory repeatability within the investigated operating range.
6. Conclusions
Based on the conducted numerical and experimental validation, the developed linear reciprocating tribometer showed satisfactory performance within the analyzed operating range. The device combines a programmable stroke of up to 500 mm with a sliding-velocity range of 0.1–50 mm/s, while the present experimental validation was performed at representative velocities of 10, 15, and 20 mm/s. FEM analysis of the two critical structural subsystems confirmed sufficient stiffness: the moving plate assembly exhibited a maximum displacement of 0.1664 mm and a maximum von Mises stress of 7.47 MPa under a 100 N load, whereas the loading portal showed a maximum localized displacement of 0.017 mm and a maximum stress of approximately 13 MPa under combined normal and tangential loading. These results indicate that structural deformation is limited and is not expected to significantly disturb contact conditions during the performed tests.
Repeated experimental tests confirmed stable reciprocating motion and reliable friction force measurement under representative laboratory conditions. The obtained coefficients of variation were 2.84%, 5.90%, and 14.62% at 10, 15, and 20 mm/s, respectively, indicating good repeatability at lower and medium speeds and acceptable repeatability at the highest analyzed speed. Additional noise measurements performed at different distances and operating speeds produced standard deviation values between 1.868 and 3.119 dB, without pronounced anomalies, providing an additional indicator of stable system operation.
Overall, the present study demonstrates that the developed tribometer can be used for controlled reciprocating tribological testing with a defined stroke length, sliding velocity, test duration, and normal load within the analyzed range. The comparison with previously reported reciprocating tribometers additionally confirmed the practical relevance of the developed system for controlled laboratory-scale tribological testing. However, the reported results should be interpreted as representative validation rather than exhaustive experimental mapping of the full design envelope. Future work will focus on tribological testing of different polymer materials and on the application of bio-lubricants under reciprocating sliding conditions.
Author Contributions
Conceptualization, J.M. and M.M. (Marija Matejić); methodology, M.M. (Miloš Matejić); software, B.B.; validation, I.M. and M.M. (Miloš Matejić); formal analysis, J.S. and M.M. (Marija Matejić); experiment preparation, J.M.; investigation, M.M. (Marija Matejić); resources, I.M.; data curation, B.B.; writing—original draft preparation, J.M.; writing—review and editing, M.M. (Miloš Matejić); visualization, I.M.; supervision, J.S. and M.M. (Miloš Matejić); project administration, J.M.; funding acquisition, B.B. All authors have read and agreed to the published version of the manuscript.
Funding
This research received no external funding. The whole investigation was funded by the authors.
Data Availability Statement
The original contributions presented in this study are included in the article. Further inquiries can be directed to the corresponding author.
Acknowledgments
During the preparation of this manuscript, the authors used ChatGPT 5.2 for minor language polishing and grammar improvement in order to enhance the clarity and readability of the manuscript. The authors have reviewed and edited the output and take full responsibility for the content of this publication.
Conflicts of Interest
Author Bojan Bogdanović was employed by the company Hexagon AB. The remaining authors declare that the research was conducted in the absence of any commercial or financial relationships that could be construed as a potential conflict of interest.
Abbreviations
The following abbreviations are used in this manuscript:
| CAD | Computer-aided design |
| COF | Coefficient of friction |
| PC | Personal computer |
| CV | Coefficient of variation |
| SD | Standard deviation |
| Nomenclature | |
| P | screw lead (mm/rev) |
| v | linear sliding velocity (mm/s) |
| vmax | maximum sliding velocity (mm/s) |
| f | maximum programmed feed rate (mm/min) |
| m | translational mass of moving assembly (kg) |
| a(t) | time-dependent linear acceleration (m/s2) |
| amax | maximum linear acceleration (m/s2) |
| Fi | inertial force (N) |
| Fin, max | maximum inertial force (N) |
| Fres | mechanical resistance force (N) |
| Fdrive | total driving force (N) |
| Ff | friction force (N) |
| FN | normal load (N) |
| μ | coefficient of friction |
| T | temperature (°C) |
| fs | sampling frequency (samples/s) |
| Lguide | linear guide length (mm) |
| Lplate | moving plate length in sliding direction (mm) |
| ⟨|F|⟩ | mean absolute resistance force (N) |
References
- Orgeldinger, C.; Rosnitschek, T.; Tremmel, S. Unveiling an Additively Manufactured Open Hardware Pin-on-Disc Tribometer Considering Its High Reproducibility. Wear 2024, 552–553, 205437. [Google Scholar] [CrossRef] [Scilit]
- Perović, A.; Čukić, S.; Miladinović, S.; Matejić, M.; Gajević, S.; Stojanović, B. Development and Experimental Validation of a Pin-on-Disc Tribometer for Friction Testing of Different Metal Materials. Tribol. Ind. 2026, 48, 188–198. [Google Scholar] [CrossRef] [Scilit]
- Miladinović, S. Tribological Behavior of Hypereutectic Al–Si Based Composites Under Lubricated Conditions. Ph.D. Thesis, University of Kragujevac, Faculty of Engineering, Kragujevac, Serbia, 2024. [Google Scholar]
- Ramalho, A.; Vilhena, L. Experimental Approach in Tribology: Effects of Test Equipment Dynamic Response on the Reliability and Reproducibility of the Results. Wear 2025, 571, 205770. [Google Scholar] [CrossRef] [Scilit]
- Żurowski, W.; Zepchło, J.; Kanaška, D.; Rucki, M. Concept and Assessment of the Novel Design of Tribological Tester. Measurement 2021, 165, 108724. [Google Scholar] [CrossRef] [Scilit]
- Mohamed, Y.S.; Abdelbary, A. Design and Construction of a Novel Reciprocating Pin-on-Plate Wear Testing Machine. Mansoura Eng. J. 2024, 49, 19. [Google Scholar] [CrossRef] [Scilit]
- Valdes, M.J.; Ardila Marín, J.G.; Rodríguez-Cabal, M.A.; Betancur, J.D. TRIBOMETRY: How Is Friction Research Quantified? A Review. Int. J. Eng. Res. Technol. 2020, 13, 2596–2610. [Google Scholar] [CrossRef] [Scilit]
- Abdelbary, A.; Abouelwafa, M.N.; El Fahham, I.M.; Gomaa, A.I. A New Reciprocating Tribometer for Wear Testing under Different Fluctuating Loading Conditions. Alex. Eng. J. 2004, 43, 615–619. [Google Scholar]
- Maldonado Cortés, D.; Peña Parás, L.; Pérez Alvizo, L.; Rangel Acosta, Y.L.; Puente Martínez, J.R. Reciprocating Sliding Motion Tribometer Design. In Proceedings of the International Conference on Industrial Engineering and Operations Management, Monterrey, Mexico, 3–5 November 2021. [Google Scholar]
- Poulios, K.; Drago, N.; Klit, P.; De Chiffre, L. A Reciprocating Pin-on-Plate Test-Rig for Studying Friction Materials for Holding Brakes. Wear 2014, 311, 40–46. [Google Scholar] [CrossRef] [Scilit]
- Mohan, C.B.; Divakar, C.; Venkatesha, K.; Gopalakrishna, K.; Mahesh Lohitha, K.S.; Naveena, T.N. Design and Development of an Advanced Linear Reciprocating Tribometer. Wear 2009, 267, 1111–1116. [Google Scholar] [CrossRef] [Scilit]
- Marjanović, N.; Tadić, B.; Ivković, B.; Mitrović, S. Design of Modern Concept Tribometer with Circular and Reciprocating Movement. Tribol. Ind. 2006, 28, 3–8. [Google Scholar]
- Blau, P.J. Friction Science and Technology: From Concepts to Applications, 2nd ed.; CRC Press: Boca Raton, FL, USA, 2009; ISBN 978-1-4200-5404-0. [Google Scholar]
- Viswanathan, H.T.; John, P.K.; Rajalekshmi, R.V. Experimental Modal Analysis of a Linear Reciprocating Tribometer for Maximum Reciprocating Frequency. J. Eng. Res. 2022, 10, 173–186. [Google Scholar] [CrossRef] [Scilit]
- Oprișan, C.M.; Chiriac, B.; Tufescu, A.; Olaru, D.N. Static and Dynamic Friction Coefficient in Low Loads and Sliding Speed Conditions. IOP Conf. Ser. Mater. Sci. Eng. 2022, 1262, 012012. [Google Scholar] [CrossRef] [Scilit]
- Küçüköztaş, K.; Talay, İ.; Çalışkan, F.; El Sakka, M.; Nassar, M.; Kaftanoğlu, B. Design and Manufacturing of a Pin on Disk Tribometer. Makina Tasarım ve İmalat Derg. 2024, 22, 31–42. [Google Scholar] [CrossRef] [Scilit]
- Stolarski, T.A. Tribology in Machine Design; Butterworth-Heinemann: Oxford, UK, 1990; ISBN 0-7506-3623-8. [Google Scholar]
- Kano, S. A Short Review: Tribology in Machining to Understand Conventional and Latest Modeling Methods with Machine Learning. Machines 2025, 13, 81. [Google Scholar] [CrossRef] [Scilit]
- ASTM G133-22; Standard Test Method for Linearly Reciprocating Ball-on-Flat Sliding Wear. ASTM International: West Conshohocken, PA, USA, 2022.
- ISO 7148-2; Plain Bearings—Testing of the Tribological Behaviour of Bearing Materials—Part 2: Testing of Polymer-Based Bearing Materials. ISO: Geneva, Switzerland, 2012.
- Marković, J.; Matejić, M.; Rangelov, D.; Banić, M.; Skerlić, J.; Jeremić, N.; Matejić, M. Tribological and Rheological Characterization of 3D Printed Polycarbonate: Effect of Layer Orientation, Surface Topography, and Lubrication Conditions. Lubricants 2026, 14, 28. [Google Scholar] [CrossRef] [Scilit]
- SAH Electronics. CZL301 Load Cell Specifications. Available online: http://stari.sah.rs/Senzori/CZL301_eng.html (accessed on 15 February 2026).



Disclaimer/Publisher’s Note: The statements, opinions and data contained in all publications are solely those of the individual author(s) and contributor(s) and not of MDPI and/or the editor(s). MDPI and/or the editor(s) disclaim responsibility for any injury to people or property resulting from any ideas, methods, instructions or products referred to in the content. |
© 2026 by the authors. Licensee MDPI, Basel, Switzerland. This article is an open access article distributed under the terms and conditions of the Creative Commons Attribution (CC BY) license.