


Abstract
Vehicle recharge time is a key barrier to widespread adoption of battery electric trucks, where megawatt class charging could be used to achieve refueling times comparable to internal combustion vehicles. This work presents the design and validation of a megawatt-capable rechargeable energy storage system (144 kWh, 40P384S) together with a physics-based modeling framework for safe 1 MW operation. The pack architecture is reconfigurable, enabling nominal 750 V (80P192S) propulsion mode as well as 1125 V and 1500 V charging modes compatible with the Megawatt Charging System (MCS). An equivalent circuit model is developed to relate cell-level parameters to pack-level power, heat generation, and temperature rise, providing guidance on feasible charge profiles and thermal limits. A Simulink-based digital twin of the reconfigurable pack is then used to analyze sensitivity to current sensor mismatch and to verify protection logic for multiple bus voltage configurations. Finally, pack tests up to 1 MW confirm the model-predicted operating envelope and illustrate practical constraints imposed by charger voltage and pack resistance. The combined hardware and modeling approach provides a reusable platform for studying extreme fast charging of medium- and heavy-duty BEV packs-class charging -capable rechargeable energy storage system (144 kWh, 40P384S) together with a physics-based modeling framework for safe 1 MW operation. The pack architecture is reconfigurable, enabling nominal 750 V (80P192S) propulsion mode as well as 1125 V and 1500 V charging modes compatible with the Megawatt Charging System (MCS). An equivalent-circuit model is developed to relate cell-level parameters to pack-level power, heat generation, and temperature rise, providing guidance on feasible charge profiles and thermal limits. A Simulink-based digital twin of the reconfigurable pack is then used to analyze sensitivity to current–sensor mismatch and to verify protection logic for multiple bus-voltage configurations. Finally, pack tests up to 1 MW confirm the model-predicted operating envelope and illustrate practical constraints imposed by charger voltage and pack resistance. The combined hardware and modeling approach provides a reusable platform for studying extreme fast charging of medium- and heavy-duty BEV packs.
1. Introduction
The automotive industry is rapidly transitioning toward battery electric vehicles (BEVs), and General Motors has introduced multiple electric vehicle (EV) products to address both market demand and regulatory drivers. Achieving a successful transition, however, requires overcoming several coupled challenges, including approaching cost parity with internal-combustion-engine (ICE) vehicles and addressing customer concerns about range and refueling convenience.
For many customers, range anxiety is driven as much by refueling time as by absolute range. Vehicles with modest pack capacities, sparse charging infrastructure, or long recharge times relative to a conventional fuel stop contribute to this concern. Fast refueling for larger BEV platforms implies charge powers on the order of a megawatt or higher; for example, adding 100 kWh in 5 min requires an average of about 1.2 MW, and delivering 150 miles of range in 18 min to a vehicle that consumes 2 kWh/mi similarly calls for roughly 1 MW of average charging power [1]. While such requirements are most acute for medium- and heavy-duty fleets with large packs and high duty cycles, smaller packs on light-duty products face additional stress because the same absolute power translates to higher cell-level C-rates.
Several technical constraints limit practical implementation of 1 MW-class charging. At the cell level, chemistry and design impose upper bounds on sustainable C-rate and temperature rise for acceptable life. At the pack level, propulsion-system architecture and wiring resistance determine how much current can be carried without excessive losses. Thermal management of the rechargeable energy storage system (RESS) and charging equipment in a stationary vehicle must remove substantial transient heat loads, and external infrastructure must provide megawatt-scale electric vehicle supply equipment (EVSE) and appropriate standards. For very large packs (e.g., ~900 kWh for a Class 8 truck), a 1 MW charger represents only ~1.1C and benefits from substantial thermal mass, whereas a ~200 kWh medium-duty pack experiences much higher relative loading. Our goal is to address these constraints for a range of applications, with particular emphasis on medium-duty pickups and commercial vehicles where removing charging limitations is critical to duty-cycle viability.
In parallel with vehicle and pack development, there has been substantial work on the broader megawatt charging ecosystem. Schneider et al. [2] analyze the Megawatt Charging System (MCS) standard and its implications for battery sizing and cell properties in long-haul battery electric trucks, showing how MCS can enable recharging during mandatory rest periods. Makoschitz [3] examines strategies for megawatt-range fast charging using direct medium-voltage grid connection, highlighting the role of distributed charging and low carbon generation. Recent efforts at Argonne National Laboratory and within the SAE J3271 working group have further clarified MCS technical and operational requirements, emphasizing that 1–2 MW charge powers are needed to recover several hundred miles of range within a single rest period.
On the infrastructure and power-electronics side, Wang et al. [4] propose megawatt-class charging architectures with enhanced grid-support functionality, integrating grid energy storage and renewables to enable bidirectional power flows. Bommenahalli and Chandran [5] compare MCS deployment in North America, Europe, and China, underscoring the importance of coordinated planning to avoid local grid bottlenecks. Ahmadi et al. [6] survey station topologies and evaluate them in terms of grid support, power density, modularity, and other factors. Zhu et al. [7] performed a comprehensive grid-impact study for heavy-duty EV charging stations, showing that multi-megawatt charging loads can impose significant stresses on distribution feeders if not mitigated.
System-level station concepts have also been explored. Moorthy et al. [8] describe a multi-port megawatt charging architecture capable of serving light-, medium-, and heavy-duty vehicles from a common DC bus interfacing grid, PV, and stationary storage. Li et al. [9] review the international status of megawatt-level charging standards and pilot deployments, and propose recommendations for standards, industry, and policy based on Chinese and global experience. Srdic and Lukic [10] investigate directly connecting extreme fast-charging stations to medium-voltage lines to eliminate several conversion stages and large low-frequency transformers, identifying both efficiency gains and remaining adoption barriers.
Other work focuses on integrating megawatt charging into broader energy systems. Gabbar et al. [11] developed a fast-charging system for e-bus applications that couples micro-grid resources, hybrid storage, and an energy-management layer to reduce dependence on the main grid. Mohamed et al. [12] highlight that electrifying medium- and heavy-duty trucks will likely necessitate megawatt-scale stations and show how distributed energy resources can mitigate grid stress and charging cost. Iyer et al. [13] propose an extreme fast-charging station architecture that serves multiple vehicles with 300-mile packs in ~15 min by using partial-power dc–dc converters, reducing redundancy relative to traditional full-rated converters.
Thermal aspects of megawatt interfaces have been addressed by Hang et al. [14], who use ACN-Sim-based simulation and hardware-in-the-loop methods to study megawatt-scale connector and interface thermal management. In practice, deployment at full MCS power remains limited; most public infrastructure is still concentrated at Level 2 and DC fast-charging levels. Zhu [15] reports on a U.S. Department of Energy-sponsored project demonstrating a 400 kW extreme fast charger using a medium-voltage solid-state transformer architecture, with General Motors serving as the battery- and vehicle-integration subcontractor. Table 1 summarizes typical charging options; as of the second quarter of 2024, the overwhelming majority of publicly deployed chargers in the U.S. were Level 2 or DC fast chargers rated at 350 kW or lower [16].
Table 1.
EV Charging Options.
The present paper is an extended version of our earlier conference publication: Guralp, O., Bucknor, N., and Raghavan, M., “Megawatt Charging—Towards ‘Fast as Gas’”, Mechanical Engineering Solutions 2025, Yerevan, Armenia, 17–19 September 2025, pp. 99–109 [17]. That work primarily introduced the megawatt-capable hardware platform. Here we significantly expand on it by:
- Developing and validating a physics-based equivalent-circuit and thermal model that links cell-level parameters to pack-level power, heat generation, and safe 1 MW charge profiles.
- Implementing a Simulink-based digital twin of the reconfigurable pack to study sensitivity to current-sensor mismatch and to verify protection logic across 750 V, 1125 V, and 1500 V operating modes.
- Performing detailed pack testing to extract both cell and system resistances and to confirm model-predicted operating envelopes during megawatt-class charge events.
Together, these contributions provide not only a flexible RESS testbed but also a reusable modeling and safety-analysis framework for megawatt-scale charging of medium- and heavy-duty BEV packs.
2. Pack Architecture
The architecture for the high-power RESS test article was shaped by four main requirements: (i) the ability to sustain short-duration charge pulses at approximately 1 MW, (ii) a bus configuration that could be rearranged to explore multiple voltage and capacity modes, (iii) compatibility with the Megawatt Charging System (MCS) interface and its associated standards, and (iv) compliance with all applicable battery and high-voltage safety constraints. Because this was an experimental platform, we prioritized the use of commercially available components and repurposed existing hardware wherever feasible.
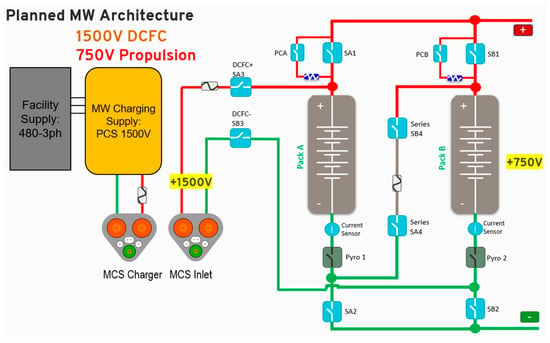
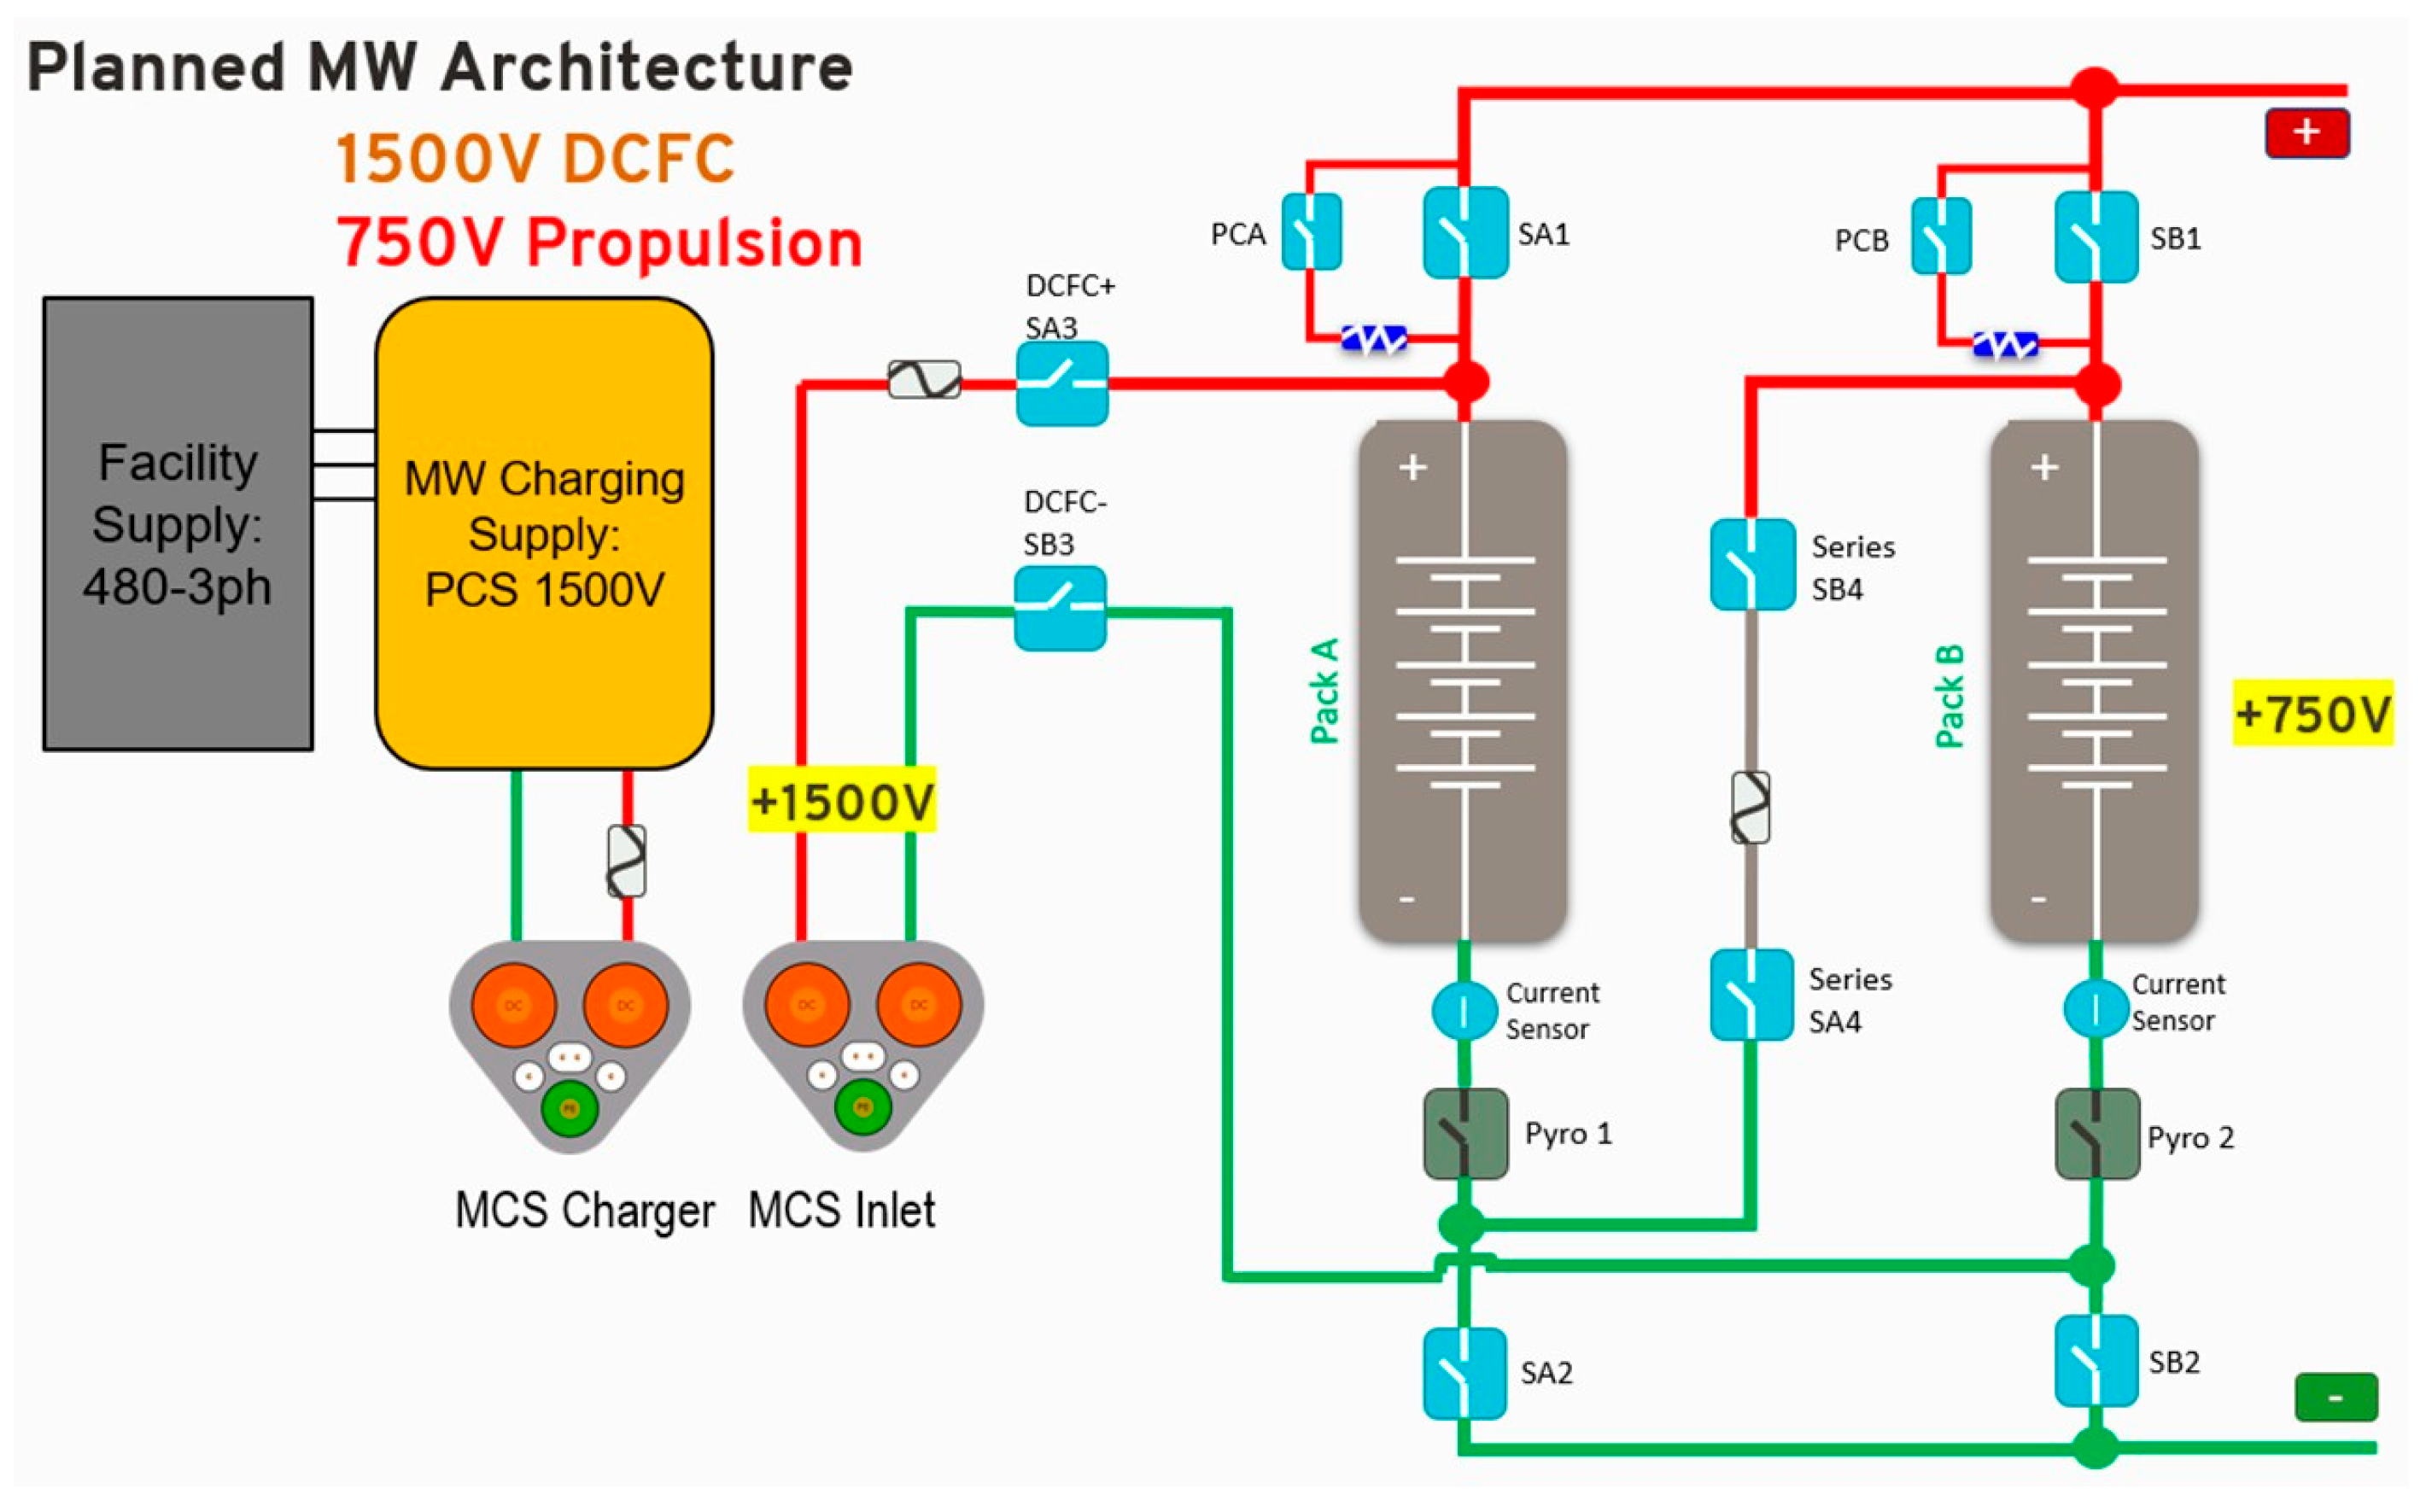
Early in the program, a top-level architecture was selected to maximize the likelihood of meeting these objectives. The resulting concept, shown schematically in Figure 1, closely matches the final implemented design. The charging configuration is based on a 1500 V DC bus so that the current required to reach 1000 kW remains within the capabilities of available test cyclers at General Motors (GM). The pack is partitioned into large subpacks interconnected through contactors, fuses, and pre-charge elements, allowing multiple series/parallel pack configurations. An MCS charge inlet, rated at the same 1500 V level, provides the external interface.
Figure 1.
1 MW RESS high-level architecture.
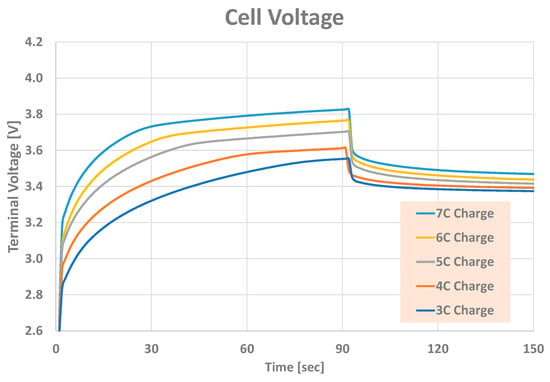
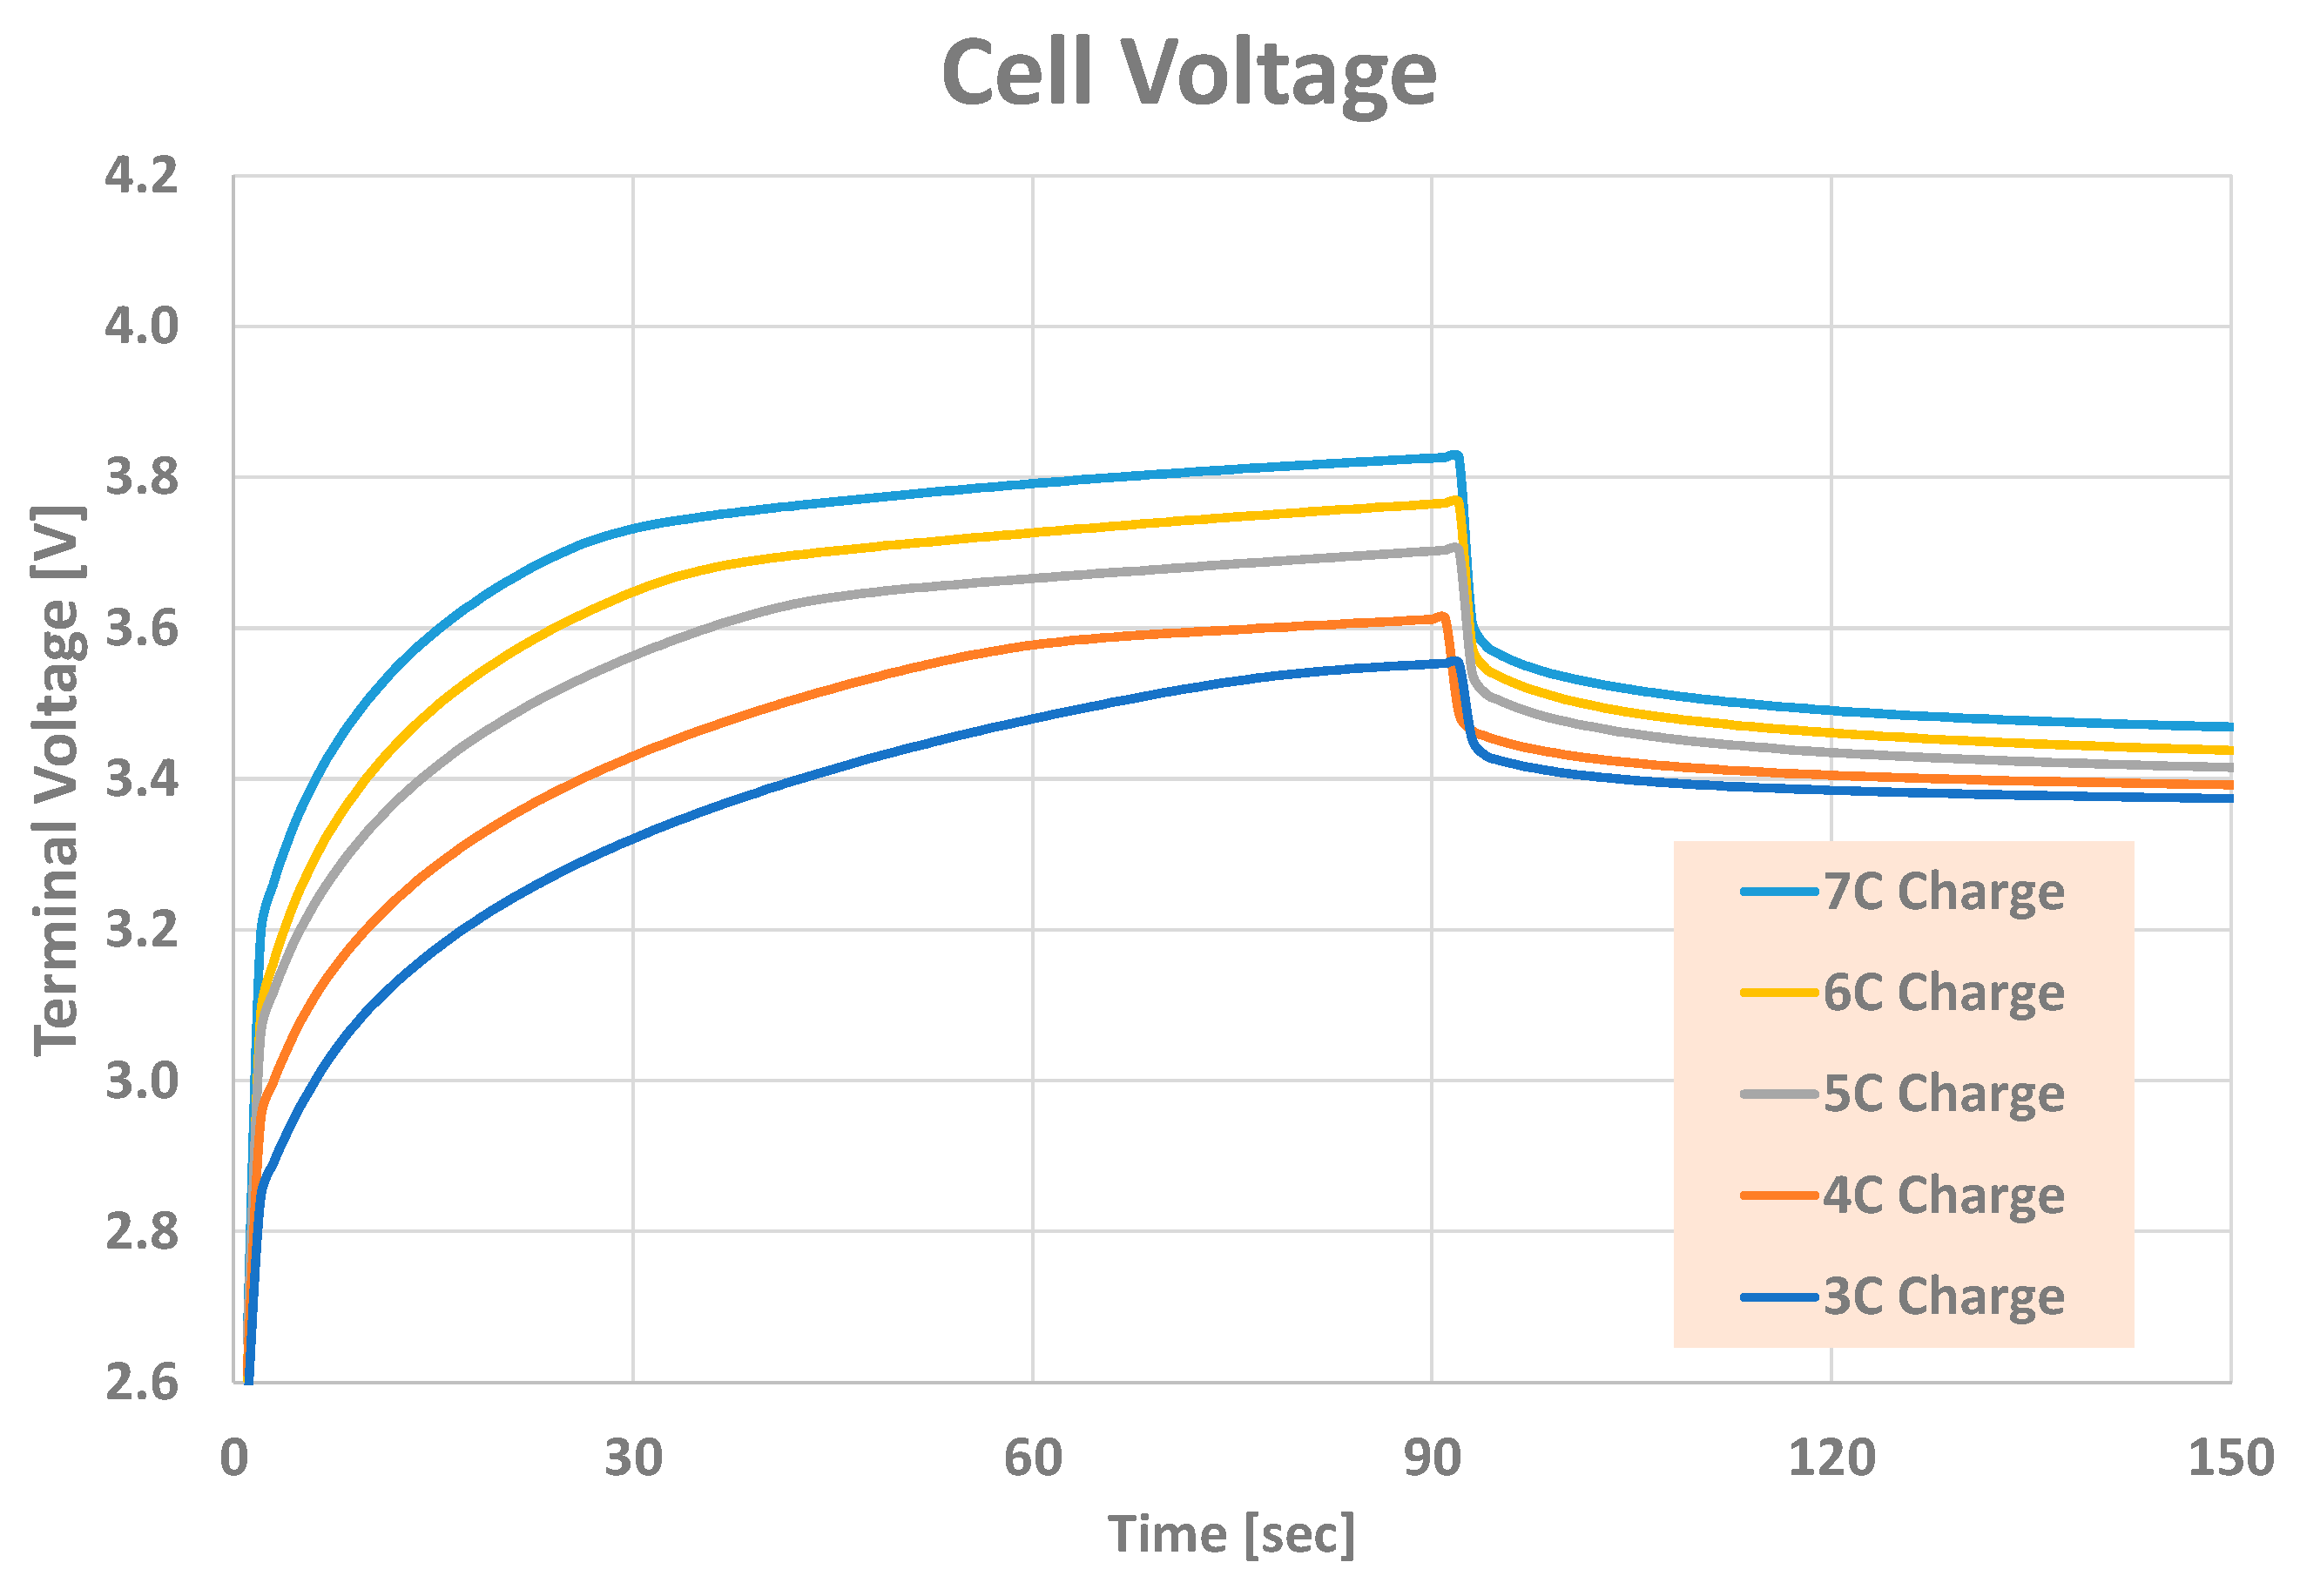
The project was able to build on a prior GM R&D effort that delivered the company’s first 800 V propulsion system on a T1 truck [18]. That earlier pack used 2.6 Ah, 18650-format cylindrical cells, which were carried forward here. These cells are power-oriented, high-nickel NMC chemistry devices with an open-circuit voltage window of roughly 2.5–4.2 V (Figure 2) and a demonstrated ability to operate at elevated charge and discharge C-rates. Leveraging earlier experience, the team defined a megawatt-class charge strategy in which the pack is charged from below 5% SOC at 1 MW for about 90–100 s. At the cell level this corresponds to >6C, delivering roughly 22.8 kWh and increasing SOC by about 17.5%.
Figure 2.
2.6 Ah cell testing.
To confirm that such operation was feasible, single-cell tests were conducted at GM R&D. Figure 2 illustrates a sequence of 90 s charge pulses at several C-rates. Across these tests, cell voltage (shown) and temperature (not shown) remained within specified limits, and the equivalent series resistance inferred from the data was approximately 0.03 Ω in the current range of interest.
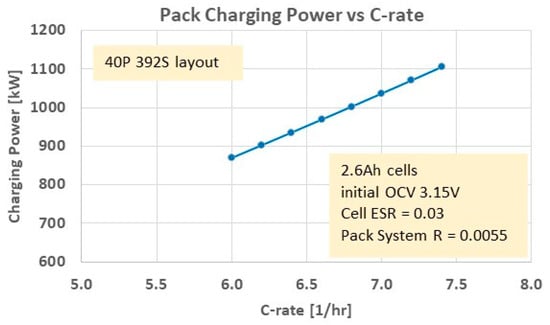
With a 1 MW target as the primary design point, the pack architecture was then sized and configured accordingly. The final scheme adopted a 40P384S arrangement, which supports megawatt-class charging while keeping the cell-level C-rate below about 7 when operated with a 1500 V-rated cycler (Figure 3). In this configuration, the total energy of the pack is 144 kWh.
Figure 3.
Estimated charging-power requirements.
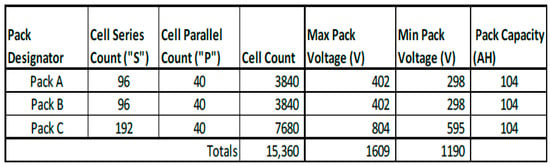
An added feature that was desired for this test article was the ability to change the overall pack architecture for various test modes. As will be outlined in the following section, this pack was designed with an advanced capability that permits varying overall system voltages and capacities (see Figure 4 below). This feature benefited from the fact that the ‘half pack’, Pack C (72 kWh, 800 V max), is leveraged from the previous 800 V work. The other half of the pack was further electrically split into identical packs A and B (36 kWh, 400 V max) to provide additional operating modes when combined with switching hardware.
Figure 4.
Individual pack configurations.
Packs A, B, and C include a number of modules (see Figure 5), each of which consists of twelve 40P1S cell strings, for a total 40P12S configuration, in addition to its own cell monitoring unit (CMU). Packs A and B have eight modules; Pack C has 16. Each pack also includes a Management Control Unit (MCU), primary contactors, pre-charge and fusing, and its own battery management system (BMS).
Figure 5.
Pack Module Configuration.
3. Pack Performance
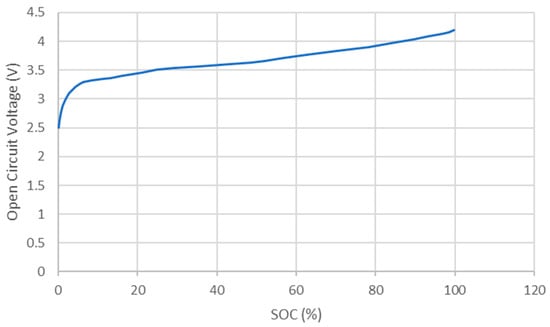
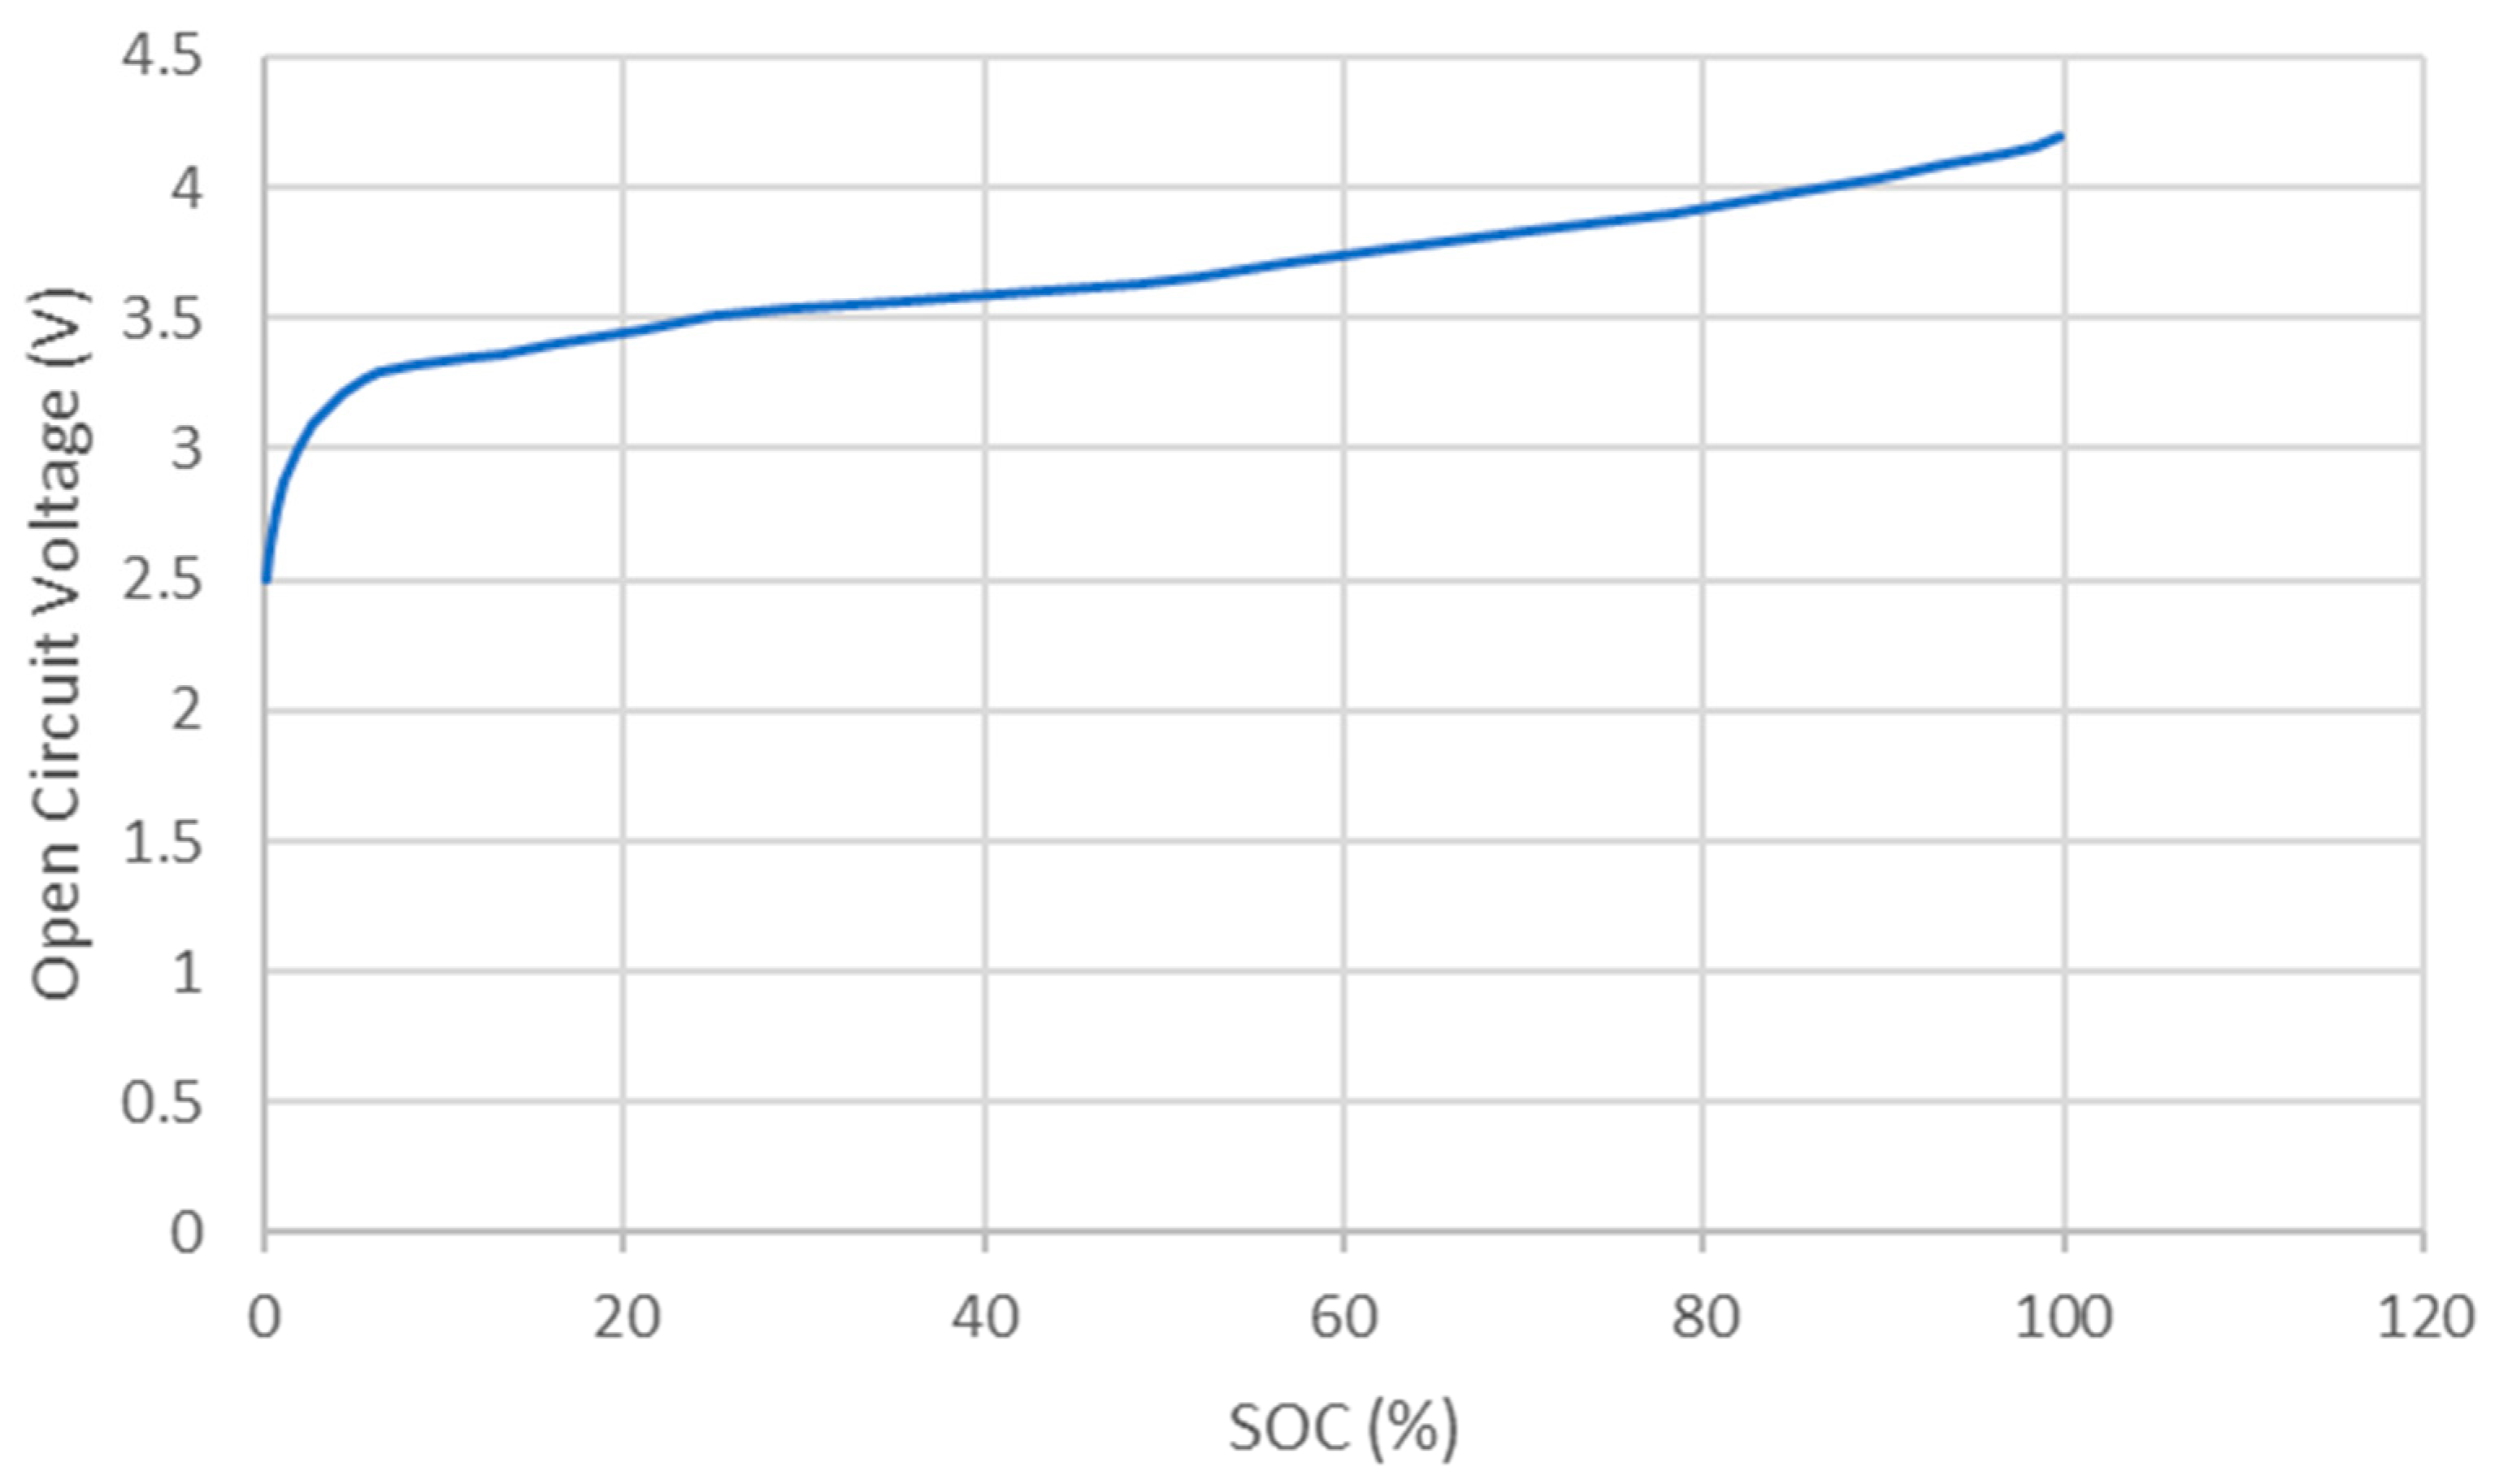
This section describes the validation process of the cells and pack design to ensure that they will meet the electrical and thermal requirements to achieve a megawatt of charge. To assess different charging profiles, a simple battery-charging model was developed. In addition to determining a desirable charging-current profile, this allowed us to estimate cell and pack heat generation. Starting with the measured open circuit voltage vs. SOC curve (Figure 6) for the candidate cell and nominal cell and pack interconnect resistances, the equivalent circuit model is given by Equations (1)–(4).
Figure 6.
Cell Open Circuit Voltage vs. SOC.
In Equation (1), Rpack is the total pack resistance, Rcell (SOC) is the nominal single cell resistance as a function of SOC, P is the number of cells in parallel in the pack, S is the number of cells in series in the pack and Rsys is the estimated lumped non-cell pack system resistance (bus bars, other interconnects in the battery pack). Equations (2)–(4) define the total open-circuit pack voltage, OCVpack, the pack terminal voltage, Vpack, and the terminal pack power, Ppack. Using Equations (1)–(4), the pack and cell heat generation rates, and , are calculated using Equations (5) and (6).
Given the specific cell used in the pack hardware, the pack design team assessed that an approximate 1 MW charging event was possible without damaging the cells by starting at a very low SOC (<5%) and stopping at around 20%, covering about 90 s of charging at the 1 MW level. The charging power is reduced after 20% SOC is reached. Starting with the SOC profile and the maximum charging-source voltage as inputs, a practical charging profile can be developed by solving for a charging current that provides a 1 MW charging rate and does not violate the pack voltage limit. For a known SOC, the cell OCV is determined. Setting the pack power Ppack, the charging current Ipack can then be determined from Equations (3) and (4). Table 2 shows an example result.
Table 2.
Example Charge-Current Profile given SOC and Desired Power.
The cell OCV shown was measured by the pack design team. The cell resistance is estimated from experimental data. Since the battery is being charged, note that the pack terminal voltage is higher than the pack OCV. This has implications for our test, as the maximum source voltage is 1500 V. Table 3 shows the corresponding pack C-rate, pack, cell-terminal voltage and total cell and per cell heat generation. The cell-terminal voltage limit is 4.2 V, but the limit on pack-terminal voltage prevents the cell from reaching the limit, which would be the typical maximum voltage during charging. The total pack energy Epack, total cell heat generation, , approximate charge time, Tcharge, and Vcell are given by Equations (7)–(11).
Table 3.
Pack Heat Generation, Terminal Voltage, and Other Metrics.
Equation (7) calculates the pack capacity in Ah as a function of current SOC. Tcharge is estimated assuming the charging current is constant during each step in SOC, which is an approximation. The duration for pack charging power > 950 kW is from SOC = 2% to 20%, which has a duration of 94 s, similar to the recommended total duration of 90 s.
The cell-charging efficiency is estimated by observing from a pack power balance that the stored chemical energy in the pack is the charged energy at the pack terminals less the thermal stored power Thus, the instantaneous charging efficiency is given by Equation (12):
The pack heat generation is significant at these levels of charging power, peaking at ~140 kW. When the charging C-rate falls to 2.9 at 25% SOC, the pack heat generation is only ~21 kW. As can be seen in Table 2, charging efficiency is as low as 83% at relatively high C-rates, recovering to 95% at ~3C. At the cell level, 9 W of heat is generated per cell. Assuming a cell-specific heat capacity Cpcell of 950 J/kg/K [19] and an isothermal cell with very limited heat transfer to the adjacent cells, as may exist with potting around each cell, the cell temperature (Tcell) rise can be estimated using a lumped capacitance model for the cell’s energy storage rate, stored, as given by Equation (13):
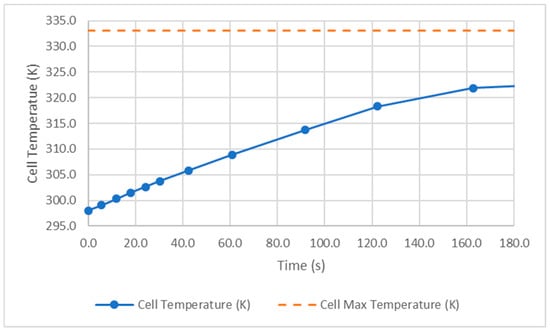
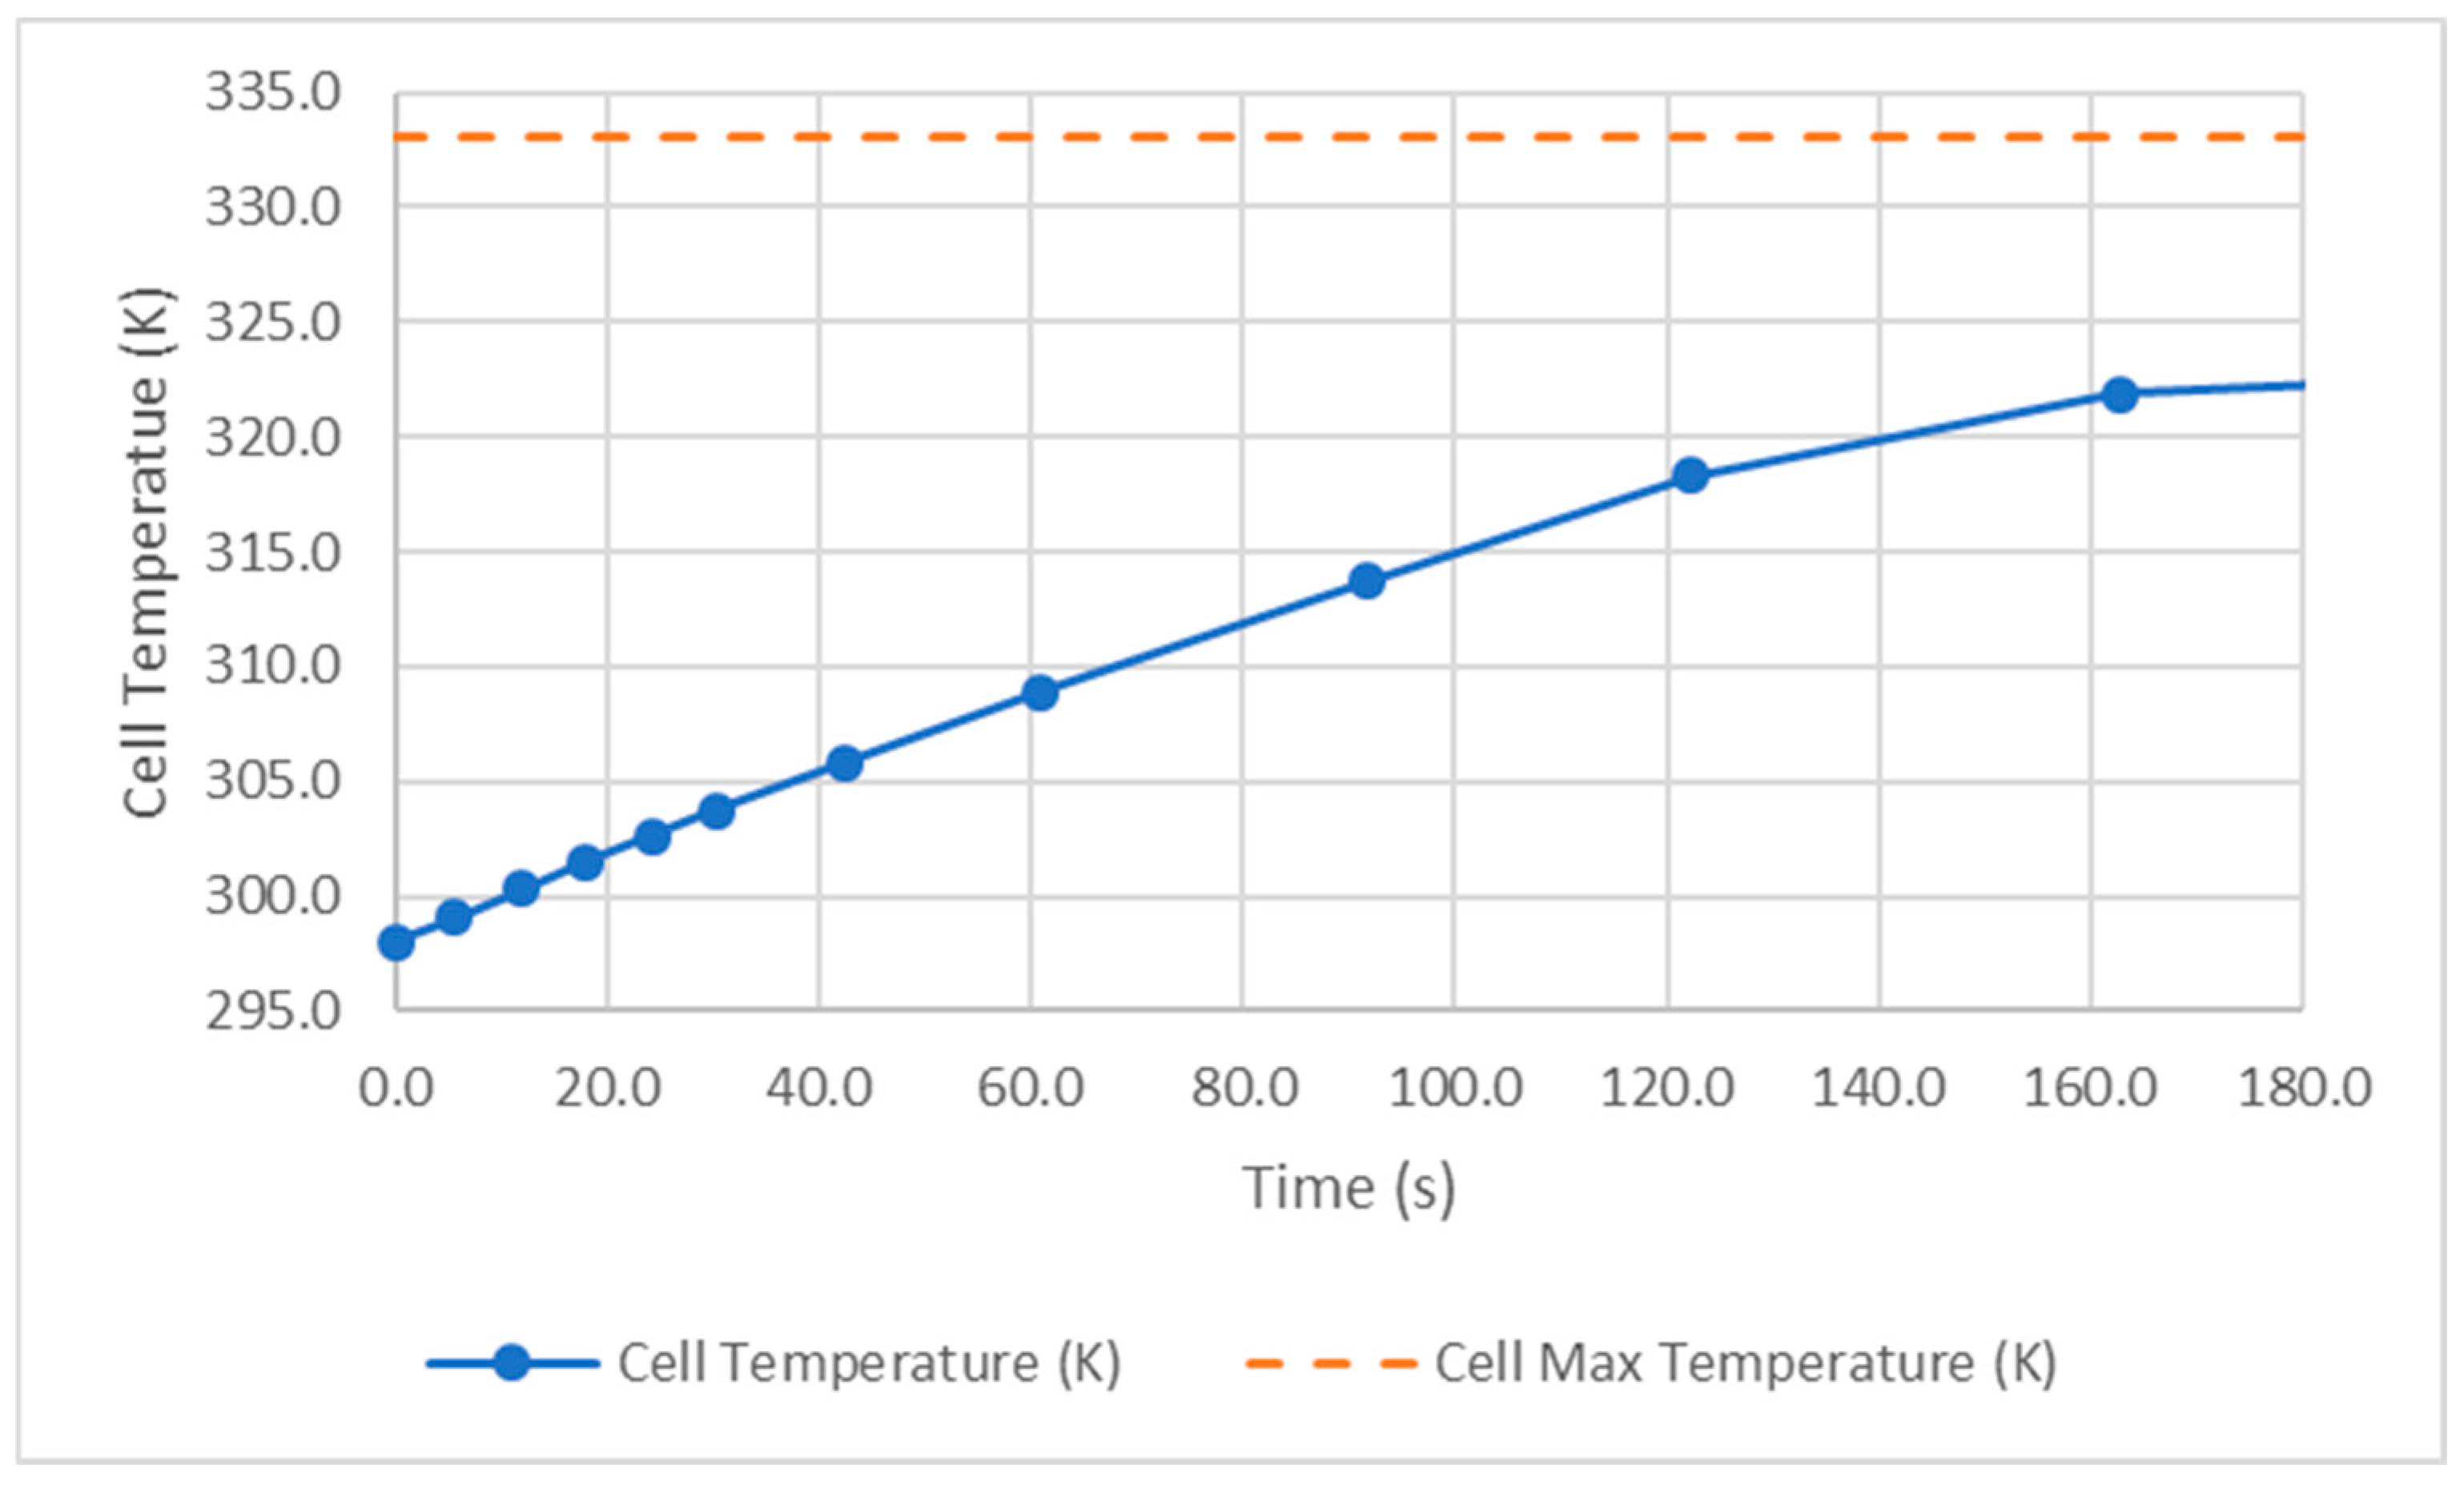
is the mass of the cell, estimated at 50 g. Using a first-order approximation for the temperature derivate, the values for time and cell heat generation can be used to estimate the cell temperature rise, which will be on the high side due to the assumptions stated. This value is plotted vs. time in Figure 7. Without cooling, the cell temperature would rise to 318 K (45C) at 122s (20% SOC), about 15C lower than typical cell maximum of 333 K (60C). Note that the reduction in C-rate after reaching 20% SOC reduces the rate of temperature rise.
Figure 7.
Estimated Cell Temperature Rise with +950 kW Charging.
Based on vendor datasheets for the HV DC contactors, pyro fuses, busbars and current-sensing elements used in the test bench, the aggregate non-cell series resistance of the megawatt charging loop is estimated to be on the order of 2 mΩ (1.5–3 mΩ range). At 1 MW and 1500 V (≈670 A), this corresponds to ≈1–2 V of ohmic drop and ≈1 kW (<0.2%) of non-cell resistive loss, with the remainder of the voltage drop and losses occurring inside the battery cells.
4. Pack Design
Once the overall pack topology had been selected and the cell performance verified analytically, attention shifted to making the hardware as configurable as possible for experimental use. To that end, the pack was equipped with a switchable battery disconnect unit (BDU) that allows different portions of the RESS to be re-wired in series or in parallel, depending on the desired operating mode.
As described earlier, the pack is divided into three main sections, labeled A, B, and C. Sections A and B each represent one quarter of the total energy, providing 36 kWh at 40P96S, while section C contributes the remaining half, 72 kWh at 40P192S. In terms of nominal voltage, packs A and B each operate around 375 V, and Pack C around 750 V. By combining these three sections in different series/parallel combinations, the overall bus can be configured at approximately 750 V, 1125 V, or 1500 V.
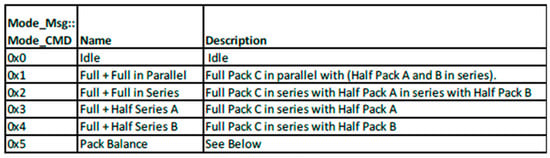
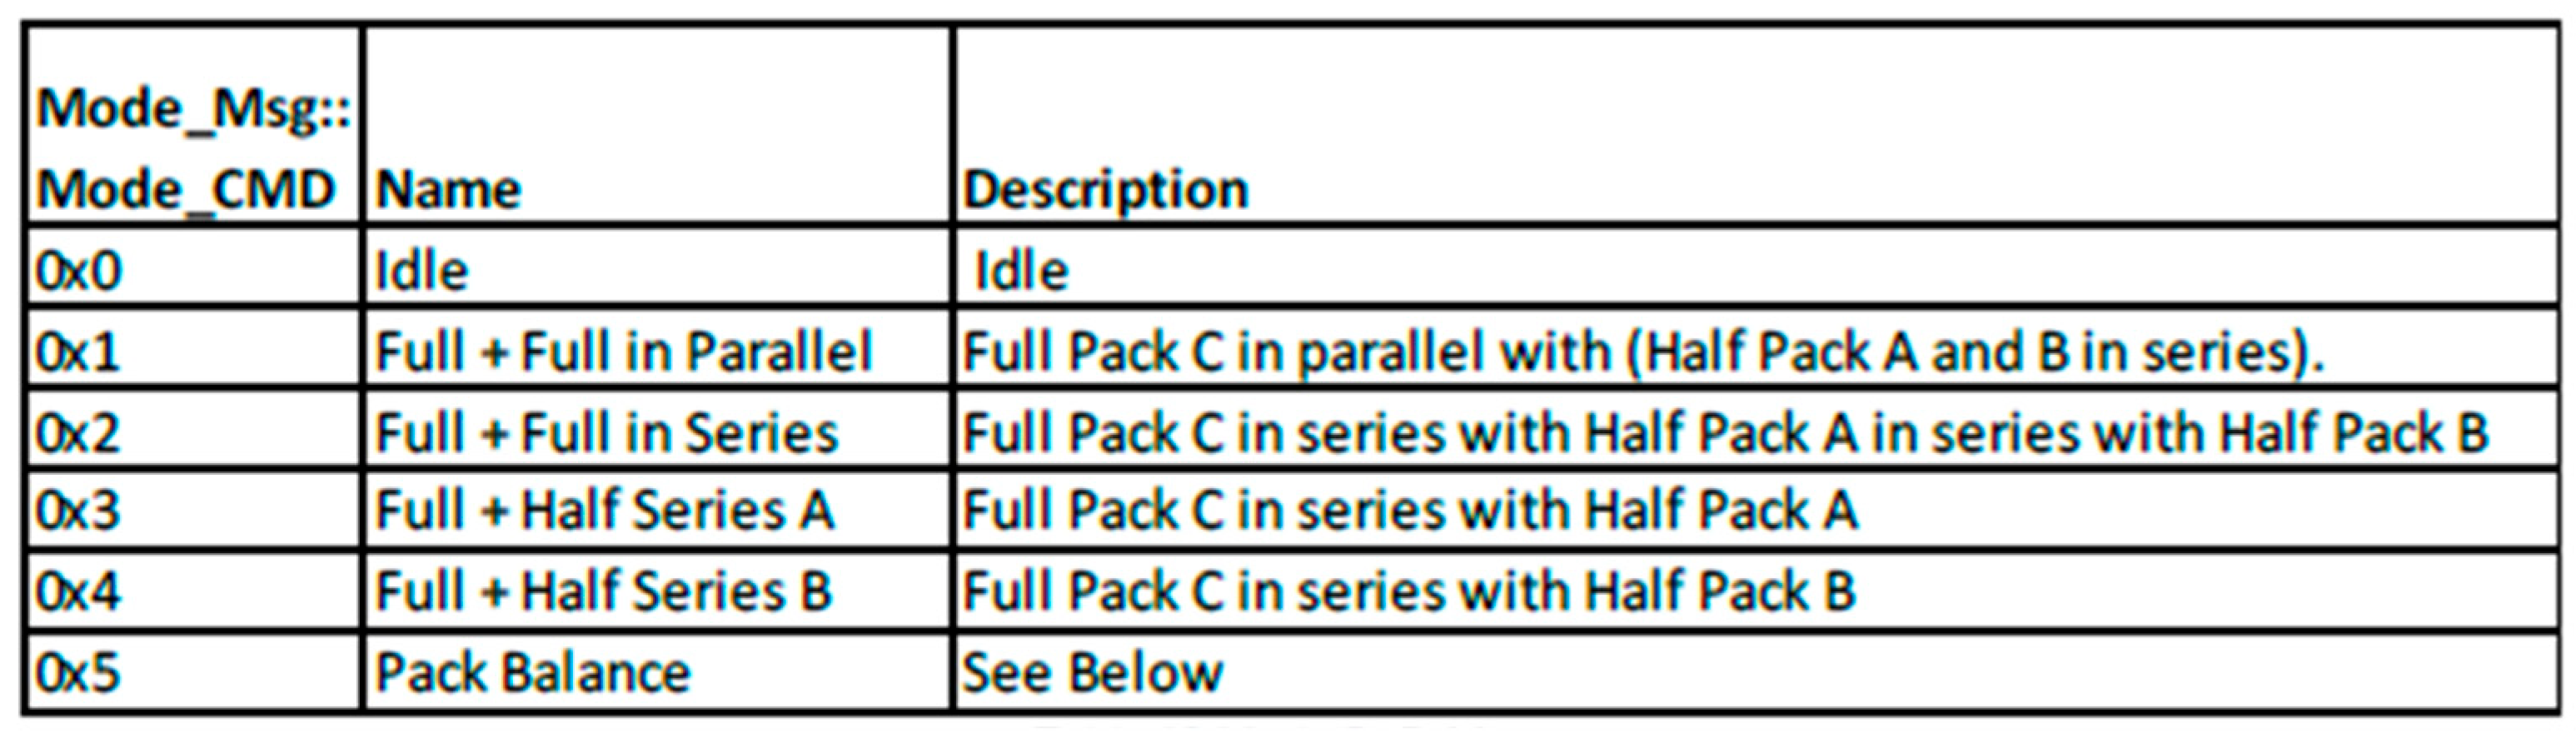
In a 750 V configuration, packs A and B remain in series with each other and are then paralleled with Pack C, yielding an 80P192S arrangement that is representative of likely future high-performance and heavy-duty vehicle buses. For 1500 V operation, packs A, B, and C are all placed in series to create the 40P384S configuration used for the megawatt test case. An intermediate 1125 V mode is obtained by disconnecting either Pack A or Pack B and placing the remaining pack in series with Pack C, resulting in a 40P288S layout that aligns well with the maximum operating voltage of the MCS charge connector [20]. The corresponding BMS operating modes are summarized in Figure 8.
Figure 8.
Pack Configurations.
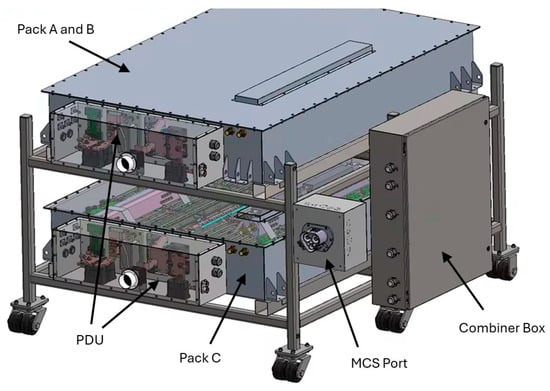
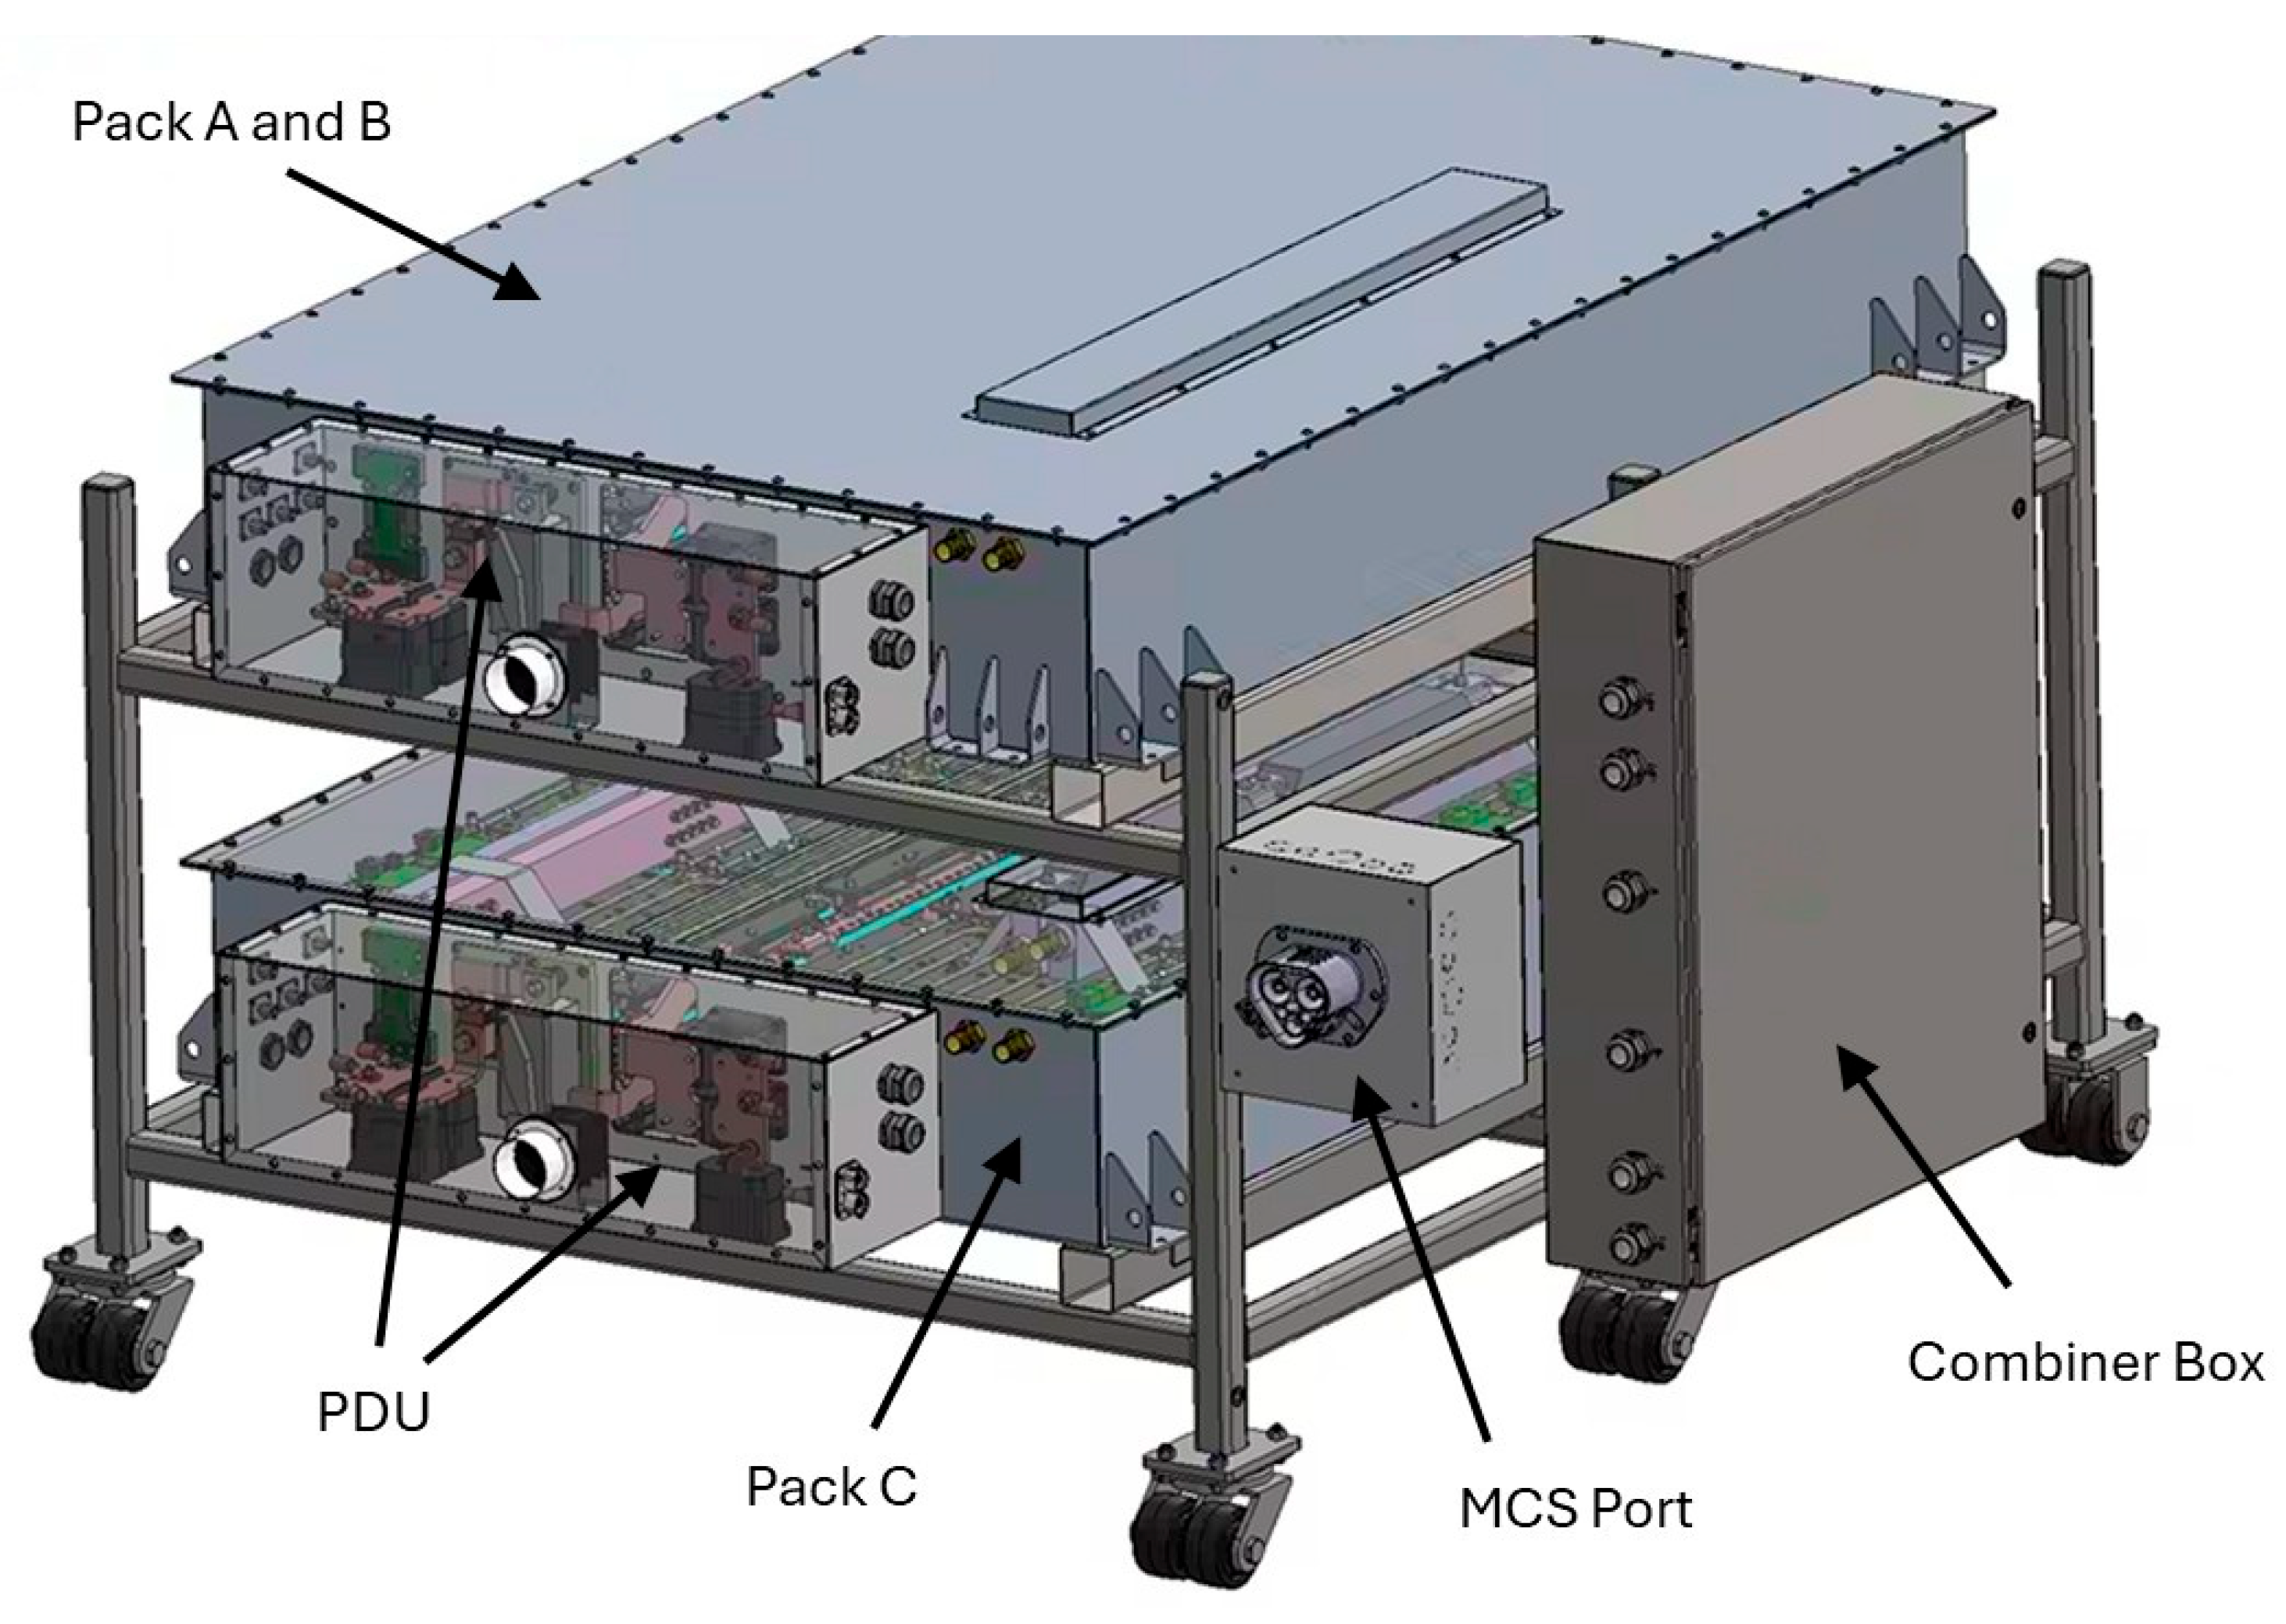
Realizing these configurations in hardware required a dedicated interconnection assembly with sufficient bus bars and switches to support all allowable RESS modes. This assembly, referred to as the Combiner Box, is shown alongside the three pack sections in Figure 9. Packs A and B form the upper layer of the stack, while Pack C occupies the lower layer. All three are mounted in a common rack, with power distribution units (PDUs) on the front of each pack. The Combiner Box is mounted along one side of the rack, and an MCS inlet on the front provides the interface to the external battery cycler. Electrically, the Combiner Box connects each subpack to the external load and supports all series/parallel arrangements needed for the 750 V, 1125 V, and 1500 V modes.
Figure 9.
Pack Assembled on Rack.
To handle the required power levels, the Combiner Box contains multiple high-voltage DC contactors. The primary devices are single-pole contactors rated at 1500 V DC and 600 A; these are used in parallel pairs to provide additional current-carrying capability and are protected by 1500 V high-speed fuses. The box also houses the Power Distribution Controller (PDC), isolation-monitoring hardware, and a dedicated 12 V supply for the control electronics. The PDC coordinates mode selection, fault detection, BMS interaction, and external CAN communication. Each of the three packs interfaces to the BMS over its own CAN link, and overall control can be exercised either through the native Lithium Balance BMS tools or through the GM Battery Test Lab supervisory software.
5. Pack Architecture Modeling and Safety
Several control-layer mechanisms were added to the pack to maintain safe operation and protect cell health during aggressive tests. Each pack section is monitored by its associated PDU, which checks that no two sections are paralleled if their voltages differ by more than a specified threshold. When that threshold is exceeded, the system is commanded into a dedicated Balance Mode. In this mode, the three main sections are equalized in stages: first, each section is internally balanced, after which Packs A and B are connected in parallel and equalized through dedicated 3.3 Ω resistors. These resistors are mounted beneath the top covers of Packs A and B and are cooled by the external thermal loop. Once A and B have converged in voltage, they are switched back into series and then balanced in parallel against Pack C. Normal charge/discharge operation is only re-enabled when all three sections are within the allowed voltage window.
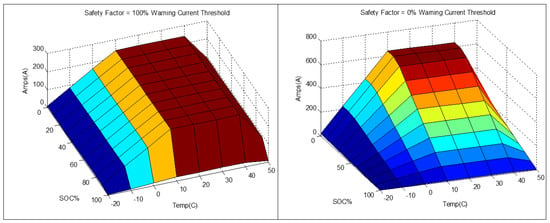
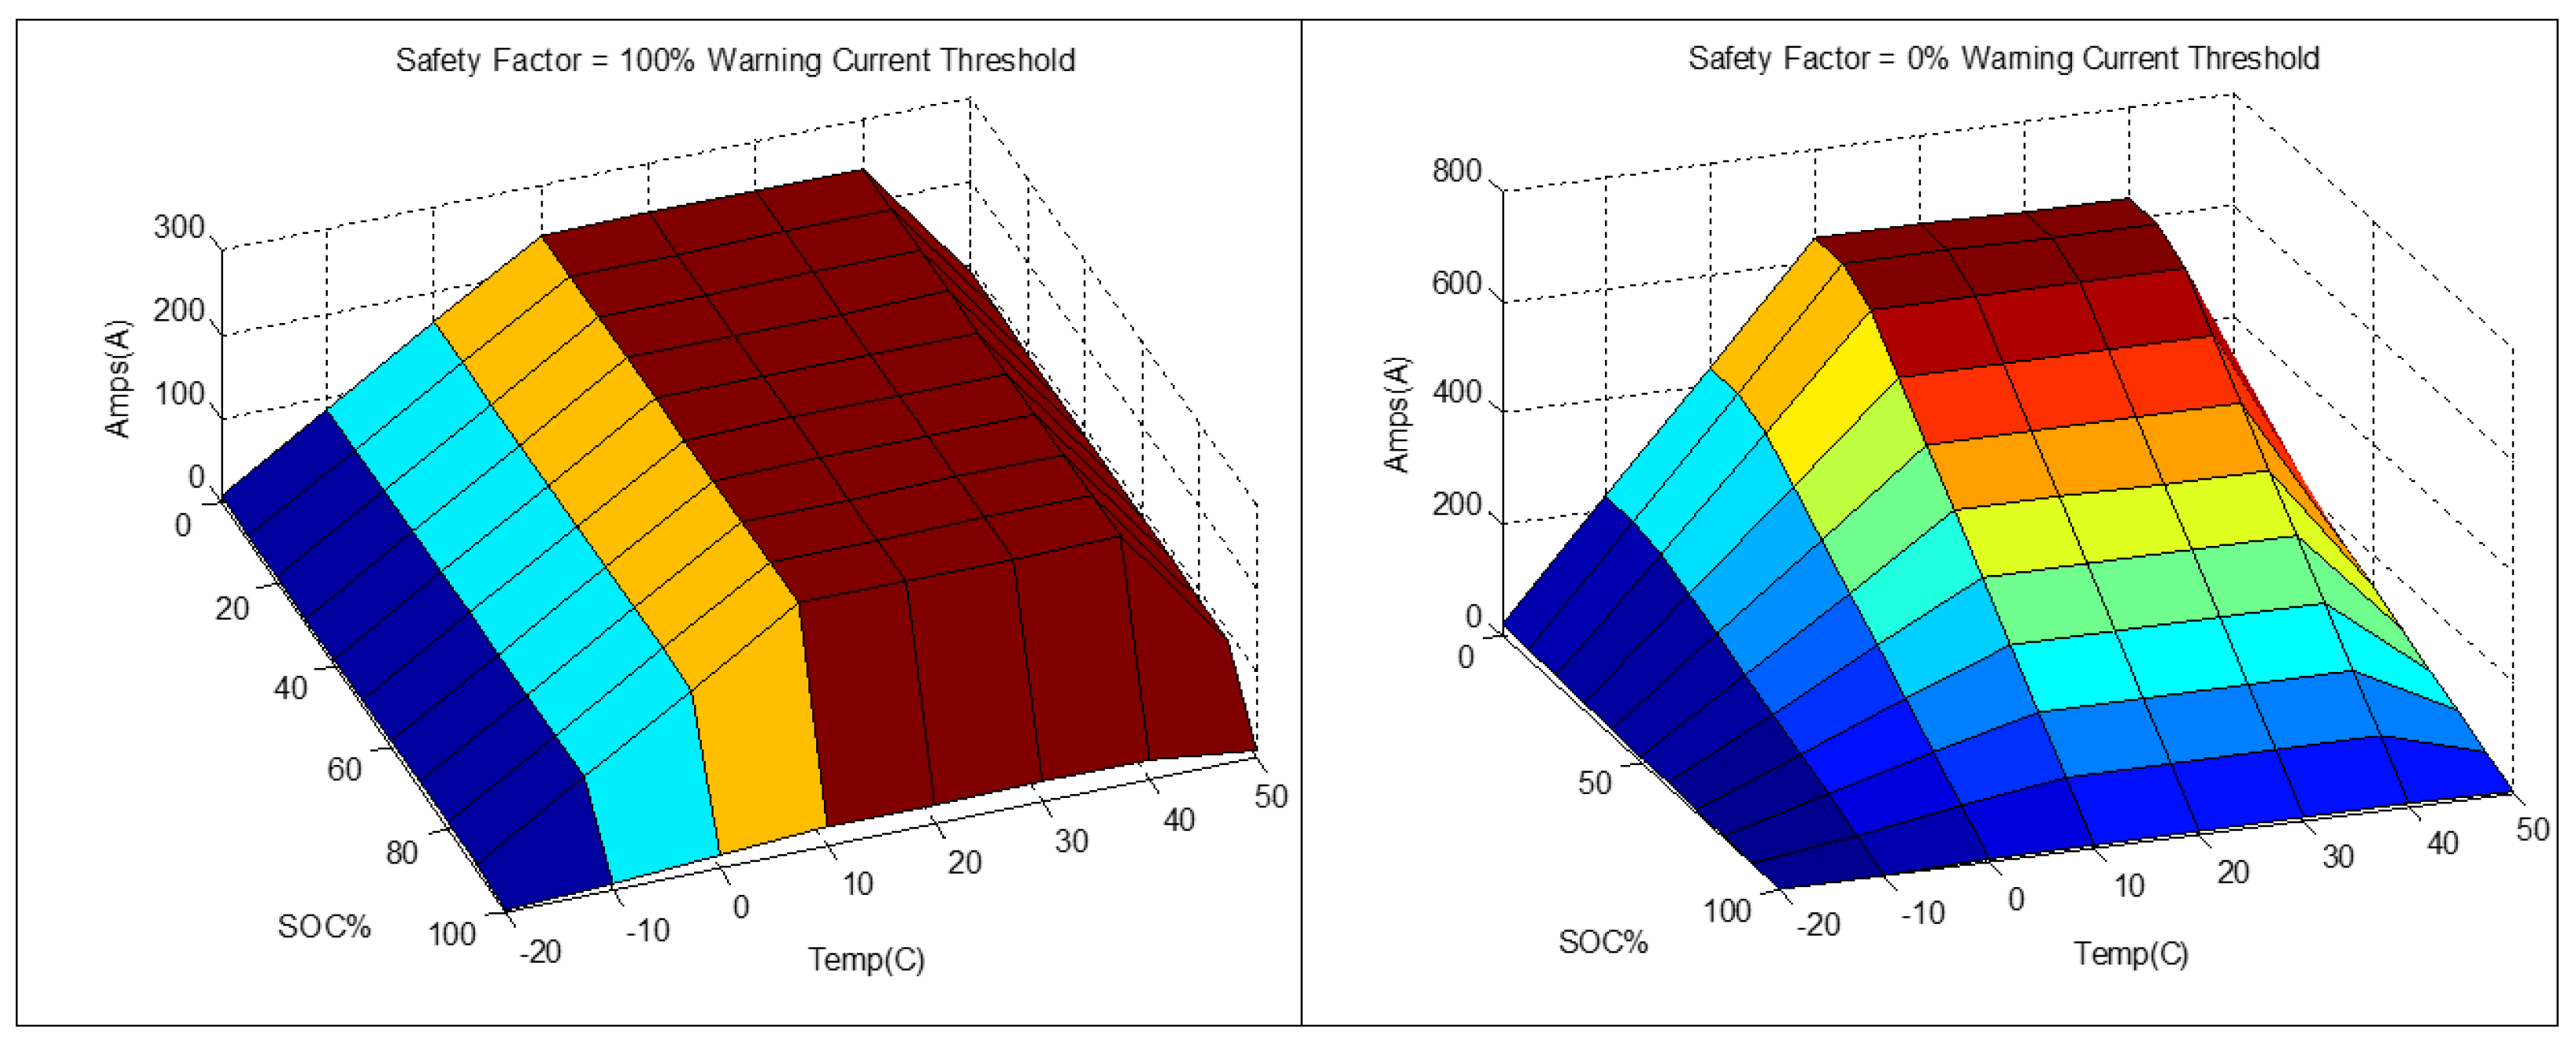
To further protect the cells, a configurable Safety Factor (SF) map is employed to derate the allowable charging current as a function of SOC and temperature. The SF parameter, which can be varied from 0 to 100%, effectively controls how much of a nominal 16 A/cell margin is actually used in a given test. Representative maps for SF = 0% and SF = 100% are shown in Figure 10. At SF = 100%, the pack current is limited to approximately 6 A per cell over most of the SOC range, with additional derating applied at the temperature extremes. At SF = 0%, the full current capability is available at low SOC, but progressively tighter current limits are imposed as SOC increases so that operation remains comfortably below the 4.2 V cell overvoltage boundary and the risk of lithium plating—and corresponding SOH loss—is minimized.
Figure 10.
Applied Safety Mapping.
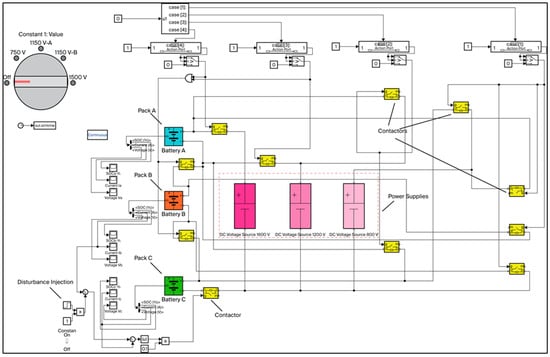
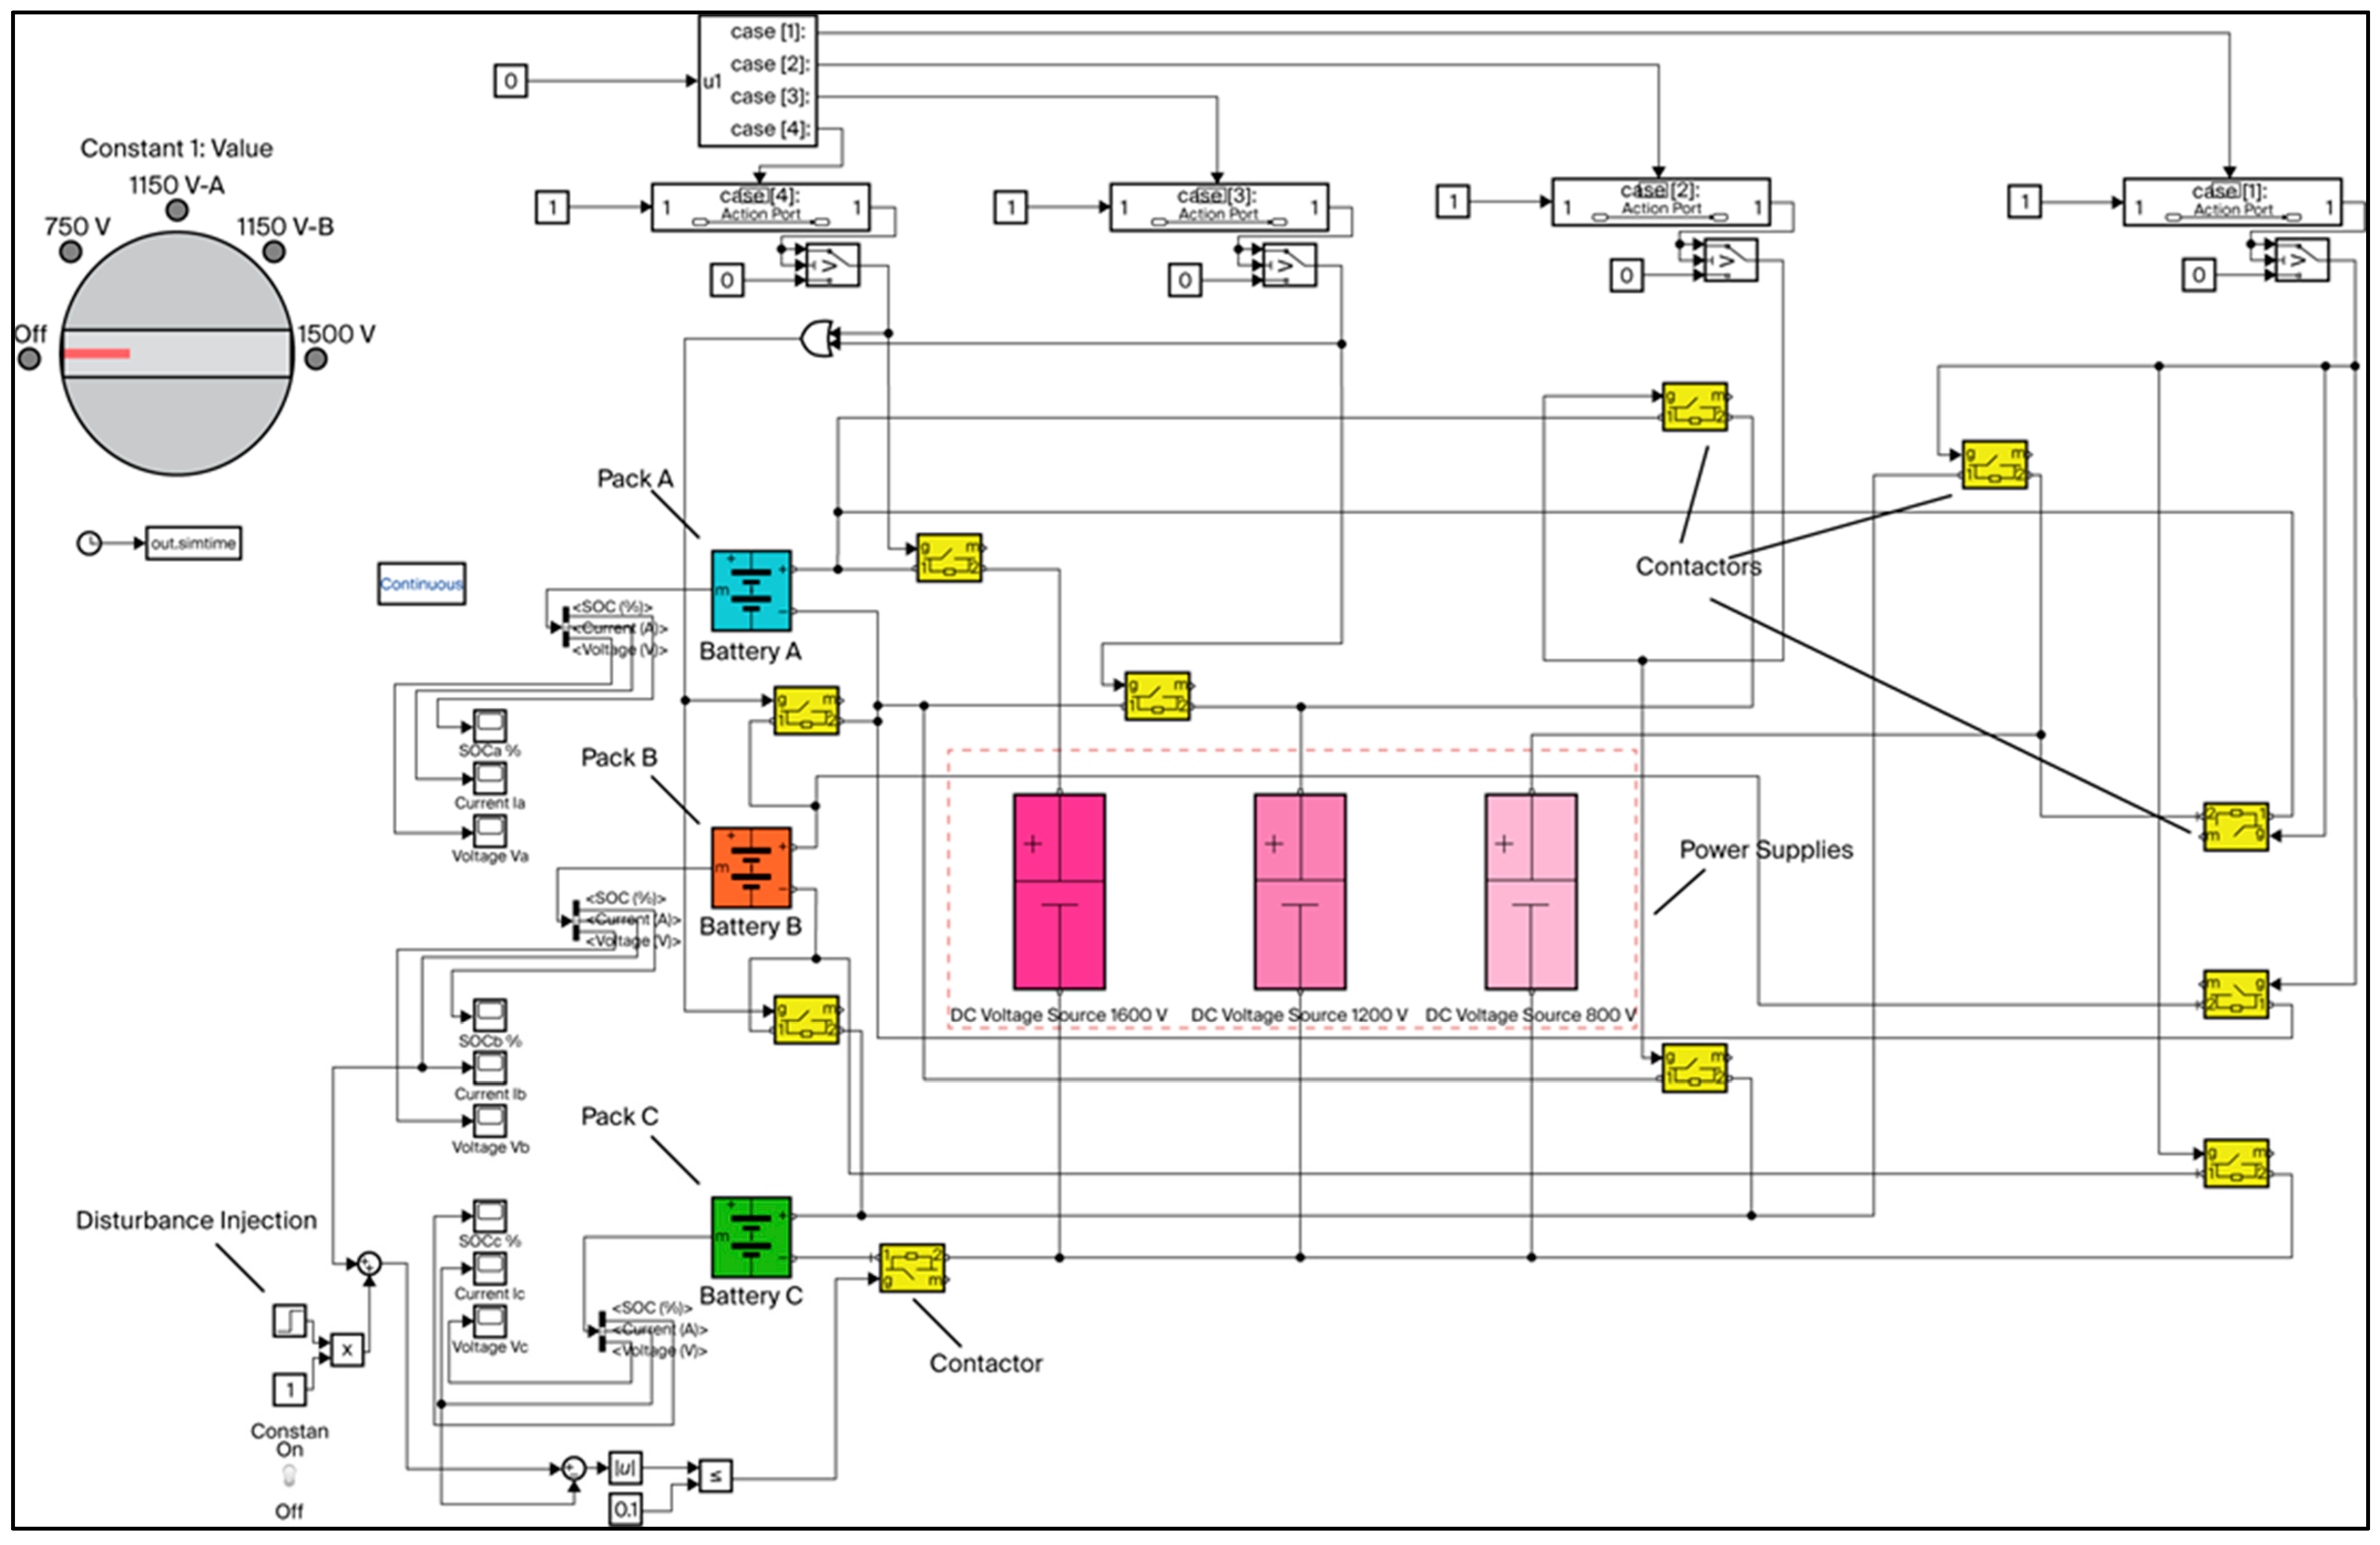
As we prepared for the megawatt charging test, we set up and debugged the sectional battery pack, one portion at a time. Everything checked out well by section, but when we set the pack up in 1500 V mode with all sections in series and began gentle charging maneuvers, we noticed a system fault as we raised the power from 0 to 50 kW. This happened repeatedly and each time was followed by a lengthy shutdown-restart process dictated by the safety systems in the lab. To better understand what was causing the faults we decided to build a digital twin in Simulink to explore the sensitivity of the system to transients and voltage or current mismatches across the various sections of the pack. This system is shown in Figure 11. The blue, orange, and green packs represent respectively Pack A, Pack B, and Pack C. The various contactors shown in yellow (only four of them are labeled for illustrative purposes) allow selective switching of connections to place the packs in the 1500 V, 1150 V or 750 V configurations as required for testing. This switching is achieved automatically via the rotary selector switch shown in the top left-hand corner of Figure 11. The power supplies for 1500 V, 1150 V, and 750 V charging are shown in the pink dashed rectangle (labeled 1600 V, 1200 V and 800 V respectively) at the center of the figure.
Figure 11.
Simulink Model of Hardware Set Up for Megawatt Charging.
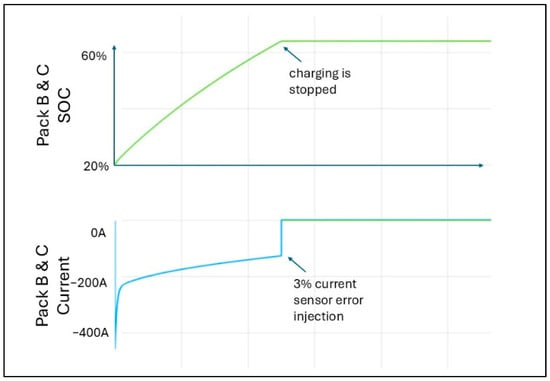
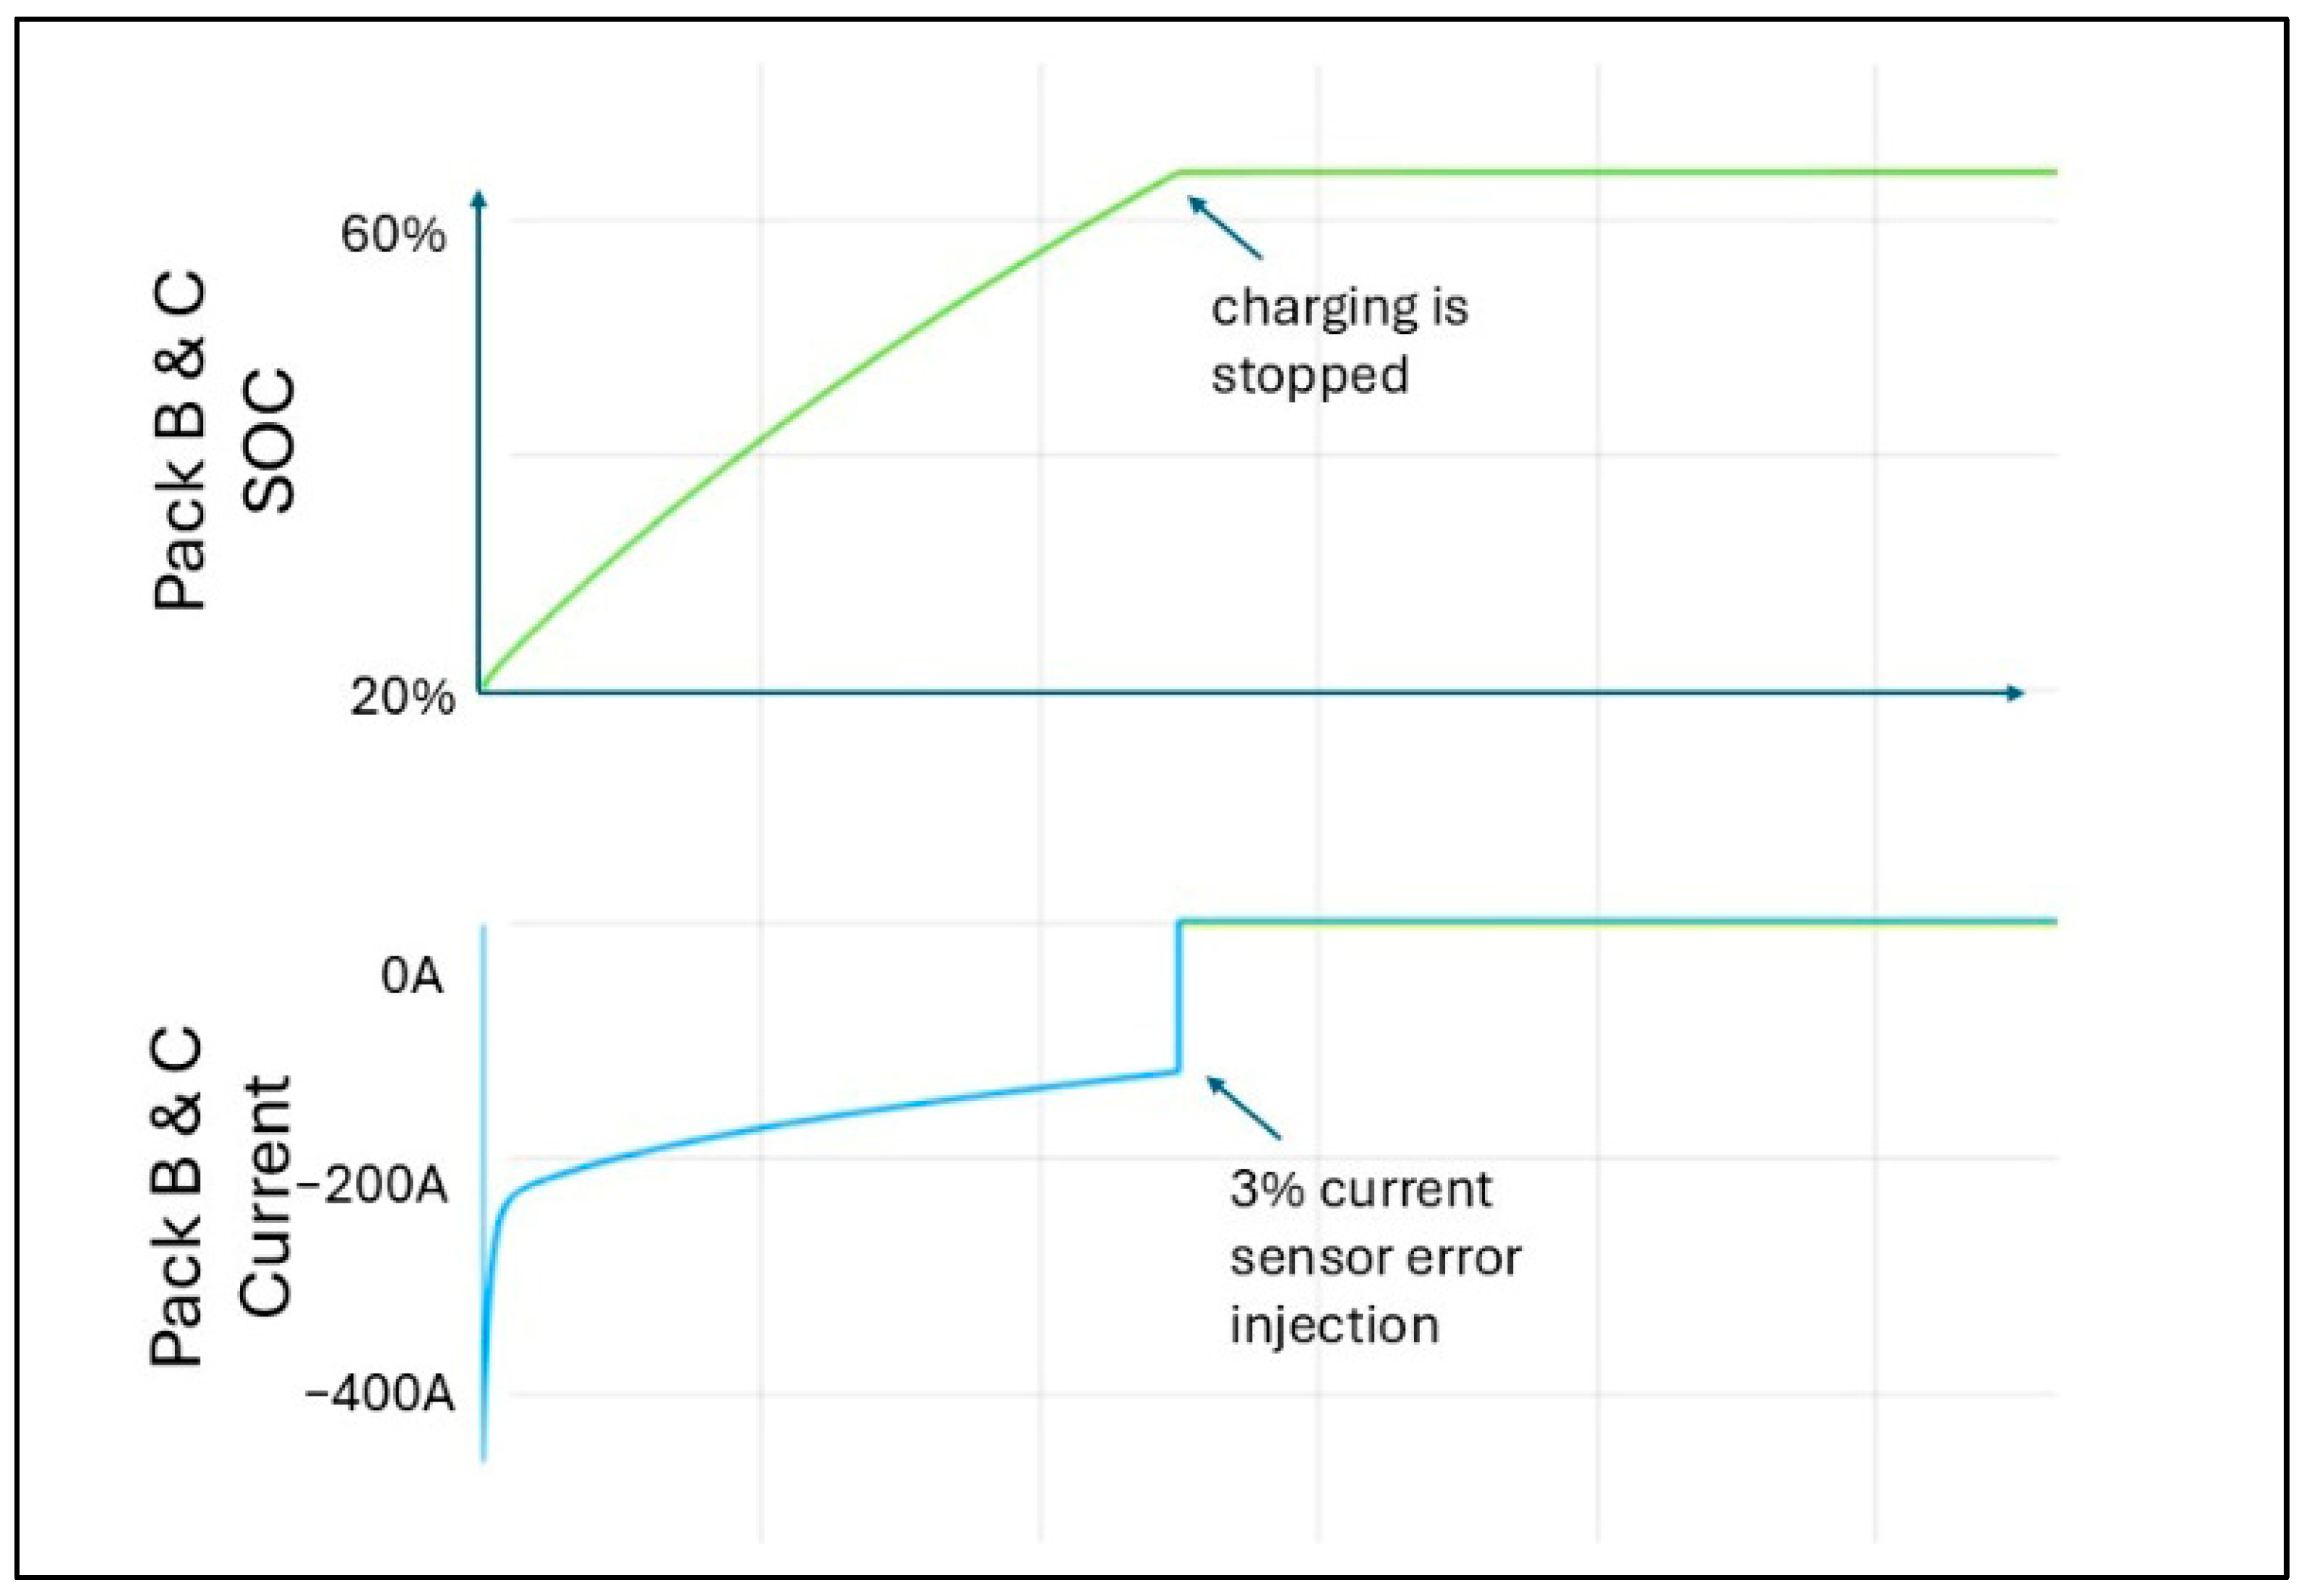
After careful analysis of the sensor data traces, we identified a plausible cause for this contactor opening to be a mismatch between current sensor readings from the various sub-packs. To better understand the sensitivity to the current mismatch, we created a disturbance-injection block (bottom left corner of Figure 11) in the Simulink model to artificially bias the Pack B current sensor reading to create a mismatch between the sub-pack currents for Packs B and C. This current difference was fed to a contactor (at the bottom of the figure), which served as the safety interrupt. By varying the injected disturbance current over various levels (2–5%) we were able to mimic the contactor opening in our hardware set up. The Simulink model also enabled us to troubleshoot the system hardware as we built and validated the complex contactor connections, one section at a time. Figure 12 shows a sample charging run where the process is prematurely terminated when a 3% disturbance current is injected into the Pack B current sensor signal halfway through the charging process.
Figure 12.
Charging Stops When a 3% Current Sensor Error is Injected.
In the laboratory hardware, current–sensor mismatch across the sub-packs is monitored at 100 Hz by both the BMS and test-cell/cycler controller. Any current discrepancies or imbalances are immediately flagged, with the resulting commands driving the high-voltage contactors to interrupt cycler current and isolate the pack sections. The protection chain is implemented using hardware-actuated contactors commanded by supervisory controls, and the design intent for response time is well within the relevant electrical and thermal time scales for the pack during high-power transients.
6. Pack Testing
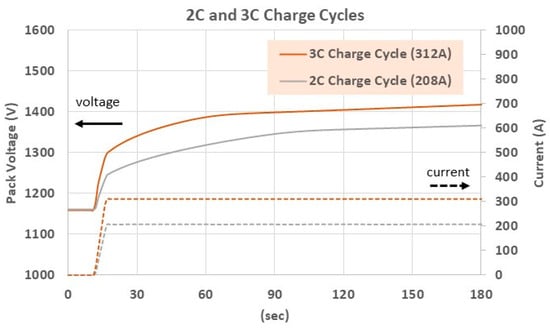
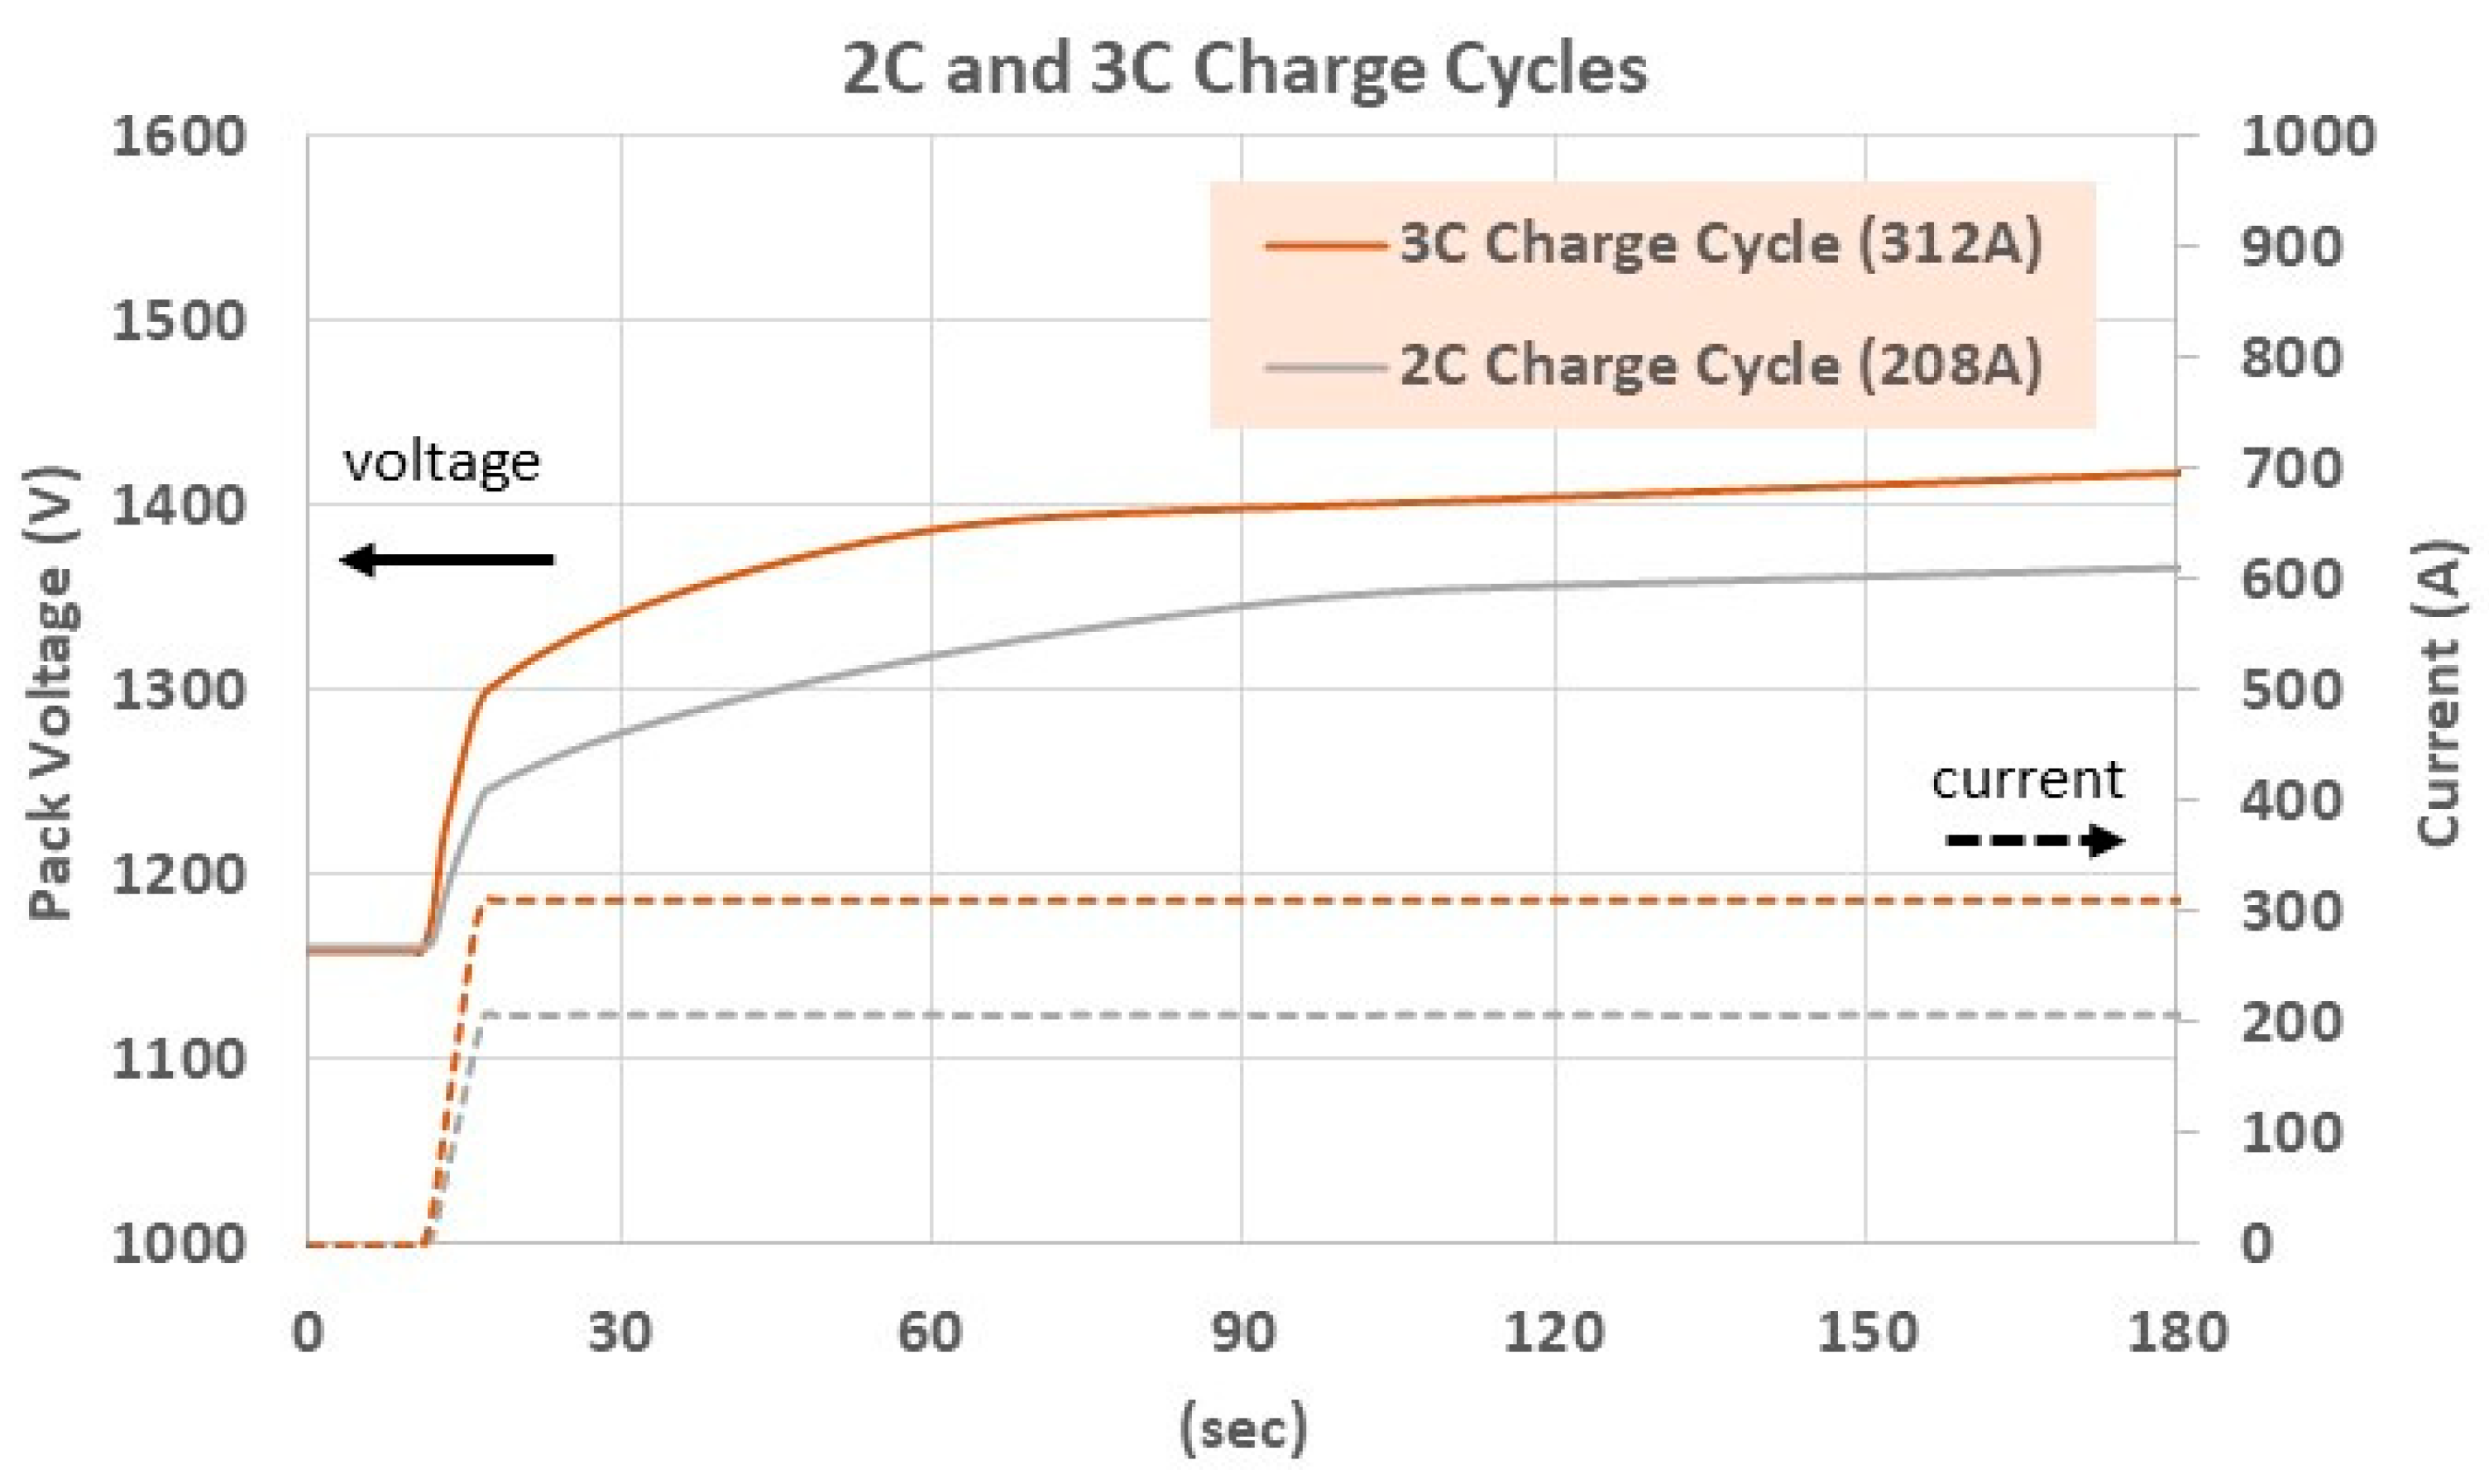
Before attempting a full megawatt-class charge, we first exercised the pack at more moderate power levels to check the assumptions in the performance model and to confirm that both the cells and the test equipment could remain within their limits. High C-rate single-cell experiments, summarized earlier, yielded an equivalent series resistance of approximately 0.03 Ω per cell, based on the instantaneous voltage step observed when current was applied (consistent with Equation (3)). Combining this value with the 40P384S configuration in Equation (1) gives a cell-dominated pack resistance of 0.288 Ω. Figure 13 presents pack-level voltage traces for 2C and 3C charge cycles on the full assembly. Using the initial voltage rise at the onset of each pulse and again applying Equation (3), the total pack resistance is inferred to be about 0.46 Ω, implying a non-cell contribution (R_sys) of roughly 0.172 Ω.
Figure 13.
2C and 3C Test Cycles on Full Pack.
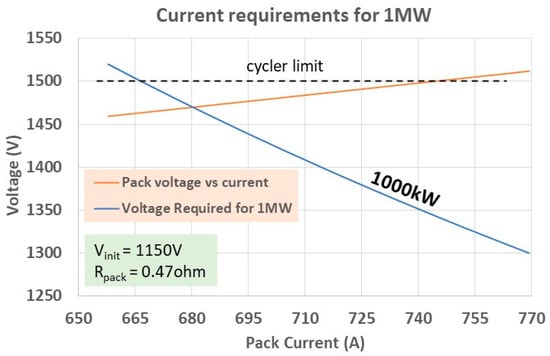
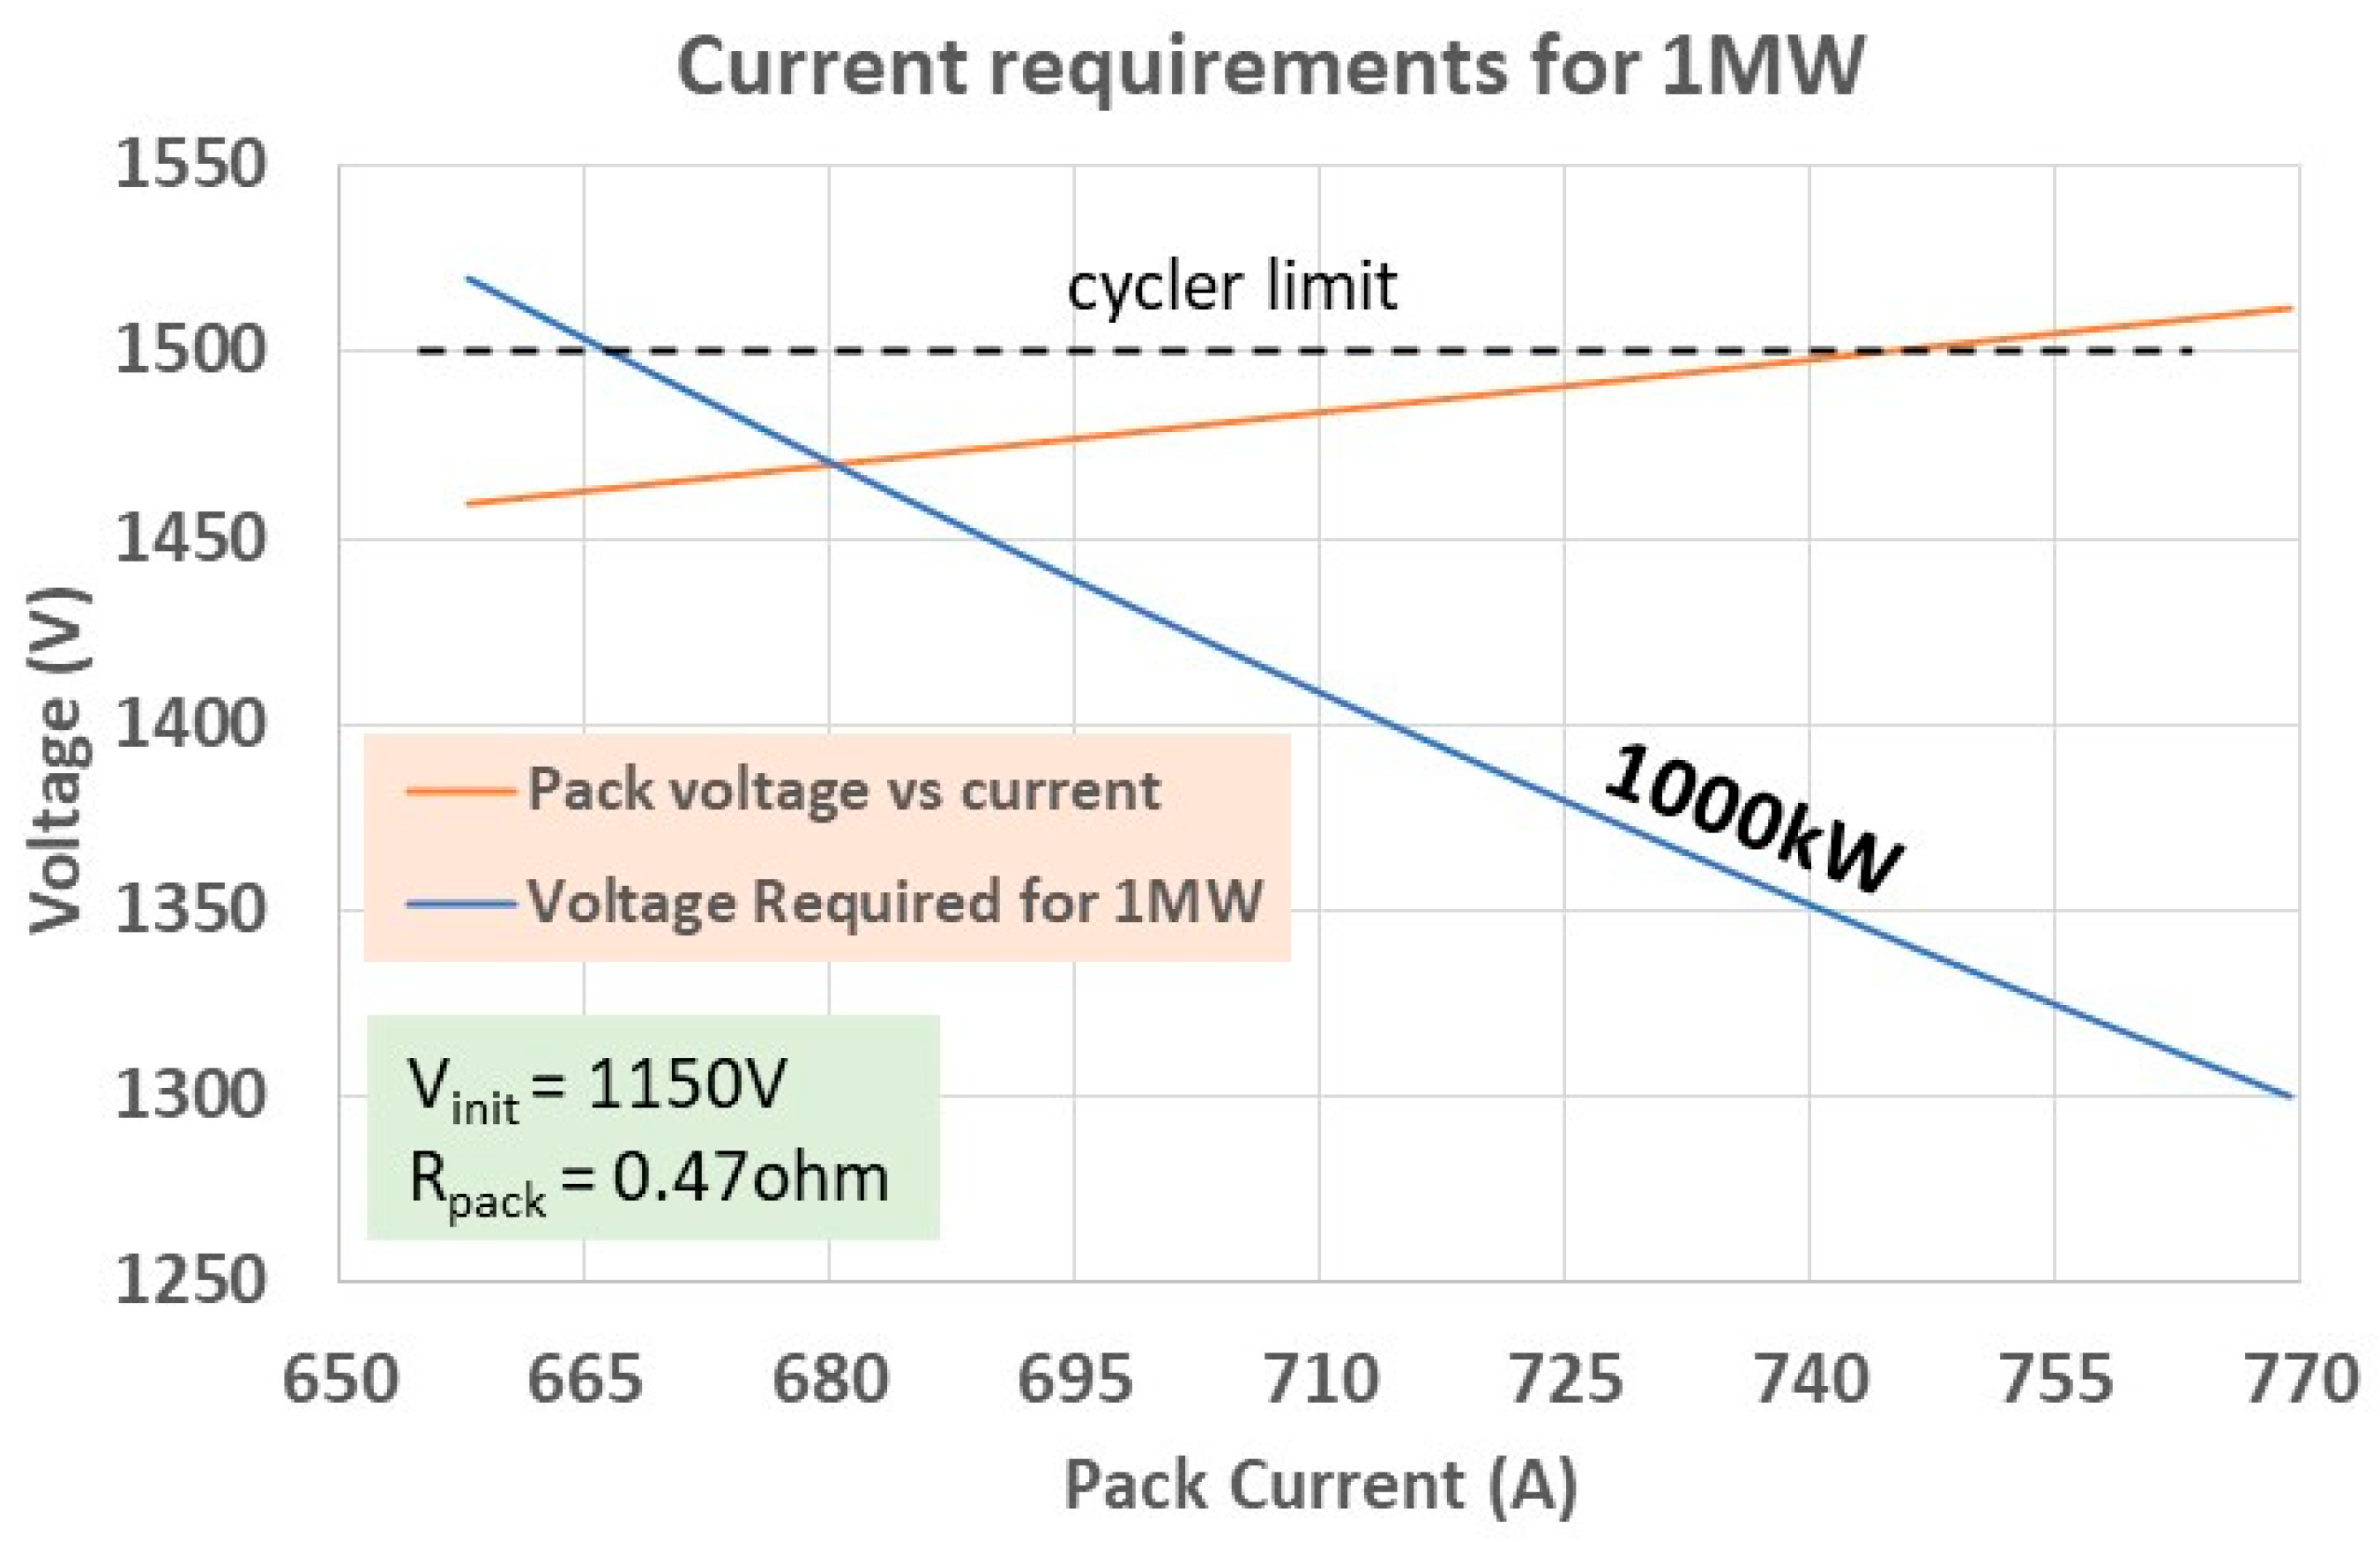
With this updated resistance estimate, we can predict how the pack voltage will respond to different charge currents. Figure 14 overlays the initial pack-terminal-voltage curve (starting from an OCV of ~1150 V at 2% SOC) with a constant-power contour at 1000 kW. Their intersection indicates that a current of approximately 680 A should be sufficient to reach 1 MW while staying just below the 1500 V limit of the cycler, leaving about 30 V of margin.
Figure 14.
Calculated Minimum Current to Achieve 1000 kW.
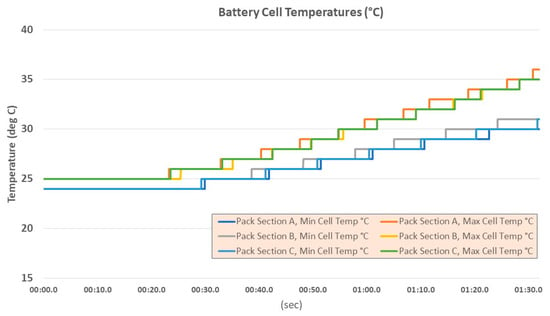
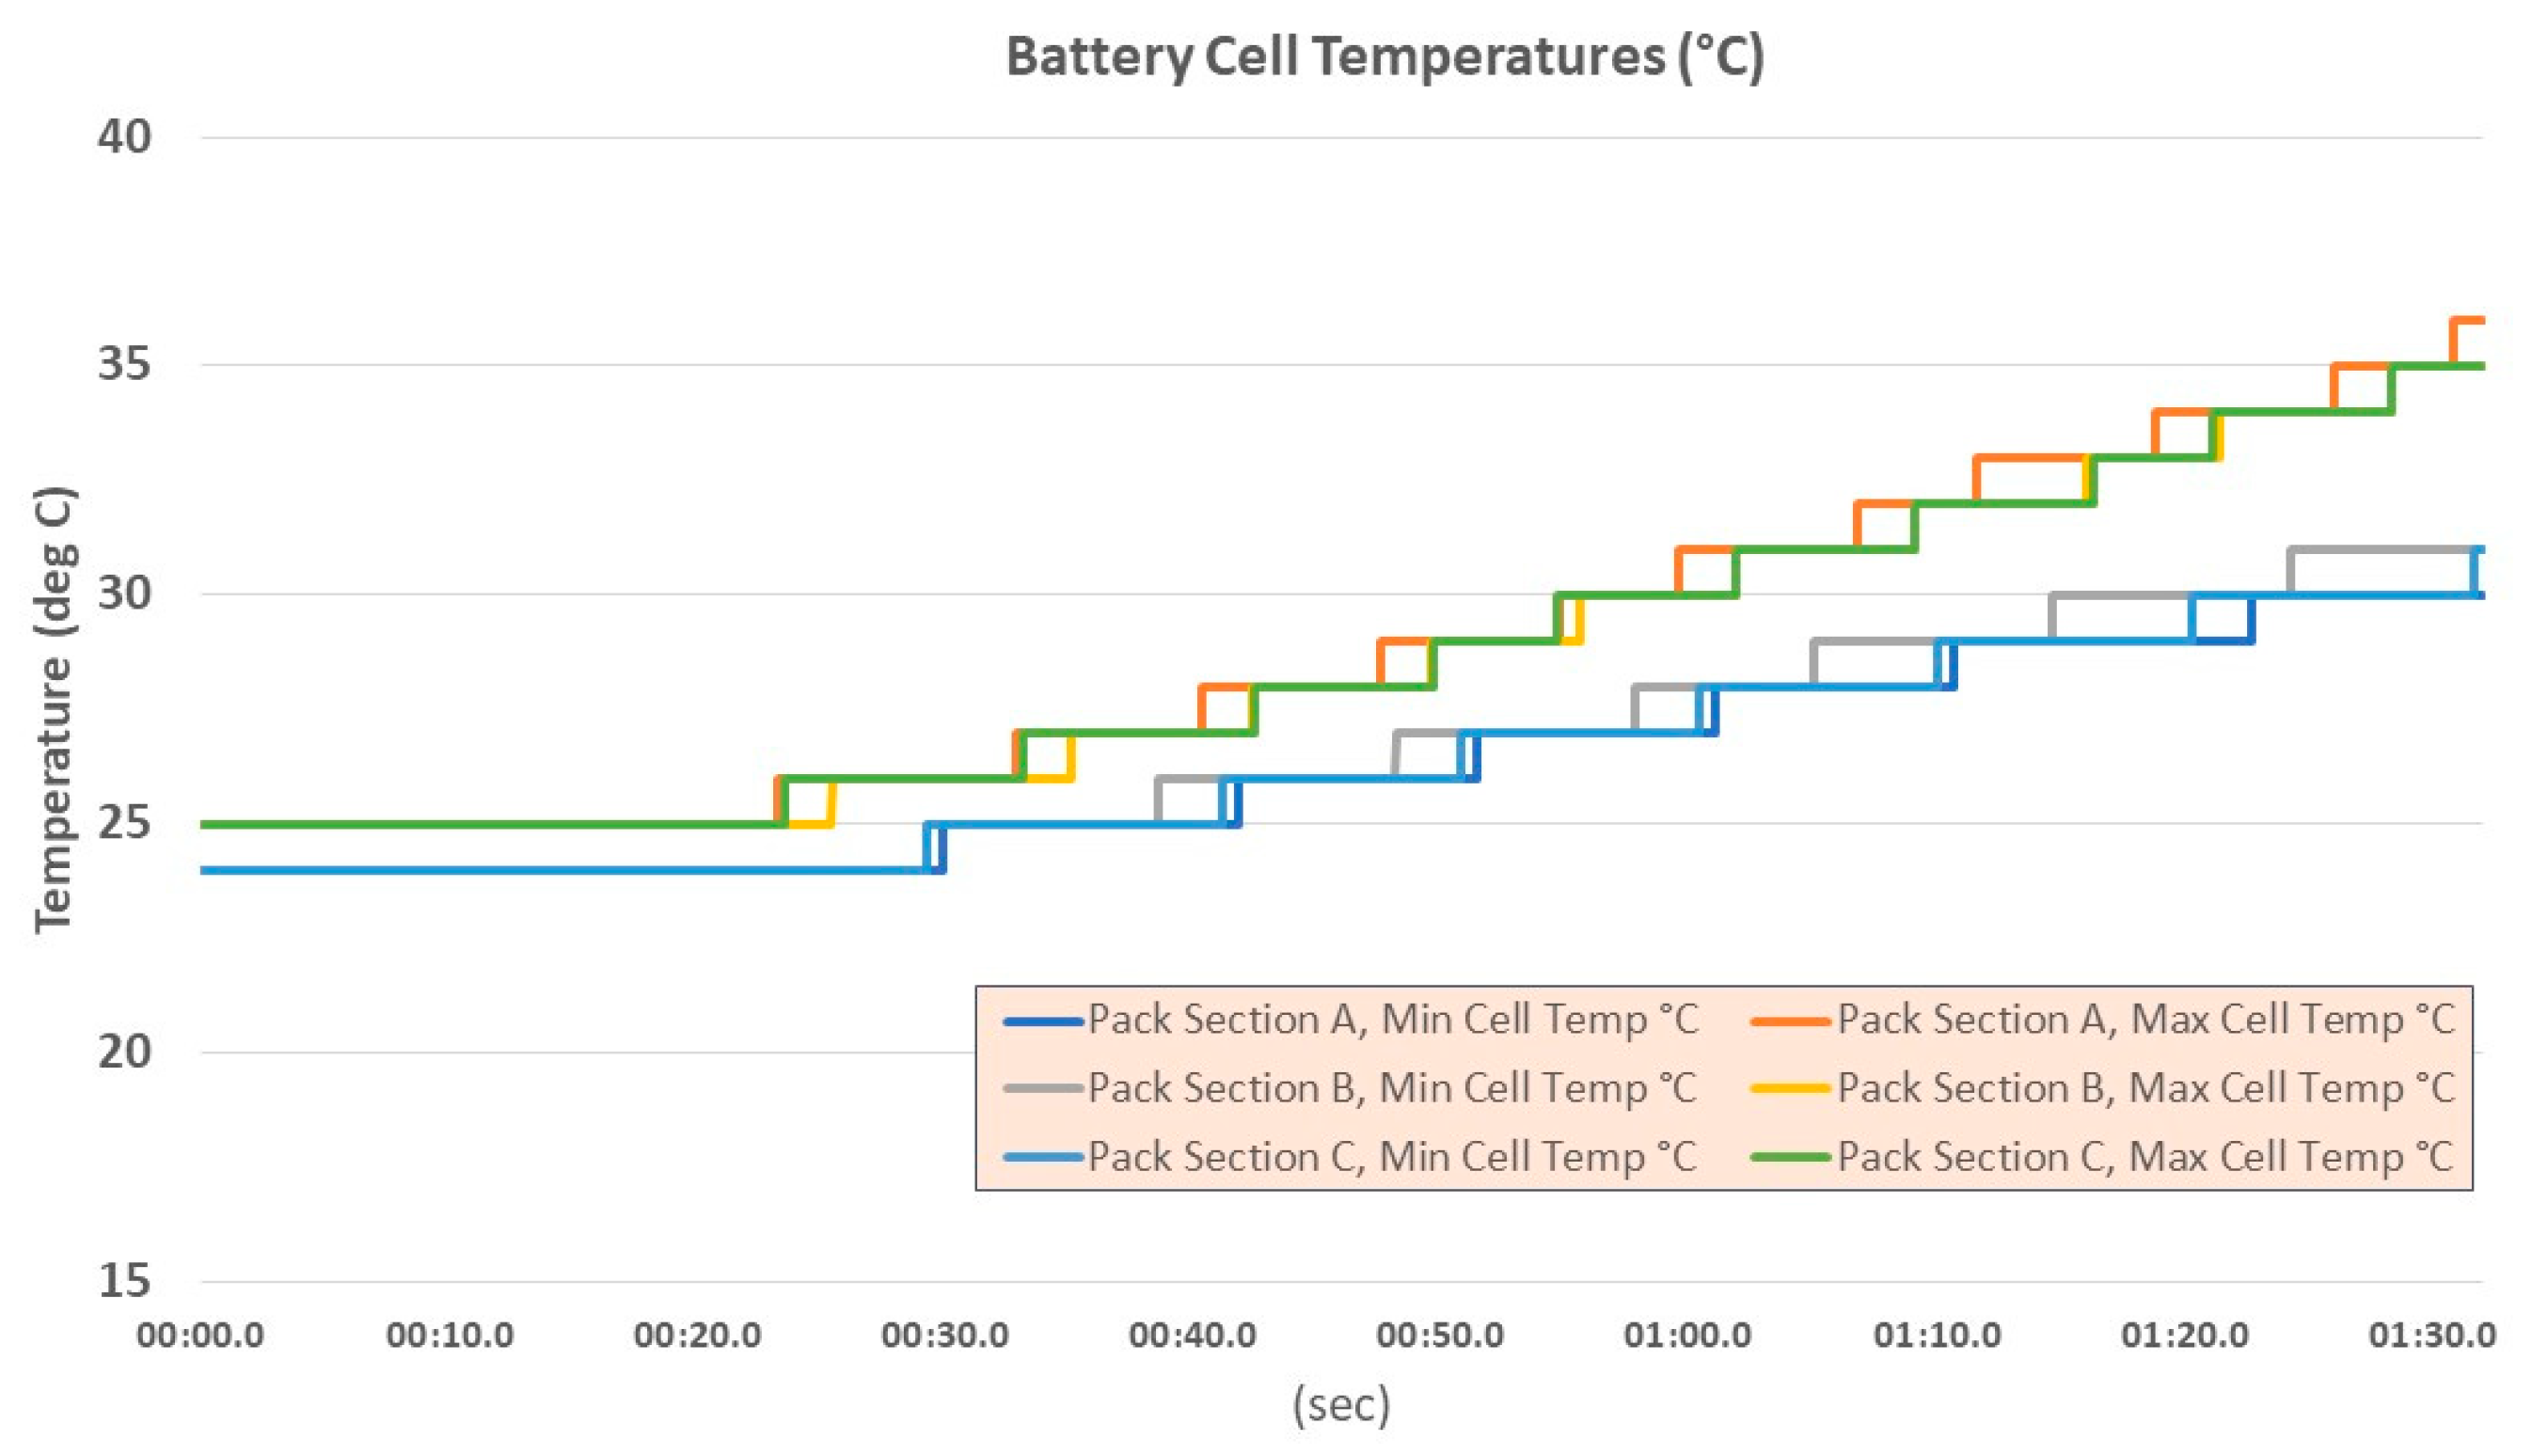
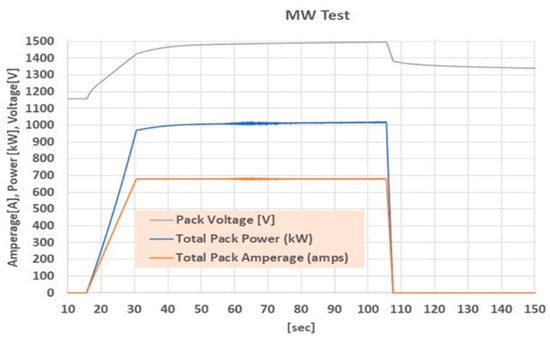
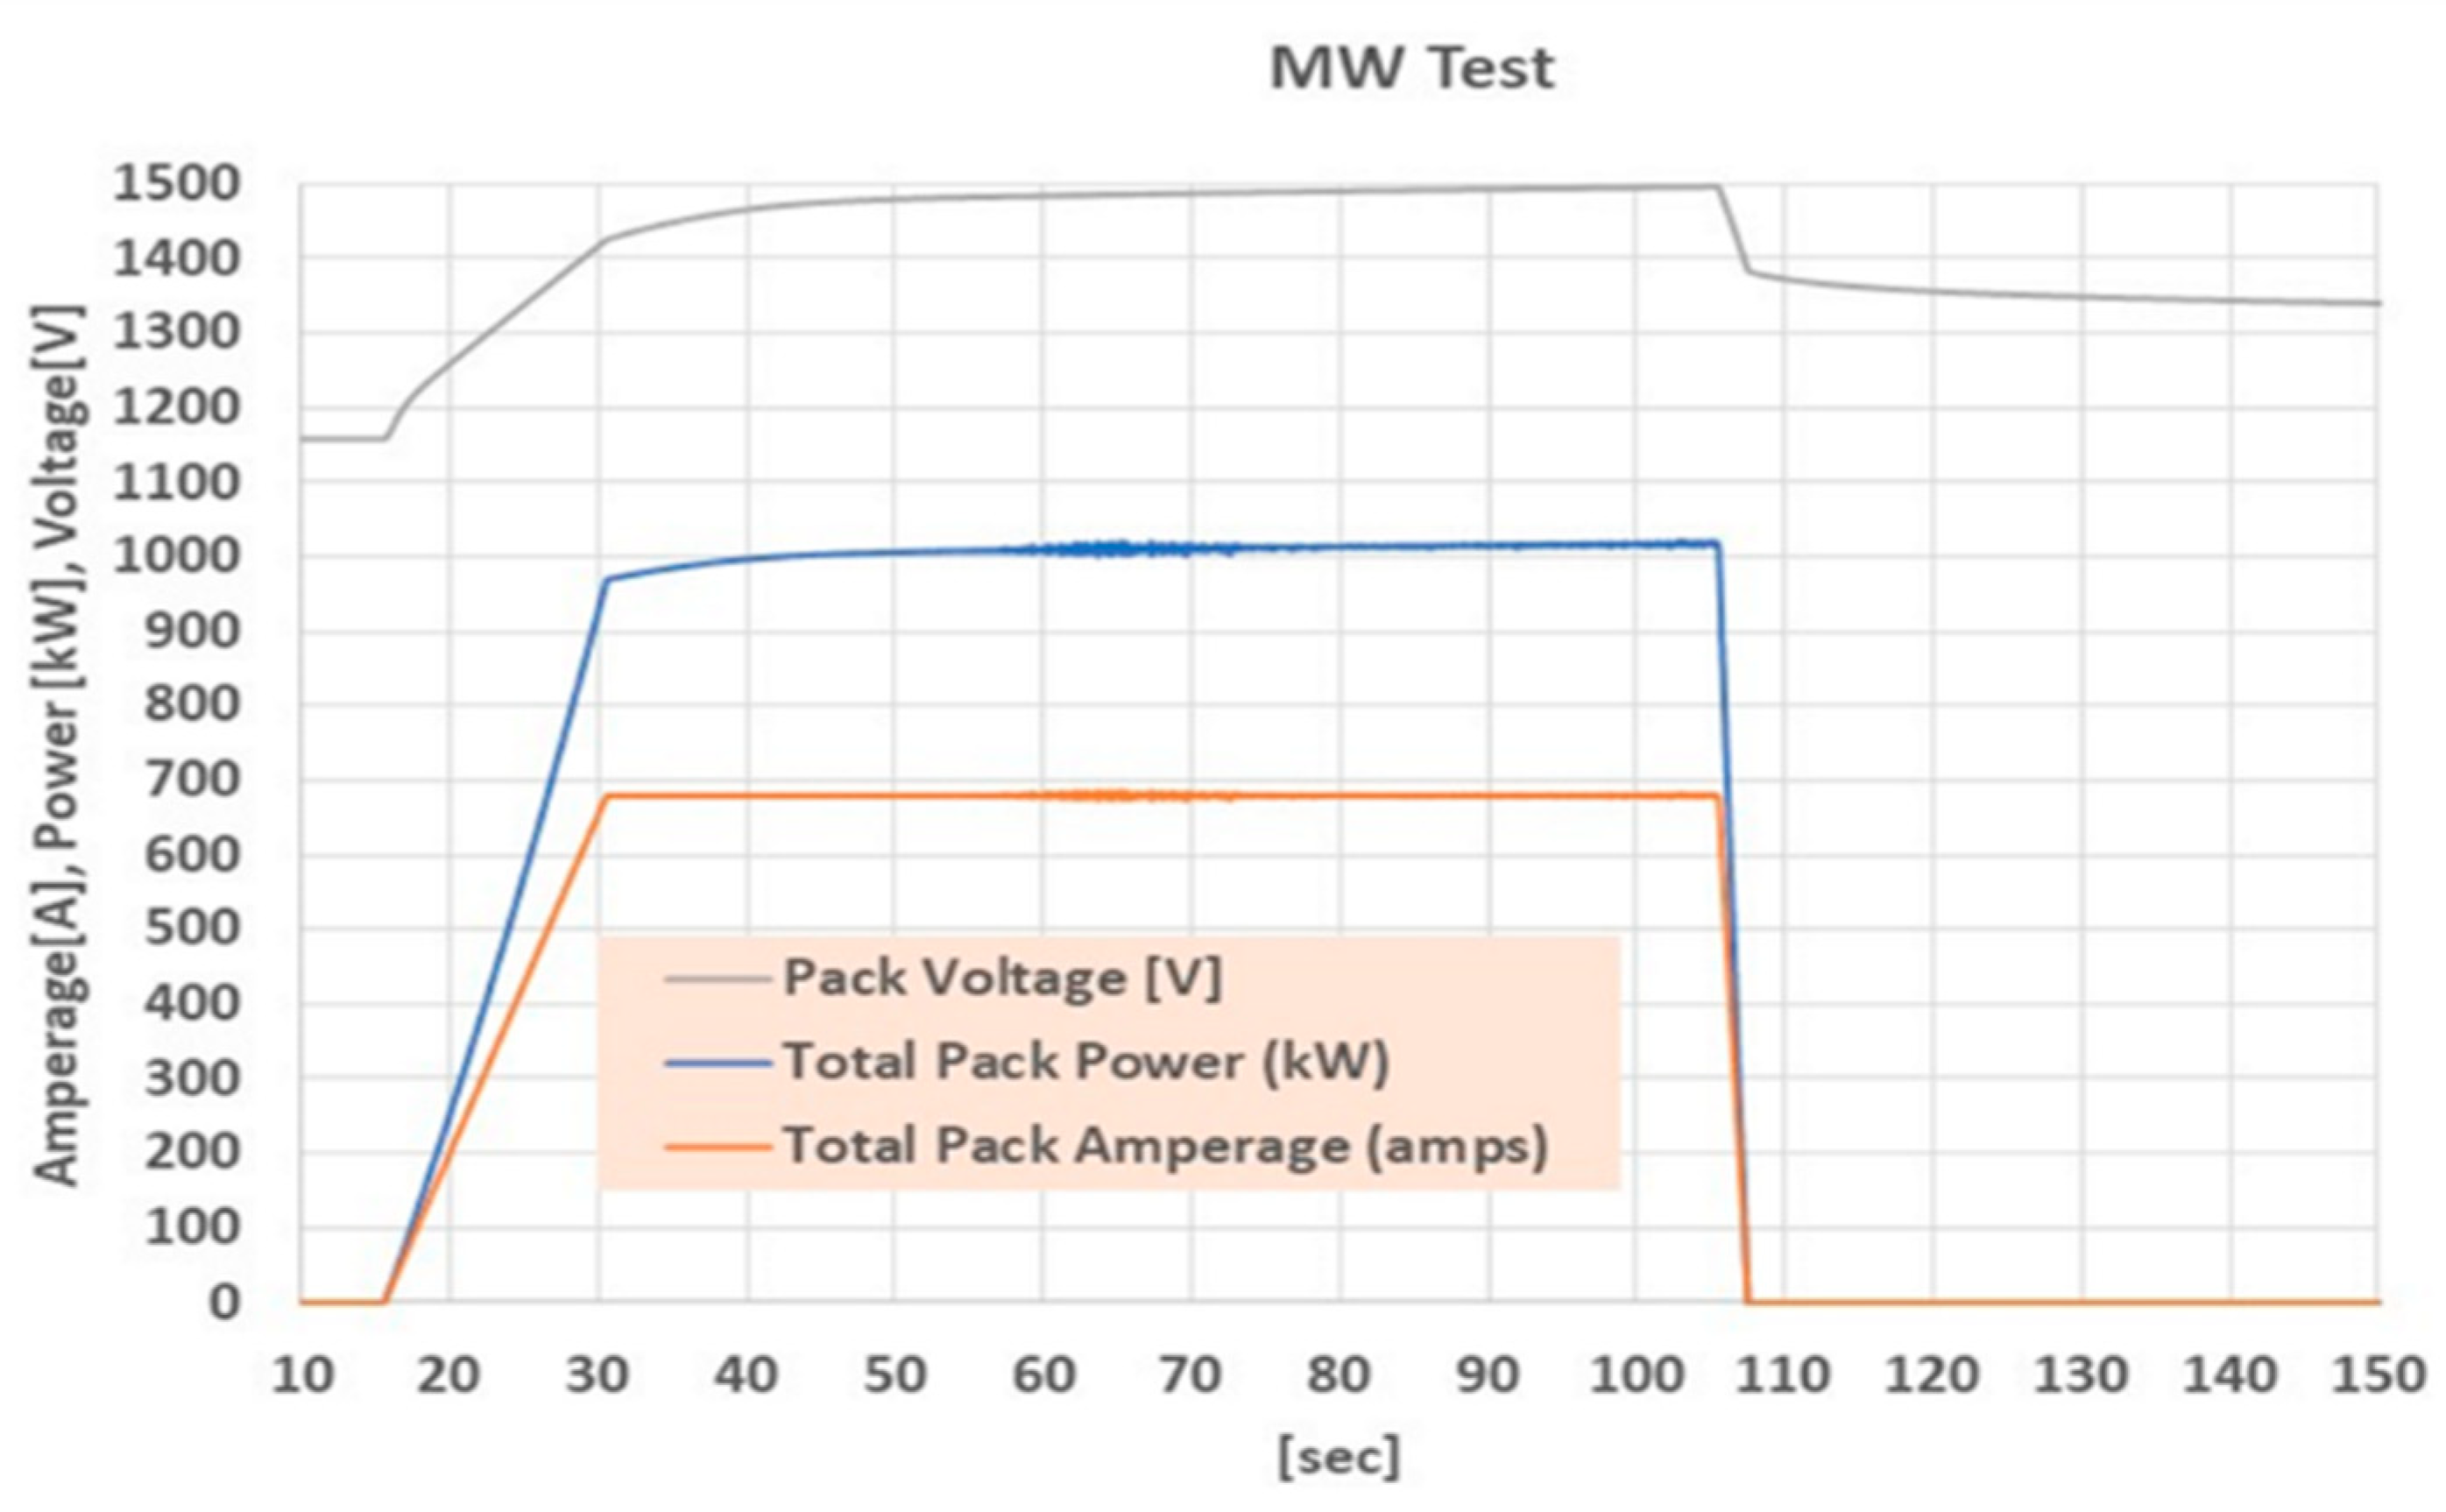
After completing sensor calibration, safety validation, and emergency-shutoff drills, we executed a high-power test following this prescription. The pack was charged at roughly 680 A for about 90 s, during which the power exceeded 1 MW without the cycler exceeding its 1500 V ceiling. Figure 15 shows the measured cell temperature during the charging event and Figure 16 shows the measured current and voltage profiles from this experiment, confirming that the selected current level achieved the intended power trace while maintaining the required voltage headroom. The initial voltage excursion at the start of the pulse was slightly lower than the ~1470 V predicted by the simple resistance model, suggesting that the effective pack resistance decreases somewhat under load. Additional testing at intermediate current levels would help refine this dependence and improve the accuracy of future predictions.
Figure 15.
Battery Cell Temperatures during Megawatt Charging.
Figure 16.
1000 kW Test Data.
7. Summary
Fast recharge is a key enabler for broader adoption of battery electric trucks, particularly where duty cycles demand short turnaround times. Meeting this need requires coordinated advances in cell technology, RESS architecture, thermal management, and charging infrastructure. In this work we have presented a megawatt-capable, reconfigurable battery pack together with a modeling and validation framework aimed at understanding the limits of 1 MW-class charging.
The main outcomes can be summarized as follows:
- A 144 kWh, 40P384S RESS test platform was designed and built with reconfigurable 750 V, 1125 V, and 1500 V operating modes, enabling controlled studies of high-power charging under different bus-voltage configurations.
- A physics-based equivalent-circuit and thermal model was developed to link cell-level parameters to pack-level power, heat generation, and temperature rise, providing guidance on feasible 1 MW charge profiles and SOC windows.
- A Simulink-based digital twin of the sectionalized pack was constructed to analyze current–sensor mismatch and contactor behavior, and to verify protection strategies across the available pack configurations.
- Pack-level testing, including 2C/3C characterization and a megawatt charge demonstration, was used to extract cell and system resistances, validate the model, and confirm that a 680 A, ~1500 V operating point can deliver ~1 MW while respecting equipment limits.
The overall program thus progressed from analytical modeling and simulation to full-scale hardware demonstration using the rack-mounted pack and a high-power charger. Because the cells employed were not designed for sustained 7C operation, only a limited number of megawatt charge events were executed to avoid lithium plating and internal short circuits. Nonetheless, the combined hardware and modeling approach provides a reusable platform for exploring extreme fast charging of medium- and heavy-duty BEV packs and for guiding future designs that may employ chemistries optimized for repeated megawatt-class operation.
Author Contributions
M.R. proposed the idea of building and testing a prototype megawatt charging system for fast charging battery electric trucks. He also created the system Simulink model to study system robustness to current–sensor mismatches. O.G. was the technical lead of the hardware development, debugging, and testing for the proof-of-concept megawatt charging demonstration. He also conducted the single-cell fast charging tests prior to cell selection and confirmation. N.B. conducted the pack architecture analysis using our in-house battery architecture toolchain. All authors have read and agreed to the published version of the manuscript.
Funding
This research received no external funding.
Data Availability Statement
We are able to provide additional data beyond what is shown in the manuscript. Such requests will have to be approved by the GM External Communications team due to the subject matter being in an active competitive space for automotive OEMs.
Conflicts of Interest
Authors Orgun Güralp, Norman Bucknor and Madhusudan Raghavan were employed by the company General Motors R&D. All authors declare that the research was conducted in the absence of any commercial or financial relationships that could be construed as a potential conflict of interest.
Abbreviations
The following abbreviations are used in this manuscript:
| BEV | Battery Electric Vehicle |
| EV | Electric Vehicle |
| GM | General Motors |
| ICE | Internal Combustion Engine |
| Cell current | |
| Pack current | |
| kW | kilowatt |
| kWh | kilowatt-hour |
| MW | Megawatt |
| MCS | Megawatt Charging System |
| OCV | Open Circuit Voltage |
| Pack heat generation | |
| Cell heat generation | |
| Cell Resistance | |
| Pack Resistance | |
| SOC | State of Charge |
| V | Volt |
References
- California Air Resources Board. Battery Electric Truck and Bus Energy Efficiency Compared to Conventional Diesel Vehicles. CARB Report, Updated May 2018. Available online: https://ww2.arb.ca.gov/sites/default/files/2018-11/180124hdbevefficiency.pdf (accessed on 23 February 2026).
- Schneider, J.; Teichert, O.; Zähringer, M.; Balke, G.; Lienkamp, M. The novel Megawatt Charging System standard: Impact on battery size and cell requirements for battery-electric long-haul trucks. ETransportation 2023, 17, 100253. [Google Scholar] [CrossRef] [Scilit]
- Makoschitz, M. Key aspects to enable multi-megawatt fast charging. E I Elektrotech. Informationstechnik 2022, 139, 435–448. [Google Scholar] [CrossRef] [Scilit]
- Wang, S.; Crosier, R.; Chu, Y. Investigating the Power Architectures and Circuit Topologies for Megawatt Superfast Electric Vehicle Charging Stations with Enhanced Grid Support Functionality. In Proceedings of the 2012 IEEE International Electric Vehicle Conference, Greenville, SC, USA, 4–8 March 2012; IEEE: New York, NY, USA, 2012; pp. 1–8. [Google Scholar] [CrossRef] [Scilit]
- Bommenahalli, R.; Chandran, D. Comparative Analysis of Megawatt Charging Systems Infrastructure for Heavy-Duty Electric Vehicles: North America, Europe, and China. J. Power Energy Eng. 2025, 13, 10–23. [Google Scholar] [CrossRef]
- Ahmadi, M.; Mithulananthan, N.; Sharma, R. A review on topologies for fast charging stations for electric vehicles. In Proceedings of the 2016 IEEE International Conference on Power System Technology (POWERCON), Wollongong, NSW, Australia, 28 September–1 October 2016; IEEE: New York, NY, USA, 2016; pp. 1–6. [Google Scholar] [CrossRef] [Scilit]
- Zhu, X.; Mishra, P.; Mather, B.; Zhang, M.; Meintz, A. Grid Impact Analysis and Mitigation of En-Route Charging Stations for Heavy-Duty Electric Vehicles. IEEE Open Access J. Power Energy 2023, 10, 141–150. [Google Scholar] [CrossRef] [Scilit]
- Moorthy, R.S.K.; Starke, M.; Dean, B.; Adib, A.; Campbell, S.; Chinthavali, M. Megawatt scale charging system architecture. In Proceedings of the 2022 IEEE Energy Conversion Congress and Exposition (ECCE), Detroit, MI, USA, 9–13 October 2022; IEEE: New York, NY, USA, 2022; pp. 1–8. [Google Scholar] [CrossRef] [Scilit]
- Li, L.; Chen, R.; Zhong, D.; Liu, Y.; Wu, D.; Zhang, K. The Latest International Progress and Implications of Megawatt-Level Charging Technology. In Frontier Academic Forum of Electrical Engineering; Springer Nature: Singapore, 2024; pp. 474–487. [Google Scholar]
- Srdic, S.; Lukic, S. Toward Extreme Fast Charging: Challenges and Opportunities in Directly Connecting to Medium-Voltage Line. IEEE Electrif. Mag. 2019, 7, 22–31. [Google Scholar] [CrossRef] [Scilit]
- Gabbar, H.A.; Elsayed, Y.; Siddique, A.B.; Elshora, A.; Adeleke, A. Design of Fast Charging Station with Energy Management for eBuses. Vehicles 2021, 3, 807–820. [Google Scholar] [CrossRef] [Scilit]
- Mohamed, A.A.; Jun, M.; Mahmud, R.; Mishra, P.; Patel, S.N.; Tolbert, I.; Santhanagopalan, S.; Meintz, A. Hierarchical control of megawatt-scale charging stations for electric trucks with distributed energy resources. IEEE Trans. Transp. Electrif. 2022, 9, 4951–4963. [Google Scholar] [CrossRef] [Scilit]
- Iyer, V.M.; Gulur, S.; Gohil, G.; Bhattacharya, S. Extreme fast charging station architecture for electric vehicles with partial power processing. In Proceedings of the 2018 IEEE Applied Power Electronics Conference and Exposition (APEC), San Antonio, TX, USA, 4–8 March 2018; IEEE: New York, NY, USA, 2018; pp. 659–665. [Google Scholar]
- Hang, Y.; Wei, L.; Shao, X.; Jia, X.; Zhao, H.; Tang, Y. Simulation Validation of Megawatt-Scale Charging Interface Thermal Management Based on ACN-Sim. In Proceedings of the 2024 IEEE 22nd International Conference on Industrial Informatics (INDIN), Beijing, China, 18–20 August 2024; IEEE: New York, NY, USA, 2024; pp. 1–7. [Google Scholar] [CrossRef] [Scilit]
- Zhu, C. High-Efficiency, Medium-Voltage-Input, Solid-State-Transformer-Based 400-kW/1000V/400A Extreme Fast Charger for Electric Vehicles (No. EE-0008361); OSTI ID: 1987553; Delta Electronics (Americas) Ltd.: Livonia, MI, USA; OSTI: Oak Ridge, TN, USA, 2023. [Google Scholar] [CrossRef] [Scilit]
- Brown, A.; Cappellucci, J.; Gaus, M.; Buleje, H. Electric Vehicle Charging Infrastructure Trends from the Alternative Fueling Station Locator: Second Quarter 2024; No. NREL/TP-5400-91053; National Renewable Energy Laboratory (NREL): Golden, CO, USA, 2024. [Google Scholar] [CrossRef] [Scilit]
- Guralp, O.; Bucknor, N.; Raghavan, M. Megawatt Charging—Toward ‘Fast as Gas’, Mechanical Engineering Solutions 2025. In Proceedings of the 2nd International Conference and Exhibition “MECHANICAL ENGINEERING SOLUTIONS: Design, Simulation, Testing and Manufacturing” (MES-2025), Yerevan, Armenia, 17–19 September 2025; pp. 99–109. [Google Scholar]
- Bucknor, N.; Patil, C.; Raghavan, M. Design and Testing of a 1 MW 800 V Truck Testbed for High Performance Applications. In Volume 1: 26th International Conference on Advanced Vehicle Technologies (AVT), Proceedings of the ASME 2024 International Design Engineering Technical Conferences and Computers and Information in Engineering Conference, Washington, DC, USA, 25–28 August 2024; V001T01A010. ASME: New York, NY, USA, 2024. [Google Scholar] [CrossRef] [Scilit]
- Kumar, R.; Chavan, S. Thermal Investigation of Cylindrical Lithium-ion Batteries for Different Loading using Experimental and Numerical Techniques. J. Electrochem. Soc. 2022, 169, 120504. [Google Scholar] [CrossRef] [Scilit]
- Hecht, C.; Figgener, J.; Sauer, D.U. Protocols and Interfaces for EV Charging. In Next Generation Electrified Vehicles Optimised for the Infrastructure; Brandstätter, B., Steiner, A., Eds.; Springer Briefs in Applied Sciences and Technology; Springer: Cham, Switzerland, 2024. [Google Scholar] [CrossRef] [Scilit]

Disclaimer/Publisher’s Note: The statements, opinions and data contained in all publications are solely those of the individual author(s) and contributor(s) and not of MDPI and/or the editor(s). MDPI and/or the editor(s) disclaim responsibility for any injury to people or property resulting from any ideas, methods, instructions or products referred to in the content. |
© 2026 by the authors. Licensee MDPI, Basel, Switzerland. This article is an open access article distributed under the terms and conditions of the Creative Commons Attribution (CC BY) license.