


Abstract
Model simulation and experimental work are carried out on the stator frame of a large box-type motor using statistical energy analysis (SEA). The internal loss factors were obtained through experimental testing and imported into VA One to establish an SEA model and an FE-SEA hybrid model. By comparing the experimental vibration response with the vibration prediction results from SEA and FE-SEA models, the study verifies the feasibility and accuracy of simulation analysis based on statistical energy analysis for predicting the mid-to-high frequency vibration of large box-type motor stator frames. Based on the validated SEA model, a layer-by-layer vibration energy transmission analysis based on input power contribution is carried out. By quantitatively comparing the input power contributions of adjacent structural plates, the dominant vibration energy transmission path from the stator core excitation to the motor feet is identified, and its energy contribution is quantified, providing guidance for the structural optimization of the stator frame.
1. Introduction
Large-power drive motors are highly demanded by large-scale equipment in energy, transportation, marine, aerospace and other fields. These motors operate under heavy load for long continuous periods, and their vibration and noise performance determines the safety and environmental indicators of the entire industrial system. Motor vibration is mainly divided into three categories: electromagnetic vibration, mechanical vibration, and aerodynamic vibration. For large-capacity motors, electromagnetic excitation is an important source of motor vibration, especially in the mid-to-high frequency range, with excitation frequencies ranging from several tens of Hz to several kHz. Previous studies have shown that radial electromagnetic force is the primary cause of electromagnetic vibration [1]. Since the frequency and amplitude of electromagnetic excitation are restricted by motor performance indicators, the sole reduction of excitation sources presents evident limitations. Accordingly, structural optimization to suppress electromagnetic vibration transmitted from the stator core to the mounting feet along the transfer path represents an important approach for motor vibration and noise reduction.
Currently, three primary methods are widely adopted for vibration modeling and simulation analysis. The finite element method (FEM) and boundary element method (BEM) apply to low-frequency conditions. The statistical energy analysis (SEA) is suitable for high-frequency prediction. After half a century of development, SEA has become a mature high-frequency vibration analysis method in the field of vibration and noise, widely applied in automotive, marine, aerospace and other industries. However, its application in motor vibration analysis and prediction spans only a little over two decades, and most studies have focused on small induction motors. In 1999, Delaere et al. investigated a 5.2 kW motor [2], dividing the stator frame into three annular subsystems (ignoring the mounting feet), measuring the internal loss factors and coupling loss factors of each subsystem, and then performing SEA analysis to obtain the transmission characteristics from the air gap to the frame. Wang et al., drawing on previous experience, additionally considered the motor mounting feet as independent subsystems [3,4]. By measuring the internal loss factors and coupling loss factors of each subsystem of a 2.2 kW induction motor, they completed SEA modeling and vibration prediction. The predicted results above 1000 Hz agreed well with experimental measurements. Shen and Wu [5] investigated a 1.1 kW switched reluctance motor, further dividing the stator winding into an independent subsystem and using SEA to predict the mid- to high-frequency vibration velocity of the motor. Wang et al. [6] and Li et al. [7] studied simplified motor structures and achieved mid- to high-frequency vibration prediction by hybrid modeling using FEM and SEA. These studies indicate that SEA can effectively reduce the computational cost for the mid-to-high-frequency vibration prediction of motors. However, existing works mainly focus on motors with low power or relatively simplified structures. As a typical structural form of large-capacity motors, the stator frame of large box-type motors exhibits large overall dimensions, complex configurations and dense stiffener arrangements. A large number of SEA subsystems are generated during division, and their connection relationships are complicated. Vibration energy can transmit through multiple parallel structural paths. These factors increase the difficulty of reasonable subsystem division and the identification of dominant vibration transfer relationships. In addition, components show significant differences in dimension and stiffness, which leads to obvious non-uniformity in modal density. Thin-walled plates possess high modal density within the mid-to-high frequency range. By contrast, the stator core, mounting feet and local high-stiffness regions present sparse modes. Accordingly, a full SEA model can hardly satisfy statistical assumptions in certain frequency bands. Compared with small- and medium-sized motors, vibration analysis for the stator frame of large box-type motors poses greater engineering complexity.
Among the above-mentioned problems, non-uniform modal density is one of the critical factors that degrade the prediction accuracy of full SEA models for large box-type motors. To address the mid-frequency problem caused by the coexistence of deterministic structures with low modal density and statistical structures with high modal density, Langley et al. established the hybrid FE-SEA theory and developed the deterministic-statistical hybrid vibro-acoustic analysis method [8,9,10]. Such methods have been applied to mid-frequency vibro-acoustic prediction of complex structures in aircraft and automobile engineering [11,12]. The hybrid FE-SEA theory has continued to evolve in recent years. Andrade et al. [13] extended the hybrid FE-SEA method to displacement excitation cases and greatly reduced the computational cost of complex vibro-acoustic systems, and later expanded its applicability to nonlinear vibro-acoustic systems by using the equivalent linearization method [14]. In China, the FE-SEA method has also been adopted to analyze complex structures such as fairings and vehicle aerodynamic noise [15,16]. It can be concluded that the FE-SEA method has formed a relatively mature theoretical framework and engineering application system, and its primary advantage lies in improving the response prediction performance of conventional SEA for deterministic structures with low modal density and responses within the mid-frequency region.
However, structural vibration responses alone cannot fully clarify the energy transmission mechanism of vibration in complex assembled structures. Magrans et al. [17] decomposed the responses of linear vibro-acoustic systems into the sum of a finite number of transfer paths based on direct transmissibility. The relative weights of different energy transfer paths were also discussed in their work. Guo et al. [18] constructed a vibration transfer model based on the improved transfer matrix method for parallel fluid-transporting pipeline systems. They explicitly proposed to identify the dominant transfer paths of the system using power-flow signals. Wang et al. [19] calculated the power flowing into and out of the bogie frame for high-speed train bogies. They further ranked the vibration transfer paths between the bogie frame and the car body. Ren et al. [20] stratified the vibration transfer process of gear systems based on the vibration power-flow theory. They identified the dominant transfer paths at different positions and in different directions. The structural intensity field exhibits vortex features under mid-to-high frequency conditions. Such features mask the actual energy flow. Takhchi et al. [21] extracted the irrotational component. They clearly identified the energy flow paths from sources to sinks for general plate-like structures. Current analyses of vibration transfer paths are mainly based on power flow or transmissibility. Existing methods focus on predefined transfer paths or mechanical systems with clear hierarchical connections such as gears and pipelines. However, these methods have clear limits for the present structure. Transmissibility-based expansion yields path weights that are difficult to map onto specific panels and branches of the present structure under dense coupling. Power-flow-based methods have been applied mainly to systems with clear hierarchical connections and paths that can be defined in advance. Irrotational-intensity methods rely on a field obtained from FE-computed responses, where the FE method incurs a higher computational cost than SEA, and this field becomes difficult to interpret as energy crosses welds and plate interfaces.
Existing studies on mid-to-high frequency vibration modeling and prediction of motors mainly focus on small-sized motors or simplified stator structures. There is a lack of research on vibration transfer characteristics of the stator frame of large box-type motors, a complex structure with many mutually coupled panels including the iron core, end plates, reinforcing plates, rib plates and motor feet. This study takes the stator frame of a large box-type motor as the research object. The FE-SEA hybrid model is built using VA One software version 2015 for mid-to-high frequency vibration prediction, and experiments are performed to verify the accuracy of the model. Vibration energy in the stator frame of a large box-type motor transmits from the stator core to the motor feet through multiple parallel branches that are difficult to predefine or isolate individually. Therefore, this study proposes a layer-by-layer backtracking identification method for vibration energy transfer paths based on input power. The methodological contribution lies in progressively identifying the dominant transmission chain of a complex system (234 subsystems) by ranking the input power contributions of directly coupled subsystems at each backtracking step, starting from the target motor foot and tracing backward toward the stator core. Unlike the standard power-flow output of VA One, which gives the power flow between subsystems, the present method reconstructs the dominant chain back to the stator core. The method is grounded in the SEA power balance, where coupling loss factors characterize the energy exchange between subsystems. On the SEA model with measured internal loss factors and validated by vibration responses, starting from the target subsystem of motor feet, the input power of each structural panel is adopted as the evaluation index of energy transmission. Layer-by-layer power contribution comparison is carried out for candidate transmission panels between the iron core excitation and motor feet, and high-contribution transmission branches at each layer are retained for continuous tracking. This approach identifies the dominant vibration energy transfer path from iron core excitation to motor feet of the large box-type motor and quantifies the energy contribution of this dominant path. It can provide a quantitative basis for determining key energy transfer components and targeted vibration reduction optimization of the stator frame.
2. FE-SEA Theory and Parameter Determination
2.1. The FE-SEA Hybrid Method
Large box-type stator frames of motors are fabricated by welding and assembling many plates. In the mid- and high-frequency range, the modal density of the structure increases. The finite element method requires high computational cost under such conditions. Meanwhile, some components with relatively high stiffness exhibit sparse modes, and the full SEA model may suffer from accuracy limitations when applied to these parts. Therefore, the FE-SEA hybrid method is adopted to establish the vibration prediction model.
The FE-SEA method divides the structure into deterministic subsystems and statistical subsystems. For structural regions with low modal density or where local responses are of interest, the finite element method is used to describe their dynamic characteristics. For structural regions with high modal density and statistically distributed vibration responses, the SEA method is adopted for modeling. According to their coupling relationships with deterministic subsystems, statistical subsystems can be further classified into two categories: Type I statistical subsystems, which are directly coupled with deterministic subsystems, and Type II statistical subsystems, which interact only with other statistical subsystems. The dynamic equation governing the degrees of freedom q of the deterministic subsystem is expressed as:
where k denotes the number of statistical subsystems connected to the deterministic subsystem. The total dynamic stiffness matrix of the system is obtained by linear superposition of the dynamic stiffness matrix of the deterministic subsystem and the dynamic stiffness matrix at the hybrid junction:
2.2. Acquisition of Internal Loss Factor Based on ESEA
The internal loss factor is a key parameter in SEA. For simple structures, the loss factor can be obtained through analytical formulas. However, for complex mechanical structures in practical engineering, loss factor parameters are commonly obtained through experimental measurement, namely the experimental statistical energy analysis (ESEA). Lalor [22,23] proposed a simplified measurement method for SEA parameters, which lays a foundation for the identification of SEA parameters of engineering structures. The identification of ESEA parameters relies on the accurate measurement of input power and spatially averaged vibration responses of each subsystem. The energy balance matrix may become ill-conditioned when measurement errors are large or the differences in energy responses among different subsystems are small. The prediction accuracy of the SEA model is affected by the experimental scheme and parameter identification method.
The classical statistical energy method is based on the weak coupling assumption, where the internal loss factor is much larger than the coupling loss factor. Accordingly, the total loss factor ηsi can be used to approximate the internal loss factor ηi:
where Pi denotes the average input power to subsystem i, ω is the angular frequency in rad/s, Ei is the space- and time-averaged vibrational energy of subsystem i.
It should be noted that approximating the internal loss factor using the total loss factor relies on the assumption that the energy transferred to neighboring subsystems is relatively small compared with the energy dissipated within the subsystem. When this assumption is not fully satisfied, the internal loss factor may be overestimated, as part of the coupling-related energy transfer is attributed to internal dissipation. This approximation may introduce uncertainty into the subsequent SEA predictions, particularly in the estimation of vibration energy level ratios between coupled subsystems.
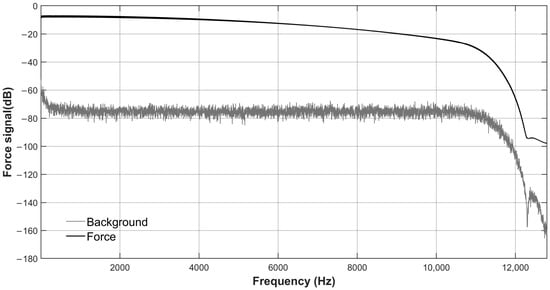
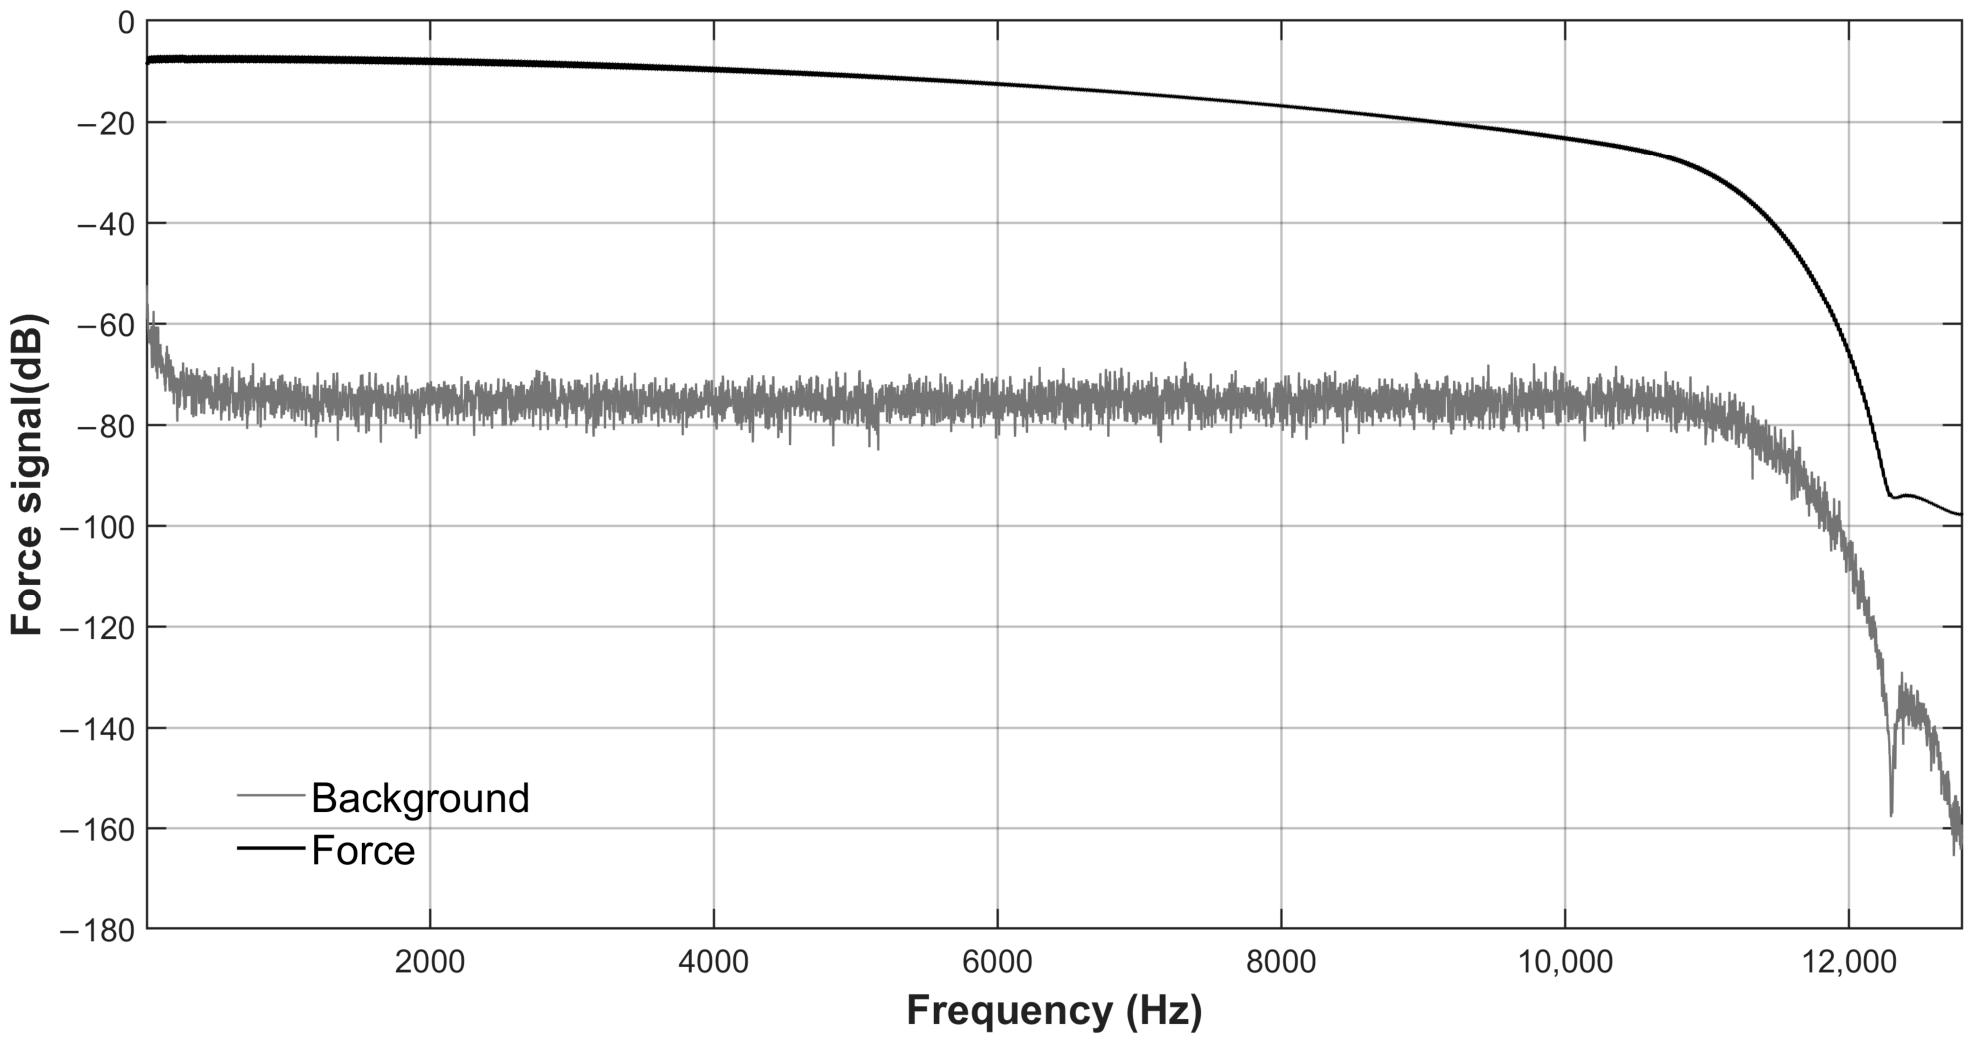
The main experimental methods for measuring internal loss factors include the steady-state energy flow method and the transient decay method. In this study, the steady-state energy flow method was adopted to estimate the internal loss factors, with repeated hammer impacts applied at an average rate of approximately 1 Hz to simulate steady-state broadband excitation [24]. Although individual hammer impacts are transient in the time domain, repeated hammer strikes maintain the force signal at a relatively high level, 30 dB above the background noise, and their FFT spectra are approximately flat over the investigated frequency range. As shown in Figure 1, the measured impact force spectrum is approximately flat over the investigated frequency range of 10 Hz to 10 kHz, with an effective upper frequency limit exceeding 10 kHz. The steady-state energy flow method requires accurate measurement of the space- and time-averaged vibrational energy of the excited subsystem and the input power. Theoretically, both the input excitation force and the velocity response at the excitation point need to be measured simultaneously. In practice, however, the velocity signal is obtained from an accelerometer placed near the excitation point. This approach has relatively little influence on the measurement error of the input power.
Figure 1.
Comparison of the measured force signal and the background signal.
This study takes a large box-type motor stator frame as the research object, with overall dimensions of 1350 mm × 836 mm × 1170 mm. The frame mainly consists of a 50 mm thick stator core, 20 mm thick vertical support plates, 12 mm thick side plates and lateral support plates, 40 mm thick mounting feet, 30 mm thick end covers, a 10 mm thick top plate, and a 4 mm thick base plate. The frame material is Q235 steel, and the total weight is 1271 kg.
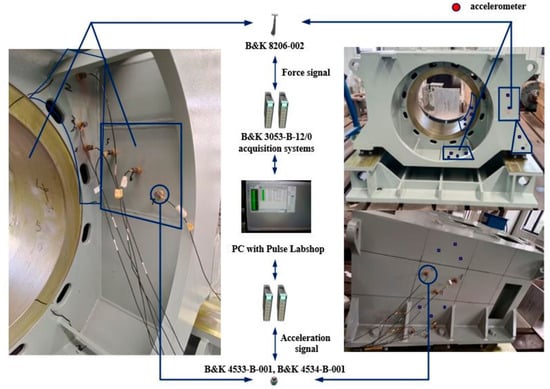
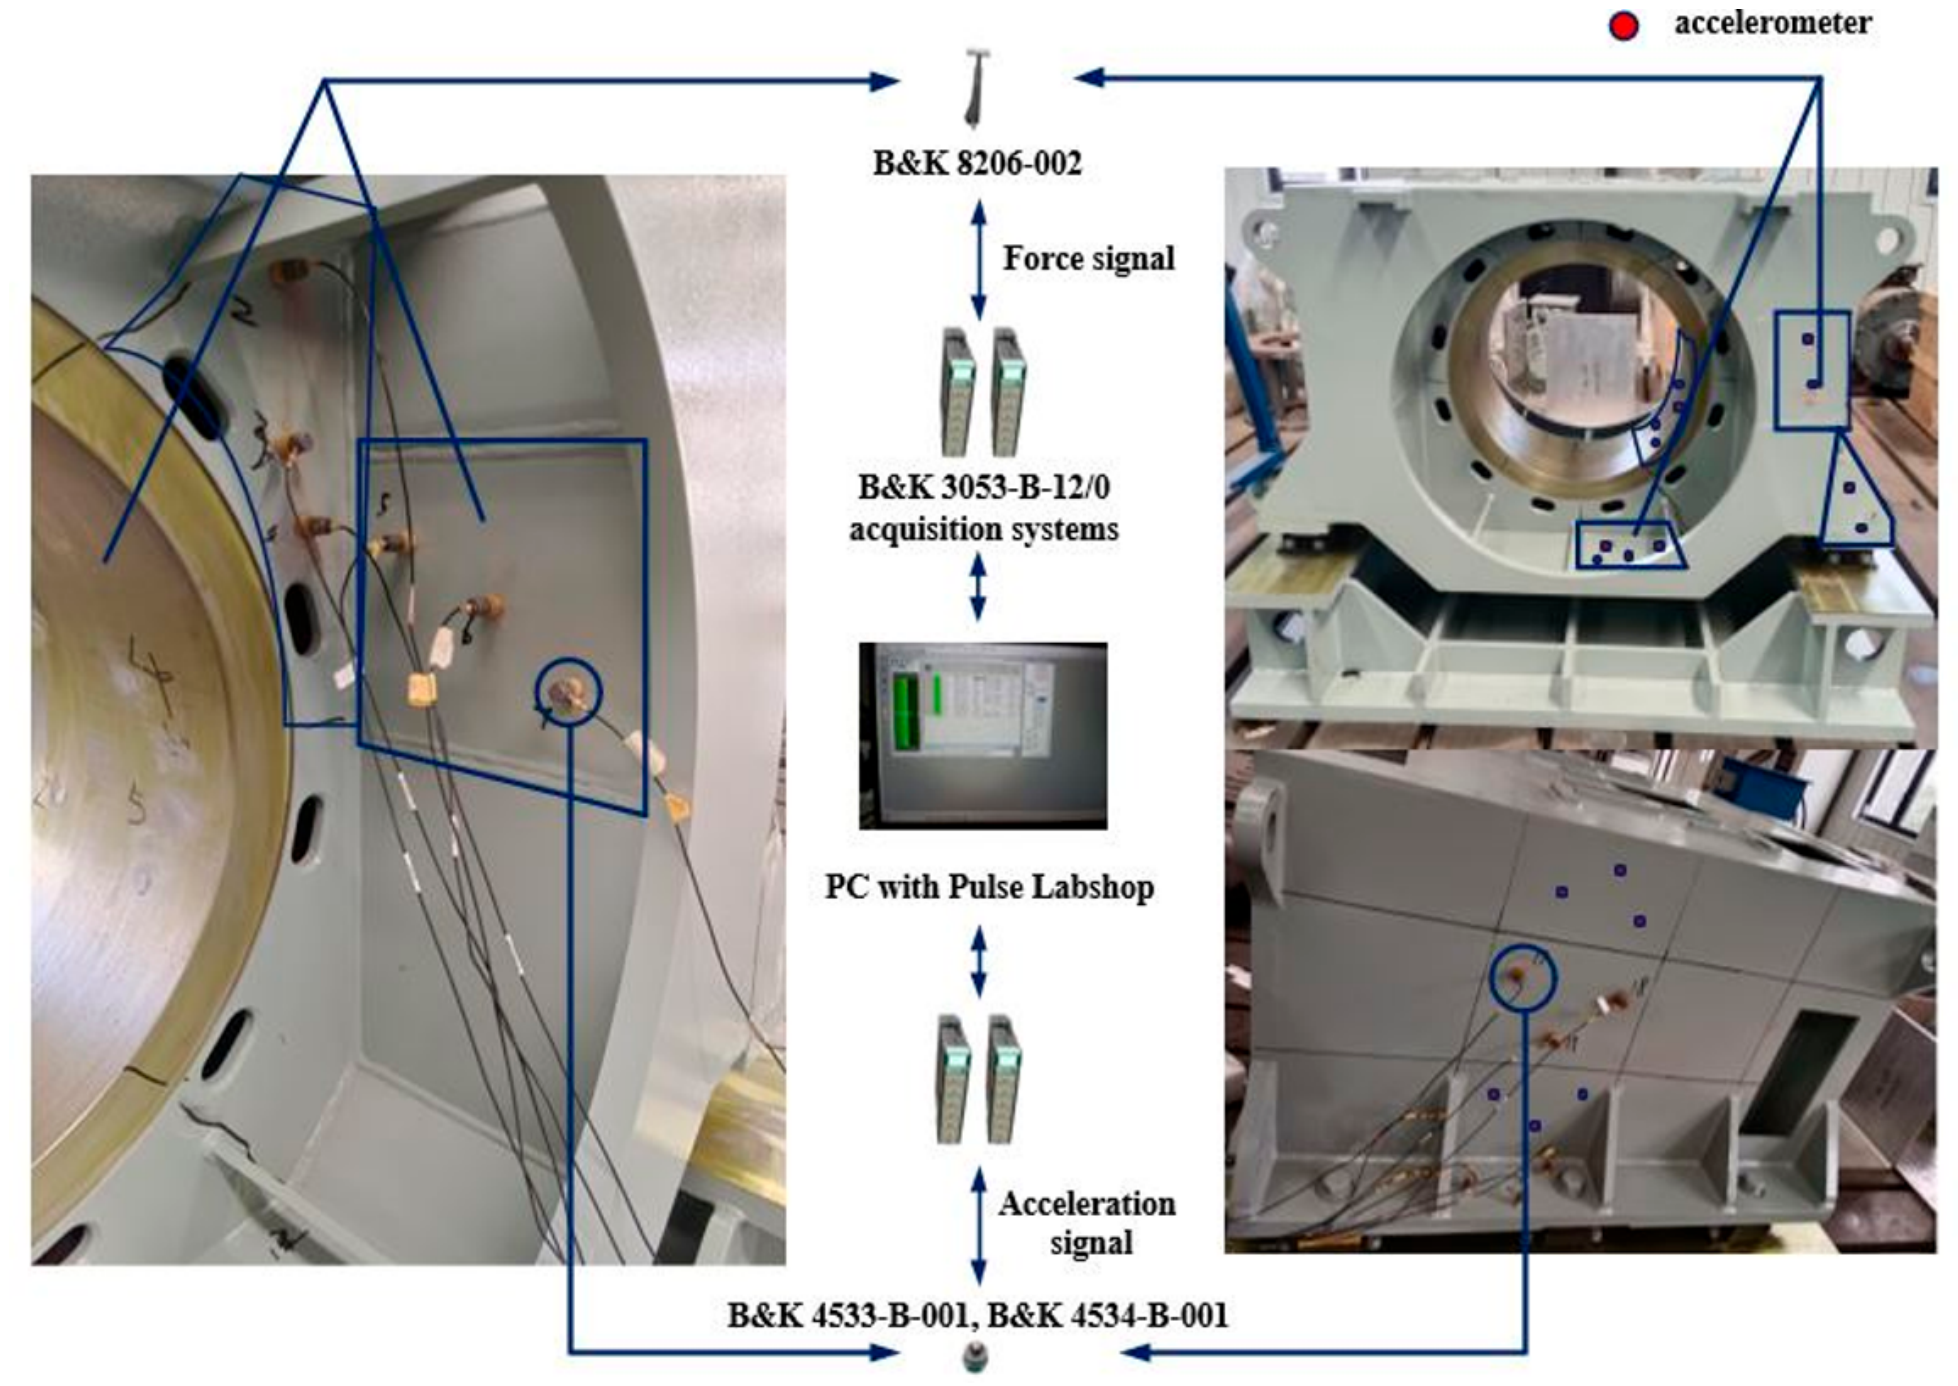
The stator frame of a large box-type motor consists of numerous welded plate components. If loss factor identification is carried out separately for every structural plate, the experimental workload will increase significantly. Moreover, it is difficult to obtain independent test results without altering the original welded connections and actual boundary constraints. Based on the homogeneity assumption in statistical energy analysis, plates with the same thickness exhibit similar vibration dissipation characteristics. Therefore, only several representative plates from each thickness group of the stator frame are selected for testing. As shown in Figure 2, the motor stator frame is mounted on the foundation base via vibration isolators. The influences introduced by the isolators are mainly present at low frequencies and can be neglected. The test system mainly consists of the stator frame, an impact hammer, accelerometers and two data acquisition systems. SEA subsystems are divided according to physical boundary conditions, and representative plates are selected for testing from each subsystem of different thickness groups. Considering the size and structural complexity of different subsystems, accelerometers (B&K 4533-B-001, B&K 4534-B-001) are placed at 2–4 random measurement points on the surface of each subsystem. The number of measurement points for each subsystem was selected according to its physical dimensions and accessible surface area. Two measurement points were used for smaller subsystems, while three or four points were arranged for larger subsystems. The measurement points were spatially distributed and selected in an approximately random manner, avoiding edges and boundaries to reduce the influence of localized vibration responses. The spatially averaged mean-square velocity was calculated from the measurements at these points. The repeatability of the measured spatially averaged energy was also examined to assess the consistency of the experimental results. Partial subsystems and their measurement layouts are shown in the figure as examples, with red dots indicating accelerometer measurement points. An impact hammer (B&K 8206-002) is used to sequentially strike each measurement point on every subsystem. The vibration acceleration near the excitation point is measured by the accelerometers, and the acceleration signal is integrated in real time to obtain the velocity signal. Both the velocity signal and the force signal are processed by two acquisition systems (B&K 3053-B-12/0) to compute the cross-power spectrum, the imaginary part of which is taken as the input power of the hammer for each strike. Each impact is applied near one of the accelerometers to calculate the input power, while the measurements from the remaining accelerometers are used to evaluate the average vibrational energy of each subsystem E = <MV2>.
Figure 2.
Vibration measurement of the large box-type motor stator frame.
When assessing the effect of background noise on vibration test results, the measured signal is generally 20 dB higher than the measured noise in the concerned frequency band. This means the effective vibration response is significantly larger than the background noise, and background noise has little influence on measurement results. Therefore, the vibration responses obtained in this frequency band possess good signal identifiability and test reliability. This can be used for subsequent vibration characteristic analysis and model validation.
To obtain results that can truly reflect the global energy distribution, excitations are applied at multiple locations and repeated impact tests are performed. The measured results are averaged in both spatial and statistical domains to obtain reliable estimates of the internal loss factors:
where K is the number of measurements.
Taking one vertical support plate subsystem as an example, the internal loss factors obtained by exciting each measurement point in the mid- and high-frequency bands gradually converge to the average value, as shown in Figure 3. This verifies the repeatability of the spatial averaging results.
Figure 3.
Repeatability of spatial-averaged internal loss factors for a vertical support panel subsystem.
2.3. Formula for the Coupling Loss Factor of Plate Subsystems
The coupling loss factor characterizes the transfer efficiency of vibration energy between different structural subsystems and serves as another critical parameter affecting the accuracy of the SEA model. Since the large box-type stator frame of the motor is mainly composed of plate components, the formula for calculating the coupling loss factor between plates based on wave theory is given as follows:
where cg is the wave group velocity, τij is the transmission coefficient, L is the connection length, and Ai is the area of subsystem i.
The stator frame of large box-type motors features complex welded connections, which cannot be accurately characterized by analytical formulas. Furthermore, it is impractical to experimentally measure the coupling loss factors via the statistical energy method without destroying the original welded assembly state. Therefore, based on the established FE-SEA model and the experimentally identified internal loss factors, the VA One software is employed to automatically calculate the coupling loss factors between structural subsystems.
3. SEA and FE-SEA Hybrid Model of the Large Box-Type Motor Stator Frame
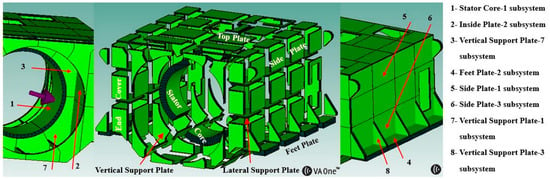
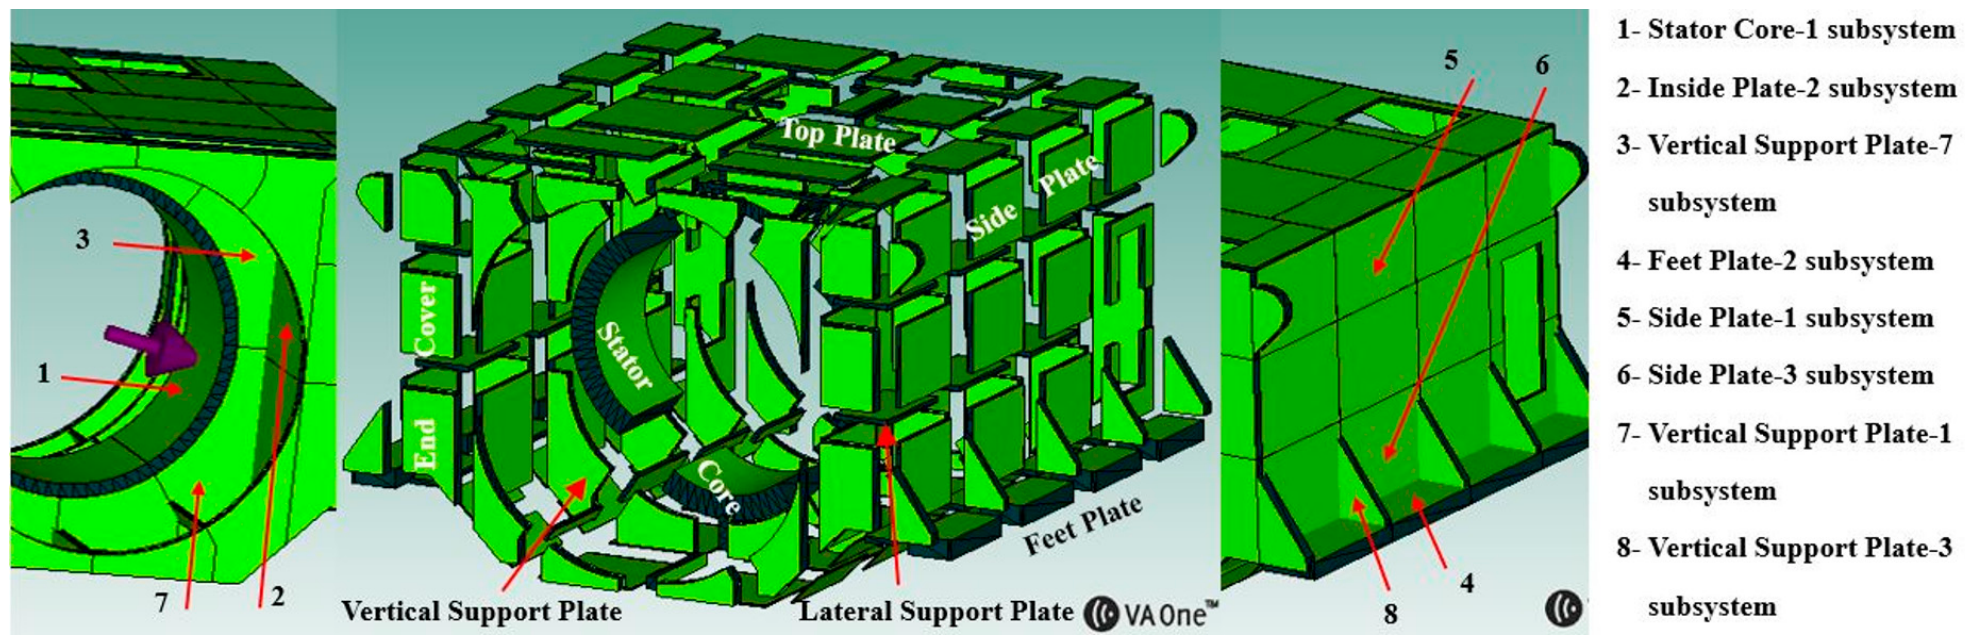
According to SEA theory, a complex structure can be divided into multiple coupled subsystems, where the division is determined by groups of similar resonant modes, and the topological physical boundaries typically serve as the boundaries between subsystems. The large box-type motor stator frame has a complex structure with multiple ribs and stiffeners. Compared with previous studies on small and medium-sized motors, the number of subsystems in a large and complex motor stator frame increases by dozens of times. Figure 4 shows the subsystem division for statistical energy analysis modeling of this structure.
Figure 4.
SEA model and subsystem division of the large box-type motor stator frame.
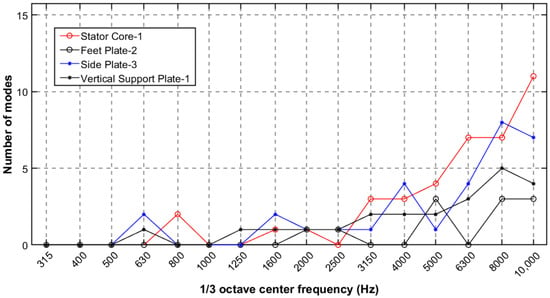
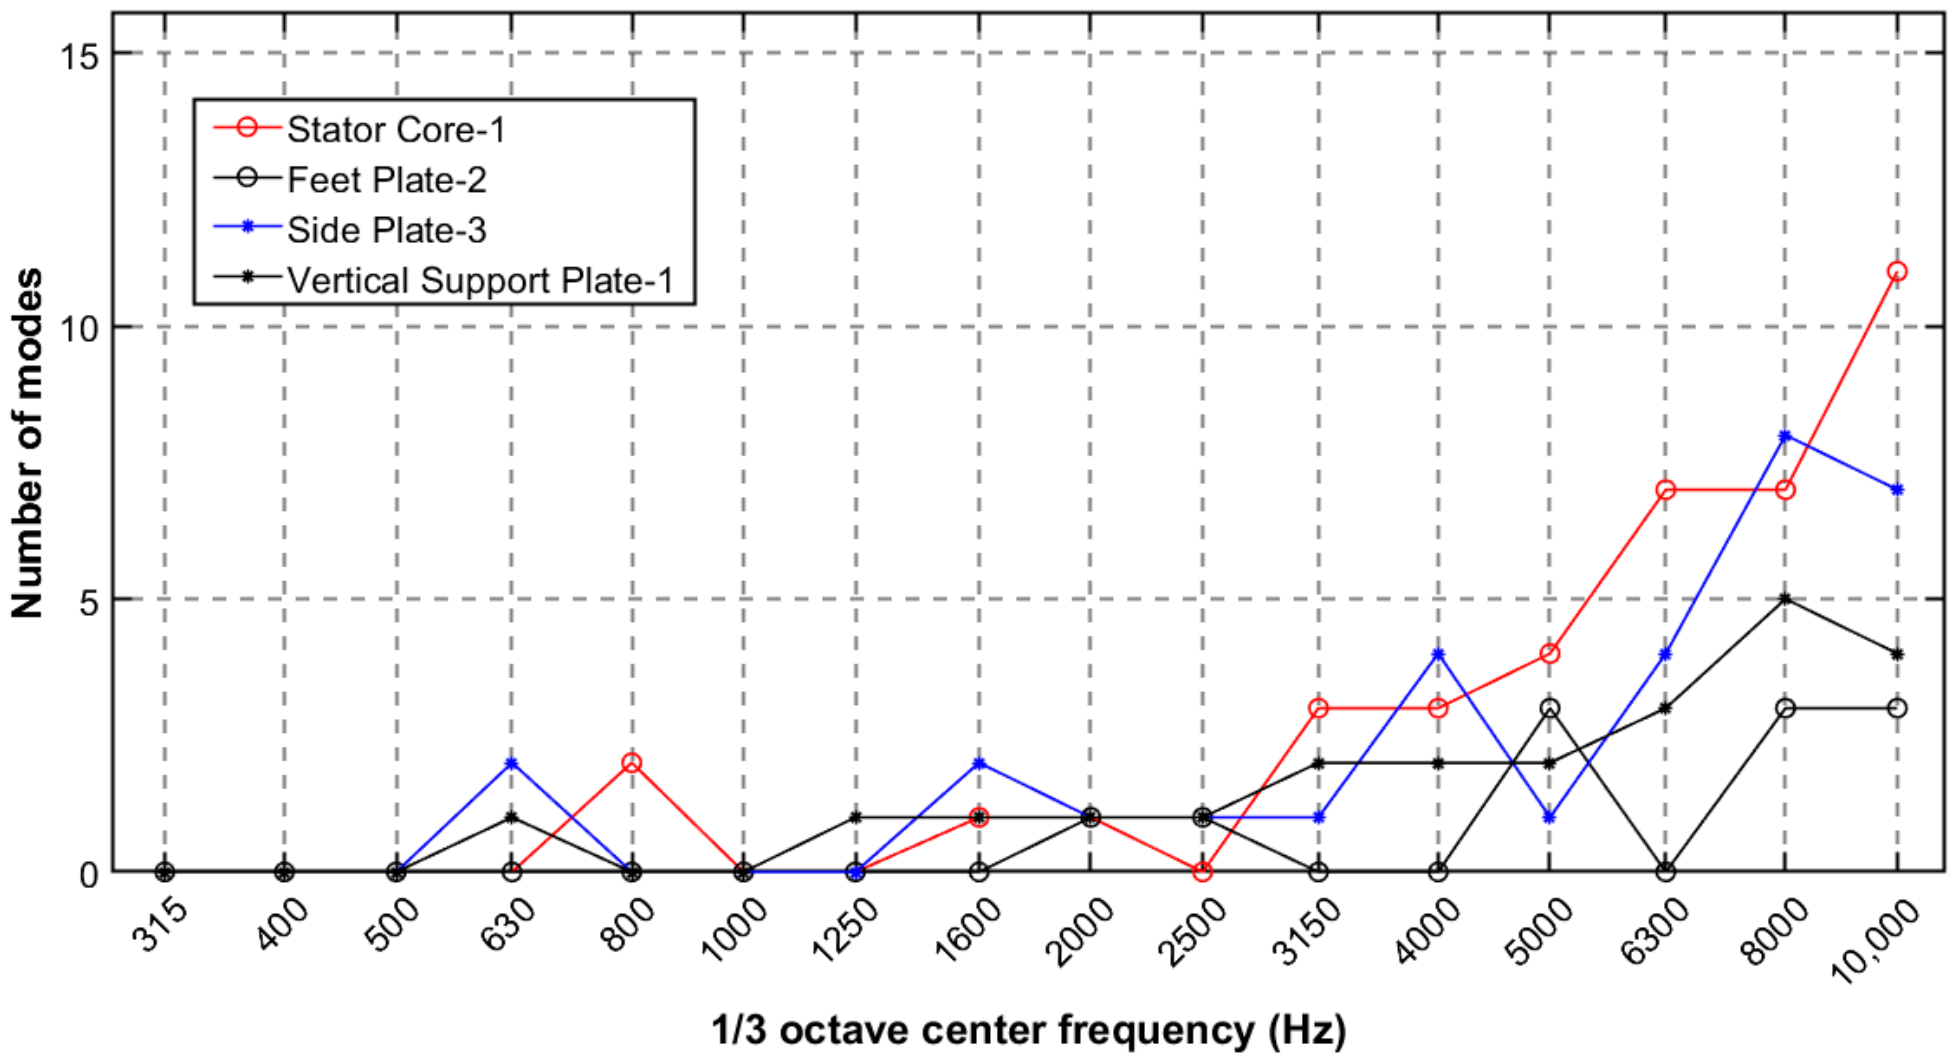
Considering the applicable range of SEA theory, each subsystem must have a sufficiently high modal density within the frequency band of interest. This study uses the finite element software Ansys Workbench version 19.2 to compute the modes of the Stator Core-1, Feet Plate-2, Side Plate-3, and Vertical Support Plate-1 Subsystems under free boundary conditions. Figure 5 shows the number of modes within each one-third octave band.
Figure 5.
The modal counts of the Stator Core-1, Feet Plate-2, Side Plate-3, and Vertical Support Plate-1 subsystems.
For the Side Plate-3 and Vertical Support Plate-1 subsystems, the first mode appears at 630 Hz, but no modes exist at 800 Hz or 1000 Hz. The Vertical Support Plate-1 subsystem exhibits continuous modes starting at 1250 Hz, while the Side Plate-3 subsystem shows continuous modes from 1600 Hz. The Stator Core-1 subsystem has its first mode at 800 Hz, but continuous modes do not appear until 3150 Hz. Since the lowest modal frequency of the subsystems in the motor stator frame structure starts at 630 Hz, and considering the fundamental principles and assumptions of the statistical energy analysis method, this study focuses only on the frequency range above 630 Hz. A comparative analysis is conducted on the accuracy of statistical energy analysis modeling in the mid-frequency range (630–3150 Hz), where the modal count is low, versus the high-frequency range (3150–10,000 Hz), where the modal count is high. In the frequency range of 630–3150 Hz, several SEA subsystems have no modes. This limits the applicability of the statistical assumptions underlying SEA. Above 3150 Hz, all SEA subsystems apart from the mounting feet exhibit continuous modes, which improves the validity of the SEA assumptions. Accordingly, the prediction results are relatively reliable.
This study makes the first attempt to use VA One software to carry out simulation modeling research on a complex structure such as a large box-type motor stator frame. Due to the high stiffness of the mounting feet, the first-order modal frequency of this subsystem is relatively high, and continuous modes do not appear until 8000 Hz, making it unsuitable for modeling using SEA subsystems (Beam, Plate, Singly-Curved Shell, Cylinder, etc.). Therefore, the mounting feet are described using the FEM model with shell elements, and the 40 mm thickness is assigned as a section property on the shell mid-surface, so no element division is made through the thickness. The mesh size used for the feet is 0.02 m. Mesh convergence was assessed with three mesh sizes (0.08 m, 0.04 m and 0.02 m), and the maximum pressure values were 4.5766 × 10⁻⁵ MPa, 4.5766 × 10⁻⁵ MPa and 4.5810 × 10⁻⁵ MPa, obtained from static analysis under an applied force of 1 N. Assuming the theoretical order p = 2 for the shell element and a refinement ratio of r = 2, the GCI was estimated as approximately 0.04%, well below the 5% criterion, which indicates that the 0.02 m mesh provides sufficient accuracy while maintaining computational efficiency. In addition to the static mesh convergence assessment, the dynamic mesh convergence was evaluated using vibration velocity responses obtained from harmonic response analyses. The velocity amplitudes calculated using the 0.02, 0.04, and 0.08 m meshes were compared at representative frequencies. For frequencies exhibiting monotonic convergence, the corresponding fine-grid convergence indices (GCI) were calculated using the three-grid method. The resulting GCI values were 7.89%, 4.84%, 4.58%, 3.64%, 2.60%, and 9.11% at 2200, 2500, 2800, 3100, 3400, and 4000 Hz, respectively. These results indicate that the dynamic responses exhibit generally acceptable mesh convergence, with GCI values below 10% at the selected frequencies. Based on thin-plate theory, one bending wavelength at 10 kHz is 193 mm, which is about five times the plate thickness; therefore, the effect of shear deformation can be neglected in the analyzed frequency range.
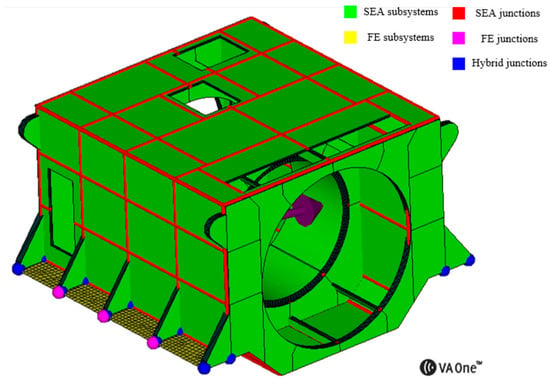
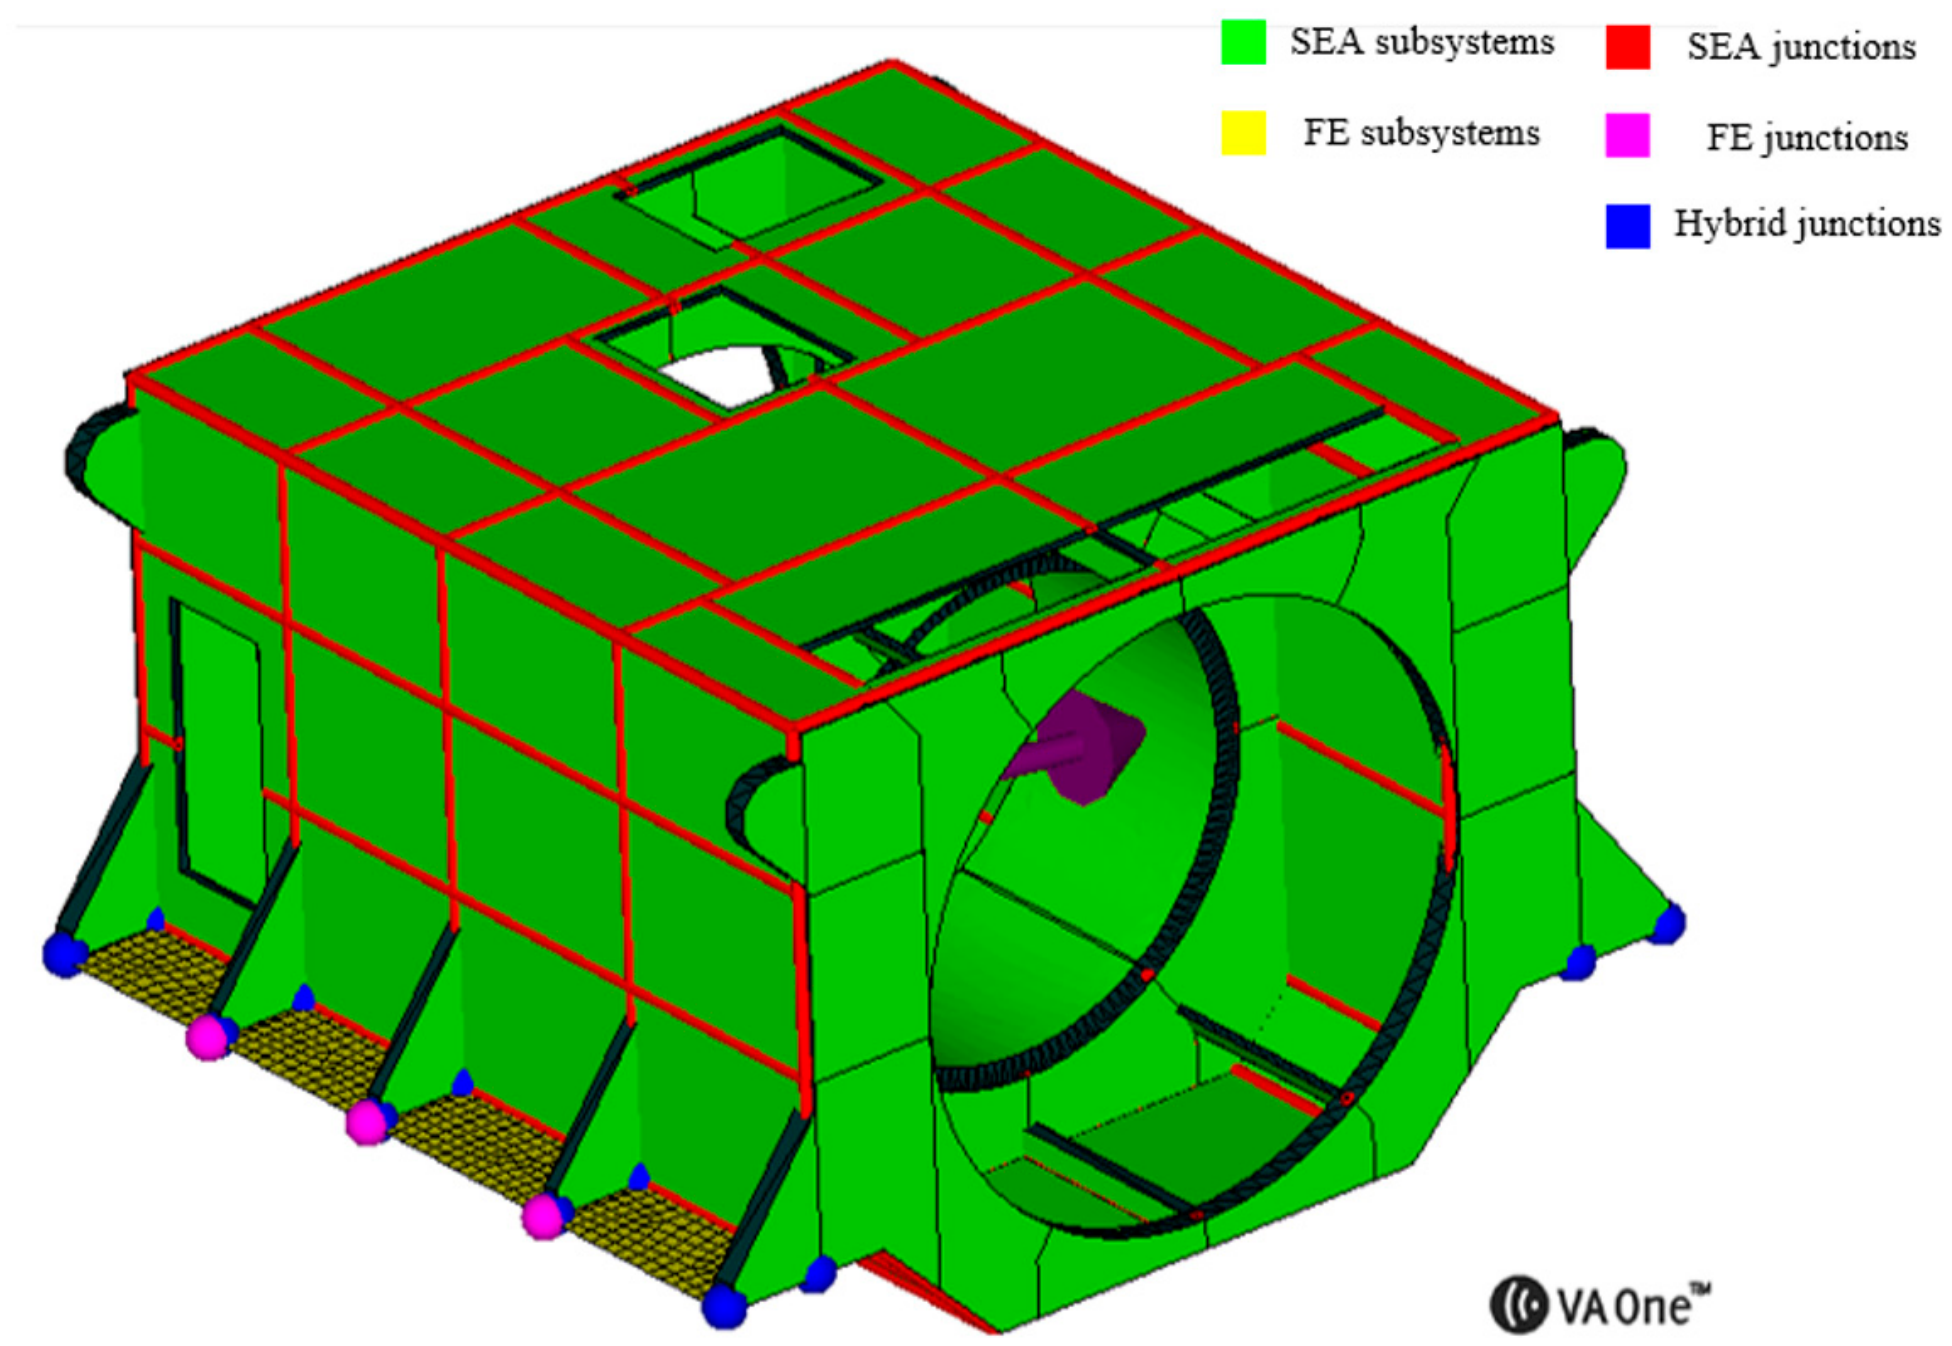
The model consists of 1113 nodes and 925 elements. The four subsystems in the circumferential direction of the stator core are modeled using SEA Singly-Curved Shell subsystems, while the remaining parts of the stator frame are modeled using SEA Plate subsystems. A hybrid FE-SEA model of the large box-type motor stator frame is thus established, as shown in Figure 6, consisting of 8 FE subsystems and 226 SEA subsystems. In the simulation model, the measured internal loss factors are used as material parameter inputs. Unit excitations are applied to the Stator Core-1, Inside Plate-2, and Vertical Support Plate-7 subsystems, respectively, to obtain the vibration energy level ratio. In terms of modeling time, the SEA and FE-SEA models take roughly the same time in this study, approximately 4 h. The SEA model completes response calculations within 1 min. In comparison, the FE-SEA hybrid model requires more computation time because of the introduced FE subsystem. Its initial connection and calculation take about 16 min.
Figure 6.
The FE-SEA hybrid model established in VA One.
In VA One, junctions include point junctions, line junctions, and area junctions. Taking the line junction as an example, a SEA line junction can be created in two ways. Using the Autoconnect button on the modeling toolbar automatically creates line junctions when two or more SEA structural subsystems share a series of two or more consecutive common nodes on their boundary. Using the Create Manual Line Junction button allows line junctions to be created manually where two or more structural subsystems do not share common nodes. In Figure 6, the different junction types are distinguished and labeled by color. A SEA line junction is by default modeled as an ideal connection, meaning mass-less, frictionless and locally rigid. In the physical motor frame, the groove welds are treated as fully connected (full penetration); although local lack-of-fusion may exist, the welding is made as complete as possible, so that the actual structure matches the simulation model as closely as possible.
4. Results
4.1. Internal Loss Factor
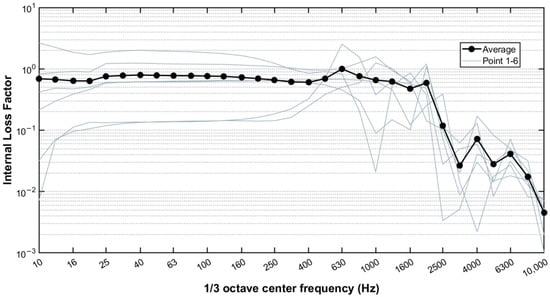
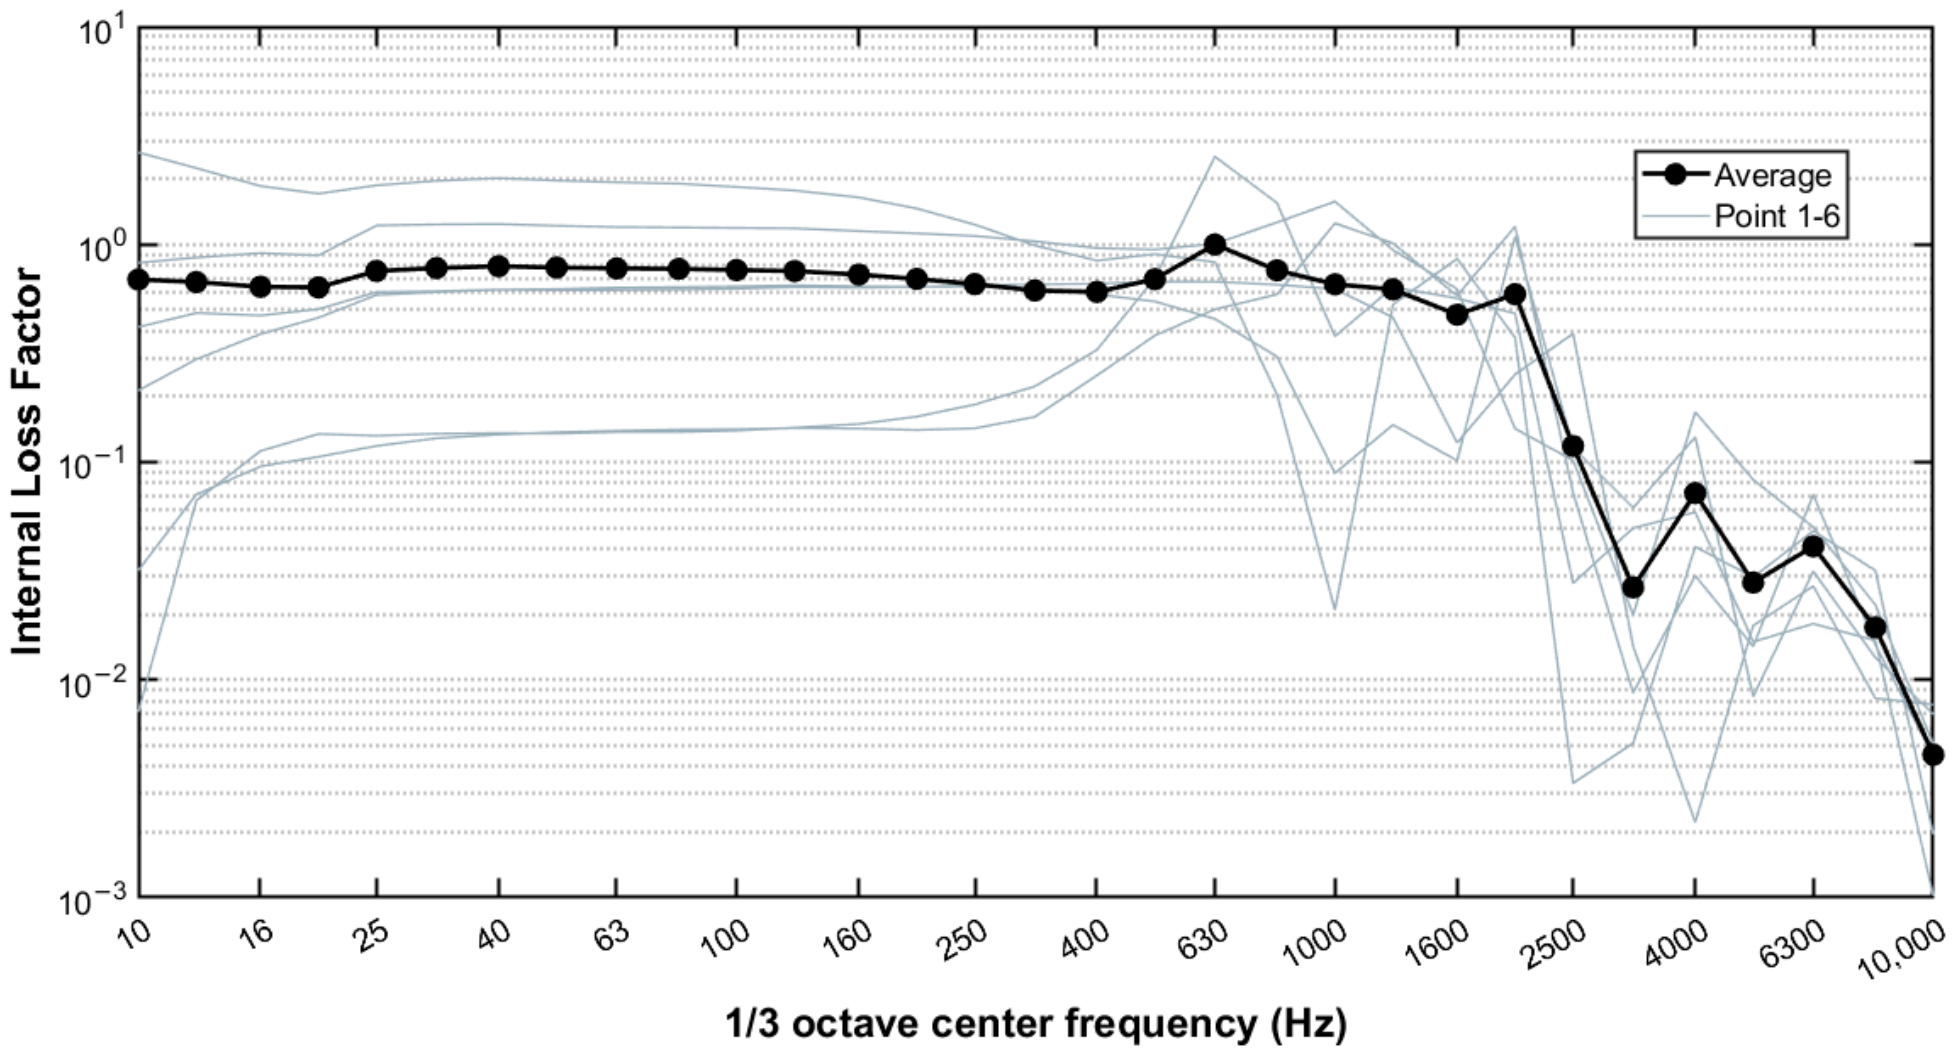
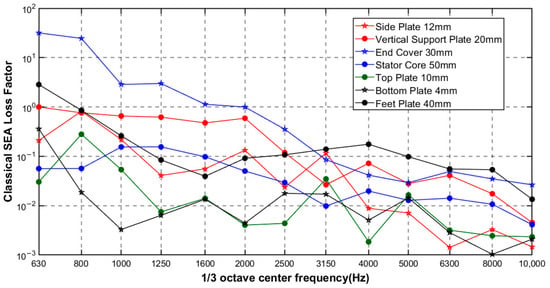
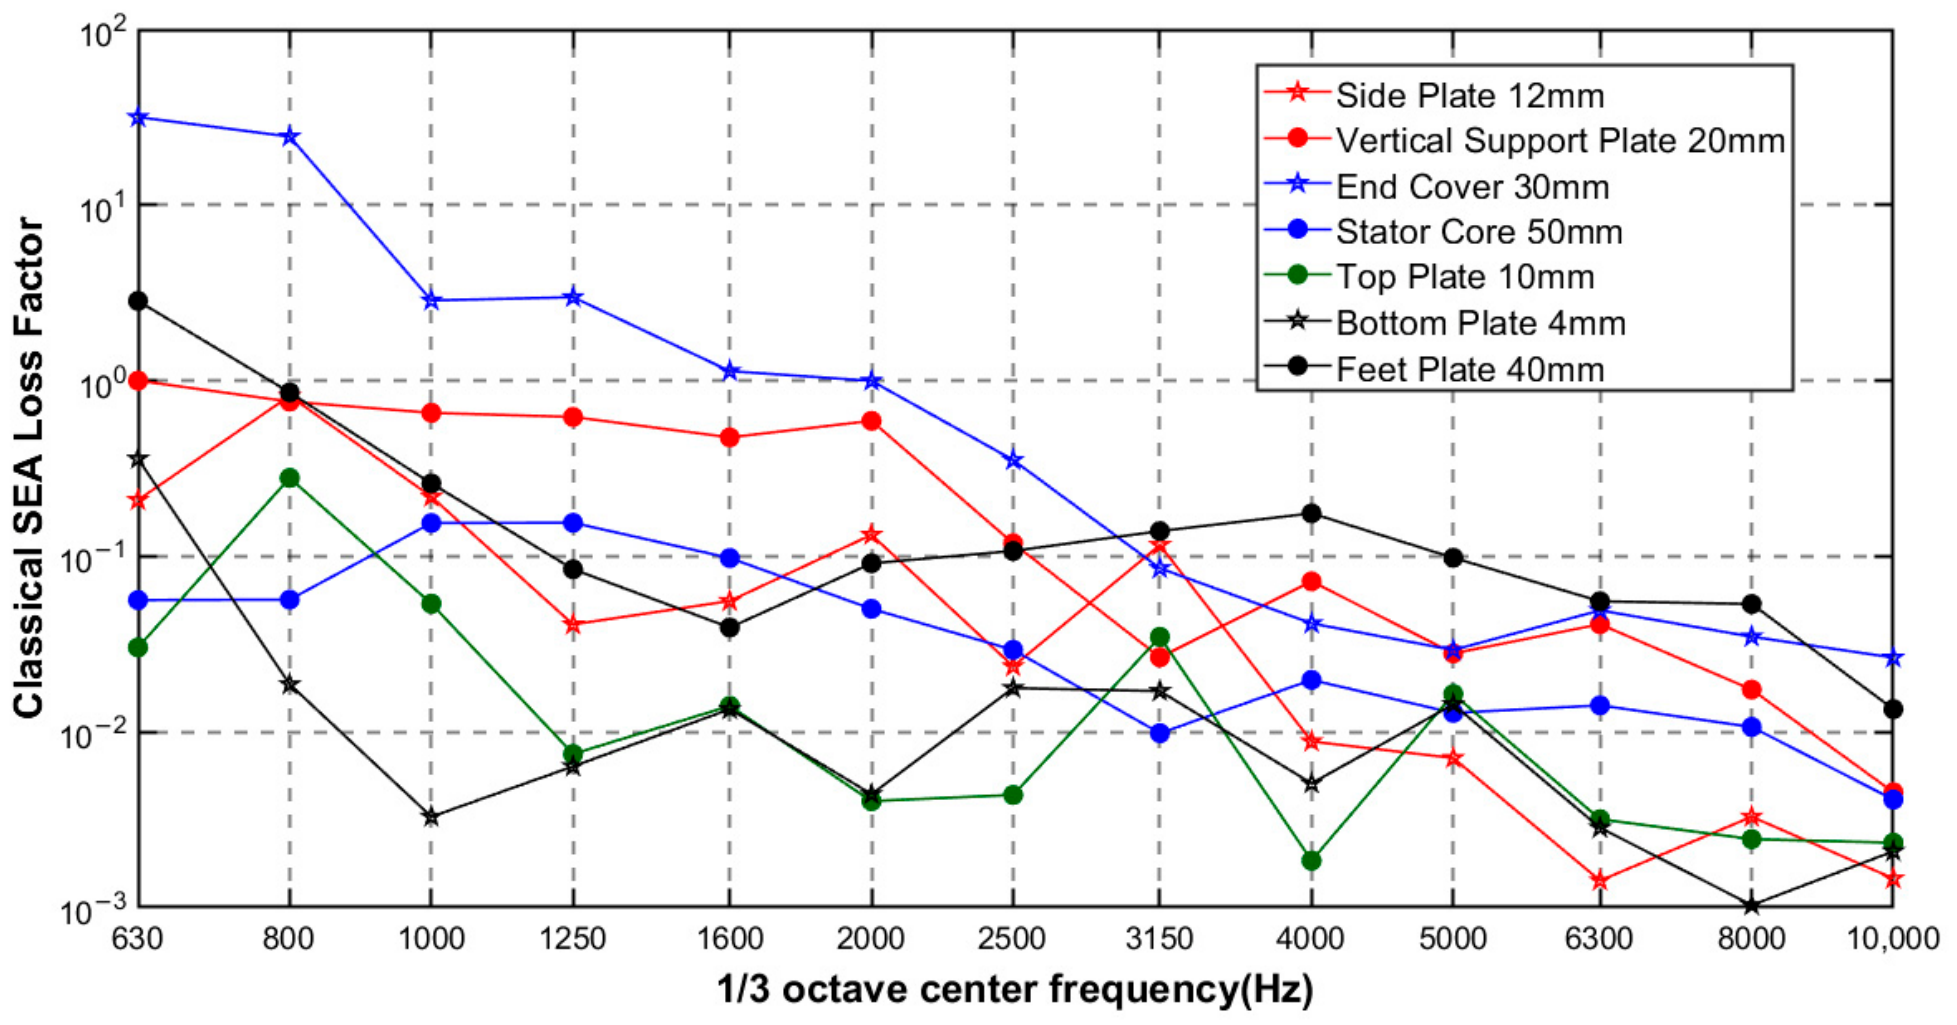
The internal loss factor, as a key parameter describing energy dissipation within a subsystem, is typically approximated in simulation models by twice the material’s critical damping ratio. To more accurately predict the vibration energy level ratio of the motor stator frame structure, this study adopts the steady-state energy flow method to experimentally measure the internal loss factor, which is then calculated according to Equations (3) and (4). Based on plate thickness, the following seven subsystems are selected as research objects, and the equivalent internal loss factors are computed, as shown in Figure 7.
Figure 7.
Internal loss factor measurement results.
It can be observed that, unlike the engineering typical internal loss factor of structural steel, which typically ranges from 0.0001 to 0.001, the internal loss factors of the various subsystems in the motor stator frame structure generally lie between 0.001 and 0.1 above 3150 Hz, and tend to decrease as the frequency increases. In the frequency range from 630 to 3150 Hz, the internal loss factors of some subsystems exceed 1. This may be attributed to the relatively low modal density in the mid-frequency range, where the applicability and accuracy of the SEA model are limited, resulting in a larger error in the estimated loss factors.
These unusually large values should not be interpreted as the actual internal damping characteristics of the subsystems, but rather reflect the limitations of the loss factor estimation in these frequency bands. The internal loss factors exceeding unity were retained in the original model to maintain consistency with the experimental parameter identification procedure, since arbitrary replacement would introduce unjustified assumptions. Nevertheless, a sensitivity analysis was conducted by replacing these anomalously large values with 0.01 and 0.1, respectively, while keeping all other model parameters unchanged. As shown in Table 1, the results demonstrate that overestimated internal loss factors can lead to an underestimation of the predicted vibration energy level ratios, thereby quantifying the sensitivity of the predicted responses to the internal loss factors and providing further insight into the reliability and limitations of the numerical predictions.
Table 1.
Sensitivity of the predicted vibration energy level ratios to anomalously large internal loss factors.
4.2. Comparison of Vibration Energy Level Ratio Between Simulation and Experiment
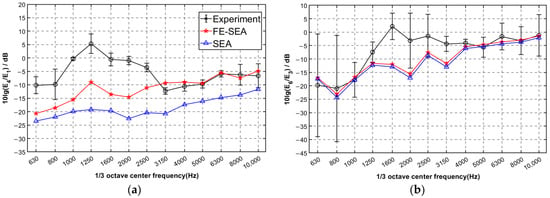
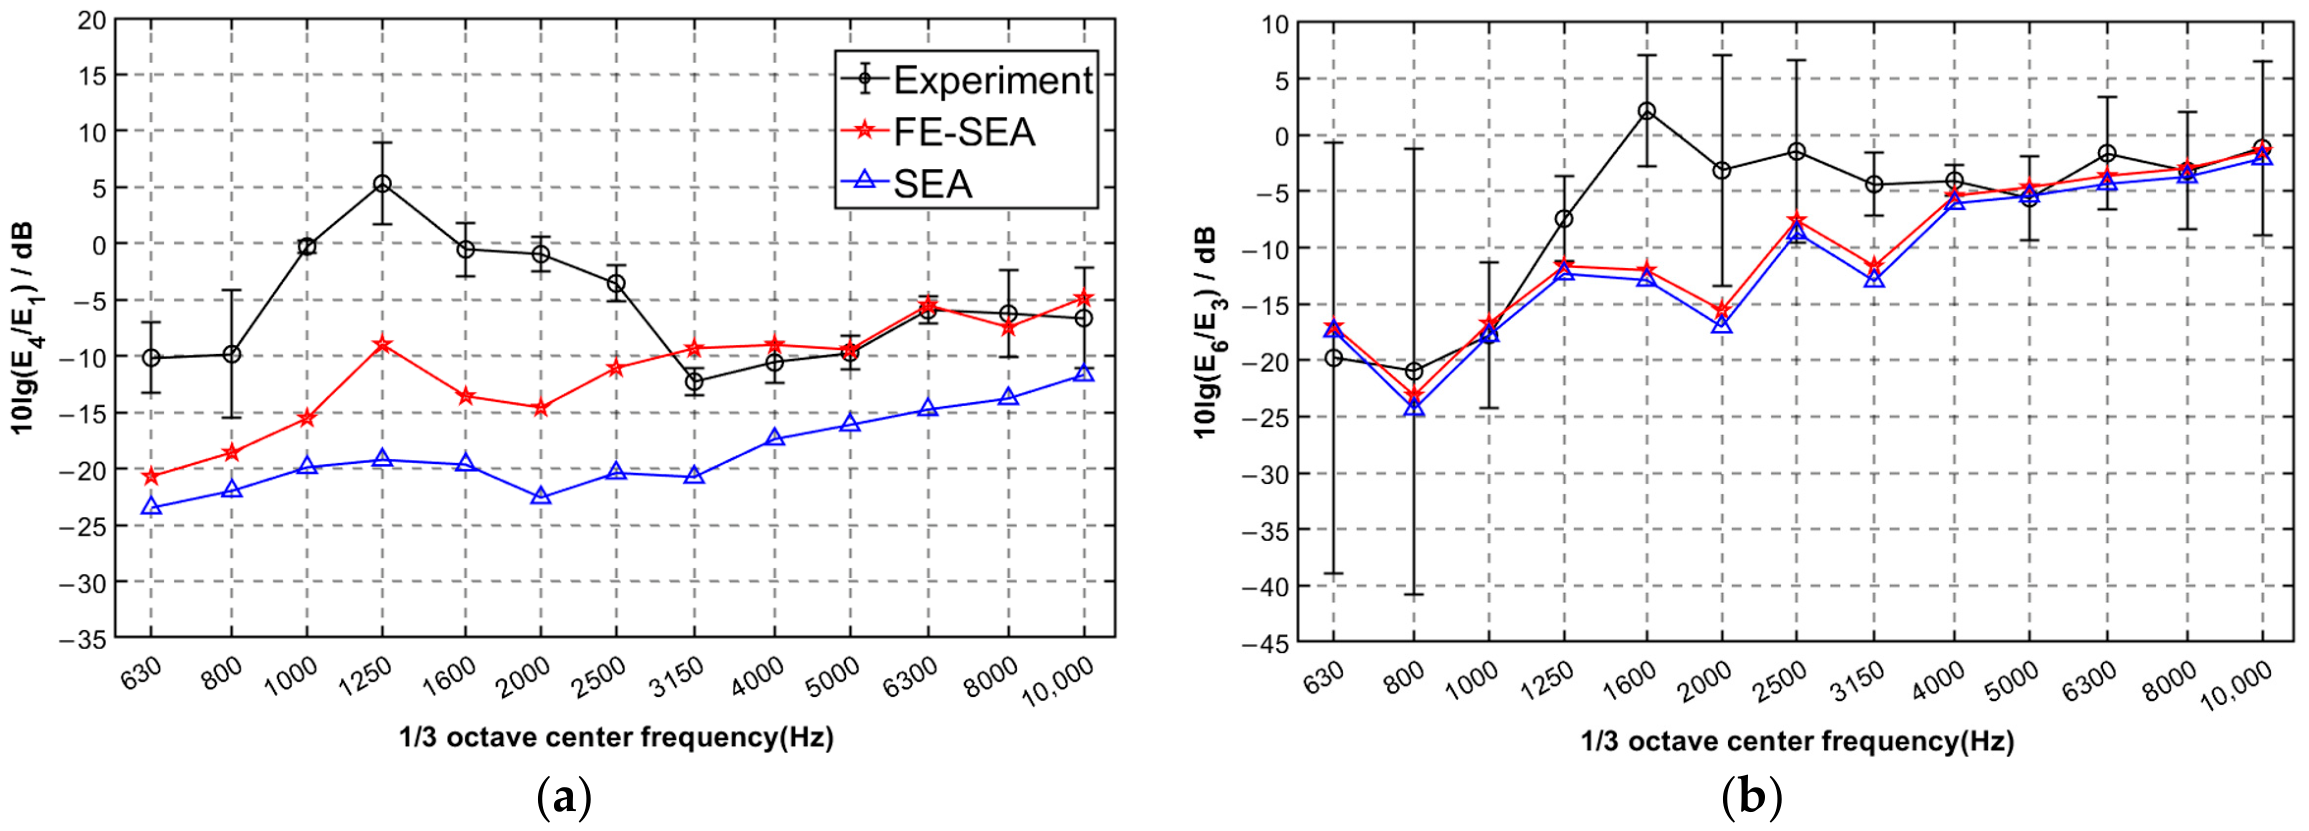
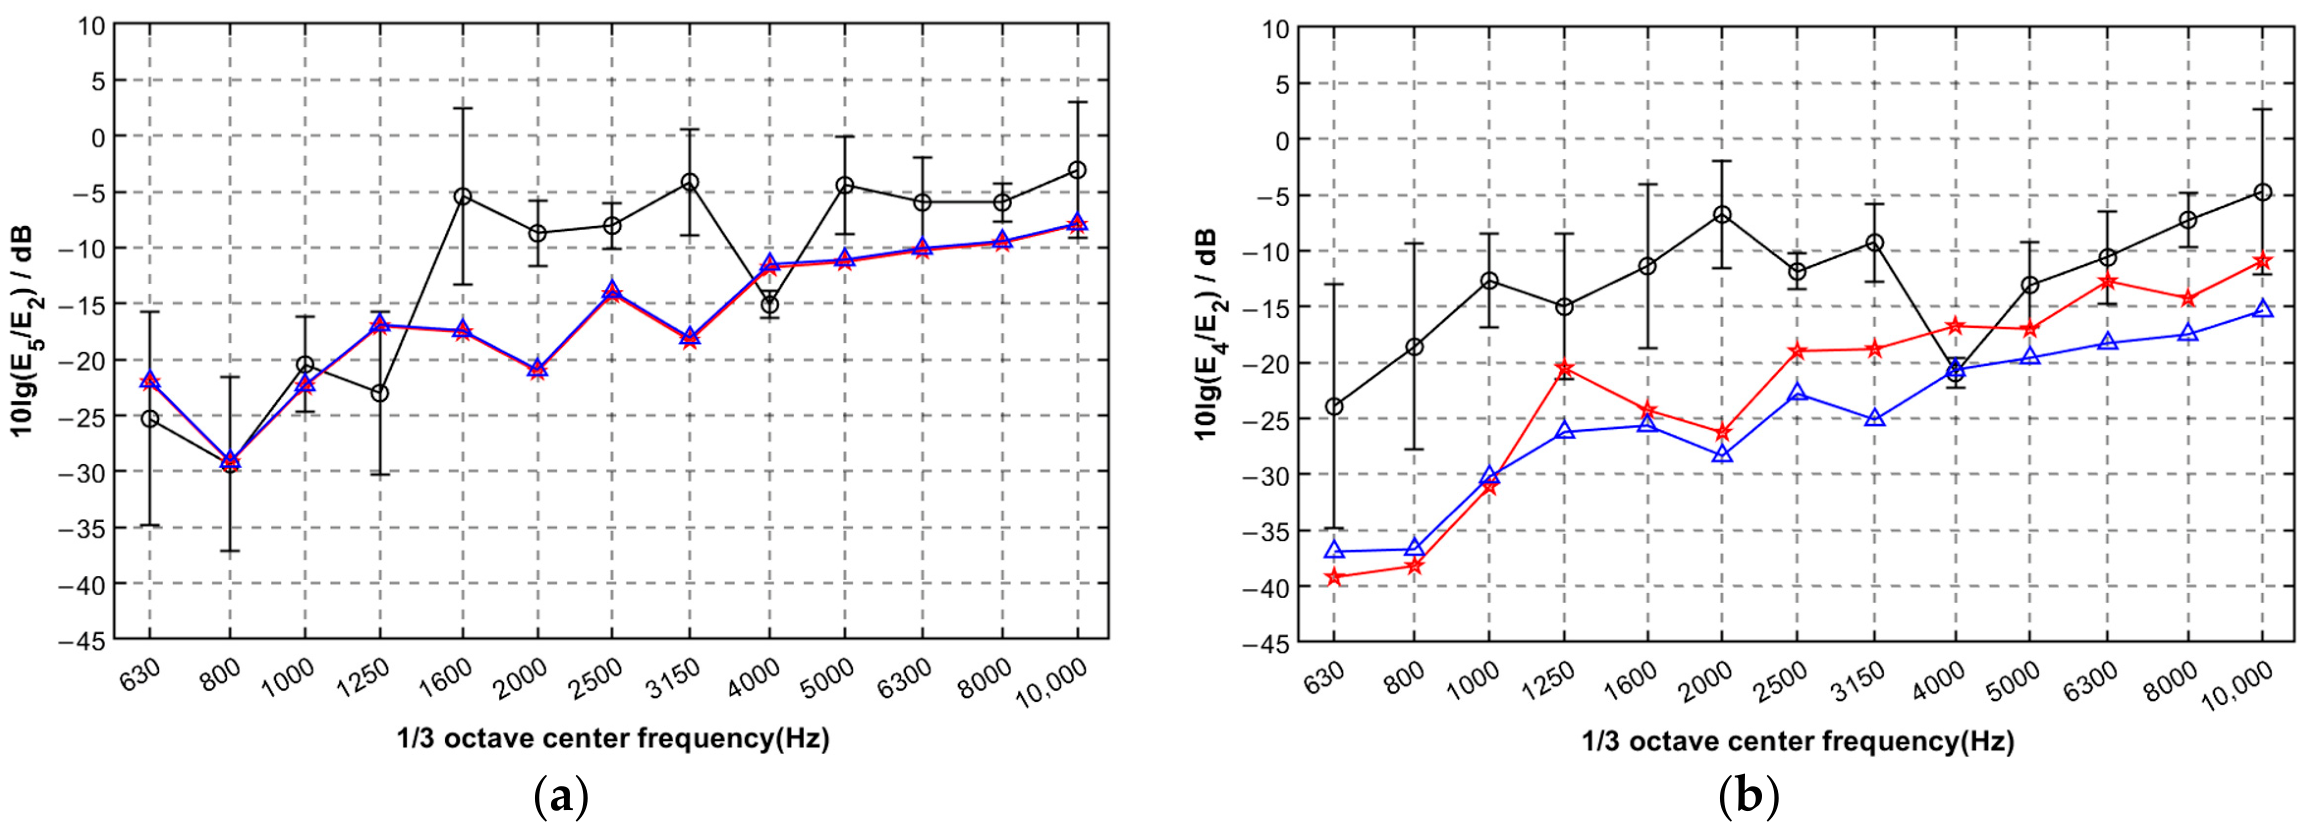
This study selects subsystems 1, 2, 3, 4, 5, and 6 as the objects of interest for vibration prediction research. The experimental setup is identical to that in Section 2.2. An impact hammer is used to sequentially strike each measurement point on every subsystem. The vibration accelerations at measurement points other than the excitation point on the source subsystem are measured using acceleration sensors. The acceleration signals are integrated in real time to obtain velocity signals, and the average vibration energy of the source subsystem is then calculated as E = <MV2>. The spatiotemporally averaged vibration energies of the other subsystems can be obtained in the same way. The ratio of the vibration energy of each subsystem to that of the source subsystem is the vibration energy level ratio. For each subsystem, 2–4 measurement points were randomly selected according to its physical dimensions. After each measurement round, the accelerometers were removed and repositioned to obtain additional measurements at different locations. This procedure was repeated until more than 10 measurement values were collected for each subsystem. The 95% confidence intervals of the mean vibration responses were calculated using a t-distribution based on the collected measurements. The vibration energy level ratios under excitation from different source subsystems are presented, with experimental results shown as mean values with 95% confidence intervals. The experimentally measured average internal loss factors are imported into VA One software, and the energy level ratios predicted by the SEA model and the FE-SEA hybrid model are simulated separately. In Figure 8 and Figure 9, 10lg(Ei/Ej) represents the logarithmic energy level ratio between receiving subsystem i and source subsystem j when subsystem j is excited.
Figure 8.
Energy level ratios: (a) subsystems 4 and 1. (b) subsystems 6 and 3.
Figure 9.
Energy level ratios: (a) subsystems 5 and 2. (b) subsystems 4 and 2.
When the modal density is low, the number of modes contributing to the response within the frequency band is insufficient, resulting in localized and non-uniform energy distributions. Under such conditions, the fundamental statistical assumptions of SEA are no longer valid, leading to increased prediction errors. Based on the modal analysis results, subsystem 4 is modeled using both the SEA and FE methods. According to the energy transmission paths, longitudinal transmission typically involves line connections, while transmission with direction changes involves point connections and wave conversion. The paths from subsystem 1 to subsystem 4 and from subsystem 3 to subsystem 6 are mostly longitudinal transmission with line connections, whereas the paths from subsystem 2 to subsystem 4 and from subsystem 2 to subsystem 5 are mostly point connections with significant wave conversion. Therefore, four representative sets of results are selected to illustrate the prediction accuracy of the two simulation methods.
Figure 8a compares the vibration energy ratio of subsystem 4 to subsystem 1 obtained by SEA simulation, FE-SEA simulation and experimental measurement when subsystem 1 is excited. In the frequency range of 630–3150 Hz, due to the low modal density of the subsystems, the applicability of statistical energy analysis is limited. The energy level ratios predicted by both the full SEA model and the FE-SEA hybrid model deviate considerably from the experimental results. In the mid-frequency range, the SEA-predicted energy ratio is 17 dB lower than the experimental result, and the FE-SEA counterpart is 11 dB lower. Above 3150 Hz, the errors between the predicted energy level ratios and the experimental results decrease for both models. The average difference between the SEA and FE-SEA predictions over this frequency range is 7.5 dB, with the FE-SEA model showing better agreement with the experimental results. Specifically, the average prediction error of the FE-SEA model relative to the experimental results is 1.1 dB, compared with 6.9 dB for the SEA model. Moreover, the FE-SEA predictions mostly fall within the 95% confidence interval (average interval width: 4.7 dB) of the experimental energy level ratio, indicating better agreement with the measurements. In contrast, the SEA model exhibits larger prediction errors, partly because continuous modes in subsystem 4 do not appear until 8000 Hz, resulting in a low modal density that makes the SEA flat plate subsystem modeling less accurate. Overall, the 95% confidence intervals of the experimentally measured vibration energy level ratios tend to be narrower in the higher-frequency range, indicating lower measurement variability.
Figure 8b presents the vibration response of subsystem 6 when subsystem 3 is excited. Since all subsystems along the energy transmission path from subsystem 3 to subsystem 6 are modeled as SEA subsystems in both simulation approaches, the influence of FE subsystems is minimal, and the two simulation curves from the SEA and FE-SEA models nearly coincide. The average difference between the SEA and FE-SEA predictions is only 0.2 dB. Above 3150 Hz, the average error between the FE-SEA model predictions and the experimental results is 1 dB, while that of the SEA model is 1.3 dB; the simulated results fall within the 95% confidence interval (average interval width: 8.5 dB) of the experimental energy level ratio. Both models show good agreement with the experiments, indicating that the division of subsystems into FE and SEA in the hybrid FE-SEA modeling is reasonable.
Figure 9a,b show the vibration responses of subsystems 5 and 4, respectively, when subsystem 2 is excited. Because the connections from subsystem 2 to subsystems 4 and 5 are mostly point connections with significant wave conversion, the error in the energy level ratio between simulations and experiments increases by approximately 3.6 dB. In Figure 9a, all subsystems along the vibration transmission path are modeled as SEA subsystems in both simulation approaches, so the influence of FE subsystems is minimal, and the two simulation curves from the SEA and FE-SEA models nearly coincide. The average difference between the SEA and FE-SEA predictions is only 0.9 dB. Above 3150 Hz, the average error between the FE-SEA model predictions and the experimental results is 4.5 dB, while that of the SEA model is 4.6 dB; the simulated results fall within the 95% confidence interval (average interval width: 7.4 dB) of the experimental energy level ratio. In Figure 9b, subsystem 4 is modeled using both SEA and FE-SEA approaches. Above 3150 Hz, the average difference between the SEA and FE-SEA predictions over this frequency range is 4 dB, with the FE-SEA model showing better agreement with the experimental results. The average error between the FE-SEA model predictions and the experimental results is 4.6 dB; the simulated result falls largely within the 95% confidence interval (average interval width: 7.5 dB) of the experimental energy level ratio, whereas the full SEA model shows a larger average error of 7.1 dB.
The primary source of discrepancy between simulation and experiment is the applicability of classical statistical energy analysis theory. For instance, the presence of strong coupling and indirect coupling in the model exceeds the fundamental assumptions of classical SEA theory. Meanwhile, the internal loss factors determined through experiments based on the classical SEA framework also introduce corresponding errors. Secondary error sources include model simplification. Nevertheless, the model is constructed largely according to the real-world structure, so errors induced by simplification are small. Measurement errors are relatively controllable and produce limited influence.
The vibration prediction error of the full SEA model is relatively large for the mounting feet, with an average value of 7 dB. This is because continuous modes only appear in the mounting feet above 8000 Hz, resulting in a low modal density within the frequency range of interest and making the SEA theory inapplicable. Moreover, mounting holes on the mounting feet increase the local structural stiffness. The actual coupling between the plates is strong coupling rather than the weak coupling assumed in the classical statistical energy analysis method. The dispersion of material parameters, such as density and Young’s modulus, also affects the accuracy of the model. In contrast, the FE-SEA hybrid method uses finite element to model the mounting feet with insufficient modes, which significantly improves the prediction accuracy and reduces the average error to 2.9 dB. This indicates that the FE-SEA hybrid modeling approach is well suited for vibration prediction of the large box-type motor stator frame.
4.3. Vibration Contribution Analysis of the Motor Mounting Feet
The mounting feet serve as the gateway for vibration transmission from the motor to the outside. The vibration level of the mounting feet not only reflects the condition of the motor itself but also helps evaluate its impact on surrounding equipment. Therefore, the dominant transmission paths that affect the vibration of the mounting feet are of primary interest.
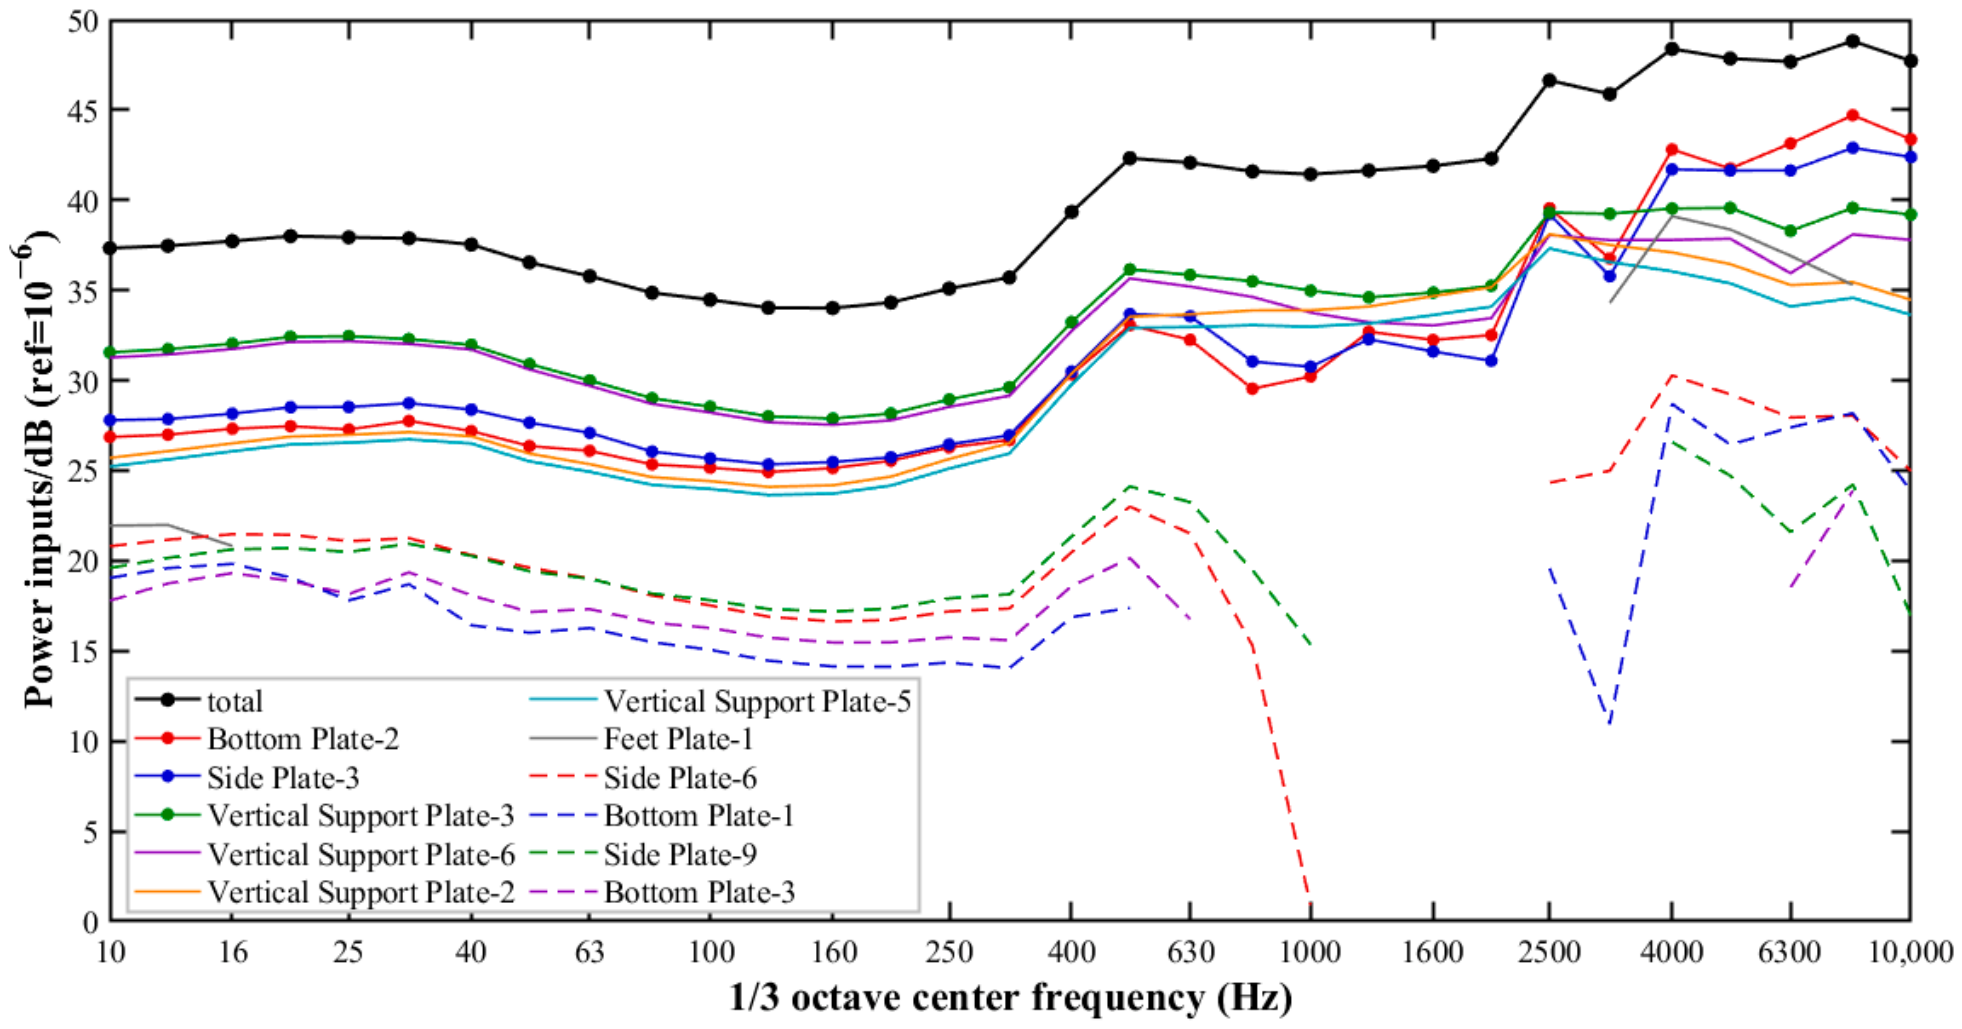
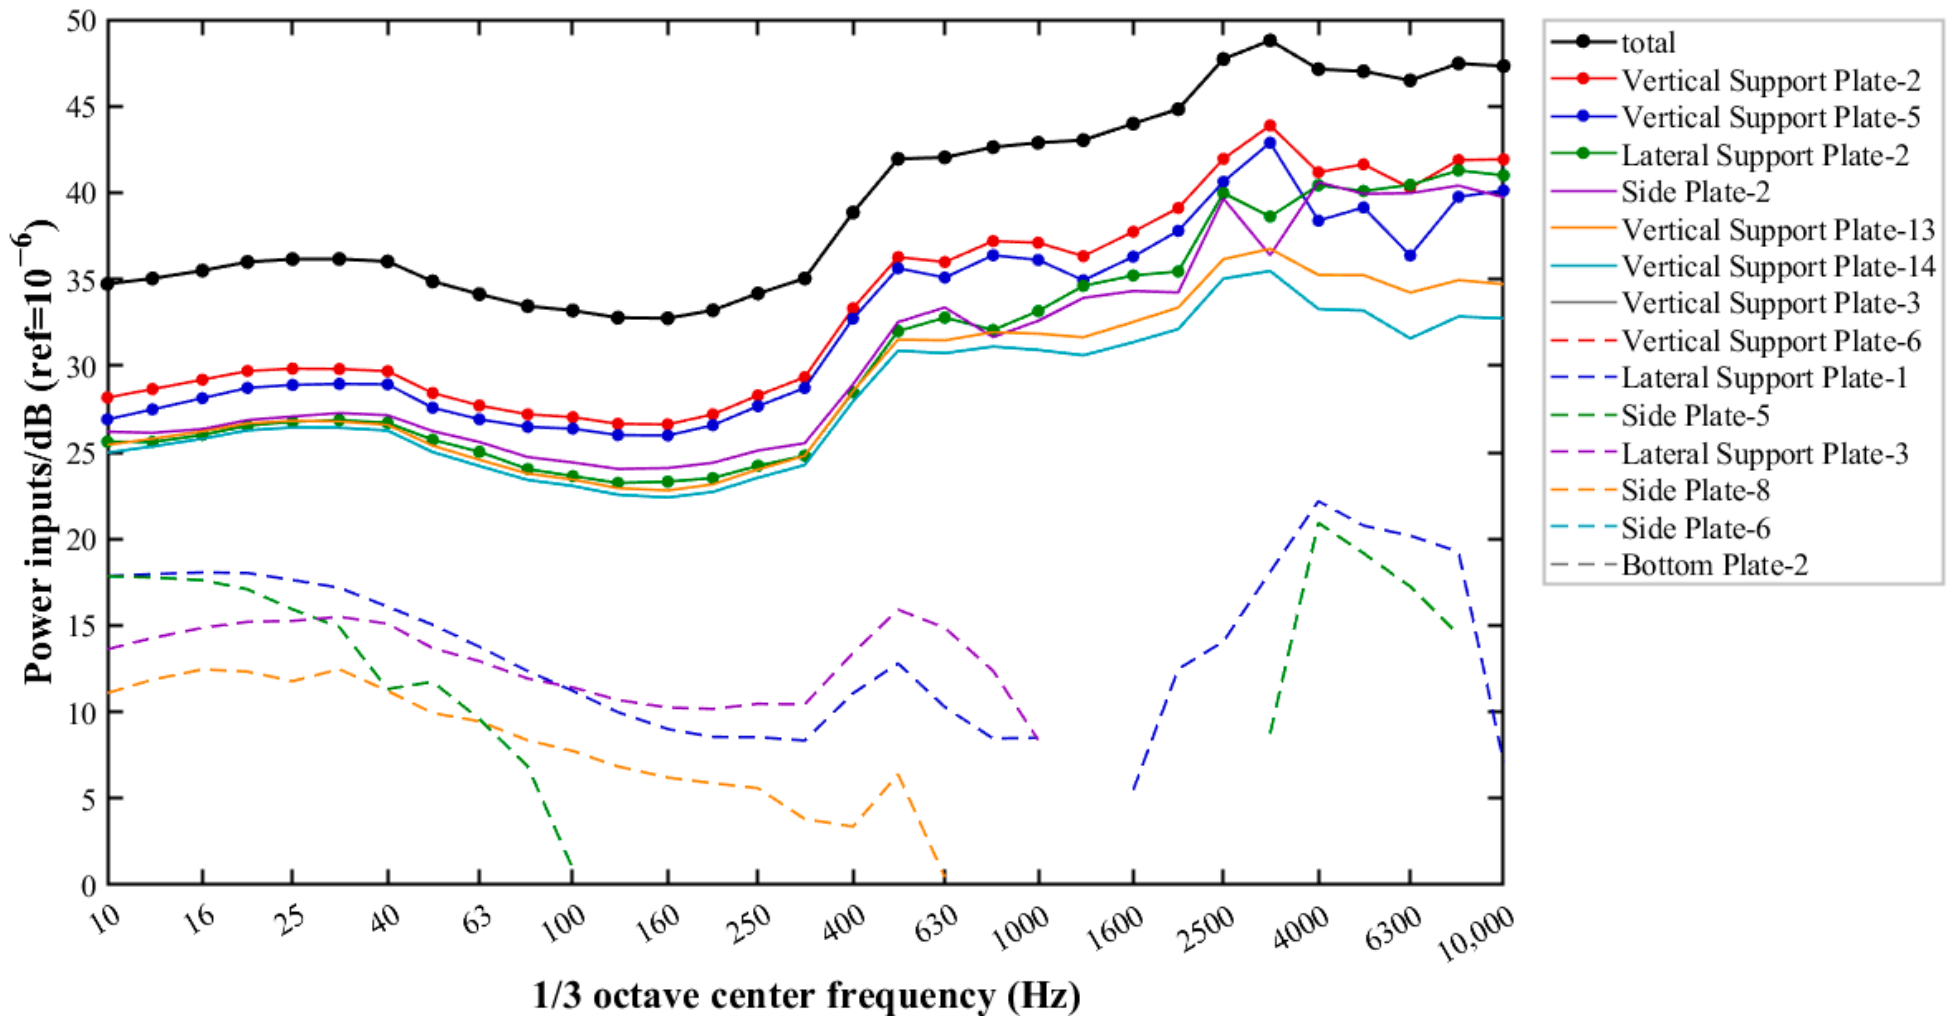
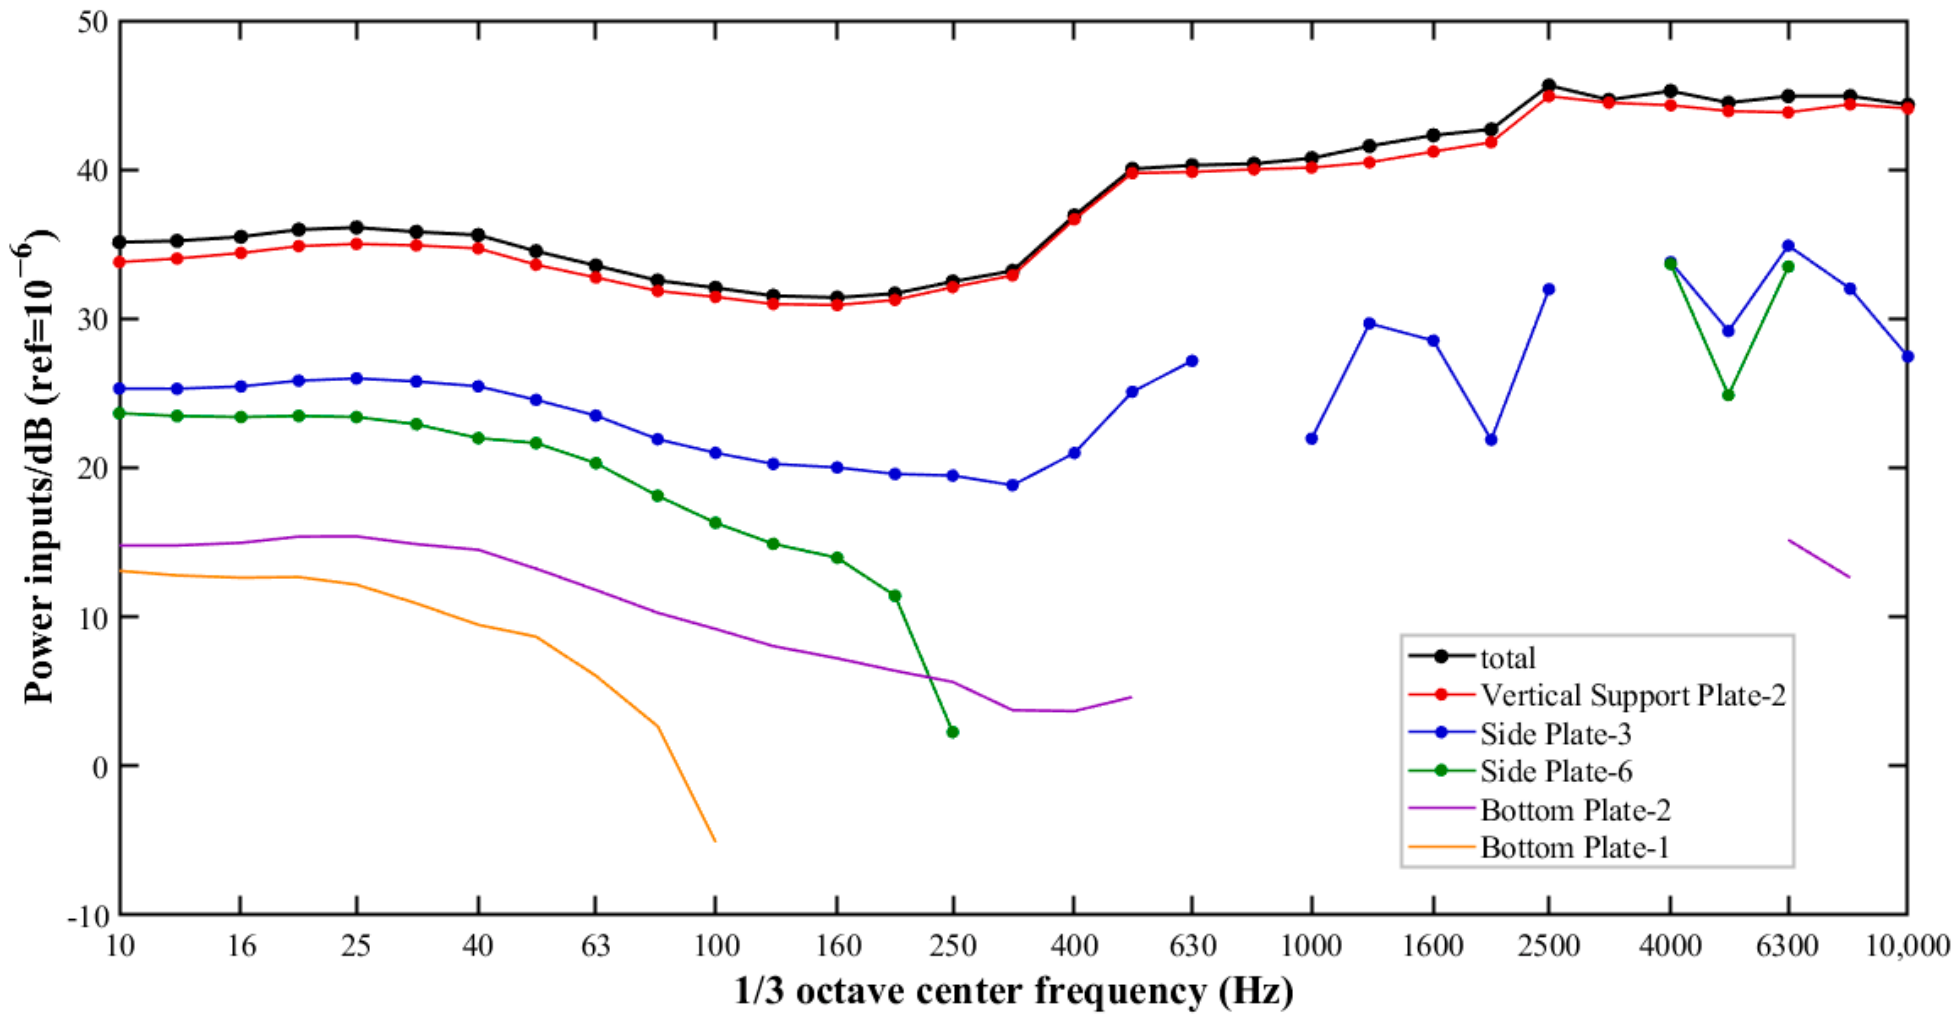
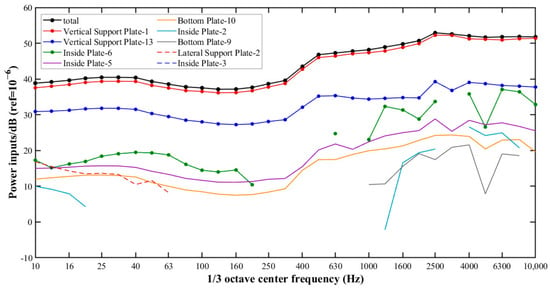
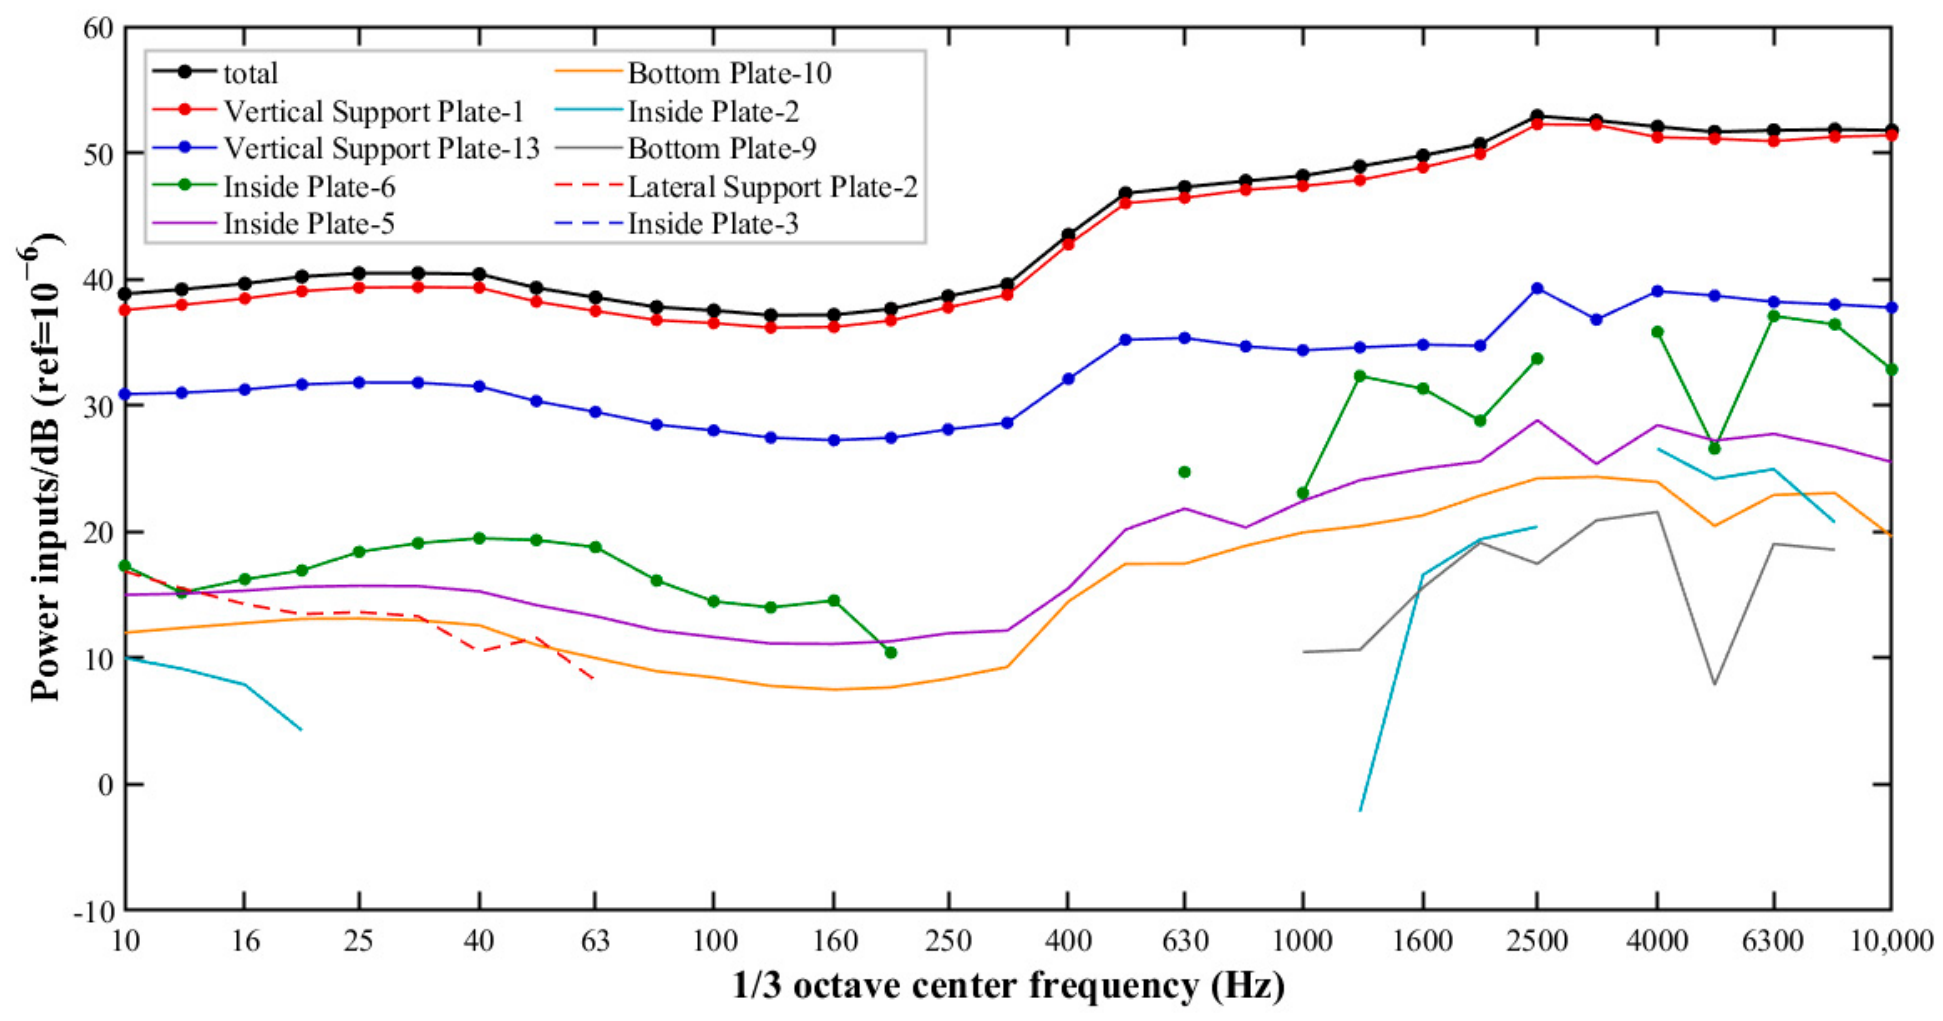
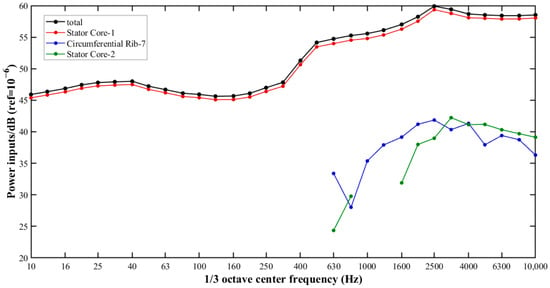
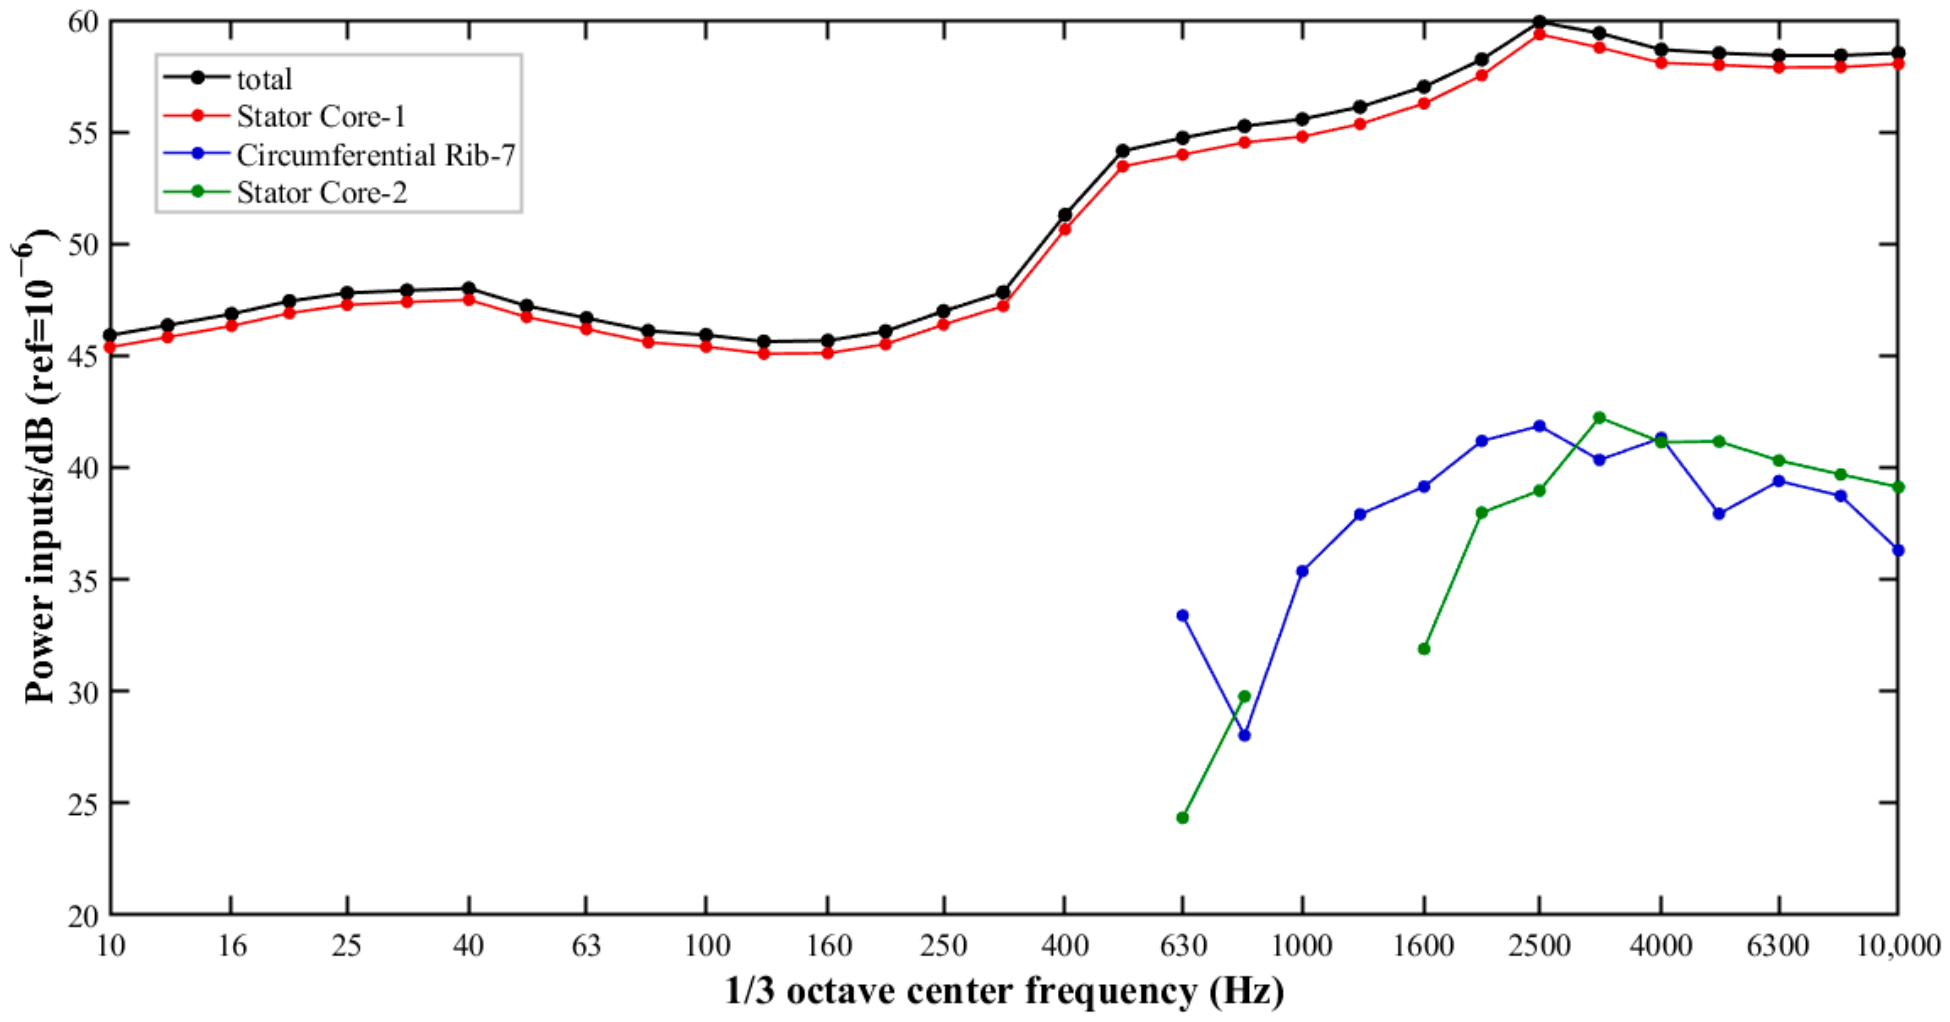
Electromagnetic vibration is dominated by radial force components. Therefore, a point force is applied to the Stator Core-1 subsystem to replace the electromagnetic excitation forces. Although actual electromagnetic forces in large motors are spatially distributed and contain multiple harmonic components, this simplification allows the relative input power contributions between structural subsystems to be examined without explicitly modeling the detailed electromagnetic force distribution. In addition, decoupling from the actual electromagnetic forces further supports iterative motor optimization during the design stage. The present work focuses on the structural energy transmission characteristics under this simplified excitation condition. A more detailed representation of realistic electromagnetic forces can be incorporated in future studies to further evaluate the path identification under complex operating conditions. Figure 10, Figure 11, Figure 12, Figure 13 and Figure 14 present a layer-by-layer quantitative analysis of the vibration contribution from the Stator Core-1 subsystem to the Feet Plate-2 subsystem. Some frequency segments in certain curves appear as discontinuities. This occurs because the modal energy of the target subsystem is higher than that of the input subsystem in those frequency bands, causing energy to flow in the reverse direction from the target subsystem to the input subsystem. In other words, the input subsystem does not supply power to the target subsystem. To avoid misleading interpretations, these are presented as natural breaks in the figure.
Figure 10.
Power inputs to Feet Plate-2.
Figure 11.
Power inputs to Side Plate-3.
Figure 12.
Power inputs to Vertical Support Plate-3.
Figure 13.
Power inputs to Vertical Support Plate-2.
Figure 14.
Power inputs to Vertical Support Plate-1.
Figure 10 shows the power input to the Feet Plate-2 subsystem. At 10 kHz, 37% of the energy of the Feet Plate-2 subsystem comes from the Bottom Plate-2 subsystem, 30% from the Side Plate-3 subsystem, 14% from the Vertical Support Plate-3 subsystem, 10% from the Vertical Support Plate-6 subsystem, 5% from the Vertical Support Plate-2 subsystem, and 4% from the Vertical Support Plate-5 subsystem. The vibration of the Feet Plate-2 subsystem primarily originates from the Bottom Plate-2, Side Plate-3, Vertical Support Plate-3, and Vertical Support Plate-2 subsystems. (Vertical Support Plate-6 and Vertical Support Plate-5 are two subsystems on another plate supporting the stator core, symmetric to Vertical Support Plate-3 and Vertical Support Plate-2, respectively. Their contributions to the Feet Plate-2 are relatively smaller and are not considered further.)
Figure 11 and Figure 12 show the power input to the Side Plate-3 and Vertical Support Plate-3 subsystems, respectively. At 10 kHz, 29% of the energy of the Side Plate-3 subsystem comes from the Vertical Support Plate-2 subsystem, and 20% from the Vertical Support Plate-5 subsystem. For the Vertical Support Plate-3 subsystem, 94% of its energy comes from the Vertical Support Plate-2 subsystem. Thus, the Vertical Support Plate-2 subsystem is the dominant energy source for both the Vertical Support Plate-3 subsystem and, as the largest contributor, the Side Plate-3 subsystem. Moreover, the Vertical Support Plate-2 subsystem also makes a non-negligible contribution (30%) along the transmission path through the Bottom Plate-2 subsystem. Consequently, the Vertical Support Plate-2 subsystem has the greatest influence on the vibration of the Feet Plate-2 subsystem.
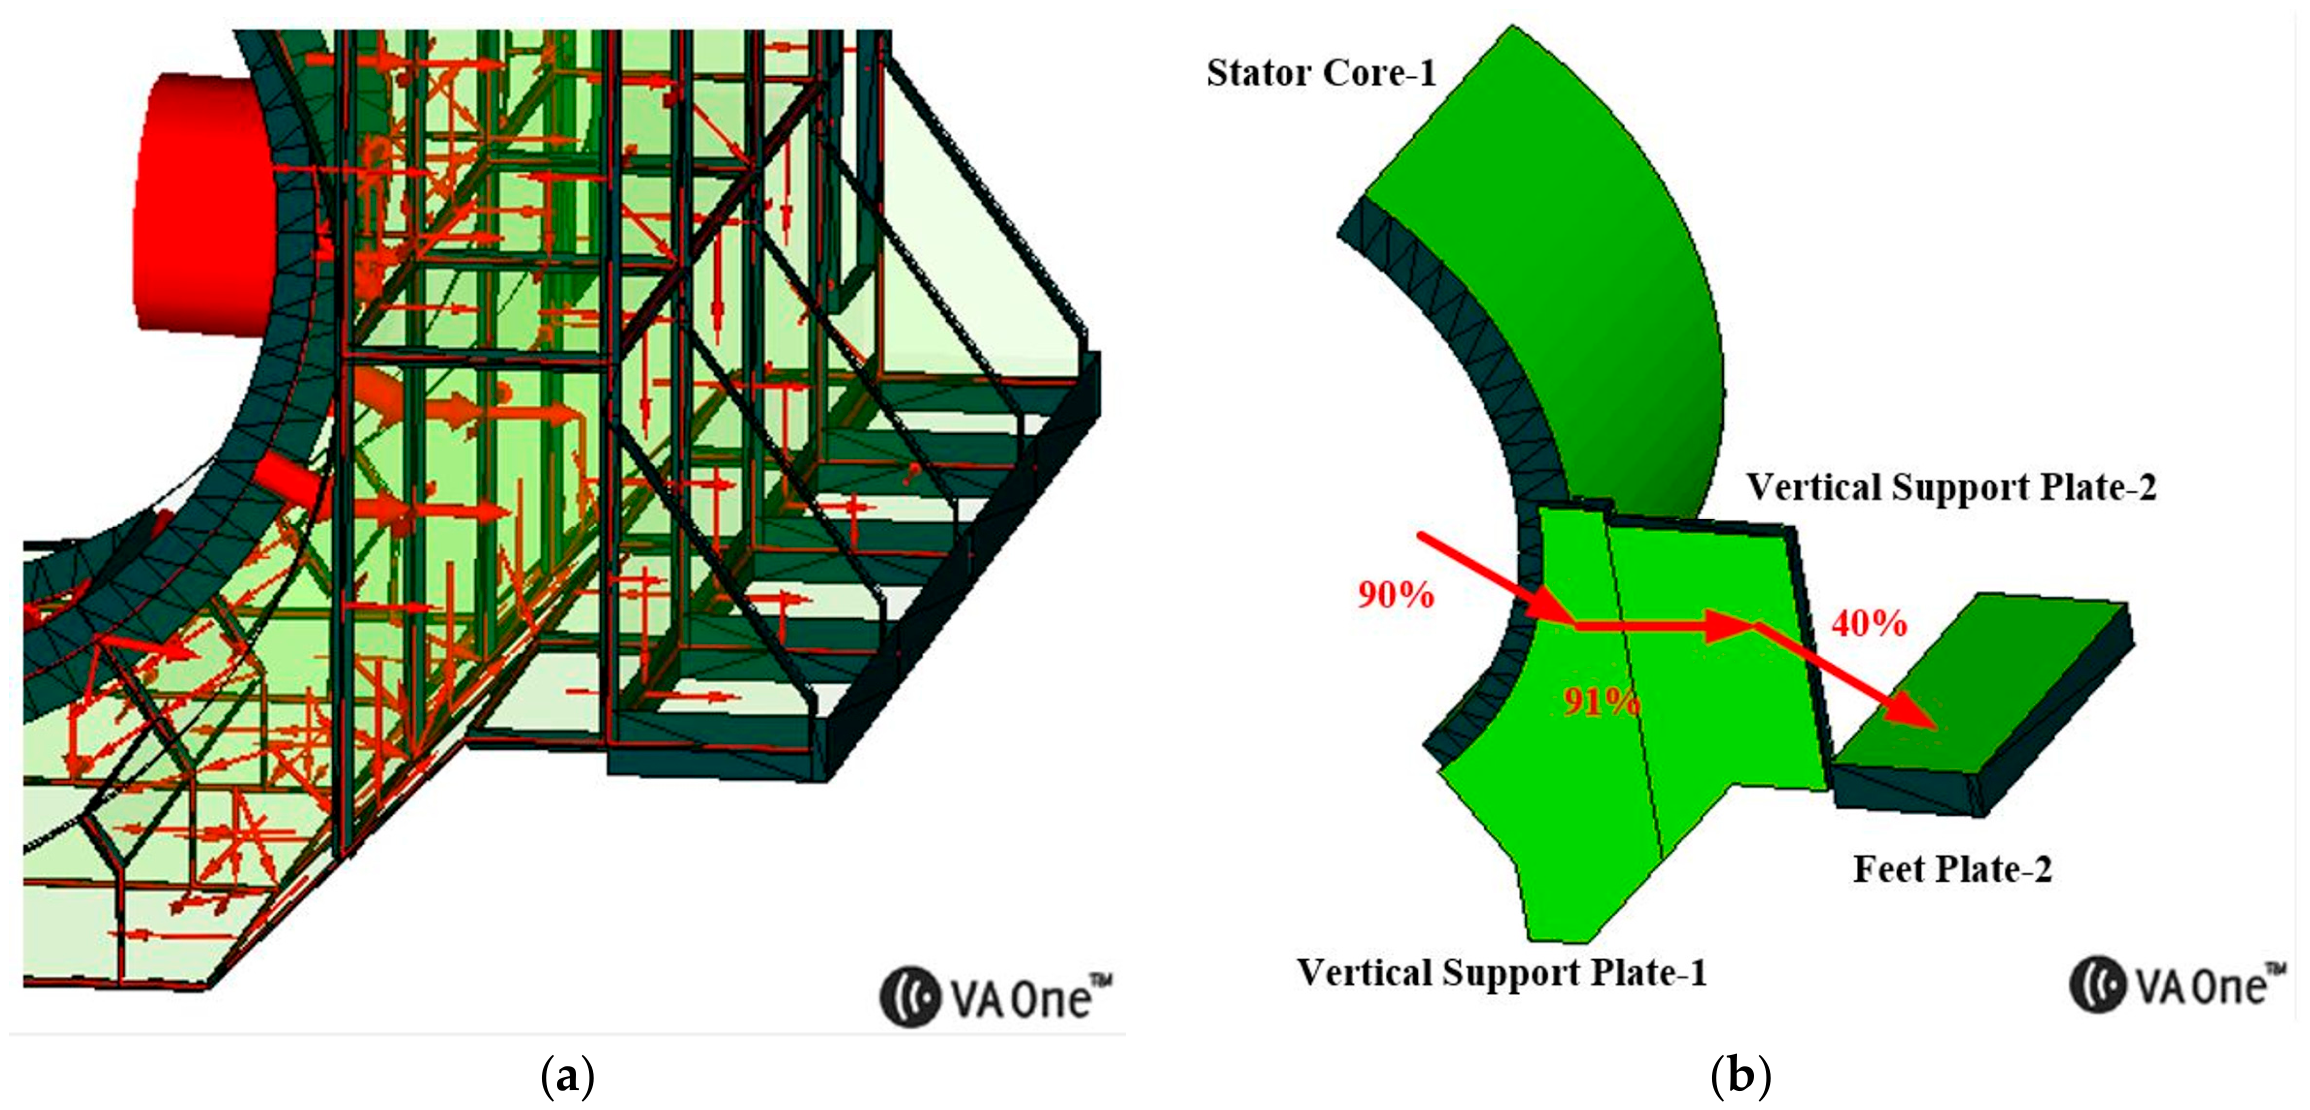
Figure 13 shows the power input to the Vertical Support Plate-2 subsystem. At 10 kHz, 91% of the energy of the Vertical Support Plate-2 subsystem comes from the Vertical Support Plate-1 subsystem. This indicates that the vibration of the Vertical Support Plate-2 subsystem primarily originates from the Vertical Support Plate-1 subsystem.
Figure 14 shows the power input to the Vertical Support Plate-1 subsystem. At 10 kHz, 90% of the energy of the Vertical Support Plate-1 subsystem comes from the Stator Core-1 subsystem. This indicates that the vibration of the Vertical Support Plate-1 subsystem primarily originates from the Stator Core-1 subsystem.
Therefore, at 10 kHz, the dominant vibration transmission path from the Stator Core-1 subsystem to the Feet Plate-2 subsystem in the large box-type motor stator frame structure is Stator Core-1—Vertical Support Plate-1—Vertical Support Plate-2—Feet Plate-2.
Furthermore, the additional power contribution analysis at 1600 Hz demonstrates that the dominant vibration transmission path is consistent with that identified at 10 kHz, confirming the robustness of the path identification over the investigated frequency range. At 1600 Hz, the input power of Feet Plate-2 is primarily contributed by Vertical Support Plate-3 (19.84%), Vertical Support Plate-2 (18.95%), Vertical Support Plate-5 (14.89%), and Vertical Support Plate-6 (13.04%). Given the geometric symmetry of Vertical Support Plates 3 and 6, as well as Vertical Support Plates 2 and 5, with respect to Stator Core-1 and Feet Plate-2, and the relatively higher contributions of Vertical Support Plate-3 and Vertical Support Plate-2, the subsequent analysis focuses on the former branch. Specifically, the dominant contribution to Vertical Support Plate-3 originates from Vertical Support Plate-2 (77.78%). In turn, Vertical Support Plate-1 contributes 80.38% of the input power of Vertical Support Plate-2, and Stator Core-1 contributes 84.22% of that of Vertical Support Plate-1. Although the contribution percentages along individual links differ from those obtained at 10 kHz, the dominant vibration transmission path remains unchanged: Stator Core-1—Vertical Support Plate-1—Vertical Support Plate-2—Feet Plate-2.
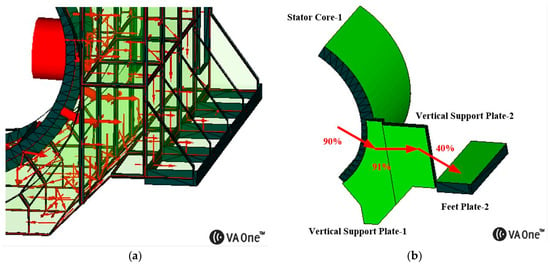
Figure 15 illustrates the energy flow and the dominant vibration transmission path from the Stator Core-1 to the Feet Plate-2. To provide a partial experimental assessment of the identified dominant vibration transmission path, the input power contribution from Vertical Support Plate-3 to Feet Plate-2 was estimated using experimentally measured vibration energies and a model-derived coupling loss factor, and subsequently compared with the numerical simulation result. Under steady-state conditions, the input power is equal to the dissipated power. The input power contribution ratio of subsystem j to subsystem k can be calculated by . At 10 kHz, the measured vibration energies of Vertical Support Plate-3 (E8) and Feet Plate-2 (E4) are 5 × 10⁻⁹ J and 1.9 × 10⁻⁸ J, respectively. The measured internal loss factor of Feet Plate-2 (η4) is 0.011. The coupling loss factor from Vertical Support Plate-3 to Feet Plate-2, η84, is obtained from VA One and equals 0.0045. Based on these parameters, the measurement-informed input power contribution ratio was approximately 11%, compared with 14% obtained from the numerical simulation (see Figure 10), corresponding to a difference of approximately 1.1 dB. Although this comparison is not fully independent because the coupling loss factor is obtained from the VA One model, and complete experimental verification of the entire transmission path remains challenging as some intermediate structural components are inaccessible for vibration measurements, the agreement provides supplementary experimental support for the predicted power contribution of this local transmission link.
Figure 15.
(a) Energy flow in the motor stator frame structure at 10 kHz (smaller and fewer red arrows indicate less vibrational energy). (b) Dominant vibration transmission path (percentages represent power contributions).
The dominant vibration transmission paths are identified by tracing the input power contributions backward from the target subsystem to the vibration source. At each level, the contributing subsystems are ranked according to their input power contribution ratios, and the subsystems with relatively large contributions are retained for further analysis. When multiple significant transmission branches are identified, each branch is traced backward independently. If these branches converge at a common upstream subsystem, their cumulative contribution is calculated by summing the products of the corresponding input power contribution ratios along the parallel branches, as expressed in Equation (6).
where:
- Cj→k: cumulative input power contribution ratio of the upstream subsystem j to the target subsystem k through the considered parallel path.
- Ci→k: input power contribution ratio of the intermediate subsystem i to the target subsystem k.
- Rj→i: input power contribution ratio of subsystem j to the intermediate subsystem i.
- m: number of parallel branches converging to the same upstream subsystem.
Following this procedure, the input power contribution from Vertical Support Plate-2 to Feet Plate-2 is 40%. Given that the input contributions of the preceding two links reach 91% and 90%, the cumulative input power contribution of the identified dominant vibration transmission path to Feet Plate-2 is approximately 33%.
5. Conclusions
This paper presents a comparative study on the mid- to high-frequency vibration characteristics of a large box-type motor based on statistical energy analysis, through theoretical, simulation, and experimental approaches. Although the experimental SEA method is based on the classical SEA formulation, which inherently neglects the effects of indirect coupling and strong coupling, the resulting predictions remain within acceptable accuracy limits.
- (1)
- Compared with small motors, which are typically divided into four to five subsystems, the subsystem division in this study is more complex, involving a total of 234 subsystems. This leads to more accurate modeling and a smaller vibration prediction error. Compared with experimental results, when the frequency band of interest exhibits continuous modes, the FE-SEA hybrid modeling method achieves higher accuracy than the SEA model in vibration prediction for the large box-type motor stator frame. The average prediction error is 2.9 dB, showing good agreement with experiments.
- (2)
- The vibration prediction accuracy of the mounting feet using the SEA model is lower than that of the FE-SEA hybrid model, with an average error of 7 dB. This is partly due to the insufficient modal count of the mounting feet subsystem, which limits the applicability of statistical energy analysis.
- (3)
- Through the input-power-based layer-by-layer backtracking method, the dominant vibration transmission path from the stator core to the mounting feet is identified. Contribution analysis of the mounting feet vibration shows that this transmission is mainly carried by the vertical support plates. For the experimentally accessible link from Vertical Support Plate-3 to Feet Plate-2, the measurement-informed input power contribution ratio is approximately 11%, compared with 14% predicted by the numerical simulation, corresponding to a difference of approximately 1.1 dB. This agreement provides supplementary experimental support for the predicted local power contribution.
The simulation and experimental work in this paper extends the application of statistical energy analysis to vibration prediction of large box-type motors, and lays a foundation for accurate vibration prediction of high-speed motors. Based on a layer-by-layer quantitative comparison of vibration contribution, the dominant vibration transmission path from the stator core to the mounting feet is identified, and the contribution ratio of this path is quantitatively evaluated.
Author Contributions
Conceptualization, X.W. and K.C.; methodology, X.W. and K.C.; software, K.C.; validation, K.C.; formal analysis, K.C.; investigation, K.C., Y.H. and L.Y.; resources, X.W. and Y.G.; data curation, K.C.; writing—original draft preparation, K.C.; writing—review and editing, K.C., X.W., Y.H., L.Y., Y.G. and K.M.; visualization, K.C.; supervision, X.W. and K.M.; project administration, X.W.; funding acquisition, X.W. All authors have read and agreed to the published version of the manuscript.
Funding
This research was funded by the National Natural Science Foundation of China, grant number 52425701.
Data Availability Statement
The original contributions presented in this study are included in the article. Further inquiries can be directed to the corresponding author.
Conflicts of Interest
The authors declare no conflicts of interest.
Abbreviations
The following abbreviations are used in this manuscript:
| SEA | statistical energy analysis |
| FE-SEA | hybrid finite element–statistical snergy analysis |
References
- Wu, B.; Qiao, M. A review of the research progress of motor vibration and noise. Int. Trans. Electr. Energy Syst. 2022, 2022, 5897198. [Google Scholar] [CrossRef] [Scilit]
- Delaere, K.; Iadevaia, M.; Heylen, W.; Sas, P.; Hameyer, K.; Belmans, R. Statistical energy analysis of acoustic noise and vibration for electric motors: Transmission from air gap field to motor frame. In Proceedings of the 34th IAS Annual Meeting, Phoenix, AZ, USA, 3–7 October 1999. [Google Scholar] [CrossRef] [Scilit]
- Wang, C.; Lai, J.C.S.; Pulle, D.W.J. Prediction of acoustic noise from variable-speed induction motors: Deterministic versus statistical approaches. IEEE Trans. Ind. Appl. 2002, 38, 1037–1044. [Google Scholar] [CrossRef]
- Wang, C.; Lai, J.C.S.; Pulle, D.W.J. Sound power radiated from an inverter-driven induction motor. Part 3: Statistical energy analysis. IEE Proc. Electr. Power Appl. 2005, 152, 619–626. [Google Scholar] [CrossRef] [Scilit]
- Shen, L.; Wu, J.H. Prediction method of medium and high frequency vibration in switched reluctance motors based on statistical energy analysis. Proc. CSEE 2009, 29, 70–75. [Google Scholar] [CrossRef]
- Wang, X.; Li, X.H.; Cheng, S.W.; Wang, D.; Zhang, X.B. Research on simulation and prediction of medium and high frequency vibration in motor structures based on statistical energy method. Large Electr. Mach. Hydraul. Turbine 2019, 47–51. [Google Scholar] [CrossRef]
- Li, X.H.; Wang, X.; Wang, D.; Zhang, X.B. Modeling research on stator vibration of three-phase induction motors based on statistical energy method. J. Vib. Shock 2020, 39, 218–224. [Google Scholar] [CrossRef]
- Langley, R.S.; Bremner, P. A hybrid method for the vibration analysis of complex structural-acoustic systems. J. Acoust. Soc. Am. 1999, 105, 1657–1671. [Google Scholar] [CrossRef] [Scilit]
- Langley, R.S.; Cordioli, J.A. Hybrid deterministic-statistical analysis of vibro-acoustic systems with domain couplings on statistical components. J. Sound Vib. 2009, 321, 893–912. [Google Scholar] [CrossRef] [Scilit]
- Shorter, P.J.; Langley, R.S. Vibro-acoustic analysis of complex systems. J. Sound Vib. 2005, 288, 669–699. [Google Scholar] [CrossRef] [Scilit]
- Cotoni, V.; Gardner, B.; Cordioli, J.A.; Carneal, J.; Fuller, C. Advanced modeling of aircraft interior noise using the hybrid FE-SEA method. In Proceedings of the SAE 2008 Noise and Vibration Conference and Exhibition, St. Charles, IL, USA, 5–8 May 2008. [Google Scholar] [CrossRef] [Scilit]
- Charpentier, A.; Sreedhar, P.; Fukui, K. Using the hybrid FE-SEA method to predict structure-borne noise transmission in a trimmed automotive vehicle. In Proceedings of the SAE World Congress & Exhibition, Detroit, MI, USA, 16–18 April 2007. [Google Scholar] [CrossRef] [Scilit]
- Andrade, L.; Langley, R.S.; Butlin, T. Extension of a hybrid FE-SEA approach for vibro-acoustic analysis with prescribed displacements. J. Sound Vib. 2022, 529, 116912. [Google Scholar] [CrossRef] [Scilit]
- Andrade, L.; Langley, R.S.; Butlin, T. Equivalent linearisation in a hybrid FE-SEA approach for nonlinear vibro-acoustic modelling. J. Sound Vib. 2022, 526, 116788. [Google Scholar] [CrossRef] [Scilit]
- Jiang, Z.Y.; Chen, C.Z. Analysis of medium and high frequency vibration and noise in radome based on FE-SEA method. J. Liaoning Inst. Sci. Technol. 2025, 27, 28–31. [Google Scholar]
- Zhang, Y.J. Vehicle aerodynamic noise analysis based on FE-SEA model. Noise Vib. Control 2024, 44, 183–189. [Google Scholar]
- Magrans, F.X.; Aragonès, À.; Rodríguez-Ferran, A.; Guasch, O. The solution of vibroacoustic linear systems as a finite sum of transmission paths. Mech. Syst. Signal Process. 2021, 153, 107464. [Google Scholar] [CrossRef] [Scilit]
- Guo, X.; Ge, H.; Xiao, C.; Ma, H.; Sun, W.; Li, H. Vibration transmission characteristics analysis of the parallel fluid-conveying pipes system: Numerical and experimental studies. Mech. Syst. Signal Process. 2022, 177, 109180. [Google Scholar] [CrossRef] [Scilit]
- Wang, M.; Shi, X.; Li, M.; Li, Y. Estimation of vibration powers flowing to and out of a high-speed train bogie frame assisted by time-domain response reconstruction. Appl. Acoust. 2022, 185, 108390. [Google Scholar] [CrossRef] [Scilit]
- Ren, Y.; Sun, X.; Luo, Y.; Lu, W.; Wang, H. Layering vibration transfer path analysis of a flexible supported gear system based on the vibration power flow theory. Processes 2023, 11, 1233. [Google Scholar] [CrossRef] [Scilit]
- Takhchi, J.; Ouisse, M.; Sadoulet-Reboul, E.; Bouhaddi, N.; Gagliardini, L.; Bornet, F.; Gavric, L.; Lakrad, F. A method to investigate mid and high-frequency vibration energy transfer paths using the irrotational intensity. J. Sound Vib. 2024, 572, 118160. [Google Scholar] [CrossRef] [Scilit]
- Lalor, N. Practical Considerations for the Measurement of Internal and Coupling Loss Factors on Complex Structures; ISVR Technical Report No. 182; Institute of Sound and Vibration Research, University of Southampton: Southampton, UK, June 1990. [Google Scholar]
- Lalor, N. The experimental determination of vibrational energy balance in complex structures. In Proceedings of the Stress and Vibration: Recent Developments in Industrial Measurement and Analysis, London, UK, 14 March 1989; SPIE: Bellingham, WA, USA, 1989; Volume 1084, pp. 302–310. [Google Scholar] [CrossRef] [Scilit]
- Zhang, Y.J.; Xiao, J.; Wei, B.F.; Wang, Z. A new method for obtaining internal loss factors based on impulse excitation. J. Vib. Shock 2014, 33, 161–164. [Google Scholar]

Disclaimer/Publisher’s Note: The statements, opinions and data contained in all publications are solely those of the individual author(s) and contributor(s) and not of MDPI and/or the editor(s). MDPI and/or the editor(s) disclaim responsibility for any injury to people or property resulting from any ideas, methods, instructions or products referred to in the content. |
© 2026 by the authors. Licensee MDPI, Basel, Switzerland. This article is an open access article distributed under the terms and conditions of the Creative Commons Attribution (CC BY) license.