


Abstract
Navigate-on-Pilot (NOP) systems can experience delayed awareness of interacting vehicles in traffic conflict scenarios because of the limited effective perception range of onboard sensors. To improve the safety of NOP longitudinal control, this study develops a safety-driven cruise speed control method for V2X-enabled NOP vehicles. Systems-Theoretic Process Analysis (STPA) is used to identify unsafe control actions, their causes, and corresponding safety goals. V2X information is incorporated to extend vehicle perception, while communication delay is considered when updating interacting-vehicle states. A two-dimensional safety-envelope model is then used to detect potential spatial conflicts, and the remaining path distance to the predicted conflict region is compared with the minimum stopping distance to determine emergency braking. Real-vehicle experiments were conducted in T-intersection and roundabout scenarios under potential-conflict and non-conflict conditions. The proposed method distinguished interactions with different spatial and temporal relationships under both straight and curved paths. Compared with an onboard-perception-based strategy, the V2X-enabled strategy advanced the braking response by approximately 1.6 s at the T-intersection and 2.4 s in the roundabout. The results indicate that earlier availability of interacting-vehicle information can increase the time available for conflict assessment and longitudinal control without requiring substantially greater braking intensity.
1. Introduction
Navigate-on-Pilot (NOP) functions combine route-level navigation with automated longitudinal and lateral vehicle control. Safe operation requires timely and sufficiently complete perception of the surrounding traffic environment. In traffic conflict scenarios involving complex road geometries, roadside structures, surrounding vehicles, and restricted sensor fields of view can delay the detection of interacting vehicles. These limitations do not necessarily arise from failures of individual components. Even when sensors, communication units, and controllers operate as intended, unsafe system behavior can still occur under specific triggering conditions. Safety of the intended functionality (SOTIF) addresses these risks by considering limitations in both the intended functionality and its implementation [1,2].
Managing these risks requires a system-level analysis that considers perception, decision-making, actuation, communication, driver behavior, and the traffic environment. Systems-Theoretic Process Analysis (STPA) treats safety as a control problem and identifies hazardous interactions by analyzing unsafe control actions, causal scenarios, and corresponding safety constraints. A comparative study of automatic emergency braking found that STPA can identify interaction and timing hazards that conventional component-based methods may overlook [3]. Recent SOTIF studies have also developed methods for multidimensional risk assessment and runtime identification of unsafe scenarios in automated vehicles [4,5]. However, few studies have systematically linked STPA-derived safety goals to the design of NOP longitudinal control strategies for safety-critical vehicle interactions across different road geometries.
Vehicle-to-Everything (V2X) communication can extend vehicle perception beyond the line of sight of onboard sensors. By sharing vehicle states and detected objects, connected vehicles and roadside infrastructure can help identify occluded road users before they enter the onboard sensor field of view [6,7]. Previous experimental and simulation studies have examined cooperative localization and perception on mobile platforms [8], centralized cellular V2X resource allocation [9], and lane-level conflict resolution at unsignalized intersections [10]. Together, these studies demonstrate the safety potential of connected perception but focus mainly on perception coverage, communication efficiency, or intersection coordination. The relationship among SOTIF hazards, the timeliness of received state information, and emergency braking decisions remains unclear.
However, V2X communication also introduces functional limitations. A received message represents the state of the interacting vehicle at the time of transmission, rather than at the current decision time. Communication delay, packet loss, channel load, and positioning uncertainty can therefore introduce errors into estimates of speed, position, and arrival time at the conflict area. Large-scale simulations of autonomous intersection management have shown that communication delay can reduce both safety and traffic performance [11]. Comparisons between IEEE 802.11p and cellular V2X further show that latency and reliability depend on the communication technology and operating conditions [12,13]. A safety-critical longitudinal controller should therefore treat communication delay as more than a network performance metric. Delay should be included in the state estimation and stopping-distance calculations used to determine when braking begins.
Longitudinal control under communication constraints has been widely studied in cooperative adaptive cruise control and vehicle platooning. Relevant approaches include network-aware string stability analysis [14], hierarchical connected cruise control with information delays [15], consensus control with heterogeneous delays [16], and graceful degradation during communication loss [17]. Other studies have incorporated measured delay into minimum safe-distance models for platoons [18] or combined DSRC delay with positioning error in rear-end collision warnings [19]. Researchers have also optimized adaptive cruise control using a safe-distance model based on driver behavior [20]. However, these methods mainly address same-lane vehicle following or rear-end conflicts. In more general traffic conflict scenarios, vehicles following different paths may approach a shared conflict region under varying road geometries. An NOP controller should therefore account for interacting-vehicle states, conflict geometry, and emergency stopping constraints to determine when braking should begin.
To address these issues, this study proposes a safety-driven cruise speed control method for V2X-enabled NOP vehicles in traffic conflict scenarios. STPA is applied to identify unsafe control actions, their causes, and the corresponding safety goals. V2X information extends the effective perception range of the ego vehicle by providing the states of interacting vehicles beyond the coverage of onboard sensors. Communication delay is considered when these vehicle states are updated. A two-dimensional safety-envelope model is then used to identify potential spatial conflicts and determine the condition for emergency braking.
The main contributions are as follows. First, STPA-based safety analysis is linked to the design of the NOP cruise speed control logic. Second, a collision-risk assessment method is developed for traffic conflict scenarios using V2X vehicle information and two-dimensional safety-envelope projections. Third, conflict detection is combined with the minimum stopping distance to determine when emergency braking should begin. The proposed method is evaluated through real-vehicle experiments in representative traffic conflict scenarios and compared with an onboard-perception-based strategy.
2. Safety-Driven Design of the Cruise Speed Control Function
The complexity of NOP operating scenarios and internal control logic makes SOTIF risk analysis a system-level task. Safety analysis should therefore consider interactions among functional modules rather than examine individual components in isolation.
A typical cruise speed control architecture consists of three largely decoupled layers: perception and cognition, decision and planning, and control and actuation. Each module can therefore be analyzed using a method suited to its characteristics.
2.1. Safety Design Process for the Cruise Speed Control Function
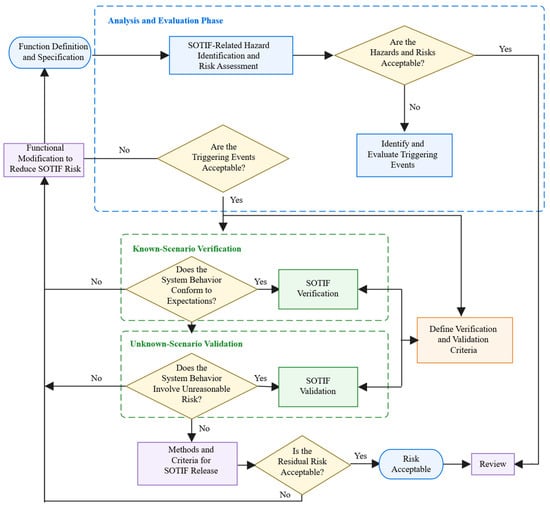
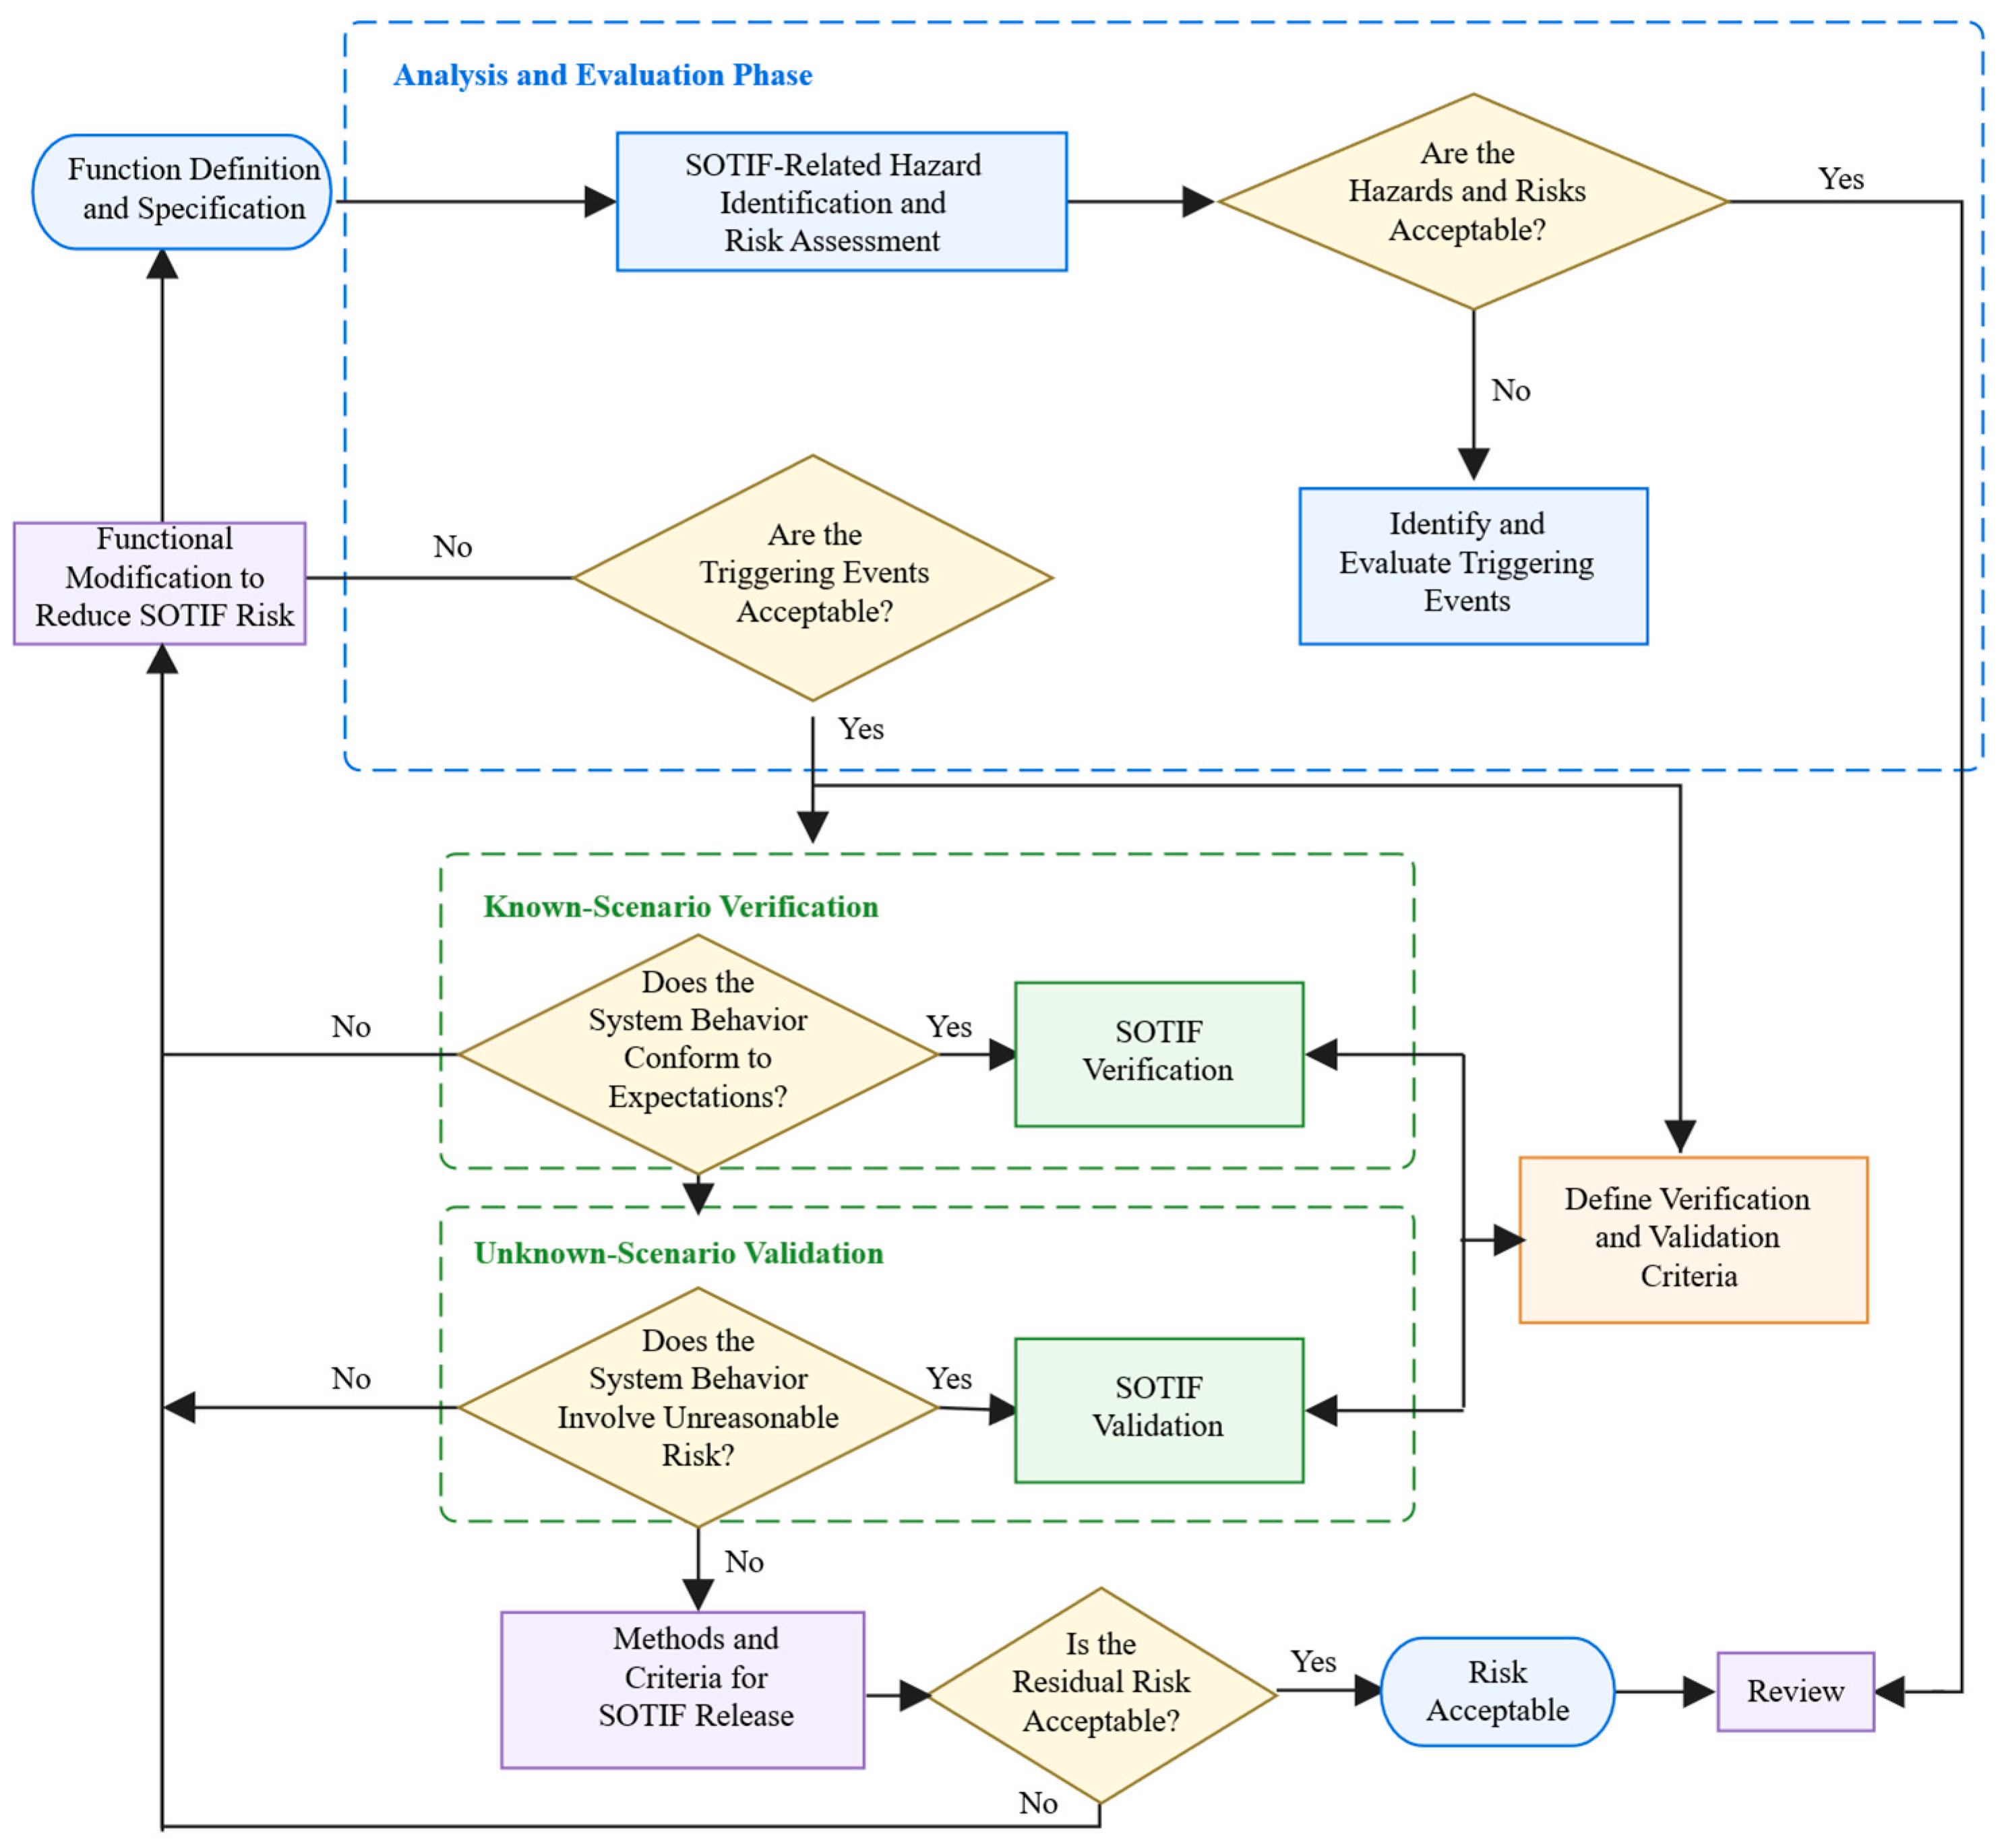
STPA treats system safety as a control problem and is applied here within the SOTIF framework. It attributes hazards to inadequate or missing safety constraints in system design and operation and constrains unsafe system behavior through control. In this study, STPA is used to identify unsafe control actions and their causes in the NOP cruise speed control function. Based on this analysis and the characteristics of the function, a SOTIF design process is developed, as shown in Figure 1.
Figure 1.
Safety design process for the NOP cruise speed control function.
A system cannot operate as intended under all possible conditions. Its normal operation is restricted to a defined operational scenario. The operational scenario of the NOP system must therefore be specified to define the safe boundary of its intended function. The SOTIF analysis is then conducted within this boundary.
2.2. STPA-Based SOTIF Analysis
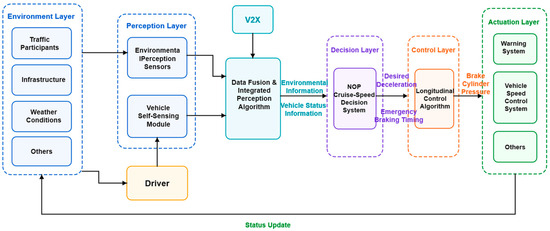
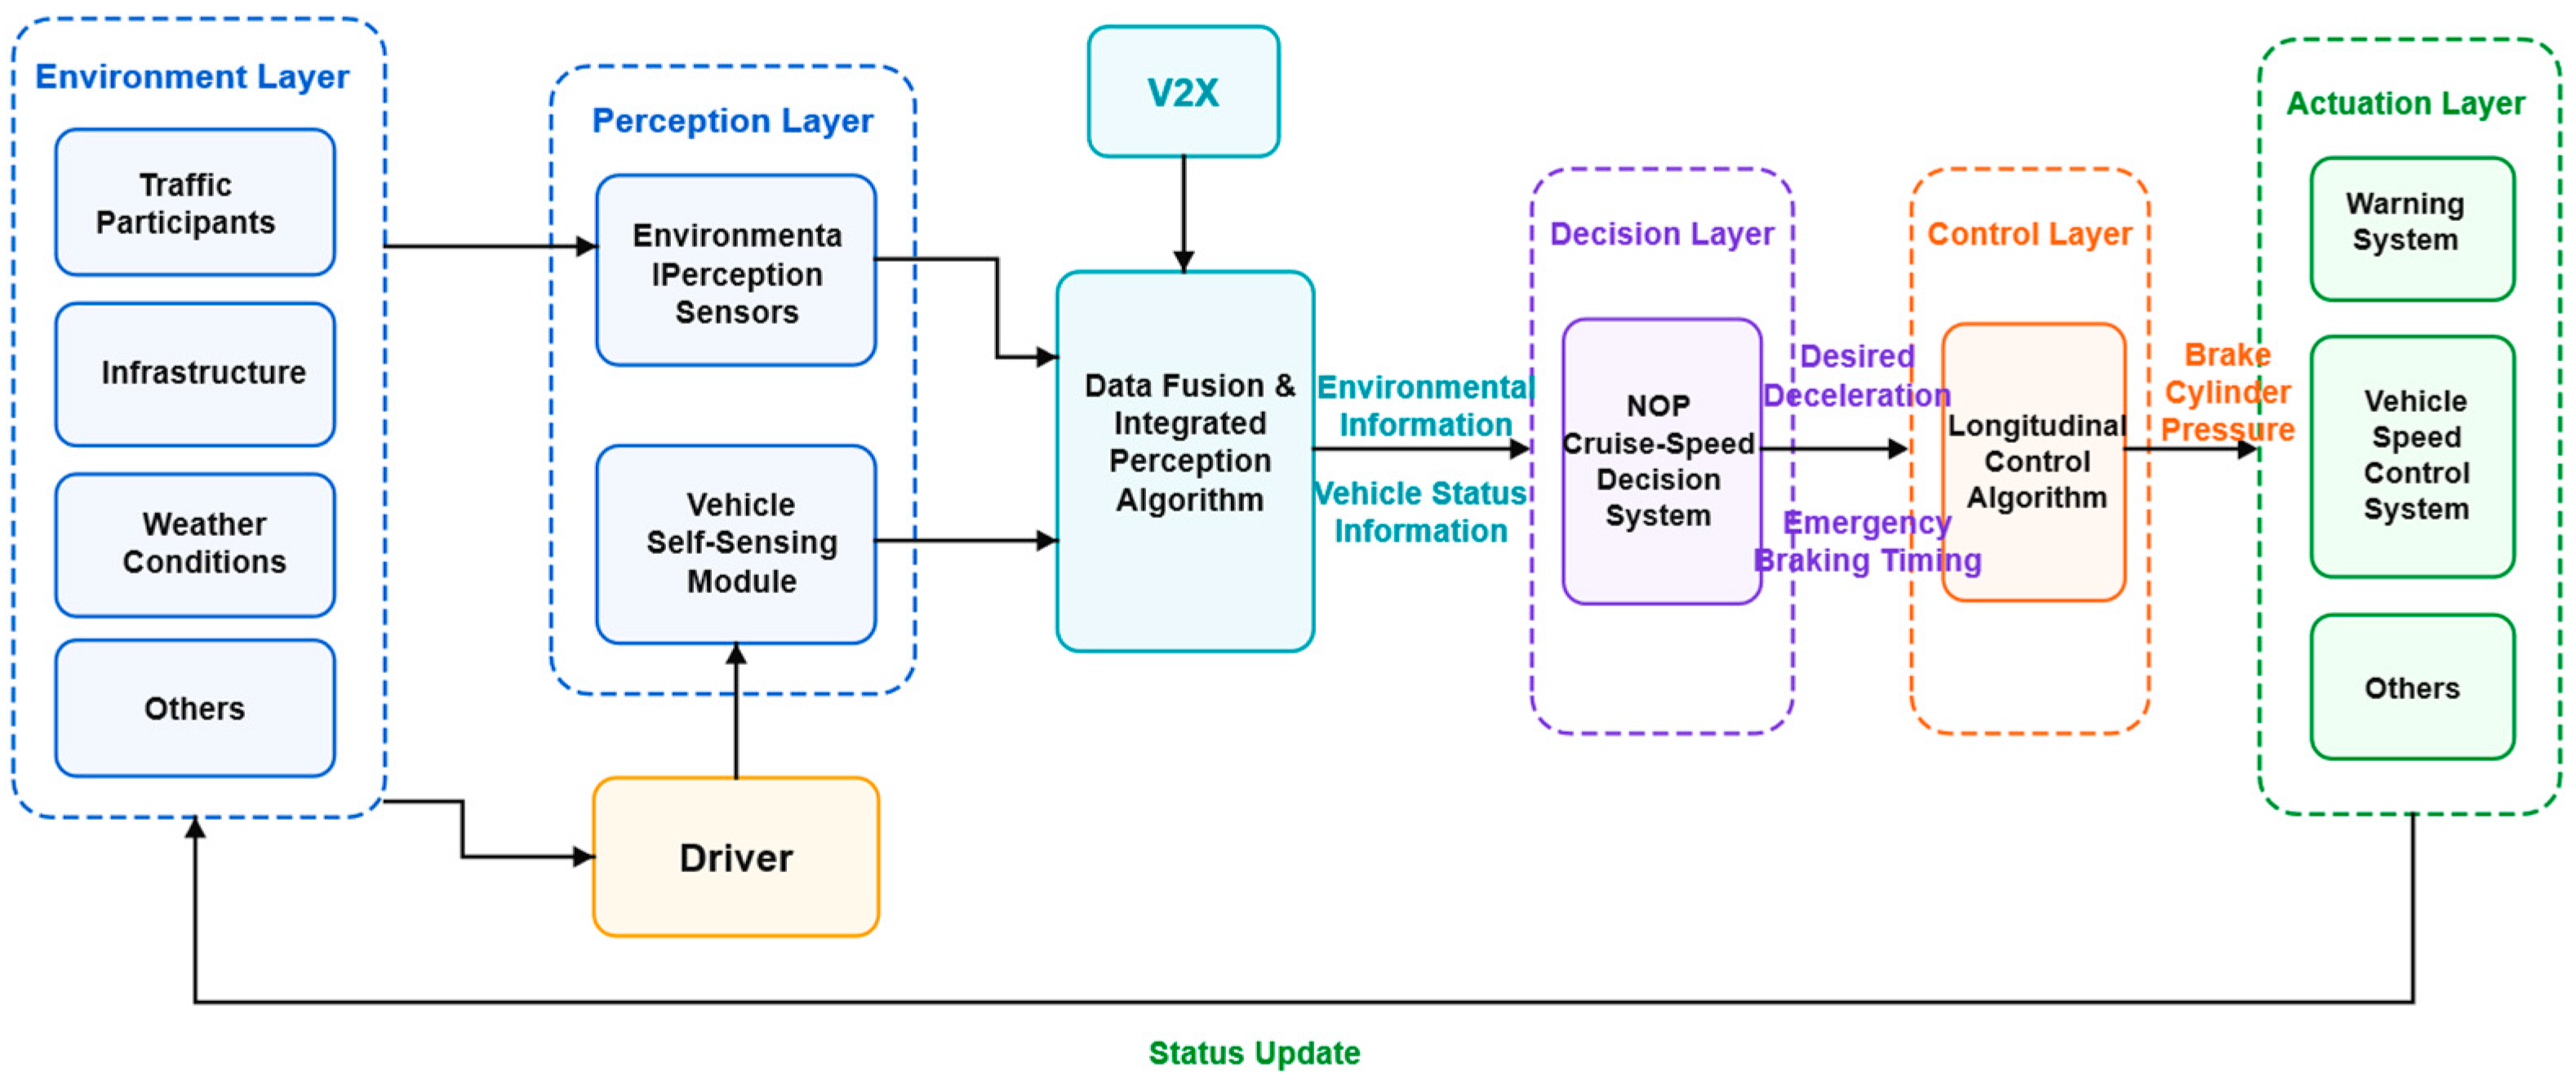
Following the SOTIF design process described above, STPA is applied to analyze the cruise speed control architecture. The STPA control structure of the NOP cruise speed control function is shown in Figure 2. It contains five control levels: perception, decision, control, actuation, and environment. At the perception level, environmental information is acquired through onboard sensors, cooperative vehicle-road perception devices, and driver responses. After processing, this information is provided to the decision level. The decision level combines environmental and vehicle-state information to assess potential conflicts and determine the required deceleration and emergency braking initiation time. The control level converts these decisions into brake cylinder pressure signals. The actuation level consists of the physical vehicle, including the warning system, speed control system, and other actuators.
Figure 2.
STPA control structure of the NOP cruise speed control function.
2.2.1. Identification of Potential Triggering Events
Emergency braking decisions are based on potential-conflict assessment and longitudinal safety evaluation. First, the positions, speeds, headings, and motion states of the ego and interacting vehicles are used to predict their spatial relationship and identify potential conflicts. When a potential conflict is identified, the remaining path distance from the ego vehicle to the predicted conflict region, Dconf, is compared with the minimum stopping distance, Dstop. Emergency braking is initiated when Dconf ≤ Dstop. The vehicle dynamics module then determines the braking command based on the prescribed maximum deceleration and vehicle parameters. For vehicle-state information received through V2X, communication delay is considered before the interacting-vehicle state is used in the conflict assessment.
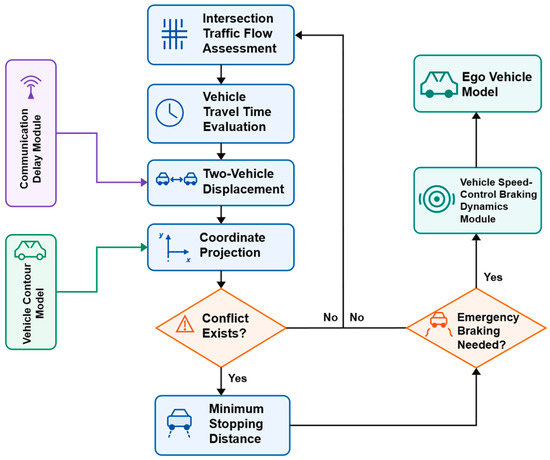
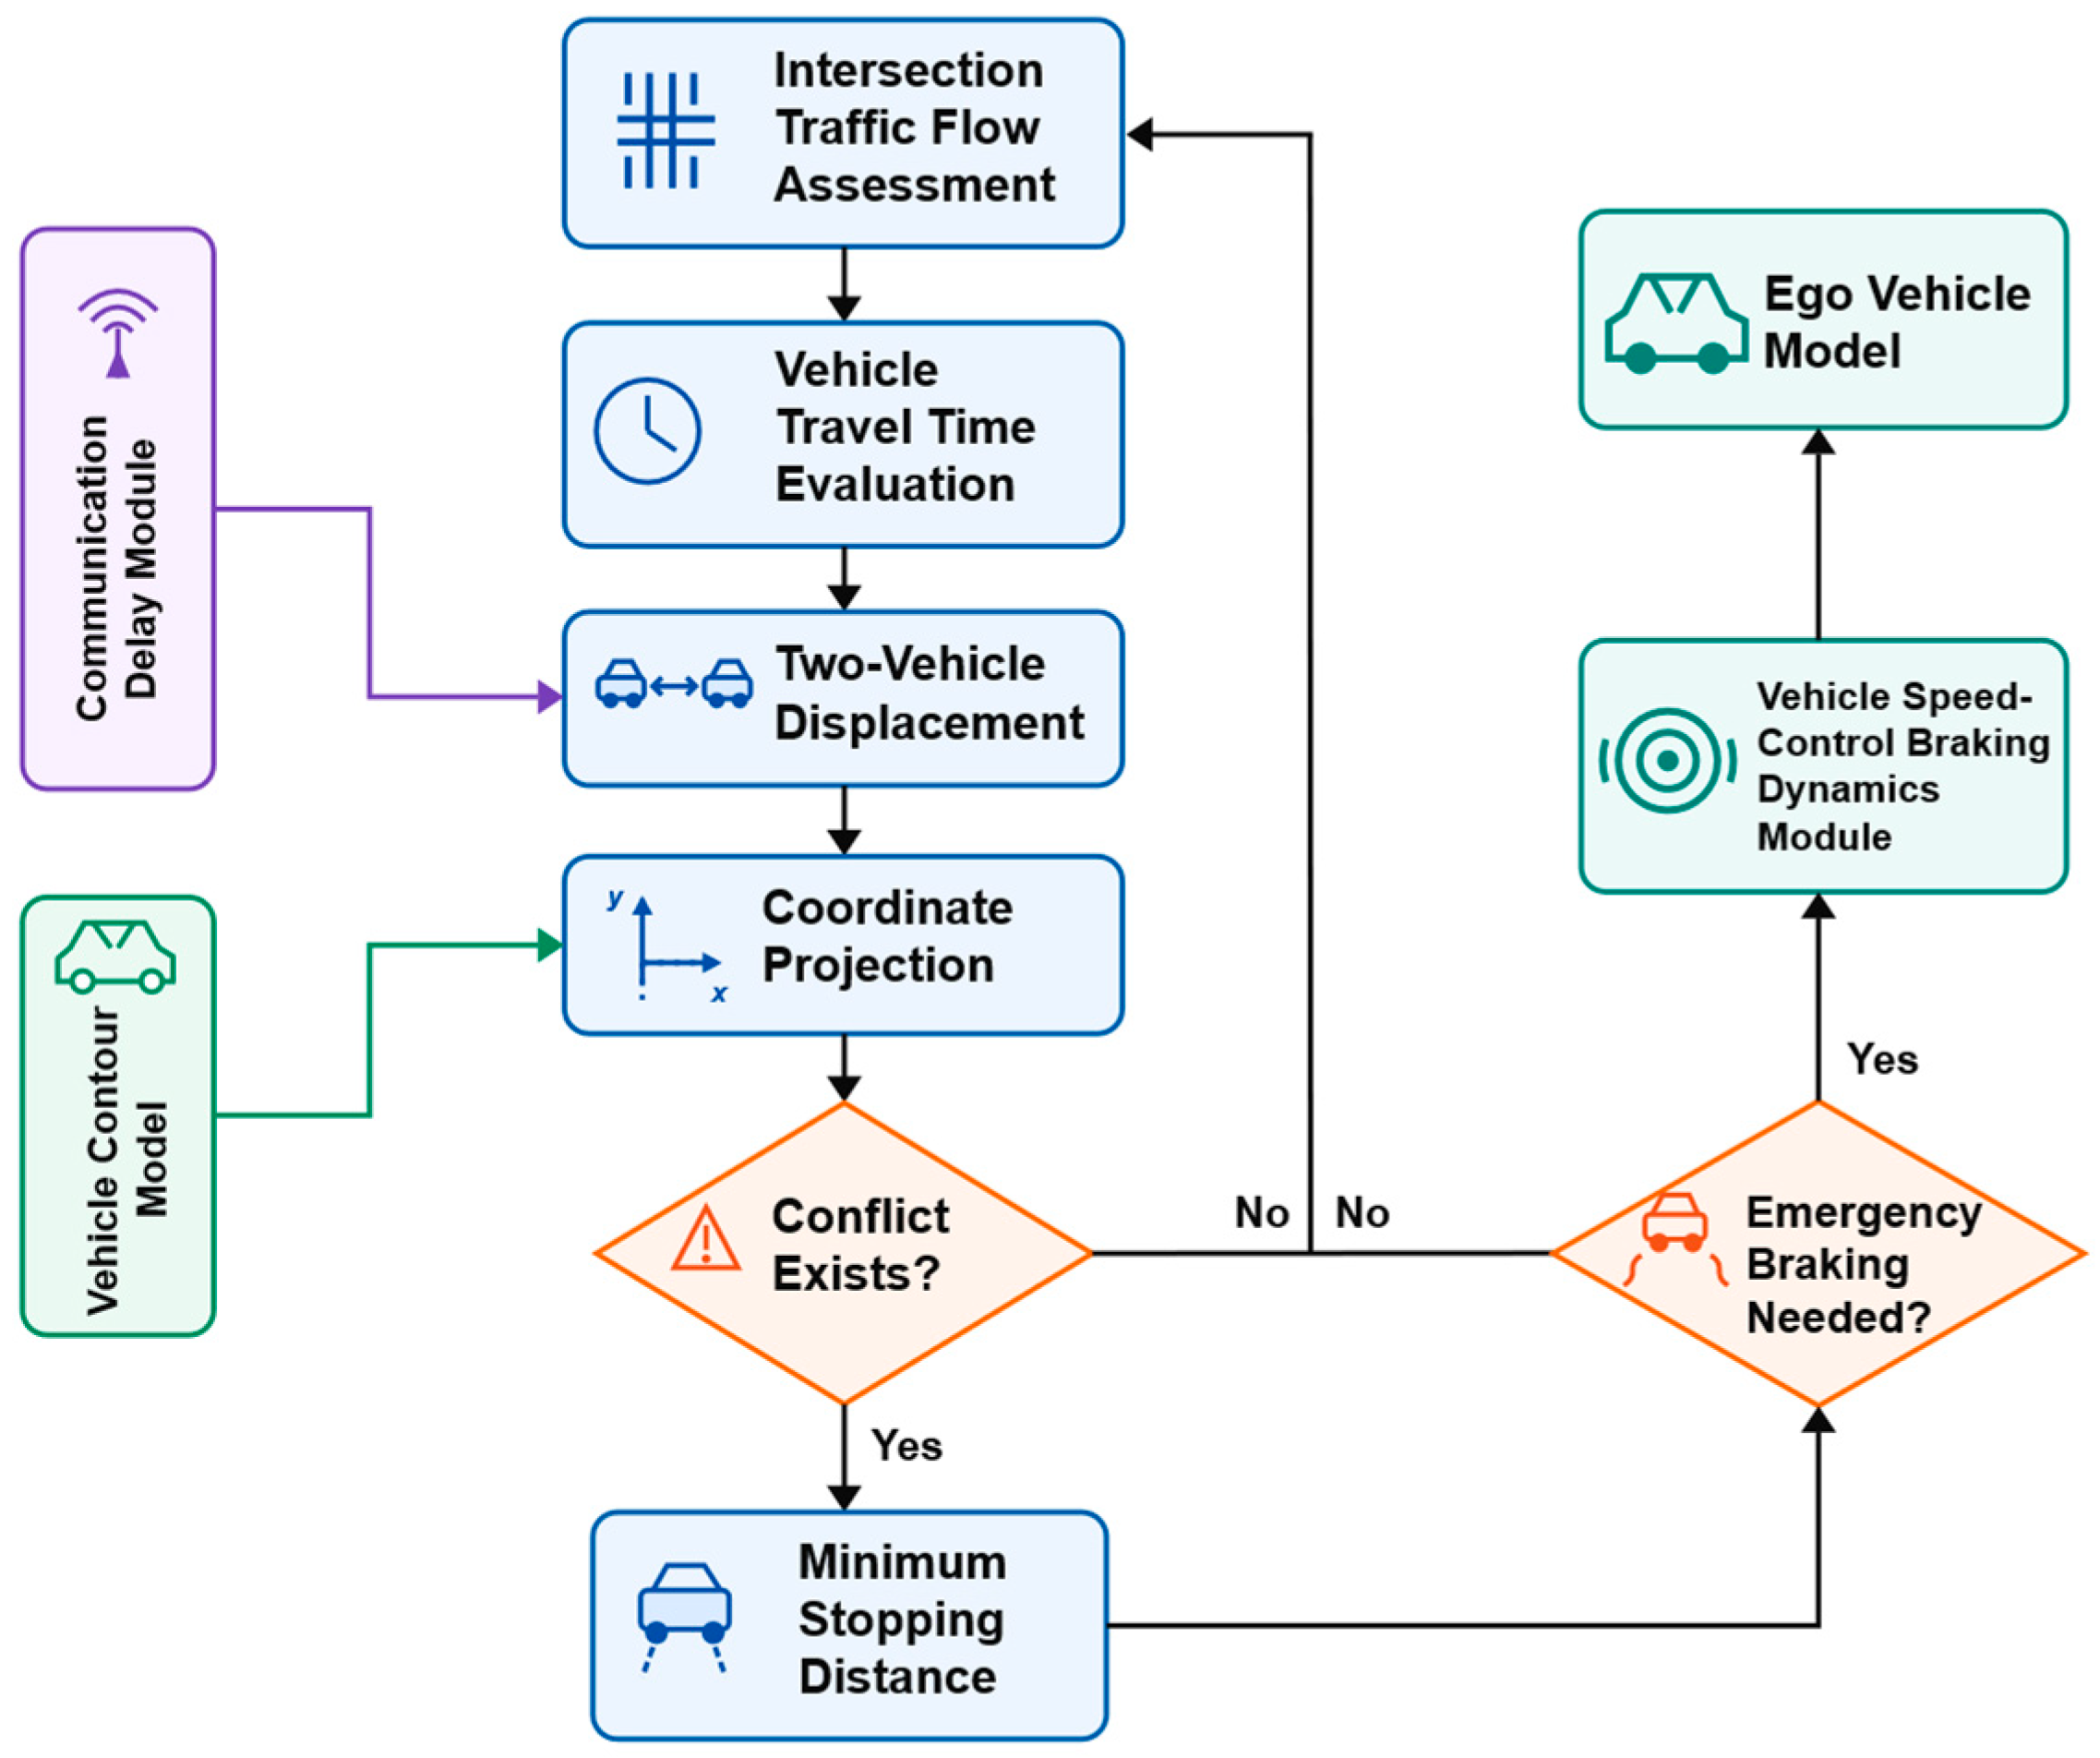
Figure 3 presents the model framework of the NOP cruise speed control function. Environmental and vehicle-state information is obtained through onboard perception and V2X communication. The interacting-vehicle state received through V2X is updated to account for communication delay before being provided to the conflict assessment module. The decision system then evaluates potential spatial conflicts between the ego vehicle and the interacting vehicle. When a potential conflict is identified, the remaining path distance to the predicted conflict region is compared with the minimum stopping distance. This comparison determines whether emergency braking should be initiated. The resulting decision is then executed by the vehicle control and actuation modules.
Figure 3.
Model framework of the NOP cruise speed control function.
For the cruise speed control function considered here, ST1 represents the safety-critical condition requiring emergency braking. Specifically, ST1 is satisfied when a potential vehicle conflict is identified and Dconf ≤ Dstop. The unsafe control actions M1–M4 describe cases in which the braking control associated with ST1 is absent, unnecessary, premature, or delayed, respectively.
2.2.2. Risk Assessment of the Cruise Speed Control Function
The primary function of NOP cruise speed control is to decelerate the vehicle and maintain a safe separation from interacting vehicles in potentially hazardous scenarios. The severity of the resulting losses is classified into five levels, from S1 to S5. A higher level indicates a more severe consequence.
A triggering event is an unsafe control action that may lead to a hazard under a specific operational scenario. To prevent SOTIF-related hazards, potentially hazardous events associated with cruise speed control should first be identified. In this study, a hazardous event is defined as unintended functional behavior under a specific scenario that may result in a given level of loss.
Unsafe control actions are identified by examining the possible failure modes of safety-critical control actions [21]. Following the general STPA classification, four types of unsafe control actions, denoted M1–M4, are considered. Table 1 summarizes the identified hazardous events, corresponding unsafe control actions, and associated loss severity levels.
Table 1.
Hazard and loss severity assessment for the cruise speed control function.
Among the identified hazardous events, H2 and H3 are associated with relatively low-to-moderate severity levels, ranging from S1 to S3. These events generally do not result in vehicle damage, injury, or death. In contrast, H1 and H4 may reach severity levels of S4 or S5 and may lead to collision-related vehicle damage, injury, or death. H1 and H4 therefore require particular attention during system design and subsequent safety analysis.
2.2.3. Analysis of the Causes of Unsafe Control Actions
The output of the decision level depends on three sources: the decision system, environmental information from the perception level, and positioning and navigation information from the perception level. The causes of unsafe control actions are therefore grouped into four categories, denoted DS1–DS4.
(1) DS1: Failure to obtain traffic-environment information. The decision level receives incorrect environmental information from the perception level, or correct information is generated but not successfully transmitted.
(2) DS2: Failure to obtain the ego-vehicle state. The perception level provides incorrect ego-vehicle state information, or correct information is generated but not successfully transmitted.
(3) DS3: Safety problems within the decision system. DS3.1 represents defective state-transition conditions. DS3.2 represents overly sensitive transition conditions that cause oscillation and frequent switching among states. DS3.3 occurs when the decision output is correct but interference or delay during transmission causes the received signal to differ from the expected result.
(4) DS4: V2X communication limitations. Delayed transmission may cause the decision system to use stale interacting-vehicle state information.
The mapping from each triggering-event combination to its cause categories and specific causes is summarized in Table 2.
Table 2.
Triggering-event combination.
2.3. Safety Goals
Potentially hazardous events are derived from the identified triggering conditions and their causes [2], as summarized in Table 3. Table 3 links potential hazards, loss-severity levels, triggering conditions, and triggering causes. Each hazardous event is represented by the ordered tuple (Ri,Sj,Pk), where Ri denotes the triggering cause, Sj denotes the loss-severity level, and Pk denotes the potential hazard. The associated safety goals are denoted by Gl.
Table 3.
Potential hazards, loss severity levels, and safety goals for the cruise speed control function.
The STPA-based SOTIF assessment identifies inaccurate perception, signal transmission errors, communication delay, and inappropriate decision logic as potential safety risks. Among these risks, communication delay is an important factor affecting the timeliness of interacting-vehicle state information. Accordingly, the received V2X state is updated to compensate for communication delay before being used in conflict assessment and cruise speed control. The resulting safety goals are incorporated into the perception, conflict assessment, and emergency braking decision logic.
3. Communication-Delay Compensation and Ego-Vehicle Stopping-Distance Model
V2X messages describe the state of the interacting vehicle at the transmission time rather than at the current decision time. Communication delay must therefore be considered before the received state is used for conflict prediction. Separately, the ego-vehicle stopping distance must account for brake-system response and deceleration dynamics. This section first compensates the interacting-vehicle state for communication delay and then formulates the minimum stopping distance of the ego vehicle.
3.1. Field Tests of Communication Delay
Field tests were conducted to measure the delay between onboard communication devices. The measured delay was subsequently used to establish the safe-distance model.
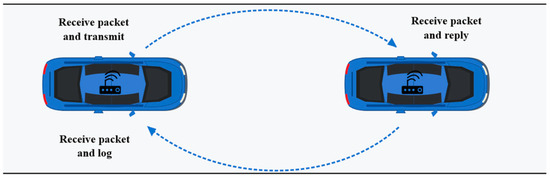
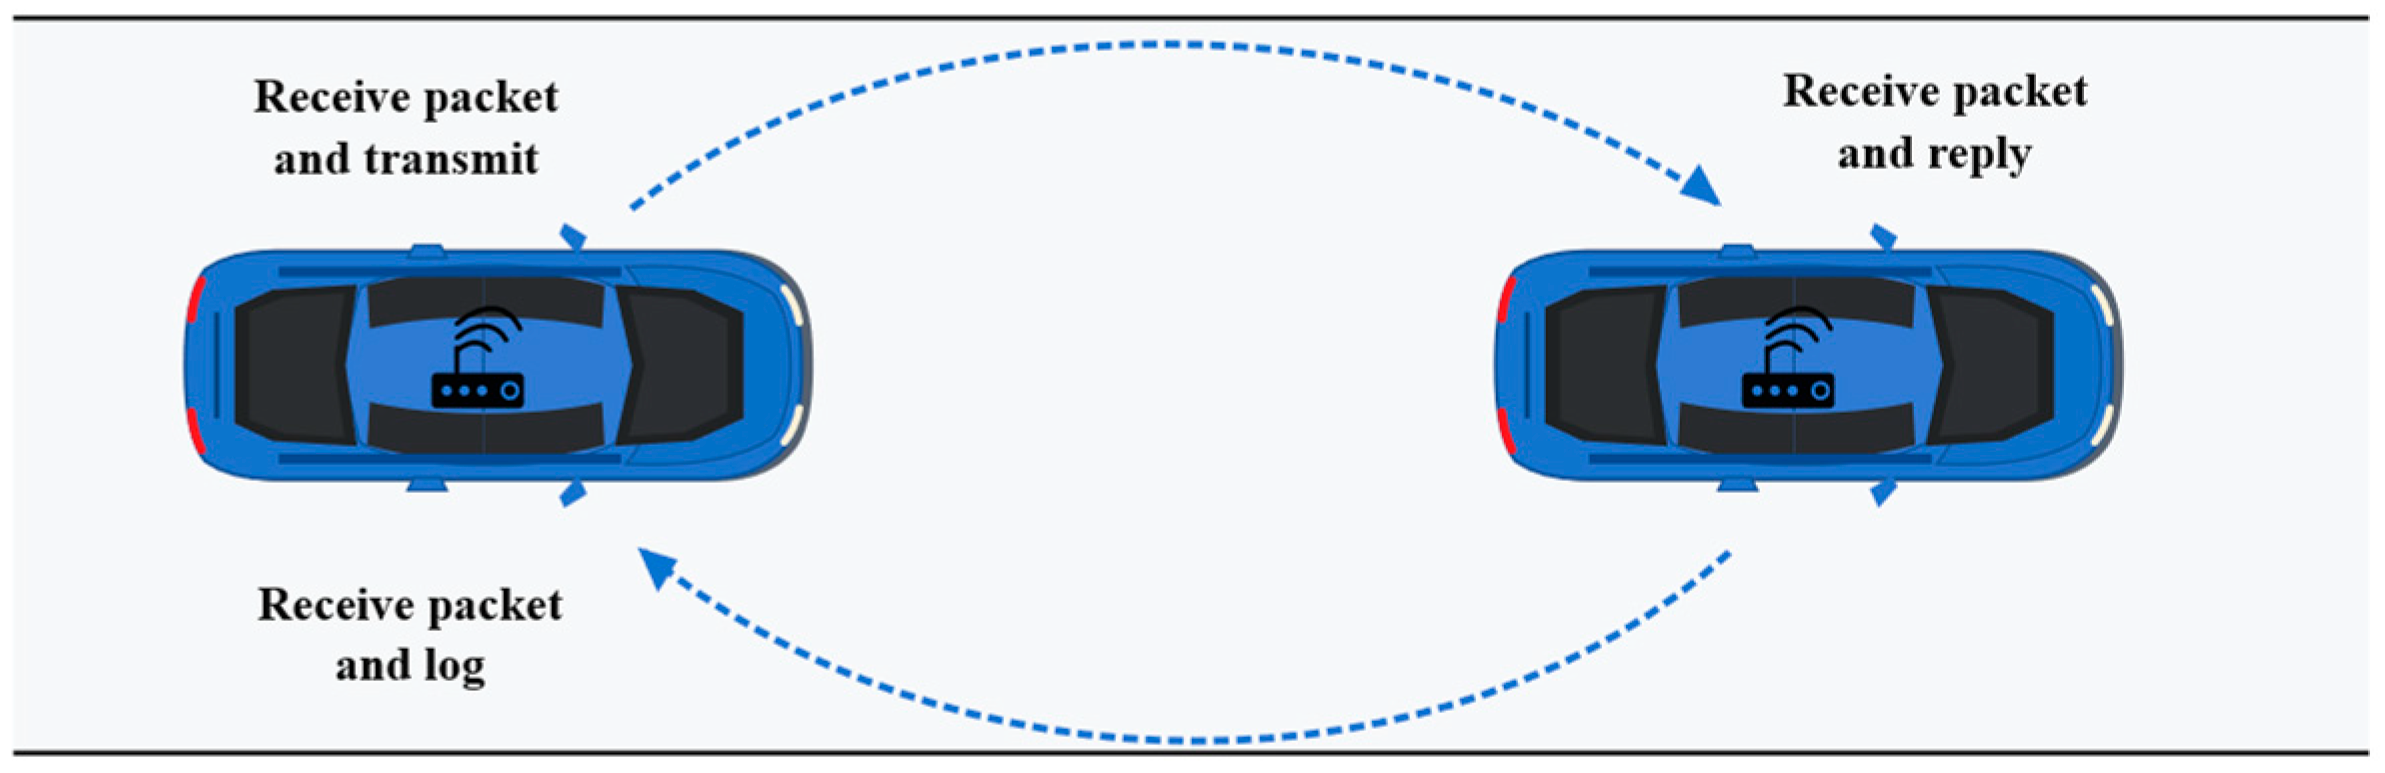
An I-VICS onboard unit (OBU) was installed in each test vehicle. A round-trip measurement method was used to avoid errors caused by inaccurate clock synchronization between the TX2 units. The rear vehicle sent simulated ROS data and a transmission timestamp to the front vehicle through its TX2. The front vehicle returned the received packet, and the rear vehicle recorded the reception time. The one-way communication delay was estimated as half the difference between the transmission and reception timestamps. Data were transmitted at 10 Hz. The bidirectional packet-exchange procedure is illustrated in Figure 4.
Figure 4.
Communication delay test setup.
- (1)
- Test Scenarios
Stationary and moving scenarios were selected for the field tests. During the moving tests, the vehicles crossed intersections, made turns, and waited at traffic lights. The two vehicles otherwise traveled in the same lane, although other vehicles occasionally entered the gap between them. The detailed stationary and moving test conditions for the two sites are summarized in Table 4 and Table 5, respectively.
Table 4.
Test conditions at the Tsinghua University Suzhou Automotive Science and Technology Park.
Table 5.
Test conditions on Xiangcheng Avenue in Suzhou High-Speed Rail New City.
- (2)
- Test Data
Table 6 presents the communication delay measured while both vehicles were stationary at the Tsinghua University Suzhou Automotive Science and Technology Park. Table 7 presents the delay measured under moving conditions at vehicle speeds of 15, 35, 55, and 75 km/h.
Table 6.
Communication delay with both vehicles stationary.
Table 7.
Communication delay under moving conditions.
3.2. Communication-Delay Compensation and Stopping-Distance Estimation
- (1)
- Communication-Delay Compensation for the Interacting Vehicle
The V2X packet received at the current decision time contains the interacting-vehicle state measured at the transmission time. Let , and denote the received longitudinal position, speed, and acceleration, respectively. Let τ denote the one-way communication delay in seconds. Because τ is short, the interacting-vehicle acceleration is assumed to remain constant during the delay interval. The state at the current decision time is therefore estimated as
Here, the superscripts r and c denote the received and delay-compensated states, respectively. The compensated state is subsequently used as the initial state of the interacting vehicle in the path-prediction model. The delay-compensated state is not treated as a separate component of the ego-vehicle stopping distance.
- (2)
- Ego-Vehicle Displacement
The emergency-braking process is divided into four stages: driver reaction time τ1, brake-clearance elimination time τ2, braking-force build-up time τ3, and steady braking time τ4. Let ve0 denote the ego-vehicle speed when the emergency-braking command is issued. During τ1 and τ2, the ego vehicle is assumed to maintain this speed. The corresponding displacement is
D1 = ve0(τ1 + τ2)
In the NOP cruise speed control function considered here, emergency braking is initiated automatically by the decision system. Driver reaction time is therefore excluded by setting τ1 = 0. Equation (2) consequently becomes
D1 = ve0τ2
During the braking-force build-up time τ3, the braking-deceleration magnitude is assumed to increase linearly from zero to its prescribed maximum value. Let k denote the rate of increase in the deceleration magnitude. The ego-vehicle displacement during this stage is
The maximum braking-deceleration magnitude is denoted by ab, where ab > 0. Under the linear build-up assumption, k is given by
Here, ab = 6 m/s2 is the nominal commanded target; the model may underestimate stopping distance when the achieved deceleration is lower.
Evaluating Equation (4) gives the displacement during the braking-force build-up stage:
When abτ3/(6ve0)≪1, the second term in Equation (6) is small relative to the first term. The approximation D2≈ve0τ3 may therefore be used to reduce the computational cost.
At the end of the braking-force build-up stage, the ego-vehicle speed is
After the braking-deceleration magnitude reaches ab, it remains constant until the ego vehicle stops. The duration of the steady braking stage is τ4 = v3/ab. The corresponding displacement is therefore
Here, v3 is the ego-vehicle speed at the end of the braking-force build-up stage. D3 is the distance traveled under the prescribed constant braking-deceleration magnitude.
The minimum stopping distance of the ego vehicle is obtained by summing the displacements during brake-clearance elimination, braking-force build-up, and steady braking:
Dstop = D1 + D2 + D3
Dstop represents the longitudinal path distance required for the ego vehicle to come to rest after the emergency-braking command is issued. Communication delay does not directly change this ego-vehicle stopping distance. Instead, it changes the estimated interacting-vehicle state and consequently affects the predicted conflict region and Dconf.
In the stopping-distance calculations, the brake-clearance elimination time and braking-force build-up time were set to τ2 = 0.20 s and τ3 = 1.00 s, respectively, based on calibration tests conducted on the test vehicle.
In the subsequent decision model, the delay-compensated interacting-vehicle state is used to predict the conflict region. Emergency braking is initiated when a potential conflict is identified and the remaining ego-vehicle path distance satisfies Dconf ≤ Dstop.
4. Optimization of Cruise Speed Control Under Emergency Conditions
Emergency deceleration is considered for safety-critical interaction scenarios in which the ego vehicle and an interacting vehicle approach a common conflict region. The proposed method first determines whether a potential conflict exists between the two vehicles. If a conflict risk is detected, the emergency braking condition and initiation time are determined. Vehicle operating conditions are affected by pedestrians, surrounding vehicles, road geometry, and environmental conditions. Traffic conflicts may arise from the road environment [22], driver behavior [23], vehicle characteristics, road design [24], and weather conditions [25].
4.1. Vehicle Model
A safety envelope is constructed around the vehicle outline to represent the occupied safety region of each vehicle. The envelope also reduces the influence of positioning uncertainty on conflict assessment.
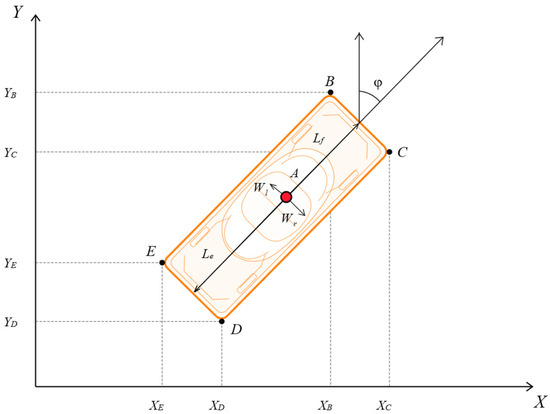
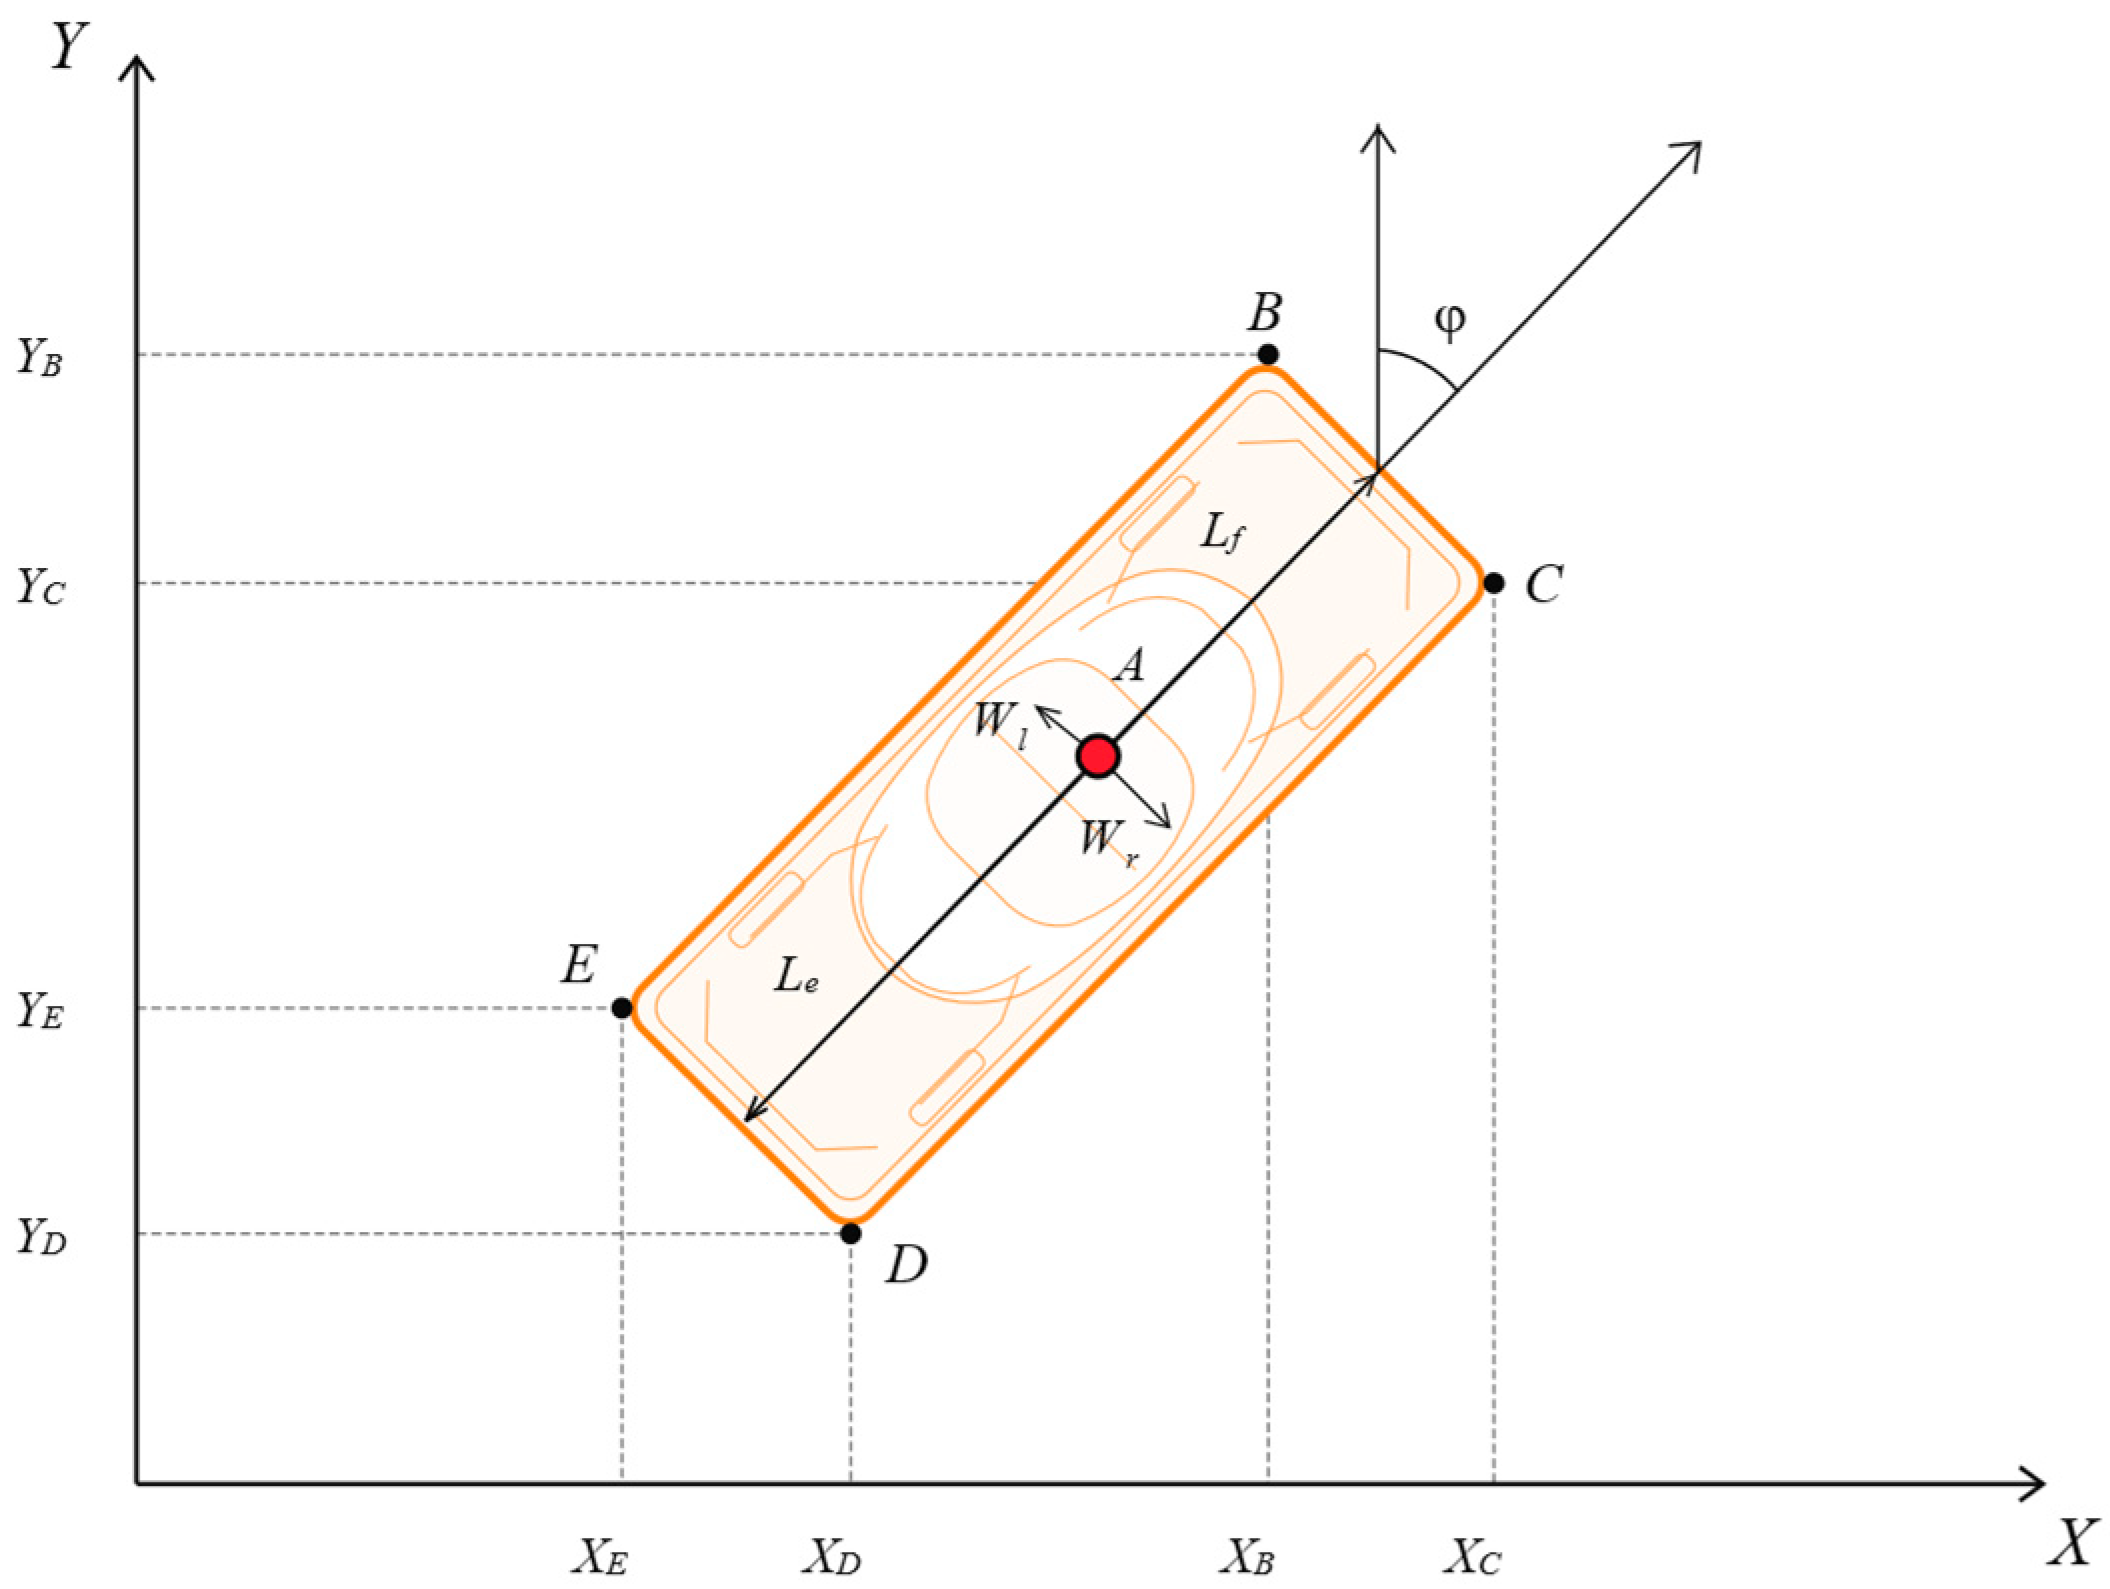
Figure 5 illustrates the safety envelope and coordinate definition for each vehicle. Point A is the GPS reference point. Lf, Le, Wl, and Wr denote the distances from point A to the front, rear, left, and right boundaries, respectively. The vehicle heading angle is denoted consistently by φ. Under the adopted coordinate convention, φ is measured clockwise from the positive Y-axis. The four vertices of the safety envelope are calculated as
Figure 5.
Vehicle safety model.
Here, (XA,YA) denotes the coordinate of the vehicle GPS reference point. The subscripts B, C, D, and E identify the four vertices shown in Figure 5.
4.2. Two-Vehicle Conflict Detection and Distance Maintenance Model
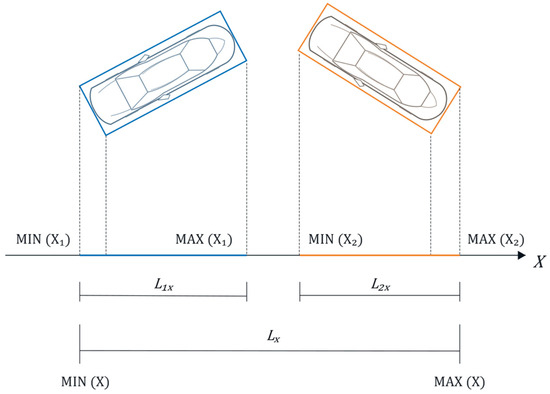
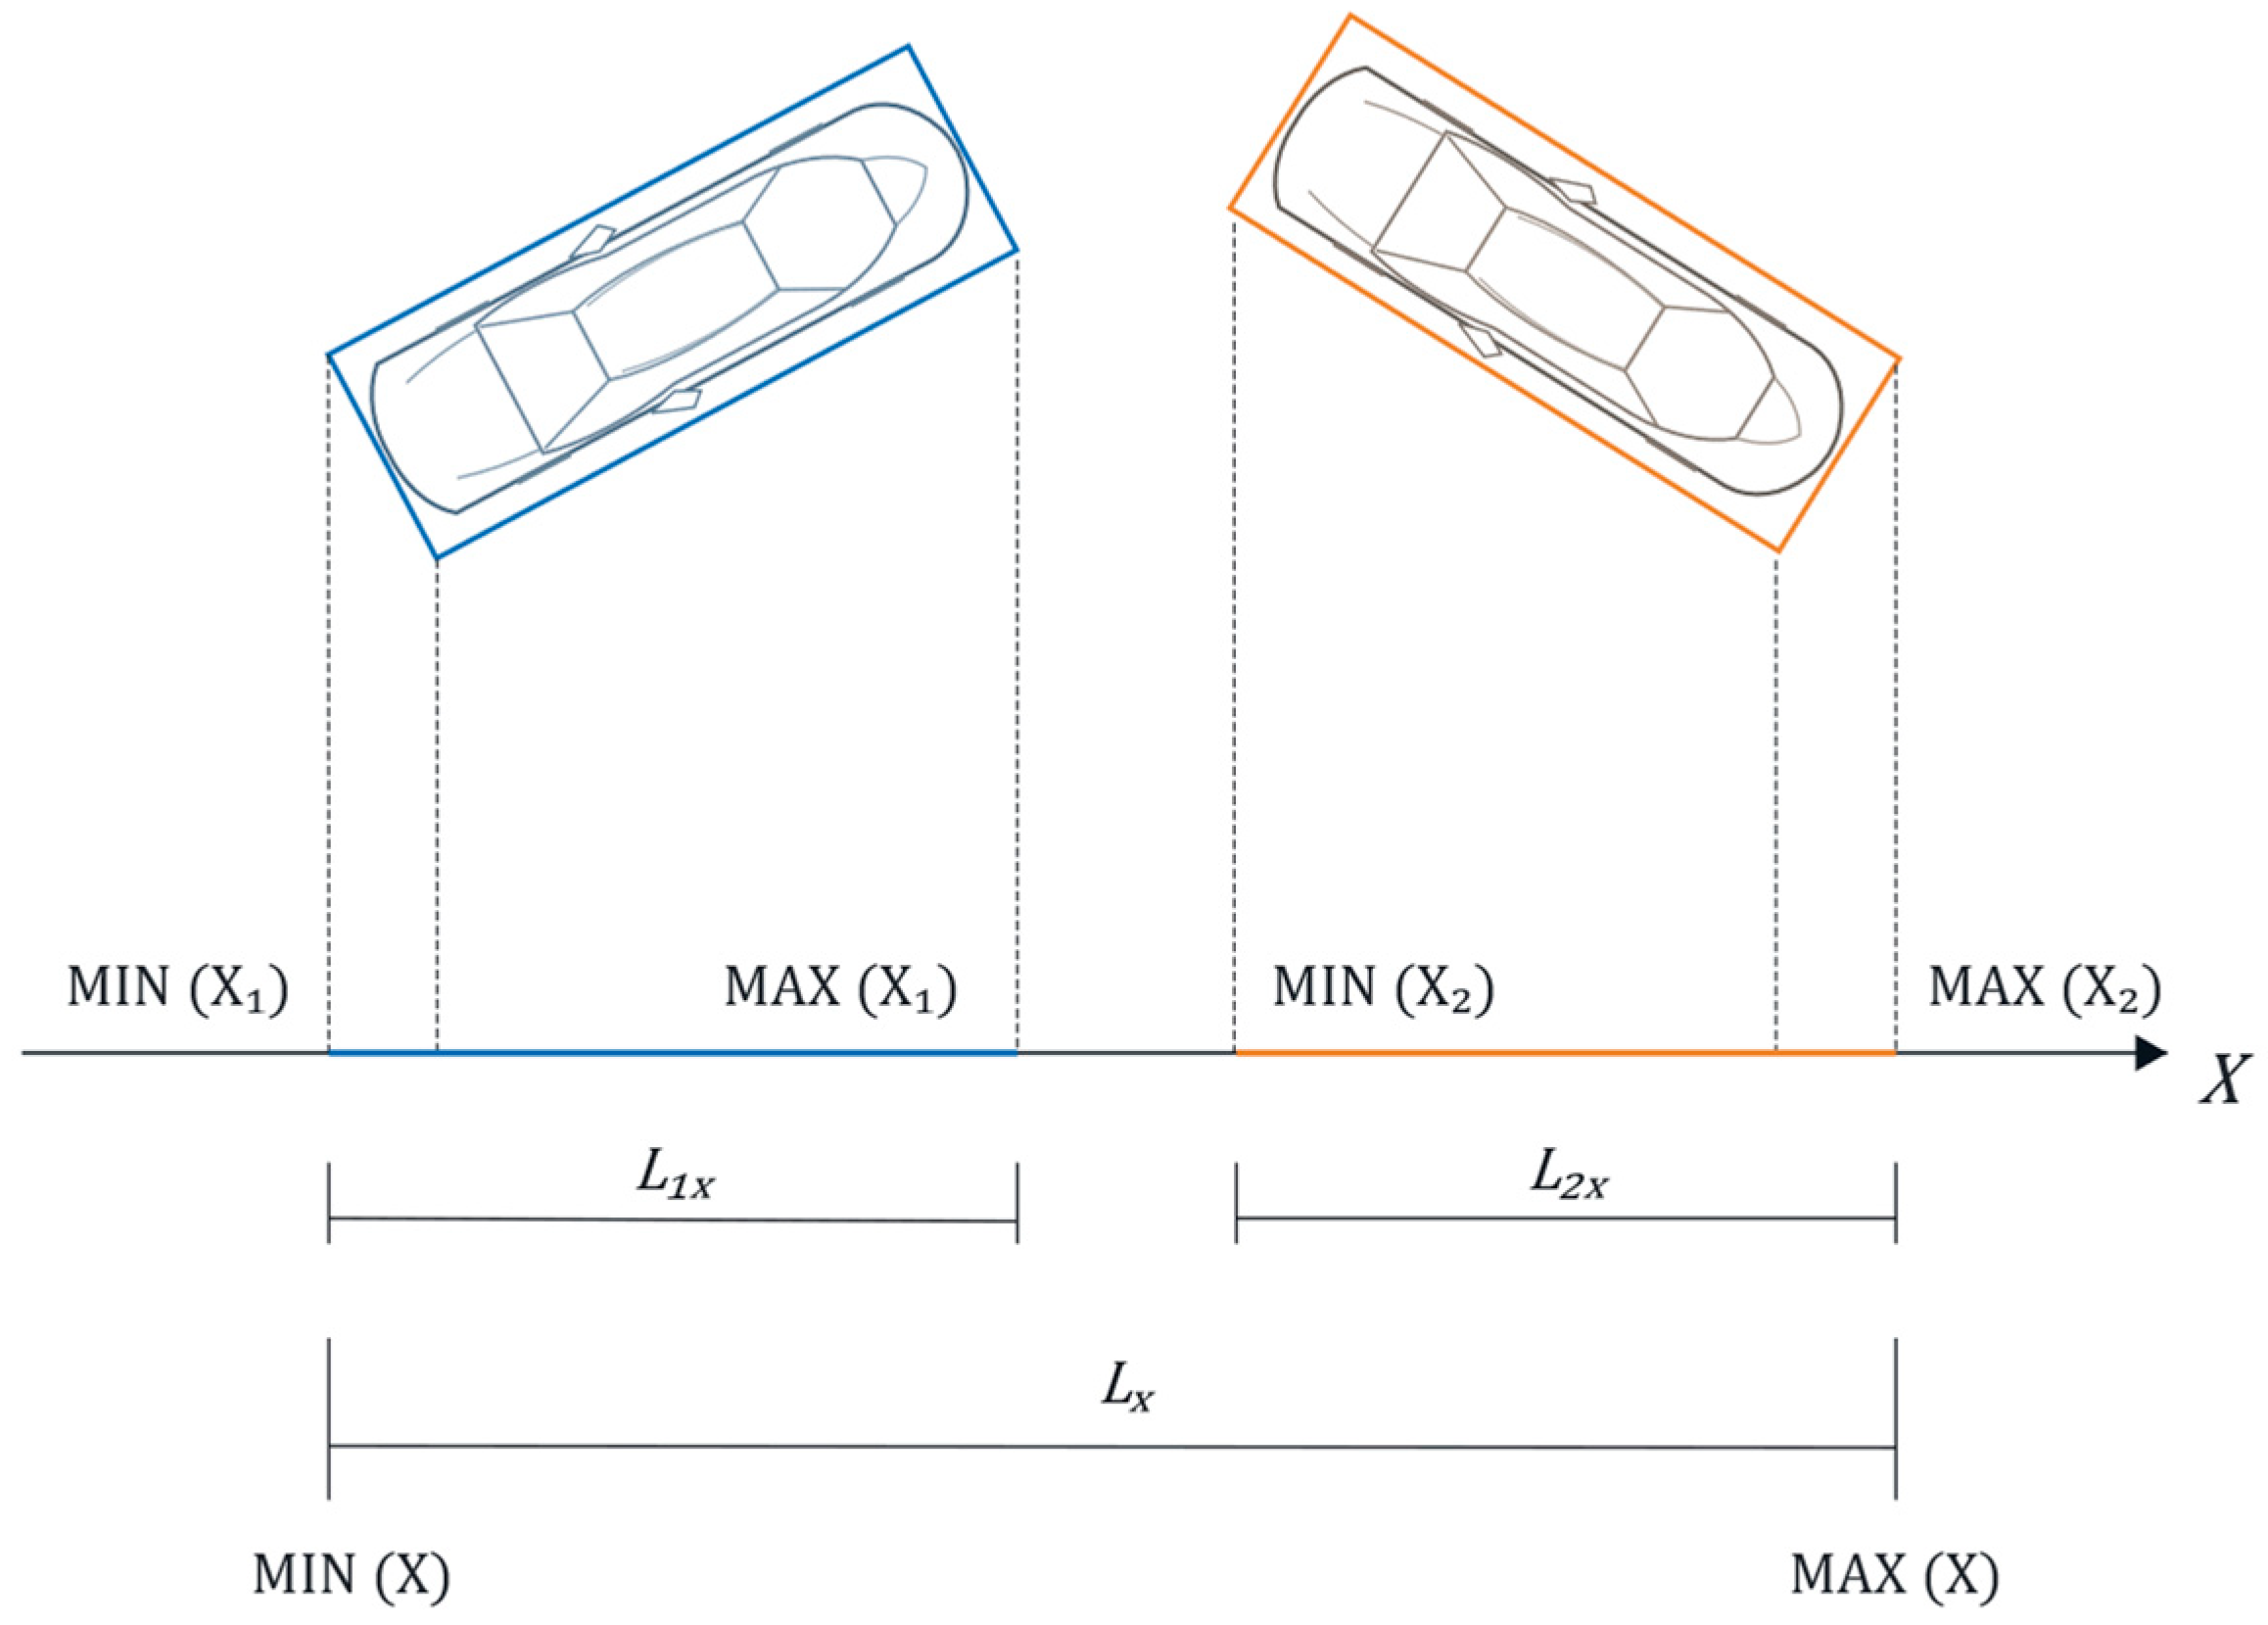
The proposed conflict detection and distance maintenance model considers two vehicles: the ego vehicle and the interacting vehicle. The ego-vehicle GPS reference point is defined as the coordinate origin, and the ego-vehicle heading determines the coordinate direction. The position of the interacting vehicle is calculated from the relative bearing and distance between the two GPS reference points. Its complete pose in the coordinate system is then determined using its heading angle.
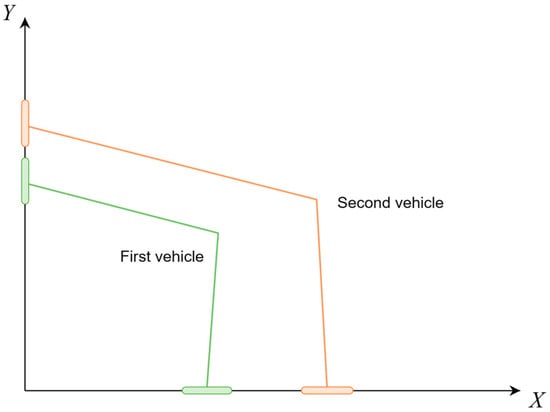
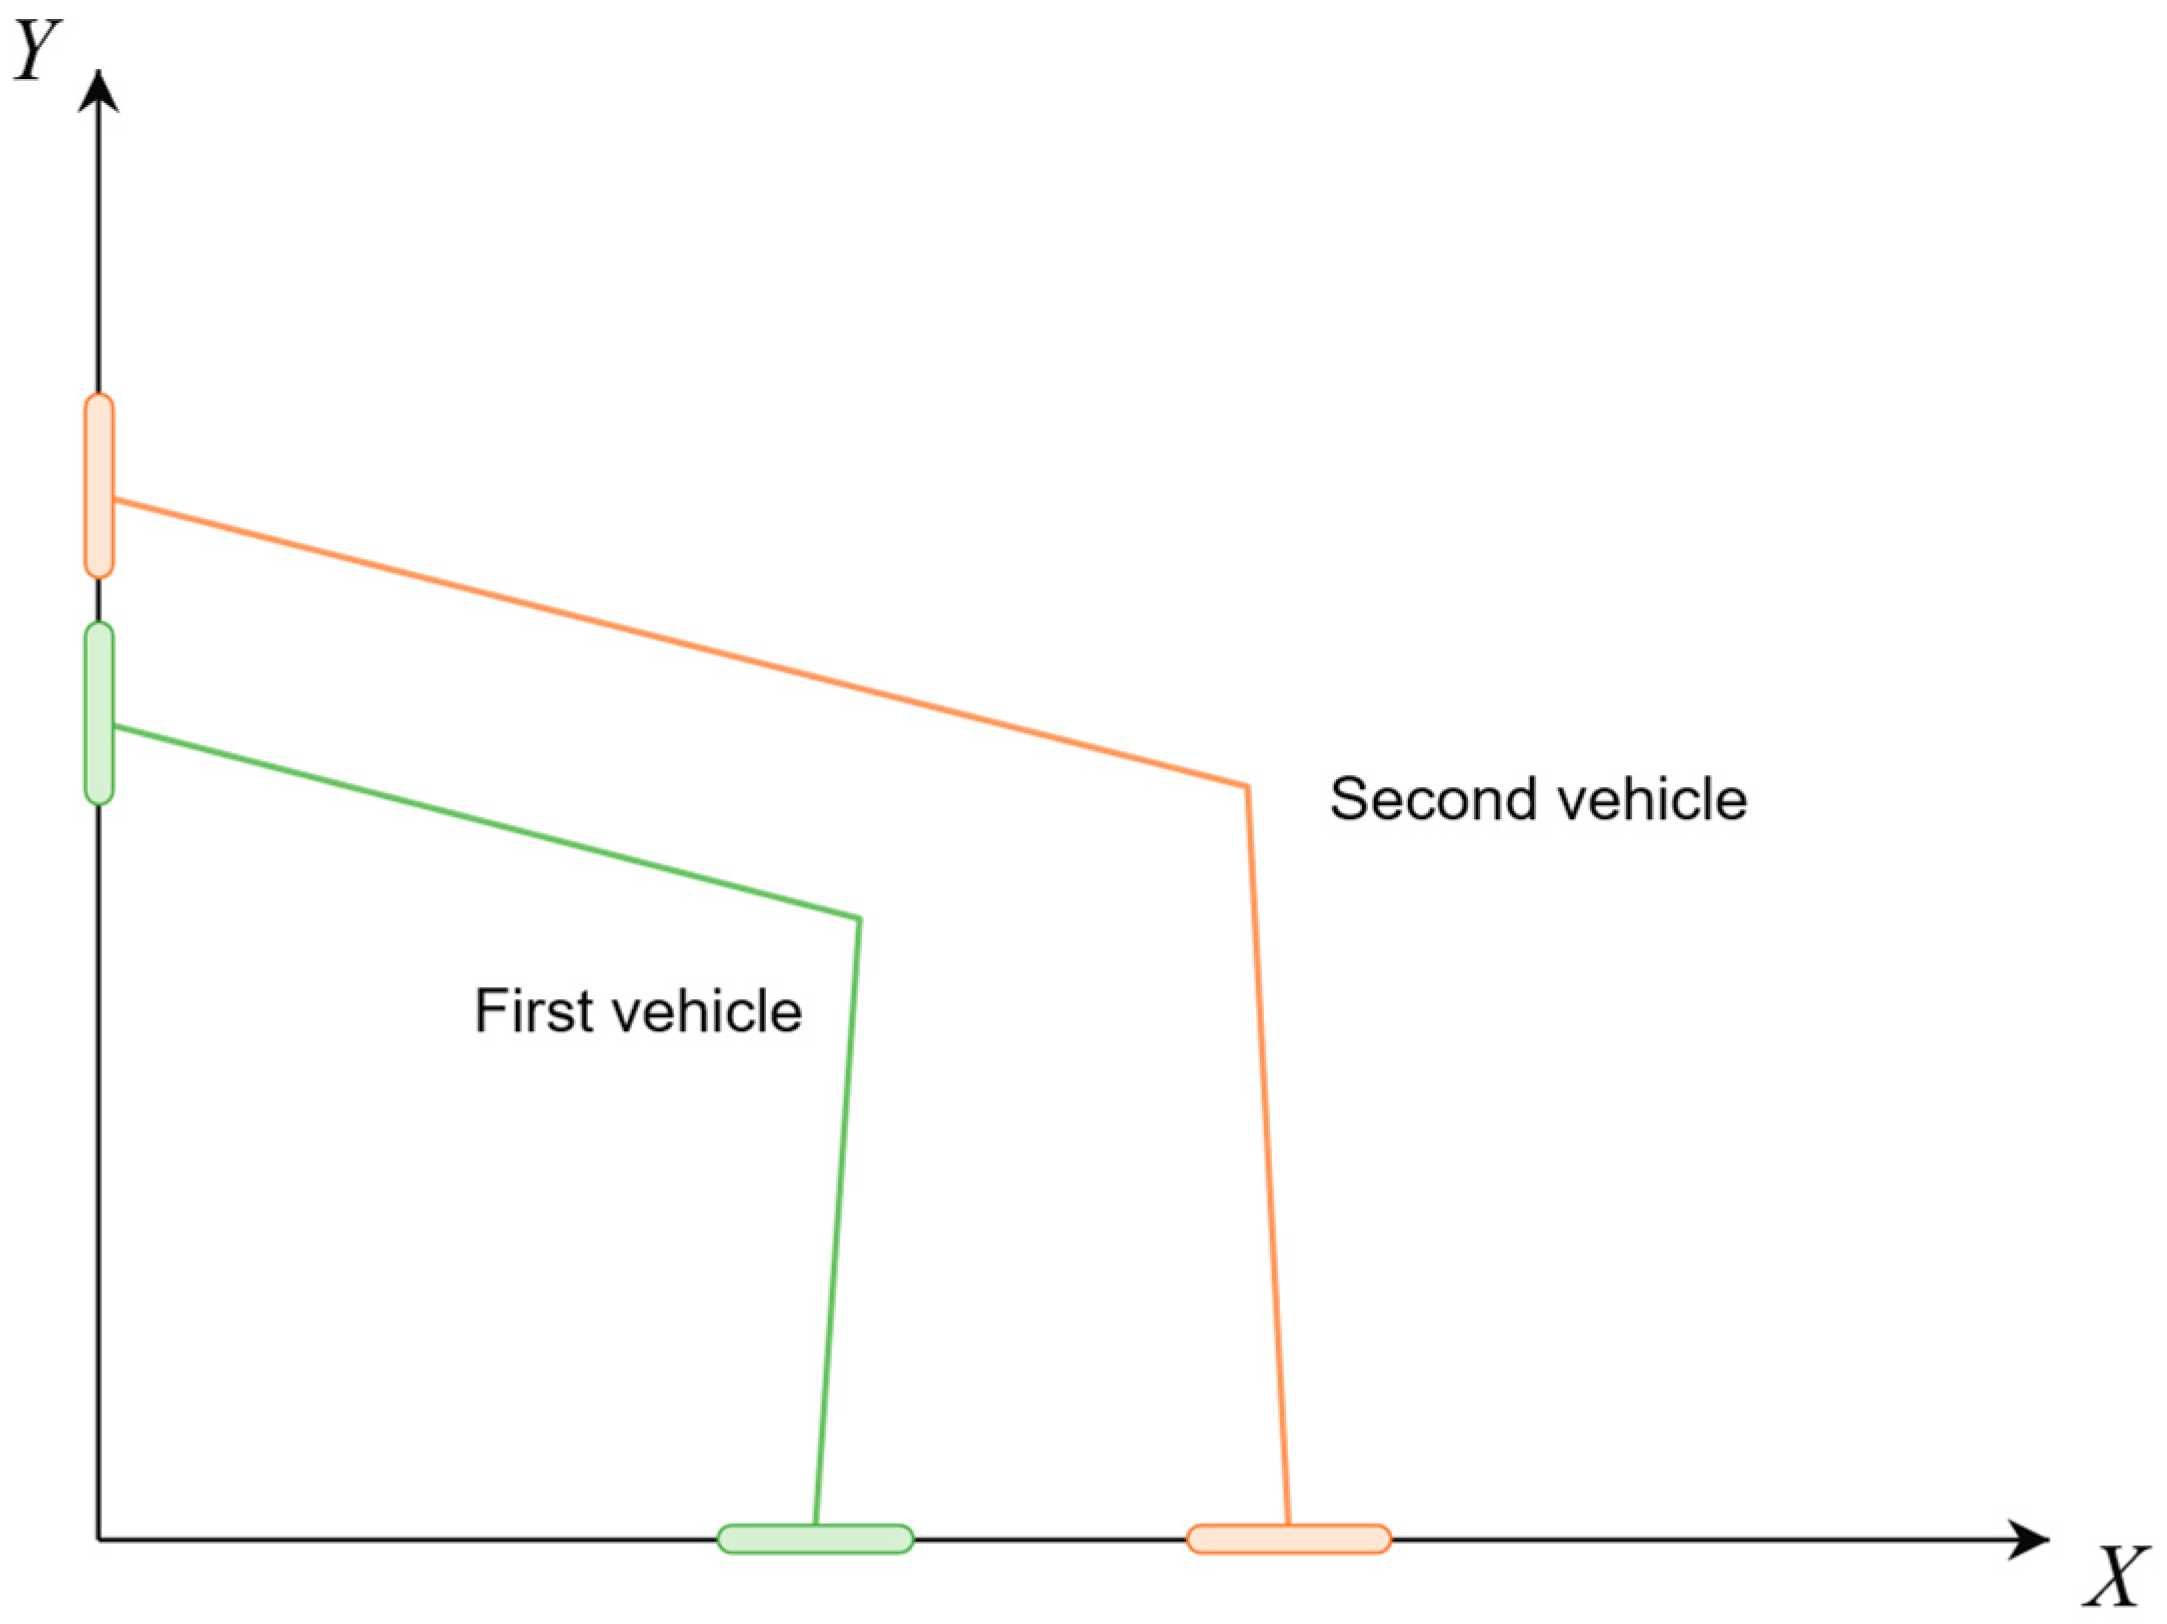
The thick green and orange lines in Figure 6 represent the projections of the two vehicle safety envelopes on the X and Y axes. To avoid a collision, the projections of the two vehicles must not overlap simultaneously on both axes.
Figure 6.
Safety-envelope projections of the two vehicles.
At each prediction time Tp, the safety envelopes of the ego vehicle and the interacting vehicle are projected onto the X- and Y-axes. The projection-separation variables SX(Tp) and SY(Tp) are defined as
Here, LX(Tp) and LY(Tp) are the total ranges occupied by the two vehicle envelopes on the corresponding coordinate axes. They are calculated as
Here, X(Tp) = {XB1,XC1,XD1,XE1,XB2,XC2,XD2,XE2} and Y(Tp) = {YB1,YC1,YD1,YE1,YB2,YC2,YD2,YE2}.
The individual projection lengths of vehicle 1 and vehicle 2 are
where X1 = {XB1,XC1,XD1,XE1}, Y1 = {YB1,YC1,YD1,YE1}, X2 = {XB2,XC2,XD2,XE2}, and Y2 = {YB2,YC2,YD2,YE2}.
Substituting the equations above into Equation (12) gives:
A positive separation on either coordinate axis indicates that the two safety envelopes do not overlap. The vehicles are therefore considered free from a potential spatial conflict when
SX(Tp) > 0 ∨ SY(Tp) > 0
A potential conflict is identified when both projection separations are non-positive:
SX(Tp) ≤ 0 ∧ SY(Tp) ≤ 0
Equation (17) provides a deliberately conservative test for potential conflicts. At oblique headings, separated envelopes may still have overlapping projections on both axes. Emergency braking is triggered when a potential conflict is identified and Dconf ≤ Dstop.
The geometric quantities used to calculate SX(Tp) and SY(Tp) are illustrated in Figure 7.
Figure 7.
Two-vehicle conflict detection model.
The ego vehicle and the interacting vehicle may follow different reference paths. Let sj denote the longitudinal path coordinate of vehicle j, where j = e denotes the ego vehicle and j = i denotes the interacting vehicle. Let Tp denote the prediction time measured from the current decision instant. Assuming constant longitudinal acceleration over the prediction interval, the predicted displacement is
Let rj(s) = [xj(s),yj(s)]T represent the reference path of vehicle j parameterized by longitudinal path distance s. The formulation treats this path as a given geometric input representing the maneuver being evaluated. In the roundabout scenario, the assumed paths correspond to the ego vehicle circulating within the roundabout and the interacting vehicle approaching and merging into the circulating lane. The reference path specifies the assumed route, whereas the received V2X messages provide the vehicle state used for motion prediction. Given the reference path and initial longitudinal state, the predicted vehicle position is obtained as
pj(Tp) = rj[sj,0+Δsj(Tp)]
The predicted heading is determined from the local direction of the selected reference path. Consequently, the predicted position and heading are conditional on the vehicle continuing along that path over the prediction horizon.
For the interacting vehicle, Equation (1) compensates the received longitudinal state for communication delay. The compensated state then initializes the motion prediction along the assumed reference path:
Substituting Equation (20) into Equations (18) and (19) gives the predicted interacting-vehicle position:
In the reported tests, the interacting-vehicle reference path was predefined for each scenario.
For the ego vehicle, the current onboard state (se,0,ve,0,ae,0) is used directly. At each prediction time, the predicted positions and headings are substituted into the safety-envelope model. A potential conflict is identified when the envelope projections overlap simultaneously on both coordinate axes.
The earliest predicted vehicle positions satisfying SX(Tp) ≤ 0 and SY(Tp) ≤ 0 define the predicted conflict region. Dconf is the remaining path distance from the current ego-vehicle position to this region.
4.3. Optimization of the NOP Cruise Speed Control Decision Function
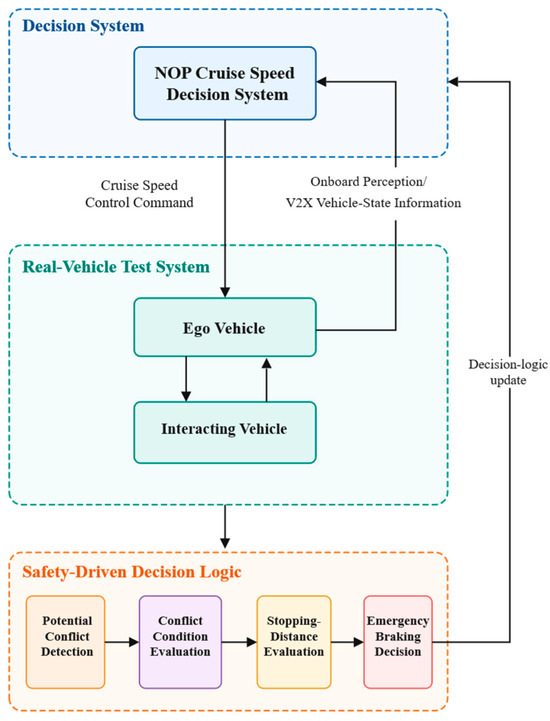
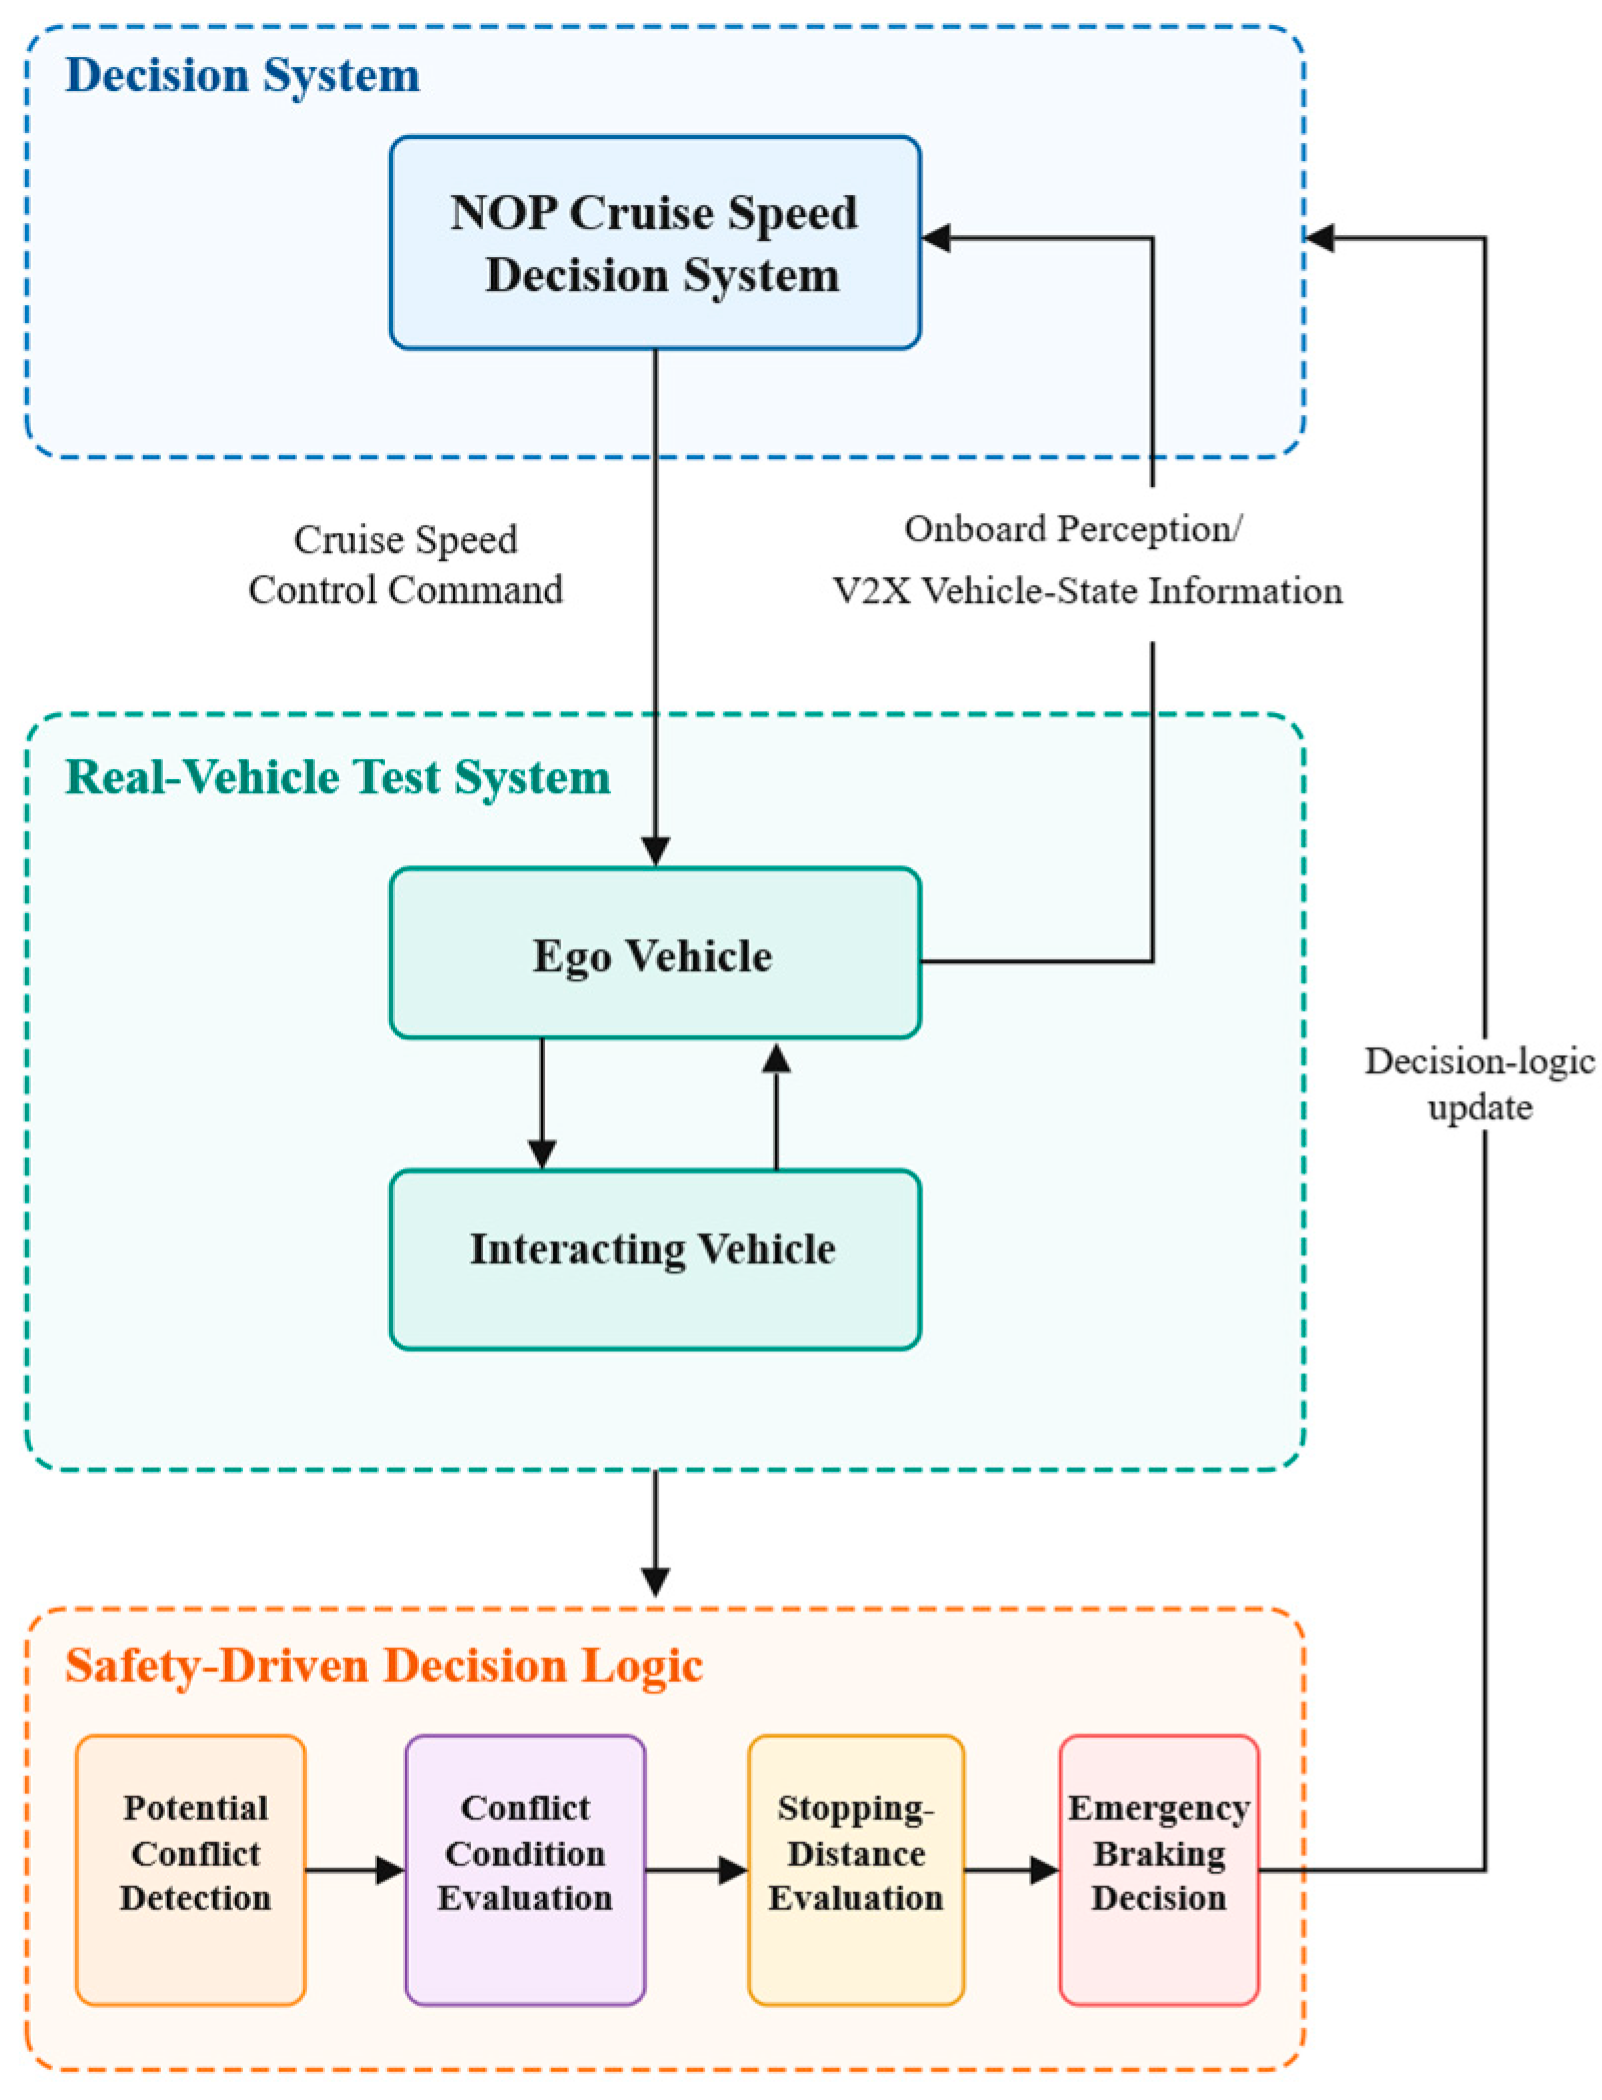
The NOP cruise speed control decision function is optimized according to the safety goals derived from the preceding unsafe control action analysis. During vehicle operation, the states of the ego vehicle and the interacting vehicle are obtained through onboard perception and V2X communication. These states are then provided to the conflict detection model. The predicted vehicle states and safety envelopes are used to identify potential spatial conflicts.
When a potential conflict is detected, the remaining path distance from the ego vehicle to the predicted conflict region, Dconf is compared with the minimum stopping distance, Dstop. If Dconf ≤ Dstop, the NOP cruise speed control function initiates emergency deceleration. Otherwise, the normal cruise state is maintained. The resulting decision logic is shown in Figure 8.
Figure 8.
Safety-driven decision framework for the NOP cruise speed control function.
5. Real-Vehicle Experimental Validation and Geometric Evaluation
5.1. Experimental Setup and Test Scenarios
Real-vehicle experiments were conducted at the Tsinghua University Suzhou Automotive Science and Technology Park to evaluate the proposed V2X-enabled NOP cruise speed control method. Two Geely Geometry C vehicles were used as the ego vehicle and the interacting vehicle. Both vehicles were equipped with I-VICS onboard units (OBUs) for vehicle-to-vehicle communication.
The OBUs support several wireless communication technologies, including DSRC, LTE-V, and 4G. DSRC was used for vehicle-to-vehicle communication in the experiments. The communication frequency was 10 Hz, and the nominal communication range exceeded 600 m. Each OBU integrated GPS/BeiDou positioning with a positioning accuracy of less than 1 m.
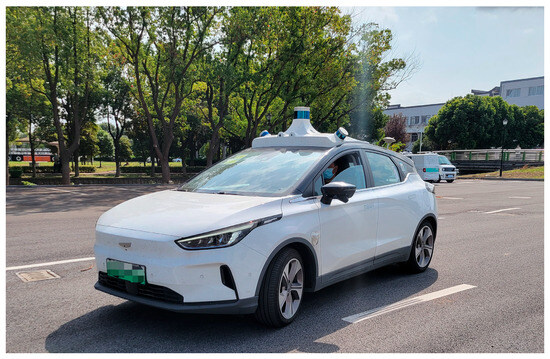
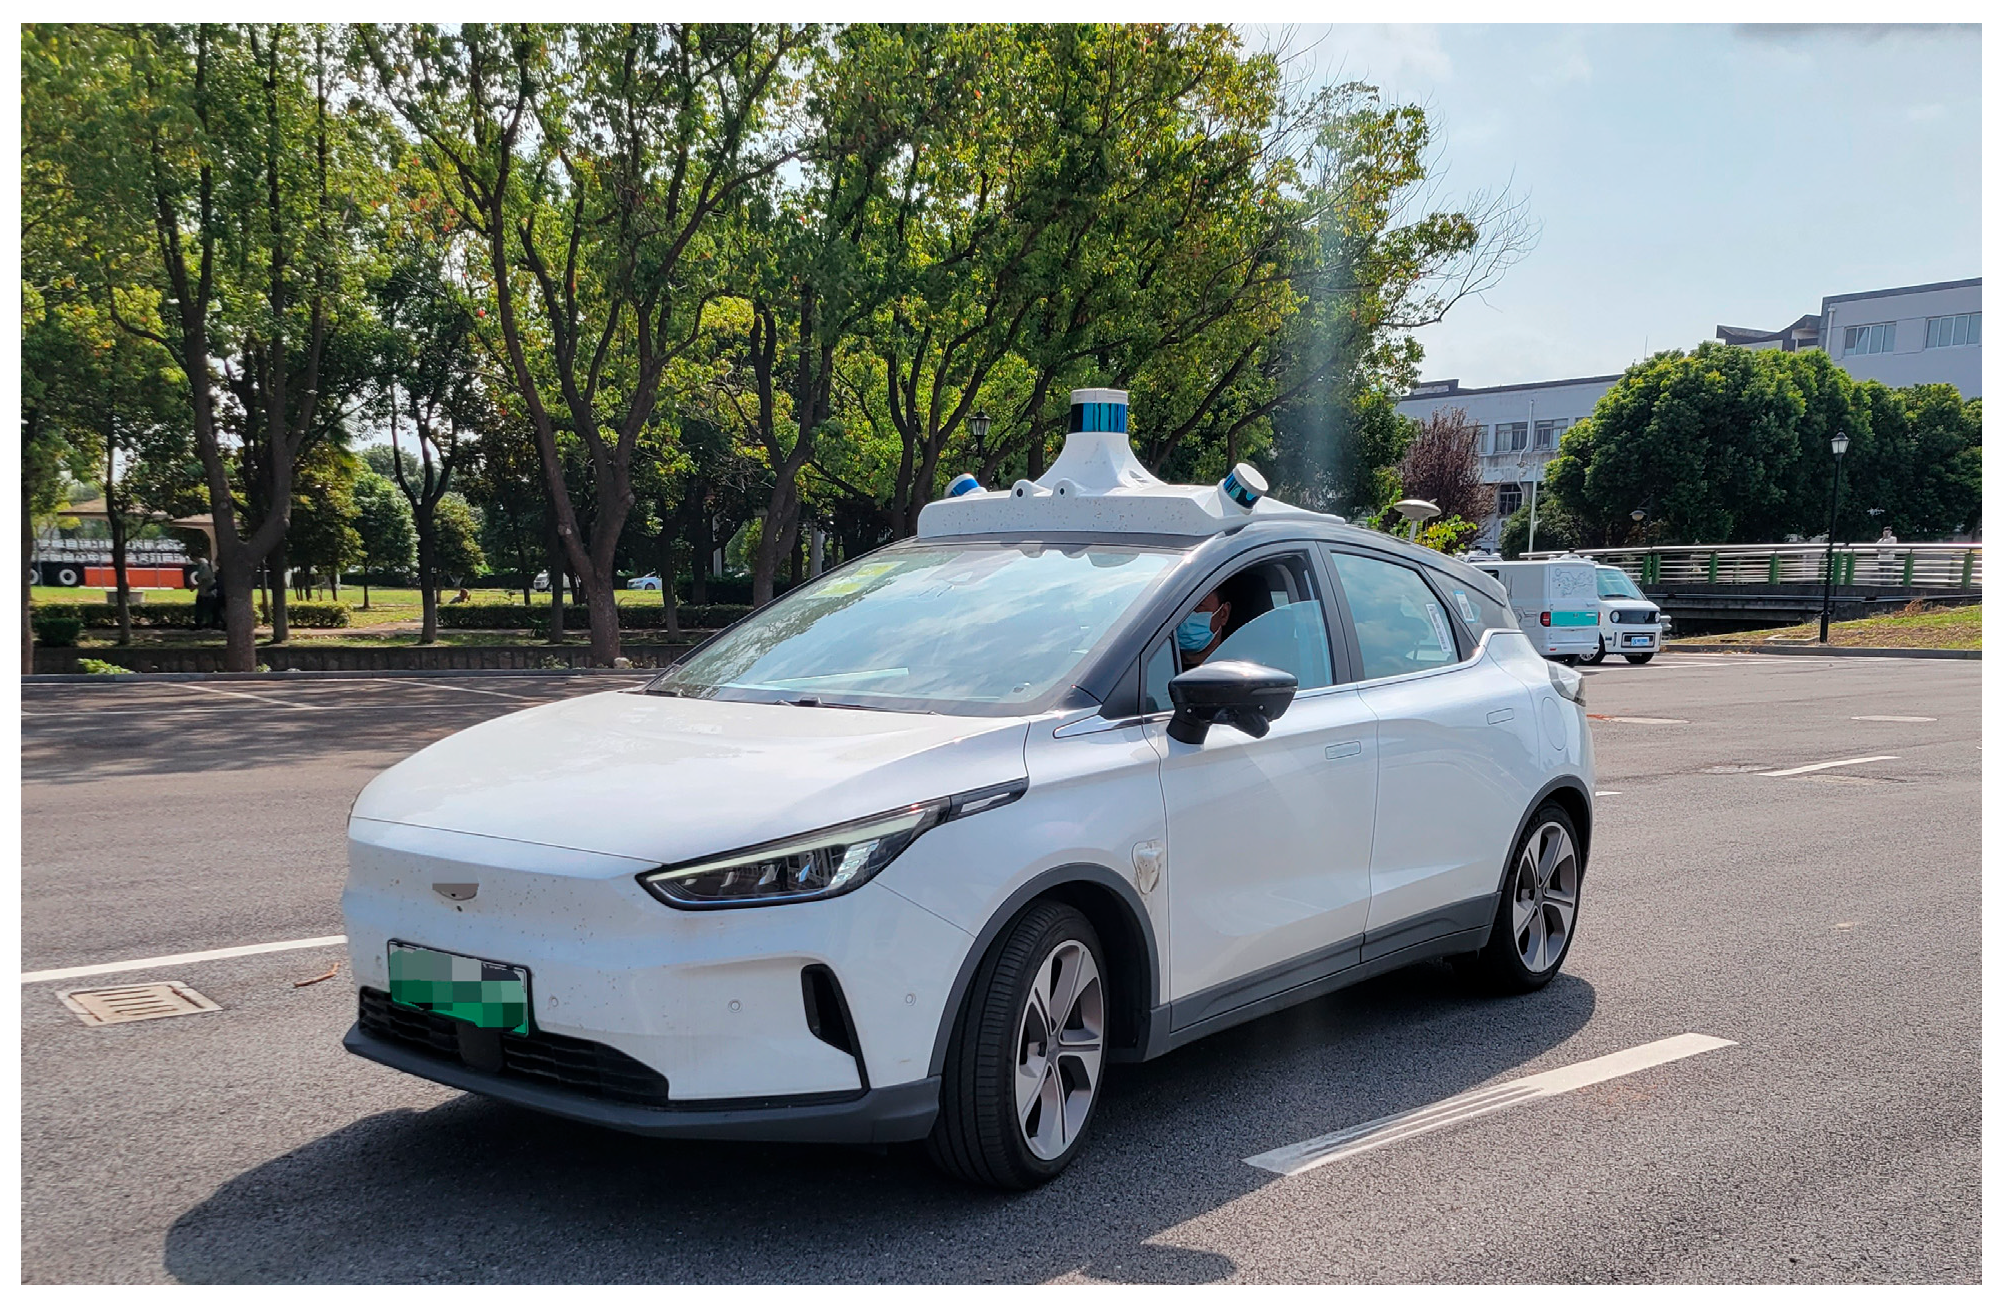
During the experiments, the position, speed, acceleration, heading angle, and timestamp of each vehicle were recorded. These data were used for vehicle-state estimation, conflict detection, and cruise speed control analysis. The onboard perception system consisted of a camera and a LiDAR sensor. Their measurements provided the interacting-vehicle state for the onboard-perception-based baseline strategy. The test vehicle is shown in Figure 9, and the main specifications of the experimental system are summarized in Table 8.
Figure 9.
Test vehicle: Geely Geometry C.
Table 8.
Main specifications of the real-vehicle experimental system.
Two representative traffic conflict scenarios were established at the closed test site: a T-intersection and a roundabout. All experiments were conducted in sunny weather on dry pavement.
In the T-intersection scenario, the ego vehicle traveled straight along the main road. The interacting vehicle approached from a side road and entered the main road, creating a potential conflict between the vehicle paths. In the roundabout scenario, the ego vehicle traveled along the circulating lane, while the interacting vehicle approached the entry and attempted to merge into circulating traffic. The two scenarios represented different road geometries and vehicle-path relationships. They were used to evaluate the proposed method under both straight-path and curved-path interactions.
5.2. Real-Vehicle Validation of the Vehicle Conflict Detection Model
5.2.1. T-Intersection Scenario
In the T-intersection scenario, the ego vehicle traveled straight along the main road, while the interacting vehicle entered from a side road. Potential-conflict and non-conflict cases were designed to determine whether the proposed model could distinguish different interactions under the same road geometry.
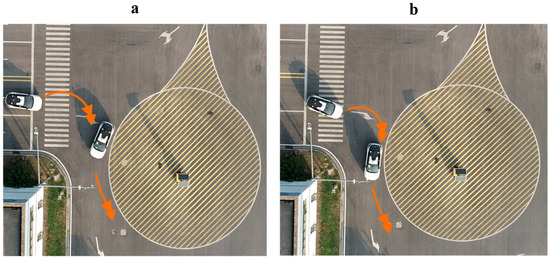
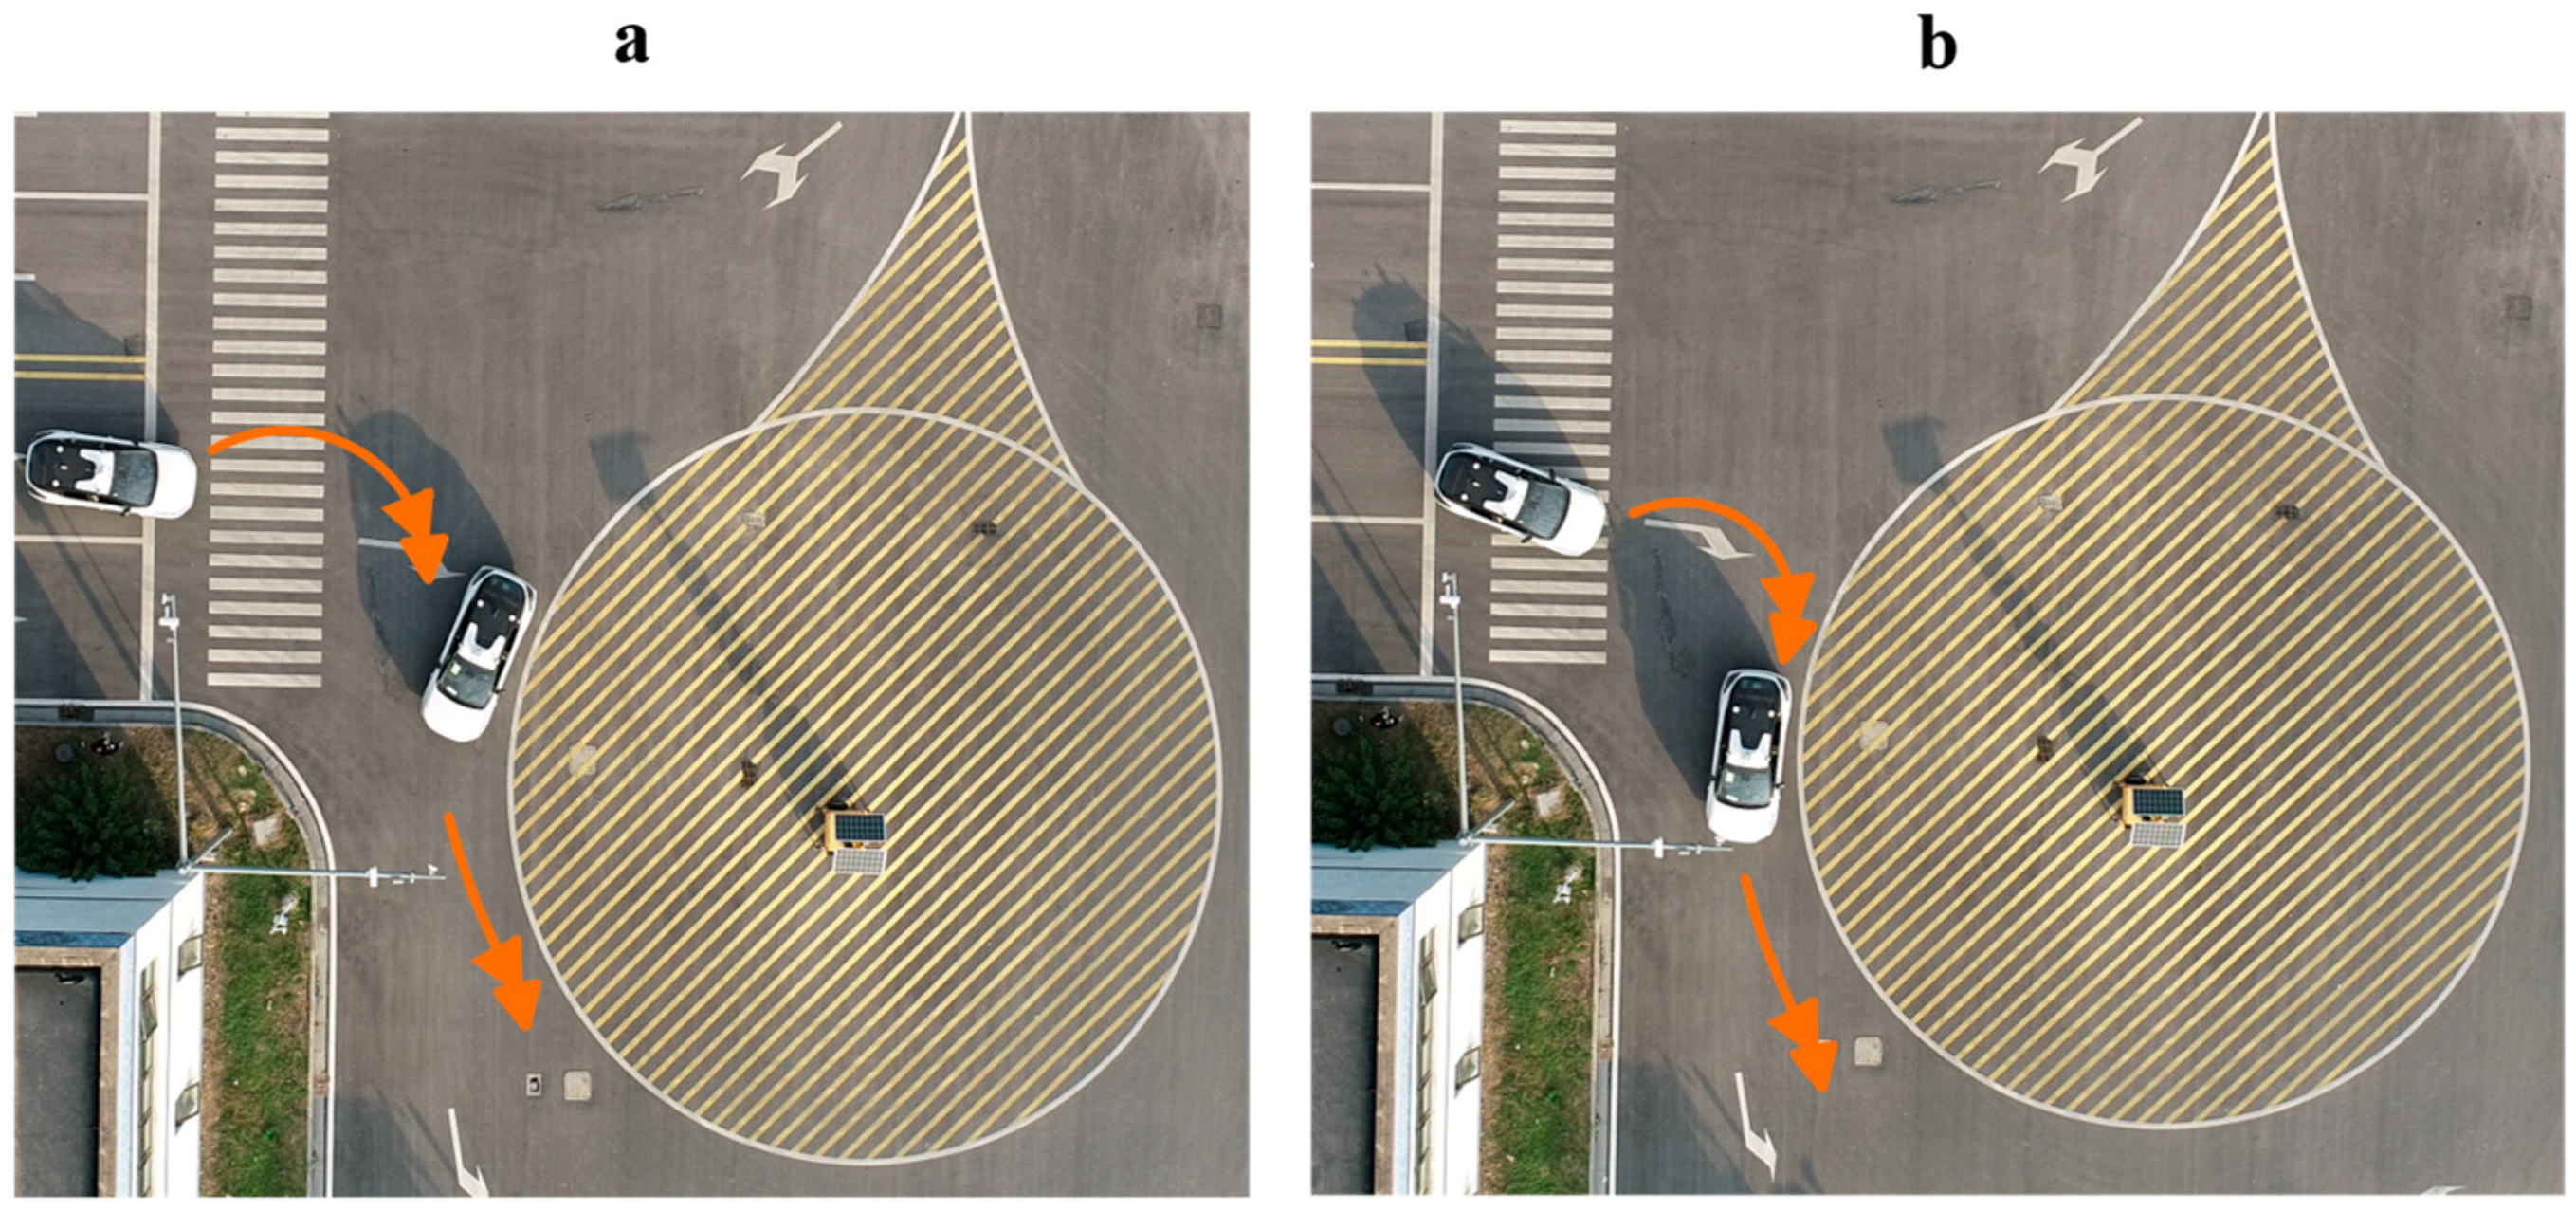
In the potential-conflict case, the ego vehicle traveled at approximately 35 km/h, while the interacting vehicle traveled at approximately 30 km/h. At the selected evaluation time, the vehicles were approximately 45 m and 40 m from the common conflict region, respectively. If their current motion states were maintained, their estimated arrival times were approximately 4.63 s and 4.80 s. The resulting temporal separation was approximately 0.17 s. The two vehicles were therefore predicted to approach the conflict region almost simultaneously, indicating a potential conflict.
For comparison, the vehicle speeds were maintained at approximately 35 km/h and 30 km/h in the non-conflict case, but their relative arrival times were changed. At the selected evaluation time, the ego vehicle remained approximately 45 m from the conflict region, whereas the interacting vehicle was approximately 60 m away. Their estimated arrival times were approximately 4.63 s and 7.20 s, giving a temporal separation of approximately 2.57 s. Although both vehicle paths passed through the same geometric conflict region, the vehicles were predicted to occupy it at different times. The interaction was therefore classified as non-conflicting.
Figure 10 shows representative snapshots of the two test cases. In the potential-conflict case, the vehicles approached the common conflict region with a small temporal separation. In the non-conflict case, their arrival times were sufficiently separated despite the same road geometry and vehicle-path relationship.
Figure 10.
Real-vehicle test snapshots in the T-intersection scenario: (a) potential-conflict case and (b) non-conflict case.
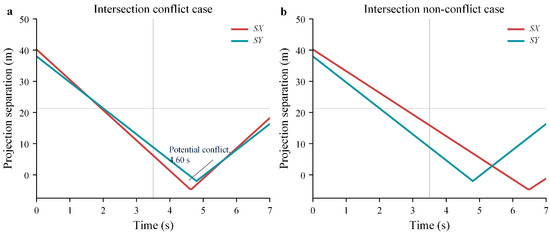
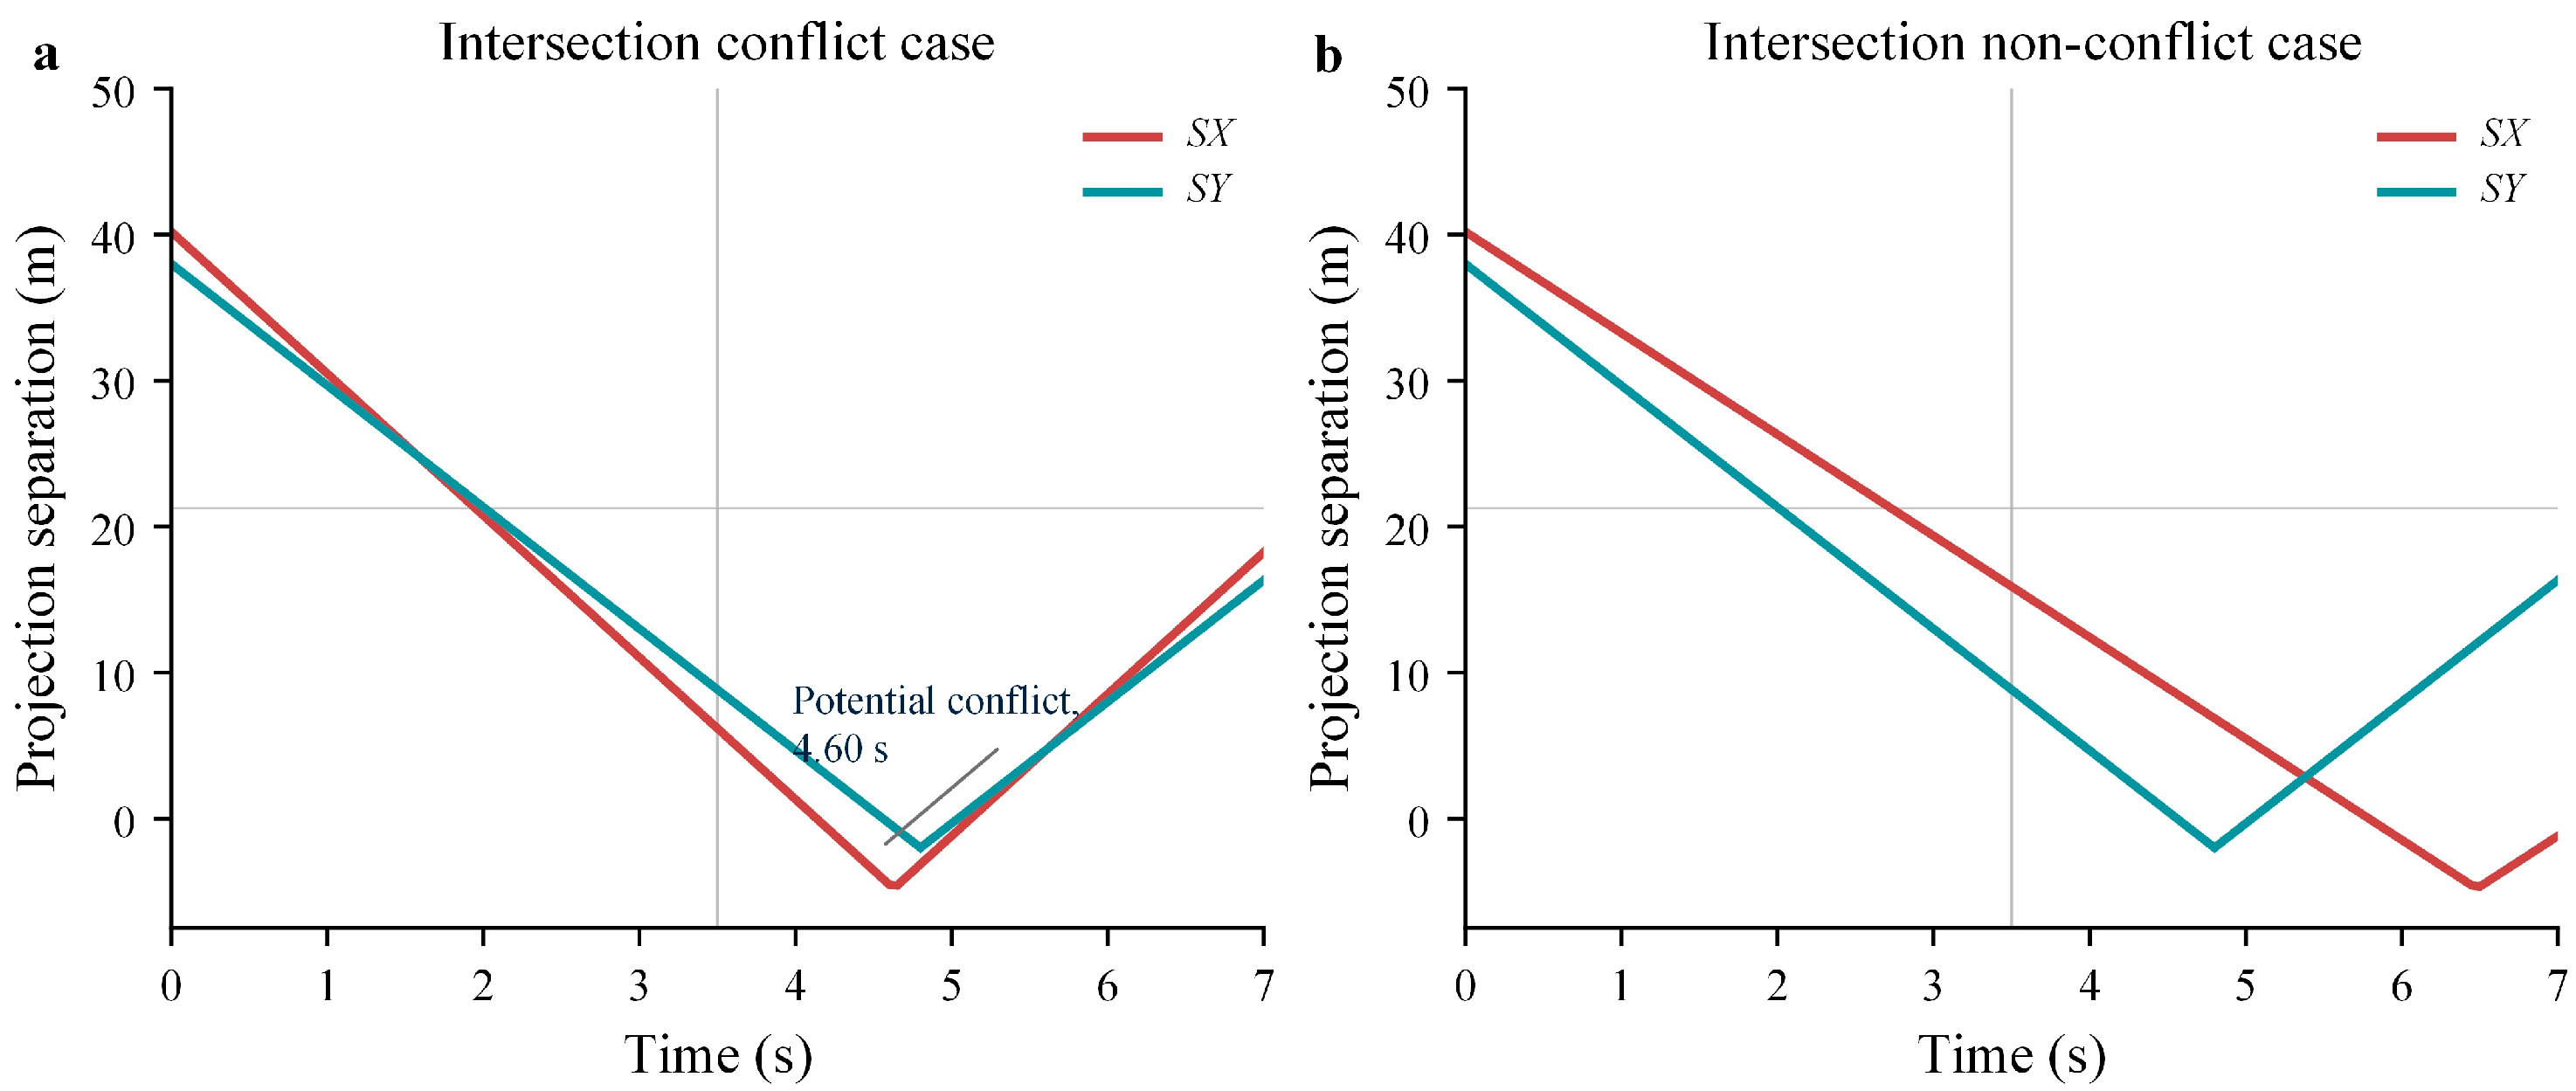
Figure 11 presents the corresponding conflict-detection results. A positive projection separation indicates that a gap remains between the safety-envelope projections along the corresponding coordinate axis. A non-positive value indicates that the projections overlap.
Figure 11.
Real-vehicle conflict detection results in the T-intersection scenario: (a) potential-conflict case and (b) non-conflict case.
In the potential-conflict case, both SX and SY gradually decreased as the vehicles approached the common conflict region. At approximately 4.60 s, the two projection separations became non-positive simultaneously. This result indicates that the predicted safety envelopes overlapped along both coordinate axes. The model therefore identified a potential vehicle conflict.
In the non-conflict case, SX and SY became non-positive at different times and never simultaneously satisfied the overlap condition. Although the vehicle paths passed through the same geometric conflict region, their temporal separation prevented them from occupying the region simultaneously. No potential conflict was therefore identified. These results show that the model considers both the spatial and temporal relationships between vehicles rather than relying only on whether their paths intersect.
5.2.2. Roundabout Scenario
A separate set of real-vehicle experiments was conducted in the roundabout scenario to evaluate the model under curved vehicle paths. The ego vehicle traveled along the circulating lane, while the interacting vehicle approached the roundabout entry and moved toward the merging conflict region. Potential-conflict and non-conflict cases were established by adjusting the motion state of the interacting vehicle. The road geometry and initial spatial relationship between the vehicles remained approximately unchanged.
In the potential-conflict case, the ego vehicle traveled along the circulating lane at approximately 22 km/h. The interacting vehicle approached the roundabout entry at approximately 32 km/h. At the selected evaluation time, the ego vehicle was approximately 28.27 m from the conflict region along its curved reference path. The interacting vehicle was approximately 42.00 m from the region.
Based on their current motion states, the estimated arrival times were approximately 4.63 s and 4.73 s, respectively. The resulting temporal separation was approximately 0.10 s. The vehicles were therefore expected to approach the merging conflict region almost simultaneously if their current motion states were maintained.
In the non-conflict case, both the ego vehicle and the interacting vehicle traveled at approximately 22 km/h. The initial path distances to the conflict region remained approximately 28.27 m and 42.00 m. The estimated arrival times were approximately 4.63 s for the ego vehicle and 6.87 s for the interacting vehicle. This difference produced a temporal separation of approximately 2.24 s. Although the vehicle paths converged at the same geometric conflict region, the vehicles were expected to reach it at different times.
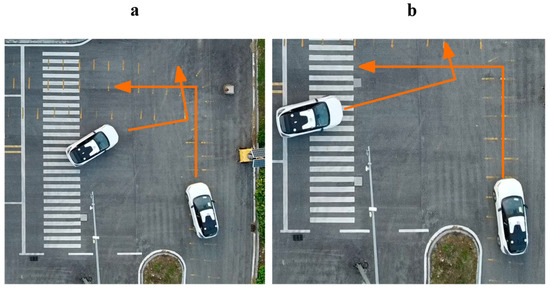
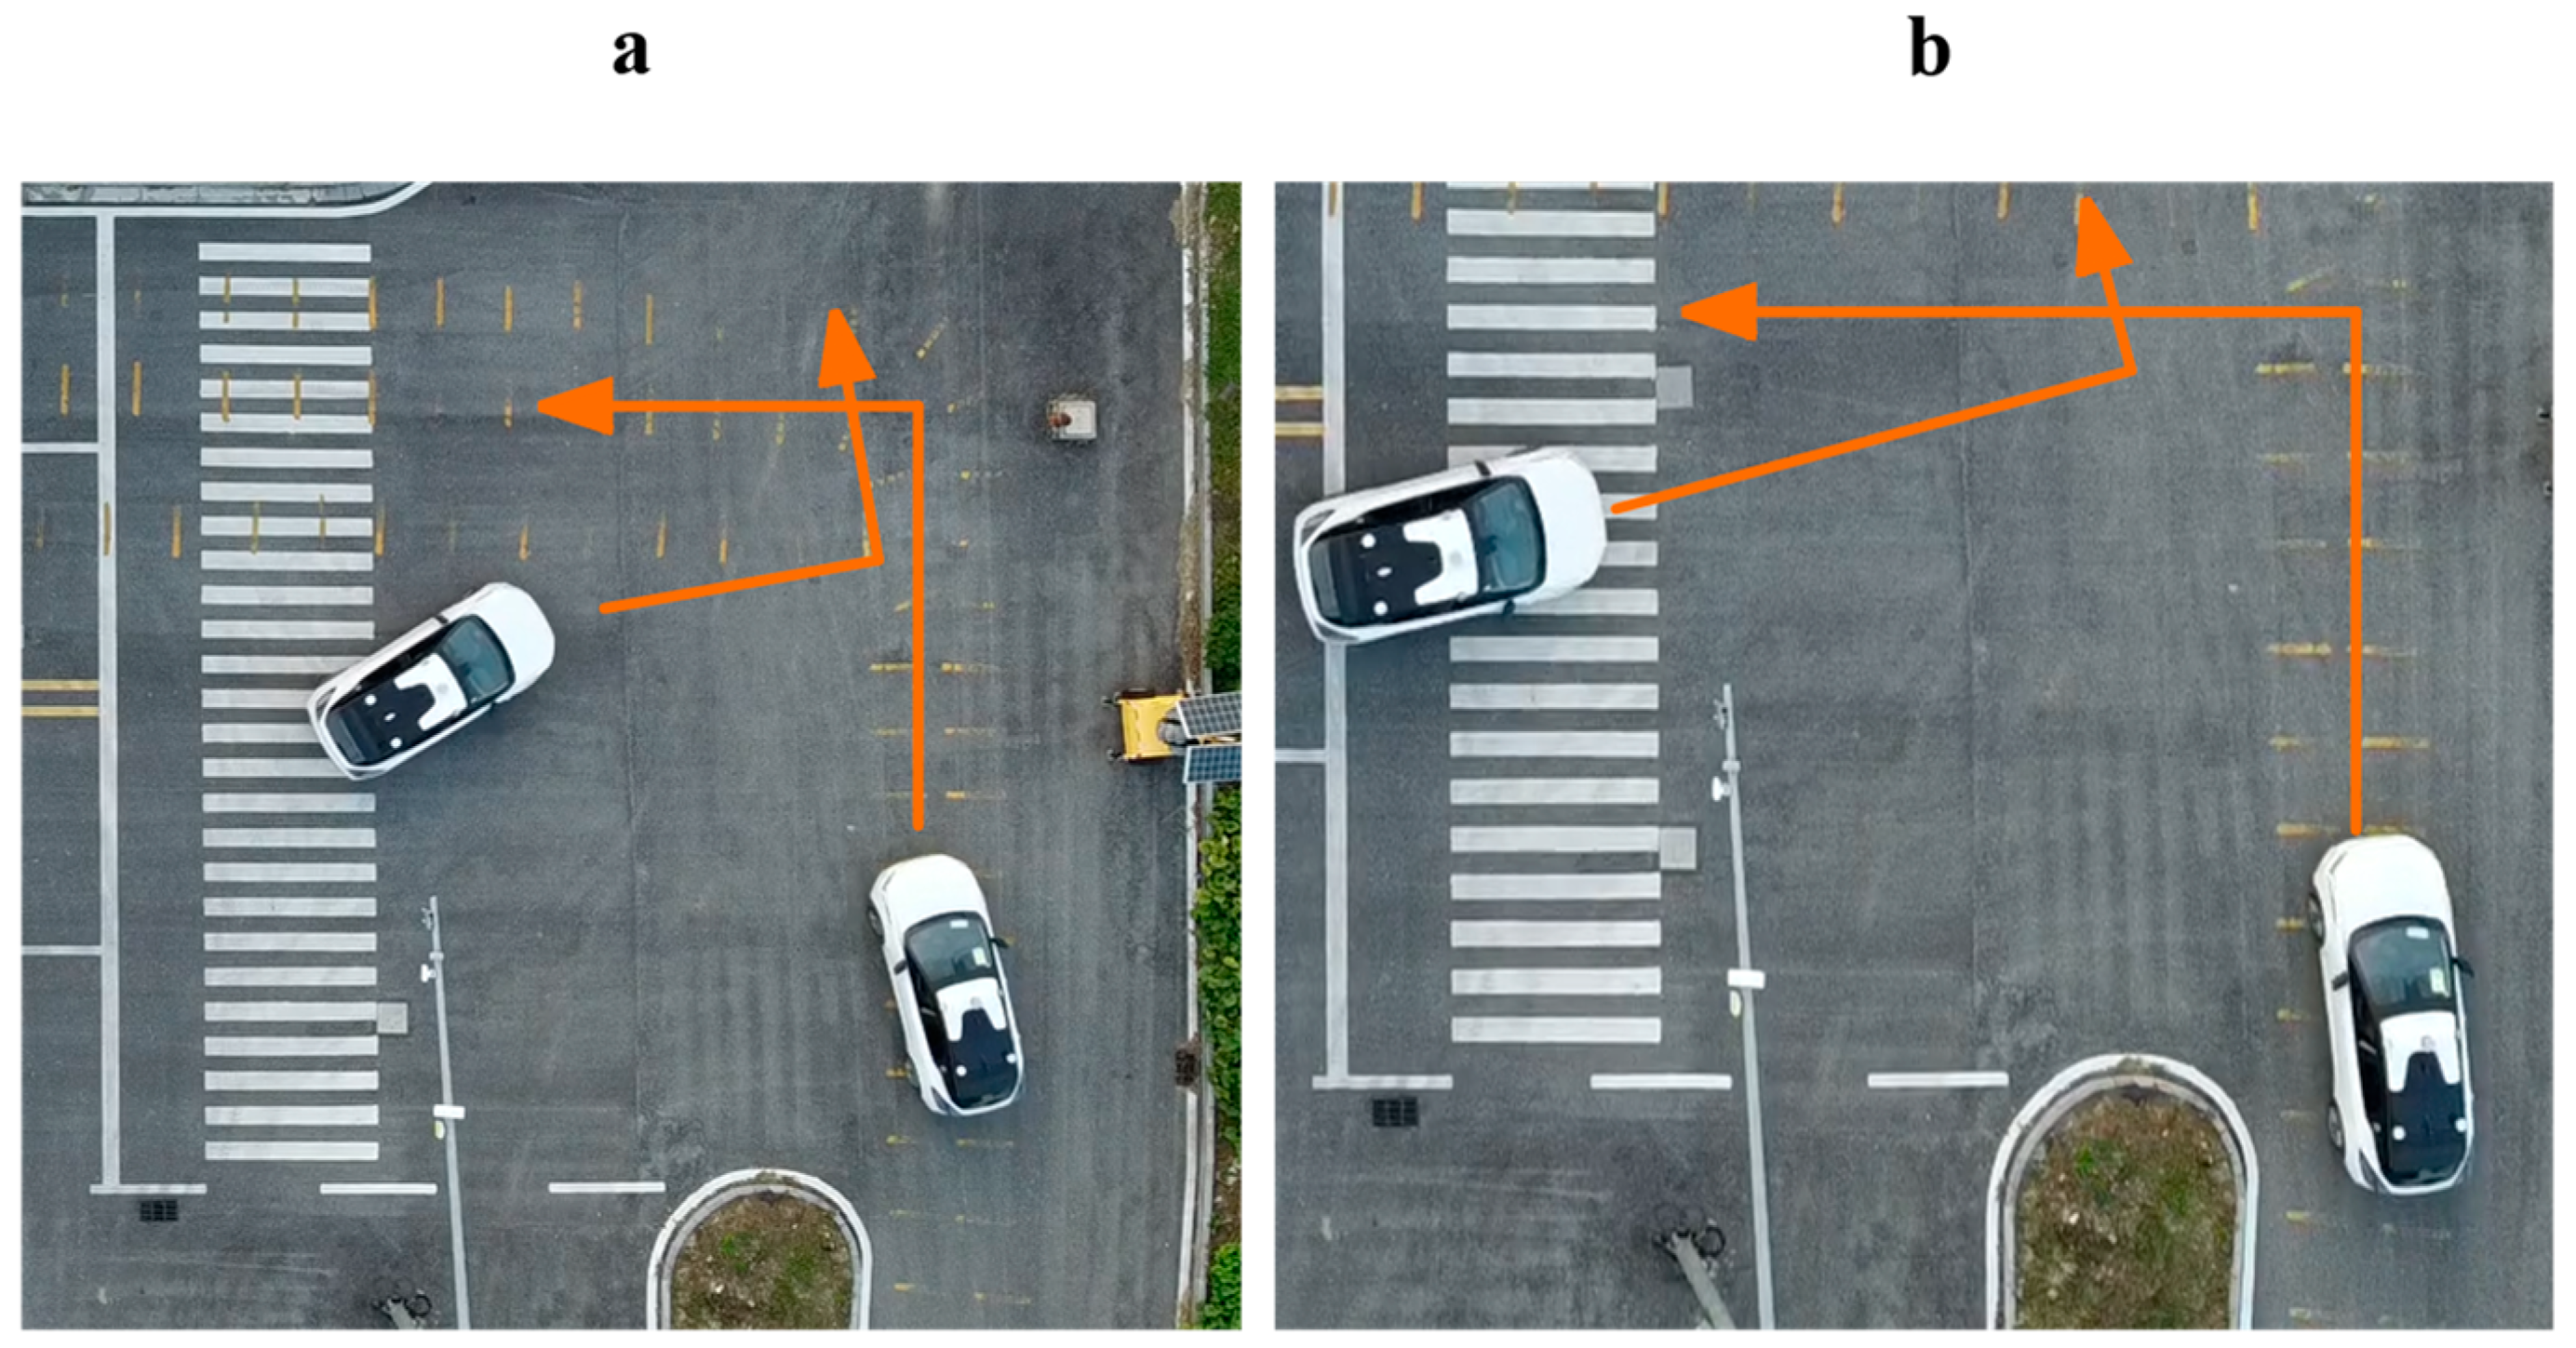
Figure 12 shows representative snapshots of the two roundabout test cases. In both cases, the ego vehicle traveled within the roundabout while the interacting vehicle approached from the entry lane. The cases therefore had the same basic vehicle-path relationship but different relative arrival times at the merging conflict region.
Figure 12.
Representative snapshots of the real-vehicle conflict-detection tests in the roundabout scenario: (a) potential-conflict case and (b) non-conflict case.
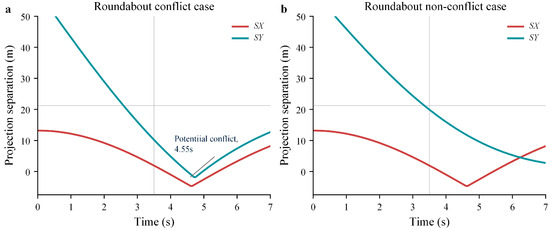
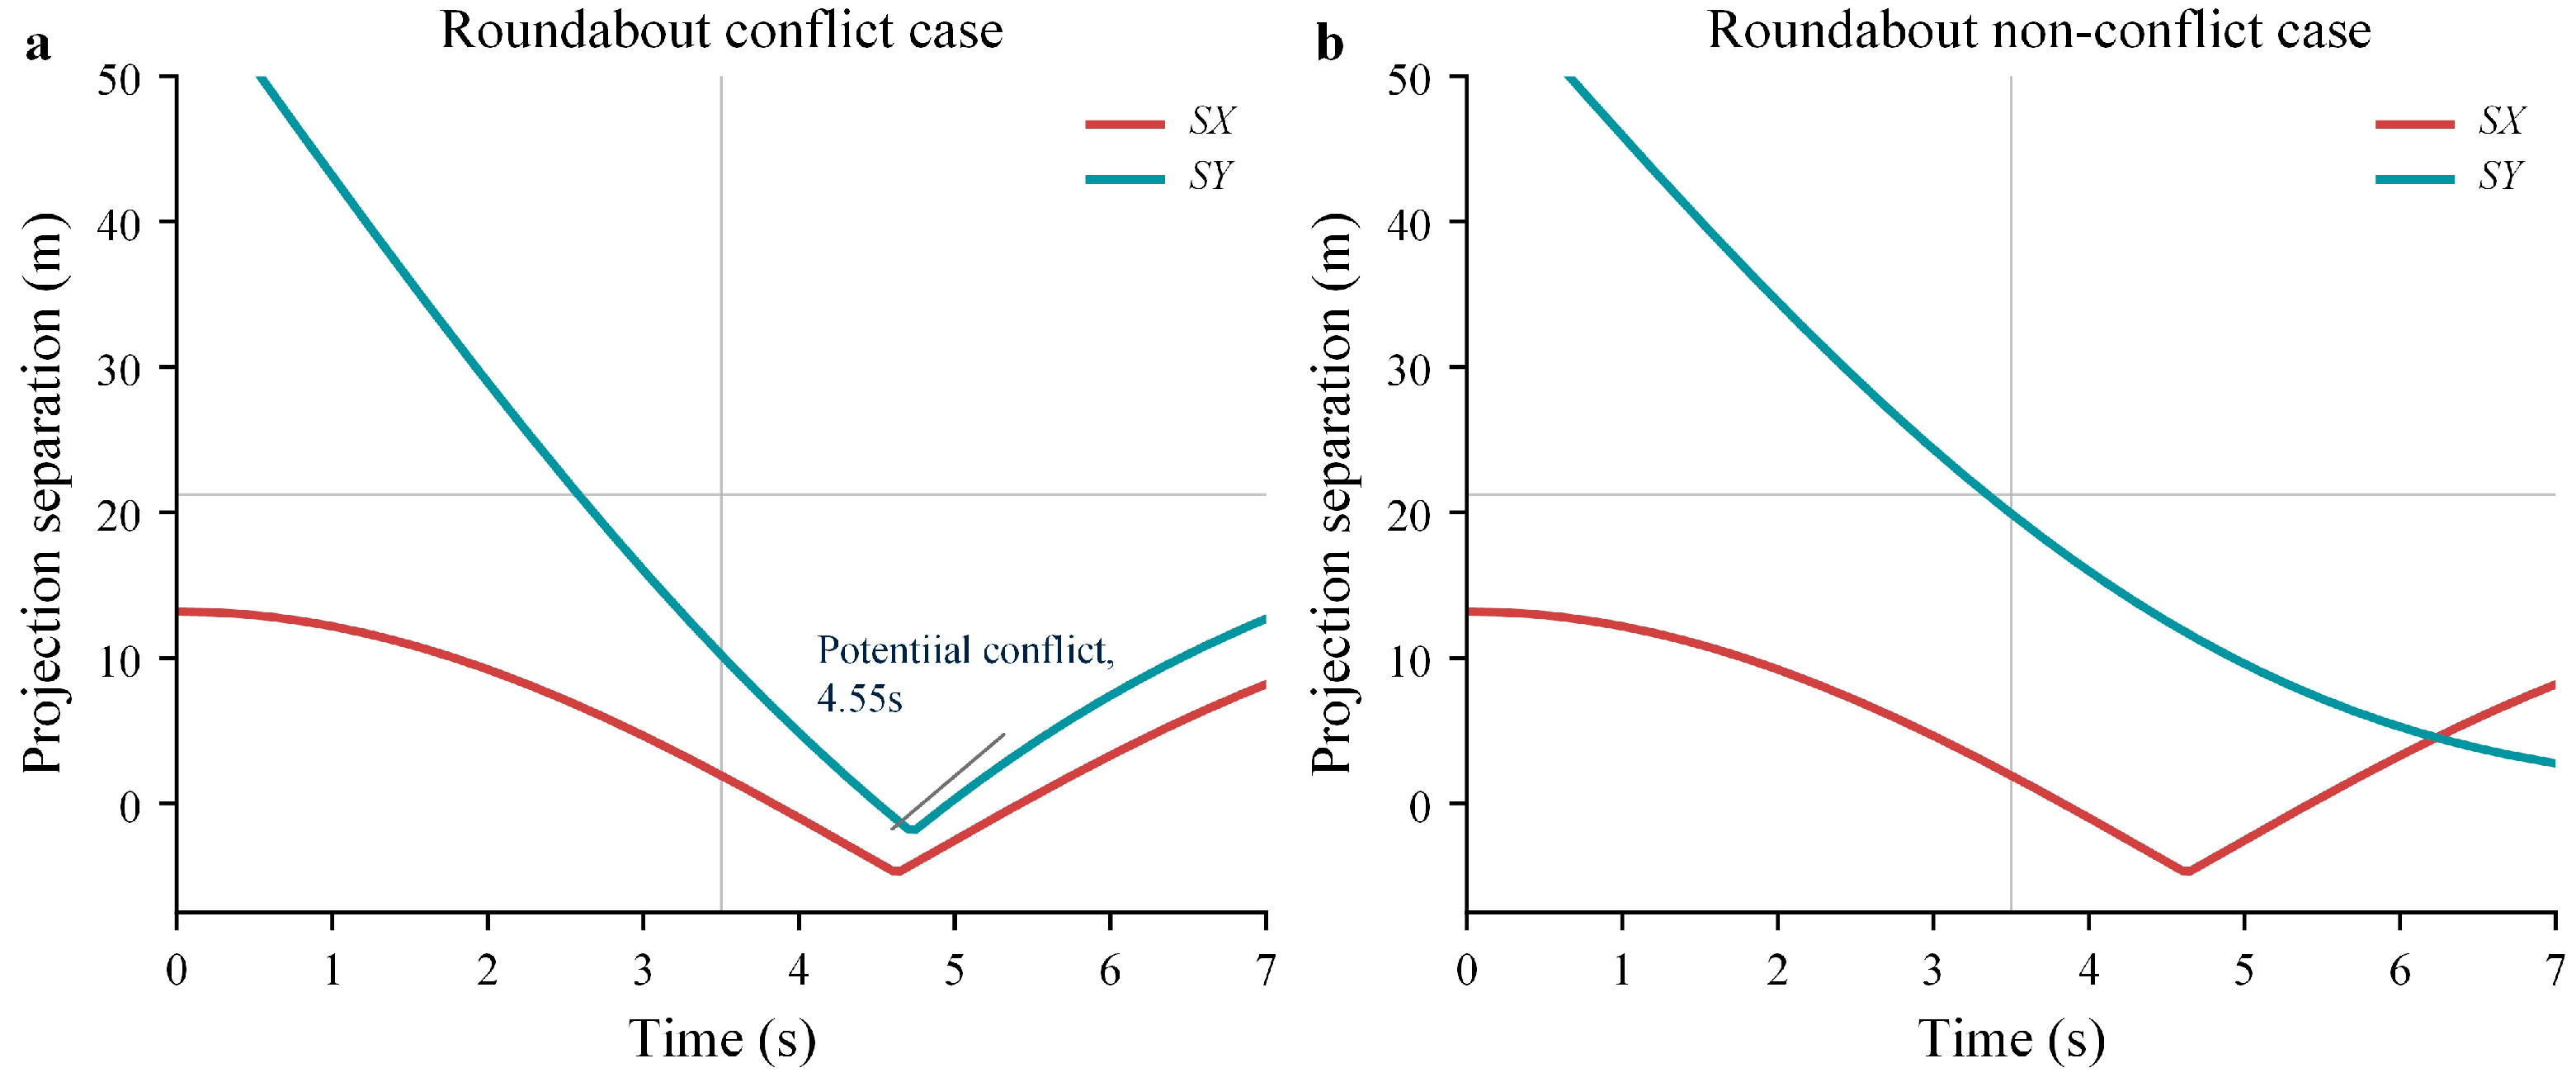
Figure 13 presents the corresponding conflict detection results. In the potential-conflict case, both SX and SY decreased as the vehicles approached the merging conflict region. At approximately 4.55 s, both projection separations became non-positive simultaneously. This result indicates that the predicted safety envelopes overlapped along both coordinate axes. The model therefore identified a potential vehicle conflict.
Figure 13.
Real-vehicle conflict-detection results in the roundabout scenario: (a) potential-conflict case and (b) non-conflict case.
The estimated arrival times provide an intuitive description of the relative timing between the two vehicles. However, the conflict classification is determined by whether the predicted safety envelopes overlap simultaneously on both coordinate axes.
In the non-conflict case, SX became non-positive during part of the interaction, while SY remained positive. The overlap conditions were therefore never satisfied simultaneously, and no potential conflict was identified. Although the vehicles approached the same merging region, their different arrival times prevented simultaneous overlap of the predicted safety envelopes. These results show that the model can distinguish potential-conflict and non-conflict interactions under curved paths and continuously changing vehicle headings.
5.3. Real-Vehicle Validation of the V2X-Enabled Cruise Speed Control Strategy
Comparative real-vehicle experiments were conducted under representative potential-conflict conditions in the T-intersection and roundabout scenarios. Two control strategies were compared under approximately matched vehicle and road conditions.
In the baseline strategy, the NOP system relied on the onboard camera and LiDAR to obtain information about the interacting vehicle. In the proposed strategy, V2X communication provided the interacting-vehicle state before it could be reliably obtained through onboard perception. Vehicle dynamics and braking-control parameters were kept unchanged between the tests. This design allowed the influence of the information source on conflict response and braking time to be evaluated. Each control strategy was evaluated in one run per scenario (n = 1 per strategy per scenario).
For both scenarios, the braking-response time was defined as the first instant when the magnitude of longitudinal deceleration exceeded 1.0 m/s2.
Minimum vehicle-body separation was defined as the smallest distance between the two physical vehicle footprints during each interaction. Vehicle separation at ego-vehicle stop was the distance between these footprints when the ego vehicle came to rest.
5.3.1. T-Intersection Scenario
The potential-conflict condition in the T-intersection scenario was selected for the cruise speed control experiment. The ego vehicle initially traveled at approximately 33 km/h in both tests.
Under the V2X-enabled strategy, information about the interacting vehicle was obtained through V2X communication. This information was included in the conflict assessment before the vehicle could be reliably detected by the onboard camera and LiDAR. A baseline test was conducted under approximately the same initial conditions using the onboard-perception-based strategy.
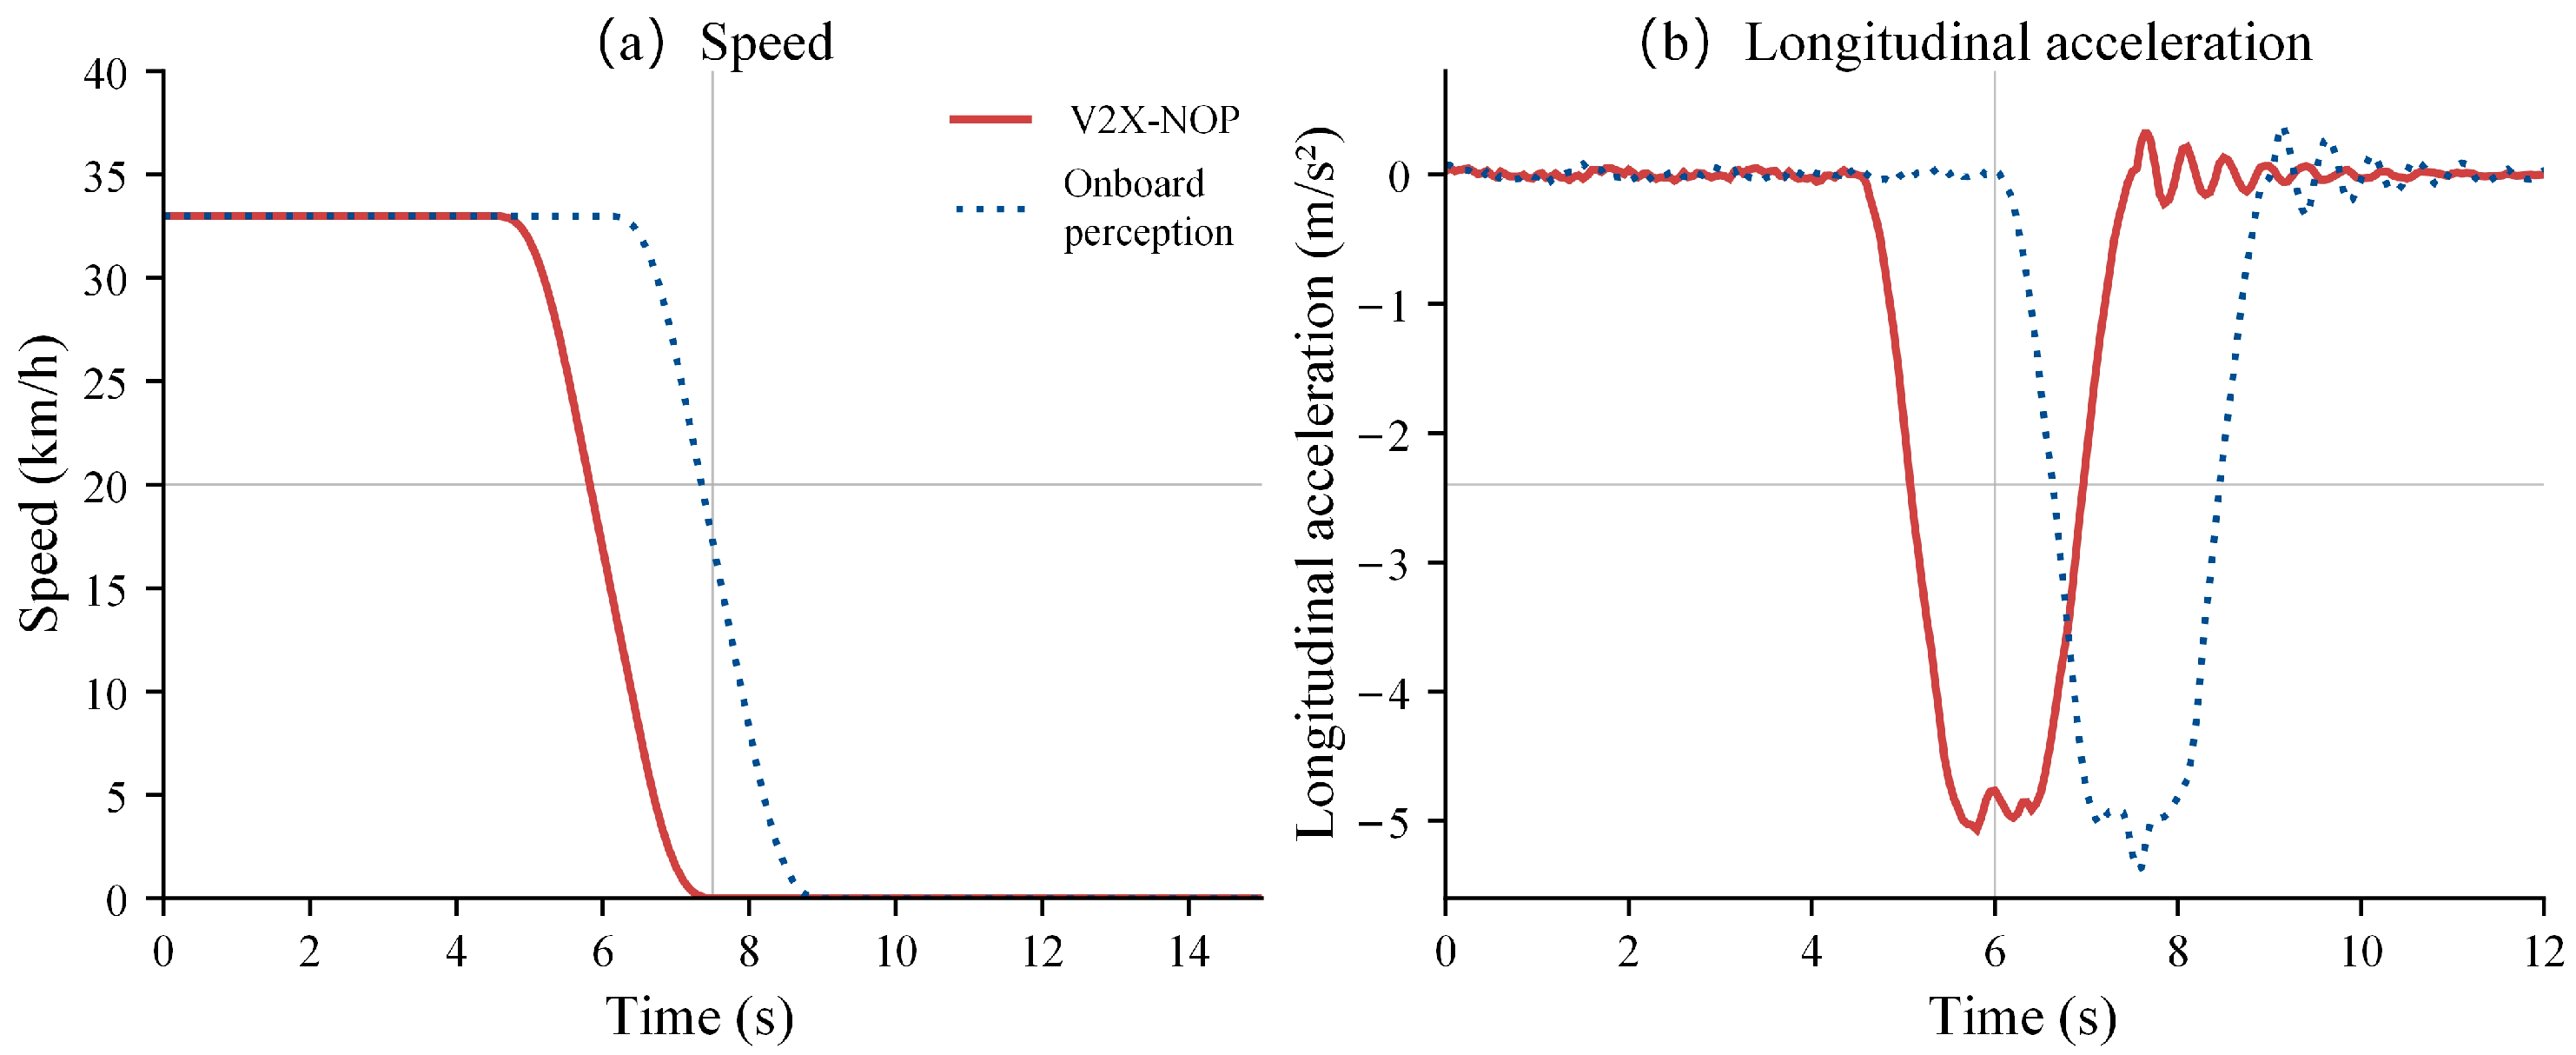
Figure 14 compares the measured ego-vehicle speed and longitudinal acceleration for the two strategies. As shown in Figure 14a, both tests began at an ego-vehicle speed of approximately 33 km/h. With the V2X-enabled strategy, the ego vehicle began decelerating shortly after the potential conflict was identified and stopped earlier than in the baseline test. When only onboard perception was used, the vehicle maintained its initial speed for longer, resulting in a later braking response.
Figure 14.
Real-vehicle cruise speed control results in the T-intersection scenario: (a) ego-vehicle speed and (b) longitudinal acceleration.
Figure 14b shows the corresponding longitudinal acceleration responses. The V2X-enabled strategy crossed the defined braking-response threshold at approximately 4.7 s. The onboard-perception-based strategy crossed the threshold at approximately 6.3 s. The maximum longitudinal deceleration was approximately 5.0 m/s2 in both tests. The timing difference was therefore mainly associated with earlier conflict awareness and braking initiation rather than greater braking intensity. Small acceleration fluctuations were observed during and after braking, consistent with the transient response of the real-vehicle braking process.
Compared with the onboard-perception-based strategy, the V2X-enabled strategy advanced the braking response by approximately 1.6 s. Despite this timing difference, the two strategies produced similar peak deceleration magnitudes. The earlier availability of interacting-vehicle information provided additional time for conflict assessment and longitudinal control. The results show that V2X information can advance the response of the NOP cruise speed control function in the T-intersection potential-conflict scenario.
5.3.2. Roundabout Scenario
A representative potential-conflict condition in the roundabout scenario was selected for the cruise speed control experiment. In both tests, the ego vehicle traveled along the circulating lane with an initial speed of approximately 30 km/h. The interacting vehicle approached the roundabout entry.
Under the V2X-enabled strategy, the state of the interacting vehicle was obtained through V2X communication and included in the conflict assessment. This occurred before the state could be reliably obtained using only the onboard camera and LiDAR. A baseline test was conducted under approximately the same initial conditions using the onboard-perception-based strategy.
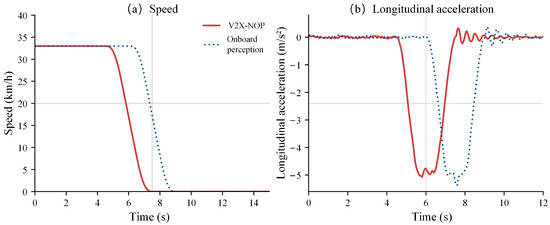
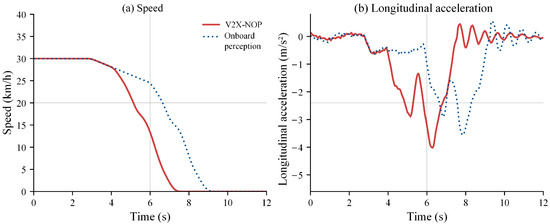
Figure 15 compares the measured ego-vehicle speed and longitudinal acceleration for the two strategies. As shown in Figure 15a, both tests began at an ego-vehicle speed of approximately 30 km/h. With the V2X-enabled strategy, the ego vehicle reduced its speed earlier and stopped at approximately 7.2 s. When only onboard perception was used, the ego vehicle maintained a higher speed for longer and stopped at approximately 8.9 s. V2X information therefore provided additional time for the NOP cruise speed control function to respond to the interacting vehicle.
Figure 15.
Real-vehicle cruise speed control results in the roundabout scenario: (a) ego-vehicle speed and (b) longitudinal acceleration.
Figure 15b shows the corresponding longitudinal acceleration responses. In both tests, slight deceleration occurred during the initial approach to the roundabout. This response reflected the normal speed adjustment associated with curved-path driving.
A clear difference appeared during the subsequent conflict-response phase. The V2X-enabled strategy crossed the braking-response threshold at approximately 4.2 s, whereas the onboard-perception-based strategy crossed it at approximately 6.6 s. The peak deceleration magnitudes were approximately 4.0 m/s2 and 3.5 m/s2, respectively. The V2X-enabled strategy therefore advanced the braking response by approximately 2.4 s. The intervals from braking-threshold crossing to a complete stop were approximately 3.0 s for the V2X-enabled strategy and 2.3 s for the onboard-perception-based strategy. This 0.7 s difference accounts for the difference between the 2.4 s advance in braking response and the 1.7 s advance in stopping time.
The roundabout experiment showed greater variation in the longitudinal acceleration profile than the T-intersection experiment. This difference arose because the ego vehicle traveled along a curved path and continuously adjusted its motion while approaching the merging conflict region. Nevertheless, the V2X-enabled strategy provided earlier information about the interacting vehicle and initiated braking earlier. The results indicate that the method can also operate under roundabout interactions involving curved paths.
5.4. Comparative Analysis
The T-intersection and roundabout experiments produced a consistent difference in braking-response time between the two strategies. In the T-intersection scenario, the V2X-enabled strategy initiated braking approximately 1.6 s earlier than the onboard-perception-based strategy. In the roundabout scenario, the corresponding difference was approximately 2.4 s. Although the scenarios involved different road geometries and vehicle-path relationships, V2X communication consistently provided earlier information about the potential conflict.
The longitudinal acceleration responses indicate that the earlier response was not primarily achieved by applying greater braking intensity. Instead, earlier availability of the interacting-vehicle state allowed the NOP cruise speed control function to begin deceleration at an earlier stage of the potential conflict. The results from both the straight-path T-intersection interaction and the curved-path roundabout interaction support the use of the proposed method under different traffic conflict geometries.
Table 9 summarizes the minimum vehicle-body separation and vehicle separation at ego-vehicle stop for both strategies.
Table 9.
Vehicle-body separation in the T-intersection and roundabout tests.
In the T-intersection test, the onboard-perception baseline reached a minimum vehicle-body separation of 0.52 m, representing a near-collision condition. The possibility of such a close approach was anticipated, and the test was conducted at a closed test site with a safety driver present. No additional braking was applied during the reported baseline run. The V2X-enabled strategy maintained a minimum separation of 7.56 m, an increase of 7.04 m, while advancing the braking response by approximately 1.6 s with a similar peak deceleration magnitude. In the roundabout test, minimum separation increased by 5.21 m. Earlier braking was therefore accompanied by greater spatial clearance in both reported tests.
Vehicle separation at ego-vehicle stop was larger with the V2X-enabled strategy at the T-intersection but smaller in the roundabout. This distance was measured at different stopping times and does not describe the closest approach during the interaction. The comparison therefore uses minimum separation to assess the spatial clearance maintained during each test.
Overall, the real-vehicle experiments indicate that the V2X-enabled method can increase the time available for conflict response under the tested conditions. However, the comparison evaluates the complete V2X-enabled strategy and does not isolate the independent contribution of the communication-delay compensation in Equation (1). The effects of packet loss and degraded V2X communication were also not evaluated. Future work will evaluate delay compensation separately and test the controller under degraded communication to improve its handling of missing or stale messages.
5.5. Geometric Evaluation of the Conflict Criterion
A static geometric evaluation was conducted to quantify the conservatism of the two-axis projection criterion relative to the separating-axis test (SAT). Both vehicles were represented by rectangular envelopes measuring 4.432 m in length and 1.833 m in width. These dimensions correspond to the body dimensions of the Geely Geometry C vehicles used in the real-vehicle experiments.
The coordinate axes were aligned with the ego vehicle, and the interacting vehicle was rotated according to the relative heading angle. A total of 500,000 relative envelope-center positions were sampled uniformly within [−10, 10] m along both coordinate axes. The samples were distributed approximately equally across seven relative heading angles from 0° to 90° in 15° increments. For the tested dimensions and headings, the sampling box contains the complete region in which the two-axis projection criterion can indicate overlapping projections, together with surrounding non-overlapping configurations.
SAT was used as the reference for determining whether the rectangular envelopes overlapped. False positives (FPs) were configurations in which SAT identified non-overlapping envelopes but the two-axis projection criterion indicated a potential conflict. True negatives (TNs) were configurations classified as non-conflicting by both methods. The geometric false-positive rate was calculated as:
Table 10 reports the results for all tested heading angles. The highest sampled false-positive rate was 4.44% at 45°, while the pooled rate across all seven angles was 1.85%. No false positives were observed at 0° or 90°. These results quantify the additional conservatism introduced by using only the two coordinate-axis projections. The reported rates are conditional on the specified envelope dimensions, sampling domain, and angle allocation and should not be interpreted as operational false-alarm rates in real traffic.
Table 10.
Geometric false-positive rates of the two-axis projection criterion relative to SAT.
6. Conclusions
This study developed a safety-driven, V2X-enabled cruise speed control method for NOP vehicles in traffic conflict scenarios. STPA was used to identify unsafe control actions, their triggering causes, and the corresponding safety goals of the NOP cruise speed control function. Based on these safety requirements, V2X information was used to extend the effective perception range of the ego vehicle. Communication delay was considered when updating the state of the interacting vehicle. A two-dimensional safety-envelope model was developed to identify potential spatial conflicts. The remaining path distance to the predicted conflict region was then compared with the minimum stopping distance to determine the emergency braking condition.
Real-vehicle experiments were conducted in T-intersection and roundabout scenarios to evaluate the method under different road geometries and vehicle-path relationships. The conflict detection results showed that the safety-envelope model could distinguish potential-conflict and non-conflict interactions based on whether the vehicle projections overlapped simultaneously on both coordinate axes. In the roundabout scenario, the model also identified conflicts while the vehicle headings and reference paths changed continuously. The formulation is therefore not limited to perpendicular or straight-path vehicle interactions.
The cruise speed control experiments showed that V2X information enabled an earlier longitudinal response to potential conflicts. Compared with the onboard-perception-based strategy, the V2X-enabled NOP strategy advanced the braking response by approximately 1.6 s in the T-intersection scenario and 2.4 s in the roundabout scenario. This improvement was mainly associated with the earlier availability of interacting-vehicle information rather than a substantial increase in braking intensity. Under the tested conditions, the V2X-enabled strategy braked earlier and maintained greater minimum vehicle-body separation in both scenarios. Future work will extend the method to interactions involving multiple connected and non-connected road users and evaluate its performance under a wider range of communication and environmental conditions.
Author Contributions
Conceptualization, H.S., C.S. and W.L.; methodology, H.S. and C.S.; software, H.S.; validation, H.S., C.S. and H.L.; formal analysis, H.S. and Y.C.; investigation, H.S., C.S. and H.L.; resources, C.S., S.X. and H.L.; data curation, H.S. and H.L.; writing—original draft preparation, H.S.; writing—review and editing, C.S., W.L., Y.C. and S.X.; visualization, H.S.; supervision, W.L. and S.X.; project administration, C.S., W.L. and S.X.; funding acquisition, C.S. and S.X. All authors have read and agreed to the published version of the manuscript.
Funding
This research was funded by the National Key R&D Program of China, grant number 2023YFB4302600, and the Science and Technology Program of Suzhou, grant number SYG2025116; the Hubei Science and Technology Talent Service Enterprise Project (2026DJB020); and the Huanggang Technical Breakthrough General Project (GGYB20260002).
Data Availability Statement
The data presented in this study are available on request from the corresponding author. The data are not publicly available due to restrictions related to the experimental platform and data management.
Acknowledgments
The authors would like to thank Bin Feng for his guidance in the real-vehicle experiments and data collection.
Conflicts of Interest
The authors declare no conflicts of interest.
Abbreviations
The following abbreviations are used in this manuscript:
| NOP | Navigate-on-Pilot |
| V2X | Vehicle-to-Everything |
| STPA | Systems-Theoretic Process Analysis |
| SOTIF | Safety of the Intended Functionality |
| OBU | Onboard Unit |
| DSRC | Dedicated Short-Range Communications |
| LTE-V | Long-Term Evolution Vehicle |
| GPS | Global Positioning System |
| ROS | Robot Operating System |
| LiDAR | Light Detection and Ranging |
References
- Wang, H.; Shao, W.; Sun, C.; Yang, K.; Cao, D.; Li, J. A survey on an emerging safety challenge for autonomous vehicles: Safety of the intended functionality. Engineering 2024, 33, 17–34. [Google Scholar] [CrossRef] [Scilit]
- Monkhouse, H.E.; Habli, I.; McDermid, J. An enhanced vehicle control model for assessing highly automated driving safety. Reliab. Eng. Syst. Saf. 2020, 202, 107061. [Google Scholar] [CrossRef] [Scilit]
- Sun, L.; Li, Y.-F.; Zio, E. Comparison of the HAZOP, FMEA, FRAM, and STPA methods for the hazard analysis of automatic emergency brake systems. ASCE-ASME J. Risk Uncertain. Eng. Syst. Part B Mech. Eng. 2022, 8, 031104. [Google Scholar] [CrossRef] [Scilit]
- Yao, B.; Huang, S.; Han, P.; Lin, J.; Duan, S.; Liu, C. SOTIF-oriented risk assessment: A multi-dimensional model for autonomous driving. IEEE Robot. Autom. Lett. 2025, 10, 1792–1799. [Google Scholar] [CrossRef] [Scilit]
- Wang, C.; Storms, K.; Zhang, N.; Winner, H. Runtime unknown unsafe scenarios identification for SOTIF of autonomous vehicles. Accid. Anal. Prev. 2024, 195, 107410. [Google Scholar] [CrossRef] [Scilit] [PubMed]
- Yu, G.; Li, H.; Wang, Y.; Chen, P.; Zhou, B. A review on cooperative perception and control supported infrastructure-vehicle system. Green Energy Intell. Transp. 2022, 1, 100023. [Google Scholar] [CrossRef] [Scilit]
- Bai, Z.; Wu, G.; Barth, M.J.; Liu, Y.; Akin Sisbot, E.; Oguchi, K.; Huang, Z. A survey and framework of cooperative perception: From heterogeneous singleton to hierarchical cooperation. IEEE Trans. Intell. Transp. Syst. 2024, 25, 15191–15209. [Google Scholar] [CrossRef] [Scilit]
- Sridhar, S.; Eskandarian, A. Cooperative perception in autonomous ground vehicles using a mobile-robot testbed. IET Intell. Transp. Syst. 2019, 13, 1545–1556. [Google Scholar] [CrossRef] [Scilit]
- Hakim, B.; Sorour, S.; Hefeida, M.S.; Alasmary, W.S.; Almotairi, K.H. CCPAV: Centralized cooperative perception for autonomous vehicles using CV2X. Ad Hoc Netw. 2023, 142, 103101. [Google Scholar] [CrossRef] [Scilit]
- Liu, J.; Cai, B.; Wang, Y.; Wang, J. A lane level positioning-based cooperative vehicle conflict resolution algorithm for unsignalized intersection collisions. Comput. Electr. Eng. 2013, 39, 1381–1398. [Google Scholar] [CrossRef] [Scilit]
- Wang, M.I.-C.; Wen, C.H.-P.; Chao, H.J. Assessing the impact of communication delays for autonomous intersection management systems. Veh. Commun. 2024, 49, 100829. [Google Scholar] [CrossRef] [Scilit]
- Vukadinovic, V.; Bąkowski, K.; Marsch, P.; Garcia, I.D.; Xu, H.; Sybis, M.; Sroka, P.; Wesołowski, K.; Lister, D.; Thibault, I. 3GPP C-V2X and IEEE 802.11p for vehicle-to-vehicle communications in highway platooning scenarios. Ad Hoc Netw. 2018, 74, 17–29. [Google Scholar] [CrossRef] [Scilit]
- Shi, M.; Zhang, Y.; Yao, D.; Lu, C. Application-oriented performance comparison of 802.11p and LTE-V in a V2V communication system. Tsinghua Sci. Technol. 2019, 24, 123–133. [Google Scholar] [CrossRef] [Scilit]
- Öncü, S.; Ploeg, J.; van de Wouw, N.; Nijmeijer, H. Cooperative adaptive cruise control: Network-aware analysis of string stability. IEEE Trans. Intell. Transp. Syst. 2014, 15, 1527–1537. [Google Scholar] [CrossRef] [Scilit]
- Zhang, L.; Sun, J.; Orosz, G. Hierarchical design of connected cruise control in the presence of information delays and uncertain vehicle dynamics. IEEE Trans. Control Syst. Technol. 2018, 26, 139–150. [Google Scholar] [CrossRef] [Scilit]
- Li, Y.; Tang, C.; Peeta, S.; Wang, Y. Nonlinear consensus-based connected vehicle platoon control incorporating car-following interactions and heterogeneous time delays. IEEE Trans. Intell. Transp. Syst. 2019, 20, 2209–2219. [Google Scholar] [CrossRef] [Scilit]
- Ploeg, J.; Semsar-Kazerooni, E.; Lijster, G.; van de Wouw, N.; Nijmeijer, H. Graceful degradation of cooperative adaptive cruise control. IEEE Trans. Intell. Transp. Syst. 2015, 16, 488–497. [Google Scholar] [CrossRef] [Scilit]
- Hu, M.; Zhao, X.; Hui, F.; Tian, B.; Xu, Z.; Zhang, X. Modeling and analysis on minimum safe distance for platooning vehicles based on field test of communication delay. J. Adv. Transp. 2021, 2021, 5543114. [Google Scholar] [CrossRef] [Scilit]
- Zhao, X.; Jing, S.; Hui, F.; Liu, R.; Khattak, A.J. DSRC-based rear-end collision warning system—An error-component safety distance model and field test. Transp. Res. Part C Emerg. Technol. 2019, 107, 92–104. [Google Scholar] [CrossRef] [Scilit]
- Liu, Z.; Yuan, Q.; Nie, G.; Tian, Y. A multi-objective model predictive control for vehicle adaptive cruise control system based on a new safe distance model. Int. J. Automot. Technol. 2021, 22, 475–487. [Google Scholar] [CrossRef] [Scilit]
- Zhang, Q.; Hong, D.K.; Zhang, Z.; Chen, Q.A.; Mahlke, S.; Mao, Z.M. A systematic framework to identify violations of scenario-dependent driving rules in autonomous vehicle software. Proc. ACM Meas. Anal. Comput. Syst. 2021, 5, 15. [Google Scholar] [CrossRef] [Scilit]
- Li, B.; Zhang, J.; Zhang, C.; Pan, W.; Cai, S.; Liu, Y.; Li, H. Lane-keeping system design considering driver’s nervousness via scene analysis. IET Intell. Transp. Syst. 2020, 14, 1171–1182. [Google Scholar] [CrossRef] [Scilit]
- Saito, Y.; Yoshimi, R.; Kume, S.; Imai, M.; Yamasaki, A.; Ito, T.; Inoue, S.; Shimizu, T.; Nagai, M.; Inoue, H.; et al. Effects of a driver assistance system with foresighted deceleration control on the driving performance of elderly and younger drivers. Transp. Res. Part F Traffic Psychol. Behav. 2021, 77, 221–235. [Google Scholar] [CrossRef] [Scilit]
- O’Hern, S.; Stephan, K.; Qiu, J.; Oxley, J. A simulator study of driving behavior and mental workload in mixed-use arterial road environments. Traffic Inj. Prev. 2019, 20, 648–654. [Google Scholar] [CrossRef] [Scilit] [PubMed]
- Pappalardo, G.; Caponetto, R.; Varrica, R.; Cafiso, S. Assessing the operational design domain of lane support system for automated vehicles in different weather and road conditions. J. Traffic Transp. Eng. (Engl. Ed.) 2022, 9, 631–644. [Google Scholar] [CrossRef] [Scilit]

Disclaimer/Publisher’s Note: The statements, opinions and data contained in all publications are solely those of the individual author(s) and contributor(s) and not of MDPI and/or the editor(s). MDPI and/or the editor(s) disclaim responsibility for any injury to people or property resulting from any ideas, methods, instructions or products referred to in the content. |
© 2026 by the authors. Licensee MDPI, Basel, Switzerland. This article is an open access article distributed under the terms and conditions of the Creative Commons Attribution (CC BY) license.