


Abstract
This paper presents the design methodology and analytical sizing of a laboratory test rig for a mechanical power take-off (PTO) system for ocean wave energy conversion. The PTO comprises dual racks, pinions with freewheel clutches, a toothed-belt transmission, a planetary speed multiplier and a flywheel provision. The rig architecture couples prescribed linear excitation with controllable rotary loading and synchronized force, torque, position and speed acquisition. Ideal kinematic relations and a lumped torque-balance model connect the reference input to component-selection requirements. For a displacement amplitude of 0.5 m, period of 4 s, pinion pitch radius of 0.09 m and total speed ratio of 36, the calculated engaged-drive speed envelope is 3000 rpm. A 5 kN input force capacity gives an ideal output-torque envelope of 12.5 N m and a force-speed capacity product of 3.93 kW. A nominal mechanical-efficiency assumption of 0.884 yields an indicative output-capacity estimate of approximately 3.47 kW. The paper defines the mechanical interfaces, load-emulation concept, acquisition architecture, operating constraints and future verification procedure.
1. Introduction
The decarbonization of electricity generation requires renewable sources with complementary spatial and temporal characteristics. Ocean waves store wind energy over large fetches and time intervals, and their resource is generally denser and more predictable over short horizons than local wind or solar irradiance [1,2]. Global theoretical wave-power estimates are large, although only a fraction can be converted economically and within environmental, bathymetric and grid constraints [2]. Wave energy converters (WECs) therefore remain attractive for coastal and offshore applications, including isolated loads, ocean-observation platforms and hybrid renewable systems.
The technological landscape is unusually diverse. WECs may be classified by installation location (onshore, nearshore or offshore), by hydrodynamic principle (oscillating water columns, overtopping devices and oscillating bodies) and by the architecture of the power take-off system [1,3,4,5]. The PTO is the functional chain that converts the relative motion, pressure variation or fluid flow produced by the primary wave absorber into mechanical or electrical power. Pneumatic PTOs are typical of oscillating-water-column devices; hydraulic PTOs are common in high-force, low-speed oscillating bodies; direct electrical PTOs use linear or rotary generators; and mechanical PTOs employ gears, racks, clutches, belts, screws or other transmissions to rectify and adapt the motion [3,4,5,6,7]. No single architecture is optimal over all sea states, scales and maintenance strategies. Survivability, corrosion, sealing, fatigue, efficiency at part load and controllability are tightly coupled design constraints.
Performance assessment in this field must distinguish resource-to-motion, motion-to-shaft and shaft-to-wire conversion. IEC TS 62600-100:2024 provides a framework for power-performance assessment of electricity-producing WECs, including similarity, uncertainty and transfer of performance between locations [8]. Before sea trials, however, laboratory testing is essential because it isolates the PTO from uncertain hydrodynamics, permits repeatable excitation and reduces the cost and risk of identifying nonlinearities, friction, backlash, saturation and control limitations. Bench testing has also proven effective for identifying multi-domain PTO models and validating them against synchronized measurements .
Mechanical test rigs range from general-purpose testing machines to highly specialized demonstrators. Their common purpose is to impose a known mechanical input on a device under test (DUT), measure its response and maintain traceability between command, load and acquired data. Dedicated rigs integrate structures, actuators, sensors, conditioning electronics, control software and safety functions; their design is consequently a multidisciplinary machine-design problem rather than a simple fixture-design task [9]. Four broad families are relevant to the present work, as shown in Table 1.
Table 1.
Main families of mechanical test rigs and their operating principle.
Quasi-static universal testing machines generally apply tension, compression or bending through an electromechanical screw drive or a hydraulic actuator. They are normally operated in force or displacement control and are verified over a defined force range; ISO 7500-1 specifies calibration and verification of static uniaxial force-measuring systems [10]. Dynamic and fatigue rigs use servo-hydraulic, electrodynamic or high-bandwidth electromechanical actuation to reproduce cyclic loads. In such systems, static calibration alone is insufficient because inertia, bandwidth, phase and machine configuration can create additional errors. ISO 4965-1 and ASTM E467 address dynamic force verification for fatigue testing systems [11,12].
Rotating-machine and drivetrain rigs instead arrange a prime mover, the DUT and an absorbing machine or dynamometer in series. Closed-loop speed or torque control establishes operating points, while shaft torque and angular speed provide mechanical power. Torque calibration and displacement verification are covered by standards such as ASTM E2624 and ASTM E2309/E2309M [13,14]. Finally, application-specific emulation rigs reproduce service histories rather than standardized specimen tests. They may combine linear and rotary actuation, programmable loads, real-time controllers and hardware-in-the-loop elements. This last category is particularly suitable for WEC PTOs because the input is oscillatory, the output is rotational and the conversion chain includes discontinuous clutch engagement and energy storage.
The test rig proposed here combines the operating principles of an electromechanical motion emulator and a drivetrain dynamometer. A linear actuator is intended to prescribe wave-equivalent displacement or velocity at the PTO input, while a second electric machine provides controllable resisting torque at the output. The instrumentation architecture is designed to acquire force, torque, displacement and speed on a common time base. These are functional design requirements; their achieved tracking accuracy and dynamic bandwidth are not evaluated in this study.
The contribution is a documented design methodology for integrating a dual-rack mechanical rectifier with programmable linear actuation, rotary load emulation and synchronized power-flow measurements. The mechanical PTO principle has been described previously [15,16,17,18], and experimental PTO bench modeling is already represented in the literature [15]. The present study connects the particular mechanism to its input and output sizing requirements, measurement boundaries and control architecture. It does not claim a new rectification principle or superior measured performance relative to earlier rigs. Section 2 presents the mechanism and analytical design basis. Section 3 describes the rig architecture, operating constraints and intended verification procedure. Section 4 states the conclusions and limitations of this design study.
2. Mechanical Power Take-Off System for Ocean Wave Energy
2.1. Operating Principle and Energy-Conversion Chain
The investigated PTO is intended for oscillating-body WECs in which relative wave-induced motion is available as a reciprocating linear displacement. Its function is to transform this bidirectional, low-speed motion into a unidirectional rotation suitable for a conventional rotary generator [16,17,18]. The mechanism, shown in Figure 1, comprises two parallel racks fixed to a rigid translating carriage, two pinions mounted on a common primary shaft, freewheel clutches integrated with the pinions, a toothed-belt stage, a planetary gear stage, a flywheel and an electrical machine.
Figure 1.
CAD view of the mechanical PTO (Figure 2).
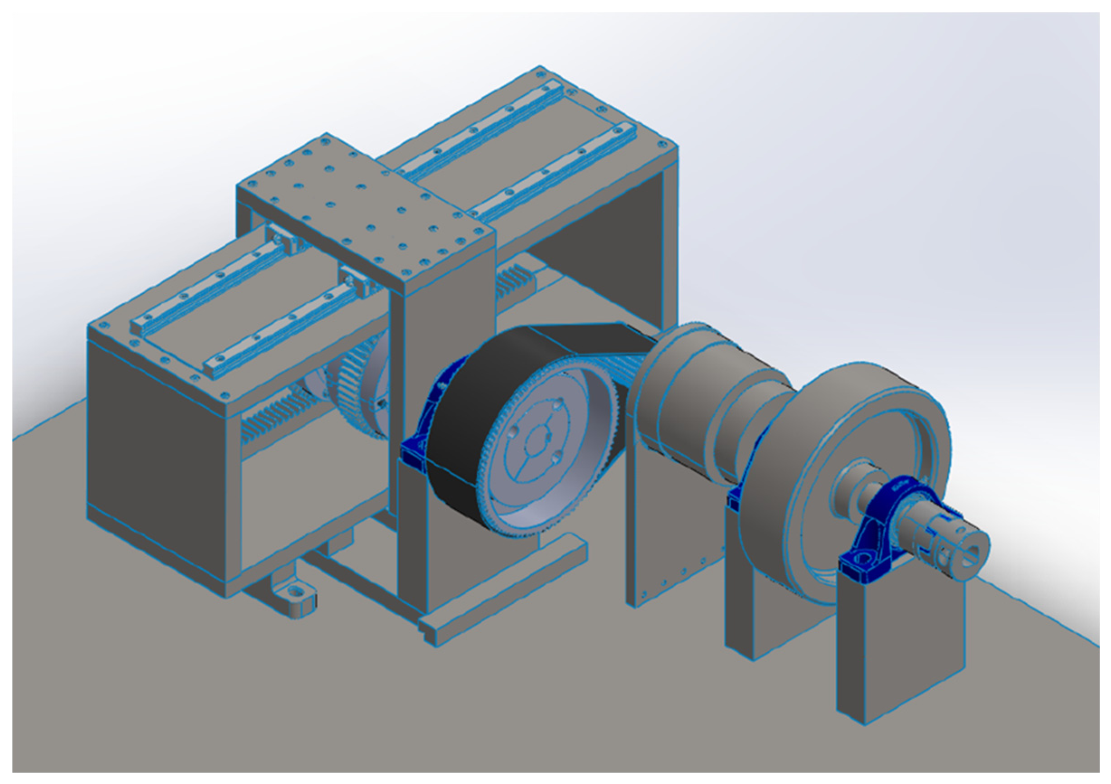
Figure 2.
Functional connection scheme of the proposed rig. The two rack-pinion-freewheel branches feed the primary shaft. Downstream transmission and output loading are shown with the intended measurement boundaries.
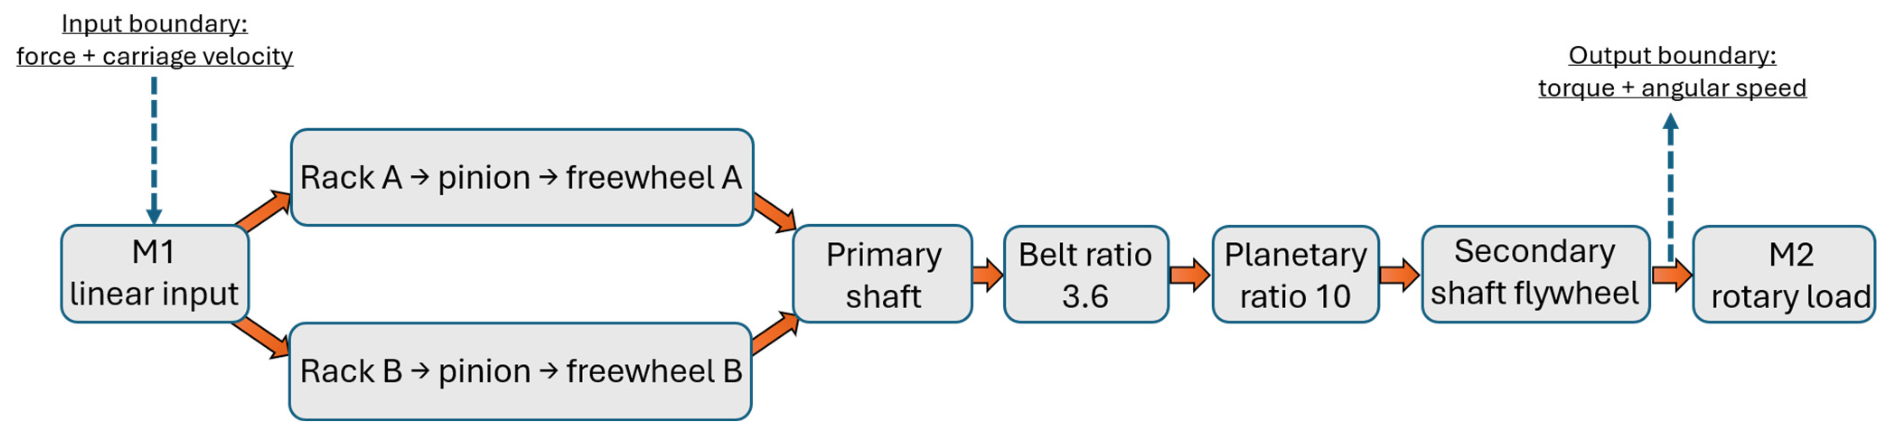
The carriage is guided by four recirculating-ball carriages. The two racks engage pinions coupled to the primary shaft through oppositely acting freewheels. During an engaged driving interval, one branch transmits torque and the other overruns; reversing the rack motion exchanges their roles. The branches therefore deliver torque to the shaft in the same rotational direction. Engagement is also governed by relative speed: when the rotating train overruns the rack-driven branch, the corresponding freewheel does not transmit driving torque.
Downstream of the rectifier, the toothed-belt stage increases speed by approximately 3.6. The planetary stage, used in reverse relative to its conventional reduction function, provides a further factor of 10. The total ideal speed ratio is therefore approximately 36. This ratio increases shaft speed while reducing the ideal transmitted torque by the same factor. A flywheel connected to the secondary shaft stores or releases kinetic energy as the instantaneous torque balance changes. This is the mechanical basis for smoothing speed, but neither a specific ripple reduction nor a flywheel performance improvement is demonstrated in this study [19,20].
The mechanical chain is deliberately modular. The freewheel units can be inspected independently, belt tension can be adjusted, the toothed-belt stage can be replaced with a CVT to be sized ad hoc [21], the planetary unit can be removed or replaced and different flywheel inertias or output loads can be tested. Such accessibility is important because the PTO contains sources of nonlinearity that are difficult to quantify from catalogs alone: clutch engagement delay, backlash, gear-mesh compliance, belt elasticity, bearing and guide friction and alignment-dependent losses.
2.2. Kinematic Analysis
Let the prescribed carriage displacement be harmonic:
where A is the displacement amplitude, Ω = 2 π/T is the excitation angular frequency, T is the wave-equivalent period and φ is the initial phase. The corresponding linear velocity and acceleration are
x(t) = A sin(Ω t + φ)
v(t) = A Ω cos(Ω t + φ)
a(t) = −A Ω2 sin(Ω t + φ).
During an engaged driving interval, under the no-slip assumption, the pinion pitch-line velocity equals the rack velocity. If rp is the pinion pitch radius, the ideal primary-shaft speed is
ω1(t) = |v(t)|/rp,
Away from reversal and clutch switching, the signed derivative of this ideal rectified speed is sign(v)a/rp, and its magnitude is |a|/rp. These relations do not describe impact or overrun intervals. The ideal secondary-shaft speed during engagement is
where ib = 3.6 is the belt ratio, and ig = 10 is the planetary ratio. For A = 0.5 m, T = 4 s and rp = 0.09 m, the maximum linear and angular speeds are
ω2(t) = i ω1(t), i = ib ig,
vmax = A Ω = 0.785 m/s,
ω1,max = 8.73 rad/s = 83.3 rpm,
ω2,max = 314.2 rad/s = 3000 rpm.
If F_c(t) denotes the driving-force magnitude carried by the active rack-pinion branch, the ideal driving-torque magnitudes on the two shafts are
T1(t) = Fc(t) rp, T2,id(t) = T1(t)/i.
At the 5 kN force-capacity limit, the ideal maximum secondary-shaft torque is 12.5 N m. These relations define the kinematic and load envelope for selecting the actuator, shafts, bearings, transmission and torque transducer. They do not, by themselves, determine harvested energy. In particular, instantaneous input power must be evaluated as F(t)v(t) using synchronized signals and the actual phase relation; multiplying independent peak force and peak speed values gives a conservative capacity product, not cycle-mean power.
The dependence on amplitude, period and pinion radius follows directly from the same kinematic relations: the engaged-drive maximum speed is proportional to iA/(rpT), whereas the ideal output-torque capacity is proportional to Fmaxrp/i. At fixed amplitude, period and force capacity, changing rp exchanges speed and torque without changing their ideal capacity product. Increasing A or reducing T raises the velocity requirement, while the acceleration demand increases as A/T2. These analytical dependencies guide component selection; the feasible parameter range also depends on actuator stroke, drive limits, component ratings and clutch dynamics.
2.3. Dynamic Model and Flywheel Sizing
A lumped torque balance at the secondary shaft provides a framework for interpreting generator loading, inertia and losses. It is used here to define model terms and design dependencies, rather than to report a simulated transient response. In this balance, driving torque is applied only during active clutch engagement and is zero during ideal overrun. The governing relation is
where J is the inertia referred to the secondary shaft, T2 is the gross driving torque transmitted through an engaged branch, Tᵣ is the generator-equivalent resisting torque and ceq is the preliminary equivalent viscous-loss coefficient. The same transmission loss must not be deducted both from T2 and through ceq. The balance alone does not specify clutch switching, backlash, impact, Coulomb friction or drive saturation. With the driving-force convention defined above, the ideal torque magnitude during engagement is
J dω2/dt = T2(t) − Tr(t) − ceq ω2(t),
T2,id(t) = |Fc(t)| rp/i.
For an illustrative sinusoidal driving-force magnitude after rectification, the torque contains a mean component and higher harmonics. With a specified clutch state and positive constant ceq, the homogeneous response of the lumped balance has time constant τ = J/ceq. This property of the simplified equation does not establish the switching response or an achieved ripple value. A periodic steady state must satisfy the cycle-mean balance
mean(T2) = mean(Tr + ceq ω2).
Without the flywheel, the inertia of the principal rotating components is estimated as J0 = 0.1464 kg m2. The flywheel adds Jf, so that J = J0 + J_. For the same instantaneous net torque, increasing J reduces angular acceleration and speed ripple. The kinetic energy stored in the rotating assembly is
Ek(t) = 1/2 (J0 + Jf) ω22(t).
The preliminary design uses a speed-fluctuation target δ = (ωmax − ωmin)/ωmean = 1/300 and a nominal flywheel inertia Jf = 5.7671 kg m2 from the prior design work [17,18]. Flywheel sizing from a torque-work diagram depends on the energy fluctuation, mean speed and loading history [19,20]. A 0.10 m thick solid steel disk with radius approximately 0.26 m and mass about 168 kg illustrates the corresponding geometric scale.
The dynamic relations are retained to explain the roles of driving torque, resisting torque, inertia and losses in the proposed rig. This paper reports no time-domain simulation results or quantitative comparison of flywheel configurations. Characterization of clutch engagement, losses and speed ripple remains outside the present design contribution.
2.4. Efficiency Analysis
A preliminary loss budget is assembled from nominal component-efficiency assumptions. It covers the recirculating-ball guides, rack-pinion mesh, freewheel bearing sets, primary-shaft bearings, toothed belt, planetary unit and secondary-shaft bearings. Table 2 distinguishes these assumptions from the sources used to inform the component selection or loss-estimation approach. The entries are not efficiencies measured on this rig at a common operating point.
Table 2.
Nominal component-efficiency assumptions for preliminary sizing.
The guide friction coefficient μ = 0.003 [22] cannot by itself establish a guide efficiency of 0.988. Guide loss depends on the sum of friction forces, guide loading, preload and seals, relative to the transmitted input work. The 0.988 entry is therefore treated as a nominal loss allocation, rather than a value derived solely from μ or from the number of carriages. The bearing entries likewise represent preliminary allocations informed by friction-estimation methods [23]. The belt and planetary values are nominal reference values [24,25]. Multiplying the displayed factors gives approximately 0.883.
ηm,nom = 0.883.
For the reference envelope, the capacity product of maximum input force and maximum linear speed is
Pin,cap = Fmax vmax = 5000 × 0.785 = 3.93 kW.
Using the nominal aggregate efficiency for preliminary sizing gives
Pout,cap = ηm,nom Pin,cap = 3.47 kW.
The corresponding nominal loss allowance is approximately 456 W. Referring that allowance to the secondary shaft at 314.2 rad/s gives a preliminary equivalent viscous coefficient
ceq = Ploss/ω2,max2 = 4.62 × 10⁻³ N m s/rad.
This coefficient is a compact representation of the adopted distributed-loss allowance near the reference point. The capacity quantities in Equations (15) and (16) do not establish cycle-mean output. The intended measured cycle efficiency is defined from synchronized input and output power as
with consistent signs and integration over complete steady cycles for which the net change of stored mechanical energy is negligible. During start-up or run-down, changes in flywheel kinetic energy must be included in the energy balance before an energy ratio is interpreted as transmission efficiency. No measured efficiency or uncertainty interval is reported here.
ηcycle = ∫(Tout ωout dt)/∫(Fin vin dt),
3. Design of the Test Rig
3.1. Functional Requirements and Architecture
The rig is conceived as a facility for future characterization of a mechanical PTO. Its requirements are controlled input motion, measurement of principal mechanical quantities on a shared time base, programmable output loading, interchangeable configurations and supervised stopping. These requirements lead to five functional blocks (Figure 2 and Figure 3): (i) structural support and linear motion; (ii) the mechanical PTO; (iii) drives and load emulation; (iv) synchronized measurement and real-time control; and (v) operator supervision and safety functions.
Figure 3.
Functional architecture of the test rig, showing command and synchronized measurement paths.
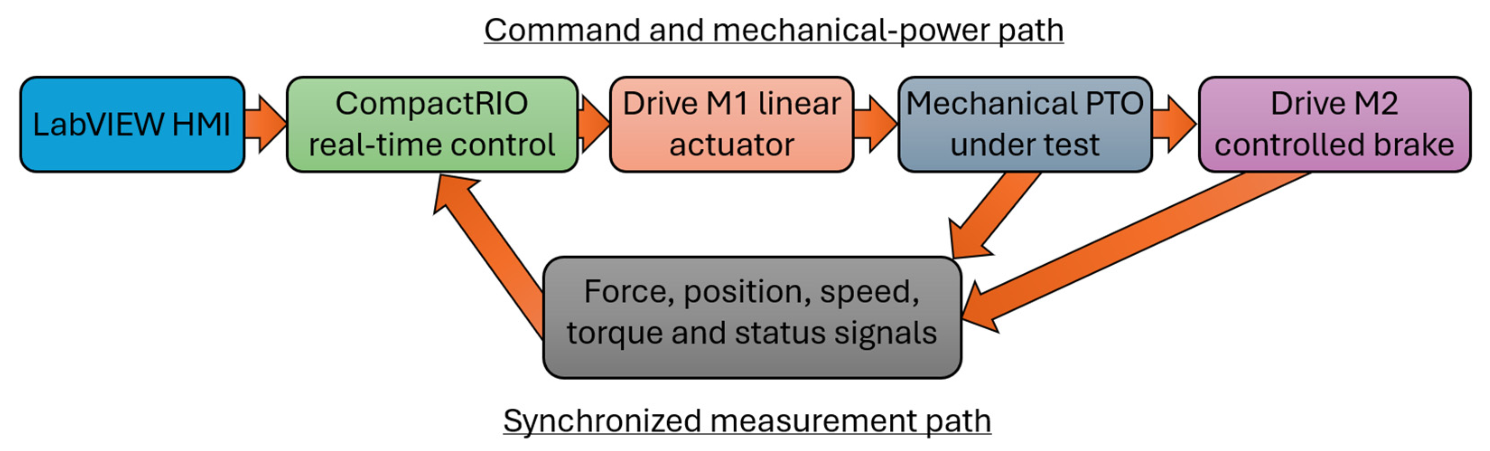
The command path begins in the LabVIEW human–machine interface. Reference waveforms and operating limits are transferred to the CompactRIO real-time controller, which generates analog and digital commands for the drives. The linear drive applies the input motion or force to the PTO, while the output brushless machine imposes a resisting torque. The measurement path runs in the opposite direction: force, torque, position and speed are converted to electrical signals, conditioned and acquired by the CompactRIO modules and then displayed and logged. Centralized acquisition is essential because mechanical power and energy require multiplication and integration of quantities measured at the same instant.
The reference operating condition is a harmonic input with A = 0.5 m and T = 4 s, a force capacity of 5 kN and an output-speed envelope up to 3000 rpm. The facility is not intended to reproduce hydrodynamic forces directly. Instead, it reproduces the PTO-side mechanical boundary conditions generated by a selected wave-to-body model or measured sea-state history. This separation allows PTO parameters to be identified without confounding them with uncertain hydrodynamic coefficients.
Irregular excitation can be specified as a finite sum of harmonic components with prescribed amplitudes, frequencies and phases. For PTO-side kinematic playback, those amplitudes must represent the target carriage-displacement spectrum; a sea-surface elevation spectrum requires a defined wave-to-body transformation before it can be used as carriage motion. The reference and its derivatives are checked against stroke, velocity and acceleration limits, and a smooth start-up envelope avoids an abrupt initial command. The selected spectrum, phases and any scaling define a reproducible input record. This describes an input-generation method; no irregular-wave realization is generated or tested in the present study.
3.2. Mechanical Structure, Actuation and Load Emulation
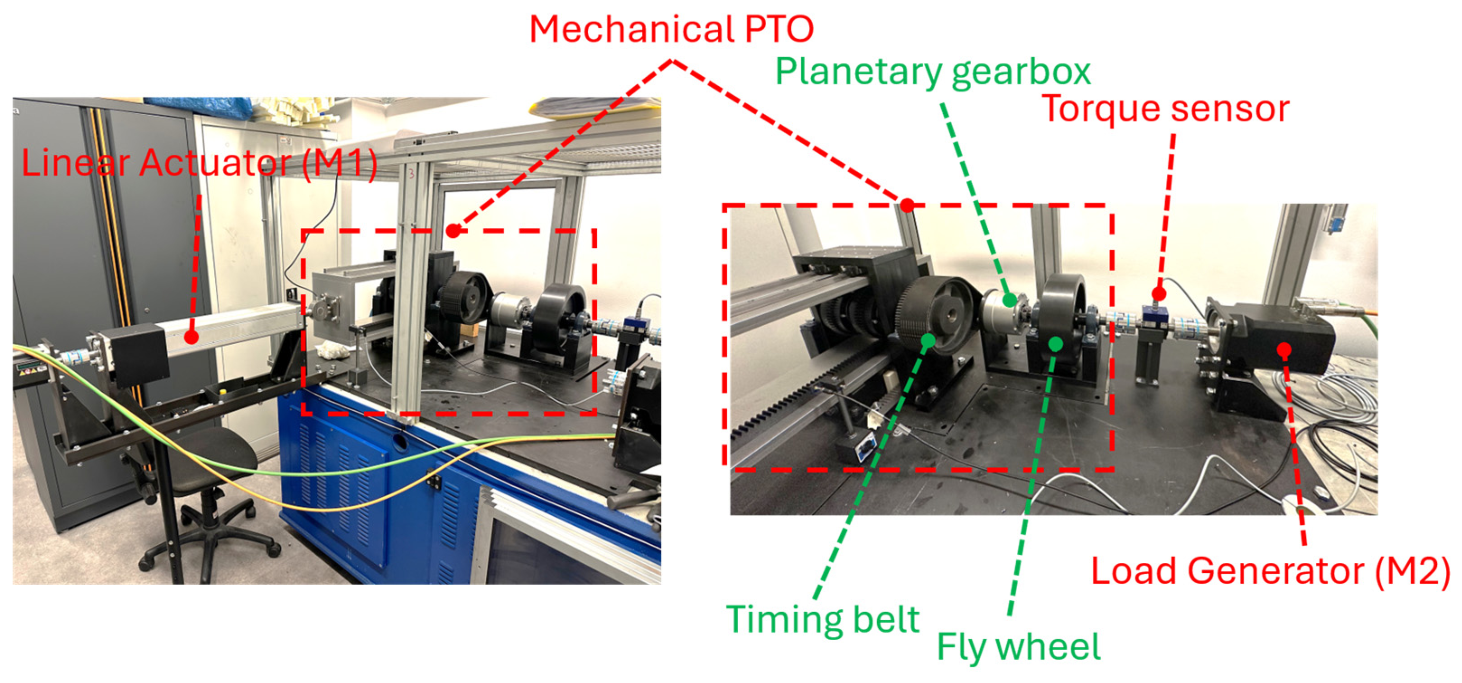
The mechanical assembly (Figure 4) is supported by a frame intended to maintain alignment between the linear actuator, rack carriage, transmission shafts and output machine. Four guide carriages constrain the rack assembly to one translational degree of freedom. Each rack drives a pinion through its associated freewheel, and the engaged branch supplies the common primary shaft. The toothed belt connects this shaft to the planetary speed-multiplication stage. The secondary train provides the flywheel connection and torque-sensing interface to the load machine. makes these functional connections explicit.
Figure 4.
Photographs of the assembled rig: left, overall arrangement with linear actuator M1; right, PTO output train with the labeled timing belt, planetary unit, flywheel, torque sensor and load machine M2.
The input architecture uses an electromechanical linear actuator driven by M1. Prescribed displacement or velocity is the intended initial operating mode because it defines the kinematic boundary condition directly. Force-controlled operation would additionally require a suitable load-cell feedback loop and a defined restoring or motion-constraining model.
The M2 load-emulation concept uses the drive in torque-command operation. CompactRIO supplies the load reference through the analog command path, and the drive current controller regulates the motor torque. A constant command represents a nominal constant resisting torque; a command based on measured speed can represent damping, subject to drive limits. The shaft transducer is intended to monitor the torque delivered at the measurement boundary. Command scaling, braking capability and continuous and transient motor-drive ratings govern the usable range. The paper specifies this functional control allocation without reporting a measured bandwidth or torque-tracking accuracy.
The arrangement permits incremental commissioning. The linear axis can first be verified without the PTO; the rectifier can then be tested at low speed with the downstream transmission disconnected; belt and planetary stages can be added; and finally, the brake and flywheel can be introduced. This subsystem-by-subsystem approach is consistent with successful WEC PTO bench-validation practice, where parameters are first identified on individual domains and subsequently checked on the complete chain [15].
3.3. Instrumentation and Data Acquisition
The measurement design includes input force, carriage displacement and velocity, primary- and secondary-shaft speed and output torque. Input force and carriage velocity define the mechanical input boundary; torque and angular speed at the connection to M2 define the output boundary in Figure 2. A T210/50NM transducer provides a nominal 50 N m torque range. Position and speed require encoder or compatible drive-feedback channels, synchronized with the analog force and torque signals. The ideal 12.5 N m output-torque envelope is within the transducer nominal range.
The acquisition and control core is a four-slot NI CompactRIO-9054 with a 1.33 GHz dual-core processor, an Artix-7 100T FPGA and NI Linux Real-Time [26]. The selected C Series modules are as follows:
- NI-9239: four simultaneous differential analog inputs, +/−10 V range, 24-bit resolution and up to 50 kS/s per channel, used for force and torque signals [27];
- NI-9263: four simultaneous analog outputs, +/−10 V range, 16-bit resolution and up to 100 kS/s update rate, used to generate drive references [28];
- NI-9375: sixteen sinking digital inputs and sixteen sourcing digital outputs for enable, direction, ready, alarm, emergency and interlock states [29].
The analog modules acquire voltages, so every force and torque channel requires appropriate conditioning, engineering-unit scaling and traceable calibration. The cited standards inform the verification plan: ISO 7500-1 [10] concerns static force systems in uniaxial testing machines; ISO 4965-1 and ASTM E467 [11,12] concern dynamic force verification in axial fatigue-testing contexts; ASTM E2624 [13] concerns torque calibration of testing machines; and ASTM E2309/E2309M [14] concerns displacement systems used in material testing. Their relevance is to the corresponding force, torque and displacement channels. The scope of each standard must be checked before formal application to this custom PTO rig.
A single sampling clock or deterministic timestamp must be used for all power-related channels. Force and velocity shall be acquired synchronously at the input, as shall torque and angular speed at the output. Signal filtering must preserve phase in the frequency band used for energy calculations; otherwise even small relative delays can bias the integral of force-velocity or torque-speed products. Raw signals, scaled engineering units, controller states and alarm events should all be stored with test metadata.
3.4. Real-Time Control, Supervision and Safety
CompactRIO is intended to separate deterministic I/O and control from the LabVIEW operator interface. Waveform management, displays and test metadata belong to the supervisory application, while time-sensitive acquisition and control functions belong to the real-time processor or FPGA.
The proposed operating logic includes initialization, homing/zeroing, ready, running, controlled stop, fault and emergency-stop states. Entry into running requires valid measurement channels, drive-ready indications, an admissible carriage position and satisfied guard and interlock conditions. Warning and stop levels are to be derived from the limiting actuator and transmission ratings, permissible carriage travel, sensor range and uncertainty, stopping delay and stored rotational energy. A warning must leave sufficient margin for a controlled stop before the corresponding limiting condition is reached. Displacement margins must include the distance travelled during detection and deceleration; speed limits must account for the flywheel and drive ratings. The input reference should be ramped smoothly to avoid exciting structural modes or generating clutch-impact loads that are unrelated to the target waveform. Direction reversal is a critical event because one freewheel disengages while the other engages. The acquisition system should therefore record at sufficiently high rate around reversal to quantify engagement delay, torque discontinuity and any backlash. Similar attention is required during flywheel tests because stored kinetic energy increases stopping time and the consequence of overspeed. Guarding, containment, verified overspeed limits and a documented run-down procedure are prerequisites before full-inertia operation.
3.5. Design Envelope and Intended Verification
Table 3 collects analytical sizing quantities, nominal assumptions and instrumentation ranges.
Table 3.
Reference design quantities and nominal measurement range.
A future characterization sequence would begin with channel verification and low-energy commissioning, followed by friction assessment, harmonic excitation, load variation and comparison of interchangeable configurations. This sequence describes the intended use of the facility.
The quantities that the proposed instrumentation is intended to make measurable are as follows:
- Input mechanical power Pin(t) = Fin(t)vin(t) and input energy;
- Output mechanical power Pout(t) = Tout(t)ωout(t) and output energy;
- Cycle efficiency and component loss estimates;
- Mean speed, peak-to-peak speed ripple and coefficient of speed fluctuation;
- Phase and time delay between command, force, torque and speed;
- Freewheel engagement transient and torque discontinuity at reversal;
- Repeatability across repeated cycles and uncertainty of derived quantities.
Subsequent characterization could use time histories, cycle energies, mean values, ripple and reversal transients to assess different aspects of the mechanism.
The nominal efficiency and capacity estimates do not define an optimum operating region. Establishing that region would require load-dependent loss information and coupled operating conditions beyond the analytical sizing relations used here. Likewise, wave-to-wire performance additionally depends on hydrodynamic and electrical subsystems [6,8]. The proposed architecture provides a framework for such later characterization, while the present article is limited to the mechanical rig design.
4. Conclusions
This paper has presented a design methodology for a laboratory rig dedicated to a mechanical wave-energy PTO. The described architecture combines dual-rack freewheel rectification, a 3.6:1 belt speed increase, a 10:1 planetary speed increase and a flywheel connection with linear excitation, rotary loading and synchronized acquisition. For the reference 0.5 m amplitude and 4 s period, ideal engaged-drive kinematics give a 3000 rpm speed envelope. The 5 kN force capacity corresponds to an ideal 12.5 N m output-torque capacity and a 3.93 kW force-speed capacity product. These are analytical sizing quantities.
The adopted nominal efficiency of 0.884 gives an indicative output-capacity estimate of approximately 3.47 kW. Component assumptions, catalog values and ideal ratios do not establish delivered cycle-mean power, a measured efficiency map or an optimum operating point. The contribution of these estimates is to document the initial sizing basis and its assumptions.
The study also specifies mechanical connections, intended input and output measurement boundaries, M2 torque-command load emulation, real-time acquisition and criteria for setting operating limits. These design decisions form a documented basis for constructing and configuring the facility. The assembly photographs illustrate realization of the mechanical arrangement, while control accuracy, repeatability, uncertainty and safety performance remain uncharacterized.
Experimental characterization and detailed transient simulation are outside the scope of this article. In particular, the paper does not demonstrate attainment of the selected flywheel ripple target, efficiency under irregular excitation or validated operation over the complete design envelope. Such characterization is a subsequent research stage; the present conclusions concern the documented architecture and analytical sizing only.
Author Contributions
Conceptualization, A.M.; methodology, A.M.; validation, L.M., V.L.B. and G.C.; formal analysis, A.M.; investigation, A.M, L.M., V.L.B. and G.C; resources, A.M.; writing—original draft preparation, , A.M, L.M., V.L.B. and G.C.; writing—review and editing, A.M, L.M., V.L.B. and G.C.; project administration, A.M.; funding acquisition, A.M. All authors have read and agreed to the published version of the manuscript.
Funding
This publication is part of the project NODES, which received funding from the MUR-M4C2 1.5 of PNRR funded by the European Union-NextGenerationEU (Grant Agreement No. ECS00000036).
Data Availability Statement
No new experimental or numerical-simulation dataset is reported. The analytical relations, reference parameters and nominal sizing assumptions used in this design study are provided in the article.
Conflicts of Interest
The authors declare no conflicts of interest.
References
- Falcao, A.F.O. Wave Energy Utilization: A Review of the Technologies. Renew. Sustain. Energy Rev. 2010, 14, 899–918. [Google Scholar] [CrossRef] [Scilit]
- Gunn, K.; Stock-Williams, C. Quantifying the Global Wave Power Resource. Renew. Energy 2012, 44, 296–304. [Google Scholar] [CrossRef] [Scilit]
- Zhang, Y.; Zhao, Y.; Sun, W.; Li, J. Ocean Wave Energy Converters: Technical Principle, Device Realization, and Performance Evaluation. Renew. Sustain. Energy Rev. 2021, 141, 110764. [Google Scholar] [CrossRef] [Scilit]
- Lian, J.; Wang, X.; Wang, X.; Wu, D. Research on Wave Energy Converters. Energies 2024, 17, 1577. [Google Scholar] [CrossRef] [Scilit]
- Scavalla, A.; Rossi, A.; La Battaglia, V.; Pio Belfiore, N. A Survey of Wave Energy Converter Mechanisms Presented Under the Topological and Functional Viewpoints. ASME. J. Mech. Des. 2023, 145, 070801. [Google Scholar] [CrossRef] [Scilit]
- Penalba, M.; Ringwood, J.V. A Review of Wave-to-Wire Models for Wave Energy Converters. Energies 2016, 9, 506. [Google Scholar] [CrossRef] [Scilit]
- Aderinto, T.; Li, H. Review on Power Performance and Efficiency of Wave Energy Converters. Energies 2019, 12, 4329. [Google Scholar] [CrossRef] [Scilit]
- IEC TS 62600-100:2024; Marine Energy—Wave, Tidal and Other Water Current Converters—Part 100: Electricity Producing Wave Energy Converters—Power Performance Assessment. International Electrotechnical Commission (IEC): Geneva, Switzerland, 2024.
- Design and Experimental Activity of Testing Machines and Mechanical Test Rigs; Santus, C., De Agostinis, M., Eds.; MDPI: Basel, Switzerland, 2026. [Google Scholar] [CrossRef] [Scilit]
- ISO 7500-1:2018; Metallic Materials—Calibration and Verification of Static Uniaxial Testing Machines—Part 1: Tension/Compression Testing Machines—Calibration and Verification of the Force-Measuring System. International Organization for Standardization (ISO): Geneva, Switzerland, 2018.
- ISO 4965-1:2012; Metallic Materials—Dynamic Force Calibration for Uniaxial Fatigue Testing—Part 1: Testing Systems. International Organization for Standardization (ISO): Geneva, Switzerland, 2012.
- ASTM E467-21; Standard Practice for Verification of Constant Amplitude Dynamic Forces in an Axial Fatigue Testing System. ASTM International: West Conshohocken, PA, USA, 2021. [Google Scholar] [CrossRef] [Scilit]
- ASTM E2624-17(2025); Standard Practice for Torque Calibration of Testing Machines. ASTM International: West Conshohocken, PA, USA, 2025. [Google Scholar] [CrossRef] [Scilit]
- ASTM E2309/E2309M-20; Standard Practices for Verification of Displacement Measuring Systems and Devices Used in Material Testing Machines. ASTM International: West Conshohocken, PA, USA, 2020. [Google Scholar] [CrossRef] [Scilit]
- Giorgi, S.; Coe, R.G.; Reasoner, M.M.; Bacelli, G.; Forbush, D.D.; Jensen, S.; Cazenave, F.; Hamilton, A. Wave Energy Converter Power Take-Off Modeling and Validation From Experimental Bench Tests. IEEE J. Ocean. Eng. 2024, 49, 446–457. [Google Scholar] [CrossRef] [Scilit]
- Mura, A. System for Producing Electrical or Mechanical Energy from Wave Motion. Italian Patent ITBS20090157A1, 14 September 2012. [Google Scholar]
- Mura, A.; Mazza, L.; Canavese, G.; Margaria, L. Dynamic Modeling and Performance Assessment of a Mechanical Power Take-Off System for Ocean Wave Energy. In Proceedings of the 54th AIAS Conference, Florence, Italy, 3–6 September 2025. [Google Scholar]
- Toncelli, G. Analisi Dinamica e Banco Prova di un Generatore di Energia Elettrica da Fonti Rinnovabili. Master’s Thesis, Politecnico di Torino, Turin, Italy, 2026. [Google Scholar]
- Ferraresi, G.; Raparelli, T. Meccanica Applicata, 3rd ed.; CLUT: Turin, Italy, 2007. [Google Scholar]
- Fasana, A.; Marchesiello, S. Meccanica Delle Vibrazioni; CLUT: Turin, Italy, 2006. [Google Scholar]
- La Battaglia, V.; Giorgetti, A.; Marini, S.; Arcidiacono, G.; Citti, P. Kinematic Analysis of V-Belt CVT for Efficient System Development in Motorcycle Applications. Machines 2022, 10, 16. [Google Scholar] [CrossRef] [Scilit]
- THK Co., Ltd. Friction Coefficient—LM Guide Technical Information; THK: Tokyo, Japan; Available online: https://tech.thk.com/en/products/pdf/en_b00_015.pdf (accessed on 27 August 2026).
- SKF Group. Bearing Friction, Power Loss and Starting Torque. Available online: https://www.skf.com/group/products/rolling-bearings/principles-of-rolling-bearing-selection/bearing-selection-process/operating-temperature-and-speed/bearing-friction-power-loss-and-starting-torque (accessed on 27 August 2026).
- SIT, S.p.A. SIT Mustang Speed STD Timing Belts—Belt Drives Engineering Manual. Available online: https://sitspa.com/wp-content/uploads/_documents/en/Mustang-Speed-STD-timing-belts.pdf (accessed on 27 August 2026).
- Nidec Drive Technology. VRL 155 Frame Size—Planetary Inline Gear Reducers. Available online: https://www.nidec-dtc.com/wp-content/uploads/2025/01/VRL-155-Frame.pdf (accessed on 27 August 2026).
- National Instruments. CRIO-905x Controllers—NI CompactRIO User Manual. Available online: https://www.ni.com/docs/en-US/bundle/ni-compactrio/page/crio-905x-controllers.html (accessed on 27 August 2026).
- National Instruments. NI-9239 and sbRIO-9239 Specifications. Available online: https://www.ni.com/docs/en-US/bundle/ni-9239-specs/page/specs.html (accessed on 27 August 2026).
- National Instruments. NI-9263 Specifications. Available online: https://www.ni.com/docs/en-US/bundle/ni-9263-specs/page/specs.html (accessed on 27 August 2026).
- National Instruments. NI-9375 and sbRIO-9375 Specifications. Available online: https://www.ni.com/docs/en-US/bundle/ni-9375-specs/page/specs.html (accessed on 27 August 2026).

Disclaimer/Publisher’s Note: The statements, opinions and data contained in all publications are solely those of the individual author(s) and contributor(s) and not of MDPI and/or the editor(s). MDPI and/or the editor(s) disclaim responsibility for any injury to people or property resulting from any ideas, methods, instructions or products referred to in the content. |
© 2026 by the authors. Licensee MDPI, Basel, Switzerland. This article is an open access article distributed under the terms and conditions of the Creative Commons Attribution (CC BY) license.