


Abstract
In this paper, we establish a Berry–Esséen bound for the edge frequency polygon estimator based on linearly extended negative quadrant-dependent (LENQD) random variables under suitable conditions. The convergence rate is shown to be , indicating that the edge frequency polygon estimator achieves a convergence performance that is comparable to that of the kernel estimator. In addition, a simulation study is conducted to validate the theoretical findings.
Keywords:
Berry–Esséen bound; edge frequency polygon estimator; linearly extended negative quadrant-dependent random variables MSC:
62G05; 62G20
1. Introduction
Density estimation is a fundamental topic in mathematical statistics because it underpins a wide range of nonparametric and semiparametric procedures. The common estimation approaches include histogram estimators, frequency polygon estimators, kernel density estimators, and nearest-neighbor methods. As noted by Scott [1], the frequency polygon estimator possesses a convergence rate that is similar to that of the kernel density estimator and outperforms the histogram estimator. The edge frequency polygon, introduced by Jones et al. [2], provides a piecewise linear alternative to the ordinary frequency polygon.
Let be a sequence of random variables with continuous density function on the real line . Consider a partition of into equal intervals of length , where as . The kth interval is denoted by . For any , there exists some integer such that . Consider three adjacent histogram bins , and , where and . Define
which count the observations falling into each interval. The corresponding histogram values are denoted by respectively. The edge frequency polygon estimator of the density function is defined as
for
The edge frequency polygon retains the simplicity and interpretability of the ordinary frequency polygon with additional theoretical and practical advantages, making it worthy of in-depth investigation.
The frequency polygon estimator of the density function is defined as
for , where
Since the introduction of frequency polygon estimation, many scholars have obtained significant theoretical results. For instance, Carbon et al. [3] proved the asymptotic normality of the frequency polygon for random fields. Yang [4] further investigated the uniformly strong consistency of the frequency polygon for strong mixing samples. Xing et al. [5] proved the uniformly strong consistency of the estimator and obtained a convergence rate. Wen and Xing [6] examined the asymptotic normality of the frequency polygons for -mixing samples, and the convergence rate is nearly . Xing and Yang [7] extended the uniformly strong consistency of the estimator for negatively associated samples. Xing et al. [8] explored the uniformly strong consistency and Berry–Esséen bound of frequency polygons for -mixing samples. Kang et al. [9] researched the uniformly strong consistency of the estimator for -mixing samples. Xi et al. [10] studied the uniformly strong consistency and the convergence rate of asymptotic normality for the edge frequency polygon estimator. Younso [11] examined the strong consistency of the frequency polygon estimators for strongly mixing sequences of real variables. Wu and Wang [12] established the Berry–Esséen bound of the frequency polygon estimation with -mixing samples. Additionally, Wang et al. [13] investigated the uniformly complete consistency of the frequency polygon estimation under m-extended negatively dependent (m-END) samples. Chao and Hu [14] obtained the convergence rate of asymptotic normality of the frequency polygon estimator for widely orthant-dependent (WOD) random variables.
Although the asymptotic properties of frequency polygon estimators have been extensively studied under various dependence structures, several important gaps remain. Most existing Berry–Esséen bounds focus on the ordinary frequency polygon, while the edge frequency polygon under more general dependence structures has received much less attention. In particular, the LENQD dependence structure, which includes negatively associated (NA) sequences and is relevant for linear processes and moving average (MA) models, has not yet been considered in this context. The aim of this paper is to fill this gap.
We first recall the definitions of extended negative quadrant-dependent (ENQD) and LENQD sequences, which were introduced by Li et al. [15] as follows.
Definition 1.
Two random variables X and Y are said to be ENQD if there exists a dominating constant such that, for any ,
and
A sequence is said to be LENQD if, for any disjoint subsets and positive real numbers or negative real numbers , and are ENQD.
Remark 1.
When , ENQD reduces to NQD. LNQD implies LENQD from the definitions, but the converse is not true. Moreover, LENQD is much weaker than the NA dependence structure introduced by Joag-Dev and Proschan [16], as well as NQD and LNQD. Furthermore, extended negatively dependent (END) random variables introduced by Liu [17] are not LENQD, and LENQD random variables are also not END. Hence, the investigation of the limit properties for LENQD random variables is of great interest.
Many interesting theoretical results have been established since the concept of LENQD random variables was introduced by Li et al. [15]. For instance, some probability inequalities were established for LENQD random variables in Li et al. [15], and Li et al. [18] investigated the strong consistency and strong representation for the Kaplan–Meier estimator and hazard rate estimator with censored LENQD data. El Alem [19] presented the Kolmogorov exponential inequality, the Rosenthal-type inequality and the Bernstein-type inequality for m-LENQD random variables. El Alem, Ahra, et al. [20] studied the convergence rate of the central limit theorem for LENQD random variables, among other results.
In this work, we establish the Berry–Esséen bound for the edge frequency polygon estimator based on LENQD samples. The convergence rate is shown to be . These results improve the corresponding ones in the existing literature. Moreover, numerical simulations are provided to support the theoretical findings.
The structure of this paper is organized as follows. The main results are presented in Section 2. Section 3 conducts some numerical simulations. Some lemmas and proofs of the main results are listed in Section 4.
Throughout this paper, the symbols denote positive constants that are independent of n and may take different values in various positions. Let be the integer part of x, represents the indicator function of a set A, and is the standard normal distribution function.
2. Basic Assumptions and Main Results
2.1. Basic Assumptions
For the presentation of our main results, the following assumptions are indispensable.
- (A1)
- Let be a sequence of identically distributed LENQD random variables with a continuous density function for and some . The joint density function of exists and satisfies for each and some .
- (A2)
- SetandLet , be positive integers tending to ∞. Set , and there exists some such thatandas , where
Remark 2.
(i) The assumptions (A1) and (A2) are regular conditions. Similar assumptions have been widely adopted in the literature, such as [7,8,10,11,12,13,14].
(ii) The relationships among the big block size p, the small block size q, the sample size n, and the bin width are established by the Bernstein big-block and small-block procedure. In particular, taking , , , and , all the conditions in (A2) can be satisfied.
2.2. Main Results
Now we state our main results. The following result is about the Berry–Esséen bound of the edge frequency polygon estimator for LENQD samples.
Theorem 1.
Suppose that assumptions (A1) and (A2) are satisfied. Then, for with
where , .
Corollary 1.
Suppose that the conditions of Theorem 1 are satisfied. Take , with , , for some . By choosing and , we have
Remark 3.
(i) The range ensures that , , , and simultaneously.
(ii) Since and as , we obtain that the convergence rate is nearly . Xing et al. [8] studied the uniformly asymptotic normality of the frequency polygon estimator for α-mixing samples and obtained the convergence rate . Wen and Xing [6] derived the convergence rate to be close to under ψ-mixing samples. In Xi et al. [10], the convergence rate of the edge frequency polygon estimator achieved for the Berry–Esséen bound was . Chao and Hu [14] presented the convergence rate as approximately for WOD sequences under suitable conditions.
The following results can be obtained under additional assumptions.
Theorem 2.
Suppose that assumptions (A1) and (A2) are satisfied. If as , and satisfies the local Lipschitz condition around x with , then
where .
According to Theorem 2, the asymptotic normality and the convergence rate of estimator can be obtained under LENQD samples.
Corollary 2.
Suppose the conditions of Theorem 2 hold. Let , with , , for some . By choosing appropriate and , we obtain
Corollary 3.
Under the assumptions of Theorem 2, we have
where D denotes the convergence in distribution.
Remark 4.
(i) For the frequency polygon estimator of the density function , Ref. [8] obtained the rate of under stationary α-mixing samples. Additionally, Ref. [12] studied the results of the convergence of to the standard normal distribution and obtained a better rate with .
(ii) In this paper, our results extend to the edge frequency polygon estimator and establish the asymptotic normality of the distribution function of for LENQD samples. Furthermore, we obtain the convergence rate of approximating the standard normal distribution.
3. Numerical Simulation
In this section, we perform a simulation to investigate the numerical performance of our main established results. The LENQD sequence is generated by an MA(1) model: , where is a Gaussian white noise process with mean and standard deviation . An extensive study of annual temperature values in Basel from 1755 to 1957 was conducted by El Alem, Guessoum et al. [21]. Their results showed that the best MA(1) model, according to the Akaike Information Criterion, is with and . We adopt these calibrated parameter values for our simulation study. Therefore the sequence consists of i.i.d. random variables with standard normal distributions by the normality test and autocorrelation test, and is a Gaussian process with the same distribution . The covariance structure is given by if and otherwise. A negatively correlated Gaussian sequence is an NA sequence and also LENQD, as noted by Joag-Dev and Proschan [16] and Remark 1.
For the purpose of comparing the different estimators, we consider the edge frequency polygon estimator , the frequency polygon estimator , and the Epanechnikov kernel estimator , for which the bandwidth is selected by unbiased cross-validation (UCV). The bandwidth for the edge frequency polygon estimator and the frequency polygon estimator is . The evaluation points are , and the sample sizes are . We repeat the calculation 1000 times using the R software with a fixed random seed (set.seed(123)) to ensure reproducibility.
As shown in Table 1, for some fixed x and , it can be observed that the mean squared error (MSE) of the estimators exhibits a general decreasing trend as n increases. Moreover, the MSE of the estimator is consistently smaller than the corresponding MSE of . The Epanechnikov kernel estimator yields the smallest MSE. To quantify the performance gap between the edge frequency polygon and the kernel estimator, we compute the relative efficiency . As shown in the last column of Table 1, RE exhibits a general decreasing trend as n increases. This indicates that the gap narrows as the sample size increases.
Table 1.
The MSE of the three estimators with and relative efficiency (RE = /).
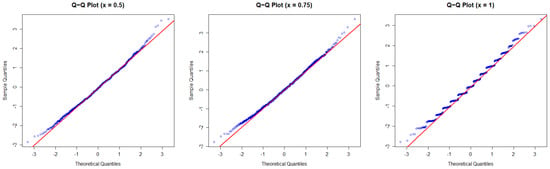
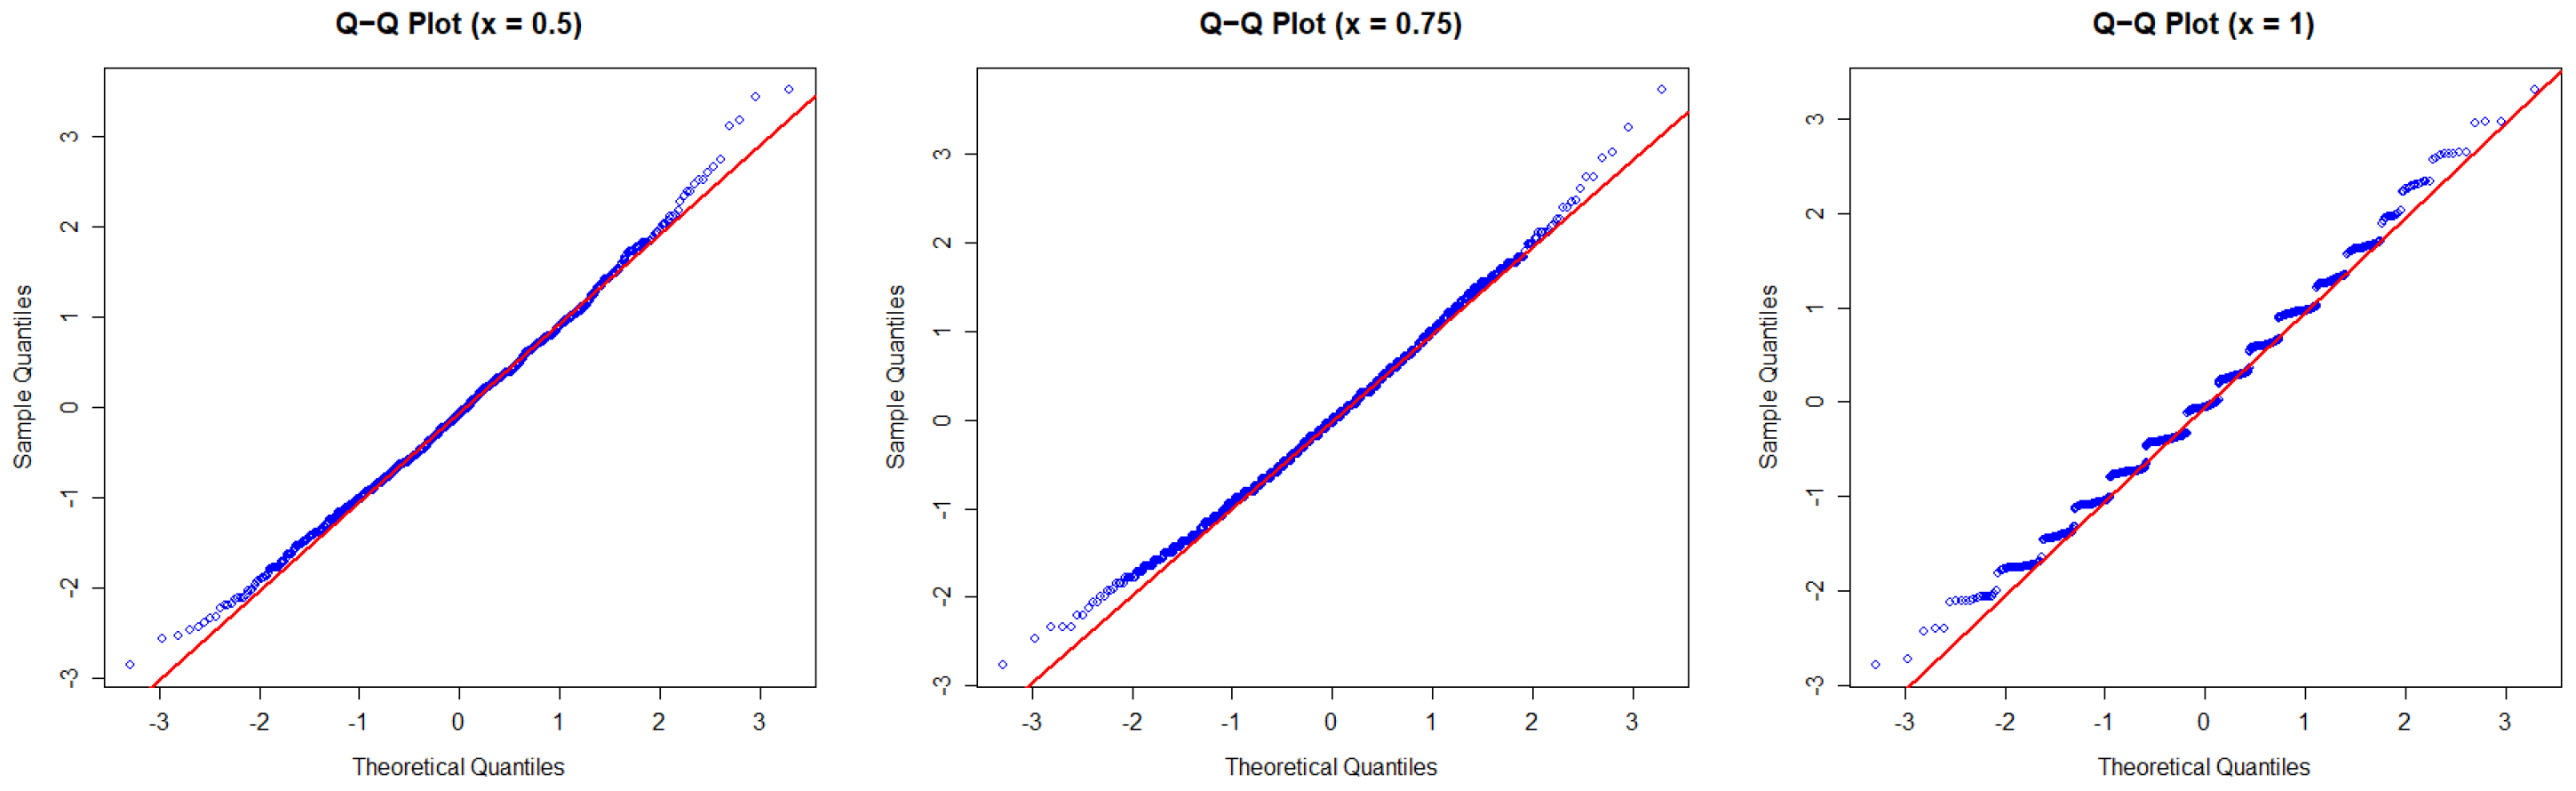
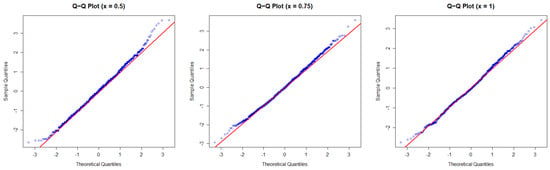
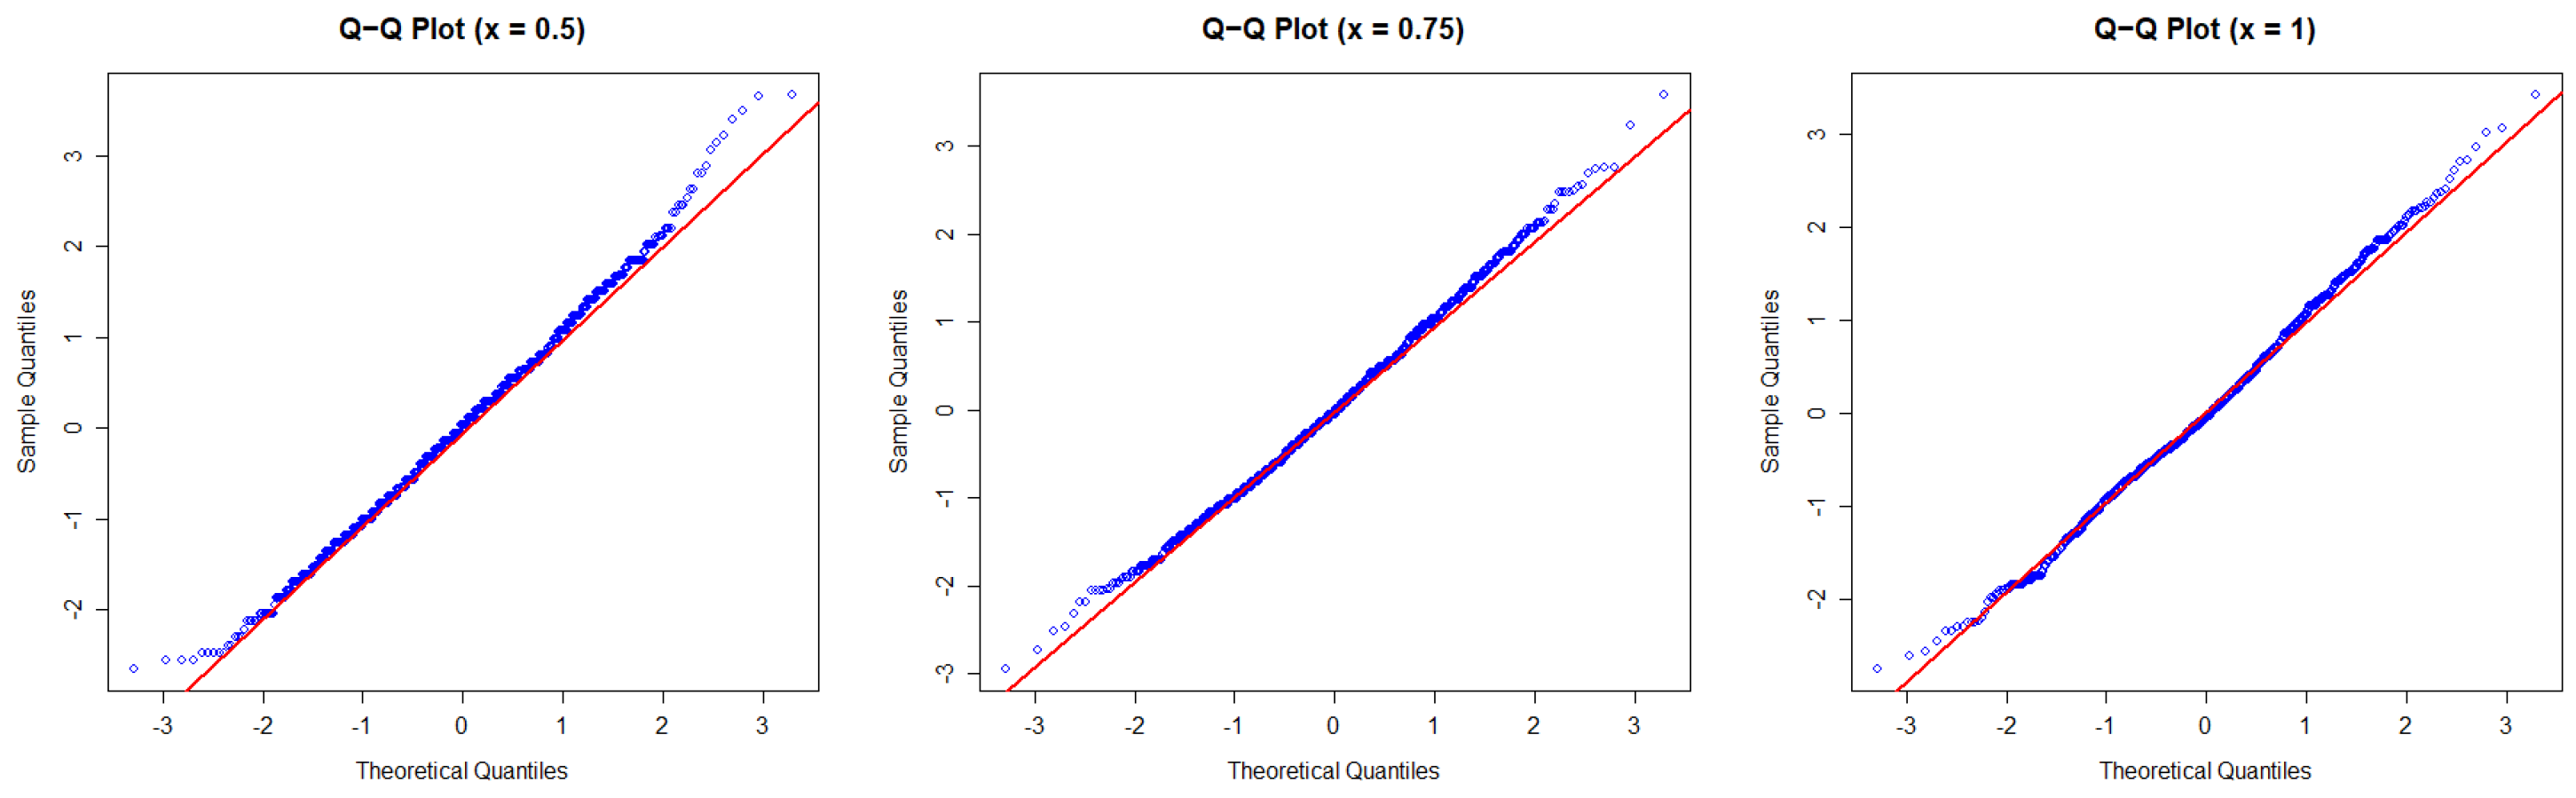
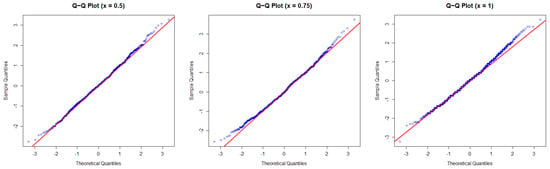
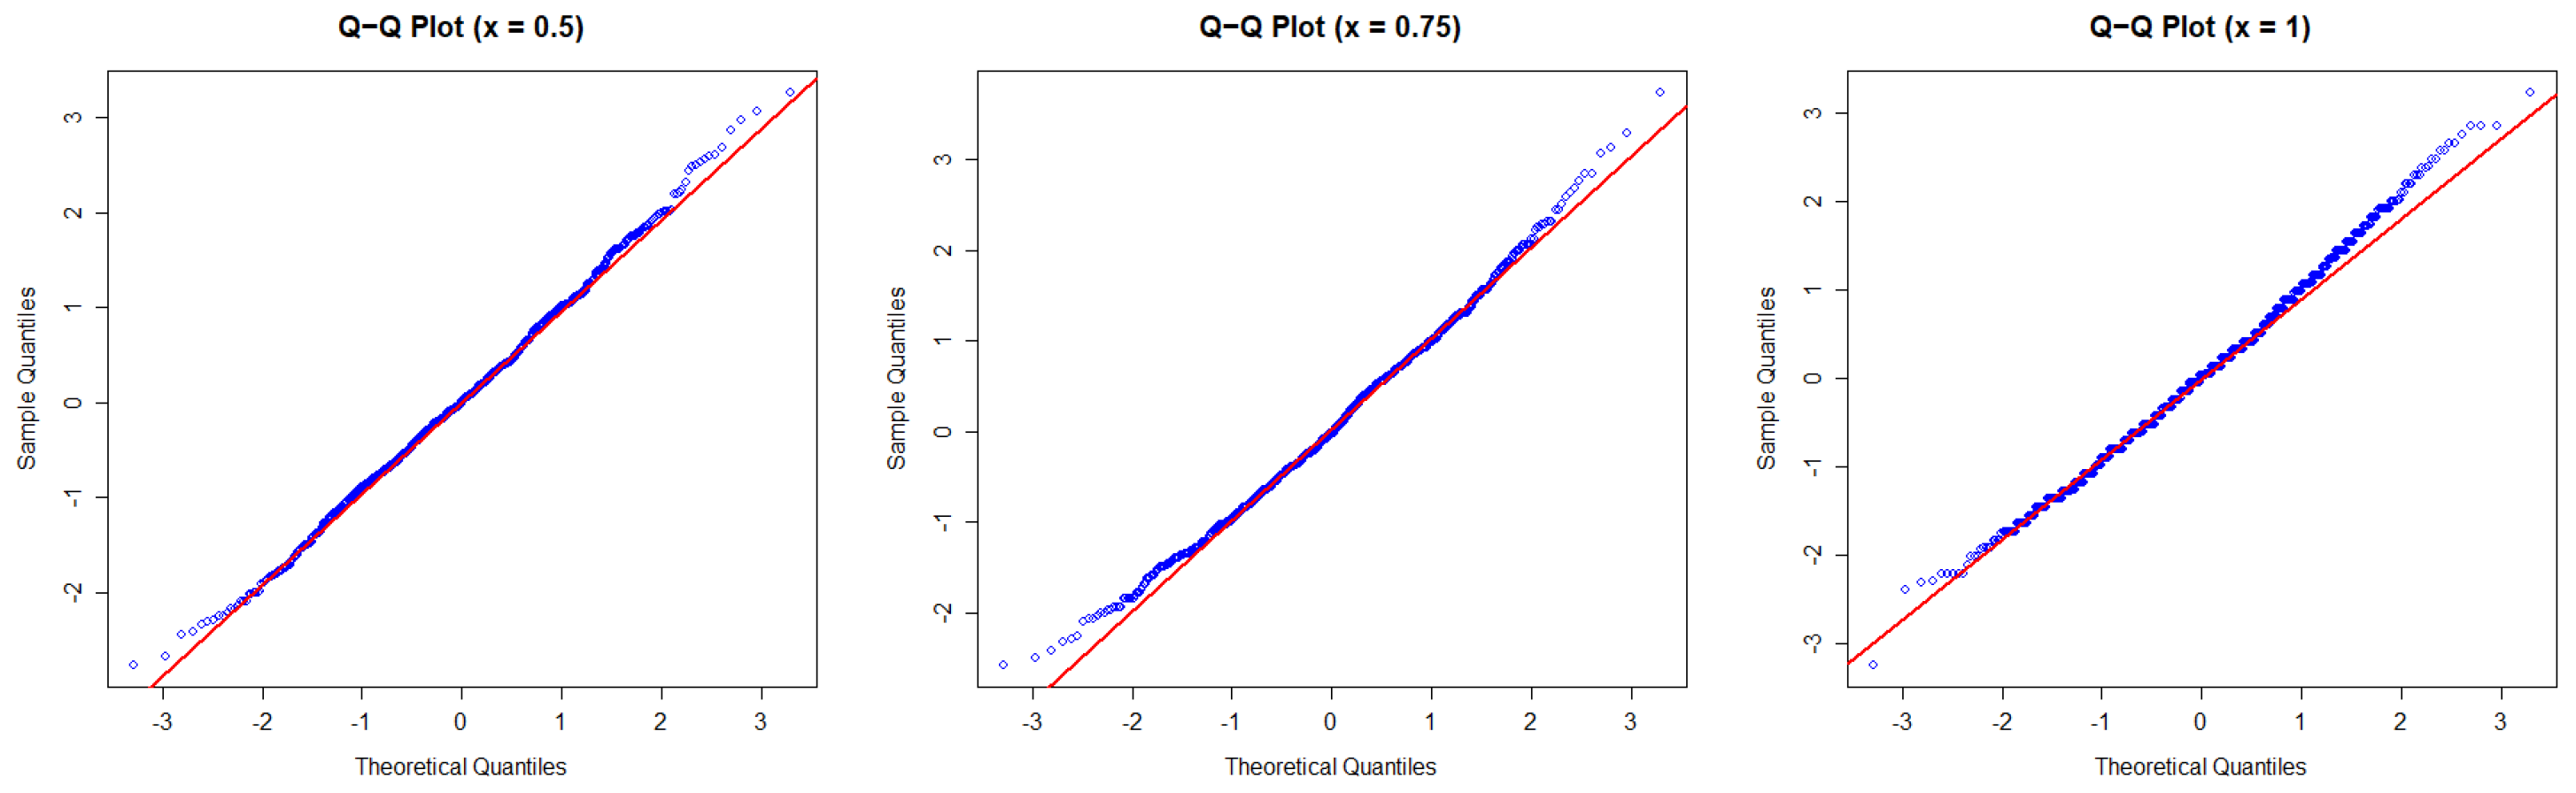
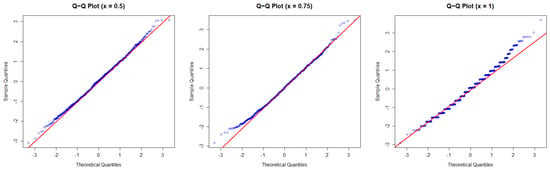
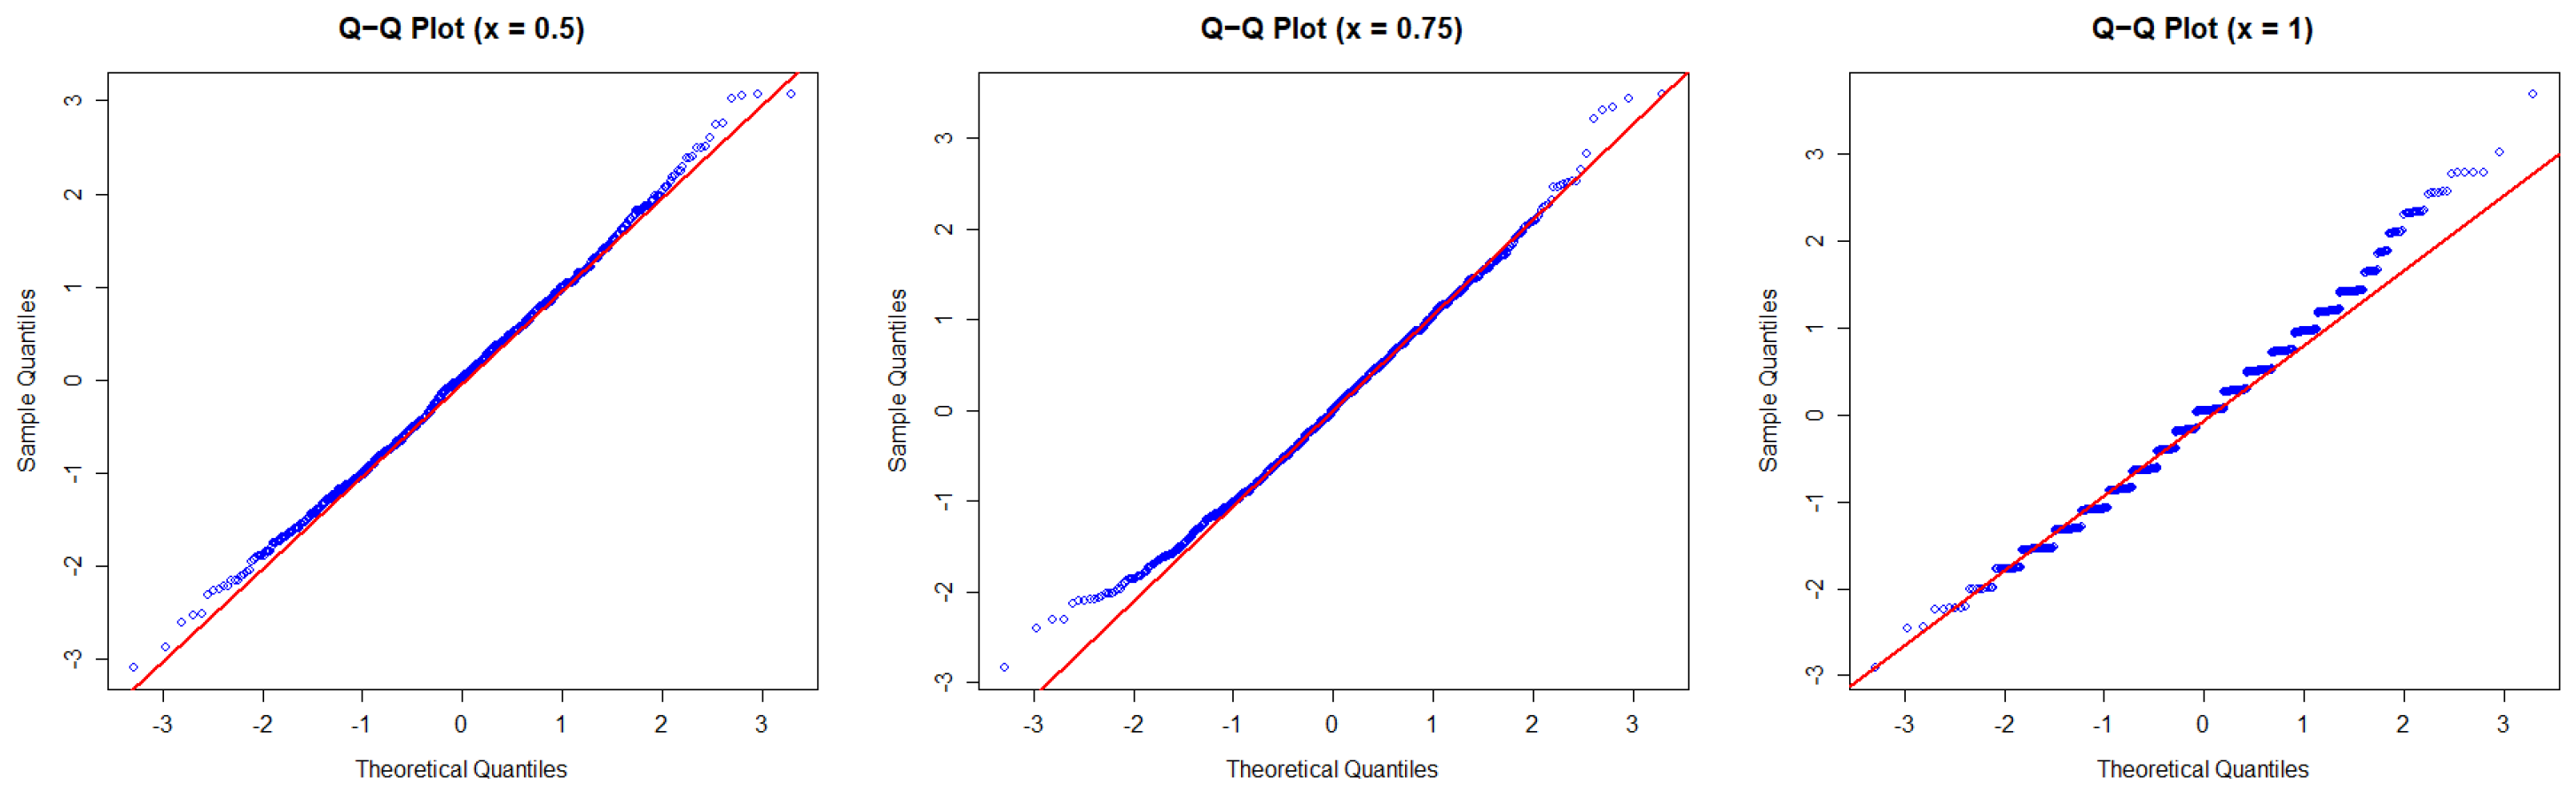
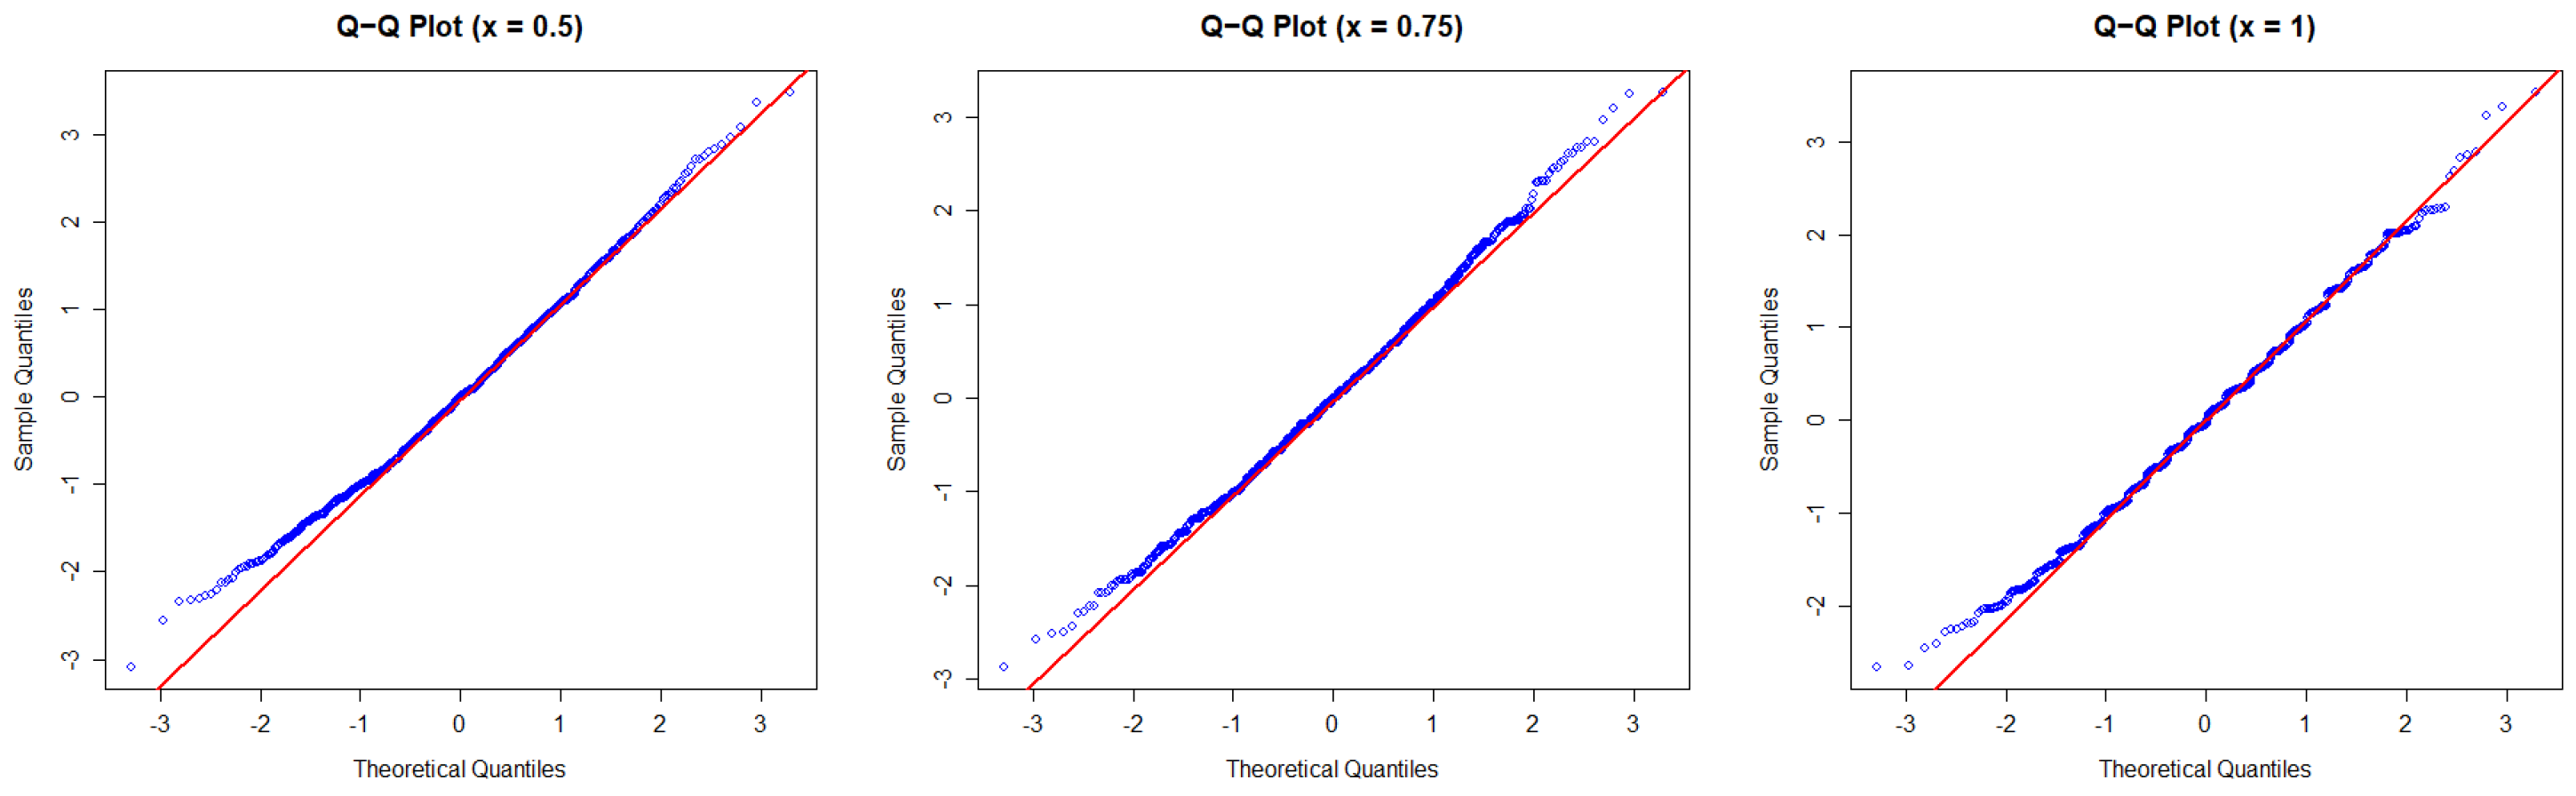
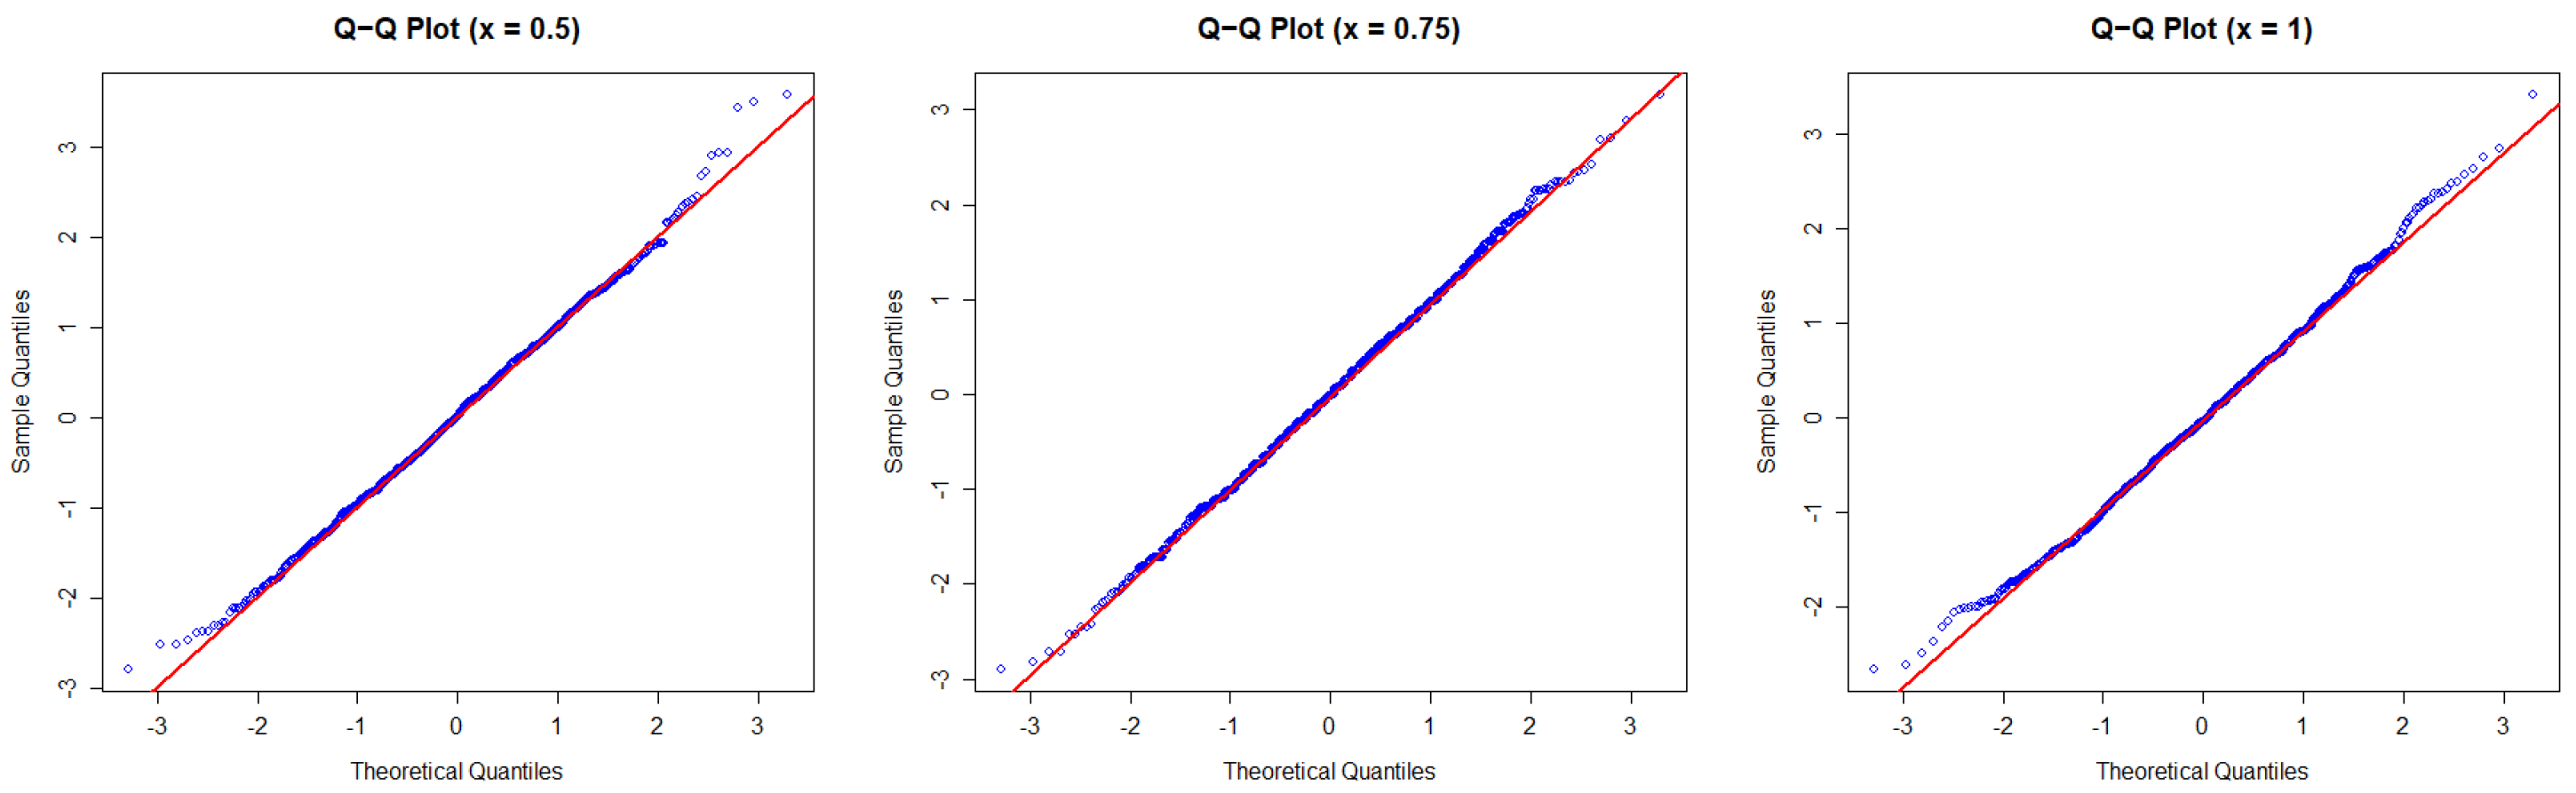
We also construct quantile–quantile (Q–Q) plots of to assess its asymptotic normality, as shown in Figure 1, Figure 2, Figure 3, Figure 4, Figure 5 and Figure 6. From these figures, it can be seen that, for each x, tends to follow the standard normal distribution.
Figure 1.
Q–Q plots of with and , respectively.
Figure 2.
Q–Q plots of with and , respectively.
Figure 3.
Q–Q plots of with and , respectively.
Figure 4.
Q–Q plots of with and , respectively.
Figure 5.
Q–Q plots of with and , respectively.
Figure 6.
Q–Q plots of with and , respectively.
For a quantitative assessment, we compute the Kolmogorov distance,
The estimated values of are reported in Table 2. In all the configurations, is below . These small magnitudes confirm that the empirical distribution of is well approximated by the standard normal distribution.
Table 2.
Kolmogorov distance.
To verify the theoretical convergence rate , we examine the scaled quantity . The results are presented in Table 3. These values range from approximately 0.06 to 0.16 across all the sample sizes and evaluation points, with no systematic increasing or decreasing trend. This provides quantitative support for the Berry–Esséen bound established in Section 2.
Table 3.
Scaled Kolmogorov distance .
In summary, the numerical results corroborate our theoretical findings: the edge frequency polygon estimator is consistent and asymptotically normal under LENQD dependence, with a convergence rate .
4. Proofs of Main Results
In this section, we will prove the Berry–Esséen bound for the edge frequency polygon estimator based on LENQD samples. For convenient writing, we first provide the following notations. For each denote
and then
Let . By employing Bernstein’s big-block and small-block procedures, can be decomposed into
where
and
To derive the main results, the following lemmas are indispensable. The first one is a basic property of LENQD random variables, which was presented by Li et al. [15].
Lemma 1.
Let be LENQD random variables and non-increasing (or non-decreasing) functions. Then random variables are LENQD with the common dominating constant M.
The following lemma, which can be found in [15], is the Rosenthal-type inequality for LENQD random variables.
Lemma 2.
Let be a sequence of LENQD random variables with dominating constant M, and assume that , for and all . Then there exists a positive constant depending only on p such that
Lemma 3.
Under assumptions (A1) and (A2), we have
where for . Furthermore, if is continuous at x, we have
Proof.
By definition,
For , note that for each Therefore, we obtain
For , we have
Next we will prove It follows from (A1) that
On the other hand, by Lemma 1, it follows that are also LENQD sequences, with and , combined with assumption (A2), and then we get
and, similarly, we can conclude that Note that as , so we obtain which, together with (9), yields (7).
Lemma 4.
Suppose that assumptions (A1) and (A2) hold; we have
Proof.
According to inequality, Jensen’s inequality and , for any , it follows that
and then we can deduce that
For a given and , set
and, by Lemma 1, it follows that are LENQD sequences, so the sequence is also LENQD. By Lemmas 2 and 3, we can obtain that
and that
Hence, (11) holds, and we get by Markov’s inequality that
□
Lemma 5.
Denote Suppose that the assumptions of Theorem 1 are satisfied. We have
Proof.
Set . Then, we have
Since , we have
and, combined with inequality and (11), we can obtain that
On the other hand, it follows that
where
By Lemma 1, it follows that are also LENQD sequences, with and , combined with assumption (A2), and then we get the following upper bound:
and we can similarly conclude that
Assume that are independent random variables and the distribution of is the same as that of for each We define , , and let , and be the distributions of , and , respectively.
Lemma 6.
Under the assumptions of Theorem 1, we get
Proof.
Note that . By Lemma 2 and , for some , we obtain that
Furthermore, it follows from Lemma 5 that as . Applying the Berry–Esséen theorem (see [22], Theorem 5.7), for , we get that
The proof of Lemma 6 is completed. □
The following lemma was presented in [15].
Lemma 7.
Let be a sequence of LENQD random variables with dominating constant and with finite second moments. Then, for any finite real numbers ,
Lemma 8.
Under the conditions of Theorem 1, we have
Proof.
Let and be the characteristic functions of and , respectively. By Berry–Esséen inequality (see [22], Theorem 5.3), we have for any that
Noting that
and applying Lemma 7, we derive that
which implies that
Since by and Lemma 6, we obtain that
From (17) it follows that
Hence, it can be deduced that
and, by choosing , the proof of Lemma 8 is completed. □
The last one comes from [23].
Lemma 9.
Suppose that and are two sequences of random variables, is a positive constant sequence, and . If
then, for any ,
Now we give the proof of Theorem 1 as follows.
Proof of Theorem 1.
Proof of Corollary 1.
In Theorem 1, let
and, for , choose and . Then we have and as . Hence, the assumption (A2) is satisfied. By the above choices of , and , we obtain
Apparently, if , then and the rate of convergence is approximately . □
Proof of Theorem 2.
In order to complete the proof, it suffices to verify by Theorem 1 that
Further, satisfies the local Lipschitz condition, i.e., for all and some , Noting that and , it follows from (1) that
where .
Proof of Corollary 2.
Similar to the proof of Corollary 1, let
and, for , choose and , and then we have and as . Hence, the assumption (A2) is satisfied. By substituting the above parameters into Theorem 2, we obtain
as . The proof is completed. □
Proof of Corollary 3.
The result follows directly from Corollary 2. □
Author Contributions
Conceptualization, X.H.; methodology, R.D. and X.H.; validation, R.D. and X.H.; writing—original draft preparation, R.D.; writing—review and editing, X.H. All authors have read and agreed to the published version of the manuscript.
Funding
The research was funded by National Social Science Foundation grant number 21BTJ040 and Anhui Provincial University Quality Engineering Project grant number 2025zytsct029.
Data Availability Statement
The original contributions presented in this study are included in the article. Further inquiries can be directed to the corresponding author.
Conflicts of Interest
The authors declare no conflicts of interest.
References
- Scott, D.W. Frequency polygons: Theory and application. J. Am. Stat. Assoc. 1985, 80, 348–354. [Google Scholar] [CrossRef]
- Jones, M.C.; Samiuddin, M.; Al-Harbey, A.H. The edge frequency polygon. Biometrika 1998, 85, 235–239. [Google Scholar] [CrossRef] [Scilit]
- Carbon, M.; Francq, C.; Tran, L.T. Asymptotic normality of frequency polygons for random fields. J. Stat. Plan. Inference 2010, 140, 502–514. [Google Scholar] [CrossRef] [Scilit][Green Version]
- Yang, X. Frequency polygon estimation of density function for dependent samples. J. Korean Stat. Soc. 2015, 44, 530–537. [Google Scholar] [CrossRef] [Scilit]
- Xing, G.D.; Yang, S.C.; Liang, X. On the uniform consistency of frequency polygons for ψ-mixing samples. J. Korean Stat. Soc. 2015, 44, 179–186. [Google Scholar] [CrossRef] [Scilit]
- Wen, Y.Z.; Xing, G.D. On the uniformly asymptotic normality of frequency polygons for ψ-mixing samples. Commun. Stat.-Theory Methods 2017, 46, 10416–10425. [Google Scholar] [CrossRef] [Scilit]
- Xing, G.D.; Yang, S.C. Uniformly strong consistency of frequency polygons for negatively associated samples. Commun. Stat.-Simul. Comput. 2017, 46, 2168–2175. [Google Scholar] [CrossRef] [Scilit]
- Xing, G.D.; Yang, S.C.; Li, X. Uniformly strong consistency and Berry–Esséen bound of frequency polygons for α-mixing samples. Commun. Stat.-Simul. Comput. 2019, 48, 416–430. [Google Scholar] [CrossRef] [Scilit]
- Kang, S.L.; Abbasi, R.; Wang, H.L.; Xu, L.X.; Wang, X.F.; Tang, Y.Y. Asymptotic behaviour of frequency polygons under ϕ-mixing samples. Commun. Stat.-Theory Methods 2018, 47, 5369–5377. [Google Scholar] [CrossRef] [Scilit]
- Xi, M.M.; Wang, C.H.; Wang, X.J. Uniformly strong consistency and the rates of asymptotic normality for the edge frequency polygons. Statistics 2023, 57, 1444–1468. [Google Scholar] [CrossRef] [Scilit]
- Younso, A. Consistency of the frequency polygon estimators of density mode for strongly mixing processes. Commun. Stat.-Theory Methods 2023, 52, 2182–2197. [Google Scholar] [CrossRef] [Scilit]
- Wu, Y.; Wang, X.J. On Berry–Esséen bound of frequency polygon estimation under ρ-mixing samples. Metrika 2024, 88, 19–41. [Google Scholar] [CrossRef] [Scilit]
- Wang, W.; Wang, H.; Wu, Y. Consistency of the frequency polygon estimators of density function and density mode under m-END samples. Commun. Stat.-Theory Methods 2024, 54, 1271–1286. [Google Scholar] [CrossRef] [Scilit]
- Chao, X.L.; Hu, X.P. Asymptotic normality of the frequency polygon estimators under widely orthant dependent samples. Commun. Stat.-Simul. Comput. 2025. [Google Scholar] [CrossRef] [Scilit]
- Li, Y.M.; Pang, W.C.; Feng, Z.Q.; Li, N.Y. On the linearly extended negative quadrant dependent random variables and its inequalities. Commun. Stat.-Theory Methods 2023, 52, 8696–8711. [Google Scholar] [CrossRef] [Scilit]
- Joag-Dev, K.; Proschan, F. Negative association of random variables with applications. Ann. Stat. 1983, 11, 286–295. [Google Scholar] [CrossRef] [Scilit]
- Liu, L. Precise large deviations for dependent random variables with heavy tails. Stat. Probab. Lett. 2009, 79, 1290–1298. [Google Scholar] [CrossRef] [Scilit]
- Li, Y.M.; Pang, W.C.; Feng, Z.Q.; Li, N.Y. Asymptotic properties of Kaplan–Meier estimator and hazard estimator for censored survival time with LENQD data. Stat. Theory Relat. Fields 2024, 8, 107–116. [Google Scholar] [CrossRef] [Scilit]
- El Alem, M.K. Some results on m-linearly extended negative quadrant dependent random variables. Commun. Stat.-Theory Methods 2026, 55, 434–446. [Google Scholar] [CrossRef] [Scilit]
- El Alem, M.K.; Ahra, G.; Abdelkader, T.; Ourda, S. On the convergence rate in the central limit theorem for LENQD random variables and its applications. arXiv 2025. [Google Scholar] [CrossRef] [Scilit]
- El Alem, M.K.; Guessoum, Z.; Tatachak, A. On the behavior of the Lynden–Bell estimator in widely orthant-dependent model. Commun. Stat.-Theory Methods 2025, 54, 1441–1460. [Google Scholar] [CrossRef] [Scilit]
- Petrov, V.V. Limit Theorems of Probability Theory: Sequences of Independent Random Variables; Oxford University Press: New York, NY, USA, 1995. [Google Scholar]
- Yang, S.C. Uniformly asymptotic normality of the regression weighted estimator for negatively associated samples. Stat. Probab. Lett. 2003, 62, 101–110. [Google Scholar] [CrossRef] [Scilit]

Disclaimer/Publisher’s Note: The statements, opinions and data contained in all publications are solely those of the individual author(s) and contributor(s) and not of MDPI and/or the editor(s). MDPI and/or the editor(s) disclaim responsibility for any injury to people or property resulting from any ideas, methods, instructions or products referred to in the content. |
© 2026 by the authors. Licensee MDPI, Basel, Switzerland. This article is an open access article distributed under the terms and conditions of the Creative Commons Attribution (CC BY) license.