


Abstract
This paper presents a comprehensive reliability analysis framework for the Chris–Jerry (CJ) lifetime distribution under an improved adaptive progressive Type-II censoring plan. The CJ model, recently introduced to capture skewed lifetime behaviors, is studied under a modified censoring structure designed to provide greater flexibility in terminating life-testing experiments. We derive maximum likelihood estimators for the CJ parameters and key reliability measures, including the reliability and hazard rate functions, and construct approximate confidence intervals using the observed Fisher information matrix and the delta method. To address the intractability of the likelihood function, Bayesian estimators are obtained under independent gamma priors and a squared-error loss function. Because the posterior distributions are not available in closed form, we apply the Metropolis–Hastings algorithm to generate Bayesian estimates and two types of credible intervals. A comprehensive simulation study evaluates the performance of the proposed estimation techniques under various censoring scenarios. The framework is further validated through two real-world datasets: one involving rainfall measurements and another concerning mechanical failure times. In both cases, the CJ model combined with the proposed censoring strategy demonstrates superior fit and reliability inference compared to competing models. These findings highlight the value of the CJ distribution, together with advanced censoring methods, for modeling lifetime data in physics and engineering applications.
Keywords:
Chris–Jerry distribution; improved censoring; likelihood and Bayesian estimation; MCMC; asymptotic and credible intervals; delta method; reliability metrics MSC:
62F10; 62F15; 62N01; 62N02; 62N05
1. Introduction
Recently, the development of flexible lifetime distributions has become increasingly important for accurately modeling real-world phenomena, particularly in reliability and survival analysis. Among these, the Chris–Jerry (CJ()) distribution, introduced by Onyekwere and Obulezi [1], has emerged as a valuable contribution to the statistical literature. Its density can take unimodal or decreasing shapes, while its hazard function can exhibit a bathtub shape. This model is notable for its ability to capture positively skewed data, enhancing its applicability across a wide range of practical scenarios. It also provides closed-form expressions for its probability density and cumulative distribution functions, which facilitate both theoretical derivations and computational implementation. This flexibility makes the CJ distribution particularly suitable for modeling failure times in engineering systems and biomedical studies. Furthermore, its structure supports effective parameter estimation using both classical and Bayesian methods, even under complex censoring schemes, as demonstrated by Alotaibi et al. [2]. These properties underscore the CJ distribution’s potential as a robust and versatile tool in statistical inference and reliability analysis.
Let Y be a non-negative continuous random variable representing a lifetime. If Y∼ with , then the probability density function (PDF) and cumulative distribution function (CDF) of Y are given by
and
respectively.
The corresponding reliability function (RF) and hazard rate function (HRF), denoted by and , at a mission time , are given, respectively, by
and
Progressive Type-II censoring (T2-PC) has been widely used in reliability and survival analysis because of its advantages over conventional Type-II censoring (T2-C). One key benefit is the flexibility to remove functioning experimental units during the study, which is particularly valuable in industrial reliability assessments and clinical trials. In a typical T2-PC setup, suppose m failures are observed among n identical test units, where . A predetermined censoring scheme is specified before the experiment. At the first failure time, denoted , a randomly chosen units are withdrawn from the remaining units. After the second failure, , another units are removed from the remaining units, and this process continues. After the m-th failure, all remaining units corresponding to are censored, thus completing the experiment; see Balakrishnan and Cramer [3].
Within the hybrid censoring framework, Kundu and Joarder [4] introduced the progressive Type-I hybrid censoring (T1-PHC) scheme. Under this design, n units are observed according to a fixed progressive censoring plan , and the experiment terminates at , where t is a pre-specified time threshold. However, a key limitation of the T1-PHC scheme is the potential for a reduced observed sample size, which can compromise the efficiency of inferential procedures. To address this issue, Ng et al. [5] proposed the adaptive T2-PC (T2-APC) scheme, which improves estimation precision. In this design, the number of failures m is predetermined, and although a censoring scheme is initially specified, its elements can be adaptively modified during the course of the experiment. The sampling structure follows that of the T2-PC, but the stopping criterion is adjusted to enhance practical applicability.
Nonetheless, if the test units exhibit very long survival times, the overall experiment duration under the T2-APC design may become impractically long. To overcome this limitation, Yan et al. [6] recently proposed the improved T2-APC (IT2-APC) scheme. This approach generalizes both the T1-PHC and T2-APC designs and introduces two time thresholds, and , where , thereby imposing an upper bound on the total test duration. The IT2-APC retains the progressive unit-removal mechanism of the T2-PC, with m planned failures from a total of n test units under a censoring scheme . After the first failure time, , a random selection of units is withdrawn from the remaining units. Subsequent failures trigger the removal of units based on the updated risk set. Let denote the number of observed failures by time , and similarly, let represent the number of observed failures by time . Depending on when the experiment terminates, the observed data will correspond to one of the next several censoring scenarios:
- Case-1: As , stop the test at .
- Case-2: As , reset as , stop the test at .
- Case-3: As , reset as , stop the test at .
Let be the observed sample of size obtained under an IT2-APC scheme from a continuous population with PDF and CDF . The joint likelihood function (LF) of for this sample can be written as
where and A is a term free of parameter(s). To distinguish, Table 1 explains the binary operators of the IT2-APC scheme represented in the LF (5).
Table 1.
Options of and .
It is important to note that several well-known censoring schemes can be obtained as special cases of the IT2-APC design, including the following:
- The T1-PHC, proposed by Kundu and Joarder [4], when ;
- The T2-APC, proposed by Ng et al. [5], when ;
- The T2-PC, described by Balakrishnan and Cramer [3], when ;
- The T2-C, described by Bain and Engelhardt [7], when , for , and .
Essentially, the threshold serves as an early warning of the progress of the experiment, while the threshold indicates the absolute maximum allowable duration of the study. If the threshold is reached before a pre-specified number of failures m occurs, the experiment is terminated at . This modification addresses the limitation of the T2-APC design proposed by Ng et al. [5], in which the total test duration was not guaranteed. By introducing the upper bound , the IT2-APC strategy ensures that the total experiment time will not exceed this limit. In the literature, several works have dealt with this censoring plan, including the Weibull distribution (Nassar and Elshahhat [8]), Burr Type-III (Asadi et al. [9]), Nadarajah–Haghighi (El-Sherpieny et al. [10]), and the power half-normal (Alqasem and Elshahhat [11]).
The rapid advancement of technology and digital systems has increased the demand for censoring schemes that are both flexible and computationally efficient, particularly for analyzing modern reliability data characterized by bounded measures such as proportions or failure rates. Recent developments in lifetime data analysis highlight the importance of adaptable censoring strategies supported by computationally intensive Bayesian inference techniques. These insights reflect the growing need for robust methodologies that can effectively handle small sample data, high levels of oversight, and application-based reliability studies in engineering, biomedical sciences, and physical sciences. Although the CJ distribution is structurally simple, its key advantage is its ability to capture bathtub-shaped hazard behavior. Censored observations, particularly those arising from the IT2-APC design, are common due to cost and time constraints, underscoring the need for adaptive censoring strategies. Integrating the CJ model with this censoring mechanism enhances both the precision and reliability of lifetime data analysis. Under the IT2-APC framework, this study is conducted with the following key objectives:
- To estimate the model parameter , as well as the RF and HRF , for the CJ distribution using both maximum likelihood and Bayesian approaches.
- To construct confidence intervals for the parameters of interest based on the asymptotic properties of the maximum likelihood estimators (MLEs) and log-transformed MLEs (log-MLEs).
- To derive the Bayesian estimates, highest posterior density (HPD) intervals, and Bayesian credible intervals (BCIs) for , , and via Markov chain Monte Carlo (MCMC) methods.
- To implement the estimation procedures in the R programming environment (version 4.2.2) using the maxLik package (Henningsen and Toomet [12]) for likelihood optimization and the coda package (Plummer et al. [13]) for MCMC diagnostics.
- To assess the accuracy and efficiency of the proposed estimators through comprehensive simulation studies and multiple performance metrics.
- To demonstrate the practical applicability of the CJ distribution by analyzing two real-world datasets from physics and engineering sectors.
The remainder of this paper is organized as follows: Section 2 and Section 3 present the frequentist and Bayesian estimation methods, respectively. Simulation results are discussed in Section 4, and two real-data applications are analyzed in Section 5. Finally, Section 6 summarizes the main findings and provides concluding remarks.
2. Likelihood Inference
This section focuses on the estimation of the MLEs for the CJ parameters , , and . The ACIs for , , and are derived using the observed Fisher information (FI) matrix together with the delta method. Using (1), (2), and (5), we can rewrite (5) as follows:
where , , and . The corresponding log-LF of (6) becomes
Subsequently, the MLE of , denoted by , is obtained by maximizing (7) and solving the following nonlinear normal equation:
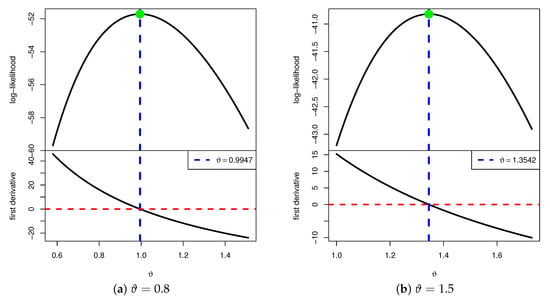
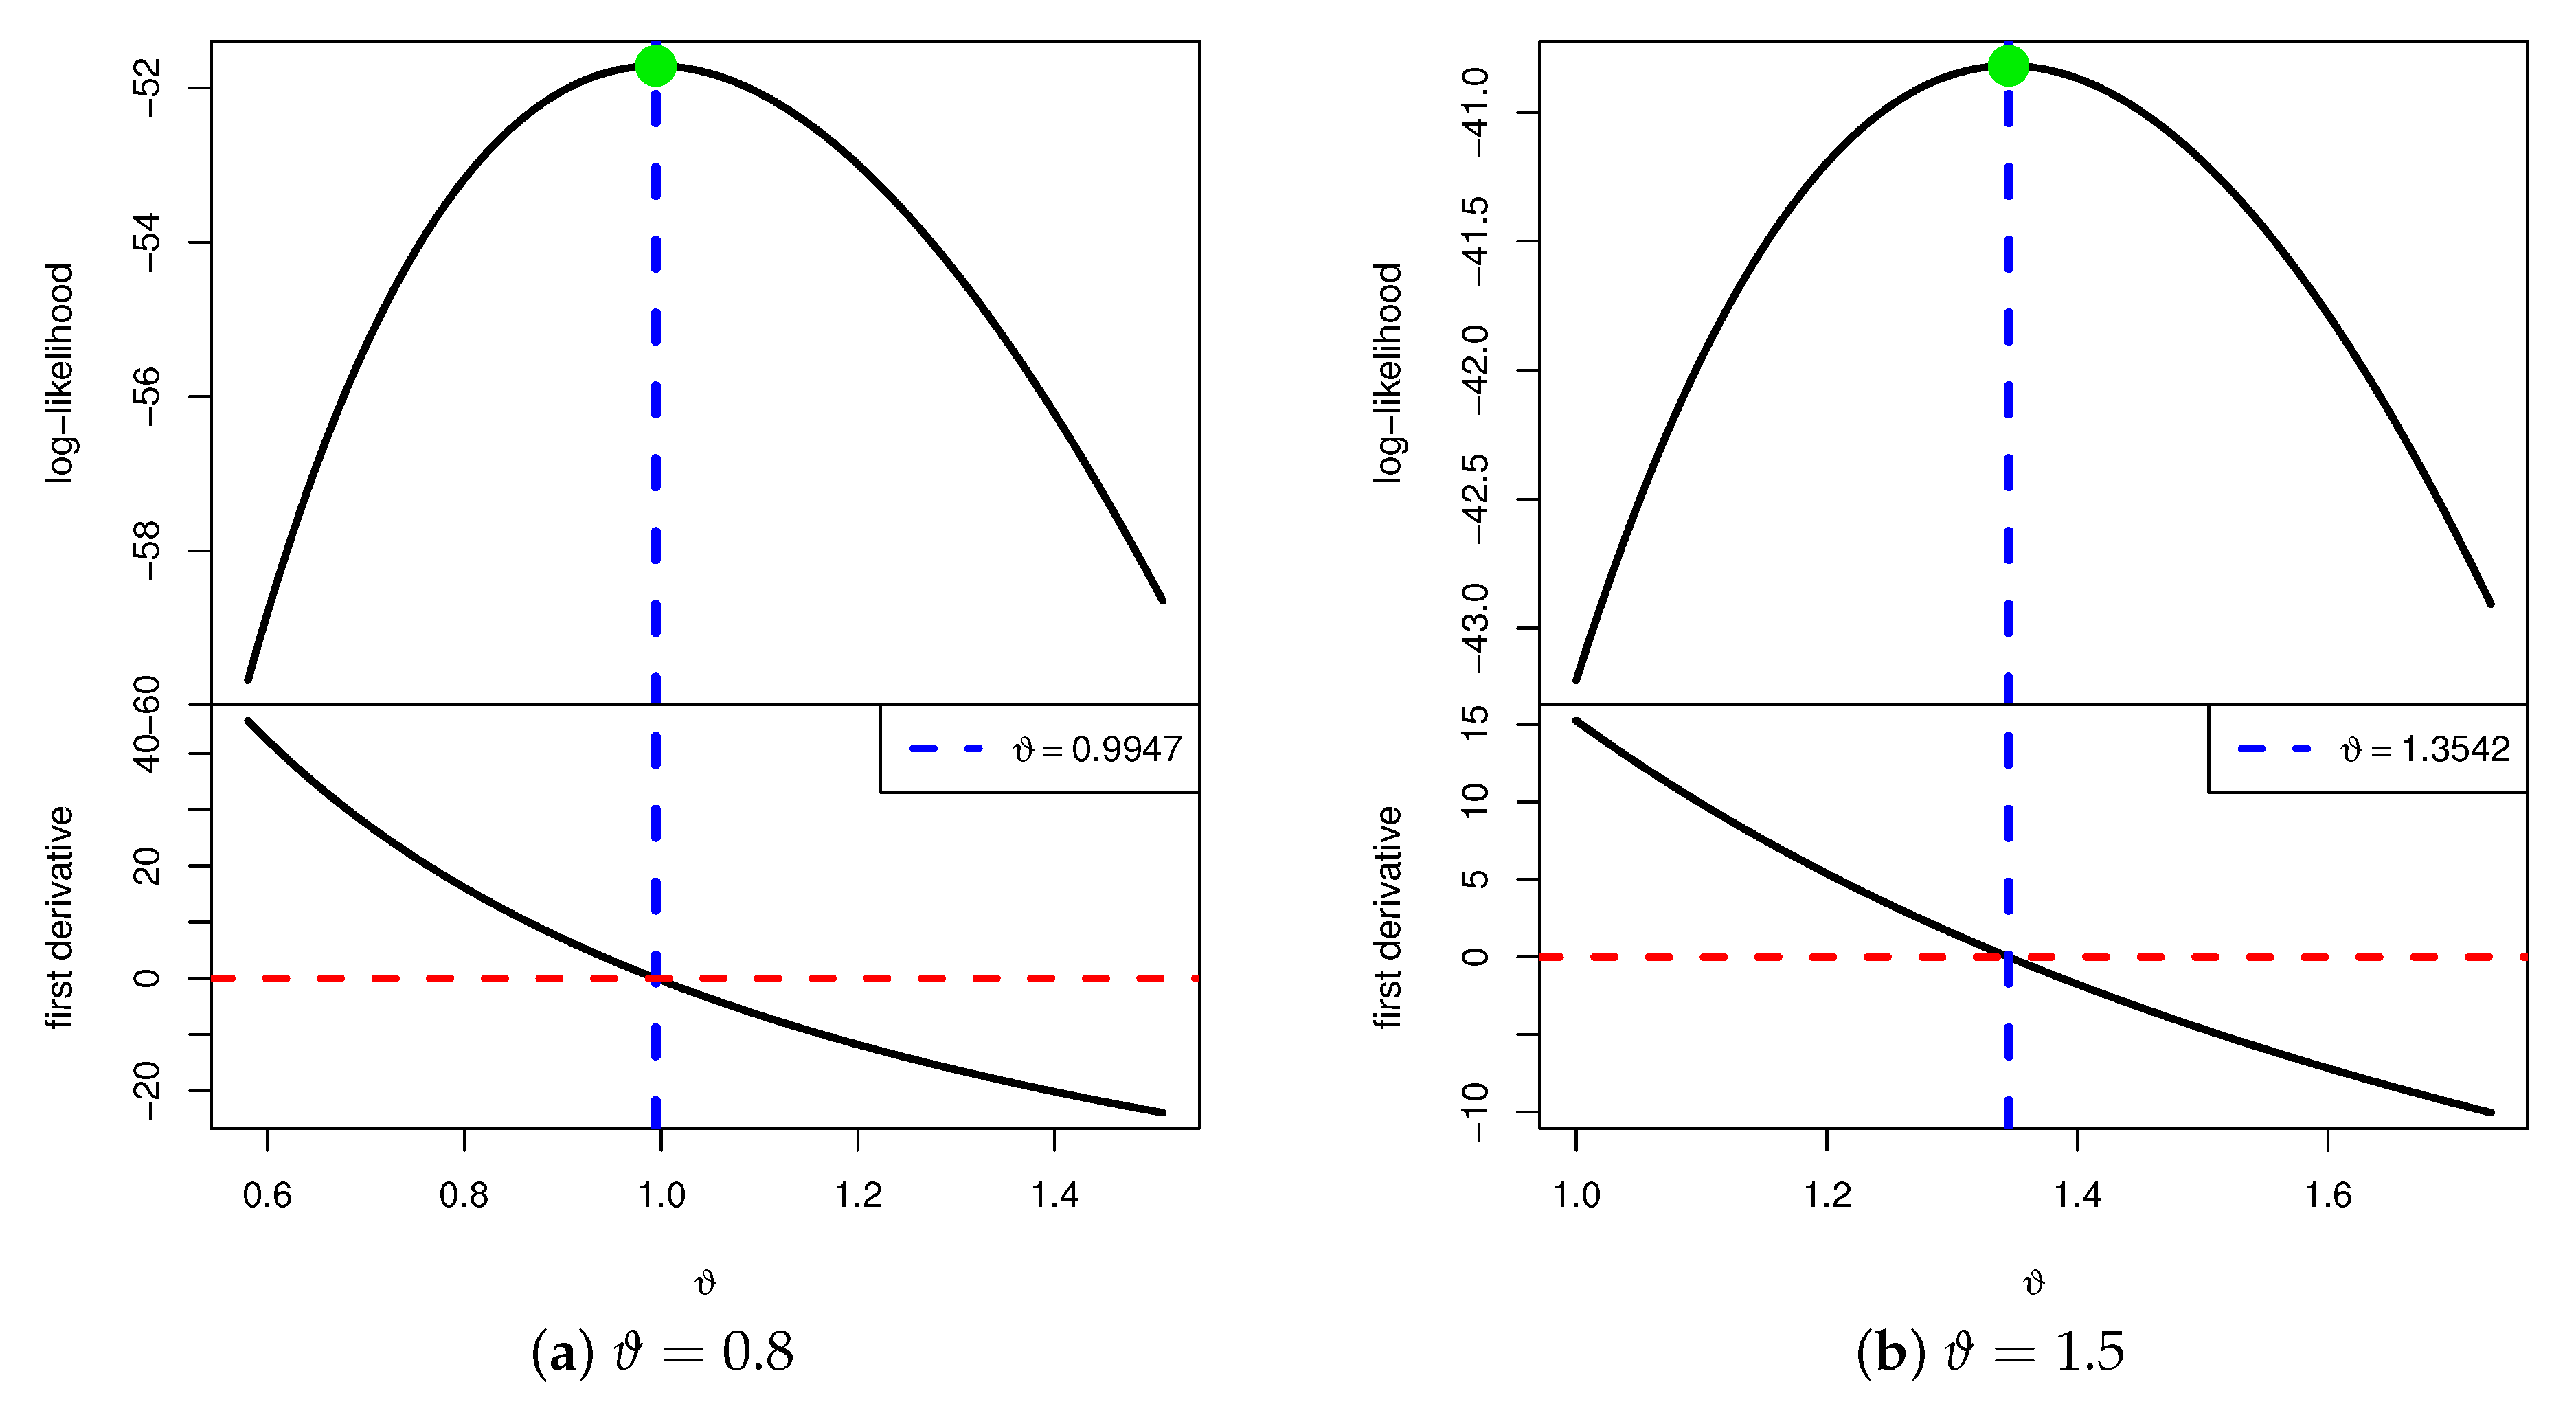
We now investigate the existence and uniqueness of numerically by simulating an IT2-APC sample from the CJ distribution with parameters , under the setup , , , and a uniformly T2-PC scheme. The numerical results yield MLEs of as 0.9947 and 1.3542 for , respectively. Figure 1 displays the log-LF defined in (7) and the score function given in (8), plotted as functions of over a selected range. As shown, the vertical line representing the MLE of intersects the log-LF curve at its maximum and intersects the score function at zero. These observations confirm that, for each value of , the MLE exists and is unique.
Figure 1.
The log-LF curve versus its score function curve.
The MLEs of RF and HRF, denoted and (for ), are obtained by substituting into Equations (2) and (4), yielding
By applying the Newton–Raphson (NR) algorithm through the maxLik package in the R environment, the estimates , , and can be efficiently computed.
In addition to the point estimates, constructing the ACIs for the parameters , , and is of practical importance. Leveraging the asymptotic properties of the MLE , these ACIs can be derived as follows. Specifically, the asymptotic distribution of is approximately normal with mean and variance-covariance (VC) matrix , which is typically obtained from the FI matrix . Due to the analytical complexity of the FI, it is often more practical to approximate using the observed FI matrix evaluated at , denoted by . Consequently, the VC matrix is estimated as:
where
On the other hand, to construct the ACIs for the RF and HRF , it is first necessary to estimate the variances of their respective estimators, and . A widely used approach for this purpose is the delta method, which approximates these variances—denoted by and , respectively. Following the treatment in Greene [14], the delta method assumes that is approximately normally distributed with mean and variance , and similarly, is approximately normal with mean and variance .
Accordingly, the quantities of and are given, respectively, by:
where
Consequently, based on the normal approximation (NA) of , the ACI using the NA-based approach (ACI-NA) at significance level is given by
where is the upper standard Gaussian percentile point. Similarly, the ACI-NA estimator of or can be obtained.
A key limitation of the traditional ACI-NA approach is that it may produce negative lower bounds for parameters that are inherently restricted to positive values. In such cases, it is common to truncate negative bounds at zero, although this adjustment is heuristic rather than statistically rigorous. To address this limitation and improve the reliability of interval estimation, following Meeker and Escobar [15], the ACI based on the log-transform normal approximation (ACI-NL) is developed. Thus, the ACI-NL for is given by
which is equivalent to
Similarly, the ACI-NL for or can be derived in the same manner.
3. Bayesian Inference
This section focuses on developing both point estimates and credible Bayesian intervals for , , and . Within the Bayesian paradigm, prior distributions and loss functions play a crucial role. Selecting an appropriate prior for an unknown parameter can be challenging. As emphasized by Gelman et al. [16], there is no universally accepted criterion for choosing a suitable prior in Bayesian analysis. Since the CJ parameter lies in the interval , the gamma distribution provides a natural and tractable choice as a prior for . Assume ∼ where a and b are the hyperparameters. Then, the corresponding prior PDF, denoted by , is given by
From (6) and (10), the posterior PDF (say ) of can be expresses as follows:
where its normalized term (say, ) is given by
It is worth noting that we adopt the squared-error loss (SEL) function, primarily because it is the most widely used symmetric loss function in Bayesian analysis. Nevertheless, the proposed methodology can be readily extended to obtain Bayesian estimates under alternative loss functions. Based on the posterior distribution in (11), and given the nonlinear structure of the likelihood function in (6), the Bayesian estimates of , , and under the SEL function are analytically intractable.
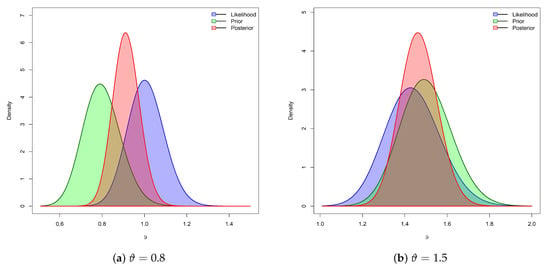
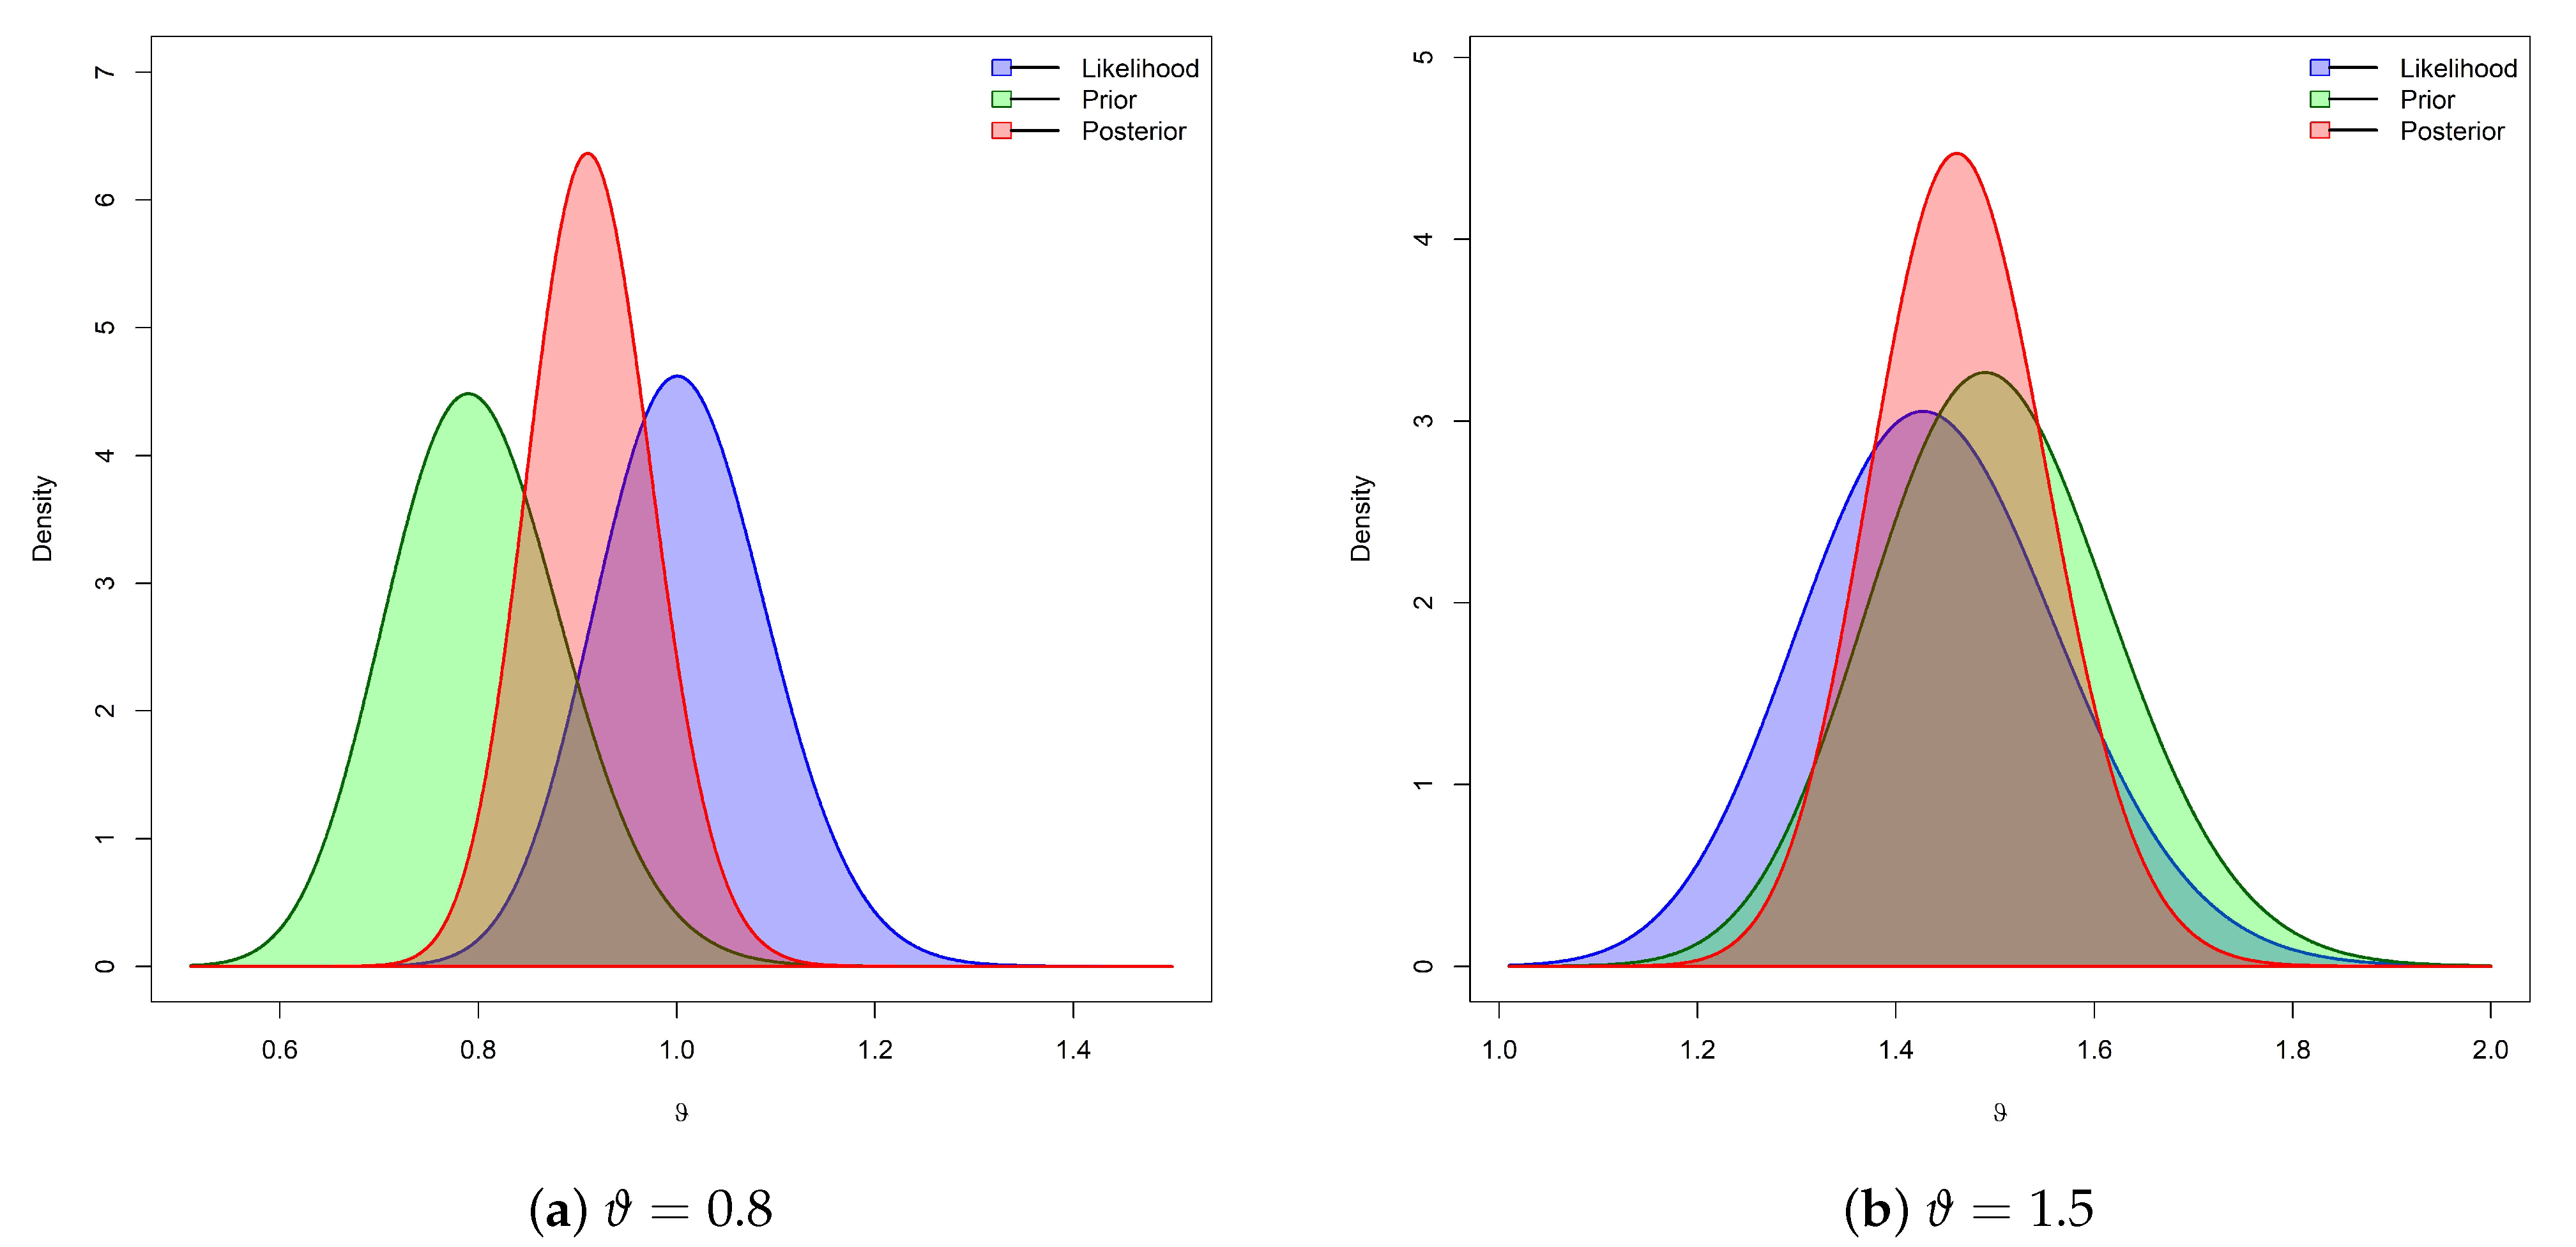
Consequently, by employing the MCMC technique, we generate Markovian samples from the posterior distribution in (11). Examining (11), it is evident that the PDF of cannot be expressed using any standard continuous statistical model. However, Figure 2 shows that the conditional PDF in (11) is approximately normal. Accordingly, following Algorithm 1, the Metropolis–Hastings (M-H) algorithm is employed to update the posterior samples of , after which the Bayesian estimates and the corresponding BCI/HPD interval estimates for , , and are computed.
| Algorithm 1 The M-H Algorithm for , , and |
|
Figure 2.
The likelihood, prior, and posterior density shapes.
4. Monte Carlo Comparisons
To evaluate the precision and practical applicability of the estimated values of , , and discussed in the preceding sections, a series of Monte Carlo simulations is conducted. Specifically, following Algorithm 2, the IT2-APC procedure is replicated 1000 times for each selected value of (namely, and ) to compute both point and interval estimates of the target parameters. For a fixed value of , the corresponding estimates of the reliability and hazard functions, , are obtained as (0.97797, 0.21747) for , and (0.94002, 0.59745) for . The simulation experiments are carried out under various configurations involving threshold parameters , total sample sizes n, effective sample sizes m, and the progressive censoring scheme . In particular, we consider , , and . Table 2 presents, for each value of n, several choices of failure sizes m along with their corresponding T2-PC schemes . For illustrative purposes, a notation such as indicates that five units are withdrawn from the experiment at each of the first two censoring stages.
| Algorithm 2 Simulate IT2-APC data. |
|
Table 2.
Different T2-PC designs in Monte Carlo simulations.
To further assess the sensitivity of the estimation procedures under the Bayesian framework, we consider two sets of hyperparameters for the CJ distribution under the two parameter settings. Following the prior elicitation strategy proposed by Kundu [17], we specify the hyperparameter values a and b in the gamma prior PDF, as follows:
- At : Prior-1:(4,5) and Prior-2:(8,10);
- At : Prior-1:(7.5,5) and Prior-2:(15,10).
Once 1000 IT2-APC datasets are generated, the frequentist estimates and their corresponding 95% ACI-NA and ACI-NL intervals for , , and are computed using the maxLik package. For the Bayesian analysis, 12,000 MCMC samples are drawn, with the first 2000 iterations discarded as burn-in. The resulting Bayesian estimates, along with their 95% BCI and HPD intervals for , , and , are then computed using the coda package.
Now, to evaluate the offered estimators obtained for the CJ() parameter, we calculate the following metrics:
- Mean Point Estimate:
- Root Mean Squared Error:
- Mean Relative Absolute Bias:
- Average Interval Length:
- Coverage Percentage:where is the desired estimate of at ith sample, is indicator function, is two-sided of asymptotic (or credible) of . Similarly, the same precision metrics can be readily applied to or .
In Table 3, Table 4 and Table 5, the point estimation results—including MPEs (1st Col.), RMSEs (2nd Col.), and MRABs (3rd Col.)—for , and are reported. Meanwhile, Table 6, Table 7 and Table 8 present the AILs (1st Col.) and CPs (2nd Col.) for the same parameters. Based on these tables, we derive the following observations, focusing on the lowest RMSEs, MRABs, and AILs, and the highest CPs:
- All results for , , and exhibit consistently satisfactory performance across the simulated configurations. This demonstrates that both point and interval estimators remain stable under varying censoring levels, sample sizes, and prior specifications, highlighting the robustness of the proposed inference framework.
- As n or m increase, the estimation accuracy of all model parameters improves. Larger sample sizes provide more information about the underlying failure-time distribution, reducing Monte Carlo variability and enhancing the coverage of interval estimates. A similar improvement is observed when the total number of removals, , decreases, as fewer removals preserve more observed failure times, thereby increasing the precision of parameter estimation.
- Increasing the threshold values (for ) results in more precise parameter estimates. Specifically, the RMSEs, MRABs, and AILs for , , and decrease, while the corresponding CPs increase. This indicates that longer censoring times provide more information about the tail behavior of the distribution, thereby improving inference for both the reliability and hazard functions.
- As the value of increases,
- –
- The RMSEs of , , and increase, indicating that higher shape parameter values introduce heavier tails, which make estimation more challenging;
- –
- The MRABs of and decrease, whereas that of increases, suggesting that bias behavior differs among the parameters, with being more sensitive to changes in than ;
- –
- The AILs for all parameters increase, and the CPs tend to decrease, confirming that as grows, the variability in estimates increases, making it harder to achieve nominal coverage levels.
- For the parameter values considered (), we observed that the RMSEs, MRABs, and AILs tend to increase as becomes larger, while the CPs decrease. These patterns are empirical for the chosen parameter values and may not necessarily generalize to all possible values of .
- Bayesian estimates obtained via MCMC sampling, along with their corresponding credible intervals, exhibit superior robustness compared to their frequentist counterparts. The use of informative priors stabilizes inference, particularly under heavy censoring and small-sample scenarios, resulting in reduced RMSEs and narrower intervals without compromising coverage.
- For each considered value of , the Bayesian estimator based on Prior-2 consistently produces more accurate results than other approaches. This improvement is attributable to the lower prior variance of Prior-2 relative to Prior-1, which enables the posterior distribution to concentrate more efficiently around the true parameter values. A similar trend is observed when comparing asymptotic intervals (ACI-NA and ACI-NL) with Bayesian intervals (BCI and HPD), as the latter adapt more effectively to model complexity.
- A comparative evaluation of the T2-PC designs listed in Table 2 reveals the following:
- –
- The point and interval estimates of and under configurations C (for and ) outperform those obtained from alternative schemes, indicating that these designs optimally balance the trade-off between sample size, number of removals, and censoring thresholds;
- –
- The estimates of achieve the highest accuracy under configurations A (for and ), suggesting that reliability estimation may require different censoring strategies than those optimal for hazard estimation.
- Comparing the proposed interval estimation techniques, we noted the following:
- –
- The ACI-NA approach outperforms ACI-NL for estimating and , whereas the reverse holds for , indicating that linearization-based approximations are more effective for certain types of parameters;
- –
- The HPD method yields superior interval estimates for all parameters compared to the BCI approach, highlighting the efficiency of HPD intervals in summarizing posterior distributions;
- –
- Overall, Bayesian interval estimates (BCIs or HPD) consistently outperform asymptotic intervals (ACI-NA or ACI-NL), emphasizing the advantages of Bayesian inference in heavily censored experimental designs.
- In conclusion, for practitioners involved in reliability analysis, the CJ lifetime population is best explored through a Bayesian framework using the MCMC methodology, particularly via the M-H sampling algorithm.
Table 3.
Point estimations of .
Table 4.
Point estimations of .
Table 5.
Point estimations of .
Table 6.
Interval estimations of .
Table 7.
Interval estimations of .
Table 8.
Interval estimations of .
5. Data Analysis
This section focuses on demonstrating the practical utility of the proposed estimators and validating the effectiveness of the suggested estimation procedures. To achieve this, we analyze two real-world datasets from the fields of physics and engineering.
5.1. Physics Application
This application examines monthly total rainfall data collected between January 2000 and February 2007 at the Carrol rain gauge station, located on the east coast of New South Wales, Australia. This dataset, originally obtained from the Australian Government Bureau of Meteorology (https://www.bom.gov.au)(accessed on 2 August 2025), was first analyzed by Jodrá et al. [18].
Recently, Alotaibi et al. [19,20] reanalyzed this dataset. For computational convenience, each rainfall observation in Table 9 has been scaled by a factor of ten. To evaluate the adequacy of the proposed CJ model, we examine the point and interval estimates of , , and . In particular, we compute the MLE of along with its standard error (Std.Er), and we perform the Kolmogorov–Smirnov (KS) goodness-of-fit test, reporting both the test statistic and its associated p-value. From Table 9, the MLE (Std.Er) of is , and the KS statistic (p-value) is . These results indicate a strong fit of the CJ model to the rainfall data, supported by narrow confidence intervals and a large p-value from the KS test.
Table 9.
Monthly total rainfall (in mm) in the state of New South Wales.
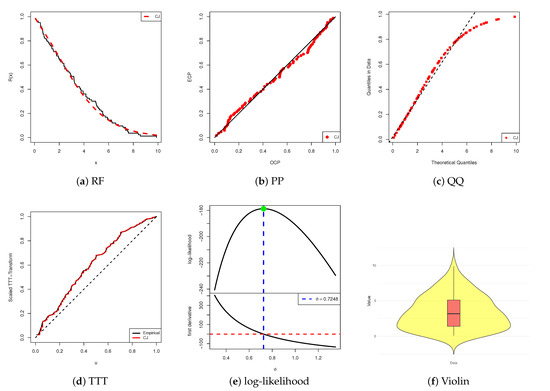
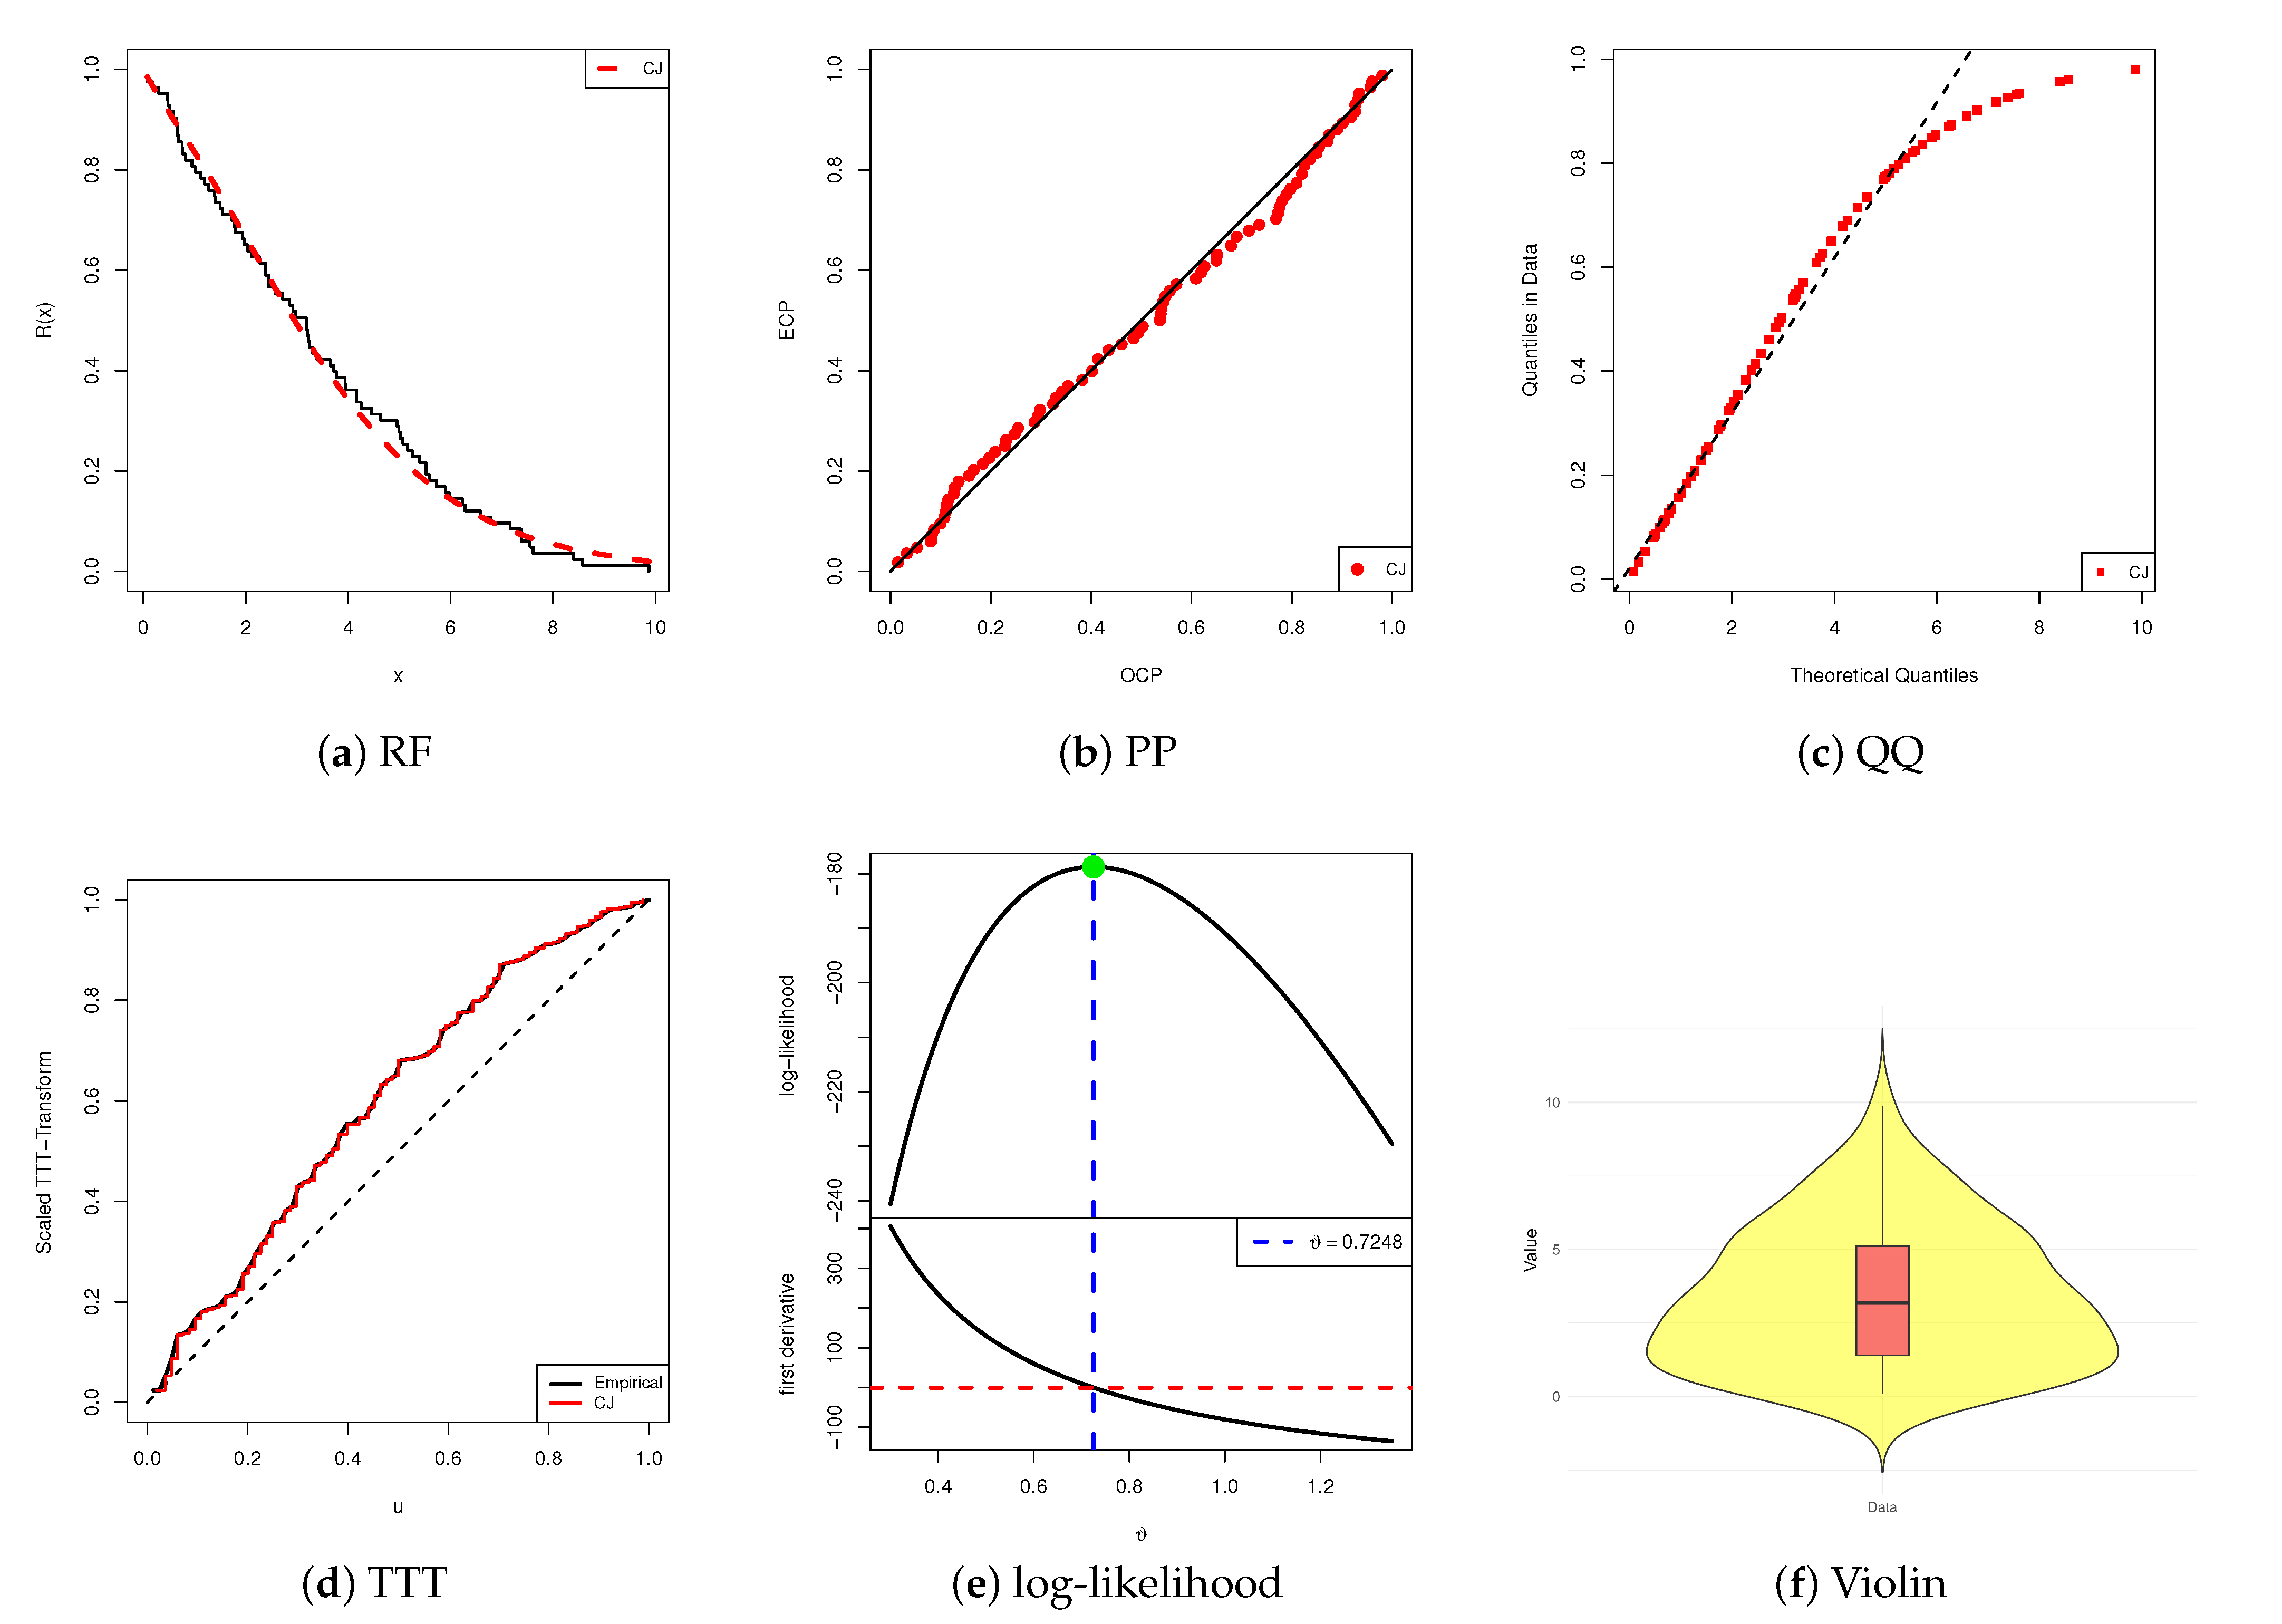
To visually evaluate the model fitting results, Figure 3 presents the RF plots, probability–probability (PP) and quantile–quantile (QQ) plots, the scaled total time on test (TTT) transform, the log-likelihood curve versus the normal equation, and a combined boxplot-within-violin plot. Based on the complete rainfall data summarized in Table 9, subplots in Figure 3a–c indicate a satisfactory fit of the CJ model, consistent with the numerical goodness-of-fit findings. Figure 3d shows that the data exhibit an increasing HRF, while Figure 3e confirms the existence and uniqueness of the MLE . Accordingly, is recommended as the initial value in subsequent estimation procedures. Finally, Figure 3f illustrates that the rainfall distribution is moderately right-skewed, with a wide spread and several high-value outliers, indicating notable variability in the dataset.
Figure 3.
Fitting diagrams of the CJ model from the rainfall dataset.
From the full dataset of monthly rainfall, three artificial IT2-APC samples (with fixed and varying choices of and threshold values ) are generated and summarized in Table 10. Since no prior knowledge of the CJ() model is available for this dataset, an improper gamma prior with hyperparameters is employed to update . The frequentist point estimates of are used as initial values for running the proposed MCMC sampler. After discarding the first 10,000 iterations from a total of 50,000, the Bayesian point estimates and their associated credible interval estimates for , , and are obtained. For each configuration , , the point estimates (with their standard errors) and the corresponding 95% interval estimates (with interval lengths (ILs)) of , , and at are presented in Table 11. From Table 11, it is observed that the estimates of and , except for , obtained via the likelihood-based method are quite similar to those derived under the Bayesian framework. However, the Bayesian estimates generally outperform the frequentist ones in terms of smaller standard errors. Furthermore, both the 95% BCI and HPD interval results exhibit narrower widths than their 95% ACI-NA and ACI-NL counterparts, indicating improved precision.
Table 10.
Different IT2-APC samples from the rainfall dataset.
Table 11.
Estimates of , , and from rainfall data.
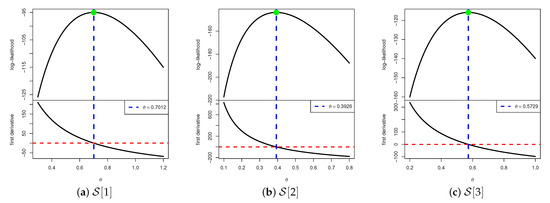
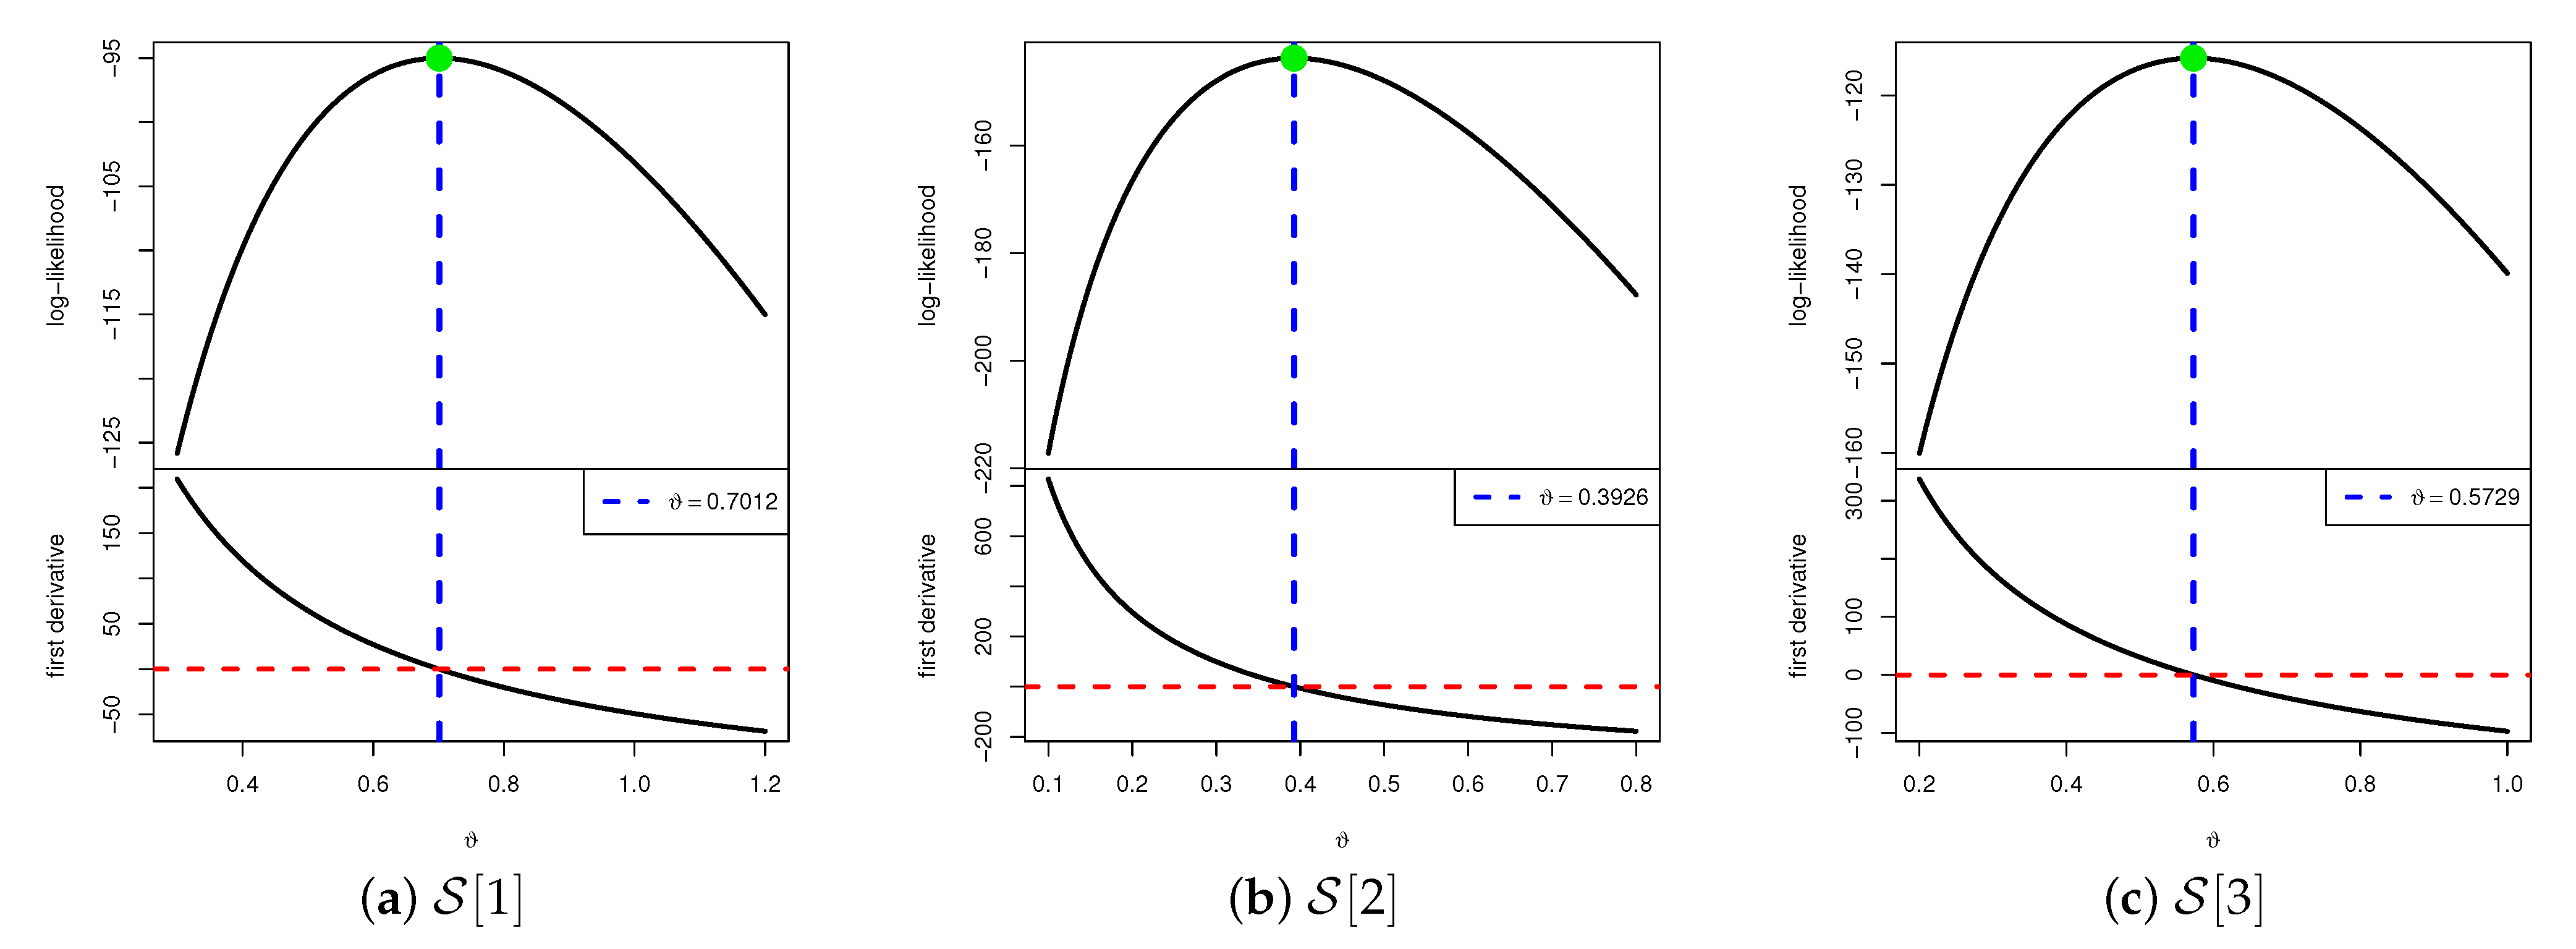
To demonstrate the existence and uniqueness of the fitted MLE of , Figure 4 presents the log-likelihood curves along with their corresponding first derivative (score) functions for all samples , , under varying values of . The plots clearly show that the estimated MLE exists and is unique for each sample configuration. These graphical results are consistent with the numerical findings reported in Table 11 and further justify the use of the estimated values as initial guesses in subsequent Bayesian inference procedures.
Figure 4.
Plots of log-likelihood/score functions of from the rainfall data.
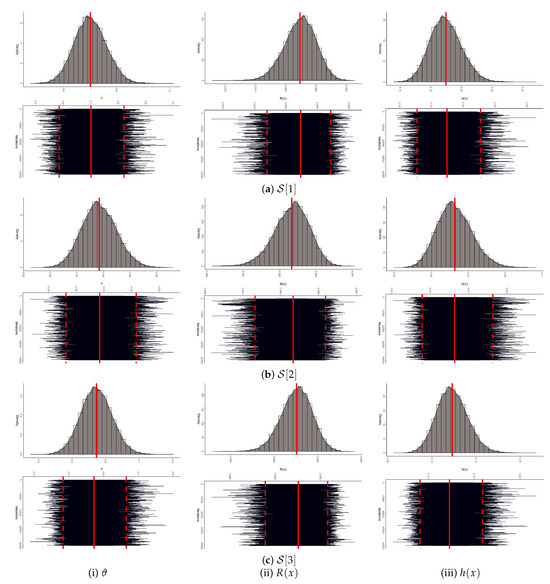
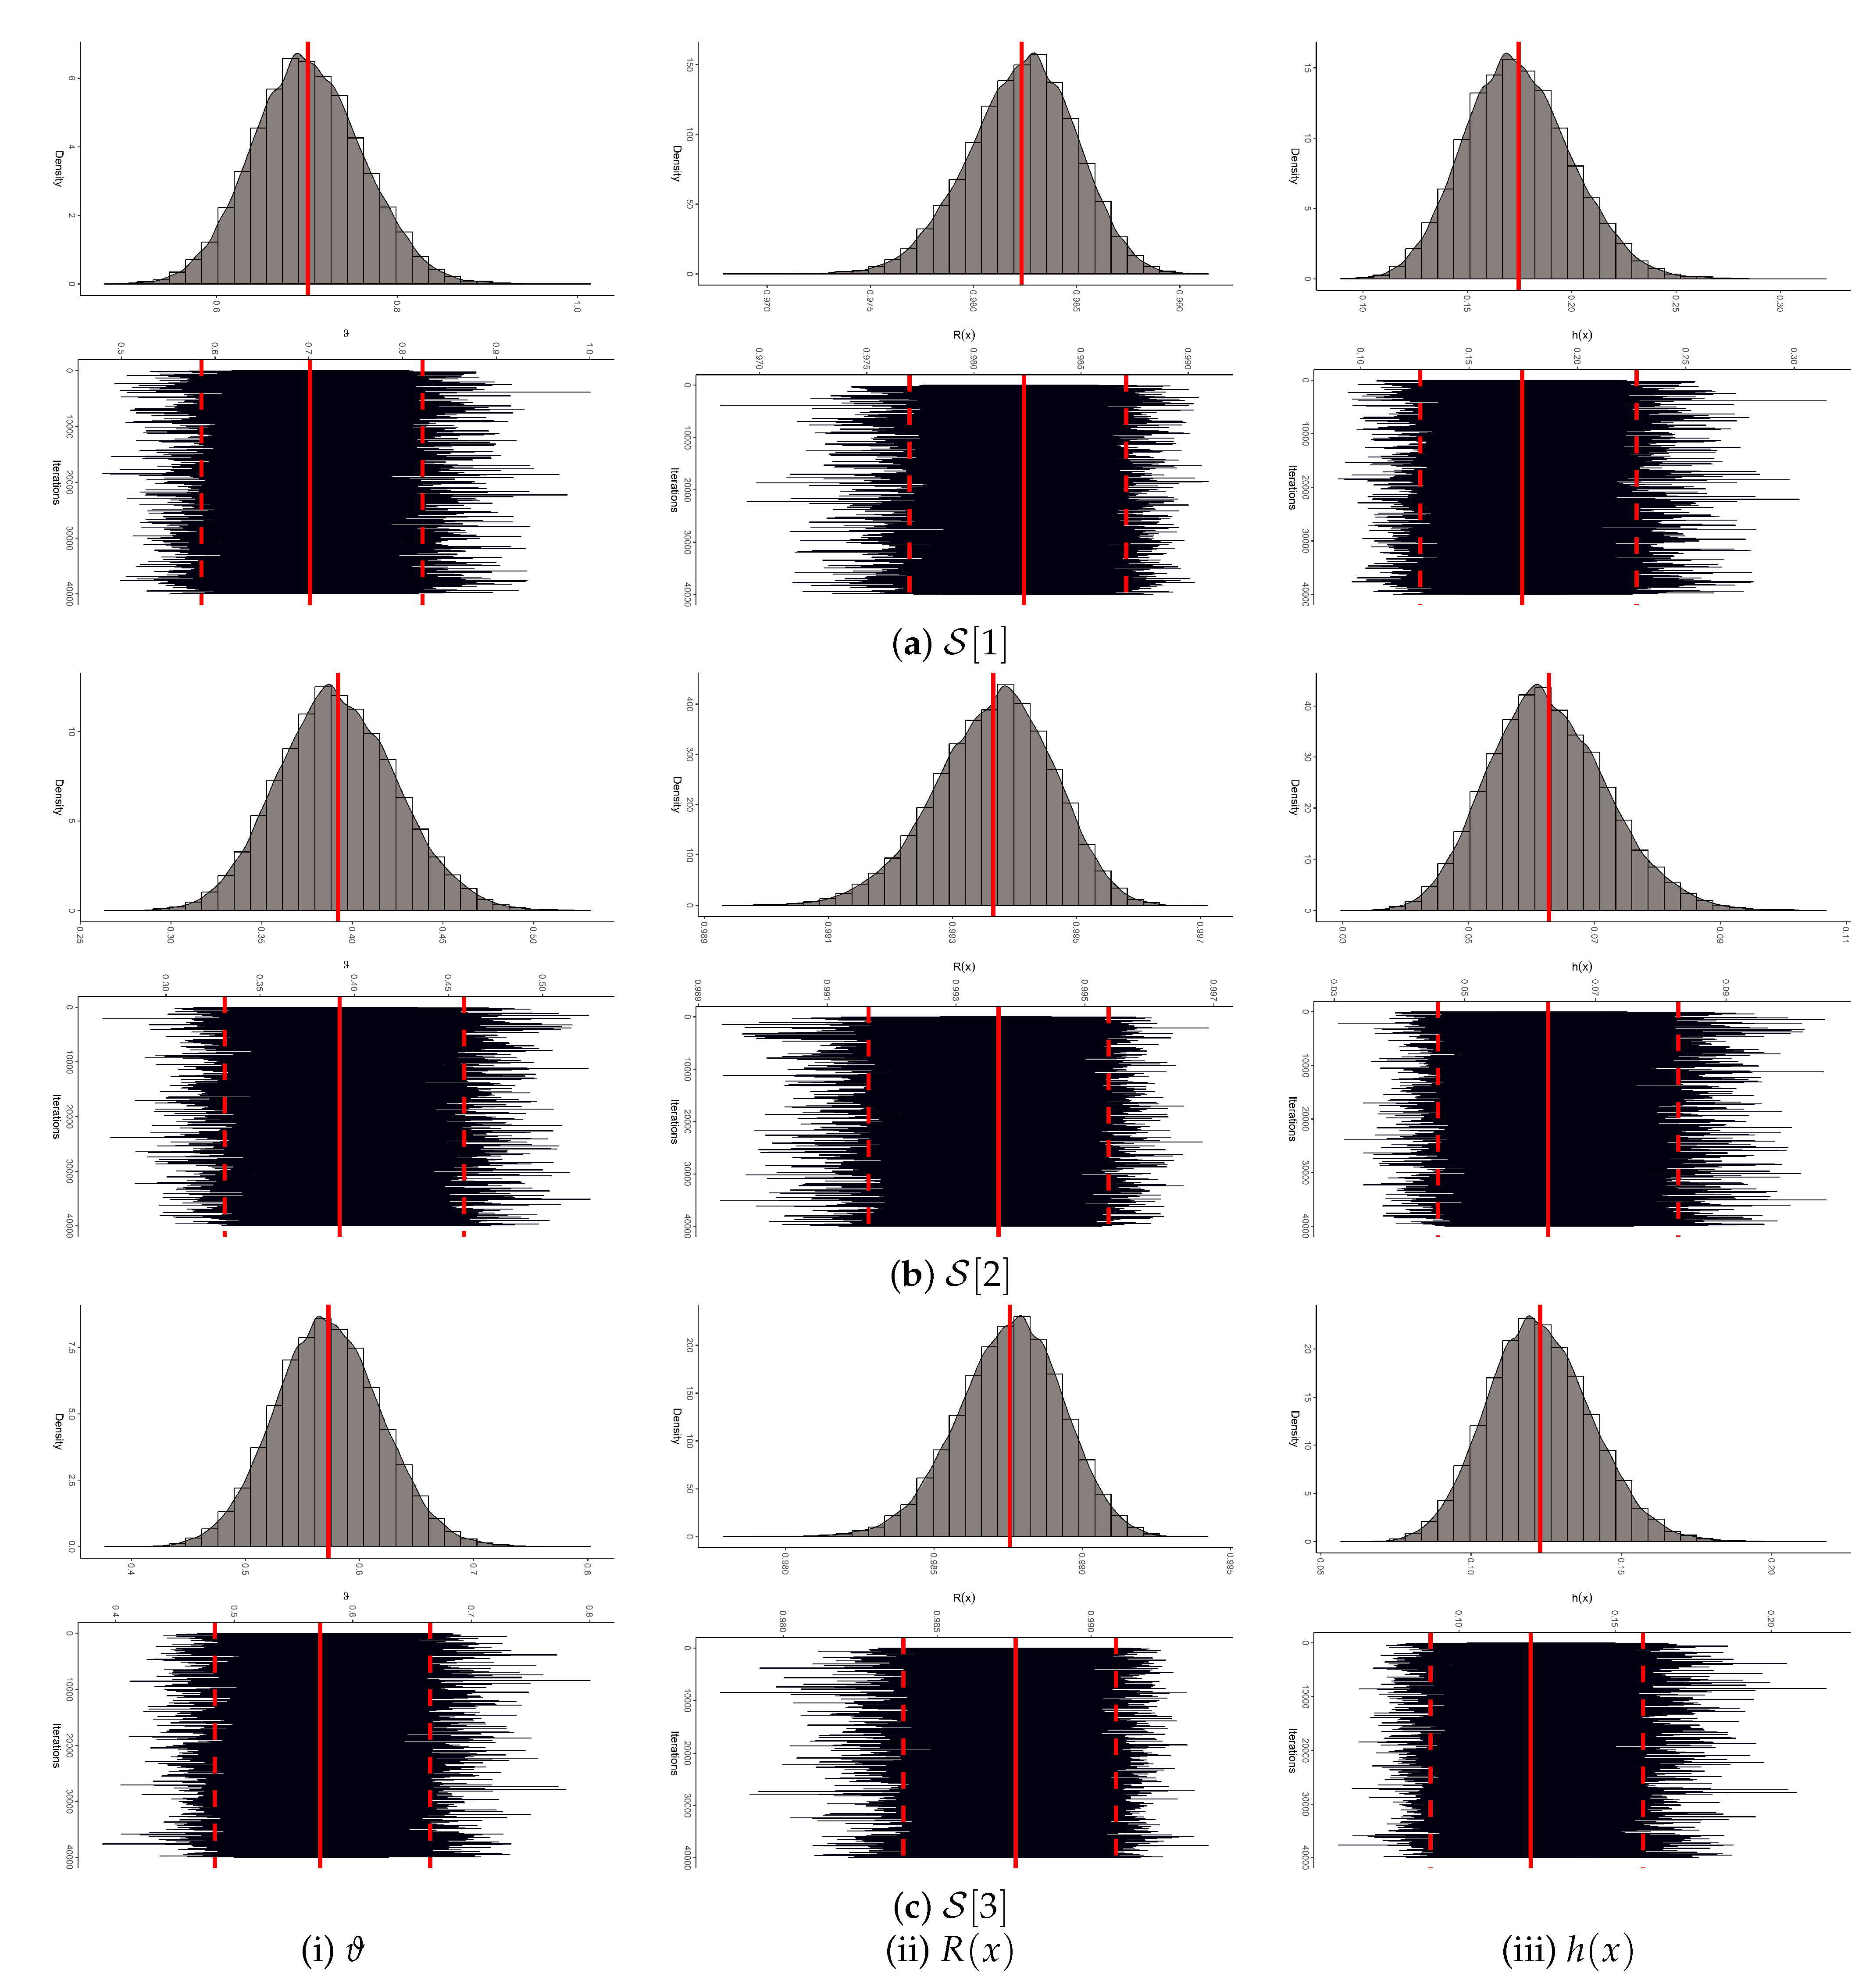
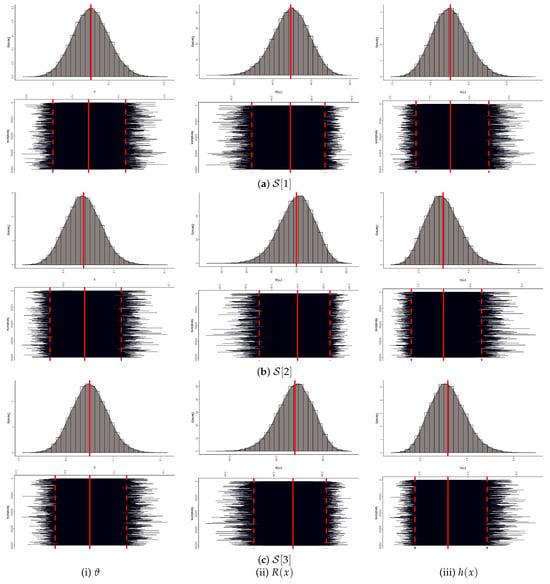
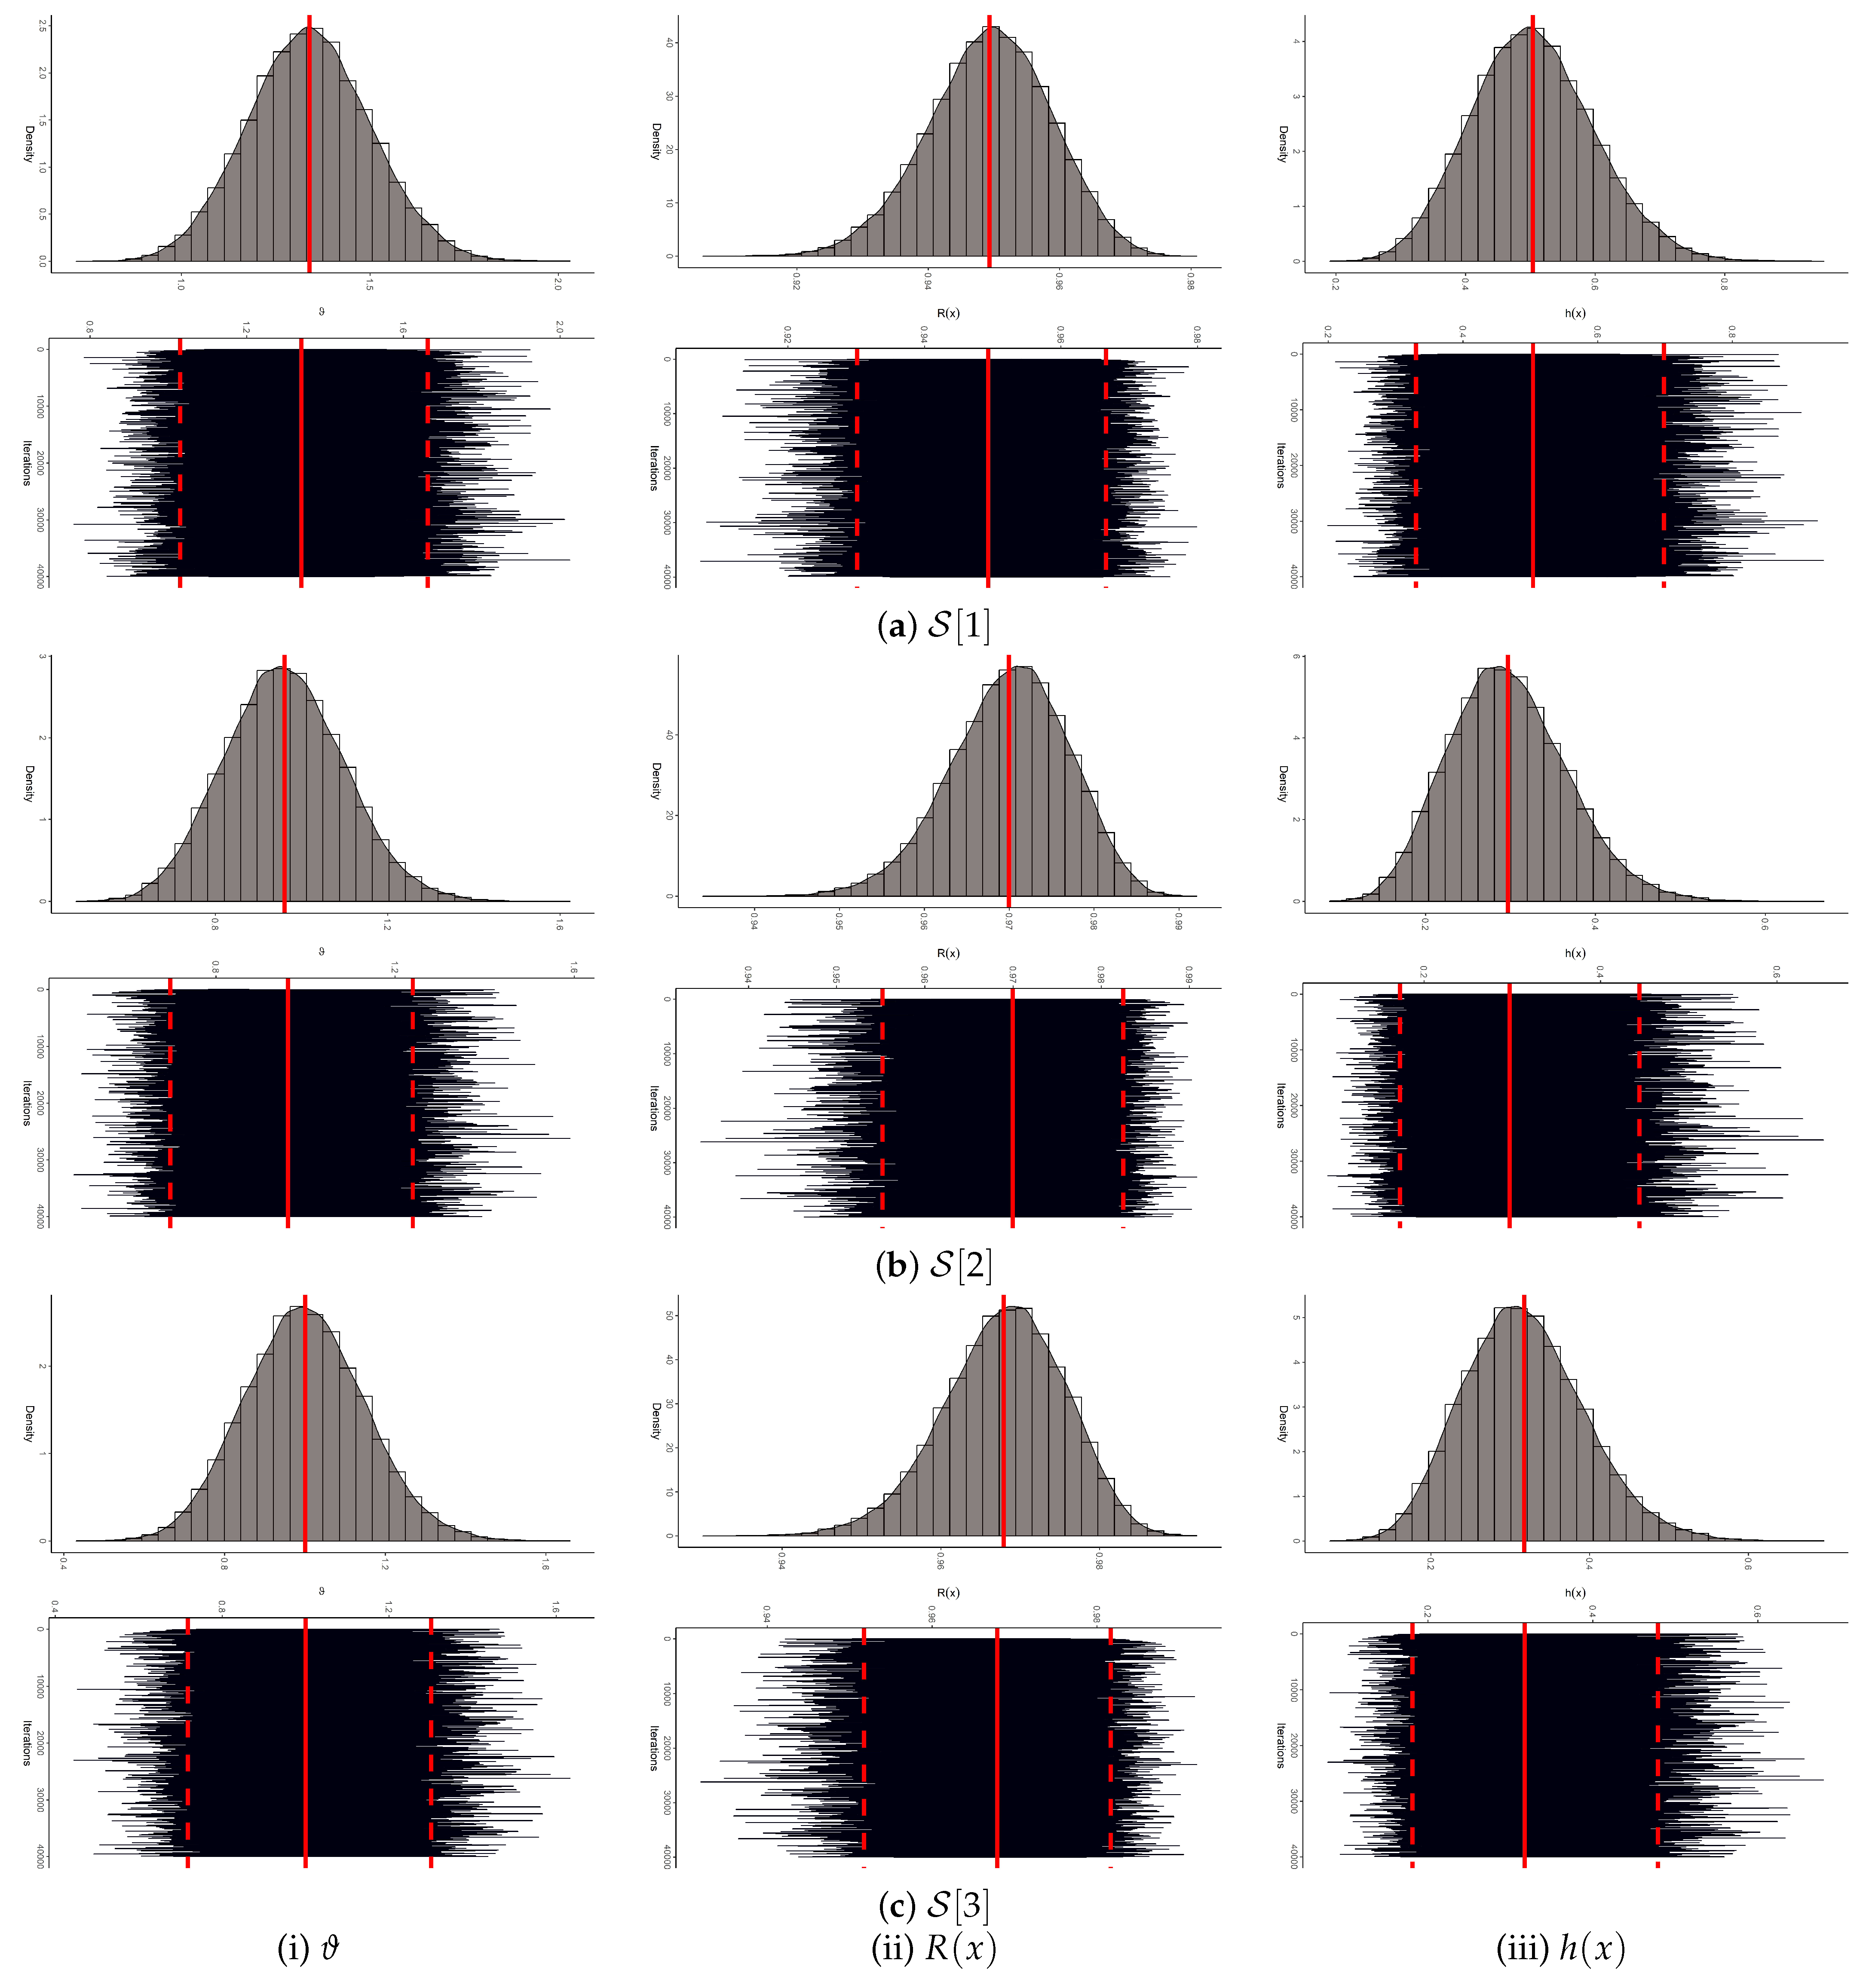
To assess the convergence behavior of the MCMC samples for , , and , both trace plots and posterior density plots for each parameter are presented in Figure 5. For clarity, the MCMC posterior mean and the 95% BCI bounds are indicated by solid and dashed red lines, respectively. Figure 5 shows that the generated Markov chains for , , and exhibit satisfactory convergence. Moreover, the posterior samples of are approximately symmetric, while those of and display negative and positive skewness, respectively. Using the remaining 40,000 post-burn-in MCMC iterations, various summary statistics for , , and were computed. These include the posterior mean, mode, quartiles for , standard deviation (Std.D), and skewness (Sk.); see Table 12. All findings in Table 12 support the results reported in Table 11 and are visually confirmed in Figure 5.
Figure 5.
The density (top) and trace (bottom) for 40,000 MCMC iterations of , , and from the rainfall dataset.
Table 12.
Statistics for 40,000 MCMC iterations of , , and from rainfall data.
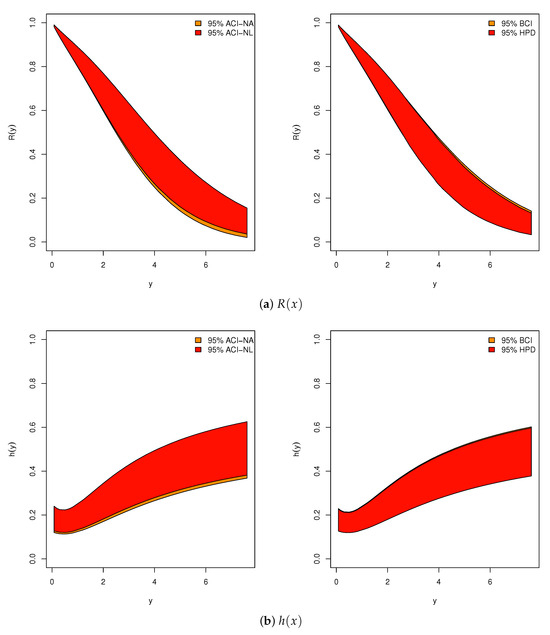
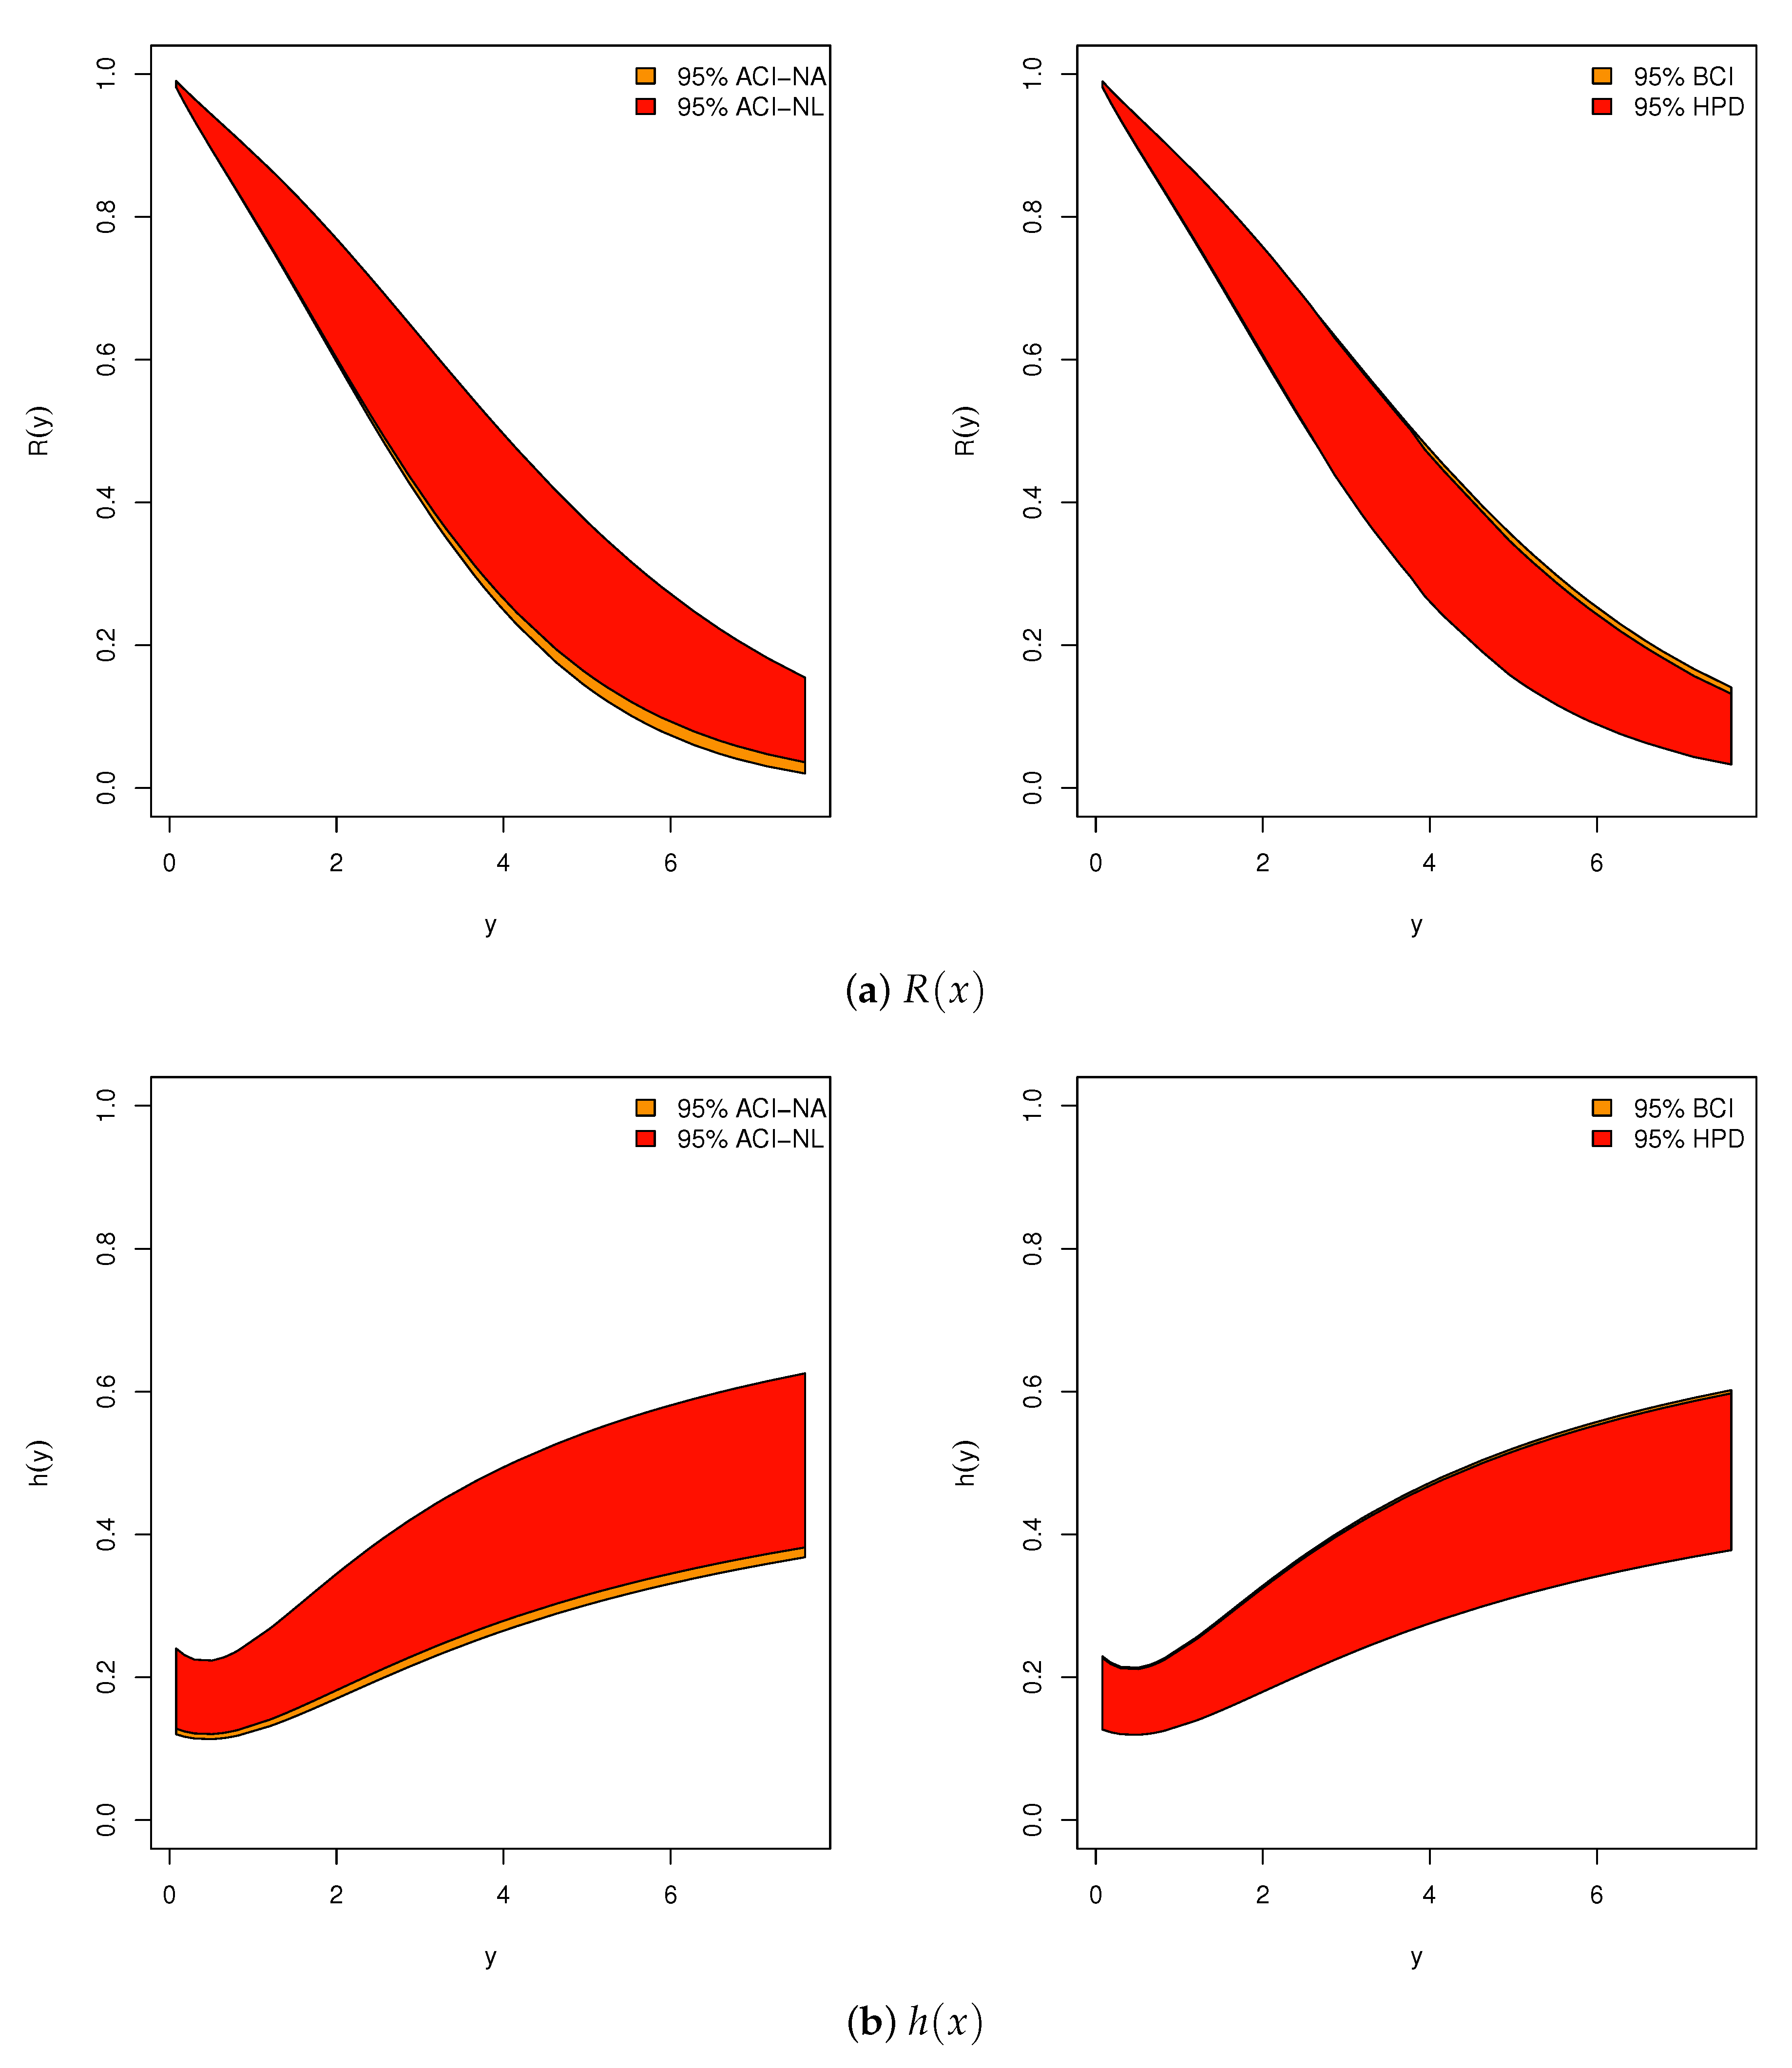
Figure 6 depicts the 95% ACI-NA/ACI-NL and BCI/HPD boundaries illustrating the performance of the reliability indices and over all data points in the sample from the rainfall dataset. The figure shows that the intervals for and obtained using the BCI (or HPD) methods have shorter ILs compared to those from the ACI-NA and ACI-NL methods, confirming the numerical findings reported in Table 11.
Figure 6.
Plots for 95% IL results of and from rainfall data.
5.2. Engineering Application
This application analyzes the failure times of 18 electronic devices exhibiting a bathtub-shaped HRF, characterized by an initially high failure rate during early use, a plateau of relatively constant failure risk, and a subsequent increase due to aging and wear-out effects. To examine the applicability of the theoretical results for , , and in an engineering context, we analyze the complete failure time data for these devices. This dataset was first reported by Wang [21] and later revisited by Elshahhat and Abu El Azm [22]. To further demonstrate the suitability of the CJ distribution for this dataset, we compare our results with those of Elshahhat and Abu El Azm [22], who fitted the Nadarajah–Haghighi distribution to the same data. Their analysis yielded a KS statistic of with a p-value of . In contrast, the CJ model achieves a smaller KS statistic of and a higher p-value of , indicating an improved fit. This comparison reinforces the effectiveness of the CJ distribution in modeling lifetime data for this application. For computational convenience, each failure time in the electronic devices dataset has been scaled by a factor of 100; see Table 13.
Table 13.
Times to failure of 18 electronic devices.
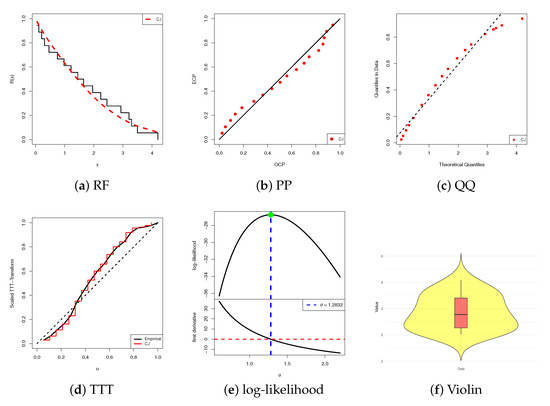
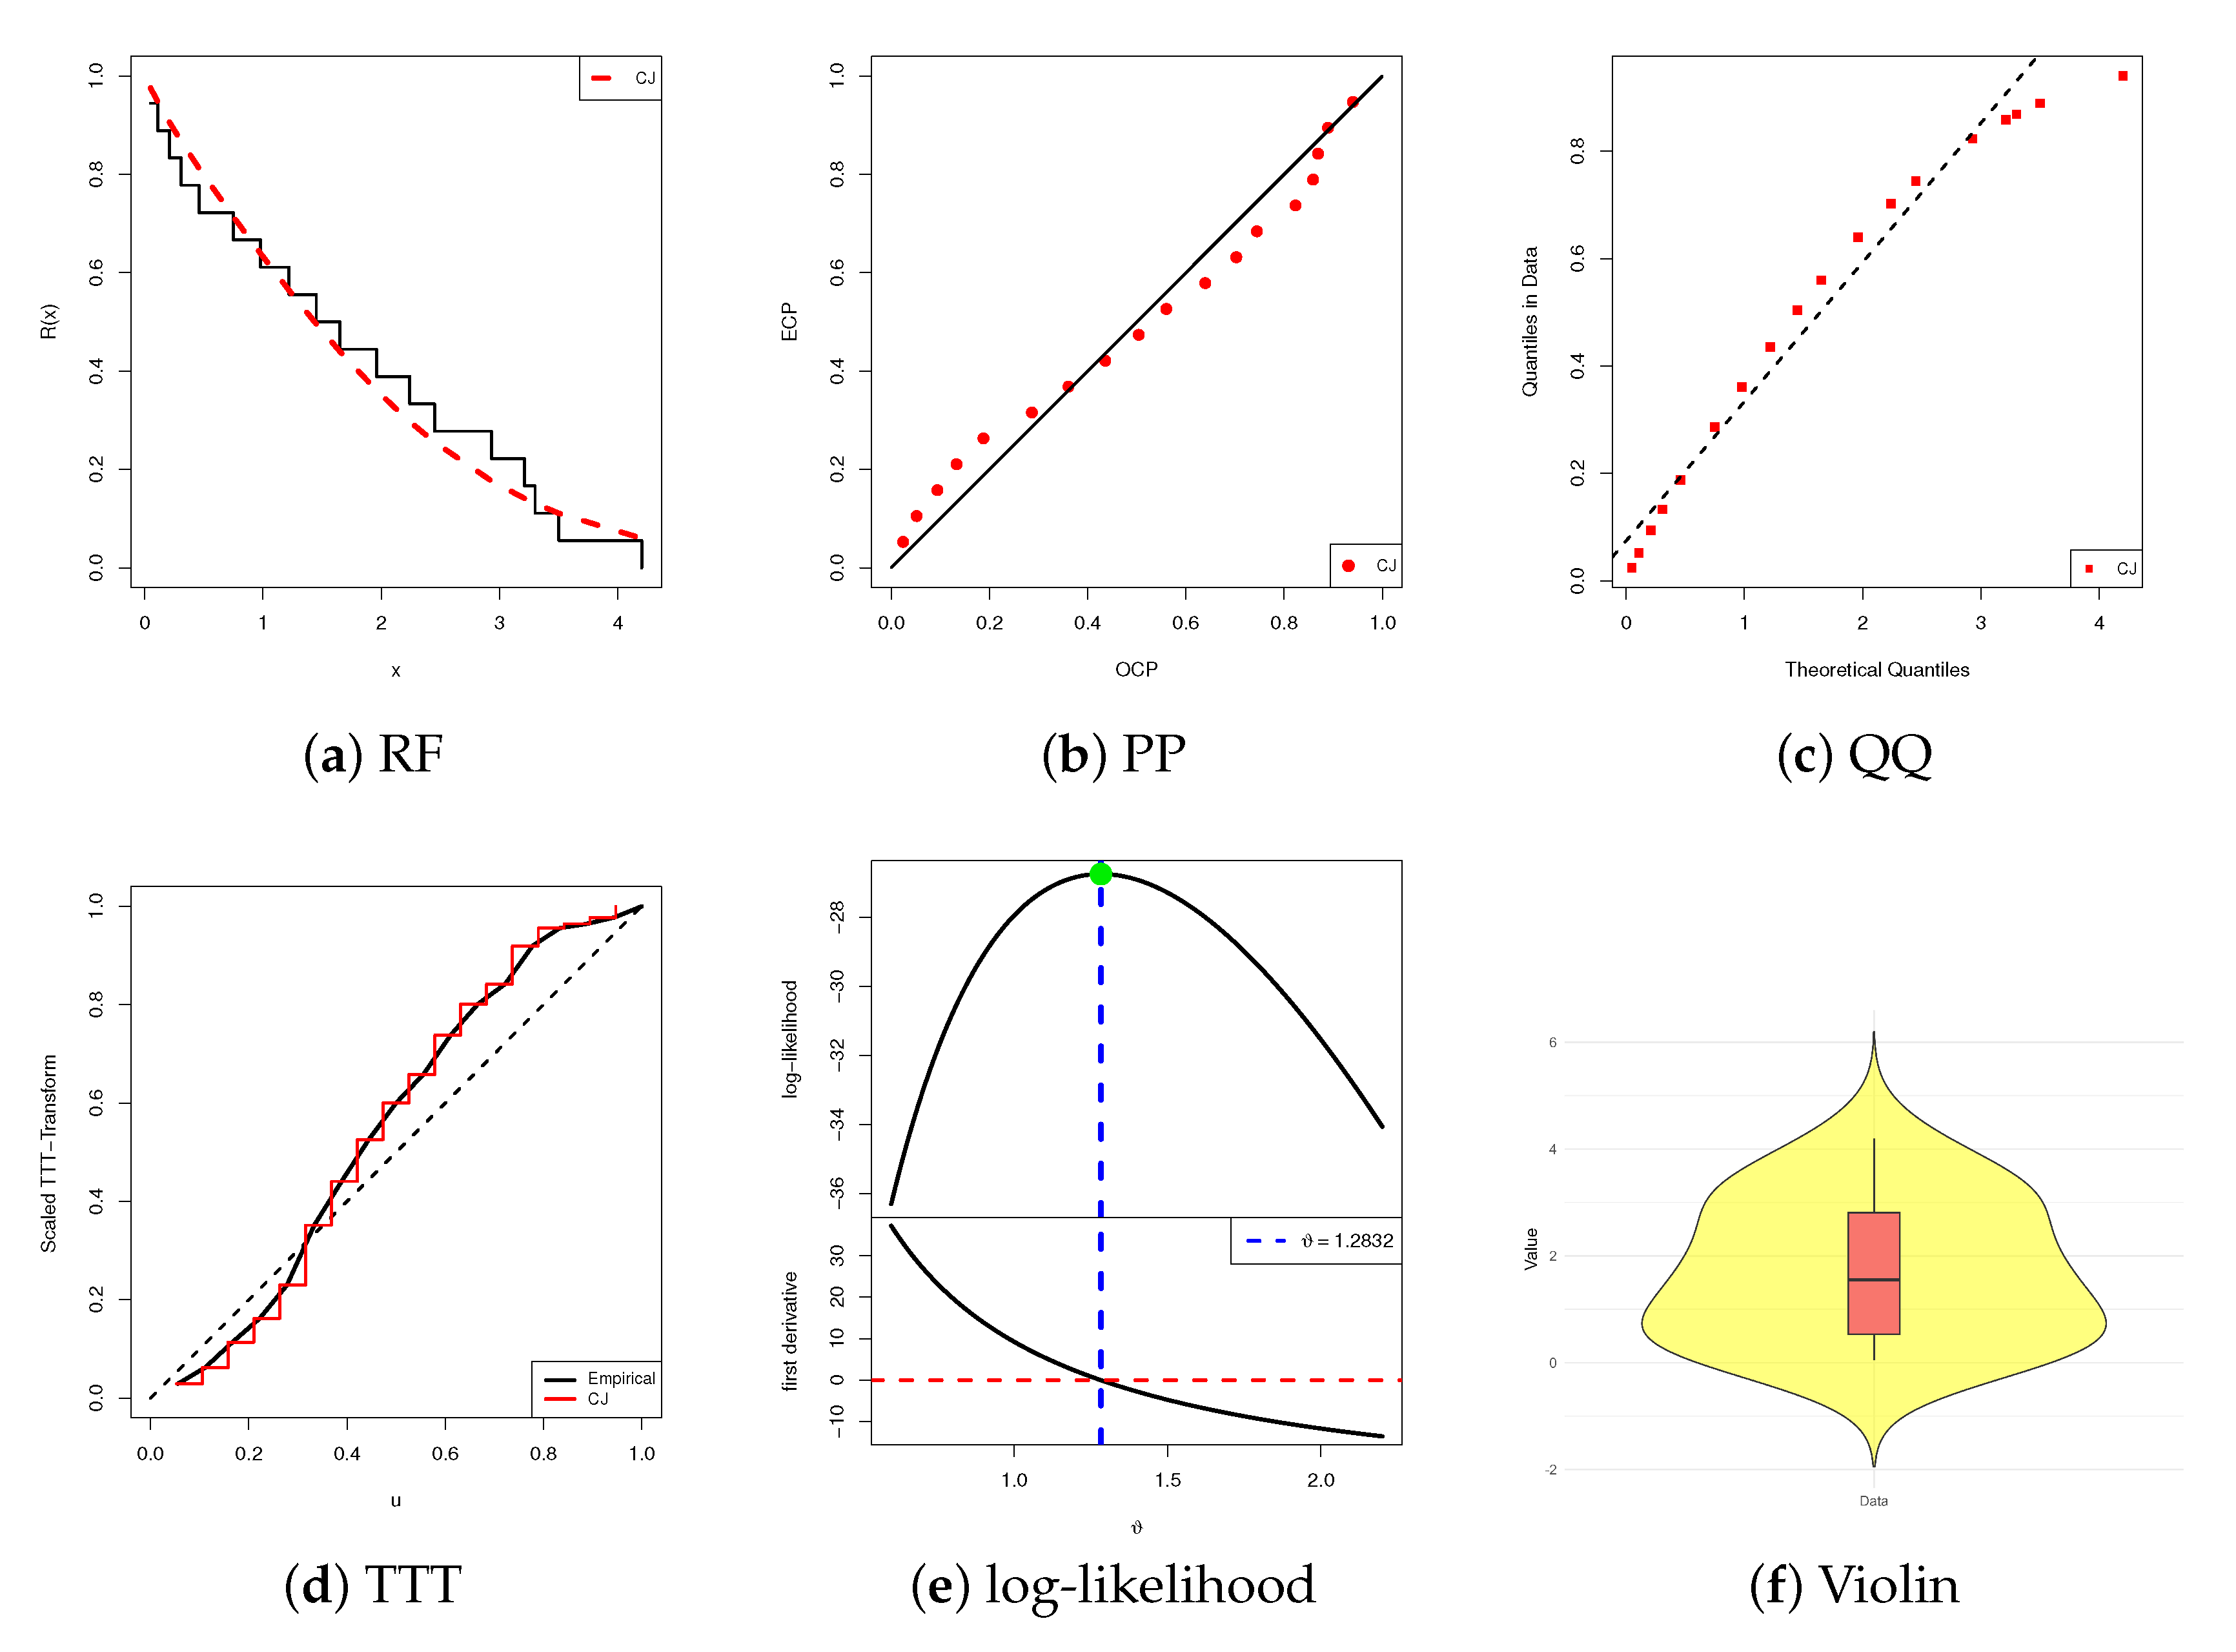
We now assess the adequacy of the CJ model before going to calculate the point and interval estimates of , , and . Based on Table 13, the MLE (Std.Er) of is 1.2832 (0.1981), and KS (p-value) is 0.1009 (0.9840). These findings indicate that the CJ model provides a satisfactory fit to the electronic devices data, supported by relatively narrow confidence intervals and a high p-value. To visually validate these results, Figure 7 presents the RF, PP, and QQ plots, the scaled TTT transform, the log-likelihood curve against the score function, and a combined boxplot-within-violin visualization. As shown in Figure 7a–c, the CJ model fits the electronic devices data well, consistent with the numerical results. Figure 7d confirms the presence of a bathtub-shaped HRF, while Figure 7e verifies the existence and uniqueness of the MLE . We therefore recommend using as the initial value in subsequent computations. Compared to the dataset analyzed in Section 5.1, Figure 7f reveals that the electronic devices dataset exhibits a symmetrical distribution with lower variability of failure times.
Figure 7.
Fitting diagrams of the CJ model from the electronic devices dataset.
From the complete failure times of electronic devices, three IT2-APC samples are generated, each with a fixed sample size and varying configurations of the censoring scheme and threshold parameters , as summarized in Table 14. In the absence of prior information on the CJ() model from the electronic devices data, an improper gamma prior with hyperparameters is employed for updating . The frequentist point estimates of are used as initial values for the proposed MCMC sampler. After discarding the first 10,000 iterations from a total of 50,000, Bayesian point and credible interval estimates for , , and are obtained.
Table 14.
Various IT2-APC samples from the electronic devices dataset.
For each design , , Table 15 reports the point estimates (with standard errors) and the corresponding 95% credible and confidence intervals (with interval widths) of , , and at . The results show that the LF-based and Bayesian estimates of and , except for , are closely aligned. However, the Bayesian approach consistently yields estimates with smaller standard errors, demonstrating improved stability. Furthermore, the 95% BCI and HPD intervals are shorter than their ACI-NA and ACI-NL counterparts, confirming the superior precision of Bayesian inference in this setting.
Table 15.
Estimates of , , and from electronic devices data.
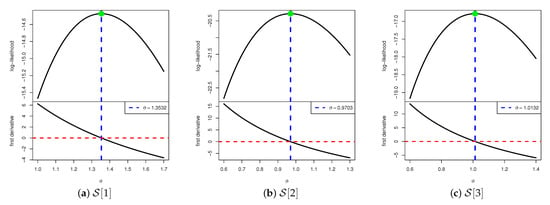
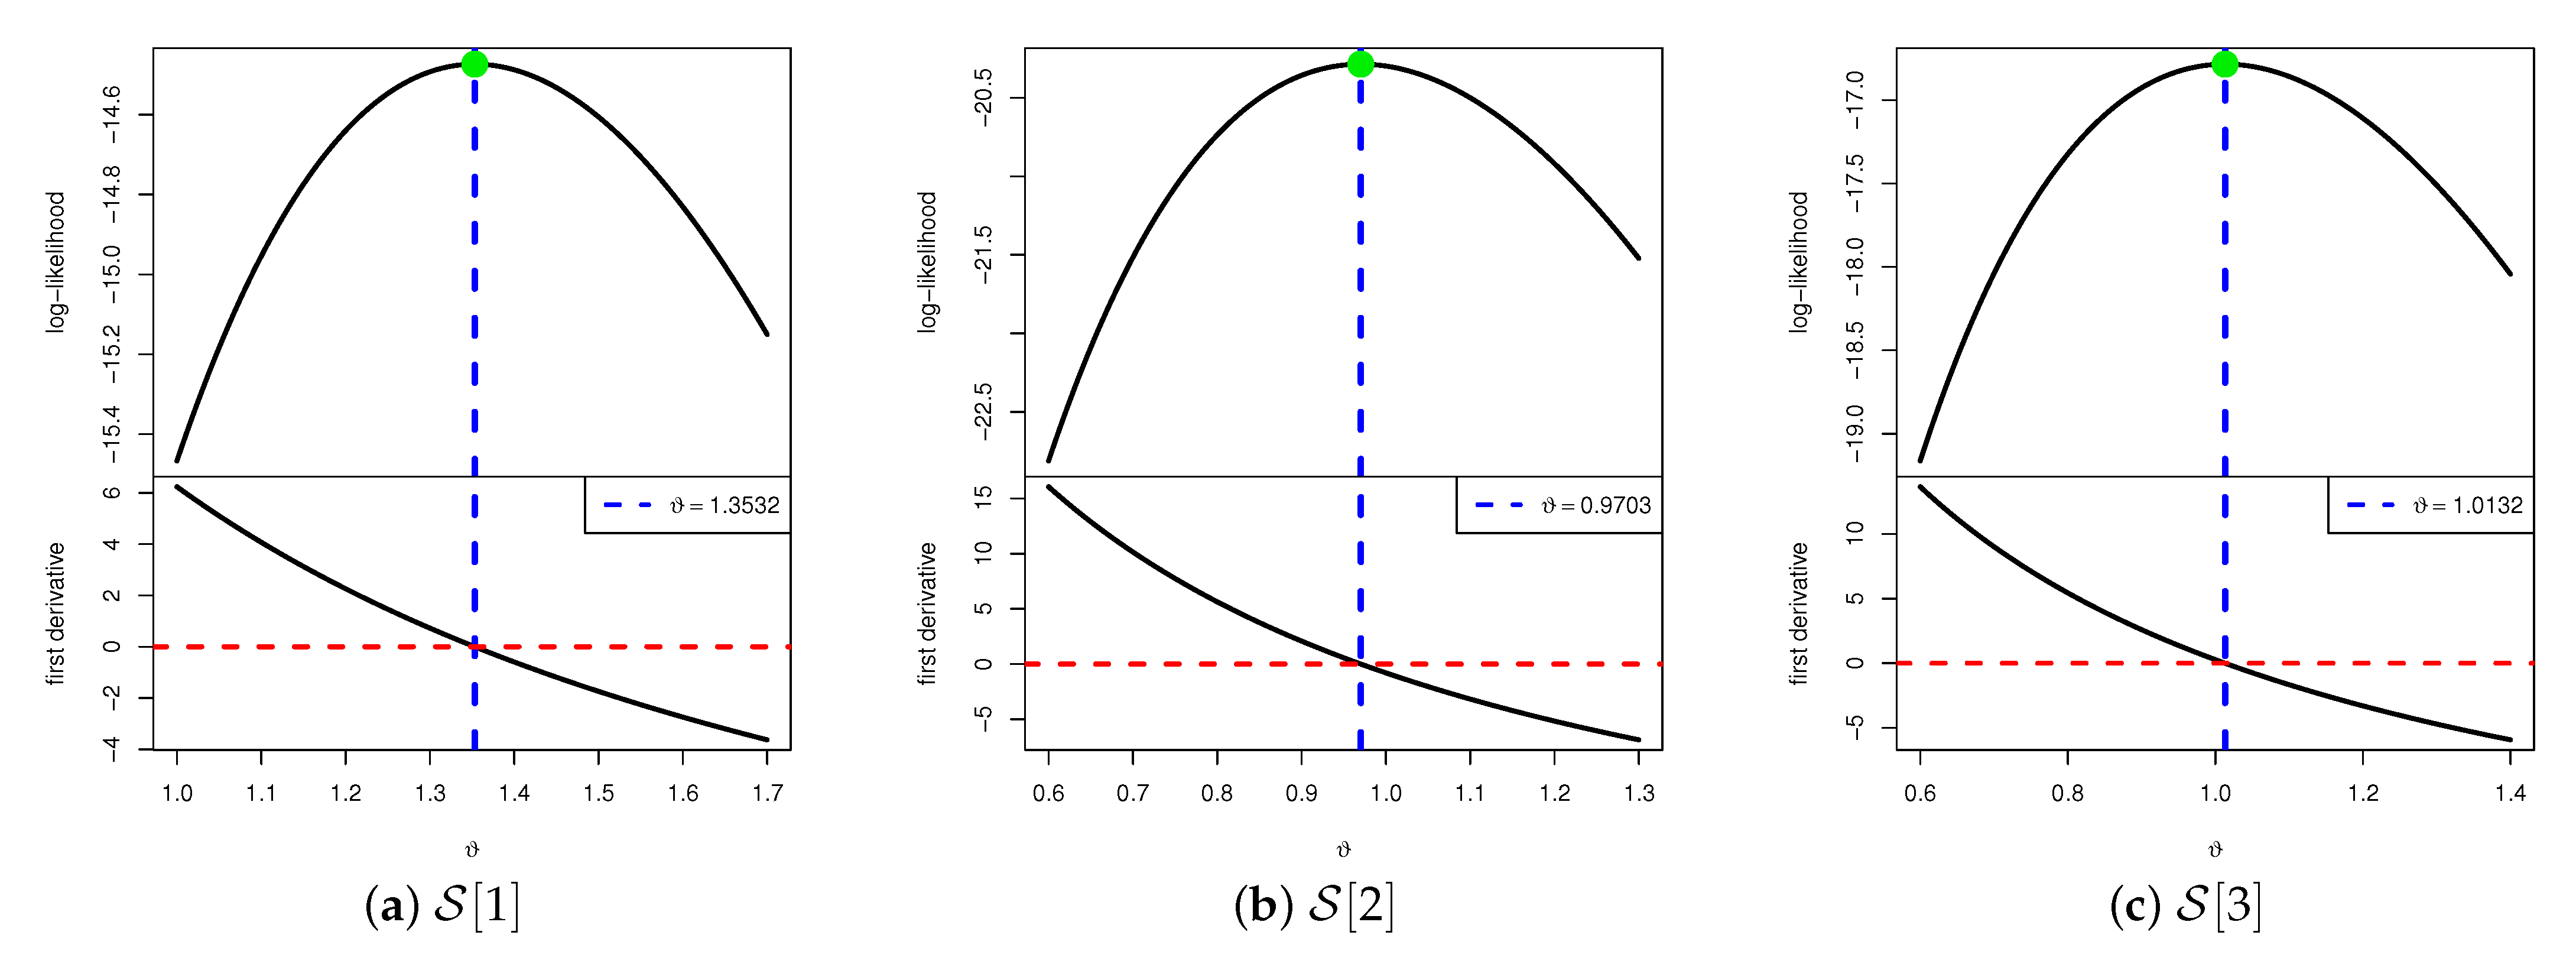
To confirm the existence and uniqueness of the estimated MLE , Figure 8 displays the log-LFs together with their associated score functions for each sample configuration , , evaluated under different values of . The plots distinctly reveal that a unique maximum of the LF exists for every case considered, thereby ensuring the well-posedness of the estimation procedure. These graphical findings are consistent with the numerical evidence provided in Table 15 and further justify the use of as a reliable initial value in the Bayesian estimation framework.
Figure 8.
Plots of log-likelihood/score functions of from electronic devices data.
The convergence behavior of the MCMC samples for , , and is evaluated using trace plots and posterior density plots, as shown in Figure 9. For reference, the posterior mean and corresponding 95% BCI limits are indicated by red solid and dashed lines, respectively. Visual inspection of these plots suggests satisfactory mixing and no evident convergence issues for the Markov chains of all parameters. The posterior distribution of is approximately symmetric, while those of and exhibit left and right skewness, respectively. Using the 40,000 post-burn-in MCMC iterations, a comprehensive set of posterior summary statistics for , , and has been computed. The results in Table 16 closely align with those in Table 15 and corroborate the graphical diagnostics in Figure 9, confirming the reliability and consistency of the Bayesian estimates.
Figure 9.
The density (top) and trace (bottom) for 40,000 MCMC iterations of , , and from the electronic devices dataset.
Table 16.
Statistics for 40,000 MCMC iterations of , , and from electronic devices data.
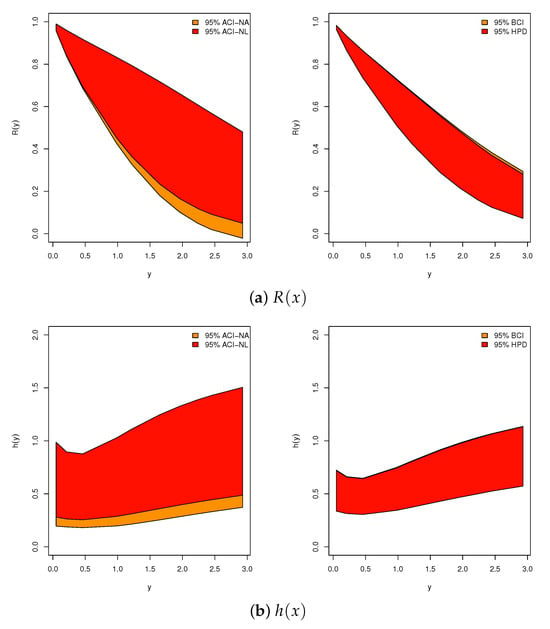
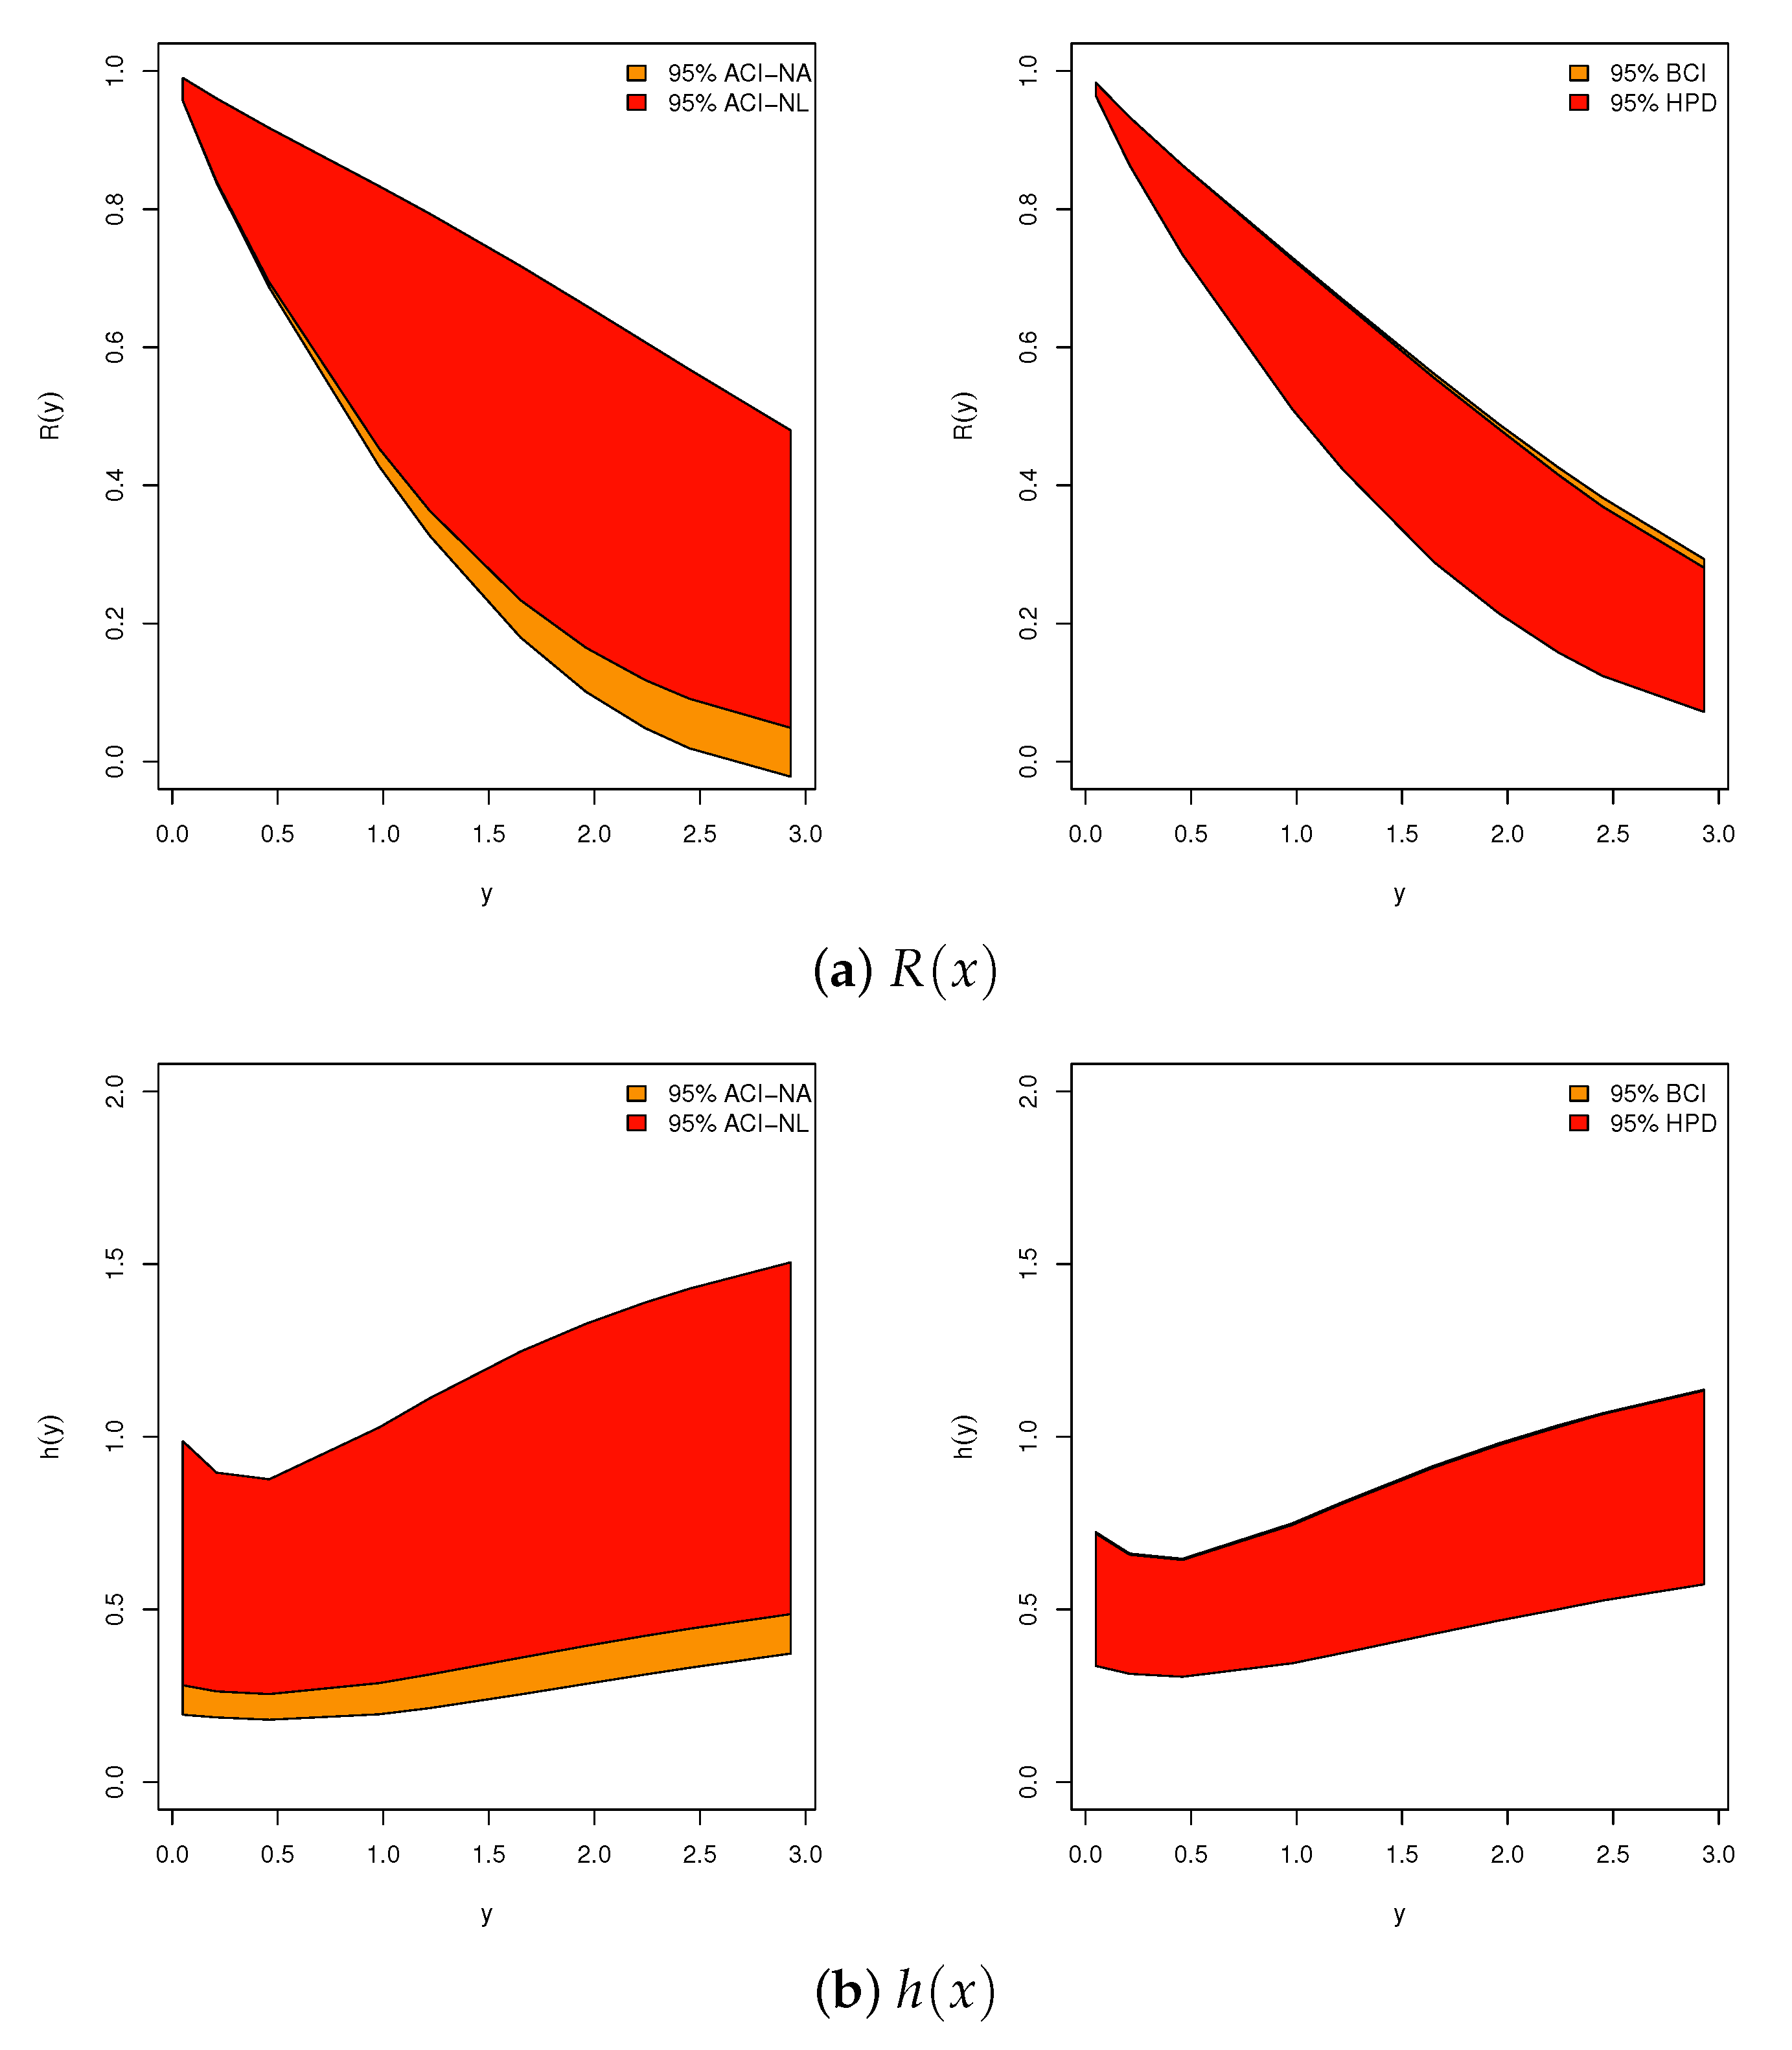
Figure 10 displays the 95% confidence and credible interval bounds for the reliability measures and , computed using the ACI-NA, ACI-NL, and BCI/HPD methods for the electronic devices dataset sample . The intervals obtained via the BCI (or HPD) approach are noticeably narrower than those produced by the classical ACI-NA and ACI-NL methods. This finding is consistent with the numerical results in Table 15 and further highlights the advantage of the Bayesian framework in delivering more precise inference through shorter interval lengths.
Figure 10.
Plots for 95% IL results of and from electronic devices data.
As a result, the analyses of samples generated under the improved Type-II adaptive progressive censoring scheme—applied to both the rainfall and electronic device datasets—provide a comprehensive assessment of the CJ lifetime model. These findings corroborate the simulation results and further demonstrate the practical utility of the proposed methodology in engineering and physical sciences applications.
6. Conclusions
This study introduces a comprehensive reliability framework based on the CJ lifetime distribution combined with an adaptive progressive Type-II censoring plan. The proposed censoring strategy enhances flexibility and efficiency in data collection for life-testing experiments. Maximum likelihood and Bayesian estimators were derived for the CJ parameter and key reliability metrics, including the reliability function and hazard rate function. Approximate confidence intervals were obtained using the observed Fisher information matrix and the delta method. To address the intractability of the likelihood, Bayesian estimation was performed under independent gamma priors and a squared-error loss function. A Metropolis–Hastings sampler was developed to generate posterior samples, enabling the computation of Bayesian estimates along with credible and highest posterior density intervals. Extensive simulation studies verified the consistency and efficiency of the proposed estimators across diverse censoring scenarios. Two real-world datasets—rainfall measurements and mechanical failure times—were analyzed to demonstrate the model’s practical applicability. In both cases, the CJ distribution under the proposed scheme achieved superior fit and inference compared to traditional approaches. Overall, this work provides a flexible and computationally efficient inferential framework for analyzing censored lifetime data using the CJ distribution, with significant relevance to environmental, industrial, and engineering reliability studies.
Author Contributions
Methodology, H.S.M., O.E.A.-K. and A.E.; Funding acquisition, H.S.M.; Software, A.E.; Supervision, O.E.A.-K.; Writing—original draft, H.S.M., O.E.A.-K. and A.E.; Writing—review and editing, H.S.M. and A.E. All authors have read and agreed to the published version of the manuscript.
Funding
This research was funded by Princess Nourah bint Abdulrahman University Researchers Supporting Project number (PNURSP2025R175), Princess Nourah bint Abdulrahman University, Riyadh, Saudi Arabia.
Data Availability Statement
The authors confirm that the data supporting the findings of this study are available within the article.
Conflicts of Interest
The authors declare no conflicts of interest.
List of Abbreviations
| Abbreviation | Meaning |
| ACI | Asymptotic Confidence Interval |
| ACI-NA | Asymptotic Confidence Interval using Normal Approximation |
| ACI-NL | Asymptotic Confidence Interval using Log-Transformed Method |
| BCI | Bayesian Credible Interval |
| CDF | Cumulative Distribution Function |
| CJ | Chris–Jerry |
| CP | Coverage Probability |
| FI | Fisher Information |
| HPD | Highest Posterior Density |
| IL | Interval Length |
| IT2-APC | Improved Type-II Adaptive Progressive Censoring |
| log-MLE | Log-Transformed Maximum Likelihood Estimator |
| LF | Likelihood Function |
| Probability Density Function | |
| KS | Kolmogorov–Smirnov (test) |
| NR | Newton–Raphson |
| M-H | Metropolis–Hastings |
| MCMC | Markov Chain Monte Carlo |
| MLE | Maximum Likelihood Estimator |
| MPE | Mean Point Estimate |
| MRAB | Mean Relative Absolute Bias |
| RMSE | Root Mean Squared Error |
| Sk. | Skewness |
| Std.D | Standard Deviation |
| SEL | Squared-Error Loss |
| T1-PHC | Type-I Progressive Hybrid Censoring |
| T2-APC | Type-II Adaptive Progressive Censoring |
| T2-PC | Type-II Progressive Censoring |
| T2-C | Type-II Censoring |
| TTT | Total Time on Test |
| VC | Variance-Covariance |
References
- Onyekwere, C.K.; Obulezi, O.J. Chris-Jerry distribution and its applications. Asian J. Probab. Stat. 2022, 20, 16–30. [Google Scholar] [CrossRef] [Scilit]
- Alotaibi, R.; Rezk, H.; Elshahhat, A. Evaluations of Chris-Jerry Data Using Generalized Progressive Hybrid Strategy and Its Engineering Applications. CMES Comput. Model. Eng. Sci. 2024, 140, 3073–3103. [Google Scholar] [CrossRef] [Scilit]
- Balakrishnan, N.; Cramer, E. The Art of Progressive Censoring; Springer: Birkhäuser, NY, USA, 2014. [Google Scholar]
- Kundu, D.; Joarder, A. Analysis of Type-II progressively hybrid censored data. Comput. Stat. Data Anal. 2006, 50, 2509–2528. [Google Scholar] [CrossRef] [Scilit]
- Ng, H.K.T.; Kundu, D.; Chan, P.S. Statistical Analysis of Exponential Lifetimes under an Adaptive Type-II Progressive Censoring Scheme. Nav. Res. Logist. 2009, 56, 687–698. [Google Scholar] [CrossRef] [Scilit]
- Yan, W.; Li, P.; Yu, Y. Statistical inference for the reliability of Burr-XII distribution under improved adaptive Type-II progressive censoring. Appl. Math. Model. 2021, 95, 38–52. [Google Scholar] [CrossRef] [Scilit]
- Bain, L.J.; Engelhardt, M. Statistical Analysis of Reliability and Life-Testing Models, 2nd ed.; Marcel Dekker: New York, NY, USA, 1991. [Google Scholar]
- Nassar, M.; Elshahhat, A. Estimation procedures and optimal censoring schemes for an improved adaptive progressively type-II censored Weibull distribution. J. Appl. Stat. 2024, 51, 1664–1688. [Google Scholar] [CrossRef] [Scilit] [PubMed]
- Asadi, S.; Panahi, H.; Anwar, S.; Lone, S.A. Reliability Estimation of Burr Type III Distribution under Improved Adaptive Progressive Censoring with Application to Surface Coating. Maint. Reliab. Niezawodn. 2023, 25, 163054. [Google Scholar] [CrossRef] [Scilit]
- El-Sherpieny, E.S.A.; Elshahhat, A.; Abdallah, N.M. Statistical analysis of improved Type-II adaptive progressive hybrid censored NH data. Sankhya A 2024, 86, 721–754. [Google Scholar] [CrossRef] [Scilit]
- Alqasem, O.A.; Elshahhat, A. Reliability Analysis of the Newly Power Half-Normal Model via Improving Adaptive Progressive Type II Censoring and Its Applications. Qual. Reliab. Eng. Int. 2025. early view. [Google Scholar] [CrossRef] [Scilit]
- Henningsen, A.; Toomet, O. maxLik: A package for maximum likelihood estimation in R. Comput. Stat. 2011, 26, 443–458. [Google Scholar] [CrossRef] [Scilit]
- Plummer, M.; Best, N.; Cowles, K.; Vines, K. CODA: Convergence diagnosis and output analysis for MCMC. R News 2006, 6, 7–11. [Google Scholar]
- Greene, W.H. Econometric Analysis, 4th ed.; Prentice-Hall: New York, NY, USA, 2000. [Google Scholar]
- Meeker, W.Q.; Escobar, L.A. Statistical Methods for Reliability Data; John Wiley and Sons: New York, NY, USA, 2014. [Google Scholar]
- Gelman, A.; Carlin, J.B.; Stern, H.S.; Rubin, D.B. Bayesian Data Analysis, 2nd ed.; Chapman and Hall/CRC: Boca Raton, FL, USA, 2004. [Google Scholar]
- Kundu, D. Bayesian inference and life testing plan for the Weibull distribution in presence of progressive censoring. Technometrics 2008, 50, 144–154. [Google Scholar] [CrossRef] [Scilit]
- Jodrá, P.; Jiménez-Gamero, M.D.; Alba-Fernández, M.V. On the Muth distribution. Math. Model. Anal. 2015, 20, 291–310. [Google Scholar] [CrossRef] [Scilit]
- Alotaibi, R.; Nassar, M.; Elshahhat, A. Data analysis with applications in physics and engineering using XLindley model with improved adaptive Type-II progressively censored samples. Heliyon 2024, 10, e33598. [Google Scholar] [CrossRef] [Scilit] [PubMed]
- Alotaibi, R.; Nassar, M.; Elshahhat, A. Rainfall data modeling using improved adaptive type-II progressively censored Weibull-exponential samples. Sci. Rep. 2024, 14, 30484. [Google Scholar] [CrossRef] [Scilit] [PubMed]
- Wang, F.K. A new model with bathtub-shaped failure rate using an additive Burr XII distribution. Reliab. Eng. Syst. Saf. 2000, 70, 305–312. [Google Scholar] [CrossRef] [Scilit]
- Elshahhat, A.; Abu El Azm, W.S. Statistical reliability analysis of electronic devices using generalized progressively hybrid censoring plan. Qual. Reliab. Eng. Int. 2022, 38, 1112–1130. [Google Scholar] [CrossRef] [Scilit]

Disclaimer/Publisher’s Note: The statements, opinions and data contained in all publications are solely those of the individual author(s) and contributor(s) and not of MDPI and/or the editor(s). MDPI and/or the editor(s) disclaim responsibility for any injury to people or property resulting from any ideas, methods, instructions or products referred to in the content. |
© 2025 by the authors. Licensee MDPI, Basel, Switzerland. This article is an open access article distributed under the terms and conditions of the Creative Commons Attribution (CC BY) license (https://creativecommons.org/licenses/by/4.0/).