


Abstract
Sublevel caving (SLC) is widely used in underground metal mining, but excessive ore loss and dilution often limit its application. To address these issues, this study evaluated insert drawing under three draw-termination ratios (DTRs) and conventional drawing at DTR = 3:1 using eight 1:50 physical-model tests. Recovery and waste-rock mixing were measured, and a dimensionless techno-economic screening index, I (c, β), was developed. Its ordinal ranking was cross-checked using a conventional economic-value change model. As the DTR increased from 1:1 to 3:1, mean recovery rose from 68.62% to 83.17%, while mean waste-rock mixing increased from 34.62% to 55.67%. At DTR = 3:1, insert drawing exceeded conventional drawing in mean recovery by 10.96 percentage points, accompanied by a 5.57-percentage-point increase in waste-rock mixing. At β = 1.46, Scheme 1 achieved the highest index, I = 1.381, and both evaluation methods produced the same ordinal ranking. Sensitivity analysis showed that Scheme 3 ranked highest when β < 0.48, whereas Scheme 1 ranked highest when β > 0.48, with equal index values near the crossover at β ≈ 0.48. The proposed framework provides a transparent laboratory-scale approach for screening tested DTR configurations and examining how economic weighting affects configuration preference, thereby providing a basis for subsequent site-specific calibration of draw-termination criteria.
1. Introduction
The sublevel caving method is widely used for thick and medium-to-low grade deposits due to its high efficiency and safety [1,2,3,4]. However, ore loss and dilution remain persistent challenges: average ore loss is about 22% and dilution ranges from 15% to 30% [5,6,7]. Improving recovery while reducing loss and dilution is critical for mining sustainability.
Ore loss and dilution originate from the mixing of caved ore with waste rock during drawing in SLC [8]. Under confined flow, granular movement is stochastic, making the ore–waste interface hard to control precisely. Conventional measures alone are insufficient [9]. Therefore, draw control must account for stochastic granular flow while balancing ore recovery against waste-rock entry.
Various approaches have been tried, including the draw-termination ratio (DTR) [10], low-dilution drawing [11], isolation layers [8,12,13,14], diversion drawing [15,16], physical modeling [17,18], and lost-ore recovery [19]. Quantitative methods such as DEM and stope optimization have also been applied [20,21]. Recent international studies have further extended SLC draw-control research. Laptev et al. employed three-dimensional DEM to investigate alternative ore-drawing modes, while Zhou et al. combined physical experiments with response-surface methodology to optimize sublevel height, drift spacing, and caving step [22,23]. More recently, Cai et al. formulated ore drawing as a robust multi-objective problem involving cost, risk, recovery, and dilution, whereas Yan et al. reviewed emerging intelligent-caving frameworks integrating ore-flow regulation with digital-twin support and mining–processing coordination [24,25]. Despite these advances, uncertainty associated with local ore–waste mixing and stochastic granular flow remains difficult to incorporate into fixed draw-control criteria. In addition, the relationship between operational draw-control parameters and economically weighted configuration selection has received comparatively limited attention. These issues motivate a framework that combines controlled physical testing with transparent configuration-level evaluation.
Insert drawing and DTR control operate at different levels. Insert drawing modifies the local ore–waste flow path near the drawpoint [26], whereas the DTR is an operational shut-off criterion based on the observed waste-to-ore ratio. By contrast, the cut-off grade is a grade-based economic criterion used to classify material and determine its processing destination.
From an economic perspective, ore loss reduces marketable metal output, while waste-rock mixing increases costs for haulage, hoisting, processing, and tailings disposal. Sole reliance on the technical recovery–dilution ratio alone cannot answer the core practical question of when to cease ore-drawing in SLC. Lane’s cut-off grade theory emphasizes dynamic grade boundaries based on net present value (NPV) [27]. Related studies have examined the delayed onset of dilution and economically informed draw-control strategies [28,29]. These studies have collectively driven the shift from technical-indicator-based to economic decision-making-based ore-drawing control in SLC. Recent economic models follow two paths: the unit-loss model using weighting coefficients [30] and the simulation–optimization model maximizing NPV [31,32].
While insert drawing provides a means of regulating ore–waste flow, its response to different operational DTR settings and the economic sensitivity of configuration ranking remain insufficiently examined. Accordingly, three DTR levels (1:1, 2:1, and 3:1) are examined under insert drawing to characterize the DTR-dependent recovery–mixing trade-off, while conventional drawing at DTR = 3:1 provides a matched comparison under the same shut-off criterion. A dimensionless techno-economic screening index is then developed to evaluate the tested configurations under alternative economic-weighting assumptions. The principal methodological contribution is a normalized screening framework that explicitly couples experimentally measured DTR-dependent recovery–mixing responses with economic weighting, thereby enabling configuration ranking, β-sensitivity assessment, and identification of interpolation-derived β-insensitive features within the tested laboratory domain.
2. Operational Framework for Insert Drawing Under DTR Control
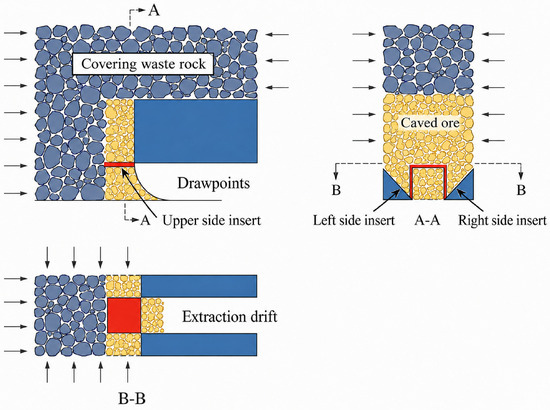
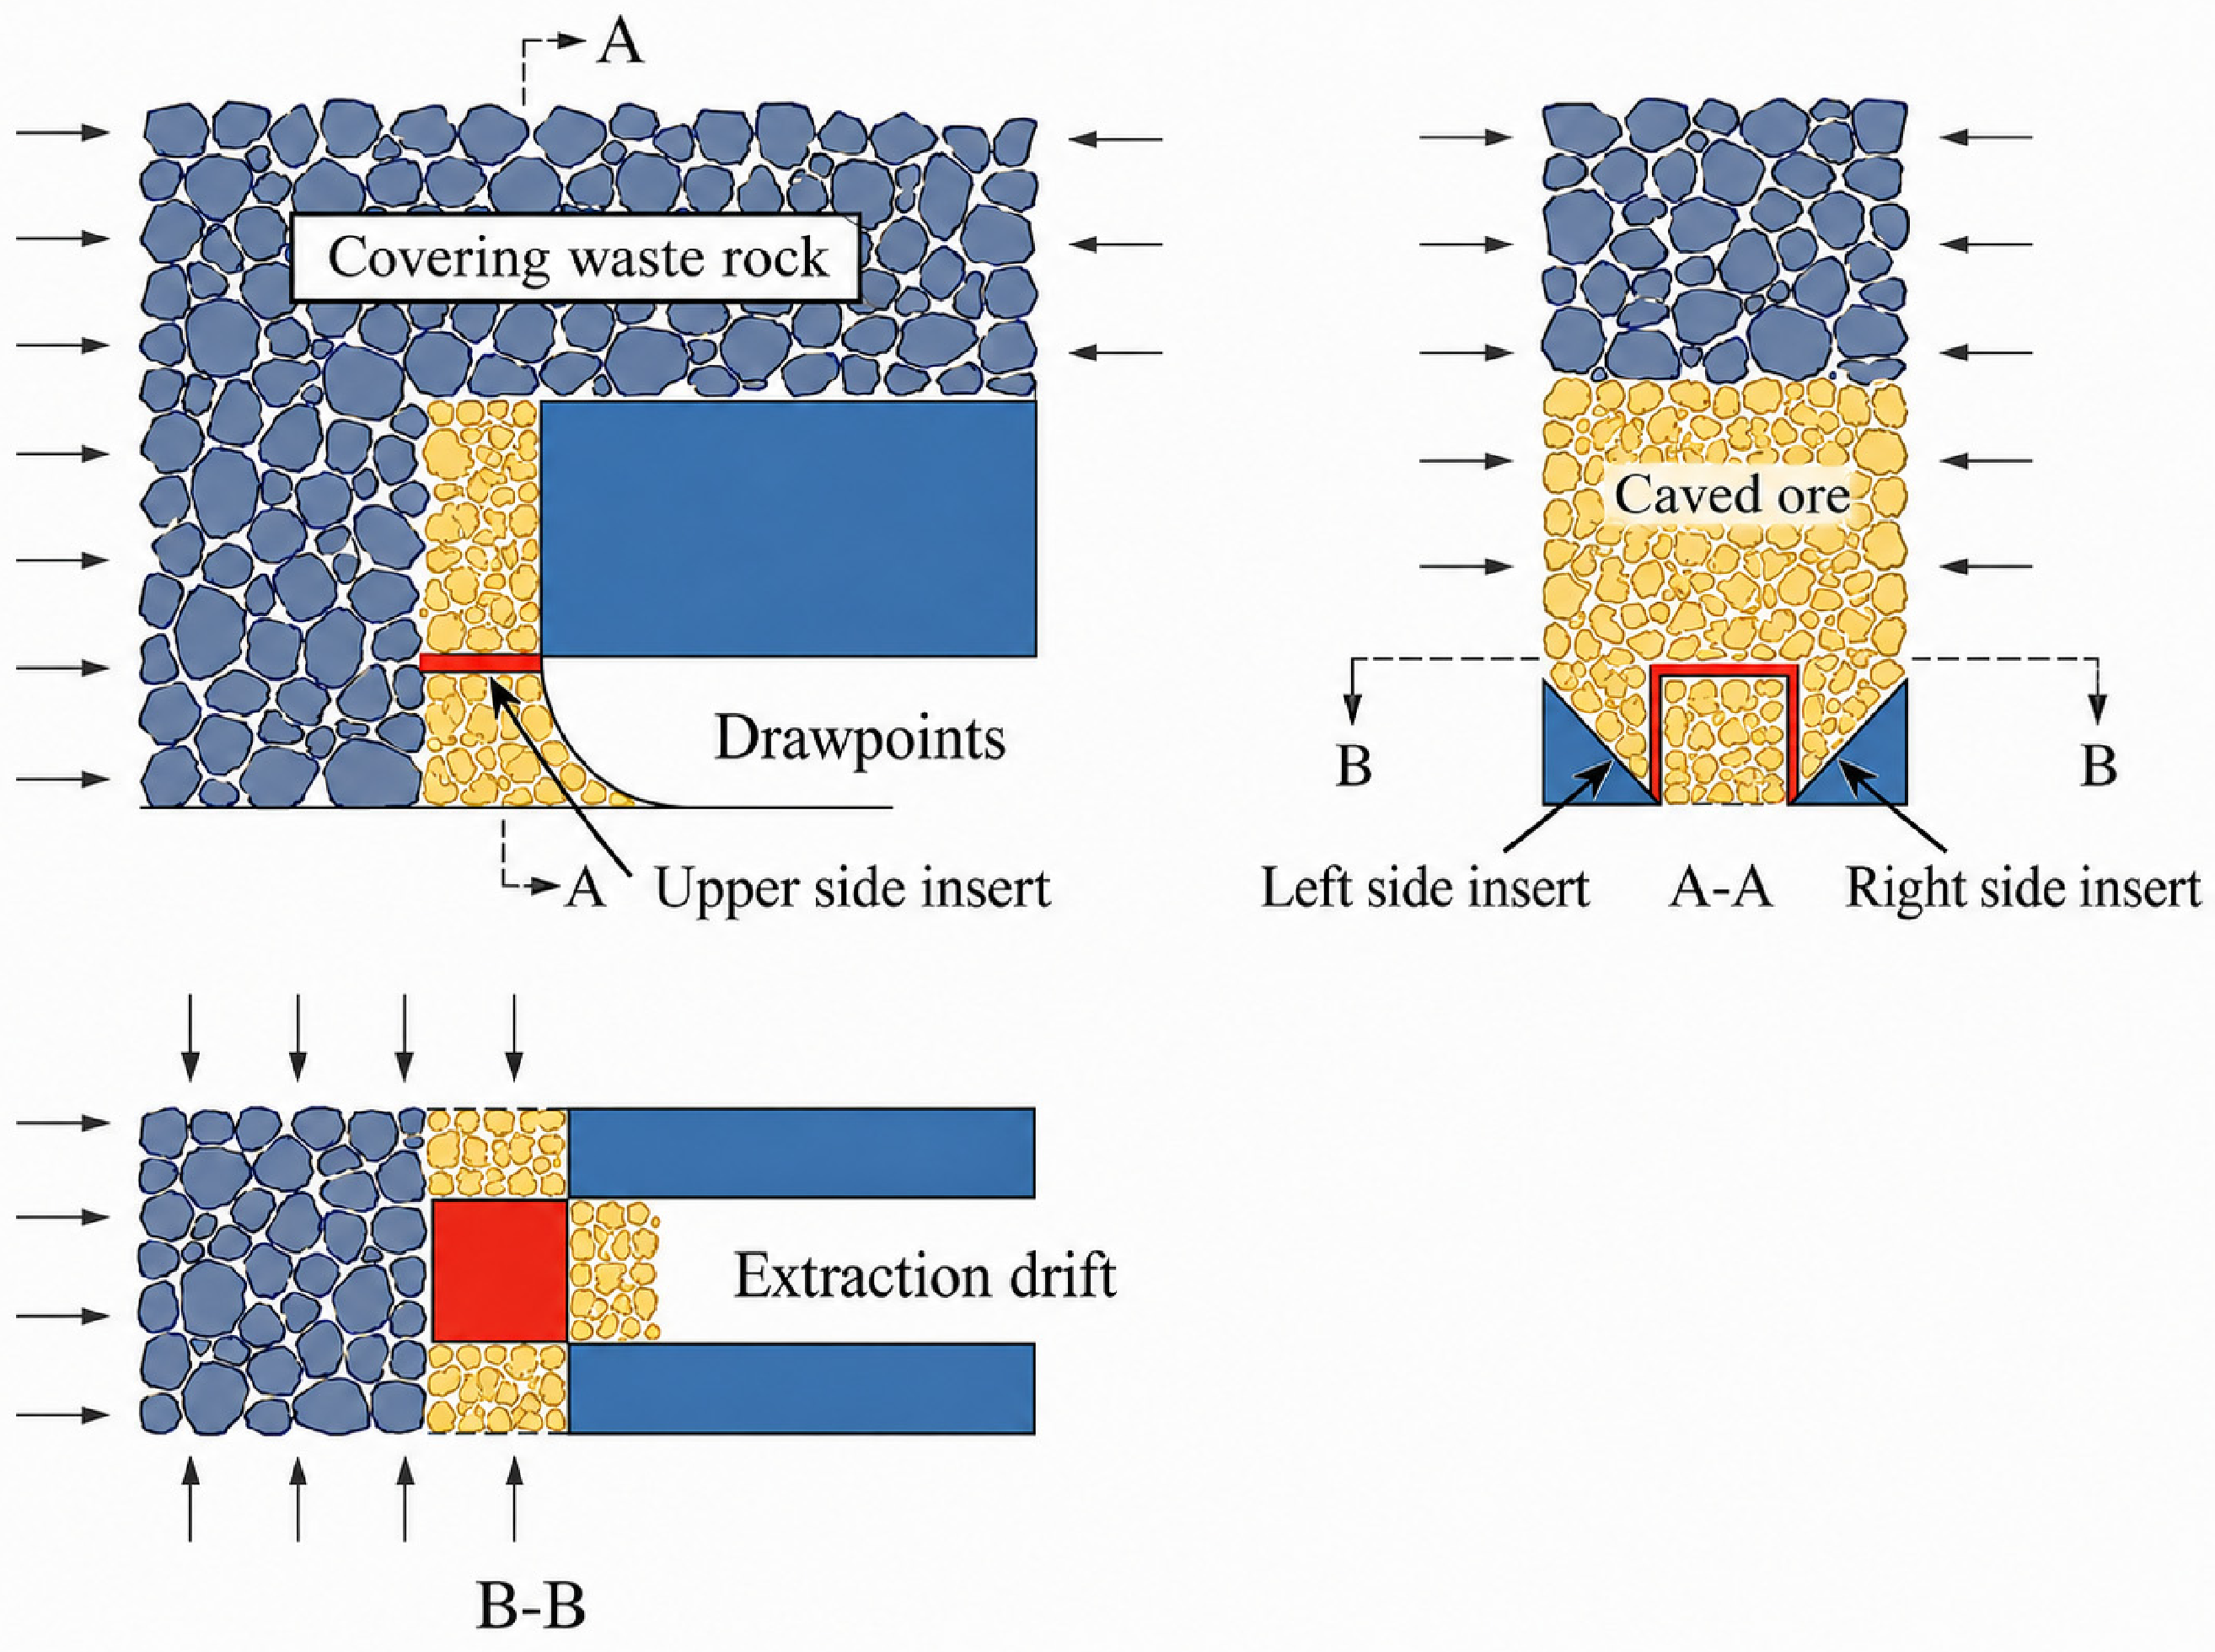
The insert drawing technique modulates the flow paths and velocities of blasted ore and caved waste rock by deploying a customized insert device at the drawpoint (Figure 1) [26]. Installed in the extraction drift, this device comprises left, right, and top baffle plates. Through selective opening and closing of the baffles, it redirects bulk material flow, delays breakthrough of the waste rock funnel, and effectively mitigates ore dilution.
Figure 1.
Stope structure diagram of insert drawing. (section A-A) Front view. (section B-B) Top view.
In the present framework, insert drawing and the draw-termination ratio (DTR) perform complementary operational functions. Insert drawing regulates the local ore–waste flow path near the drawpoint, whereas the DTR determines the endpoint of each drawing operation. Unlike the cut-off grade, which is a grade- and economics-based criterion for material classification [33,34], the DTR is defined here as the measured waste-to-ore volume ratio at the drawpoint and is used solely as the operational stopping criterion. During drawing, the waste-to-ore ratio is monitored batch by batch, and drawing is terminated once the prescribed DTR condition is satisfied. This separation between flow-path regulation and endpoint control provides the operational basis for comparing insert-drawing performance under different DTR settings and for subsequently evaluating the associated recovery–waste-mixing trade-off.
3. Materials and Methods
To evaluate the response of insert drawing to different DTR settings, controlled ore-drawing tests were conducted using a 1:50 physical model of a steeply dipping thick orebody. The similarity design considered geometric and gravity-controlled kinematic requirements for granular drawing. The 1:50 geometric scale was applied to the principal stope dimensions and particle-size classes. Under gravity-dominated flow, the characteristic time scale follows , where λl and λt denote the length and time similarity coefficients, respectively.
The model box measured 0.8 m × 0.22 m × 1.1 m and was constructed from 10 mm thick transparent acrylic panels to permit direct observation of ore–waste movement. It comprised five vertical sublevels, with an upper waste-rock cover and four lower ore-bearing sublevels. At the prototype scale, the sublevel height and extraction-drift spacing were both 10 m, the draw-step length was 2 m, and the drift was 3 m × 3 m. Five draw steps were arranged within each extraction drift. The burden plates used to separate adjacent draw steps and the three insert plates installed at the drawpoint were fabricated from 1 mm thick steel. Model and prototype dimensions are summarized in Table 1.
Table 1.
Model parameter description.
Dolomite was used as the ore analog and black magnetite as the waste-rock analog to facilitate material identification and separation. Both materials were crushed to particle sizes below 10 mm and subsequently sieved into five model-scale size fractions. The corresponding model-scale particle-size classes, prototype-equivalent size classes, and mass fractions of the ore and waste-rock analogs are summarized in Table 2. The weighed fractions were thoroughly mixed before model loading to ensure the prescribed particle-size distribution. The measured natural angle of repose of the ore analog was 30–33°.
Table 2.
Particle-size distribution and mass fractions of the analog materials.
In this study, the ore recovery rate (η) was defined as the mass of discharged ore analog relative to the initial mass of ore analog loaded into the model. Because ore grade was not assigned in the physical model, the waste-rock mixing rate was used as the experimental indicator of dilution. The waste-rock mixing rate (ρ) was defined as the mass fraction of discharged waste rock in the total discharged ore–waste material. The formulas of η and ρ are given in Equations (1) and (2), respectively:
where Qr is the mass of discharged ore analog, Qt is the initial mass of ore analog loaded into the model, and Qw is the mass of discharged waste-rock analog. For implementation of the volume-based DTR using batch mass measurements, the corresponding waste-to-ore mass-ratio thresholds were calculated from the analog-material densities using Equation (3). The densities of the waste-rock and ore analogs were 3200 and 2680 kg m−3, respectively. Therefore,
Accordingly, DTR values of 1:1, 2:1, and 3:1 corresponded to waste-to-ore mass-ratio thresholds of 1.194:1, 2.388:1, and 3.582:1, respectively.
During model preparation, the ore analog was loaded progressively by sublevel and draw step. The material assigned to each draw step was weighed before loading to maintain the prescribed distribution and to determine the initial ore mass. After completion of the ore-bearing sublevels, the upper part of the model was filled with the waste-rock analog.
Drawing proceeded from the upper to lower sublevels, from left to right among extraction drifts, and from the inner to outer draw steps within each drift. For insert drawing, the fixed plate-opening sequence was right–left–upper, as determined in the preceding sequence study [26]. Approximately 200–300 g of material was discharged in each batch. After each batch, the ore and waste-rock analogs were separated and weighed, and the total discharged mass, ore mass, and waste-rock mass were recorded. For each insert-plate position, drawing was terminated when the batch waste-to-ore mass ratio reached or exceeded the prescribed threshold for three consecutive batches. The plate was then returned to its initial position and the next plate in the sequence was operated. After completion of one draw step, the next burden plate was removed and the procedure was repeated. The same batch-wise measurement and DTR stopping rule were applied to conventional drawing, without operation of the insert plates.
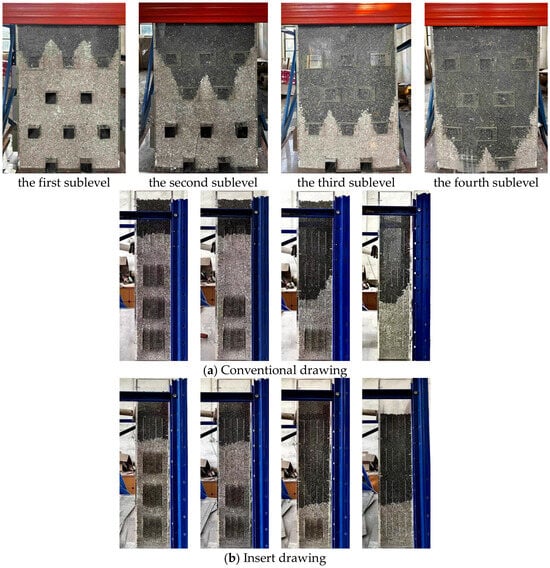
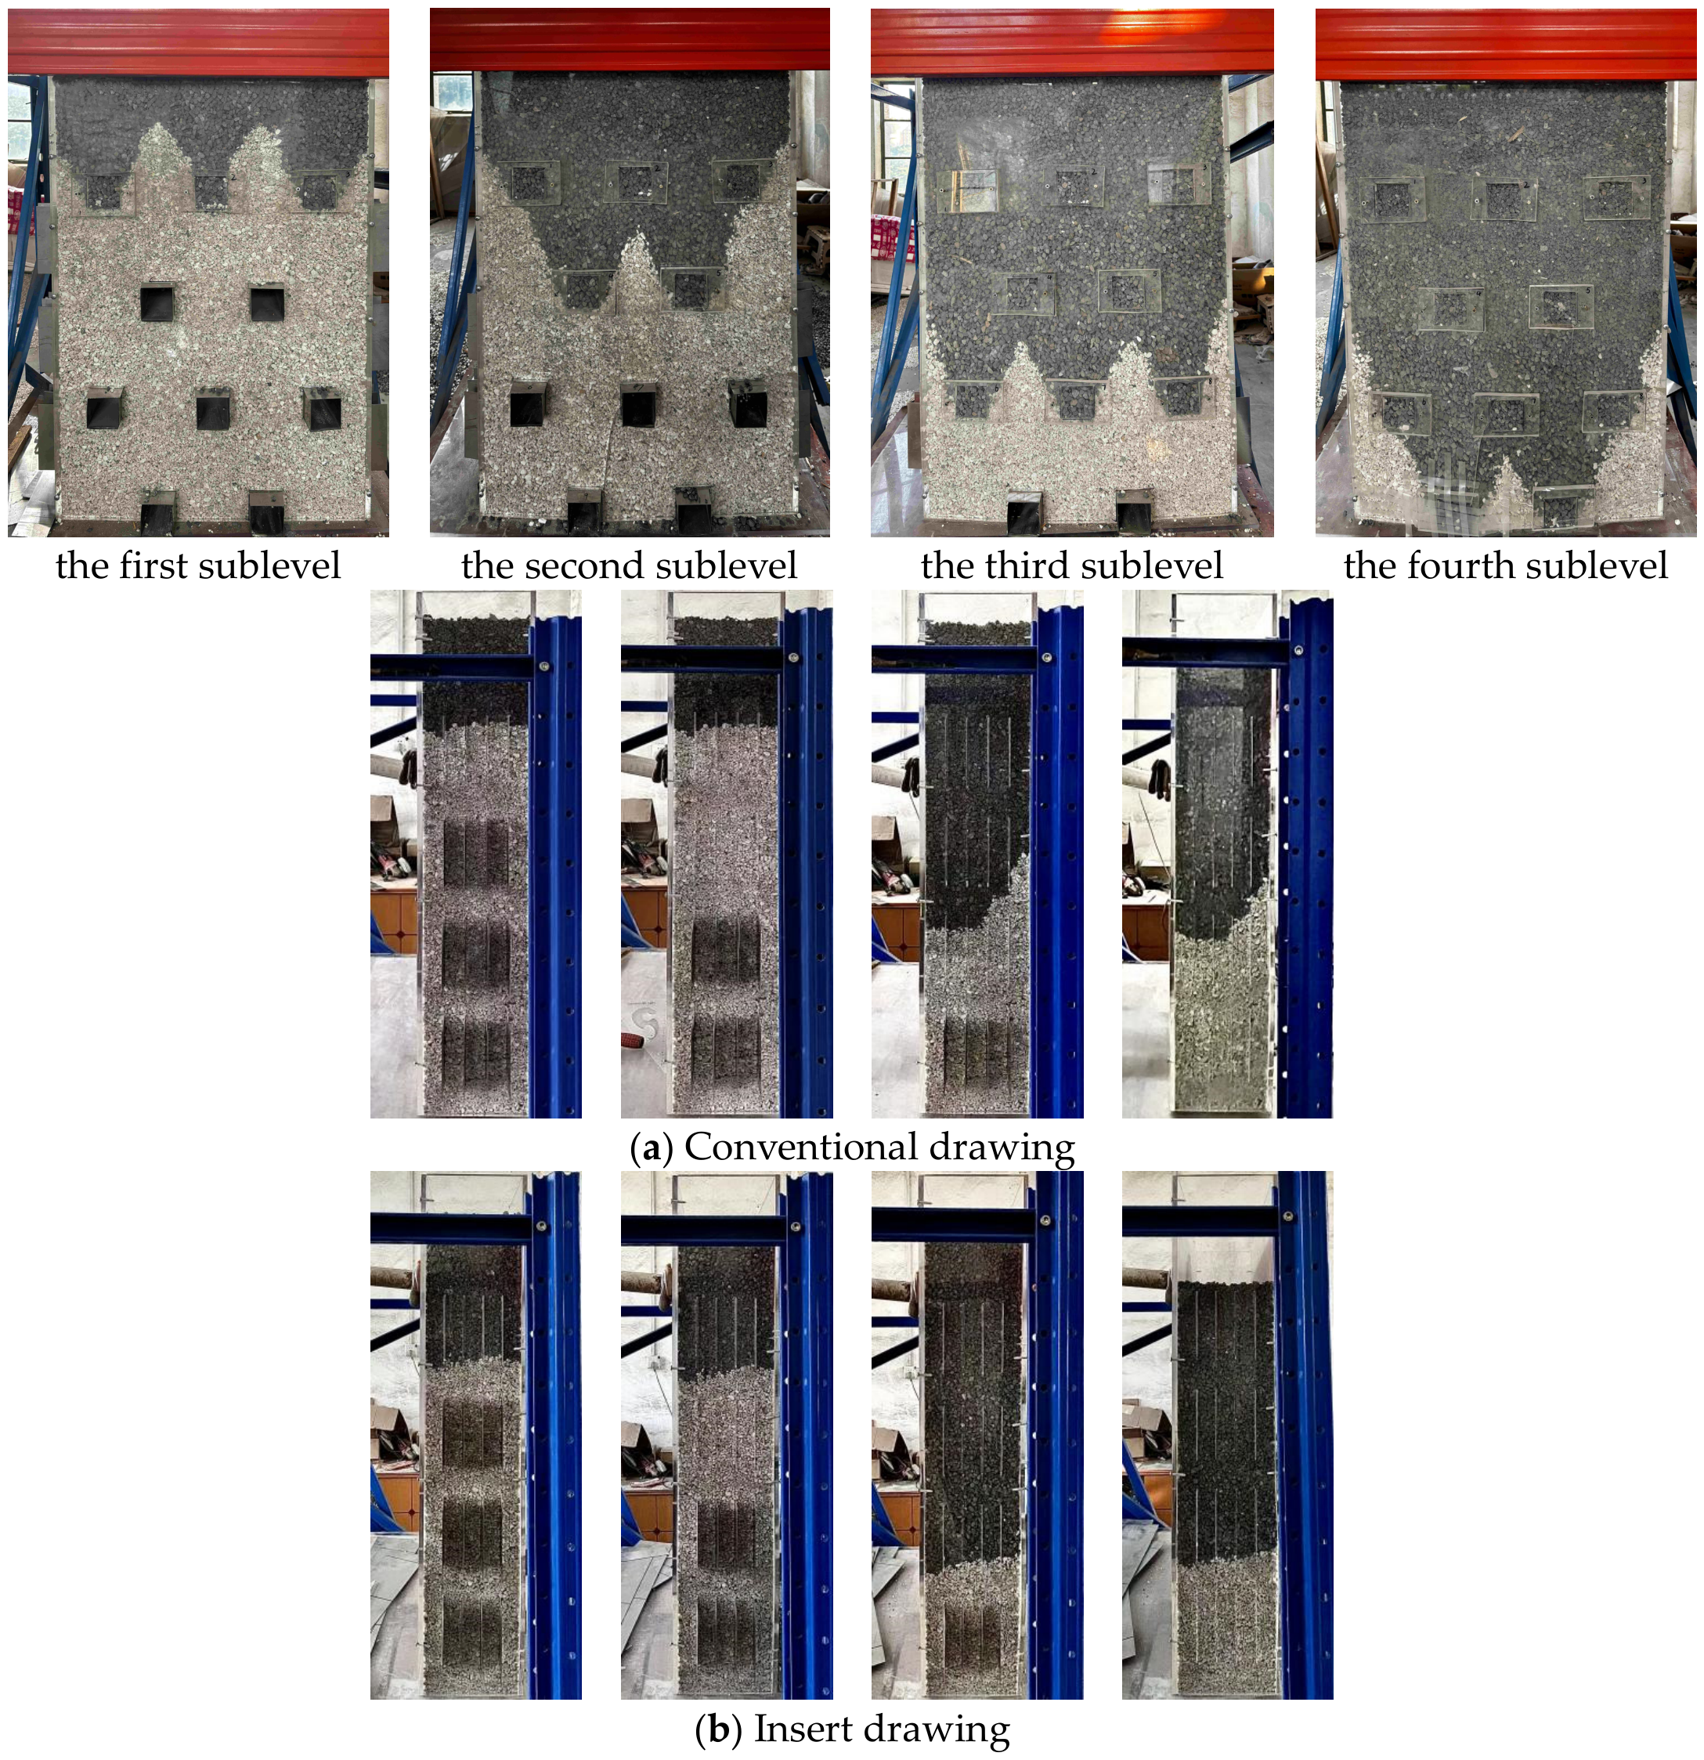
Three DTR levels (1:1, 2:1, and 3:1) were tested under the same insert-drawing configuration, with two replicate tests for each level (n = 2). Conventional drawing was tested twice at DTR = 3:1. The experimental design, therefore, supports two distinct comparisons: DTR-dependent trends are evaluated among the three insert-drawing configurations, whereas the effect of drawing method is compared only at the common DTR of 3:1. In total, eight tests were conducted. The experimental matrix is summarized in Table 3, and Figure 2 illustrates the drawing progression for the matched DTR = 3:1 comparison.
Table 3.
Ore-drawing experimental program.
Figure 2.
Comparison of drawing progression under different methods.
The DTR = 3:1 matched comparison corresponds to the experimental program previously reported in Ref. [26]. The present study extends that program with new insert-drawing tests at DTR = 1:1 and 2:1 and uses the combined dataset to investigate DTR-dependent performance and techno-economic sensitivity.
4. Experimental Results
Table 4 summarizes the drawing-test results under different DTRs, including the mean, standard deviation (SD), and coefficient of variation (CV) for each configuration. The CV was calculated as CV = SD/mean × 100% and was used here as a descriptive measure of relative dispersion between replicate measurements. According to the reasonable standards specific to the CV mining industry, CV < 15% corresponds to the reasonable range for engineering applications, 15% ≤ CV ≤ 25% represents the range of normal on-site compliance levels, and CV > 25% indicates an imbalance in production rhythms. The CV values obtained in the present experiments ranged from 0.43% to 10.40%; therefore, all tested configurations fell within the CV < 15% engineering-application range.
Table 4.
Statistical analysis of experimental data.
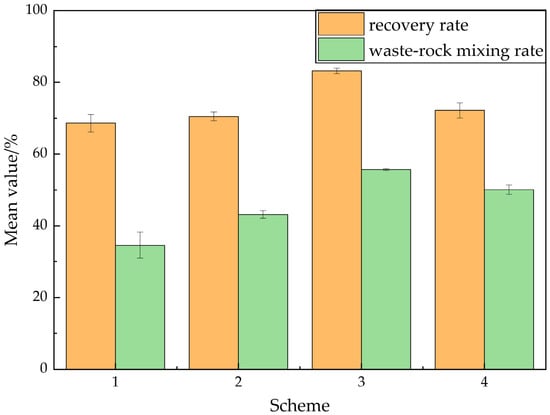
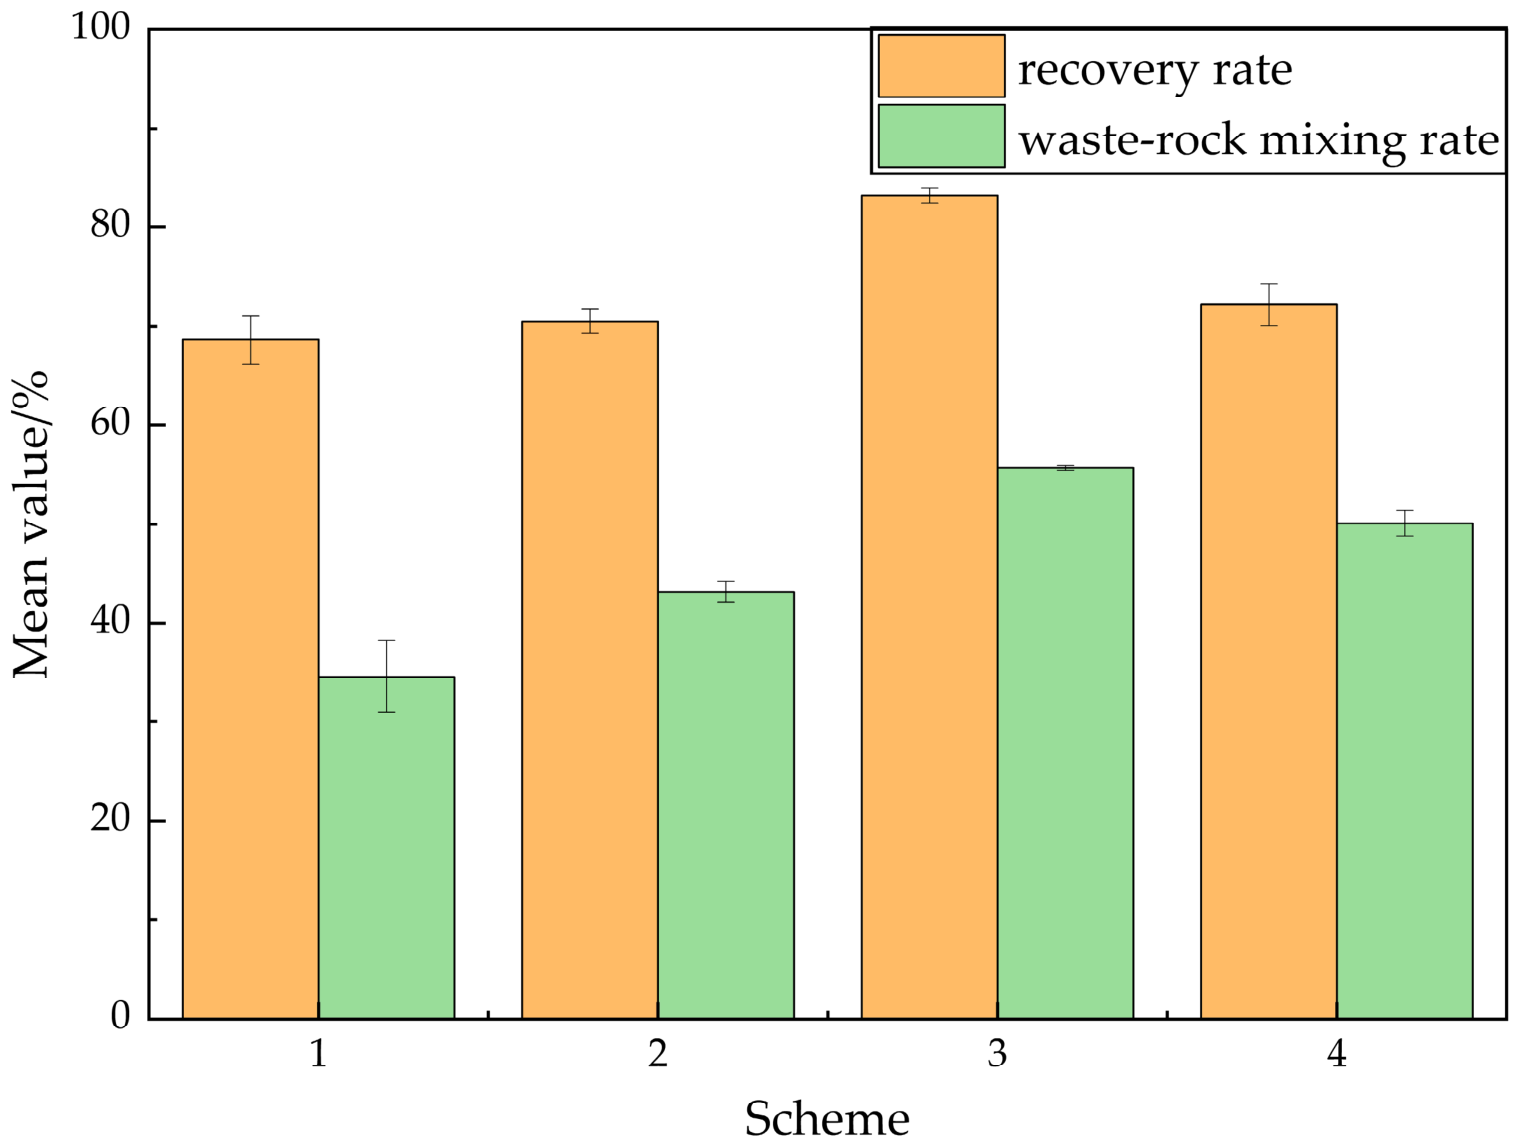
The comparison of values across all schemes is presented in Figure 3. Error bars are used to describe the observed experimental dispersion and are not interpreted as inferentially statistically significant. Among the insert-drawing tests, increasing the DTR from 1:1 to 3:1 increased mean recovery from 68.62% to 83.17% and mean waste-rock mixing from 34.62% to 55.67%. At DTR = 3:1, insert drawing and conventional drawing produced mean recoveries of 83.17% and 72.21%, respectively, together with mean waste-rock mixing rates of 55.67% and 50.10%.
Figure 3.
Mean recovery and waste-rock mixing rates of the tested configurations (n = 2 per configuration; error bars represent ±1 SD).
At DTR = 3:1, insert drawing achieved a higher observed mean recovery than conventional drawing. Across the three insert-drawing configurations, increasing the DTR raised both recovery and waste-rock mixing, and the increase in waste-rock mixing exceeded the recovery gain. These results reveal a clear DTR-dependent recovery–mixing trade-off and provide the experimental basis for the subsequent dimensionless screening analysis.
5. Techno-Economic Screening of the Tested Drawing Configurations
5.1. Construction of the Dimensionless Screening Index and Configuration Comparison
The four tested configurations exhibited distinct combinations of ore recovery and waste-rock mixing. To compare them on a common basis, conventional drawing at DTR = 3:1 was selected as the reference configuration, and a dimensionless techno-economic screening index was constructed to integrate relative recovery with a weighted adjustment for waste-rock mixing.
The index comprises three components. First, the relative recovery score is defined as Rη = η/ηref. Second, because waste-rock mixing is an adverse indicator, its departure from the reference condition is expressed as a reference-centered normalized deviation, Dρ = (ρ − ρref)/(1 − ρref). Subtracting ρref centers the reference configuration at Dρ = 0, while division by 1-ρref scales the positive deviation relative to the theoretical upper bound ρ = 1. Thus, Dρ > 0 denotes greater waste-rock mixing than the reference, whereas Dρ < 0 denotes lower mixing. This normalization does not itself reverse the direction of the adverse indicator. Directional adjustment is introduced through Pρ = 1 − βDρ; for β > 0, lower-than-reference mixing produces Pρ > 1, whereas higher-than-reference mixing produces Pρ < 1.
Because Pρ acts as a multiplicative adjustment factor, Pρ ≥ 0 was imposed to retain a non-negative screening index. For the present dataset, the maximum positive normalized mixing deviation was Dρ = 0.1116, corresponding to Scheme 3; hence, the admissible range was 0 < β ≤ 8.96. The final screening index was then expressed as I (c, β) = RηPρ, namely:
This multiplicative form uses relative recovery as the base score and adjusts it according to the normalized change in waste-rock mixing, thereby avoiding the direct addition of indicators with different scales.
In Equation (4), I denotes the dimensionless techno-economic screening index. I = 1 represents the reference configuration; I > 1 indicates a higher index score than the reference, whereas I < 1 indicates a lower index score.
c: DTR;
η: Recovery under insert drawing;
ηref: Recovery from the conventional drawing;
ρ: Waste-rock mixing ratio under insert drawing (dilution);
ρref: Waste-rock mixing ratio from the conventional drawing (dilution);
β: Relative economic weighting coefficient, defined as β = mp/ms, representing the relative economic-loss intensity associated with waste-rock mixing compared with ore loss;
mp: Unit economic loss associated with additional waste-rock mixing (dilution cost);
ms: Unit economic loss associated with unrecovered ore (opportunity cost).
For the baseline economic scenario, the unit-loss parameters reported by Tan et al. [29] were adopted, with mp = 616 CNY t−1 and ms = 422 CNY t−1, yielding β = 1.46. This value was used as the baseline economic-weighting coefficient for the configuration comparison. Because β depends on the relative economic consequences of waste-rock mixing and ore loss, its variation under alternative economic conditions is further examined in Section 5.4. The measured recovery and waste-rock mixing ratios were then substituted into Equation (4) to derive the dimensionless screening indices listed in Table 5, where the percentages in the final row exclusively denote the relative deviation of the index from the reference value.
Table 5.
Comparison of the dimensionless screening index and conventional economic-value evaluation for the tested configurations.
At β = 1.46, Scheme 1 had the highest index among the tested configurations, with I = 1.381, followed by Scheme 2 (I = 1.174), the reference Scheme 4 (I = 1.000), and Scheme 3 (I = 0.964). The relative deviation of Scheme 1 from the reference index was +38.1%; this percentage represents an index deviation rather than a monetary return. Under the adopted weighting, the lower waste-rock mixing ratios of Schemes 1 and 2 compensated for their lower recovery rates in the index calculation.
5.2. Comparison with Conventional Evaluation Approaches
To cross-check the ranking produced by I, a conventional economic-value change model was also employed following prior studies. Following the economic evaluation method proposed by Tan et al. [29], Scheme 4 was used as a reference and the relative change in economic value for each scheme was calculated as follows:
The calculated results of Equation (5) are presented in Table 5.
The conventional evaluation model produced the same ordinal ranking as the dimensionless screening index. Scheme 1 ranked first, followed by Schemes 2, 4, and 3. Scheme 3 had a negative M0, indicating that its recovery gain did not offset the corresponding increase in waste-rock mixing under the adopted unit-cost coefficients. The concordant ranking provides an internal consistency check under the same economic assumptions.
The two approaches serve different but complementary purposes. The conventional economic-value model in Equation (5) directly estimates the relative monetary consequence of changes in ore recovery and waste-rock mixing under specified unit economic parameters, whereas the proposed index I provides a normalized and dimensionless framework for configuration screening and sensitivity analysis. The principal advantage of I is that ore recovery and waste-rock mixing, which differ in physical meaning and preferred direction, are normalized relative to a reference configuration and incorporated into a unified evaluation framework. In addition, the weighting coefficient β explicitly represents the relative economic penalty associated with additional waste-rock mixing versus ore loss, allowing the influence of changing economic conditions on configuration ranking to be examined transparently through β-sensitivity analysis rather than being fixed to a single cost scenario. The index, therefore, provides a direct bridge between experimentally measured technical responses and economic preference and can support concise and transparent relative screening of drawing configurations when the detailed inputs required for a full mine-scale economic analysis are not yet available.
A further feature of the proposed framework is that the dimensionless screening function allows the sensitivity of its integrated performance to β to be examined continuously. This provides a basis for identifying a β-insensitive characteristic feature, i.e., a DTR region where the integrated evaluation is relatively insensitive to changes in economic weighting.
Neither the conventional economic-value model nor the proposed index explicitly represents intertemporal cash flows or discounting, and neither should, therefore, be interpreted as a full NPV optimization framework. A mine-scale NPV analysis would generally require time-dependent revenue and cost inputs, grade and recovery assumptions, production scheduling, and an explicit discount rate. Accordingly, the agreement in ordinal ranking between the two approaches is interpreted only as a configuration-level cross-check under consistent economic assumptions, rather than as evidence of economic equivalence between the two formulations. The methodological contribution of I is, therefore, not to replace conventional economic evaluation, but to provide a dimensionless, β-adjustable screening layer between laboratory-scale technical performance and subsequent mine-specific economic assessment.
5.3. Exploratory Interpolation and Scenario Analysis Within the Tested DTR Range
- (1)
- Descriptive interpolation of the experimental trends is performed
Quadratic interpolants are constructed through the treatment means at c = 1, 2, and 3 to describe the within-range variation in recovery and waste-rock mixing, as shown in Equation (6):
Because the three treatment means uniquely determine a quadratic interpolant, these expressions are used strictly as descriptive within-range interpolants rather than as statistical regression or predictive models.
Within the tested range, both recovery and waste-rock mixing increase with c, while the increase in waste-rock mixing from c = 2 to c = 3 exceeds that from c = 1 to c = 2. The interpolated trends, therefore, reflect the observed DTR-dependent recovery–mixing trade-off and provide the basis for the subsequent scenario analysis.
- (2)
- The dimensionless screening index
To reveal the variation in the dimensionless screening index across the tested DTR levels under different economic weighting assumptions, the descriptive interpolants are substituted into the dimensionless screening index formula to establish an exploratory scenario function. This function characterizes the within-range variation in the dimensionless screening index with the DTR scenario parameter c and the economic weighting coefficient β and supports comparative analysis of alternative economic-weighting scenarios.
In this study, c acts as both the operational stopping parameter of drawing (preset before ore drawing) and the scenario variable corresponding to DTR levels. The scenario function integrates relative recovery performance and the penalty assigned to waste-rock mixing variation. All quantitative analyses and interpretations are restricted to the experimentally covered interval 1 ≤ c ≤ 3. For visual continuity, the same polynomial is shown outside this interval using dashed segments; these segments represent only the mathematical continuation of the interpolant and are not used for configuration ranking, characteristic-point identification, or operational inference.
By substituting the descriptive interpolants from Equation (6) into the dimensionless screening index expression given in Equation (4), the exploratory scenario function is derived as shown in Equation (7). The interpolants are constructed based on the mean values of the three test groups, and the resulting function is used to examine within-range variation patterns and the dependence of the screening index on the DTR and β.
- (3)
- The within-range scenario results are analyzed
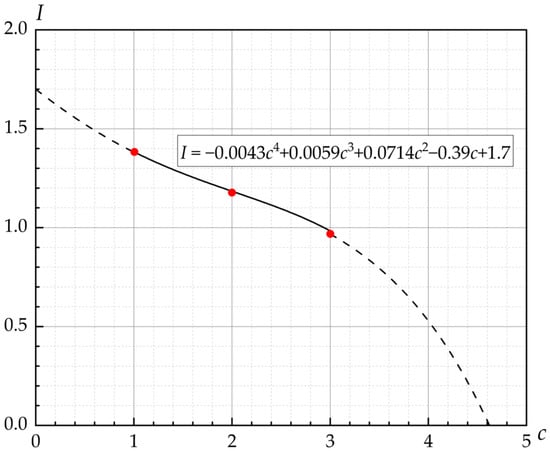
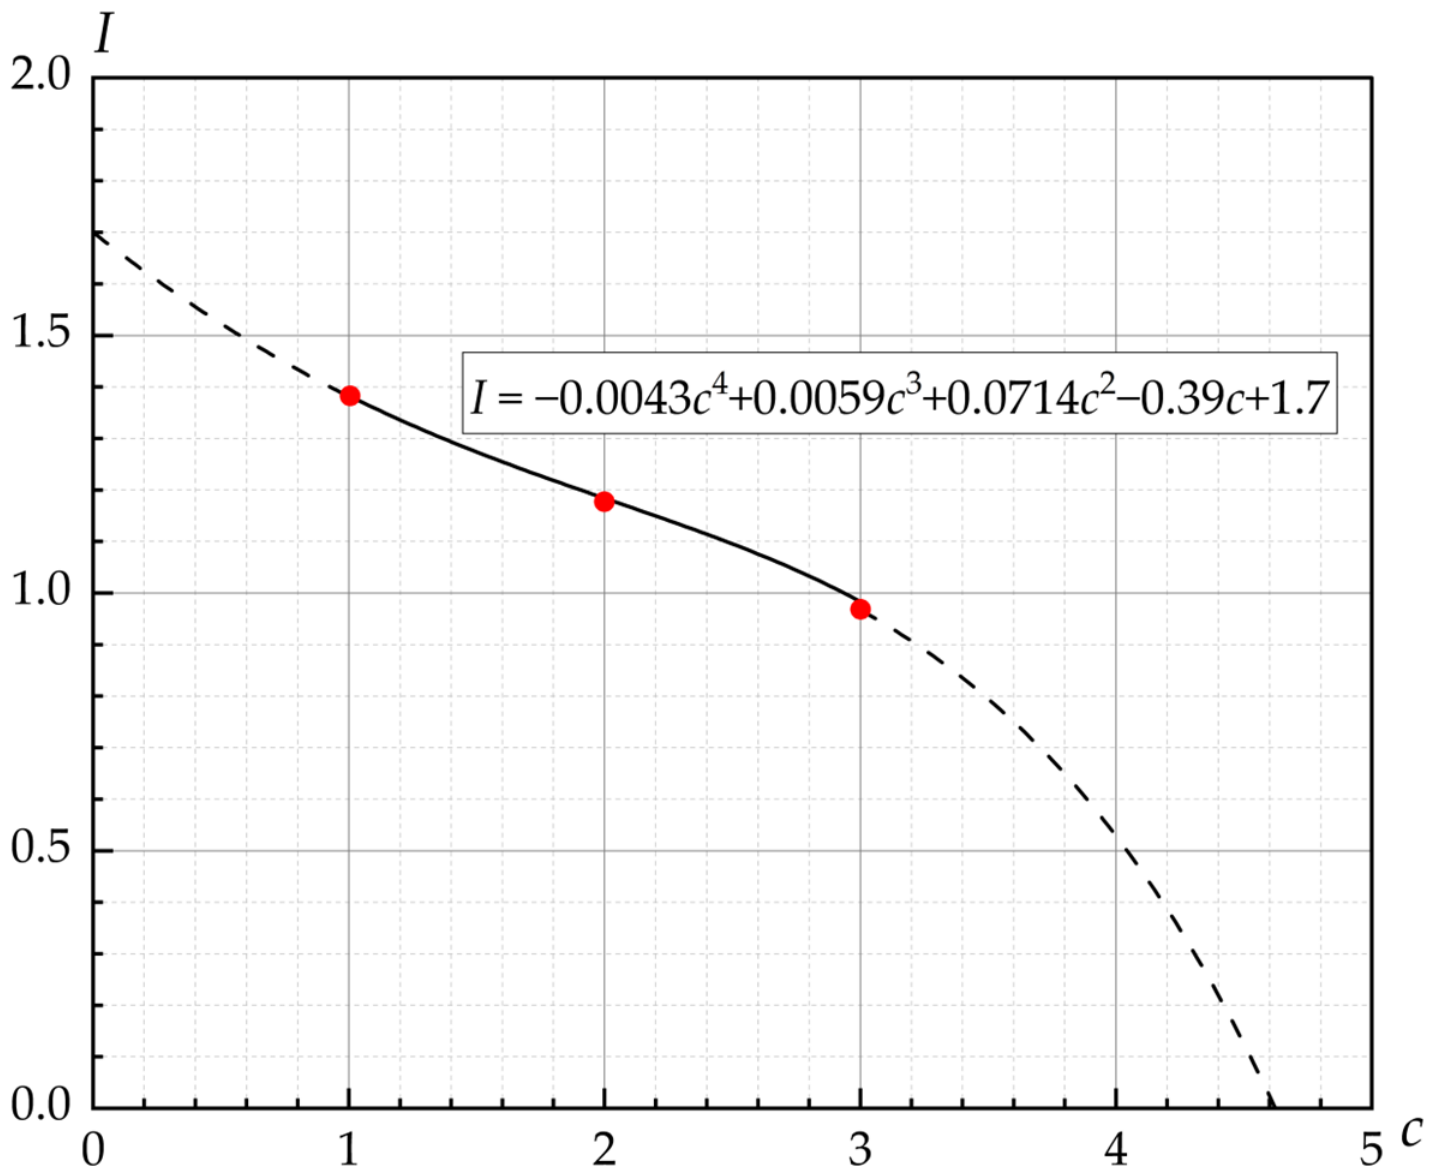
The scenario analysis is confined to the interval 1 ≤ c ≤ 3, covering the full DTR range of the physical experiments. The descriptive interpolants and adopted economic parameters are substituted into Equation (7) to visualize the variation in the dimensionless screening index I within the tested DTR range, as illustrated in Figure 4.
Figure 4.
Exploratory interpolation of the dimensionless screening index within the tested DTR range. (Solid line: tested DTR domain; dashed line: mathematical continuation only.)
Under the illustrative weighting of β = 1.46, the interpolated index is highest at the tested boundary c = 1, with I = 1.381, and decreases over 1 ≤ c ≤ 3. This pattern is interpreted as a descriptive within-range response under the adopted weighting.
This decreasing trend is conditional on the adopted interpolation method and economic parameter settings. The interpolated scenario is consistent with the discrete experimental comparison: c = 1.0 yields the highest index under the given β, verifying that the interpolation preserves the ranking of the measured configurations. Under the tested conditions and adopted economic weighting, the reduction in waste-rock mixing penalty exerts a more dominant influence on the index than the additional recovery gained by relaxing the DTR threshold.
5.4. Sensitivity Analysis
- (1)
- Regarding sensitivity to the economic weighting coefficient β
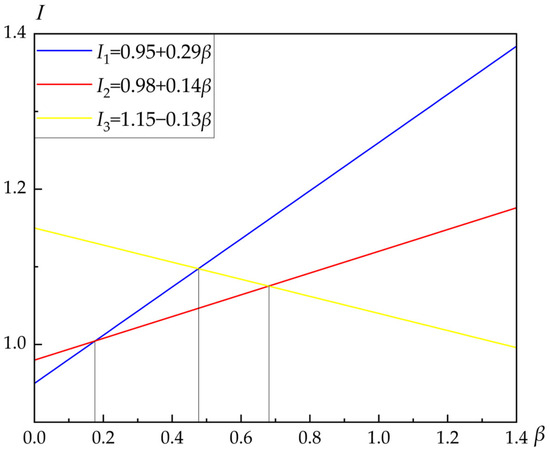
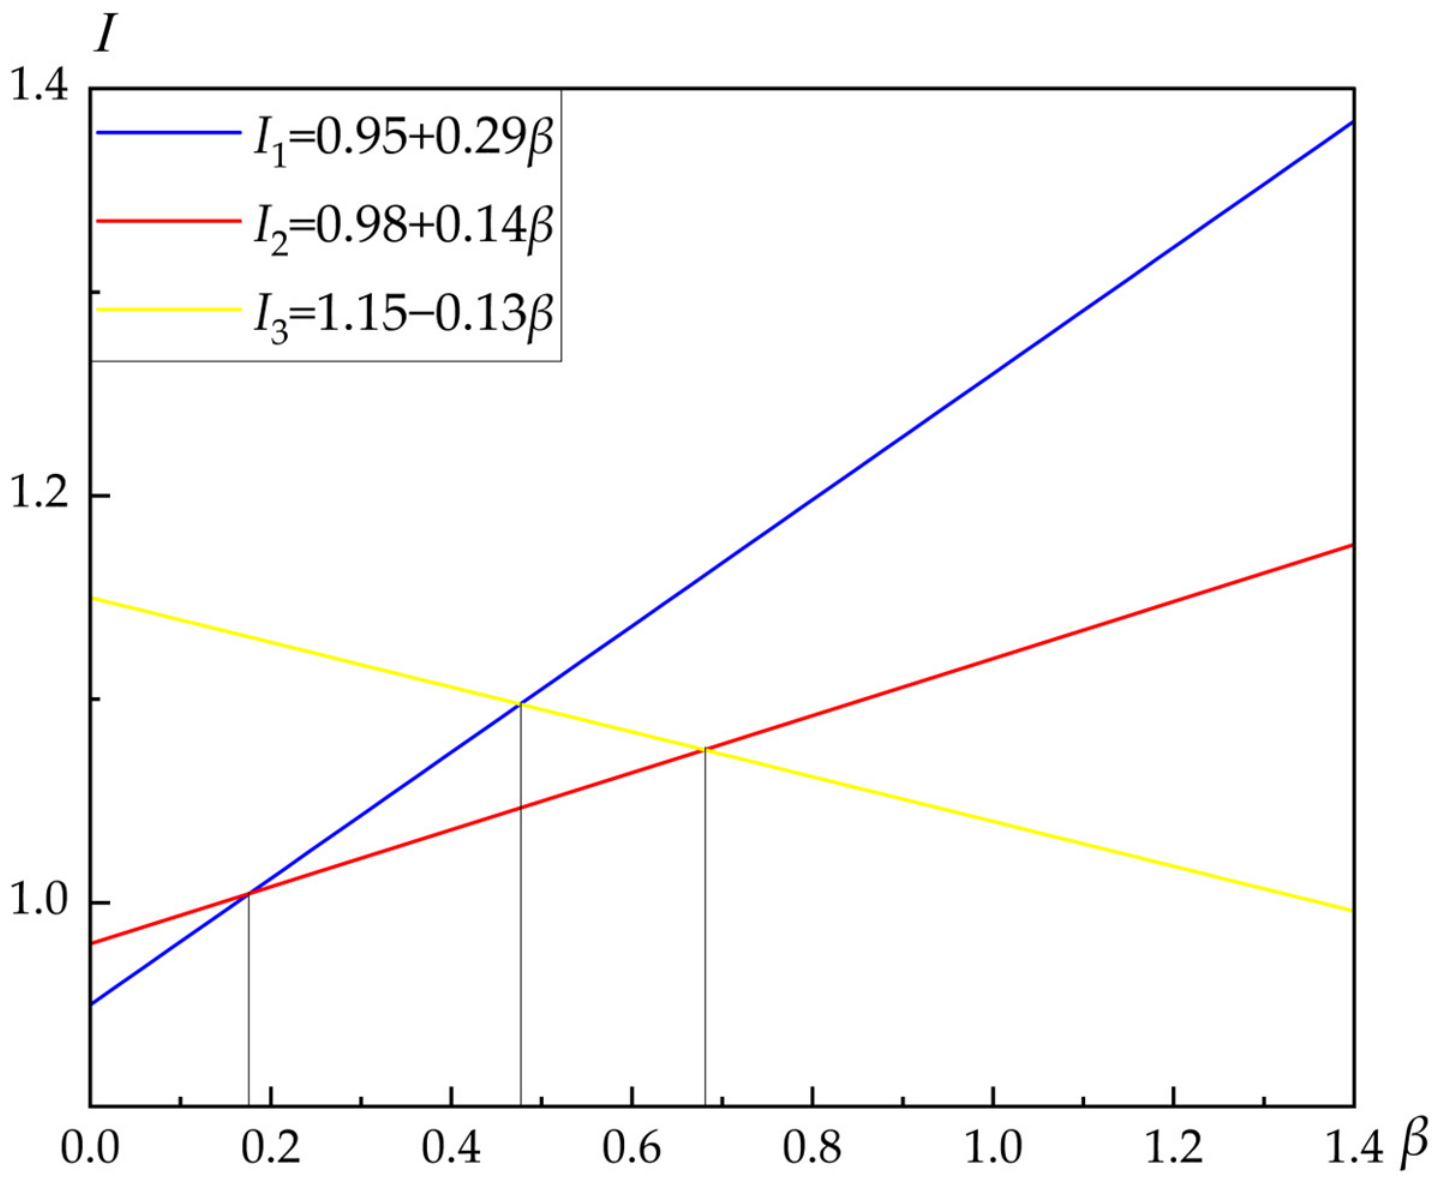
Figure 5 shows that the ranking of the tested configurations varies with β. Based on the current treatment means, Scheme 3 has the highest index when β < 0.48, whereas Scheme 1 has the highest index when β > 0.48; their index values are equal at the principal crossover near β = 0.48. The pairwise crossovers between Schemes 1 and 2 and between Schemes 2 and 3 occur near β = 0.16 and β = 0.66, respectively. Increasing β assigns greater relative weight to waste-rock-mixing control and, therefore, favors configurations with lower mixing rates. These values are nominal mean-based crossover points determined by the present dataset and index formulation.
Figure 5.
Sensitivity of the screening index to β. (The grey line is an auxiliary reading line for the intersection point).
To examine the stability of configuration ranking under a broader range of economic conditions relevant to underground iron-ore production, 48 economic scenarios were constructed by combining practical ranges of iron-concentrate prices and relevant production and processing cost parameters. The scenarios incorporated variations in ore-recovery and waste-mixing conditions, tailings grade, concentrate price, processing cost, and concentrate production cost (Table S1). For each scenario, β was recalculated from the corresponding unit economic losses associated with waste-rock mixing and ore loss. The resulting β values ranged from 1.38 to 2.71, representing a practical economic-weighting interval of approximately 1–3 under the iron-ore conditions considered. Because the entire calculated range lies above the principal crossover at β ≈ 0.48, Scheme 1 remained the highest-ranked tested configuration across all 48 scenarios. The scenario analysis, therefore, extends the economic assessment beyond the single baseline value of β = 1.46, while the calculated range remains within the mathematically admissible interval defined in Section 5.1.
- (2)
- Regarding sensitivity to the reference configuration
Local sensitivity to the reference recovery ηref and waste-rock mixing ratio ρref, corresponding to conventional drawing at DTR = 3:1, was quantified using the normalized elasticity:
Differentiation of I with respect to ηref and ρref yields:
The normalized elasticity with respect to ηref was Sη = −1.00, whereas the elasticity with respect to ρref ranged from approximately 1.32 to 1.56. A ±10% perturbation in ρref produced an index variation of approximately −12% to +17%. These results indicate that uncertainty in the reference waste-rock mixing ratio is an important source of variation in the index.
6. Discussion
- (1)
- Economic weighting coefficient β
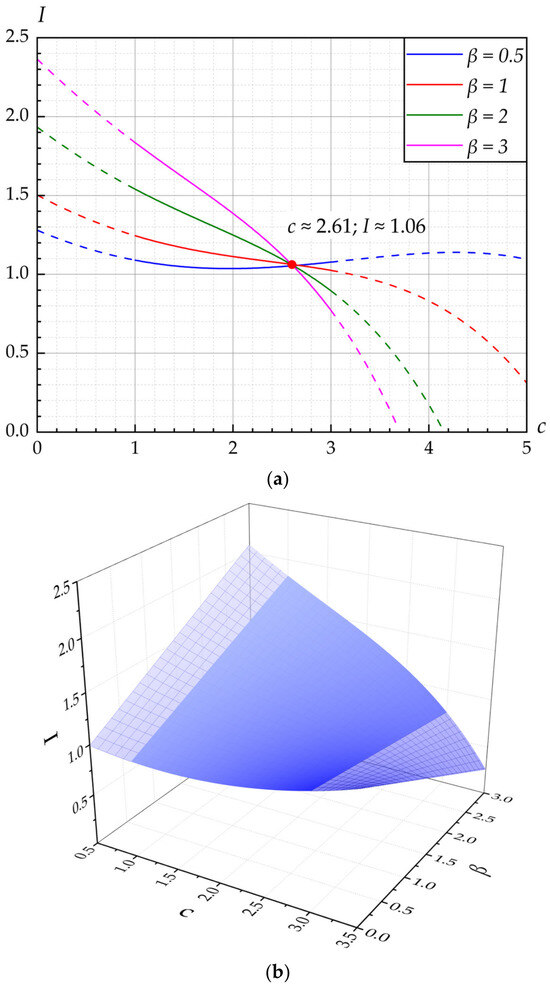
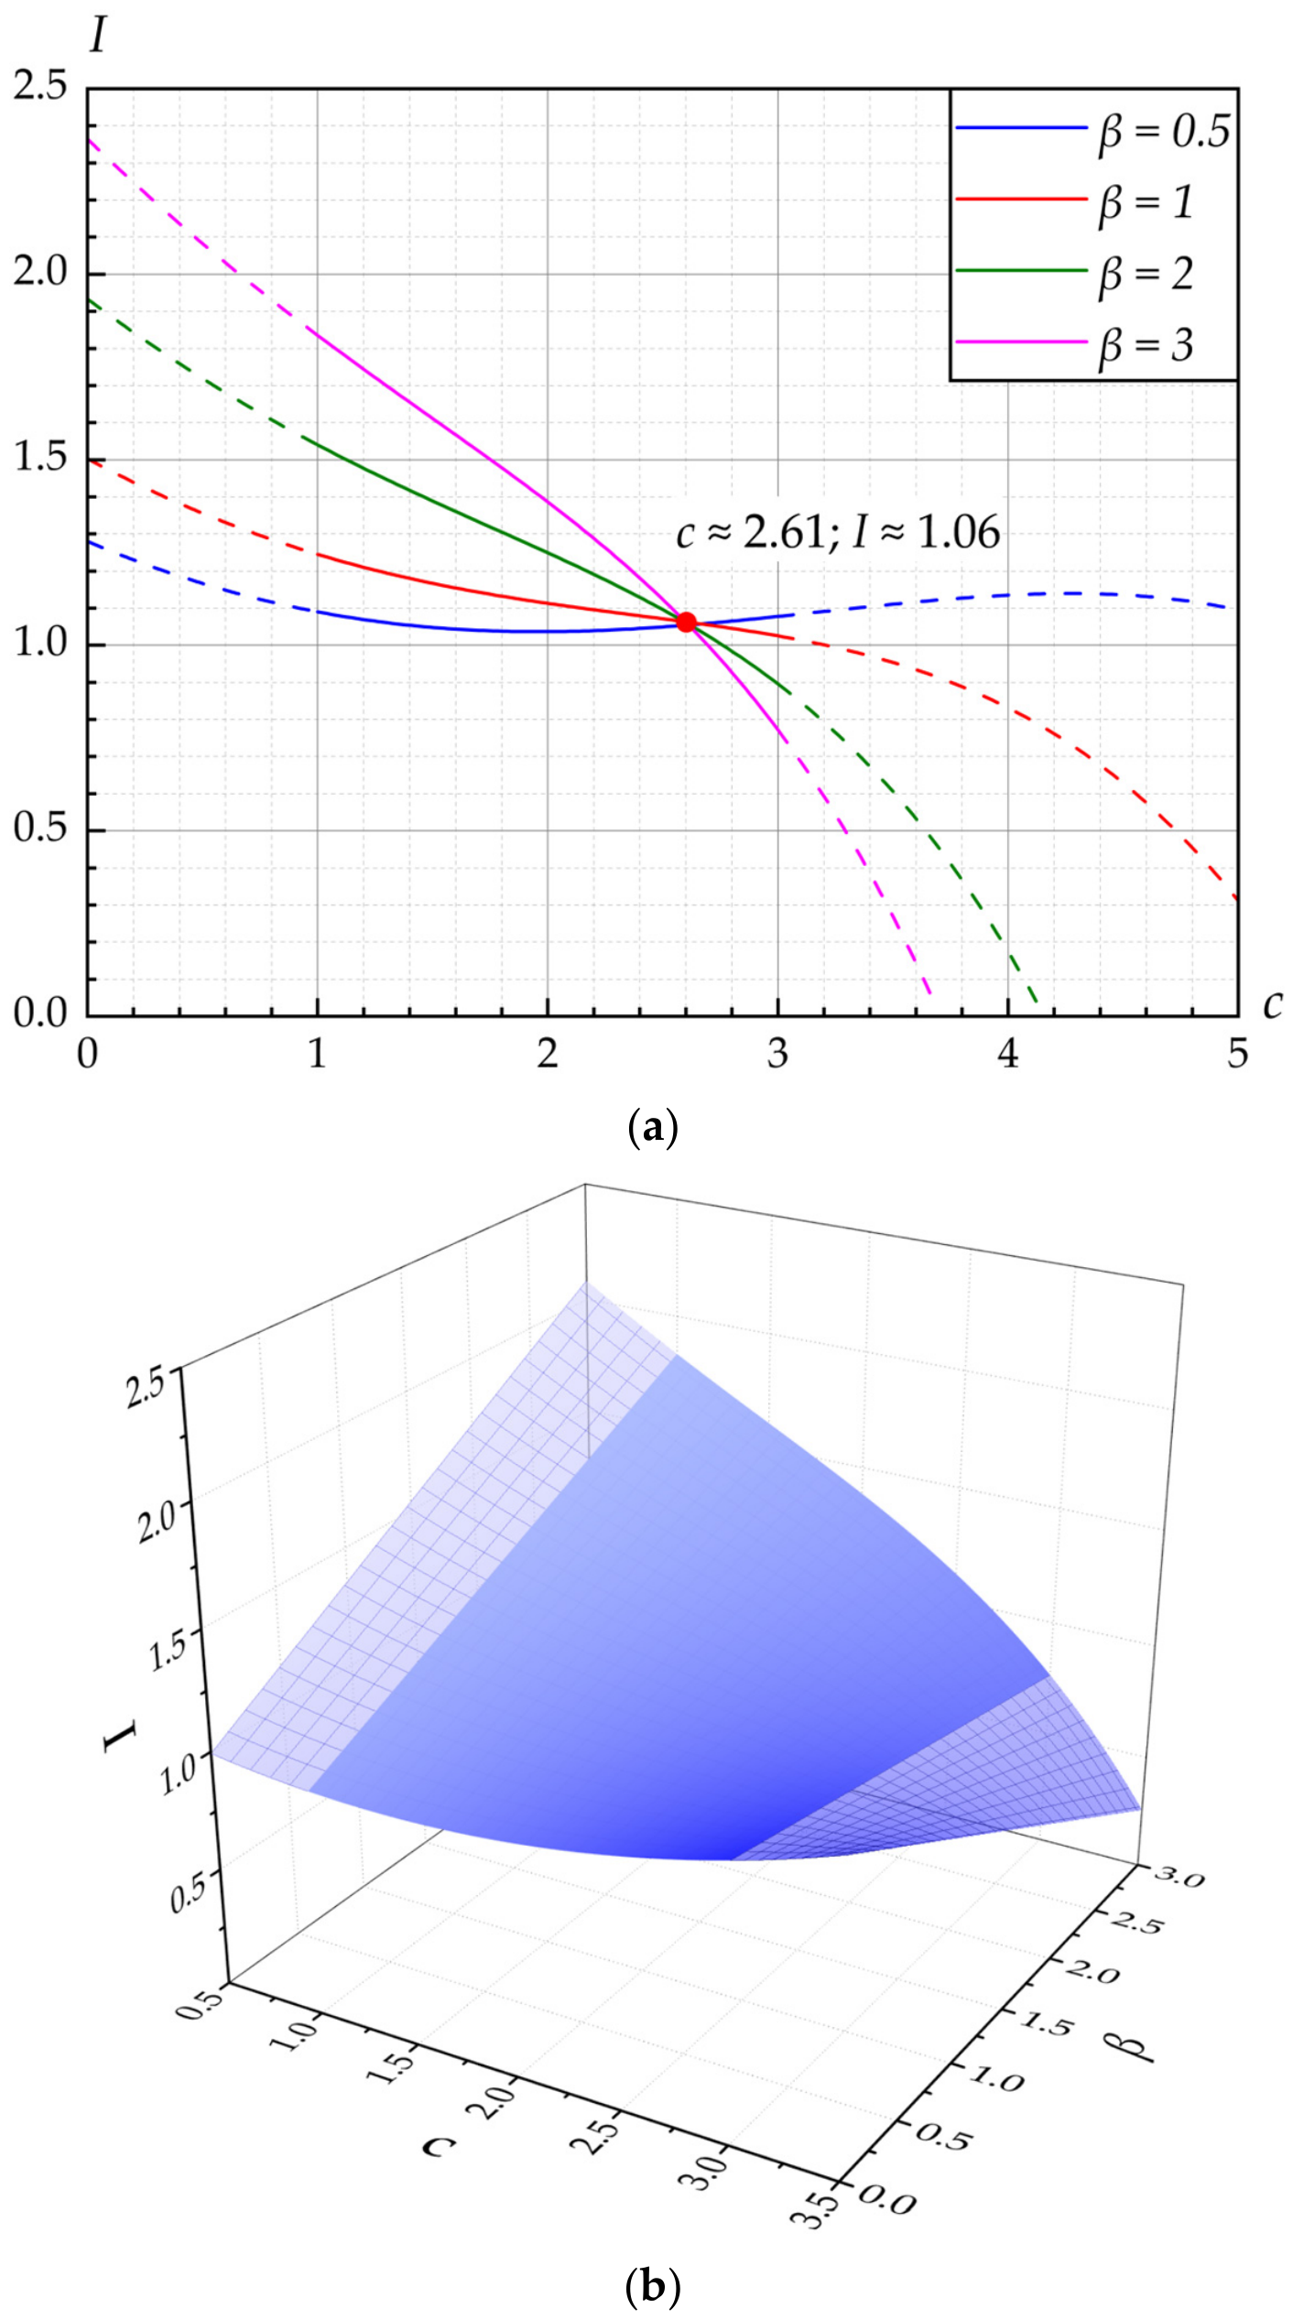
Figure 6 illustrates the joint response of the interpolated screening index to the DTR and the economic weighting coefficient. In the low-c region, the interpolated waste-rock mixing ratio is lower than the reference value; consequently, increasing β increases the calculated index. More generally, β determines how the observed recovery–mixing trade-off is translated into the relative ranking of the tested configurations, with larger values assigning greater importance to waste-rock-mixing control.
Figure 6.
Joint response of the screening index to DTR and β. (a) β-response curves (solid line: tested DTR domain; dashed line: mathematical continuation only). (b) Three-dimensional surface (solid colored surfaces: tested DTR domain; high-transparency curved surface: mathematical continuation only).
The economic weighting coefficient β should not be interpreted as a universal constant. Because it represents the relative unit economic loss associated with waste-rock mixing and ore loss, its magnitude depends on commodity type, product value, ore quality, processing conditions, and the corresponding production and cost structure. Variations in these economic factors can, therefore, alter the relative penalty assigned to waste-rock mixing and ore loss. For the iron-ore economic conditions examined in this study, the 48 scenario combinations yielded β = 1.38–2.71, broadly corresponding to an economic-weighting range of approximately 1–3. Scheme 1 remained the highest-ranked configuration throughout this interval, indicating that the ranking obtained at the baseline β = 1.46 remained stable over the broader range of economic conditions considered.
- (2)
- Interpolation-derived β-insensitive crossing
Within the three-point interpolation, the β-dependent index curves intersect around c ≈ 2.6, where the interpolated waste-rock mixing rate approaches the reference value and the β-dependent adjustment term approaches zero. The corresponding index is approximately I ≈ 1.06. This crossing follows directly from the index formulation and is interpreted as an interpolation-derived feature.
Accordingly, when .
Accordingly, becomes locally insensitive to β near this crossing. This behavior reflects a mathematical property of the index: when the interpolated mixing rate equals the reference value, the mixing adjustment vanishes.
- (3)
- Scope of the within-range interpolation
The descriptive interpolation was applied over 1 ≤ c ≤ 3, corresponding to the three DTR levels represented by the physical tests. Within this domain, it provides a continuous representation of the measured recovery and waste-rock-mixing trends and supports comparison of alternative economic-weighting scenarios. The interpolated relationships are, therefore, interpreted as within-range descriptive tools. Future experiments with additional intermediate DTR levels could be used to examine whether the location of this crossing feature remains stable when the interpolation is updated.
- (4)
- DTR-dependent response of insert drawing and configuration-level interpretation
The results indicate that insert drawing and the DTR act at different operational levels. The insert device modifies the local particle-flow path near the drawpoint, whereas the DTR determines the operational endpoint of drawing. Consequently, the selected DTR defines the position of each insert-drawing configuration along the observed recovery–waste-mixing trade-off.
The preferred configuration cannot be determined from recovery or waste-rock mixing alone because its ranking depends on the economic weighting assigned to the two indicators. The proposed dimensionless index translates the measured recovery–mixing trade-off into a transparent configuration-level ranking under alternative weighting assumptions. Accordingly, the comparisons in this study are interpreted at the configuration level, while the sensitivity analyses show how the resulting ranking changes with β and the reference parameters.
- (5)
- Limitations
The physical-model results should be interpreted within the tested configuration space. One prescribed particle-size distribution, one steeply dipping thick-orebody geometry, one analog-material combination, and one fixed insert-device configuration were adopted to isolate the DTR-dependent response under controlled conditions. Other factors, including fragmentation characteristics, rock strength, orebody geometry, confinement, analog-material properties, and insert-device parameters, may also affect granular flow and should be examined in future studies.
Each configuration included two replicate tests; therefore, the reported standard deviations characterize experimental dispersion rather than inferential significance. The quadratic interpolation and the β-insensitive crossing around c ≈ 2.6 are treated as descriptive, interpolation-derived results. The proposed index is intended for relative techno-economic screening, and mine-specific application requires calibration of local operational and economic parameters. Future work will expand the experimental matrix, incorporate calibrated DEM analysis, and conduct field-scale validation.
7. Conclusions
This study examined the DTR-dependent performance and techno-economic screening of insert drawing using controlled 1:50 laboratory-scale physical-model tests. Insert drawing was evaluated at DTR = 1:1, 2:1, and 3:1, while conventional drawing was included only as a matched comparison at the common DTR = 3:1. Within this experimentally defined scope, the main conclusions are as follows:
- (1)
- A 1:50 physical model was used to evaluate the DTR-dependent performance of insert drawing. As the DTR increased from 1:1 to 3:1, mean recovery increased from 68.62% to 83.17%, while mean waste-rock mixing increased from 34.62% to 55.67%, corresponding to increases of 14.55 and 21.05 percentage points, respectively. The larger increase in waste-rock mixing demonstrates a clear recovery–mixing trade-off over the tested DTR range.
- (2)
- At the common DTR of 3:1, insert drawing showed a mean recovery 10.96 percentage points higher than that of conventional drawing, together with a 5.57-percentage-point increase in mean waste-rock mixing. This matched comparison indicates that this higher observed recovery was achieved with additional waste-rock entry under the tested condition.
- (3)
- The dimensionless techno-economic screening index integrated recovery, waste-rock mixing, and the economic weighting coefficient β. At β = 1.46, Scheme 1, corresponding to insert drawing at DTR = 1:1, had the highest index among the tested configurations, with I = 1.381. The relative unit-loss model produced the same ordinal ranking, providing an internal consistency check under the adopted unit-cost assumptions.
- (4)
- The highest-ranked tested configuration depended on the economic weighting. Based on the current treatment means, Scheme 3 ranked highest when β < 0.48, whereas Scheme 1 ranked highest when β > 0.48, with equal indices near the principal crossover at β ≈ 0.48. Across the 48 iron-ore economic scenarios constructed from practical price and cost ranges (β = 1.38–2.71), Scheme 1 remained the highest-ranked configuration. The descriptive interpolation further indicated a locally β-insensitive crossing around c ≈ 2.6, with I ≈ 1.06.
- (5)
- The principal methodological contribution of this study is a two-stage, dimensionless screening framework that links experimentally measured DTR-dependent recovery–mixing responses with explicit economic weighting. Candidate configurations are first evaluated using measured recovery and waste-rock mixing, after which the robustness of their ranking is examined over alternative values of β. The framework, therefore, provides a β-adjustable bridge between laboratory-scale technical performance and subsequent mine-specific economic assessment, while the β-insensitive characteristic offers an additional means of examining the stability of integrated performance with respect to economic weighting.
These conclusions remain limited to the tested laboratory configuration space and the two replicate tests conducted for each configuration. In particular, the β-insensitive feature near c ≈ 2.6 is an interpolation-derived result rather than a validated operational threshold. Future work should expand the tested DTR, fragmentation, and geometric conditions, increase independent replication, integrate calibrated DEM/PFC simulations with physical experiments, and conduct field-scale validation using mine-specific operational and economic parameters.
Supplementary Materials
The following supporting information can be downloaded at: https://www.mdpi.com/article/10.3390/min16090884/s1, Table S1. Iron-concentrate price and production-cost parameter combinations and calculated β values for the 48 economic scenarios.
Author Contributions
X.S.: Conceptualization, Methodology, Writing—Original Draft, Visualization. X.M.: Data Curation, Validation, Formal Analysis. K.L.: Writing—Review and Editing, Visualization, Investigation. G.T.: Supervision, Funding Acquisition, Resources. All authors have read and agreed to the published version of the manuscript.
Funding
This work was supported by the National Natural Science Foundation of China under Grant No. 51574151.
Institutional Review Board Statement
Not applicable.
Data Availability Statement
The data supporting the findings of this study are provided in the article and the Supplementary Materials. Further inquiries can be directed to the corresponding author.
Acknowledgments
The authors would like to thank the University of South China for providing the laboratory facilities and equipment used in the experiments.
Conflicts of Interest
The authors declare no conflicts of interest.
Nomenclature
| η | Ore recovery rate |
| ρ | Waste-rock mixing rate |
| c | Draw-termination ratio |
| Rη | Relative recovery score |
| Dρ | Reference-centered normalized mixing deviation |
| Pρ | Waste-rock-mixing adjustment factor |
| I | Dimensionless techno-economic screening index |
| β | Economic weighting coefficient |
| mp | Unit economic loss associated with additional waste-rock mixing |
| ms | Unit economic loss associated with unrecovered ore |
| Qr, Qt, Qw | Relevant ore/waste masses used in Equations (1)–(3) |
| M0 | Relative economic-value change |
| λl, λt | Length and time similarity coefficients |
References
- Kvapil, R. The Mechanics and Design of Sublevel Caving Systems. In Underground Mining Methods Handbook; SME-AIME: New York, NY, USA, 1982; pp. 880–897. [Google Scholar]
- Janelid, I.; Kvapil, R. Sublevel Caving. Int. J. Rock Mech. Min. Sci. 1966, 3, 129–132. [Google Scholar] [CrossRef] [Scilit]
- Hustrulid, W.; Kvapil, R. Sublevel caving—Past and future. In Proceedings of the 5th International Conference and Exhibition on Mass Mining; Luleå University of Technology: Luleå, Sweden, 2008; pp. 107–132. [Google Scholar]
- Campbell, A.D. Full-Scale Experiments and Numerical Modelling to Improve Ore Recovery in Sublevel Cave Mines. Ph.D. Thesis, University of Queensland, Brisbane, Australia, 2018. [Google Scholar]
- Brunton, I.D.; Fraser, S.J.; Hodgkinson, J.H.; Stewart, P.C. Parameters Influencing Full Scale Sublevel Caving Material Recovery at the Ridgeway Gold Mine. Int. J. Rock Mech. Min. Sci. 2010, 47, 647–656. [Google Scholar] [CrossRef] [Scilit]
- Freidin, A.M.; Neverov, S.A. Modeling of Area-End Ore Drawing under Caved Rocks. J. Min. Sci. 2005, 41, 436–446. [Google Scholar] [CrossRef] [Scilit]
- Zhang, Z.X.; Hou, D.F.; Aladejare, A.; Ozoji, T.; Qiao, Y. World Mineral Loss and Possibility to Increase Ore Recovery Ratio in Mining Production. Int. J. Min. Reclam. Environ. 2021, 35, 670–691. [Google Scholar] [CrossRef] [Scilit]
- Shao, A.L. Waste Rock Movement and Control in End-Drawing; Metallurgical Industry Press: Beijing, China, 2013. [Google Scholar]
- Hmoud, S.; Kumral, M. Spatial Entropy for Quantifying Ore Loss and Dilution in Open-Pit Mines. Min. Metall. Explor. 2023, 40, 2227–2242. [Google Scholar] [CrossRef] [Scilit]
- King, B.; Newman, A. Optimizing the Cutoff Grade for an Operational Underground Mine. Interfaces 2018, 48, 357–371. [Google Scholar] [CrossRef] [Scilit]
- Shekhar, G.; Gustafson, A.; Hersinger, A.; Jonsson, K.; Schunnesson, H. Development of a Model for Economic Control of Loading in Sublevel Caving Mines. Min. Technol. 2019, 128, 118–128. [Google Scholar] [CrossRef] [Scilit]
- Malakhov, G.M. Discharge of Ore from Caved Blocks; Metallurgizdat: Moscow, Russia, 1952. [Google Scholar]
- Liang, W. The Mechanism of Wire Rope-Concrete-Flexible Artificial Roof in Ore-Drawing Under the Waste for Steeply Inclined Ore Body. Ph.D. Thesis, Kunming University of Science and Technology, Kunming, China, 2015. [Google Scholar]
- Chen, Q.F.; Zhao, F.Y.; Chen, Q.L.; Wang, Y.D.; Zhong, Y.; Niu, W.J. Orthogonal Simulation Experiment for Flow Characteristics of Ore in Ore Drawing and Influencing Factors in a Single Funnel under a Flexible Isolation Layer. JOM 2017, 69, 2485–2491. [Google Scholar] [CrossRef] [Scilit]
- Cao, J.L.; Ren, F.Y.; Zhang, J.J.; Yang, Q.P. Experimental Study on Diversion Drawing by Stress-Relieve Sublevel Caving Method. J. Northeast. Univ. (Nat. Sci. Ed.) 2011, 32, 1186–1189. [Google Scholar]
- Tao, G.Q.; Lu, M.X.; Zhang, X.F.; Zhang, R.; Zhu, Z.H. A New Diversion Drawing Technique for Controlling Ore Loss and Dilution during Longitudinal Sublevel Caving. Int. J. Rock Mech. Min. Sci. 2019, 113, 163–171. [Google Scholar] [CrossRef] [Scilit]
- Wang, L.; Jing, H.; Yu, J.; Liu, X. Impact of particle shape, size, and size distribution on gravity flow behaviour of broken ore in sublevel caving. Minerals 2022, 12, 1183. [Google Scholar] [CrossRef] [Scilit]
- Castro, R.; Trueman, R.; Halim, A. A Study of Isolated Draw Zones in Block Caving Mines by Means of a Large 3D Physical Model. Int. J. Rock Mech. Min. Sci. 2007, 44, 860–870. [Google Scholar] [CrossRef] [Scilit]
- Zhang, Z.X. Lost-Ore Mining—A Supplementary Mining Method to Sublevel Caving. Int. J. Rock Mech. Min. Sci. 2023, 168, 105420. [Google Scholar] [CrossRef] [Scilit]
- Sun, H.; Jin, A.; Elmo, D.; Gao, Y.; Wu, S. A Numerical Based Approach to Calculate Ore Dilution Rates Using Rolling Resistance Model and Upside-Down Drop Shape Theory. Rock Mech. Rock Eng. 2020, 53, 4639–4652. [Google Scholar] [CrossRef] [Scilit]
- Wang, S.L.; Huang, M. Optimization of Stope Structure Parameters of Non-Pillar Sublevel Caving Method Based on Loose Flow Test. Min. Res. Dev. 2025, 45, 8–13. [Google Scholar]
- Laptev, V.V.; Belogorodtsev, O.V.; Lukichev, S.V. Analysis of Ore Drawing Modes in Sublevel Caving Using Numerical Modeling. J. Min. Sci. 2024, 60, 983–989. [Google Scholar] [CrossRef] [Scilit]
- Zhou, B.; Elmo, D.; Chen, X.; Wu, Y.; Li, G. Optimization of Structural Parameters in Sublevel Caving: Insights from Ore-Waste Rock Movement Patterns. Min. Metall. Explor. 2025, 42, 1677–1691. [Google Scholar] [CrossRef] [Scilit]
- Cai, C.; Chen, J.; Ren, C.; Xiong, C.; Liu, Q.; He, C. Robust Multi-Objective Optimization of Ore-Drawing Process Using the OGOOSE Algorithm Under an ε-Constraint Framework. Symmetry 2026, 18, 254. [Google Scholar] [CrossRef] [Scilit]
- Yan, F.; Chen, J.; Wang, J.; He, F.; Li, G.; Sun, D.; Wang, H. Time-Space-Quantity-Energy Coupling in Intelligent Caving Mines: A Review of Ore-Flow Control and Mining-Processing Coordination. Minerals 2026, 16, 583. [Google Scholar] [CrossRef] [Scilit]
- Meng, X.J.; Long, T.; Shi, X.Y.; Wang, L.; Zhu, Z.; Tao, G. A New Insert Drawing Technique for Controlling Ore Loss and Dilution during Sublevel Caving. Sci. Rep. 2025, 15, 23104. [Google Scholar] [CrossRef] [Scilit] [PubMed]
- Lane, K.F. The Economic Definition of Ore: Cut-Off Grades in Theory and Practice; Mining Journal Books: London, UK, 1988. [Google Scholar]
- Shekhar, G.; Gustafson, A.; Boeg-Jensen, P.; Malmgren, L.; Schunnesson, H. Draw Control Strategies in Sublevel Caving Mines—A Baseline Mapping of LKAB’s Malmberget and Kiirunavaara Mines. J. S. Afr. Inst. Min. Metall. 2018, 118, 723–733. [Google Scholar] [CrossRef] [Scilit]
- Tan, B.H.; Long, W.G.; Gong, Z.; Zhang, Z.G.; Chen, X.M.; Zhu, Q. Experimental Research of Combined Ore-Drawing Scheme for Orebody in Confined Space During Sublevel Caving Without Sill Pillar. Mine. Met. Eng. 2023, 43, 10–15. [Google Scholar]
- Zhang, Z.G. Economic Evaluation and Analysis of Ore Loss and Dilution. China Min. Mag. 1992, 1, 33–38. [Google Scholar]
- Shekhar, G.; Gustafson, A.; Jonsson, K.; Martinsson, J.; Schunnesson, H. Development of an Optimal Draw Control Strategy for a Sublevel Caving Operation at Malmberget Mine. Min. Technol. 2020, 129, 104–112. [Google Scholar] [CrossRef] [Scilit]
- Campbell, A.D. A Global Review of Recovery, Dilution and Draw Control in Sublevel Caving Mines. In Caving 2022: Proceedings of the Fifth International Conference on Block and Sublevel Caving; Australian Centre for Geomechanics: Perth, Australia, 2022; pp. 909–926. [Google Scholar]
- Ahmadi, M.R.; Shakoor Shahabi, R. Cutoff Grade Optimization in Open Pit Mines Using Genetic Algorithm. Resour. Policy 2018, 55, 184–191. [Google Scholar] [CrossRef] [Scilit]
- Zarshenas, Y.; Saeedi, G. Determination of Optimum Cutoff Grade with Considering Dilution. Arab. J. Geosci. 2017, 10, 165. [Google Scholar] [CrossRef] [Scilit]

Disclaimer/Publisher’s Note: The statements, opinions and data contained in all publications are solely those of the individual author(s) and contributor(s) and not of MDPI and/or the editor(s). MDPI and/or the editor(s) disclaim responsibility for any injury to people or property resulting from any ideas, methods, instructions or products referred to in the content. |
© 2026 by the authors. Licensee MDPI, Basel, Switzerland. This article is an open access article distributed under the terms and conditions of the Creative Commons Attribution (CC BY) license.