


Abstract
The Qulong–Jiama polymetallic ore concentration area, located in the eastern segment of the Gangdese metallogenic belt, is one of China’s most significant copper resource production zones. With the growing demand for copper resources, this area has become a key target for mineral exploration. The current study aims to explore the application potential of multispectral and hyperspectral remote sensing technologies in porphyry copper deposit prospecting, establish a hyperspectral remote sensing prospecting model tailored to this region, and provide technical support for prospecting prediction and resource exploration of similar deposits. Sentinel-2 and Landsat 8 data were used to outline major alteration anomalies at the regional scale, while GF-5 hyperspectral data enabled precision mineral mapping. Results show clear porphyry-style alteration zoning. Hyperspectral mineral identification reveals 33 mineralization- and alteration-related minerals, including muscovite, biotite, pyrophyllite, dickite, chlorite, epidote, and limonite. The ore concentration area exhibits a well-developed inner–middle–outer alteration sequence: (1) an inner potassic–silicic zone locally accompanied by skarn; (2) a middle phyllic and argillic zone dominated by quartz–sericite–pyrite assemblages; and (3) an outer propylitic zone of chlorite–epidote–carbonate with supergene iron oxides. These alteration patterns spatially coincide with known deposits and metallogenic structures such as faults, annular features, and intrusive contacts. Based on these spatial relationships, a hyperspectral remote sensing prospecting model was constructed. The model defines diagnostic mineral assemblages for each zone, highlights structurally altered overlapping areas as priority targets, and effectively predicts the distribution of ore-related alteration belts. The strong correspondence between remote sensing-derived anomalies and existing deposits demonstrates that hyperspectral alteration information is a reliable indicator of ore-forming systems. The proposed model not only provides a scientific basis for further prospecting and exploration in the Qulong–Jiama area but also serves as a reference for copper exploration in the Gangdese metallogenic belt and other similar porphyry–epithermal metallogenic systems.
1. Introduction
Porphyry copper deposits are one of the primary global sources of copper, widely distributed in tectonic domains such as the Circum–Pacific Metallogenic Belt and the Tethyan Metallogenic Belt. Their resource reserves and mining potential dominate worldwide [1]. The Qulong–Jiama ore concentration area on the Tibetan Plateau, a representative region of the Gangdese Metallogenic Belt, hosts abundant copper–polymetallic resources [2]. However, the area’s high altitude, complex topography, and sensitive ecosystems render traditional exploration methods inefficient and ecologically disruptive. The Chinese “Spectral Crust” initiative aims to integrate space-, air-, ground-, and borehole-based spectral sensing systems. However, its effectiveness in guiding green mineral exploration in ecologically fragile and high-altitude regions remains to be systematically validated. This study addresses this gap by combining hyperspectral, multispectral (Landsat-8, Sentinel-2), and field data to establish a robust exploration model for porphyry copper deposits.
Multispectral remote sensing, such as Landsat-8 and Sentinel-2, has long been applied in geological and mineral exploration due to its wide spatial coverage, frequent revisit time, and moderate spectral resolution. These sensors are particularly effective for mapping regional-scale lithology, alteration zones, and structural features, providing a broad overview of potential mineralized areas. Numerous studies have demonstrated that multispectral indices and band ratios can successfully highlight hydrothermal alteration zones, guiding initial prospecting efforts over large, remote, or inaccessible regions [3,4]. However, the relatively coarse spectral resolution of multispectral data limits the discrimination of alteration mineral assemblages with subtle spectral differences, which is critical for detailed mineralogical analysis and deposit-scale prospecting.
Hyperspectral remote sensing technology, leveraging its integration of spectral and spatial information, enables rapid identification of hydrothermal alteration minerals and delineation of mineralization anomalies, offering an efficient and non-invasive approach for green exploration [5]. Compared to conventional multispectral sensors such as Landsat-8 and Sentinel-2, hyperspectral sensors provide hundreds of narrow contiguous bands, enabling discrimination of mineral assemblages with subtle spectral differences, which is crucial for exploration in geologically complex and ecologically sensitive areas. Numerous studies have demonstrated the feasibility of hyperspectral data in alteration mineral mapping and prospecting. For instance, reflective spectral features of typical alteration minerals such as sericite, chlorite, and illite have been analyzed using hyperspectral satellites including EO-1, EnMAP, GF-5, and ZY1-02D [6,7,8]. Additionally, the use of hyperspectral data to construct characteristic parameters such as spectral absorption center and depth facilitates the analysis of deposit-scale spectral features of alteration minerals. This enables the development of alteration mineral exploration indicator models that reflect the intensity and evolutionary stages of hydrothermal activity, thereby predicting potential mineralization centers [9,10]. Recent studies have demonstrated that new-generation spaceborne hyperspectral sensors, such as PRISMA, EnMAP, and EMIT, are capable of effectively mapping hydrothermal alteration minerals and characterizing mineral chemical variations associated with porphyry and high-sulfidation systems [11,12]. These sensors, when combined with advanced spectral analysis techniques, enable regional-scale delineation of key alteration zones—including potassic, propylitic, and phyllic assemblages—and provide valuable indicators of fluid evolution and mineralization processes. Tan et al. [13] identified and validated alteration mineral assemblages in the Liba gold deposit in the West Qinling region based on GF-5B satellite hyperspectral data. They found that short-wave infrared spectral shifts of muscovite and chlorite could serve as mineralization indicators, demonstrating the significant potential of such data in predicting prospects for orogenic gold deposits.
Although hyperspectral remote sensing provides fine spectral resolution for accurately identifying alteration minerals and characterizing hydrothermal processes, it still has limitations in terms of spatial coverage and revisit frequency, which can constrain its application in large or remote regions [14]. To overcome these shortcomings, this study integrates the complementary advantages of multispectral and hyperspectral data: multispectral sensors such as Landsat-8 and Sentinel-2 provide broad regional coverage and frequent revisit times, while hyperspectral sensors offer detailed spectral information crucial for distinguishing subtle mineral assemblages. Based on this combined approach, a robust mineral prospecting model is developed for the Qulong–Jiama ore concentration area within the Gangdese Metallogenic Belt. The model systematically integrates geological data, multispectral and hyperspectral remote sensing anomalies, and the distribution of alteration mineral assemblages to support regional-scale mapping and deposit-scale analysis in complex and ecologically sensitive terrains.
Overall, while the integration of multispectral and hyperspectral data enhances regional mapping efficiency, hyperspectral remote sensing remains the primary and most effective tool for detailed mineralogical analysis and precise prospecting. This study thus leverages the strengths of both data types but emphasizes hyperspectral data as the core for constructing an accurate and reliable prospecting framework, providing scientific and technical support for green mineral exploration in western China and advancing the implementation of the “Spectral Crust” initiative.
2. Study Area Overview and Methodology
2.1. Geological Setting of the Study Area
The Qulong–Jiama polymetallic ore concentration area, located in the Xizang (Tibet) Autonomous Region of China, is situated within the eastern segment of the Gangdese Cu, Mo, Pb, Zn, Au, Fe metallogenic belt, which itself forms part of the Tethyan–Himalayan metallogenic domain—a globally significant province for porphyry copper deposits. In terms of tectonic framework [15], it resides within the II-order Ladakh–Gangdese arc–basin system and the III-order Ladakh–South Gangdese–Lower Zayu magmatic arc.
The regional stratigraphy is predominantly composed of passive continental margin volcanic-sedimentary rock series. These include the Upper Triassic Mailonggang Formation, the Middle–Lower Jurassic Yeba Formation, the Upper Jurassic Qusangwenquan and Duodigou Formations, and the Lower Cretaceous Linbuzong, Chumulong, and Talongla Formations, with Jurassic and Cretaceous strata being the most prevalent [16].
The regional structural trend is primarily E-W. This includes major, near E-W striking translithospheric fractures resulting from the collision and compression between the northern and southern plates. Additionally, NE-trending and near SN-trending structures, characterized by extensional tectonics associated with tectonic transitions, are present, as well as annular structures related to magmatic activity and thermal doming [17].
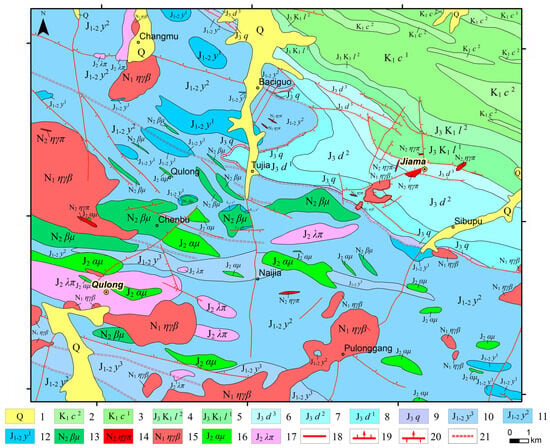
Qulong Mining Area: The exposed strata belong to the Middle Jurassic Yeba Formation, consisting of intermediate–acidic lavas and pyroclastic rocks intercalated with crystalline limestone, sericite–quartz schist, and chlorite–sericite–quartz schist (Figure 1). From bottom to top, the lithologic sequence includes volcanic breccia, volcanic lava, tuff, tuff–breccia, and carbonate rocks [18]. Small-scale faults, mostly less than 1 km in length with fracture zones 1–15 m wide, are primarily developed in the northern pyroclastic rocks [19]. The area contains a wide range of intrusive rocks, including quartz diorite, granodiorite, biotite monzogranite, granodiorite porphyry, monzogranite porphyry, diabase porphyrite, diorite porphyrite, quartz porphyry, and andesite porphyry, occurring as small stocks, dikes, and apophyses, forming a complex volcanic–magmatic system. Hydrothermal alteration shows a roughly concentric, annular zoning pattern centered on the composite intrusion, reflecting multiple phases of intrusion and overlapping alteration zones [15].
Figure 1.
Geological map of the Qulong–Jiama ore concentration area. 1—Quaternary: eluvial–deluvial deposits, glacial deposits; 2—Second Member of Chumulong Formation: fine-grained quartz sandstone, siltstone, slate; 3—First Member of Chumulong Formation: lithic quartz greywacke, siltstone; 4—Second Member of Linbuzong Formation: slate, siltstone, fine-grained quartz sandstone; 5—First Member of Linbuzong Formation: silty slate, argillaceous siltstone; 6—Third Member of Duodigou Formation: silty slate, argillaceous siltstone; 7—Second Member of Duodigou Formation: powder crystalline limestone, micritic limestone, argillaceous limestone; 8—First Member of Duodigou Formation: sparry limestone, micritic limestone, slate; 9—Quesang Hot Spring Formation: basal conglomerate, sandy conglomerate, coarse sandstone; 10—Third Member of Yeba Formation: tuffaceous dacite, tuff, argillaceous limestone, slate, tuffaceous sandstone; 11—Second Member of Yeba Formation: rhyolitic crystal tuff, dacite, andesite, crystal–vitric tuff, tuff; 12—First Member of Yeba Formation: Tuffaceous volcanic breccia, agglomerate, tuff containing volcanic breccia; 13—Pliocene diabase porphyrite; 14—Pliocene monzonitic granite porphyry; 15—Miocene biotite monzonitic granite; 16—Late Jurassic andesite porphyrite; 17—Late Jurassic rhyolite porphyry; 18—Fault of unknown nature; 19—Normal fault; 20—Reverse fault; 21—Brittle–ductile shear zone.
Jiama Mining Area: The exposed strata mainly consist of the Upper Jurassic Duodigou Formation, the Lower Cretaceous Linbuzong Formation, and minor Quaternary deposits, with ore bodies hosted between the Duodigou and Linbuzong Formations [20]. Magmatic rocks occur primarily as apophyses and dikes, including granite porphyry, biotite monzogranite porphyry, granodiorite porphyry, quartz diorite porphyrite, diorite porphyrite, diorite, spessartite lamprophyre, hornblende diabase, and quartz gabbro [16]. The structural framework is dominated by nappe–detachment systems, represented by the Jiama–Kajunguo nappe and the Tongshan detachment. Interlayer fractures and intrusion–country rock contacts serve as the primary ore-hosting structures, controlling mineralization zoning and enrichment. The Jiama deposit exhibits a “four-in-one” metallogenic system, comprising deep concealed porphyry-type Mo (Cu) ore bodies, skarn-type Cu polymetallic ore bodies in interlayer and contact zones, hornfels-type Cu–Mo ore bodies in shallow fracture systems, and independent Au ore bodies in peripheral structures. Hydrothermal alteration displays vertical stratification, lateral annularity, and multi-stage superposition, with potassic, propylitic, sericitic, and kaolinitic zones reflecting a complex hydrothermal evolution and multiple fluid recharge events [21,22].
2.2. Remote Sensing Data Processing
The remote sensing data used in this study comprised multispectral data from Sentinel-2 and Landsat 8, as well as hyperspectral data from the GF-5 Advanced Hyperspectral Imager (AHSI). Sentinel-2: The Level-1C image was acquired from the Copernicus Data Space Ecosystem on 6 April 2022, with cloud cover <1%. Pre-processing included conversion to Level-2A surface reflectance using the Sen2Cor processor, which performs radiometric calibration, atmospheric correction, and cloud masking. A cirrus correction was also applied, and the image was orthorectified based on SRTM 30 m DEM to ensure accurate geolocation. Selected bands relevant for geological analysis were retained for further processing. Landsat 8: The Level-1 image was sourced from the Geospatial Data Cloud on 19 February 2023, with cloud cover 0.68%. Pre-processing was conducted to obtain surface reflectance (Level-2SP) using the Landsat Surface Reflectance Code (LaSRC), which includes radiometric calibration, atmospheric correction, cloud and shadow detection using the Fmask algorithm, and geometric correction. Bands corresponding to the visible, NIR, and SWIR ranges were used for subsequent analyses. GF-5 AHSI: The hyperspectral image, acquired on 11 November 2023, from the China Centre for Resources Satellite Data and Application. The original dataset contained 330 bands. Bands 191–200 (1345–1421 nm) and 247–263 (1816–1951 nm) were excluded due to severe atmospheric water vapor absorption, and bands 151–153 (1009–1025 nm) were removed due to spectral overlap between VNIR and SWIR detectors. Pre-processing included radiometric calibration, atmospheric correction using the FLAASH model [23], noise removal, and orthorectification using a high-resolution DEM. Finally, 300 bands were retained for further processing, including band subsetting, spectral resampling, and image normalization [24,25].
All pre-processed datasets were co-registered to a common coordinate system (WGS84 UTM Zone 46N) to ensure spatial alignment for subsequent analysis, including alteration mapping and prospecting modeling.
2.3. Alteration Mineral Mapping Methods
Leveraging the distinct characteristics of multispectral and hyperspectral data, this study employed two core algorithms for alteration mineral mapping: principal component analysis (PCA) and spectral angle mapper (SAM).
2.3.1. Principal Component Analysis (PCA)
Principal component analysis (PCA), also known as the Karhunen–Loève transform, is an orthogonal linear transformation. It reduces inter-band correlation while preserving the total data variance, producing a set of linearly uncorrelated principal components (PCs), each containing different useful information. PCA is extensively used for dimensionality reduction and information enhancement in multispectral data. Based on this property, it is widely applied for extracting alteration information associated with various mineral resources [26,27]. For multispectral data like Sentinel-2 and Landsat 8, PCA effectively extracts spectral features related to alteration minerals by eliminating redundant information between bands.
The objective of PCA is to find a linear transformation that converts the original band matrix X into a new data matrix Y, maximizing the variance of the data in the new coordinate system. The core principle is expressed as follows:
where X is the original band matrix, W is the transformation matrix composed of the eigenvectors of the covariance matrix, and Y is the output matrix of principal components.
In this study, selected principal components were interpreted based on their eigenvector loadings and spatial distribution characteristics to highlight different hydrothermal alteration types. Specifically, PCA was used to enhance and delineate alteration information related to iron staining, hydroxyl-bearing alteration, potassic alteration, silicification, sericitization, kaolinization, propylitic alteration, and carbonation. Principal components exhibiting strong positive or negative loadings corresponding to diagnostic spectral bands of these alteration types were retained and further analyzed. The PCA-derived alteration information provided an effective regional-scale enhancement and preliminary delineation of alteration zones, which were subsequently refined and validated using hyperspectral Spectral Angle Mapper classification and field observations.
2.3.2. Spectral Angle Mapper (SAM)
The spectral angle mapper is a mature method for analyzing hyperspectral remote sensing data. It is essentially a classification technique based on spectral matching. The SAM algorithm treats the spectrum of each pixel in an image as a vector in high-dimensional space and measures spectral similarity by calculating the angle between these vectors. A smaller angle indicates greater spectral similarity and a higher probability of belonging to the same material type; thus, unknown pixels can be classified based on the magnitude of this spectral angle. Kruse [28] defined the generalized cosine of the spectral angle as follows:
In this study, SAM was applied to GF-5 hyperspectral data to identify alteration-related minerals. Reference spectra were selected from the USGS standard mineral spectral library. SAM classification was performed using a constrained spectral angle threshold to ensure reliable spectral matching, and pixels exceeding the threshold were excluded from mineral classes. The extracted alteration minerals were grouped into several representative categories, including iron oxides and hydroxides (e.g., pyrite alteration products and limonite), potassium-bearing minerals (e.g., K-feldspar and orthoclase), phyllosilicates (e.g., biotite and sericite), clay minerals (e.g., kaolinite and illite), carbonate minerals (e.g., calcite and dolomite), and sulfate minerals (e.g., alunite and gypsum), as well as other hydrothermal minerals such as tourmaline and serpentine. These mineral assemblages were subsequently integrated to characterize different hydrothermal alteration types, forming the basis for alteration zoning and further validation.
3. Analysis of Regional Metallogenic Factors
3.1. Characteristics of Linear and Circular Structures
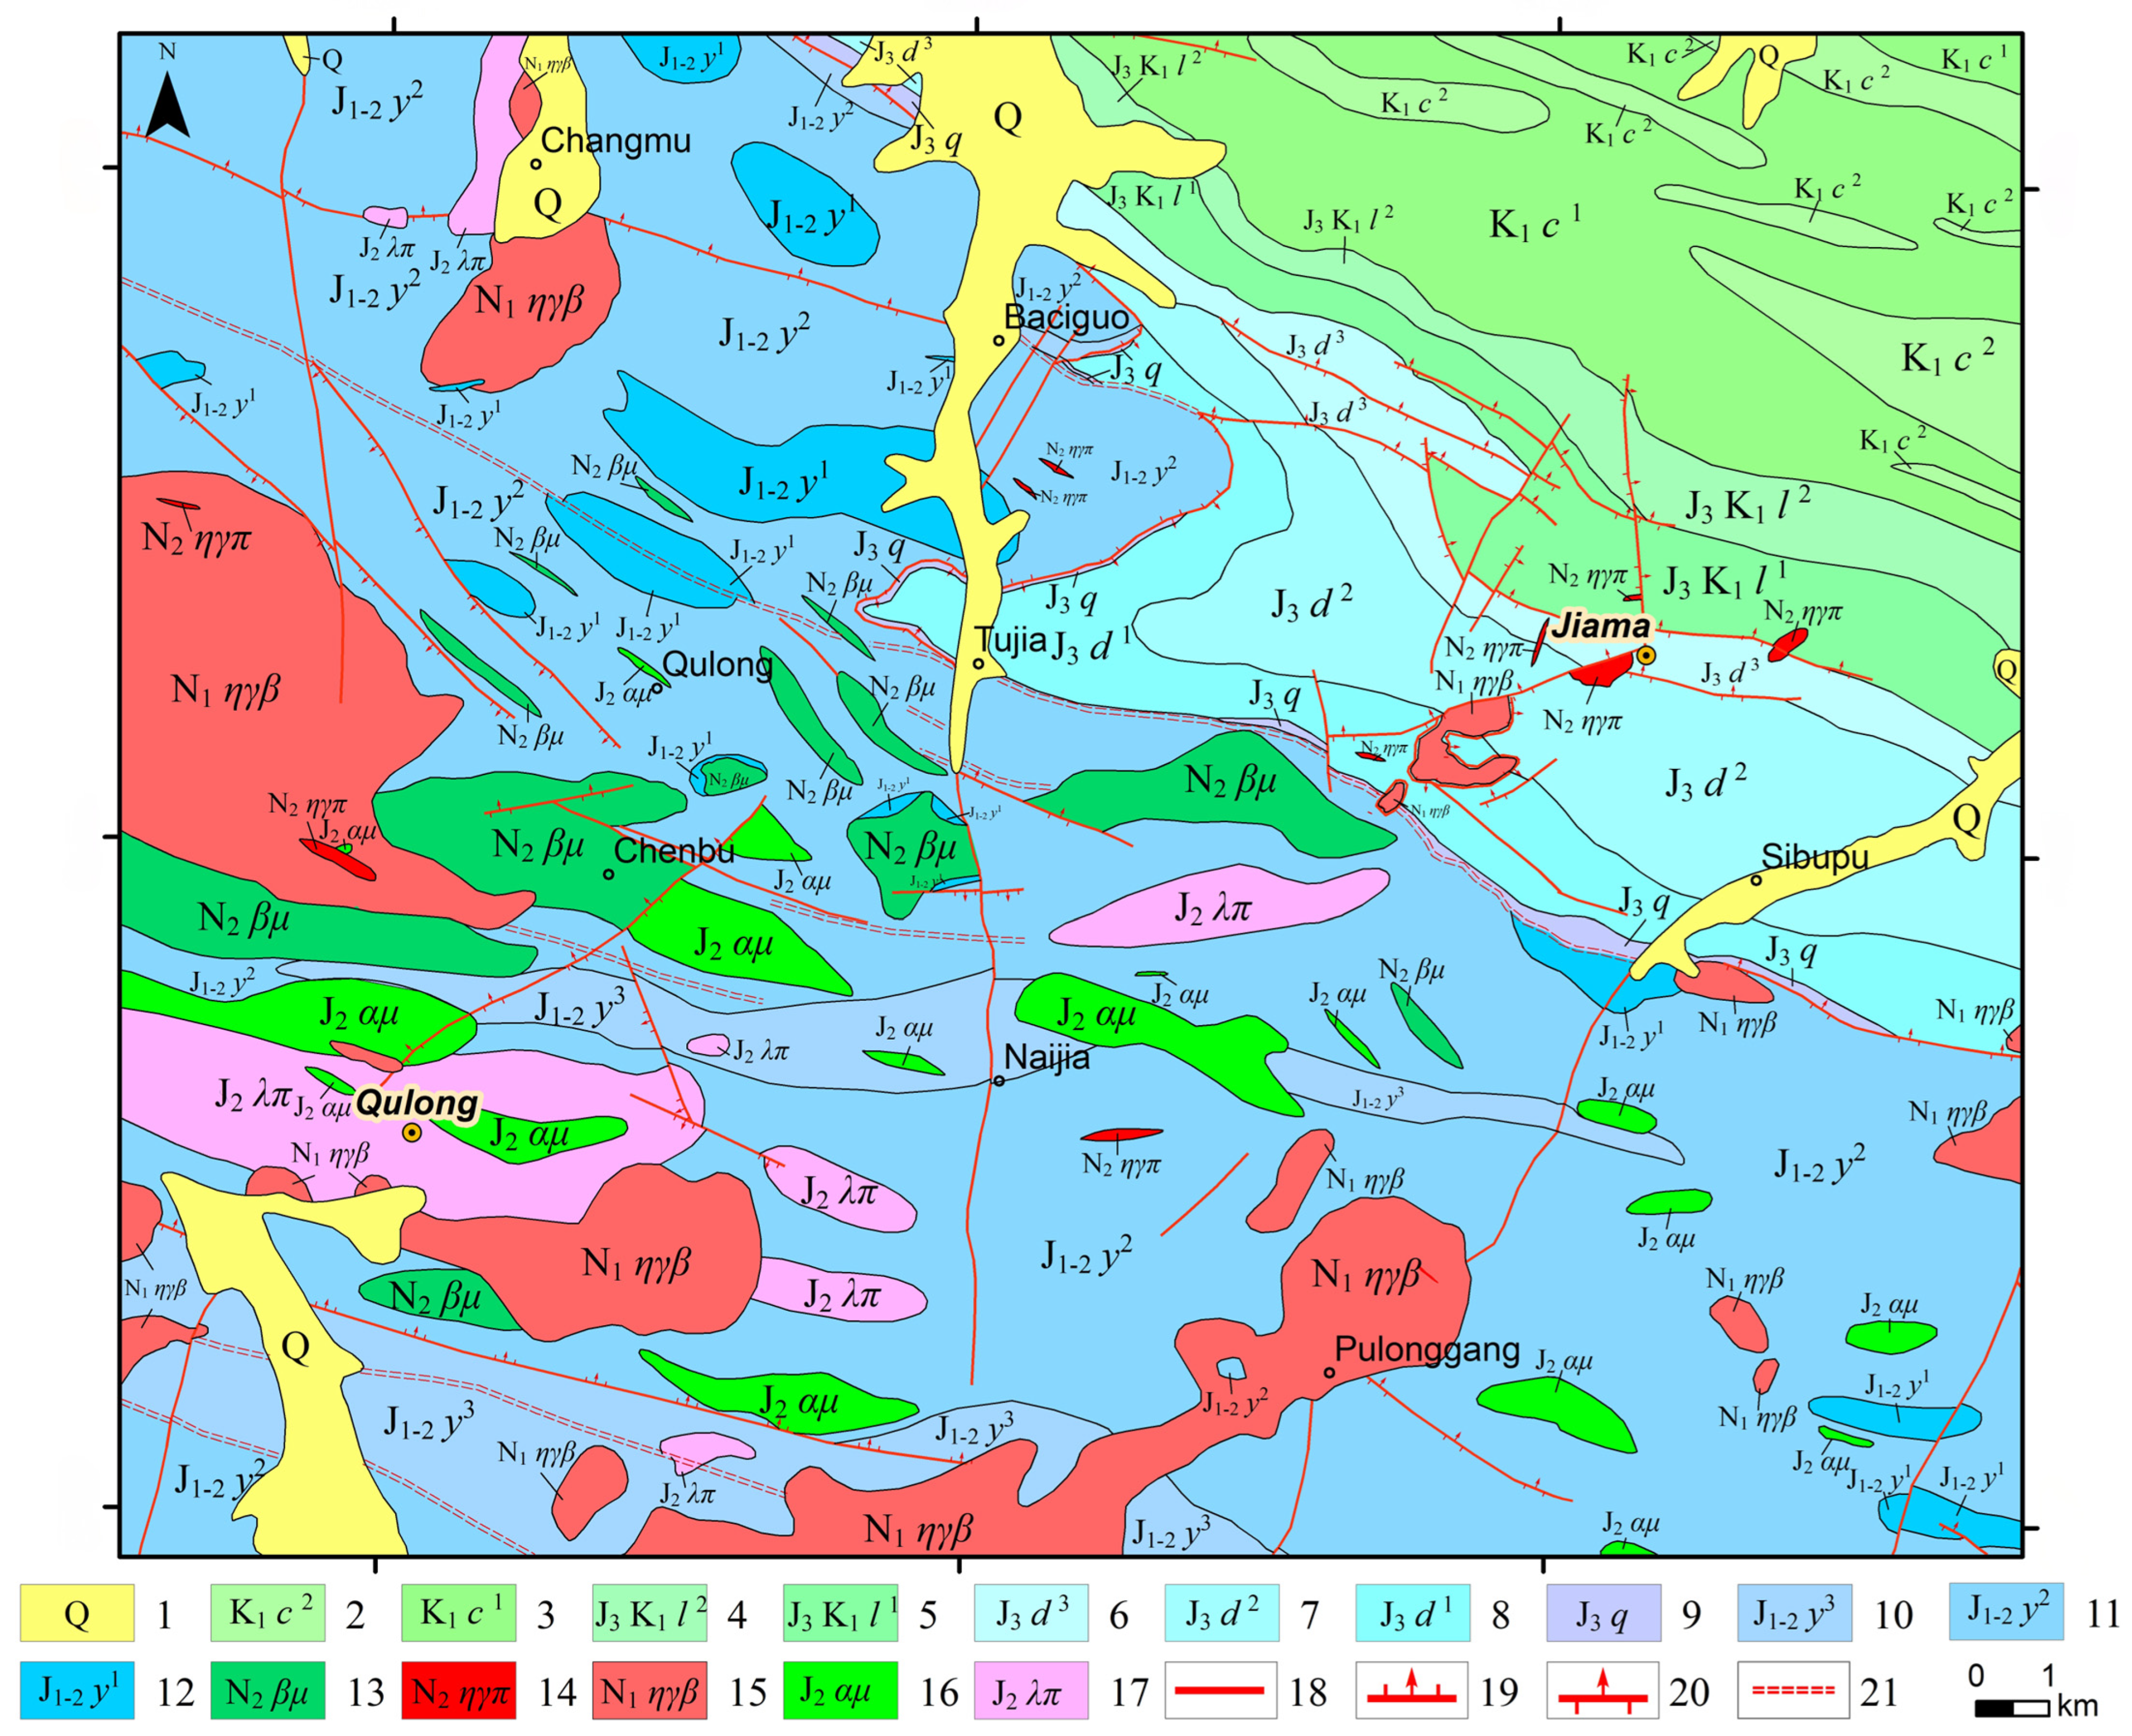
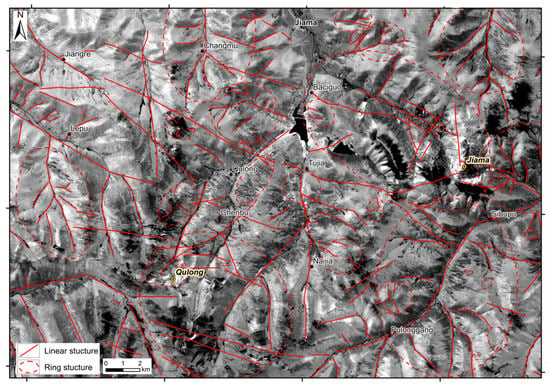
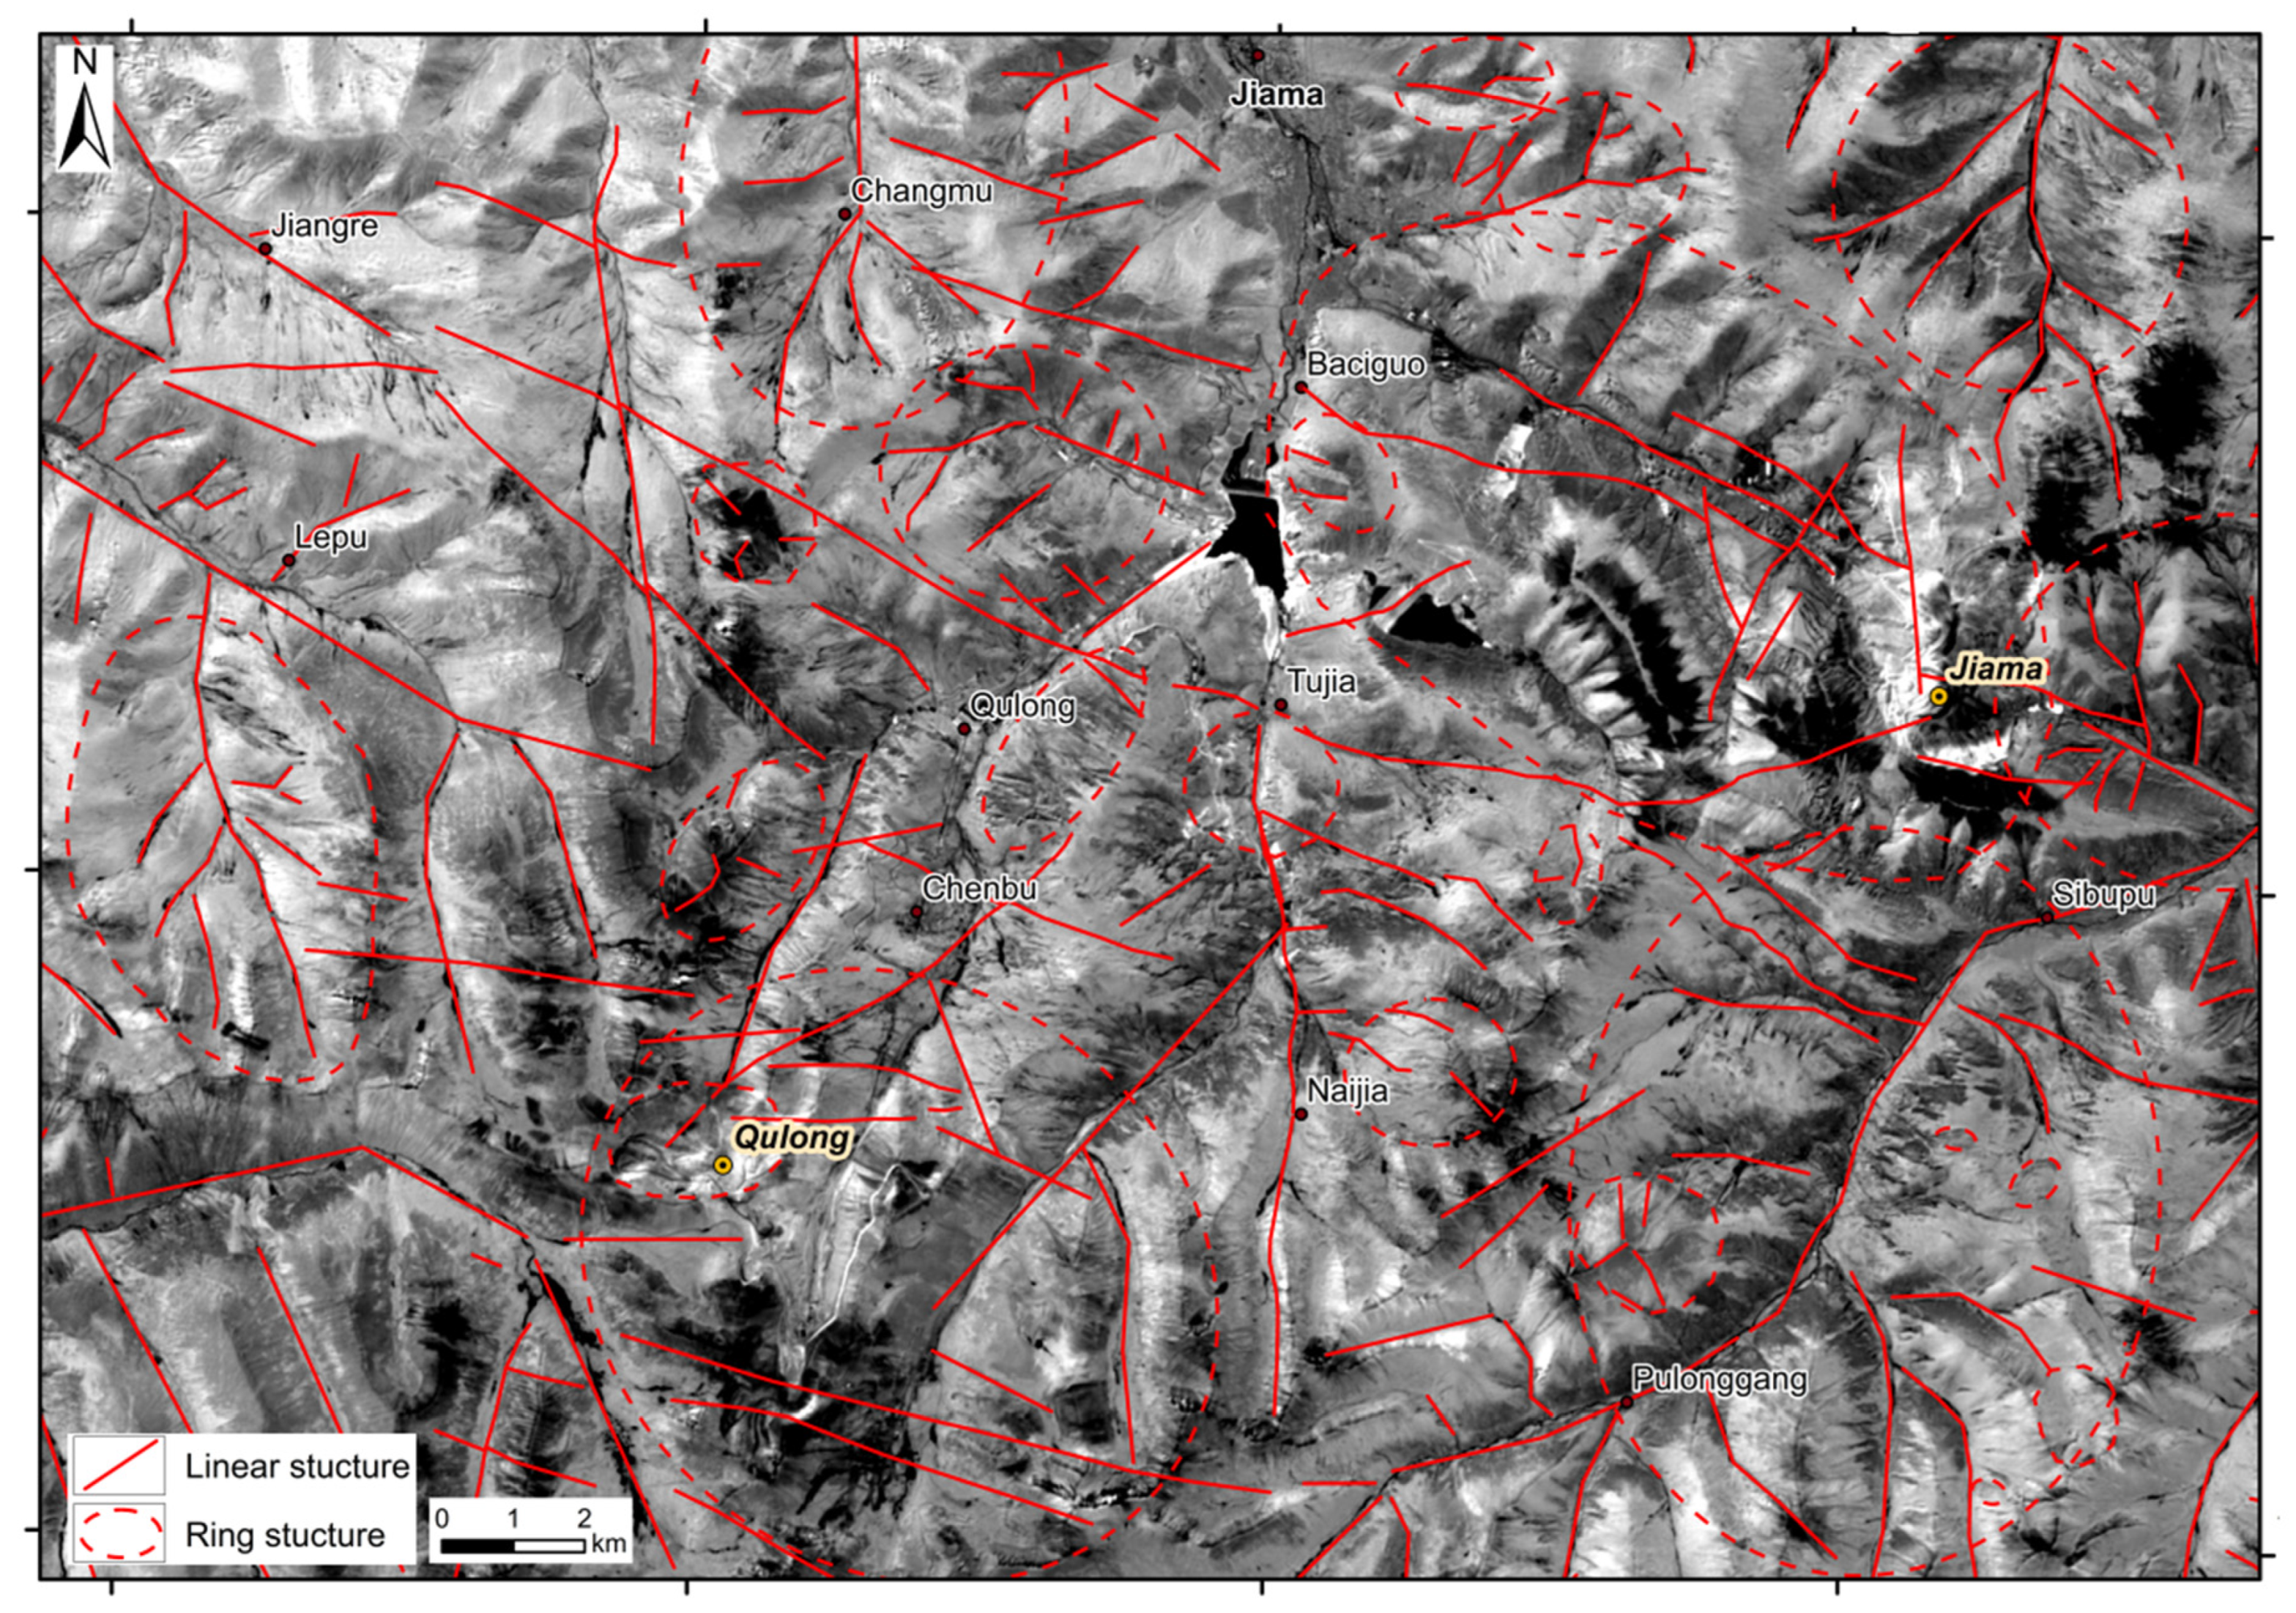
Previous studies have shown that linear and circular structures are closely related to ore-forming and ore-controlling geological processes, providing pathways, material sources, and thermal dynamics for mineralization [29,30,31]. Sentinel-2 imagery, characterized by its high resolution, can clearly display various geological information and is particularly conducive to interpreting various structural features. Therefore, Sentinel-2 imagery was selected to interpret linear and circular structures within the study area. Bands 12, 8, and 2 of the Sentinel-2 image were first selected to create a false-color composite (RGB). Subsequently, percentage truncation stretching, edge enhancement, and high-pass filtering were applied to enhance the linear and circular image characteristics, ultimately yielding the distribution map of linear–circular structures in the study area (Figure 2).
Figure 2.
Linear and circular structures in the study area (using Sentinel-2 Band 11 as the base image).
Linear structures are well developed within the area. The strikes of fault structures generally trend NE and NWW. Two nearly EW-trending ductile shear zones formed in the central part of the Qulong deposit, with the Qujiamocuo ductile shear deformation zone controlling the northern boundary of the ore body. The linear structures around the Jiama deposit are mainly NW-trending faults, controlling the distribution of NW-trending ore bodies. Circular structures are extremely developed in the area. They show structural control characteristics near known mineral occurrences, such as Jiama and Qulong, and are largely consistent with the strike of the strata. They are inferred to be controlled by regional faults and directly related to the emplacement of magmatic rocks, representing topographic and geomorphic expressions caused by intermediate–acidic intrusions.
3.2. Multispectral Alteration Mineral (Assemblage) Information
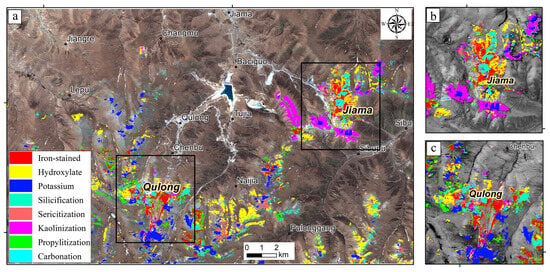
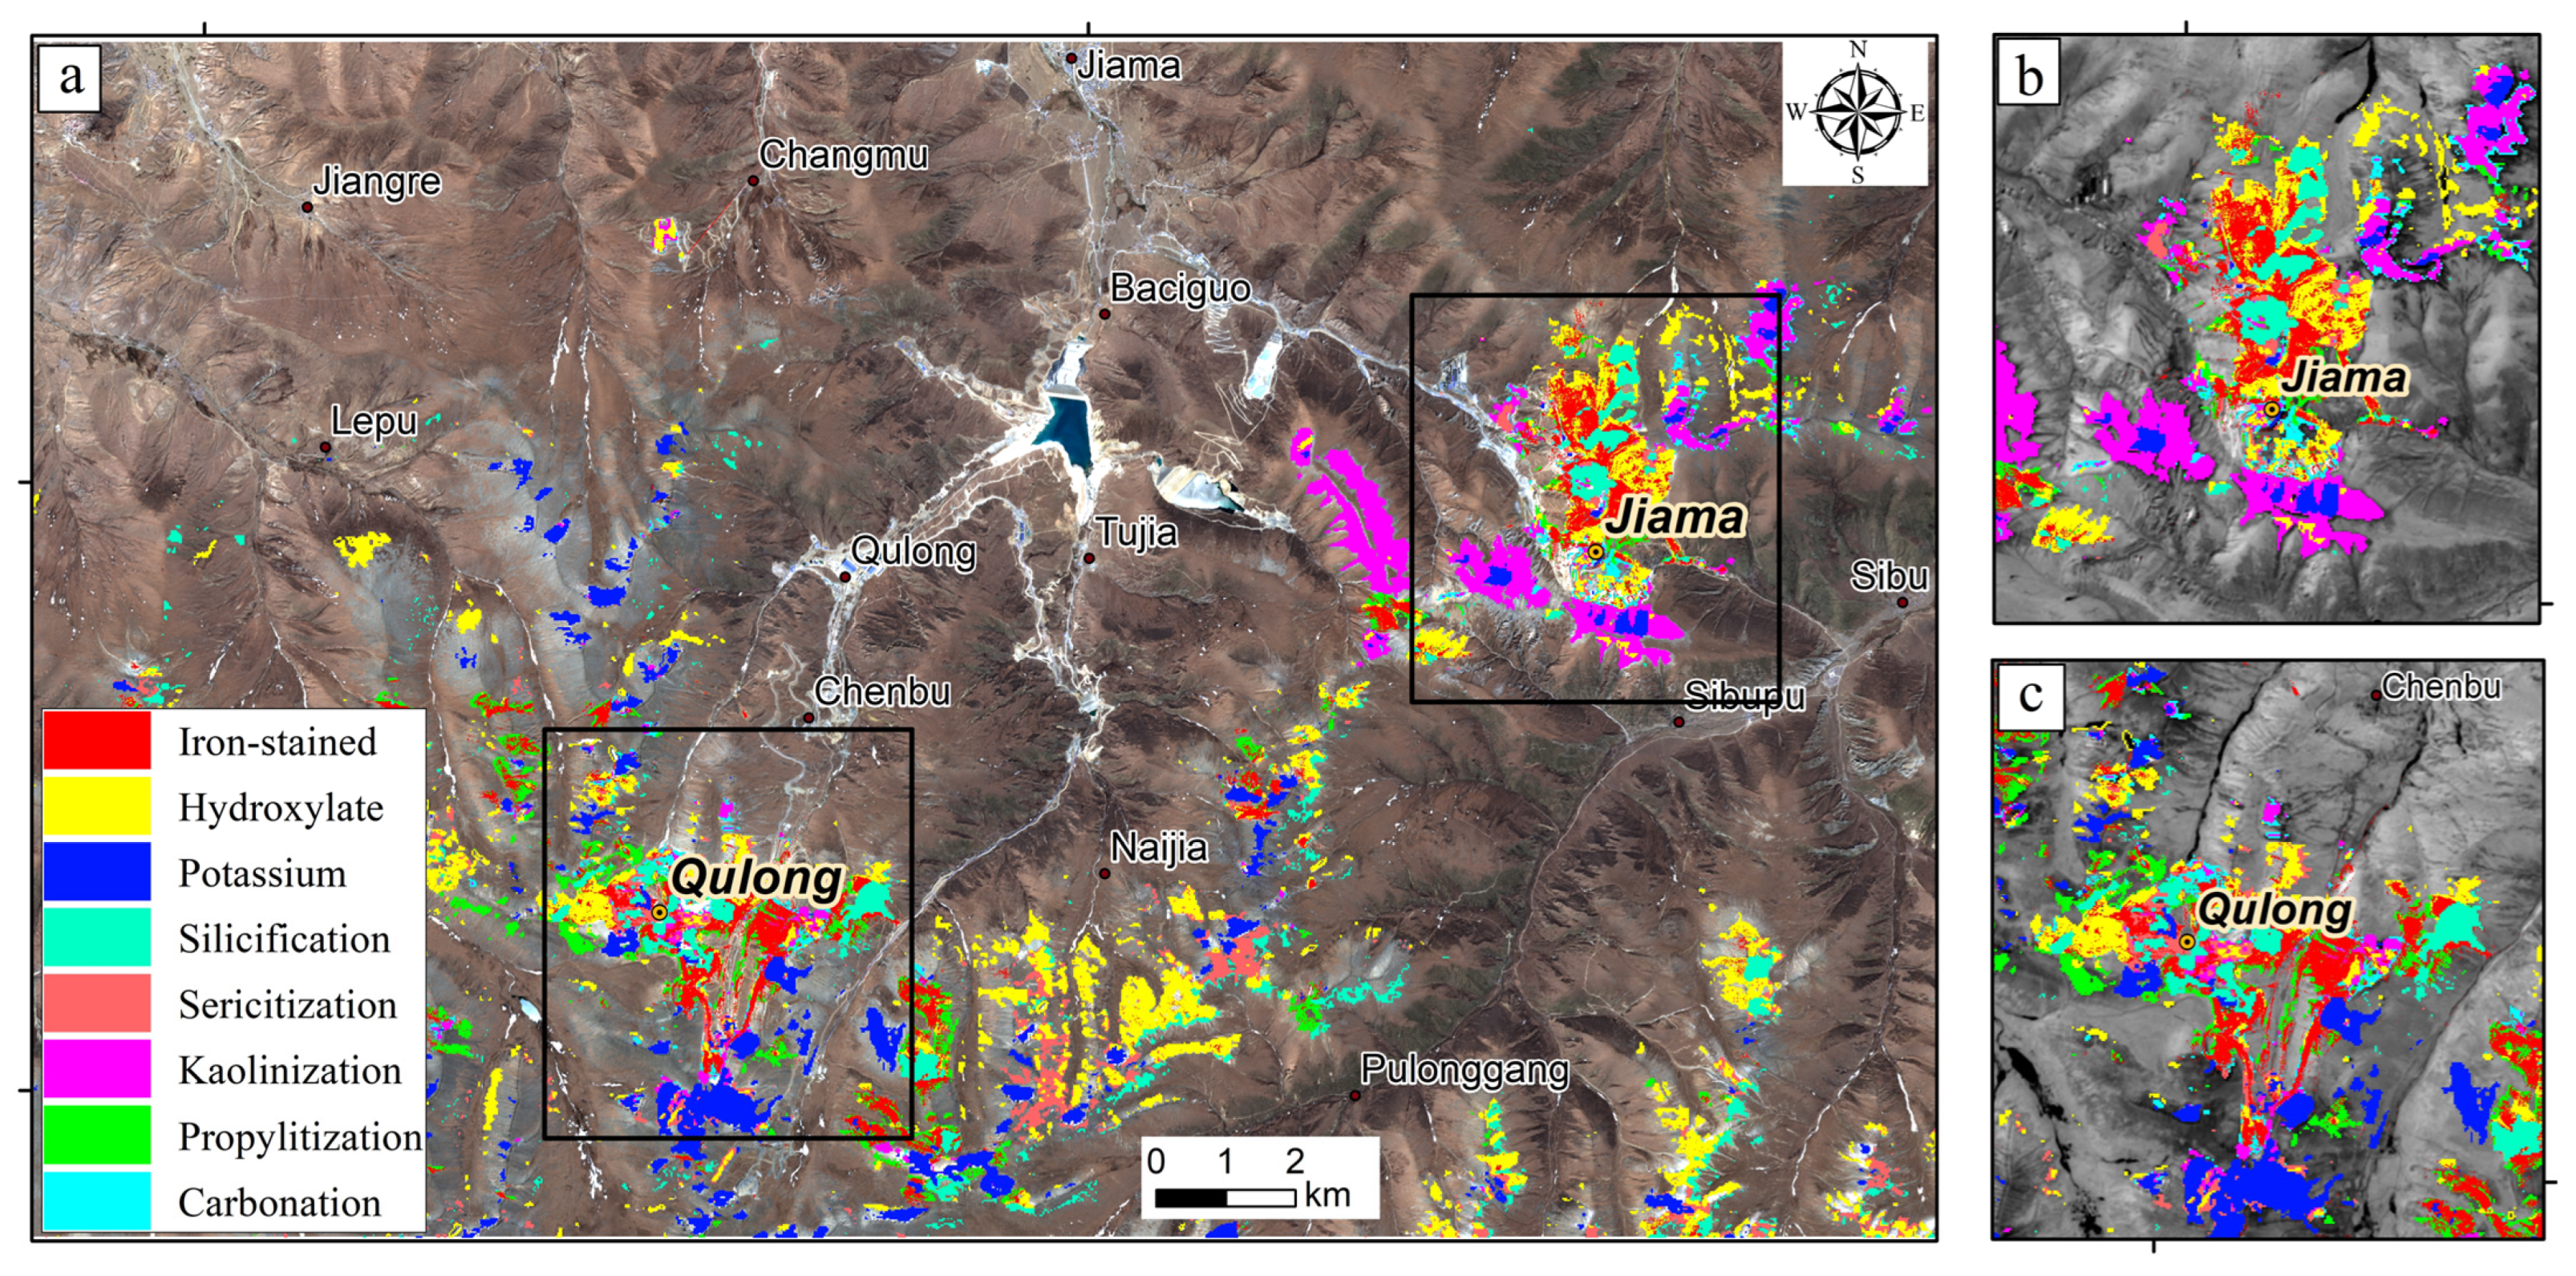
Figure 3 shows multispectral alteration mineral information extracted from Sentinel-2 data using principal component analysis (PCA), with Band B11 as the base image. Key spectral features of iron-, hydroxyl-, potassic-, silicified-, sericitic-, propylitic-, and carbonate-altered rocks were identified and interpreted in the context of regional geology. The extraction results of multispectral alteration information indicate that the study area exhibits significant alteration anomalies, with their spatial distribution highly correlated with the locations of mining areas. The concentration centers of these anomalies strictly correspond to the spatial positions of ore bodies. In the Qulong deposit, the iron-stained alteration anomalies exhibit a nearly east-west trending banded distribution, while the Jiama anomalies show a north–south axial orientation (Figure 3b). Hydroxyl anomalies appear as patchy features superimposed on the iron-stained anomalies, forming prominent alteration centers at the mining sites.
Figure 3.
Sentinel-2 alteration information extraction results (using Sentinel-2 Band B11 as the base image): (a) Alteration distribution over the entire study area; (b) enlargement of alteration distribution in the Jiama area; (c) enlargement of alteration distribution in the Qulong area.
Potassic alteration anomalies are primarily distributed in massive clusters around the skarn-type ore bodies of the Qulong deposit, with no such anomalies observed in the Jiama deposit (Figure 3c). Silicification anomalies display an east-west banded distribution along the periphery of the Qulong deposit, while their spatial distribution in the Jiama deposit closely aligns with the surface silicified cap.
Sericitization alteration is widely developed within the study area, mainly concentrated in the central part of the mining district, with an additional anomalous zone identified south of Naija Village. Propylitic alteration exhibits an annular (ring-like) distribution in the outer contact zone and surrounding rocks. Carbonatization alteration, besides being distributed as areal concentrations within the deposits, is primarily found in the Duodigou Formation limestone and marble strata surrounding the Jiama deposit.
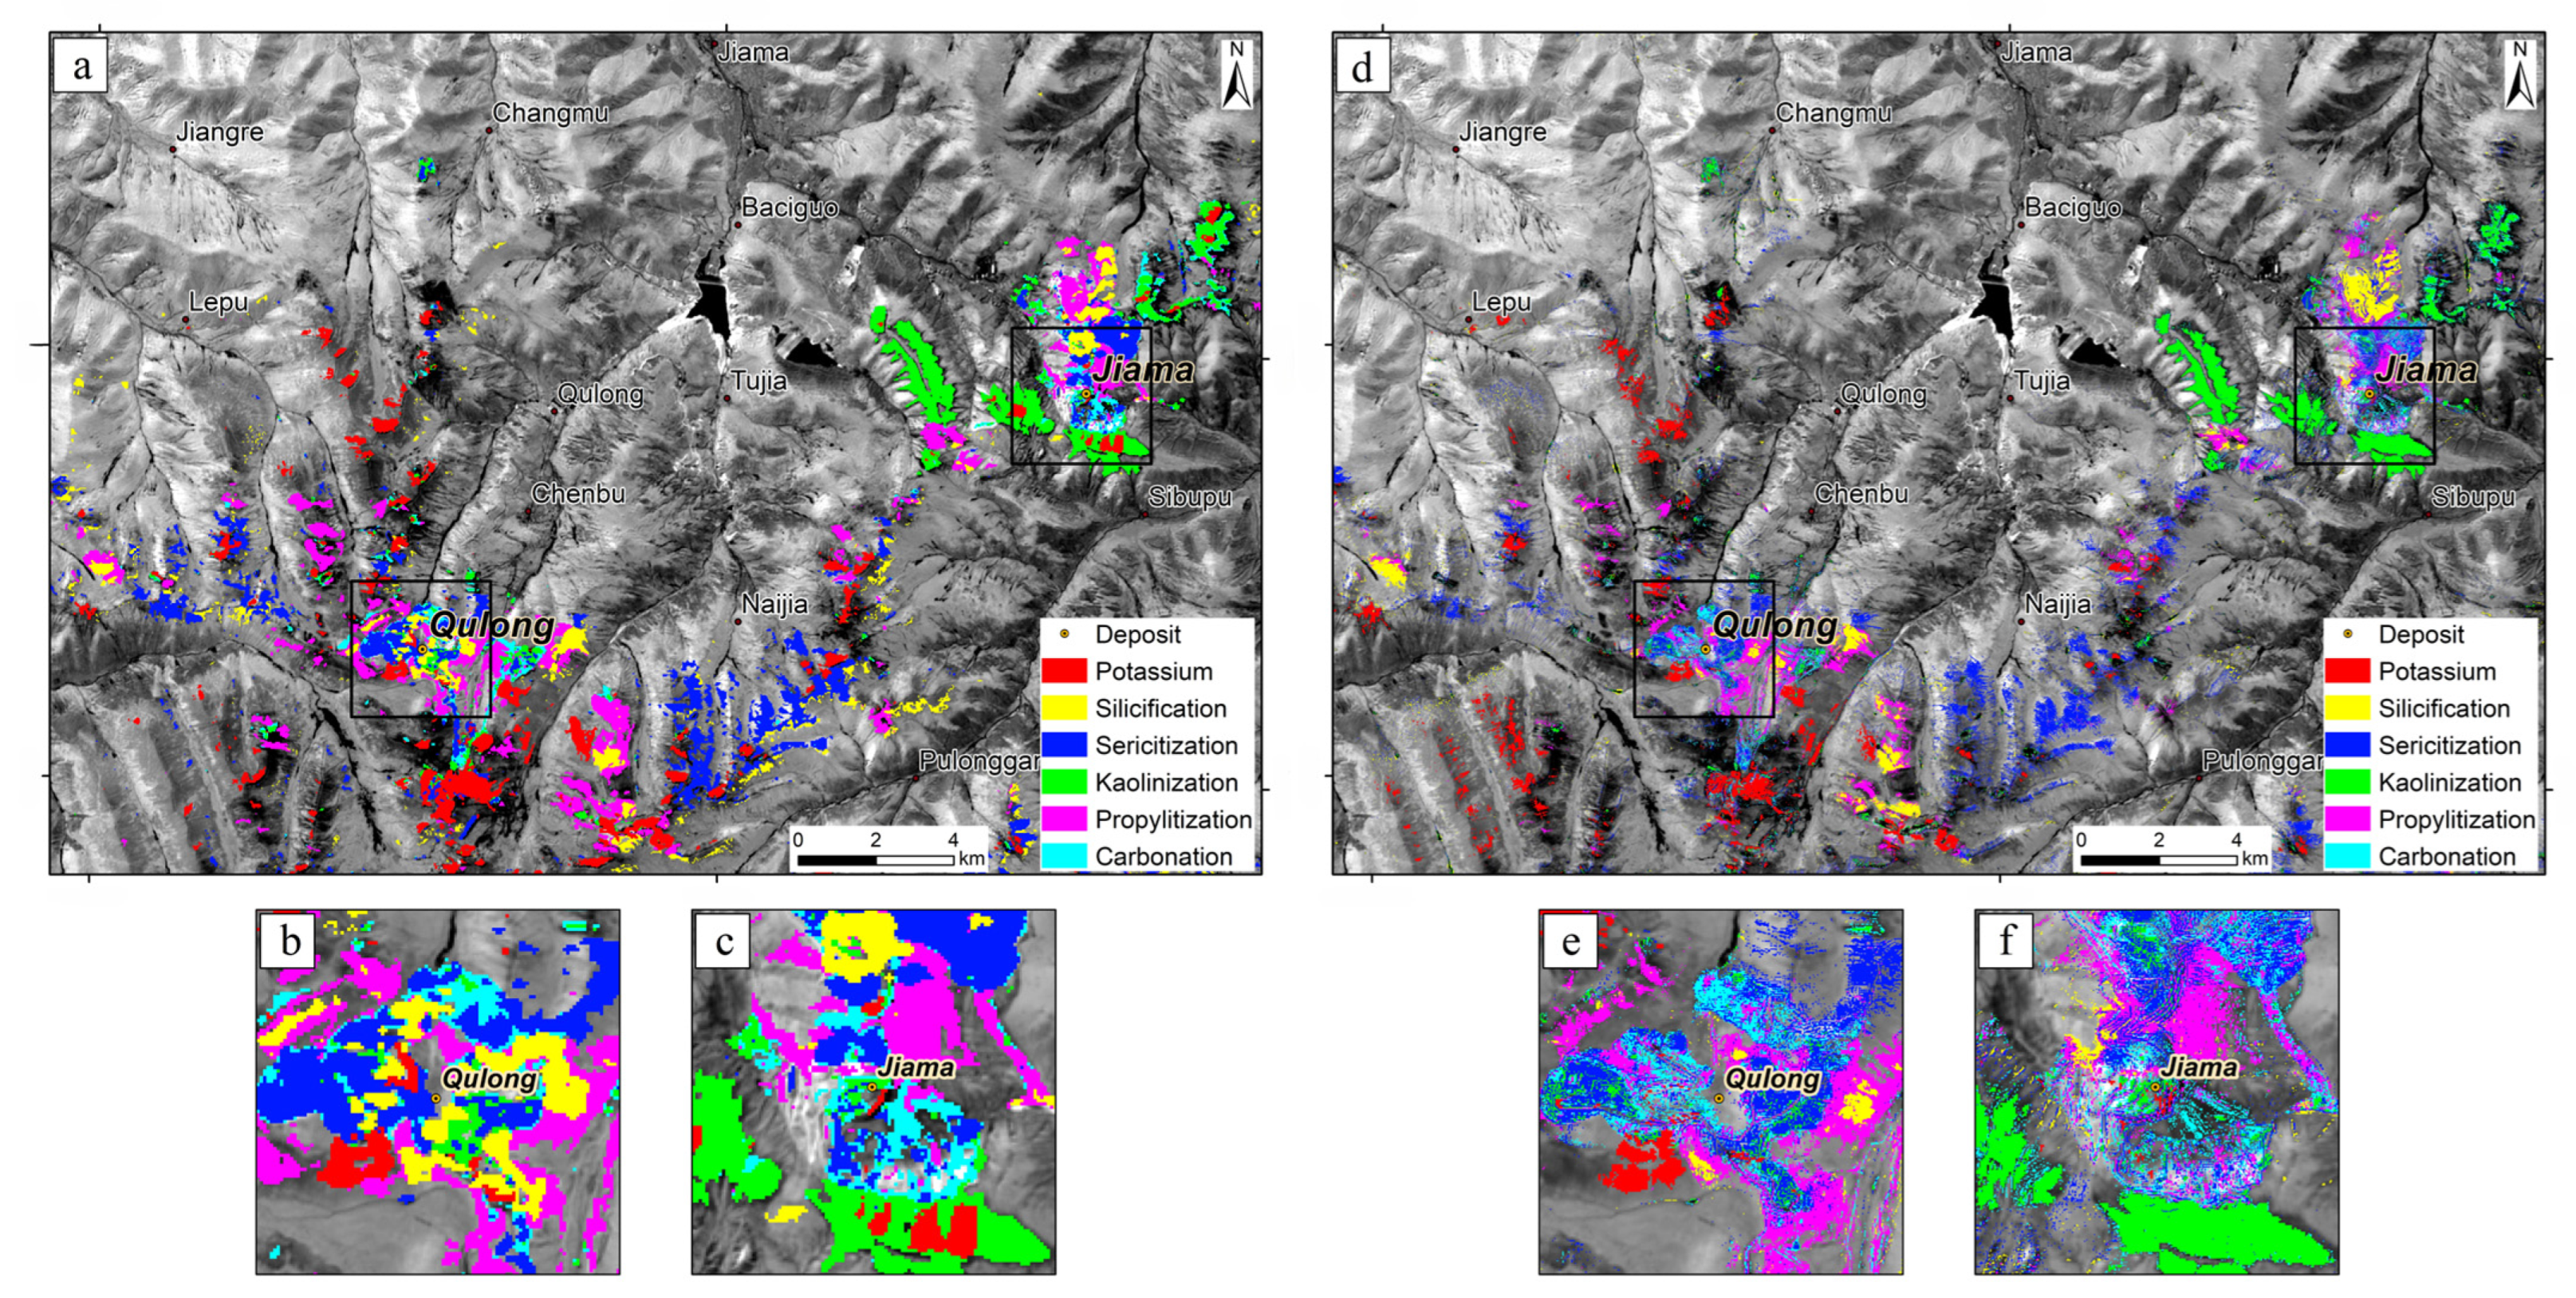
In the Qulong deposit, iron-stained alteration is predominantly superimposed on the sericitization and kaolinitization zones, partially overlapping with the propylitic alteration zone. The alteration zoning characteristics reveal a clear sequence from the center of the intrusion outward: potassic–silicic zone → sericitization–kaolinitization zone → propylitization–carbonatization zone. This zoning pattern aligns with the “monzonite-type” alteration zoning model and shows strong consistency with established deposit alteration zoning patterns.
The alteration system of the Jiama deposit demonstrates distinct spatial differentiation: sericitization mainly develops in the contact zone between the Linbuzong Formation clastic rocks and the porphyry body, accompanied by extensive silicification and phyllic alteration in both inner and outer contact zones. Propylitic alteration primarily occurs in the hornfels and marble of the outer contact zone. The interpretation results are highly consistent with the spatial distribution characteristics of argillic and phyllic alteration minerals, confirming that the surface alteration minerals in the Jiama mining area follow a typical zoning sequence from phyllic zone → argillic zone → propylitic zone. This alteration zoning pattern is closely related to the tectonic-magmatic activities and host rock characteristics of the mining area, further validating the reliability of the remote sensing alteration information extraction results.
3.3. Hyperspectral Alteration Mineral Information
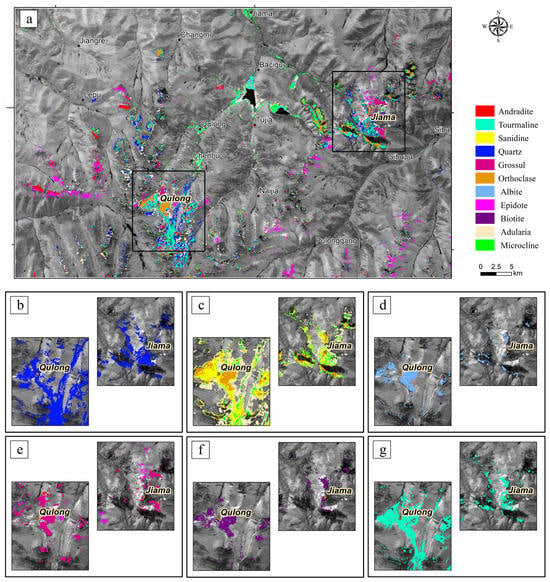
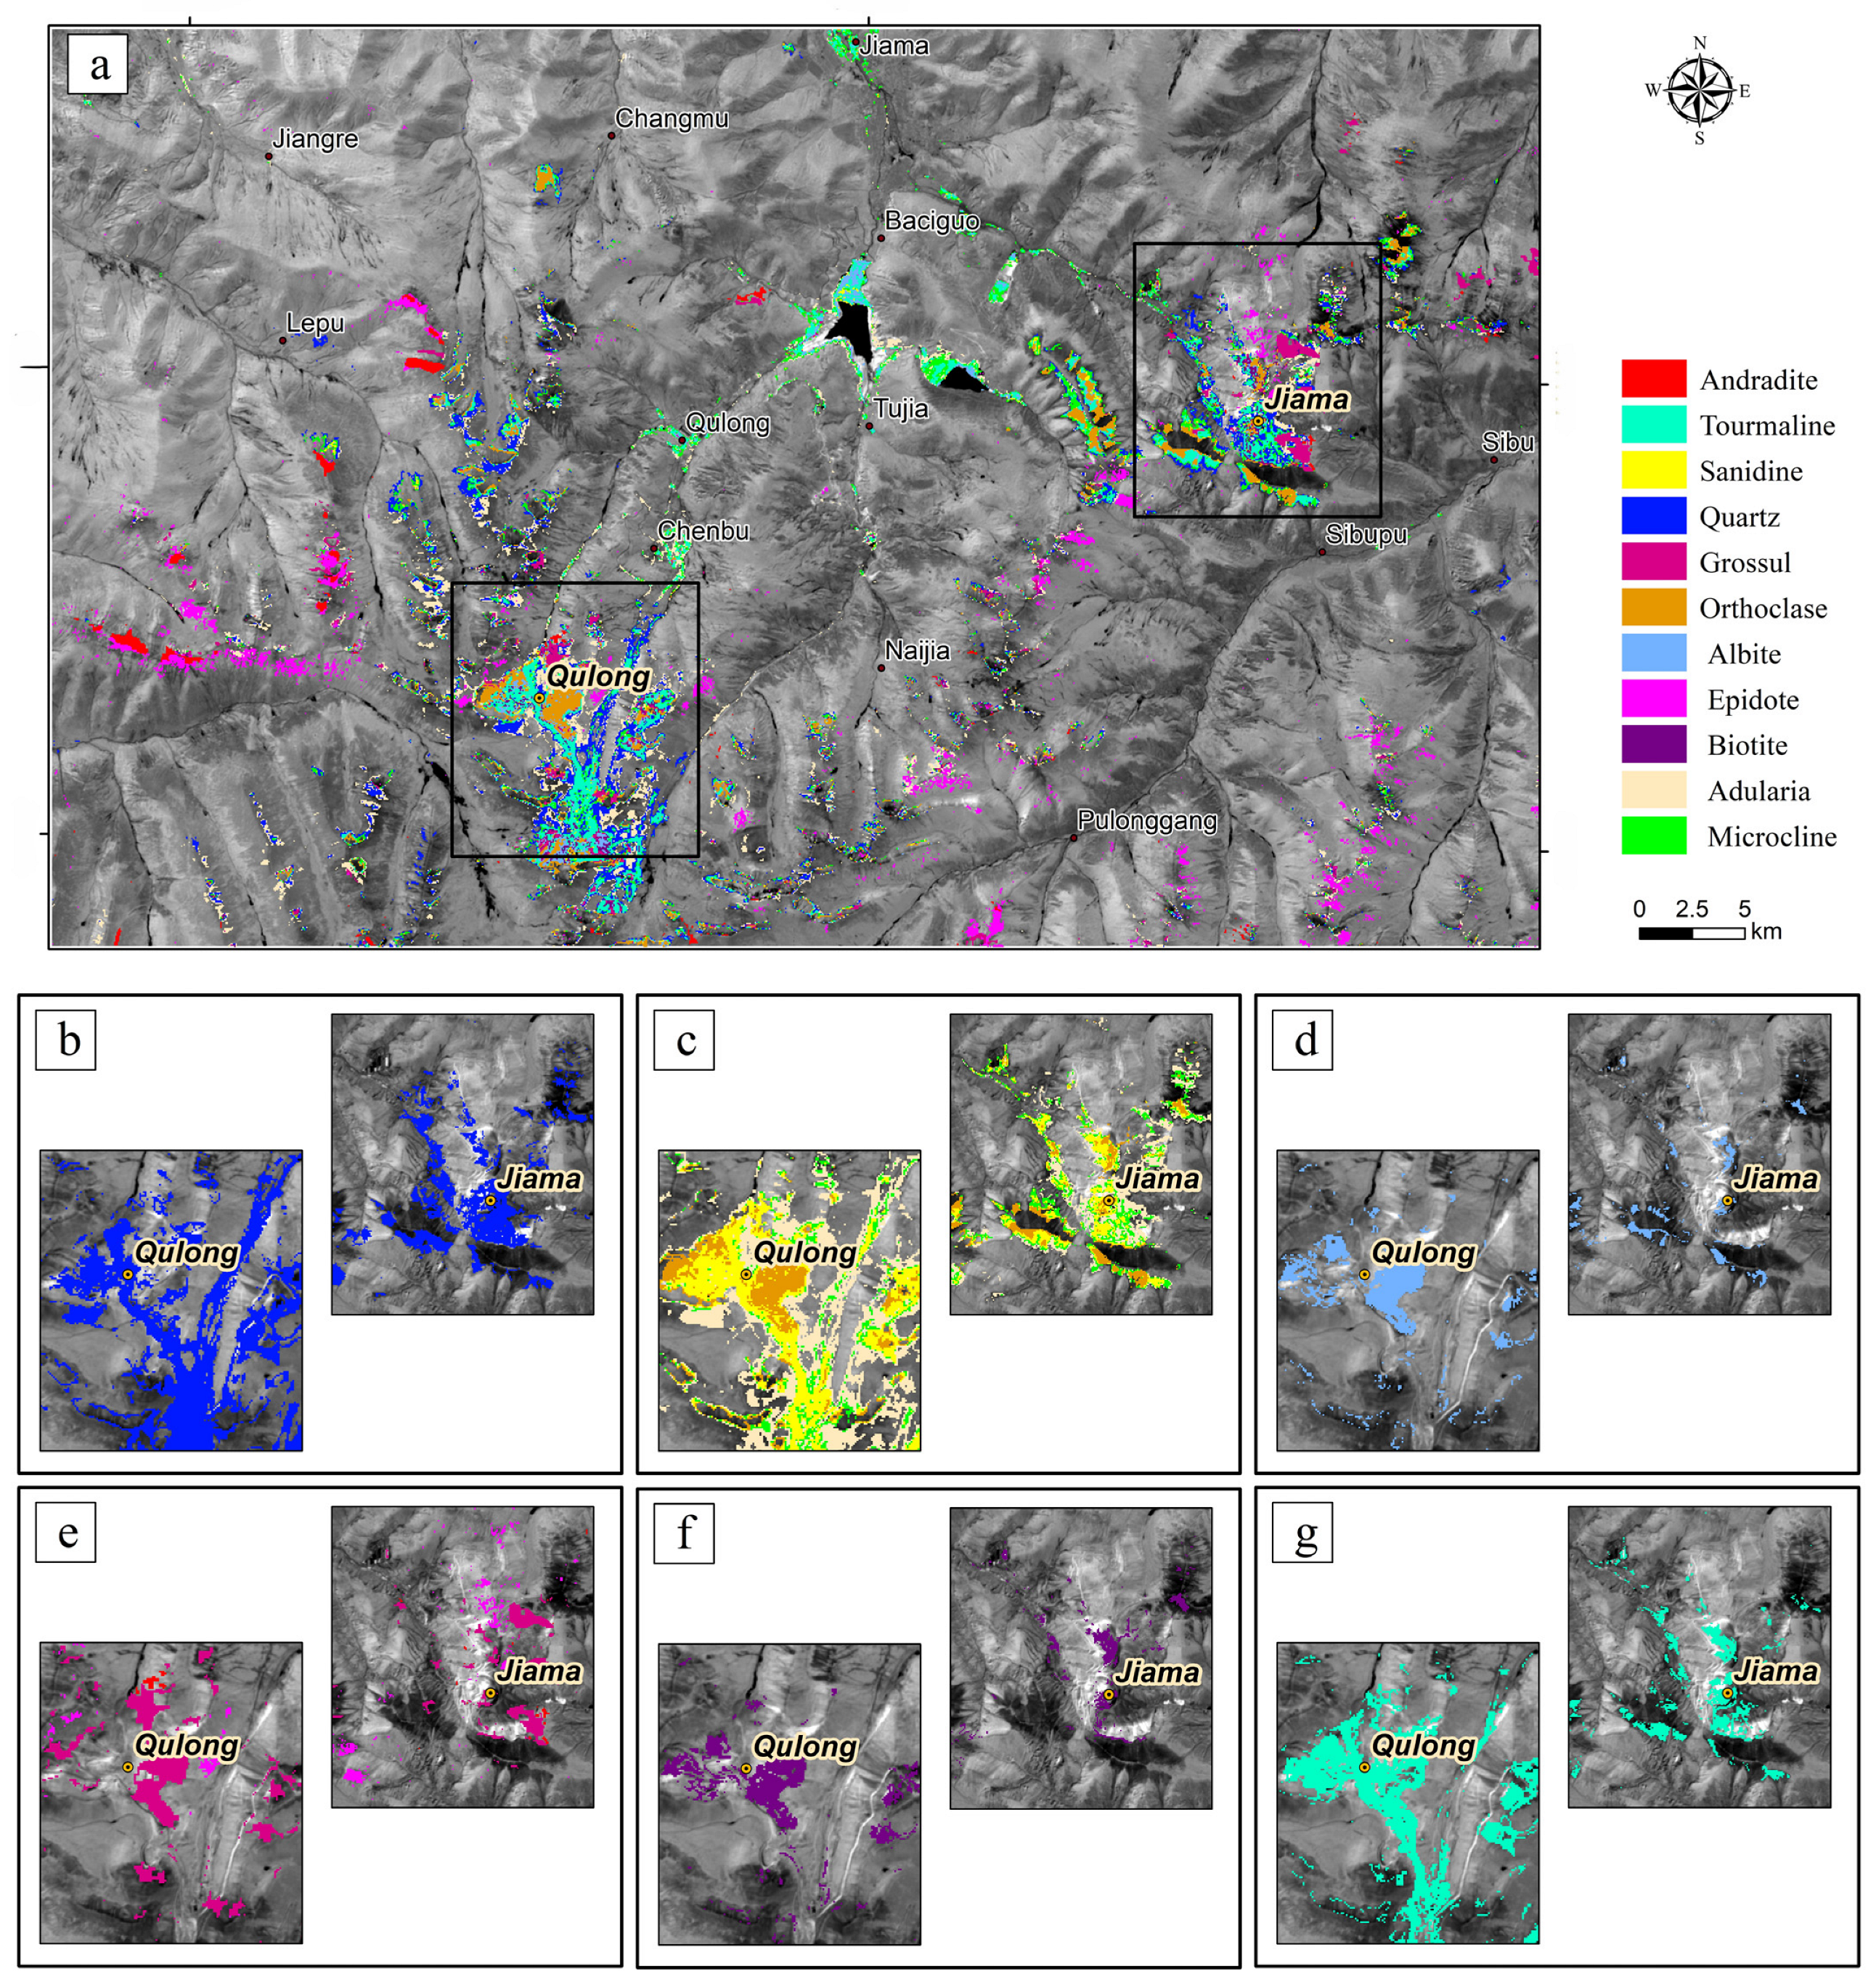
Using GF-5 data, 33 types of alteration minerals were extracted through the Spectral Angle Mapper (SAM) method, including pyrite, limonite, goethite, lepidocrocite, hematite, jarosite, K-feldspar, sanidine, microcline, adularia, albite, biotite, quartz, sericite, muscovite, calcite, dolomite, rhodochrosite, epidote, chlorite, alunite, pyrophyllite, dickite, kaolinite, montmorillonite, illite, anhydrite, gypsum, grossular, andradite, antigorite, tourmaline, and chalcedony (Figure 4, Figure 5 and Figure 6). These alteration minerals are mainly distributed in the southwestern and eastern parts of the study area, occurring predominantly in massive and banded patterns. Overall, the anomalies are scattered across multiple locations, with pronounced mineral superposition around known mineralized centers. The spatial distribution of these minerals outlines a clear hydrothermal evolution sequence from high-temperature to low-temperature alteration zones, forming distinct concentric zoning and superposition patterns associated with the Qulong and Jiama deposits.
Figure 4.
GF-5 alteration mineral mapping results (using Sentinel-2 Band 11 as the base image): (a) spatial distribution of alteration types; (b) silicification (quartz); (c) potassic Alteration (K-feldspar: orthoclase, adularia, sanidine, and microcline); (d) albitization (albite); (e) skarn alteration (andradite, grossular, epidote); (f) biotitization (biotite); (g) tourmalinization (tourmaline).
Figure 5.
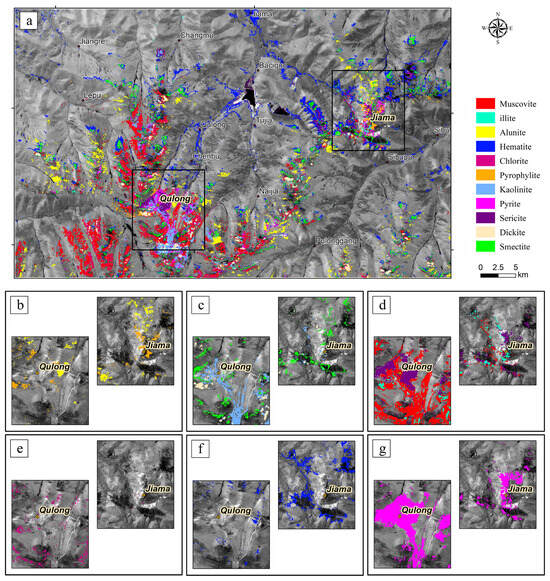
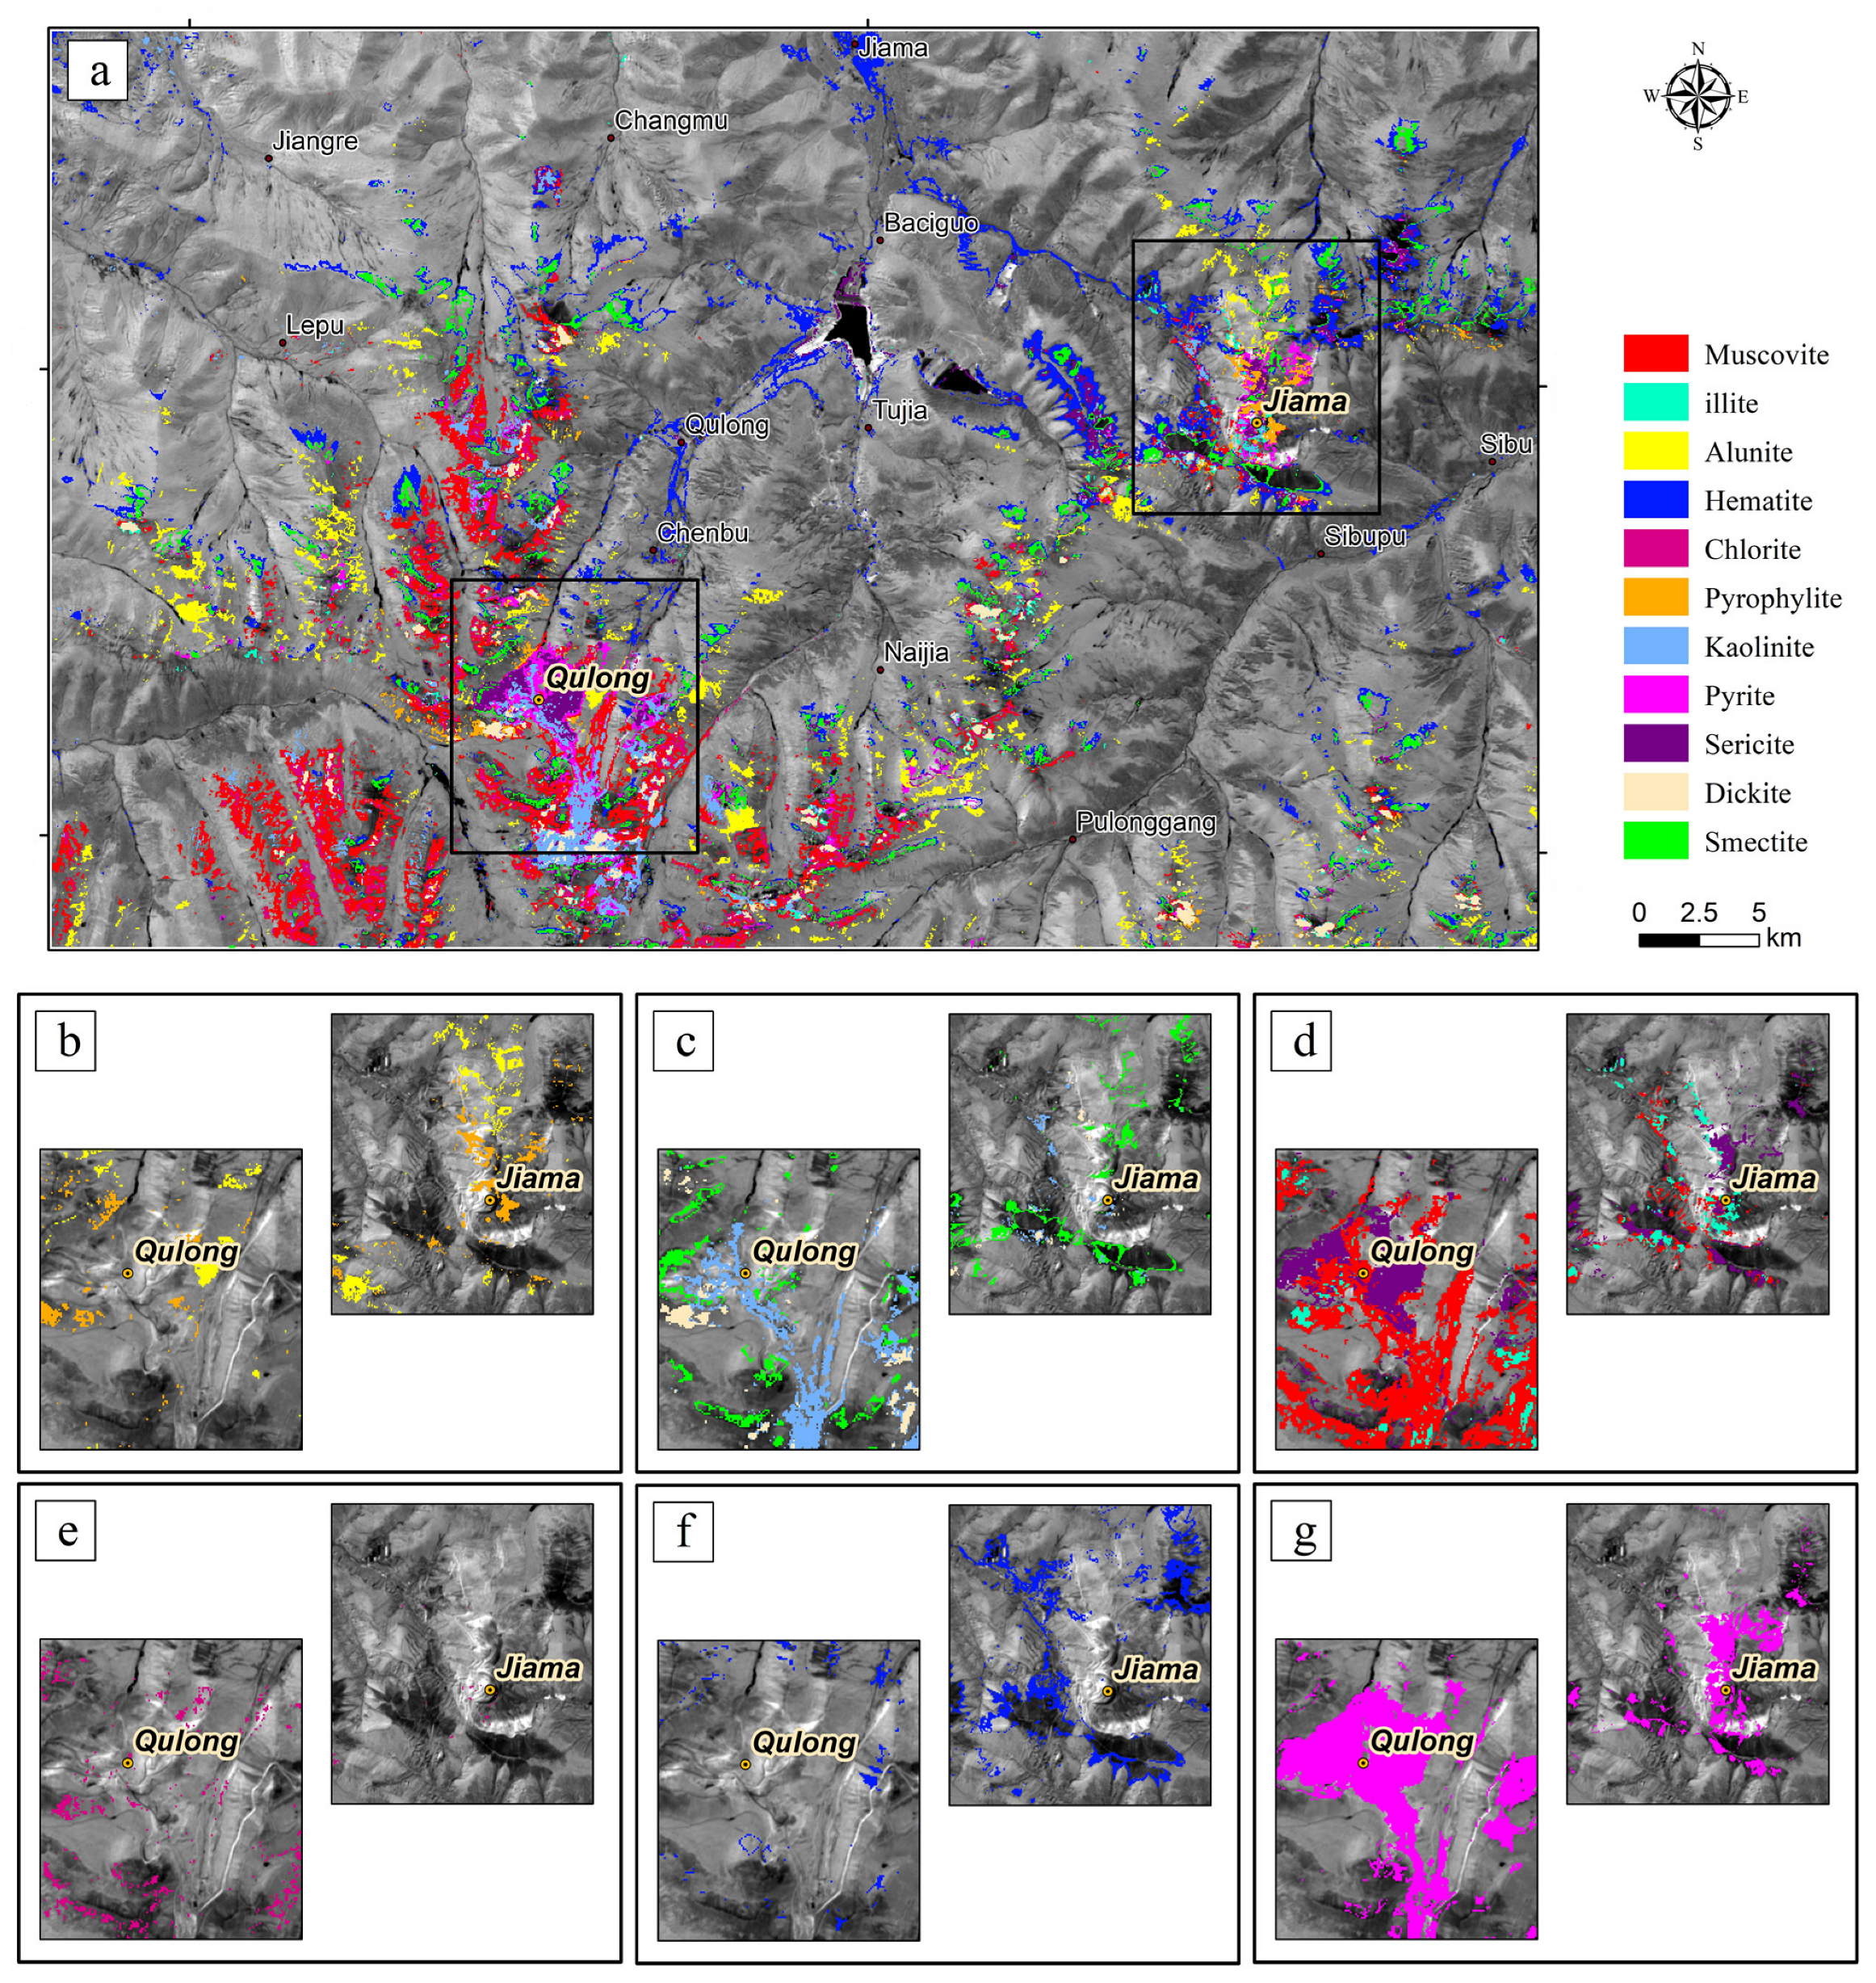
GF-5 alteration mineral mapping results (using Sentinel-2 Band 11 as the base image): (a) spatial distribution of alteration zones; (b) advanced argillic alteration (pyrophyllite, alunite); (c) argillic/clay alteration (kaolinite, dickite, and montmorillonite); (d) sericitic/phyllic alteration (muscovite, sericite, and illite); (e) propylitic alteration (chlorite); (f) iron oxide/hydroxide alteration (hematite); (g) sulfidic alteration (pyrite).
Figure 6.
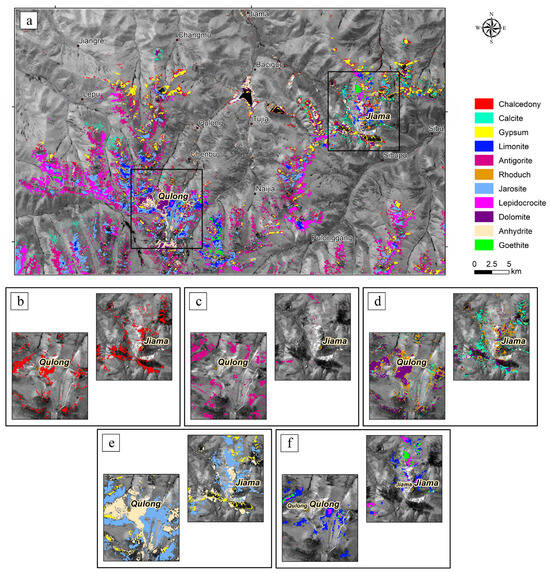
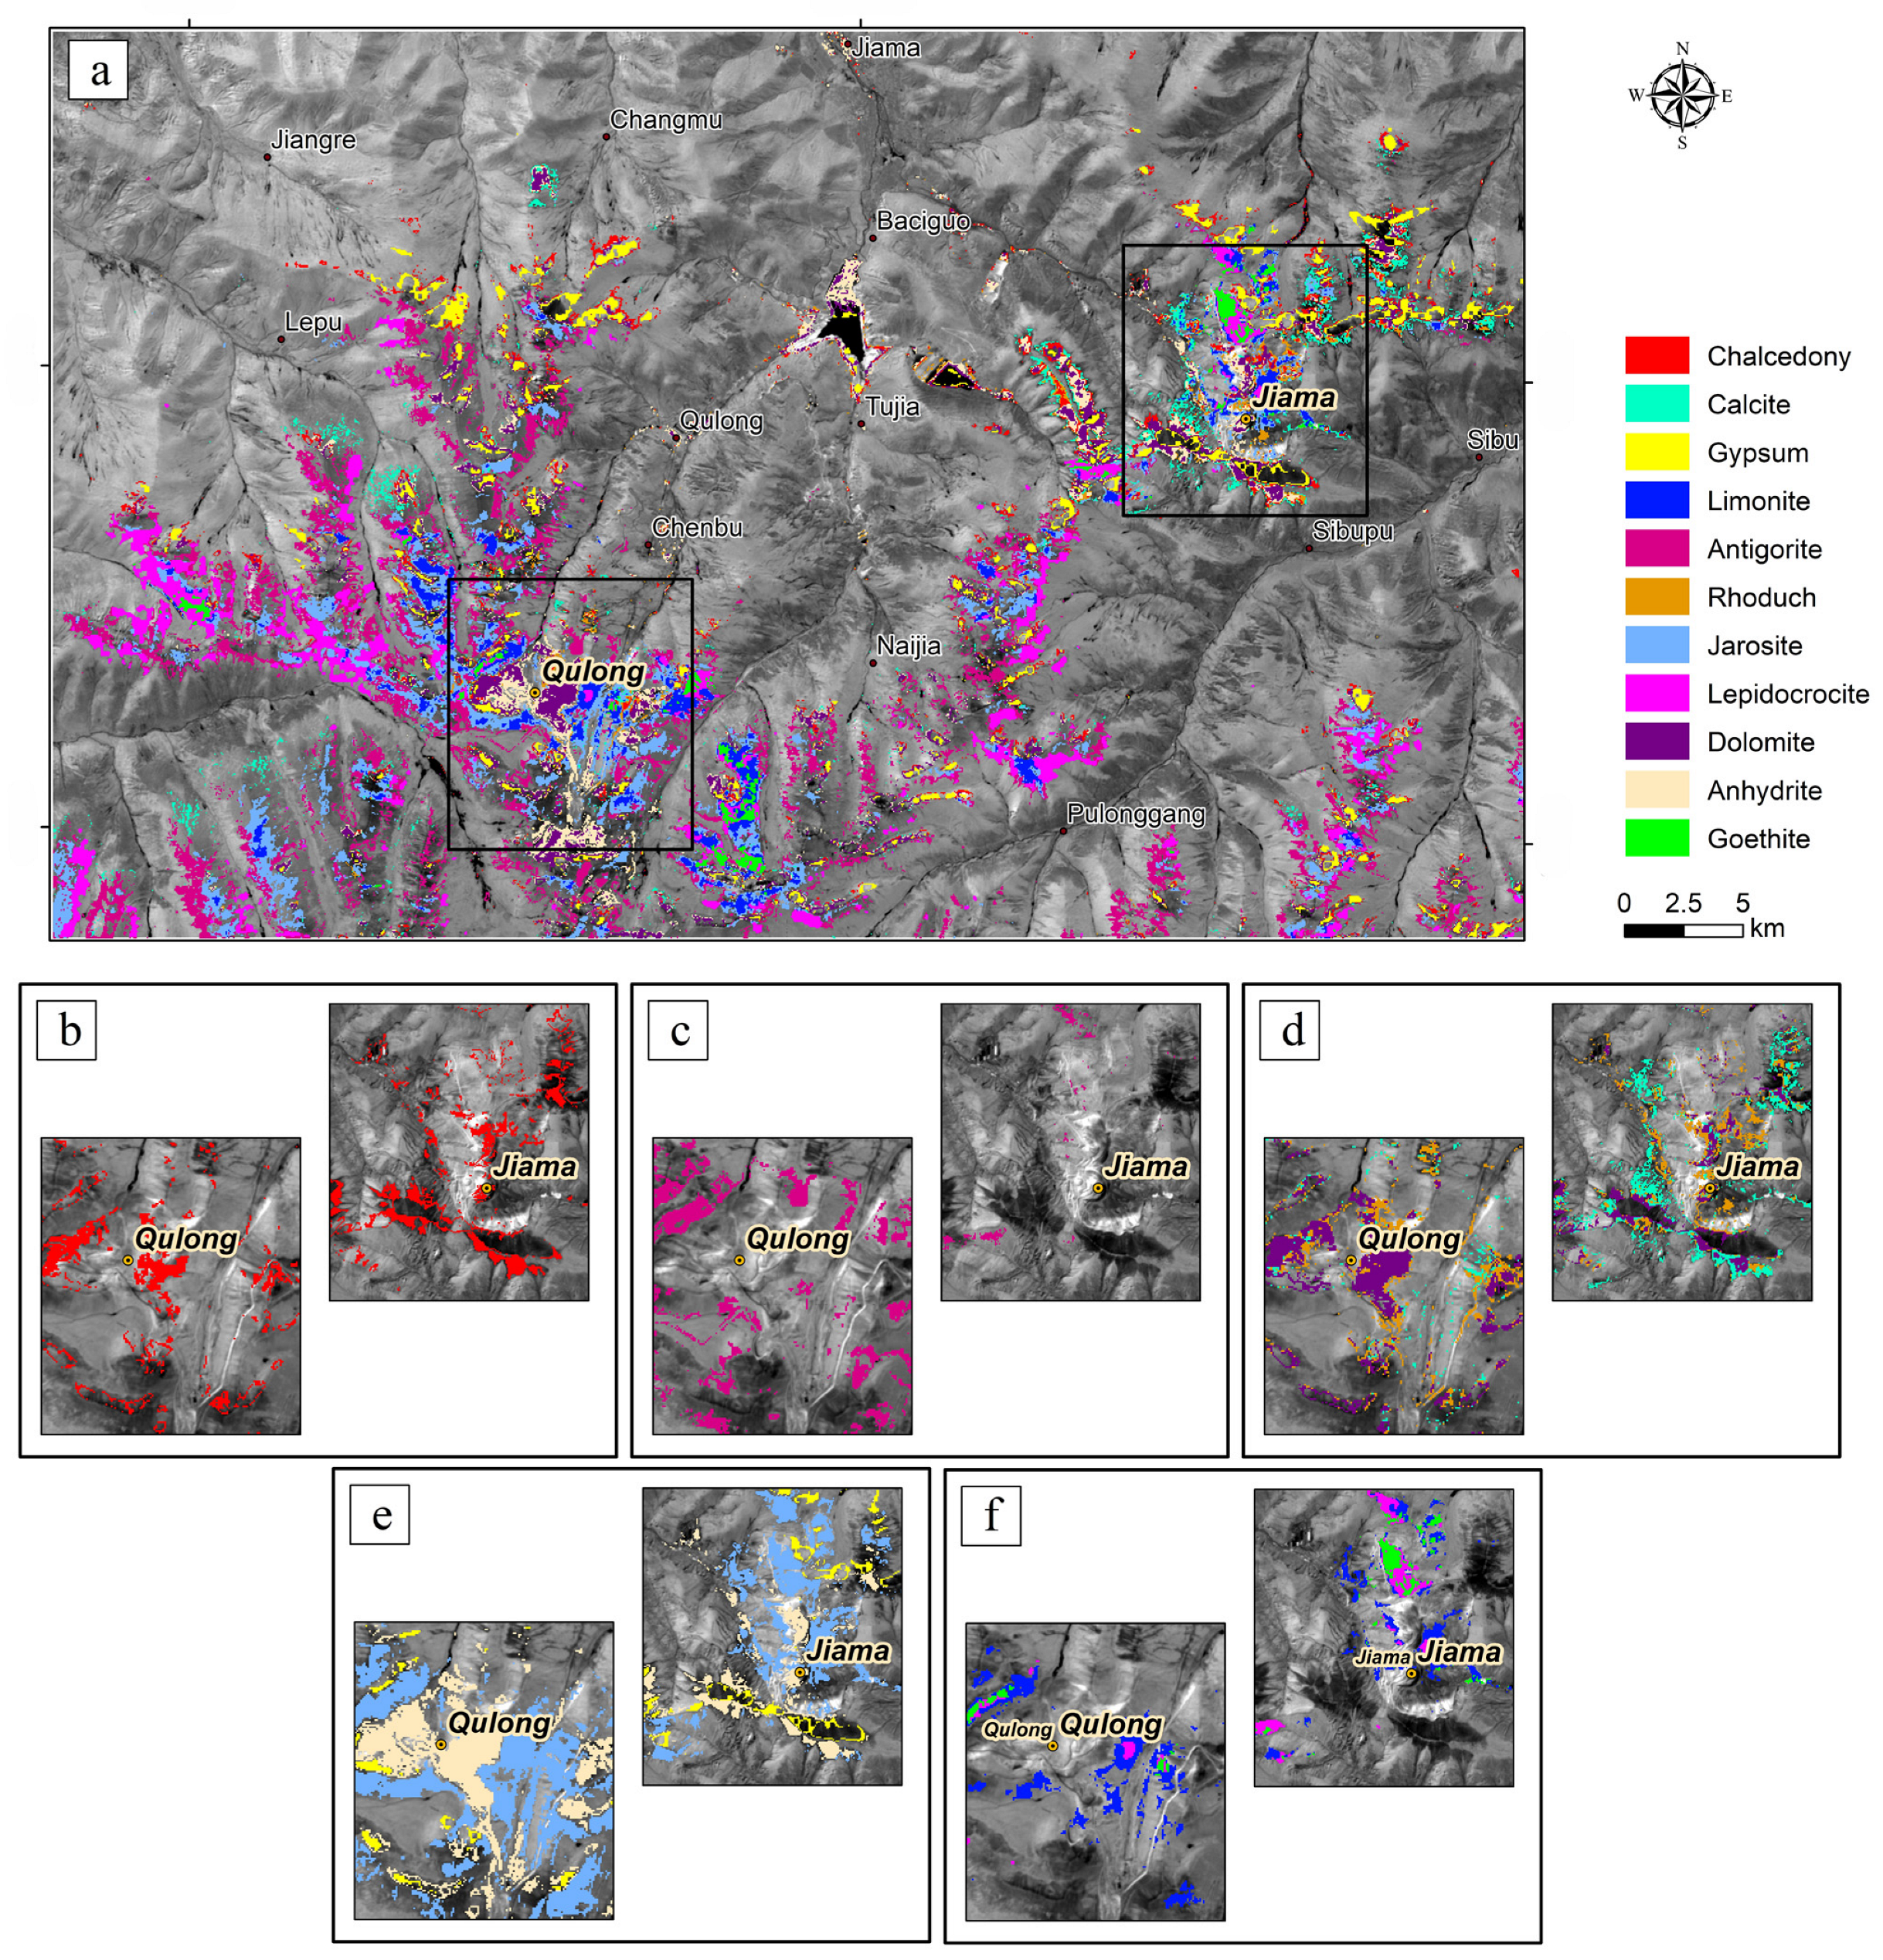
Alteration mineral mapping results from GF-5 (using Sentinel-2 Band 11 as the base image): (a) spatial distribution map; (b) siliceous alteration (chalcedony); (c) serpentinization (lizardite); (d) carbonate alteration (dolomite, calcite, and rhodochrosite); (e) sulfate alteration (anhydrite, gypsum, and jarosite); (f) iron oxide/hydroxide alteration (goethite, limonite, and lepidocrocite).
3.3.1. High-Temperature Alteration (>300 °C)
Key minerals, including andradite, grossular, biotite, tourmaline, and potassic alteration assemblages (K-feldspar, sanidine, microcline, and adularia), occur mainly as massive or banded clusters surrounding the mineralized centers in both deposits (Figure 4). Epidote forms a distinct band along the southwestern margin, marking the outer boundary of the high-temperature zone.
3.3.2. Intermediate-Temperature Alteration (200–300 °C)
Phyllic alteration dominated by sericite–quartz–pyrite is widely developed in both deposits, showing extensive mineral overlap (Figure 5). Muscovite and chlorite appear as massive or banded zones, while albite and illite display strong spatial superposition with phyllic alteration. Pyrophyllite, dickite, and kaolinite occur locally around the transition from intermediate- to low-temperature zones.
3.3.3. Low-Temperature Alteration (<200 °C)
Chalcedony, antigorite, and carbonate assemblages (dolomite, calcite, and rhodochrosite) are broadly distributed in distal zones (Figure 6). Anhydrite is concentrated near the hydrothermal core, whereas alunite, gypsum, limonite, and goethite appear as patchy or massive accumulations at the system margins, indicating late-stage acidic or supergene alteration.
Across the Qulong mineralized point, alteration minerals form mixed areal-banded zoning. High-temperature potassic alteration extends southward with strong tourmaline–quartz superposition, while phyllic and greisenized assemblages occupy broad intermediate-temperature zones. Low-temperature kaolinization, carbonatization, and chalcedony occur around the margins, accompanied by zoned biotite, chlorite, antigorite, and localized anhydrite.
At Jiama, alteration intensity decreases outward from a strongly overprinted core containing tourmalinization, potassic and phyllic alteration, anhydrite, montmorillonitization, and carbonates. These minerals form a semi-arc extending NE–SE and transition outward into low-temperature carbonates and chalcedony. High-temperature markers such as hematite, grossular, and antigorite are concentrated along the periphery, with alunite, chalcedony, and pyrophyllite distributed in patchy to banded forms.
In the southwestern part of the study area, Qulong’s alteration halo merges into a broader annular zonation with decreasing intensity toward the NW–NE wings. Biotite, sericite, anhydrite, potassic alteration, carbonates, and pyrite dominate the core arc, while antigorite, kaolinization, gypsum, advanced argillic alteration, and chloritization appear sporadically along the outer margins.
Collectively, GF-5 hyperspectral results reveal a classic porphyry-style zonation pattern: a central high-temperature potassic–silicic core, an intermediate phyllic/argillic zone, and an outer propylitic–carbonate halo. The southward extension of potassic alteration in Qulong and the multi-stage overprinting at Jiama highlight the dynamic evolution of the hydrothermal system and its strong spatial correspondence with known mineralization.
4. Research on Remote Sensing Mineral Exploration Models
4.1. Multispectral Remote Sensing Mineral Exploration Model
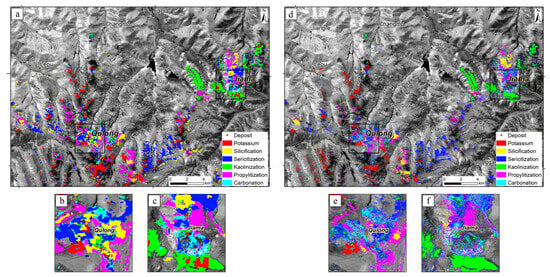
By synthesizing the spatial distribution relationships of various alteration minerals, the typical hydrothermal alteration zoning pattern of the Qulong deposit can be identified, exhibiting a annular–zonal spatial evolution structure (Figure 7). Based on the characteristics of alteration-type assemblages, it can be broadly divided into inner, intermediate, and outer zones. The alteration zoning from the center of the intrusion outward is as follows: potassic alteration + phyllic alteration zone → pyritic sericitization + argillic alteration + propylitic alteration zone → propylitic alteration + carbonation zone, corresponding to the inner, intermediate, and outer zones, respectively (Table 1).
Figure 7.
Distribution of alteration anomaly information based on multispectral remote sensing (using Sentinel-2 Band 11 as the base image): (a–c) Landsat-8; (d–f) Sentinel-2.
Table 1.
Characteristics of wall rock alteration zoning in the Qulong and Jiama mining areas.
Among these, the potassic alteration + phyllic alteration zone occurs only near the center of the porphyry body, formed by the interaction of late magmatic differentiation-derived fluids with the rock. This zone primarily contains potassium feldspar, quartz, minor pyrite, and sericite. The pyritic sericitization + argillic alteration + propylitic alteration zone is located peripheral to the potassic alteration zone, with relatively diffuse boundaries between adjacent zones, gradual transitions, and common overlapping alteration phenomena. It is mainly characterized by a closely associated assemblage of pyrite, quartz, muscovite, and kaolinite. Minor chlorite develops in areas of this zone farther from the center of the porphyry body.
The propylitic alteration + carbonation zone is situated at the outermost part of the mining area, primarily occurring in the exocontact zone between monzogranite porphyry/granodiorite porphyry and tuff of the Yeba Formation. It is characterized by abundant chlorite and minor calcite.
The Jiama deposit exhibits alteration zoning characteristics similar to those of the Qulong deposit. However, due to the multi-centered composite mineralization nature of the Jiama deposit, the alteration zoning differs in terms of alteration intensity. The alteration zoning from the center of the intrusion outward is as follows: potassic alteration + silicification zone → pyritic sericitization + argillic alteration zone → carbonation + propylitic alteration zone, corresponding to the inner, intermediate, and outer zones, respectively (Table 1).
Among these, the potassic alteration + silicification zone (inner zone) occurs near the center of the porphyry body and is closely related to intermediate–acidic intrusions. This zone mainly contains quartz, pyrite, and minor potassium feldspar. The pyritic sericitization + argillic alteration zone (intermediate zone) is located peripheral to the potassic alteration zone and is characterized by intense argillic alteration. Typical argillic alteration minerals such as illite and dickite are predominantly distributed in the area between the Xiaru and Pushui mining sections, while pyrophyllite and kaolinite are densely distributed in the Yiegelang area in the northern part of the mining area.
The carbonation + propylitic alteration zone (outer zone) is located at the outermost part of the mining area, primarily occurring in limestone and marble of the Duidigou Formation in the periphery of the mining area, and is characterized by abundant calcite.
4.2. Hyperspectral Remote Sensing Mineral Exploration Model
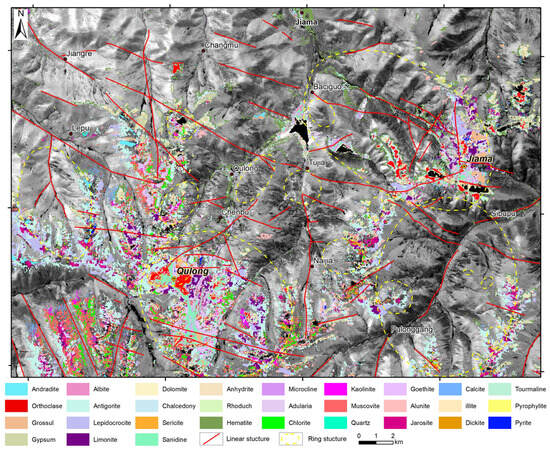
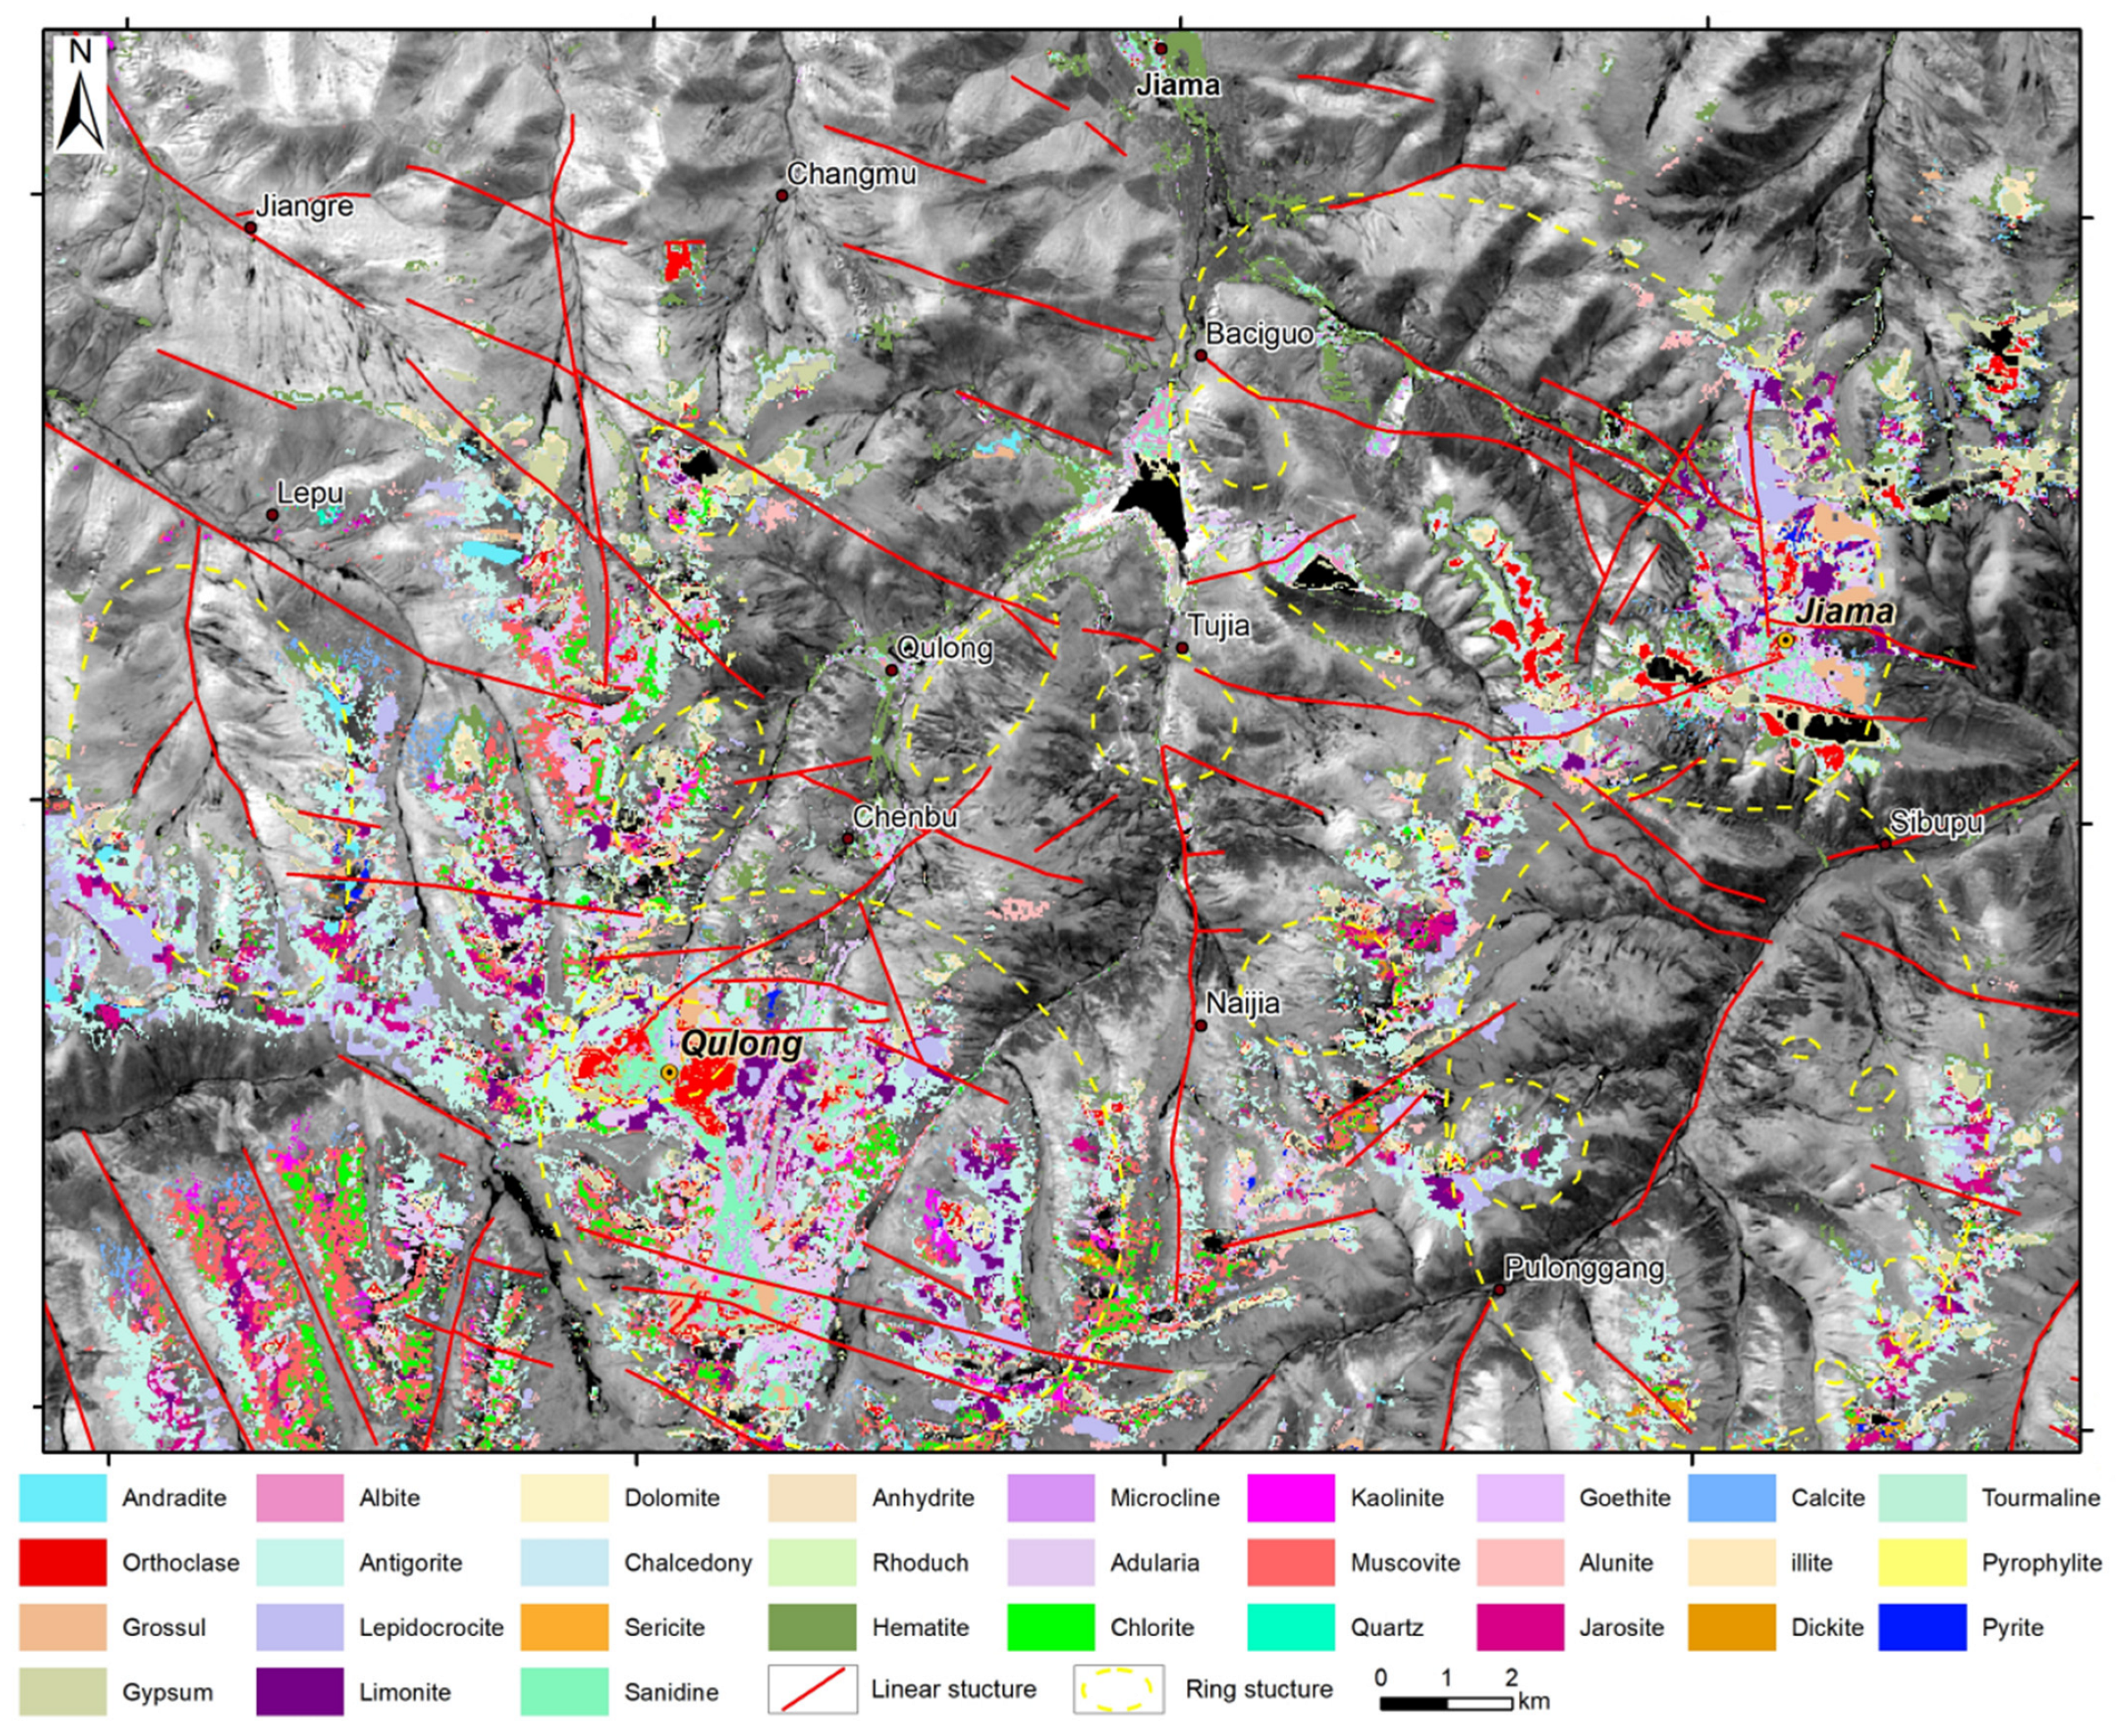
Integrating hyperspectral alteration information with structural interpretation allows the delineation of typical exploration features of porphyry copper systems in the Qulong–Jiama ore concentration area (Figure 8). Within the porphyry intrusions, characteristic alteration mineral assemblages are developed, forming the central zones of alteration anomalies. Typical minerals include potassium feldspar, biotite, and quartz. Potassic alteration assemblages (potassium feldspar, orthoclase, microcline, and adularia) are mainly concentrated near the center of the orebodies, while biotite enrichment is observed within and immediately adjacent to the porphyry intrusions, including the northern and northwestern parts of the Qulong mining area and the Jiama mining area.
Figure 8.
Integrated information distribution map of the Qulong–Jiama ore concentration area (based on Sentinel-2 Band B11 imagery).
The contact zones between porphyry intrusions and surrounding rocks represent transitional areas with complex alteration assemblages. In the Qulong mining area, where the porphyry intrudes siliceous wall rocks such as volcanic tuff, phyllic alteration, and silicification are widely developed along the intrusion margins. These zones are characterized by planar distributions of sericite, quartz, and pyrite and show gradual spatial transitions toward the intrusion center.
In the Jiama mining area, alteration assemblages in the contact zones are diverse and strongly overprinted. Tourmalinization, potassic alteration, and phyllic alteration commonly occur together, accompanied by minerals such as anhydrite, montmorillonite, and carbonates. These alteration assemblages form planar to semi-arc distributions extending outward from the central intrusion zones.
In wall rock regions distal to the orebodies, alteration intensity decreases, and alteration is mainly expressed as propylitic assemblages and iron-staining anomalies. Typical propylitic minerals include chlorite, epidote, and calcite, which are widely distributed in the surrounding wall rocks. Iron oxides and clay minerals occur sporadically in these distal zones and outline the outer extent of alteration halos. From an exploration perspective, the spatial association of chlorite–epidote alteration zones with peripheral iron-staining anomalies provides useful indicators for delineating prospective areas.
In summary, the Qulong and Jiama porphyry copper deposits exhibit typical annular–zonal alteration zoning structures: from the center of the porphyry body outward, high-temperature potassic alteration and silicification, intermediate-temperature phyllic alteration (quartz–sericite–pyrite assemblage) accompanied by argillic alteration, and low-temperature propylitic and carbonation alteration zones develop sequentially.
Based on the characteristics of hyperspectral alteration mineral information in the Qulong–Jiama ore concentration area, combined with the geological setting and metallogenic characteristics of the deposits, a hyperspectral remote sensing mineral exploration model for typical porphyry deposits is constructed from aspects such as geological background, alteration characteristics, and hyperspectral alteration information features (Table 2).
Table 2.
Hyperspectral remote sensing prospecting model for typical porphyry copper deposits in the Qulong–Jiama ore concentration area.
4.3. Validation of Alteration Types Based on Field and Petrographic Evidence
4.3.1. Field-Scale Validation of Alteration Zones
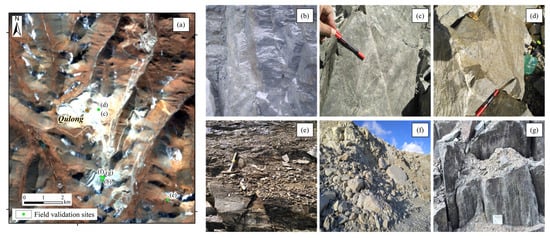
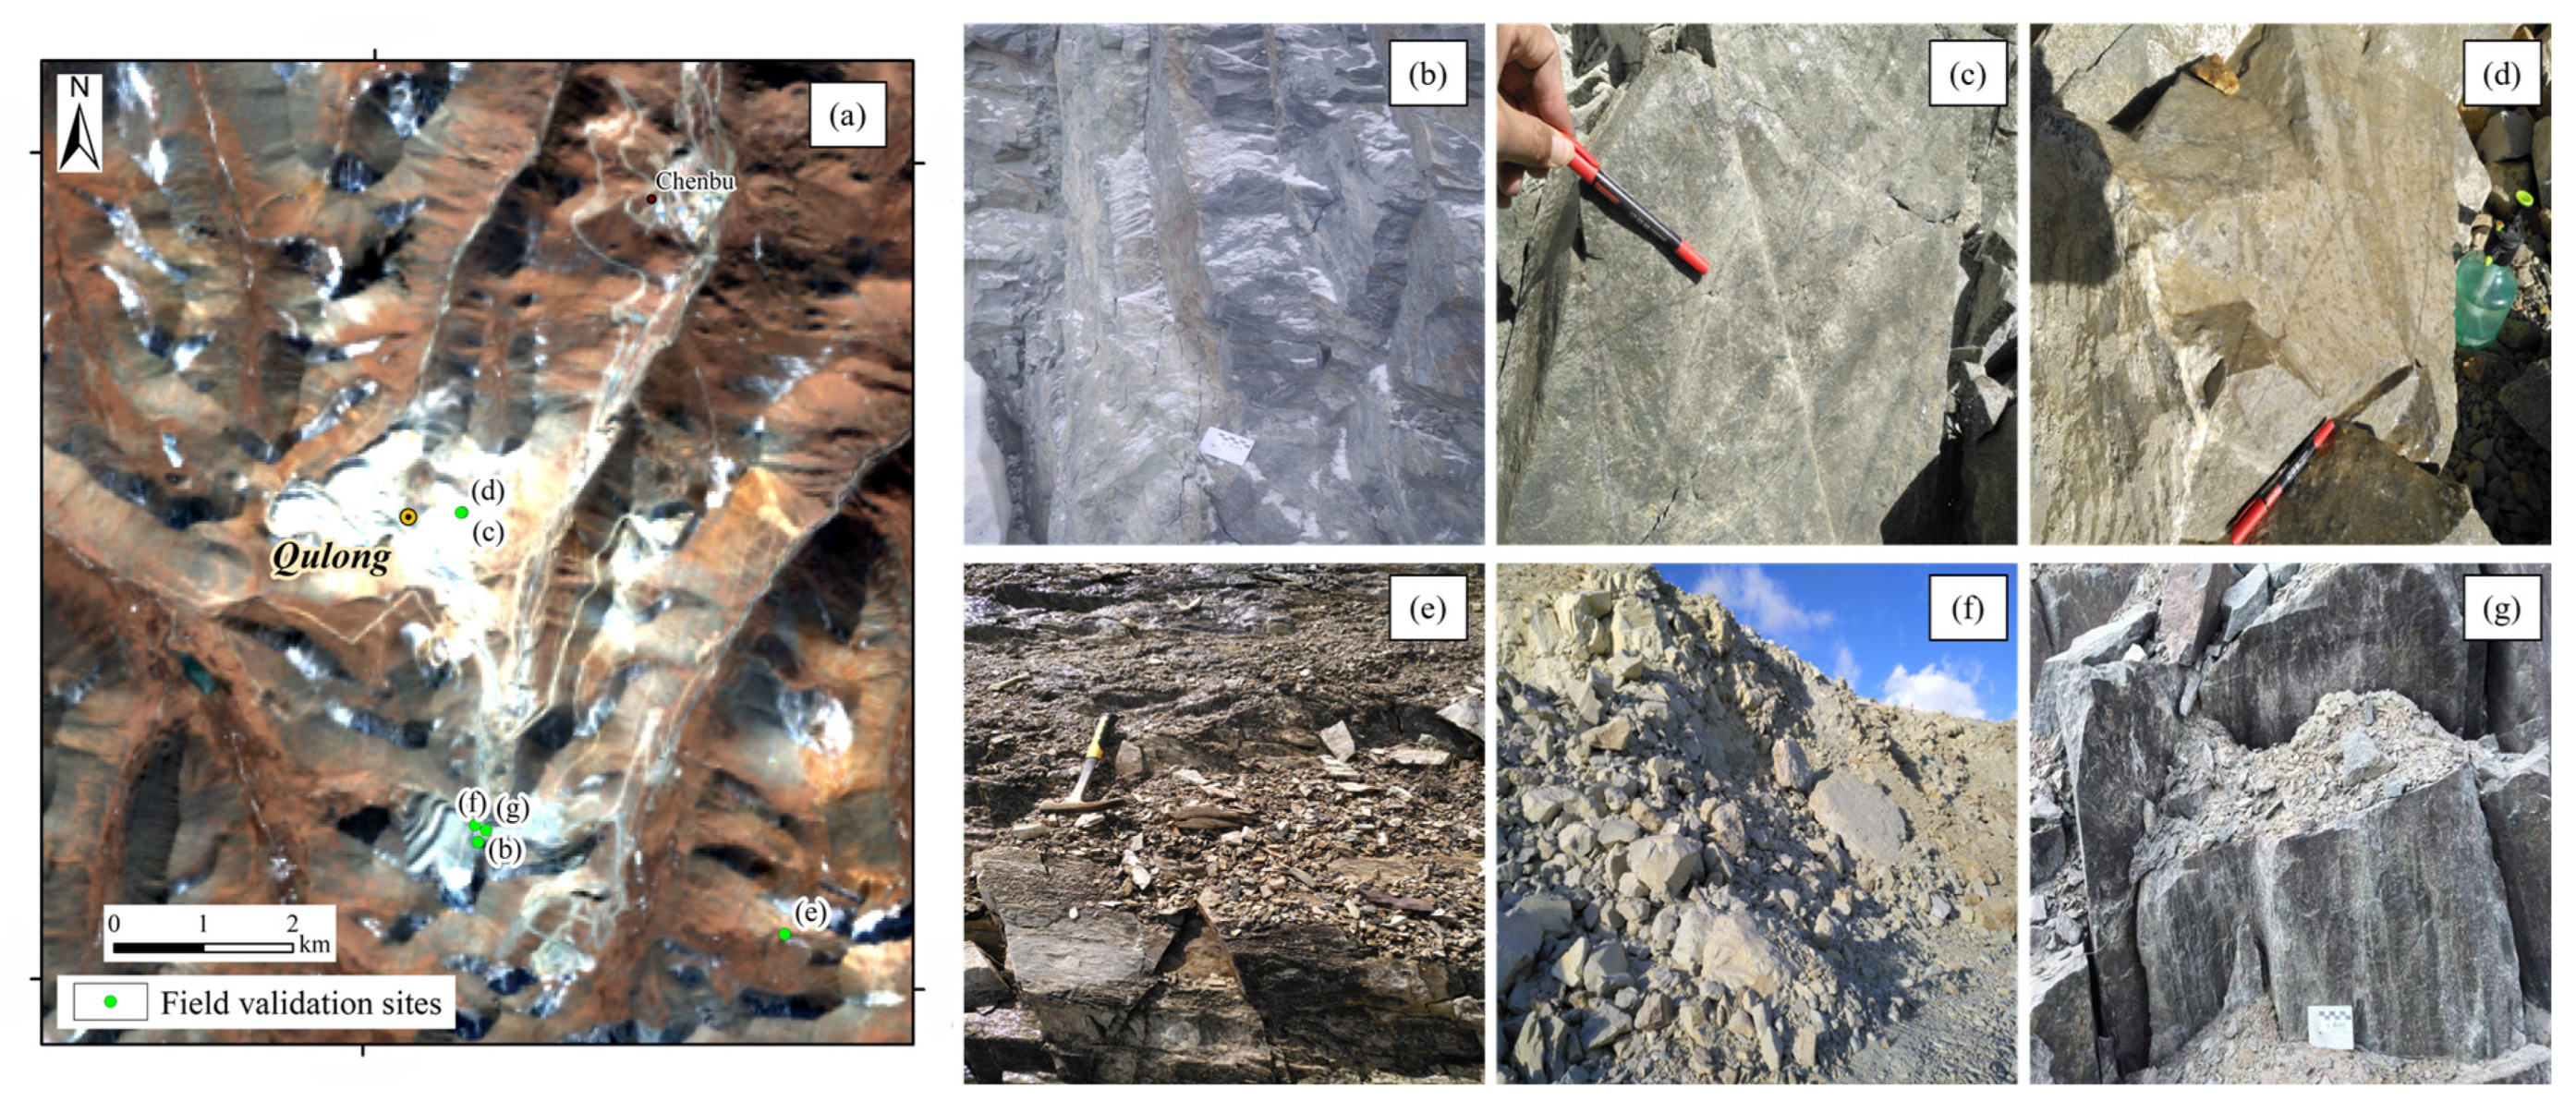
Systematic field investigations conducted in the vicinity of the Qulong mining area provide independent validation of the alteration types interpreted from remote sensing analysis. As illustrated in Figure 9, representative field validation sites document a range of hydrothermal and contact-related alteration styles. Epidotized andesitic tuff reflects propylitic alteration (Figure 9b), whereas rhyolite porphyry affected by pyrite–quartz–sericite alteration, locally overprinted by epidotization and chloritization, represents phyllic alteration (Figure 9c,d). Marbleized limestone records contact metamorphism (Figure 9e), while kaolinized biotite monzogranite indicates argillic alteration (Figure 9f). In addition, hornfelsized andesitic tuff further evidences contact metamorphism related to intrusive activity (Figure 9g). These field-observed alteration assemblages show good spatial correspondence with the alteration zones delineated from satellite imagery. The overall consistency between field observations and remote sensing-derived alteration patterns confirms that the detected alteration anomalies reflect genuine geological processes rather than spectral artifacts, providing robust ground-truth support for the reliability of the alteration mapping results.
Figure 9.
Field validation of alteration types in the study area: (a) locations of representative field validation sites; (b) epidotized andesitic tuff; (c) rhyolite porphyry affected by pyrite–quartz–sericite alteration overprinted by epidotization and chloritization; (d) rhyolite porphyry with intense pyrite–quartz–sericite alteration; (e) marbleized limestone; (f) kaolinized biotite monzogranite; (g) hornfelsized andesitic tuff.
4.3.2. Petrographic Confirmation of Alteration Assemblages
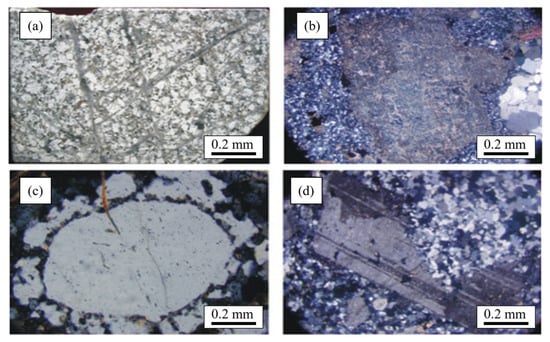
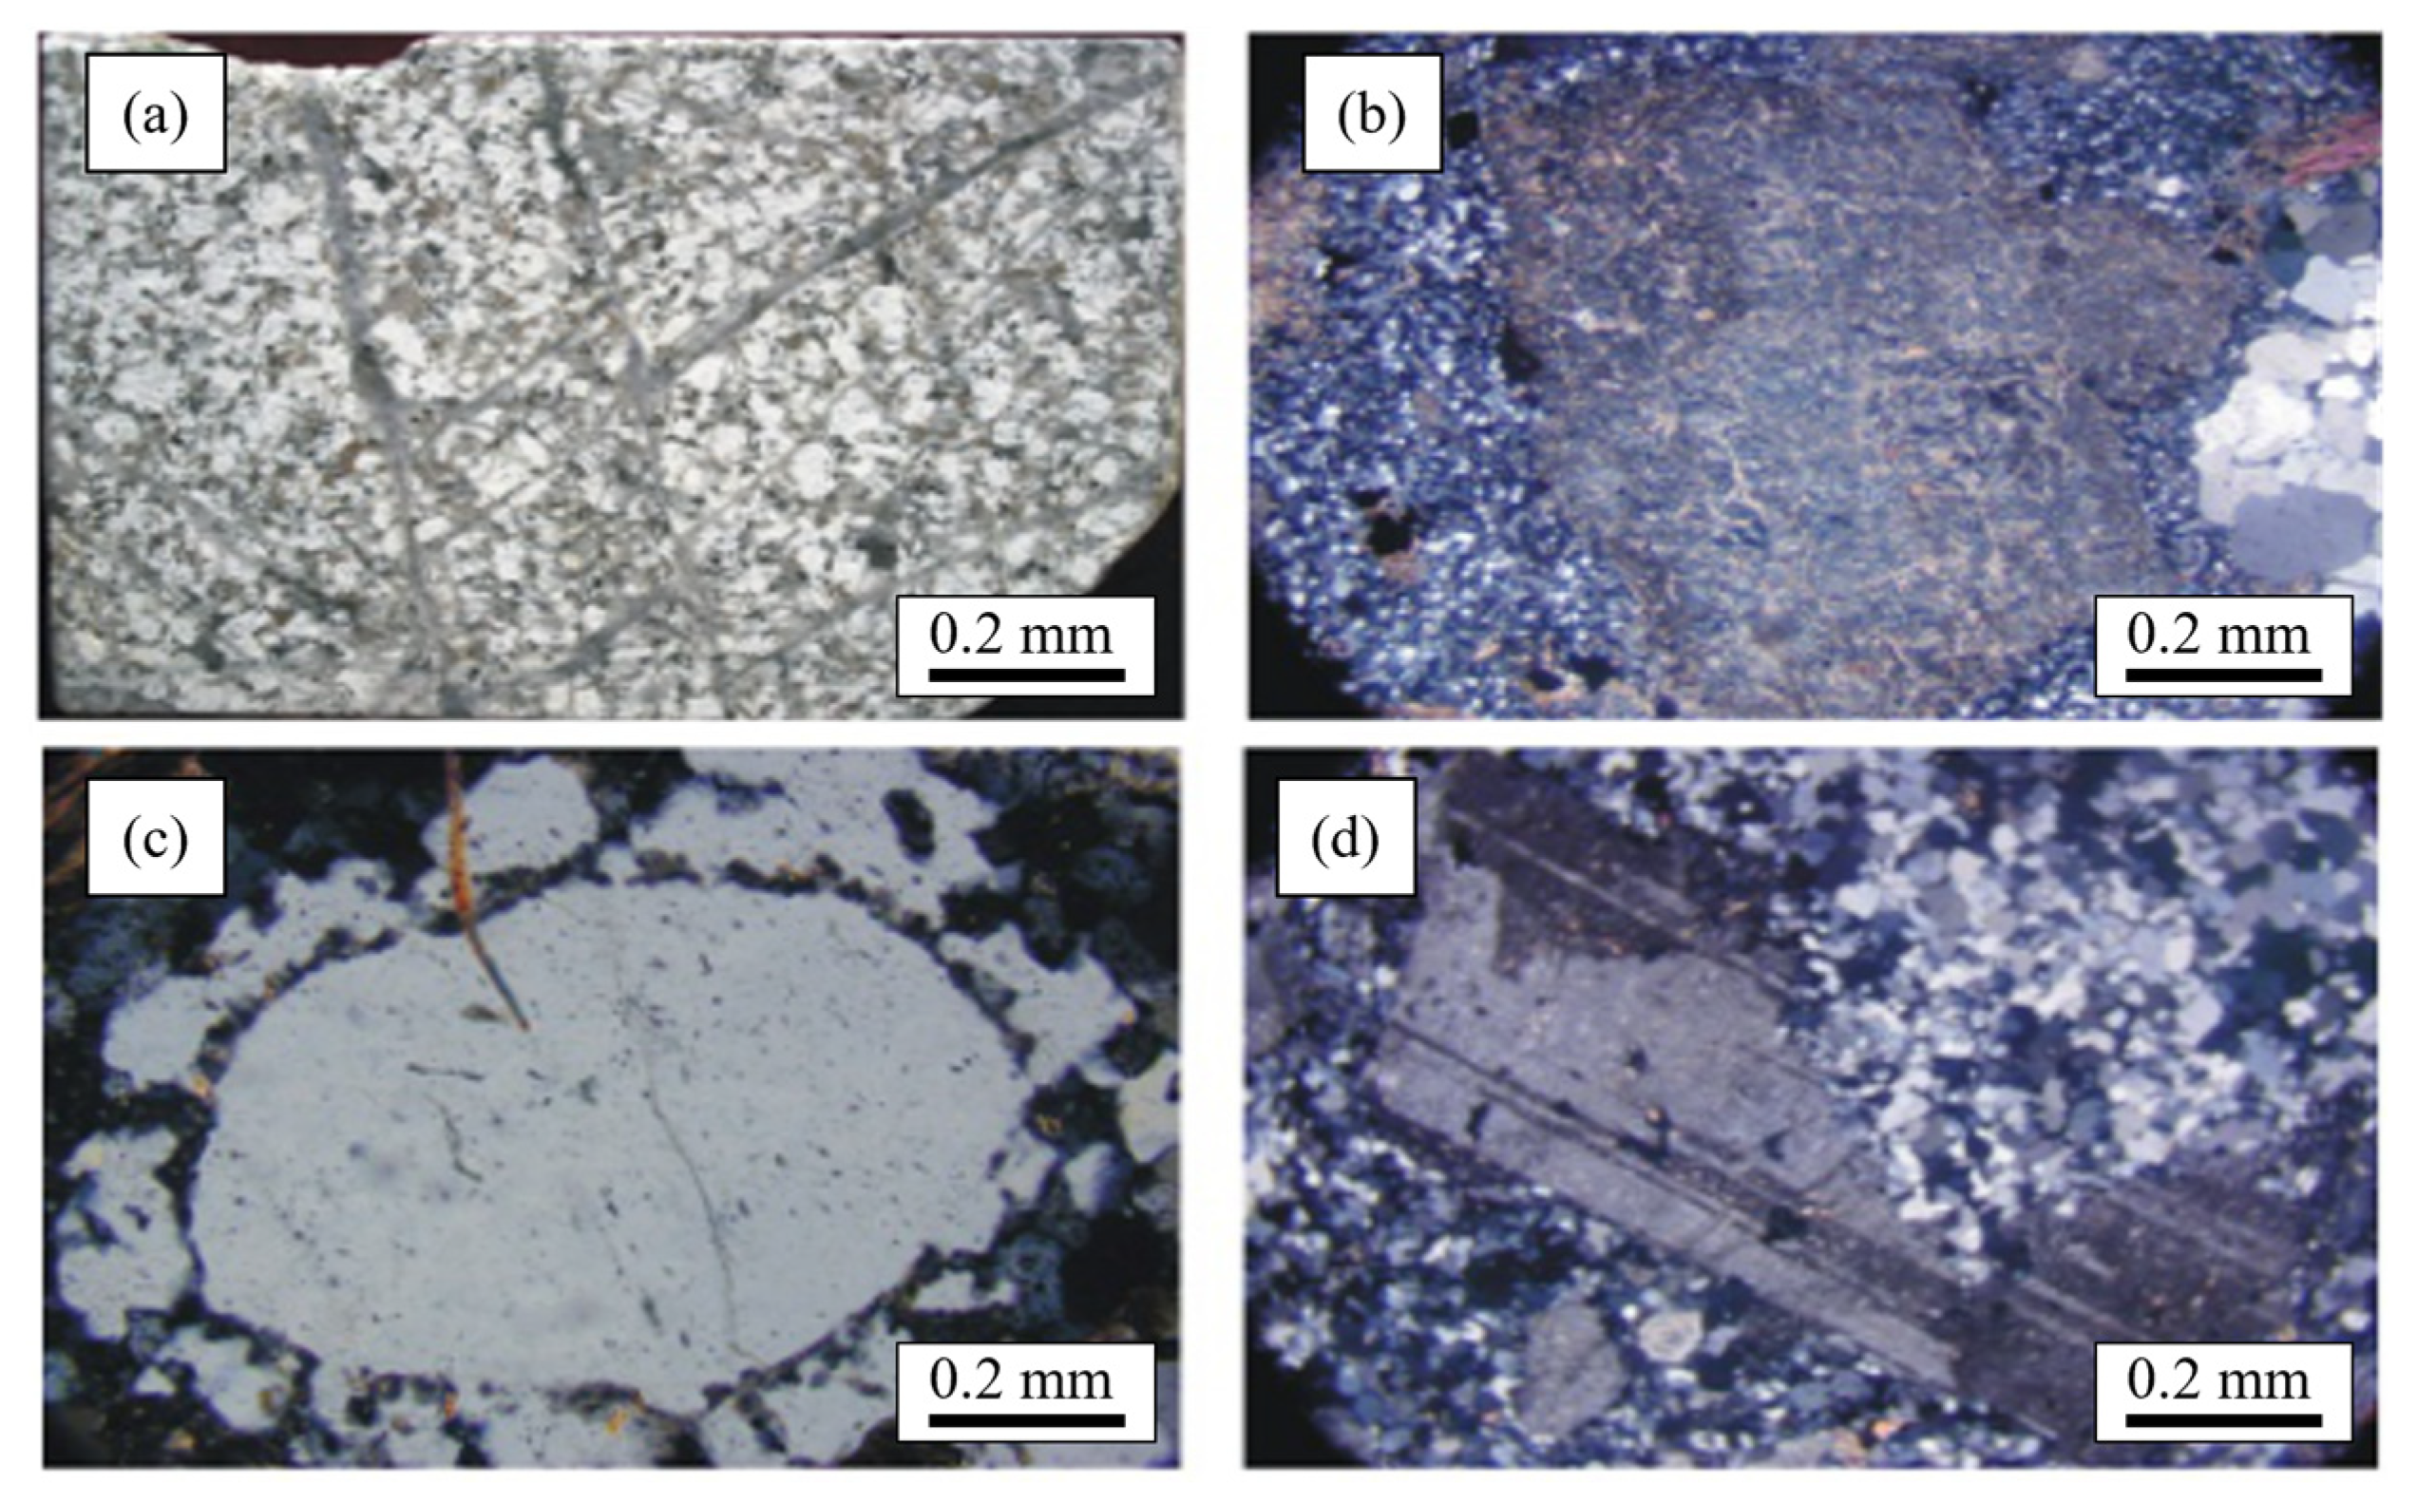
Petrographic observations of representative samples collected from areas characterized by strong alteration anomalies reveal well-developed sericitization, silicification, and argillic alteration. Sericitization is manifested by the pervasive replacement of feldspar by fine-grained sericite, resulting in a markedly altered rock matrix. Argillic alteration is characterized by the development of clay minerals and the partial destruction of primary mineral textures, indicating intense hydrothermal overprinting. Silicification is expressed by the widespread enrichment of silica within the altered rocks, commonly occurring in close association with sericitized and argillic domains (Figure 10). These alteration features show good spatial correspondence with the alteration zones delineated from remote sensing analysis, particularly the areas identified as sericitic, silicified, and argillic alteration. The consistency between petrographic observations and remotely sensed alteration patterns provides independent ground-truth evidence supporting the reliability of the remote sensing-derived alteration mapping.
Figure 10.
Photomicrographs of hydrothermal alteration in the mining area: (a) silicification and argillic alteration in biotite monzogranite; (b) silicification, argillic alteration, and carbonatization in monzogranite porphyry; (c) secondary quartz overgrowth developed in biotite monzogranite; (d) feldspar replaced by quartz in biotite monzogranite.
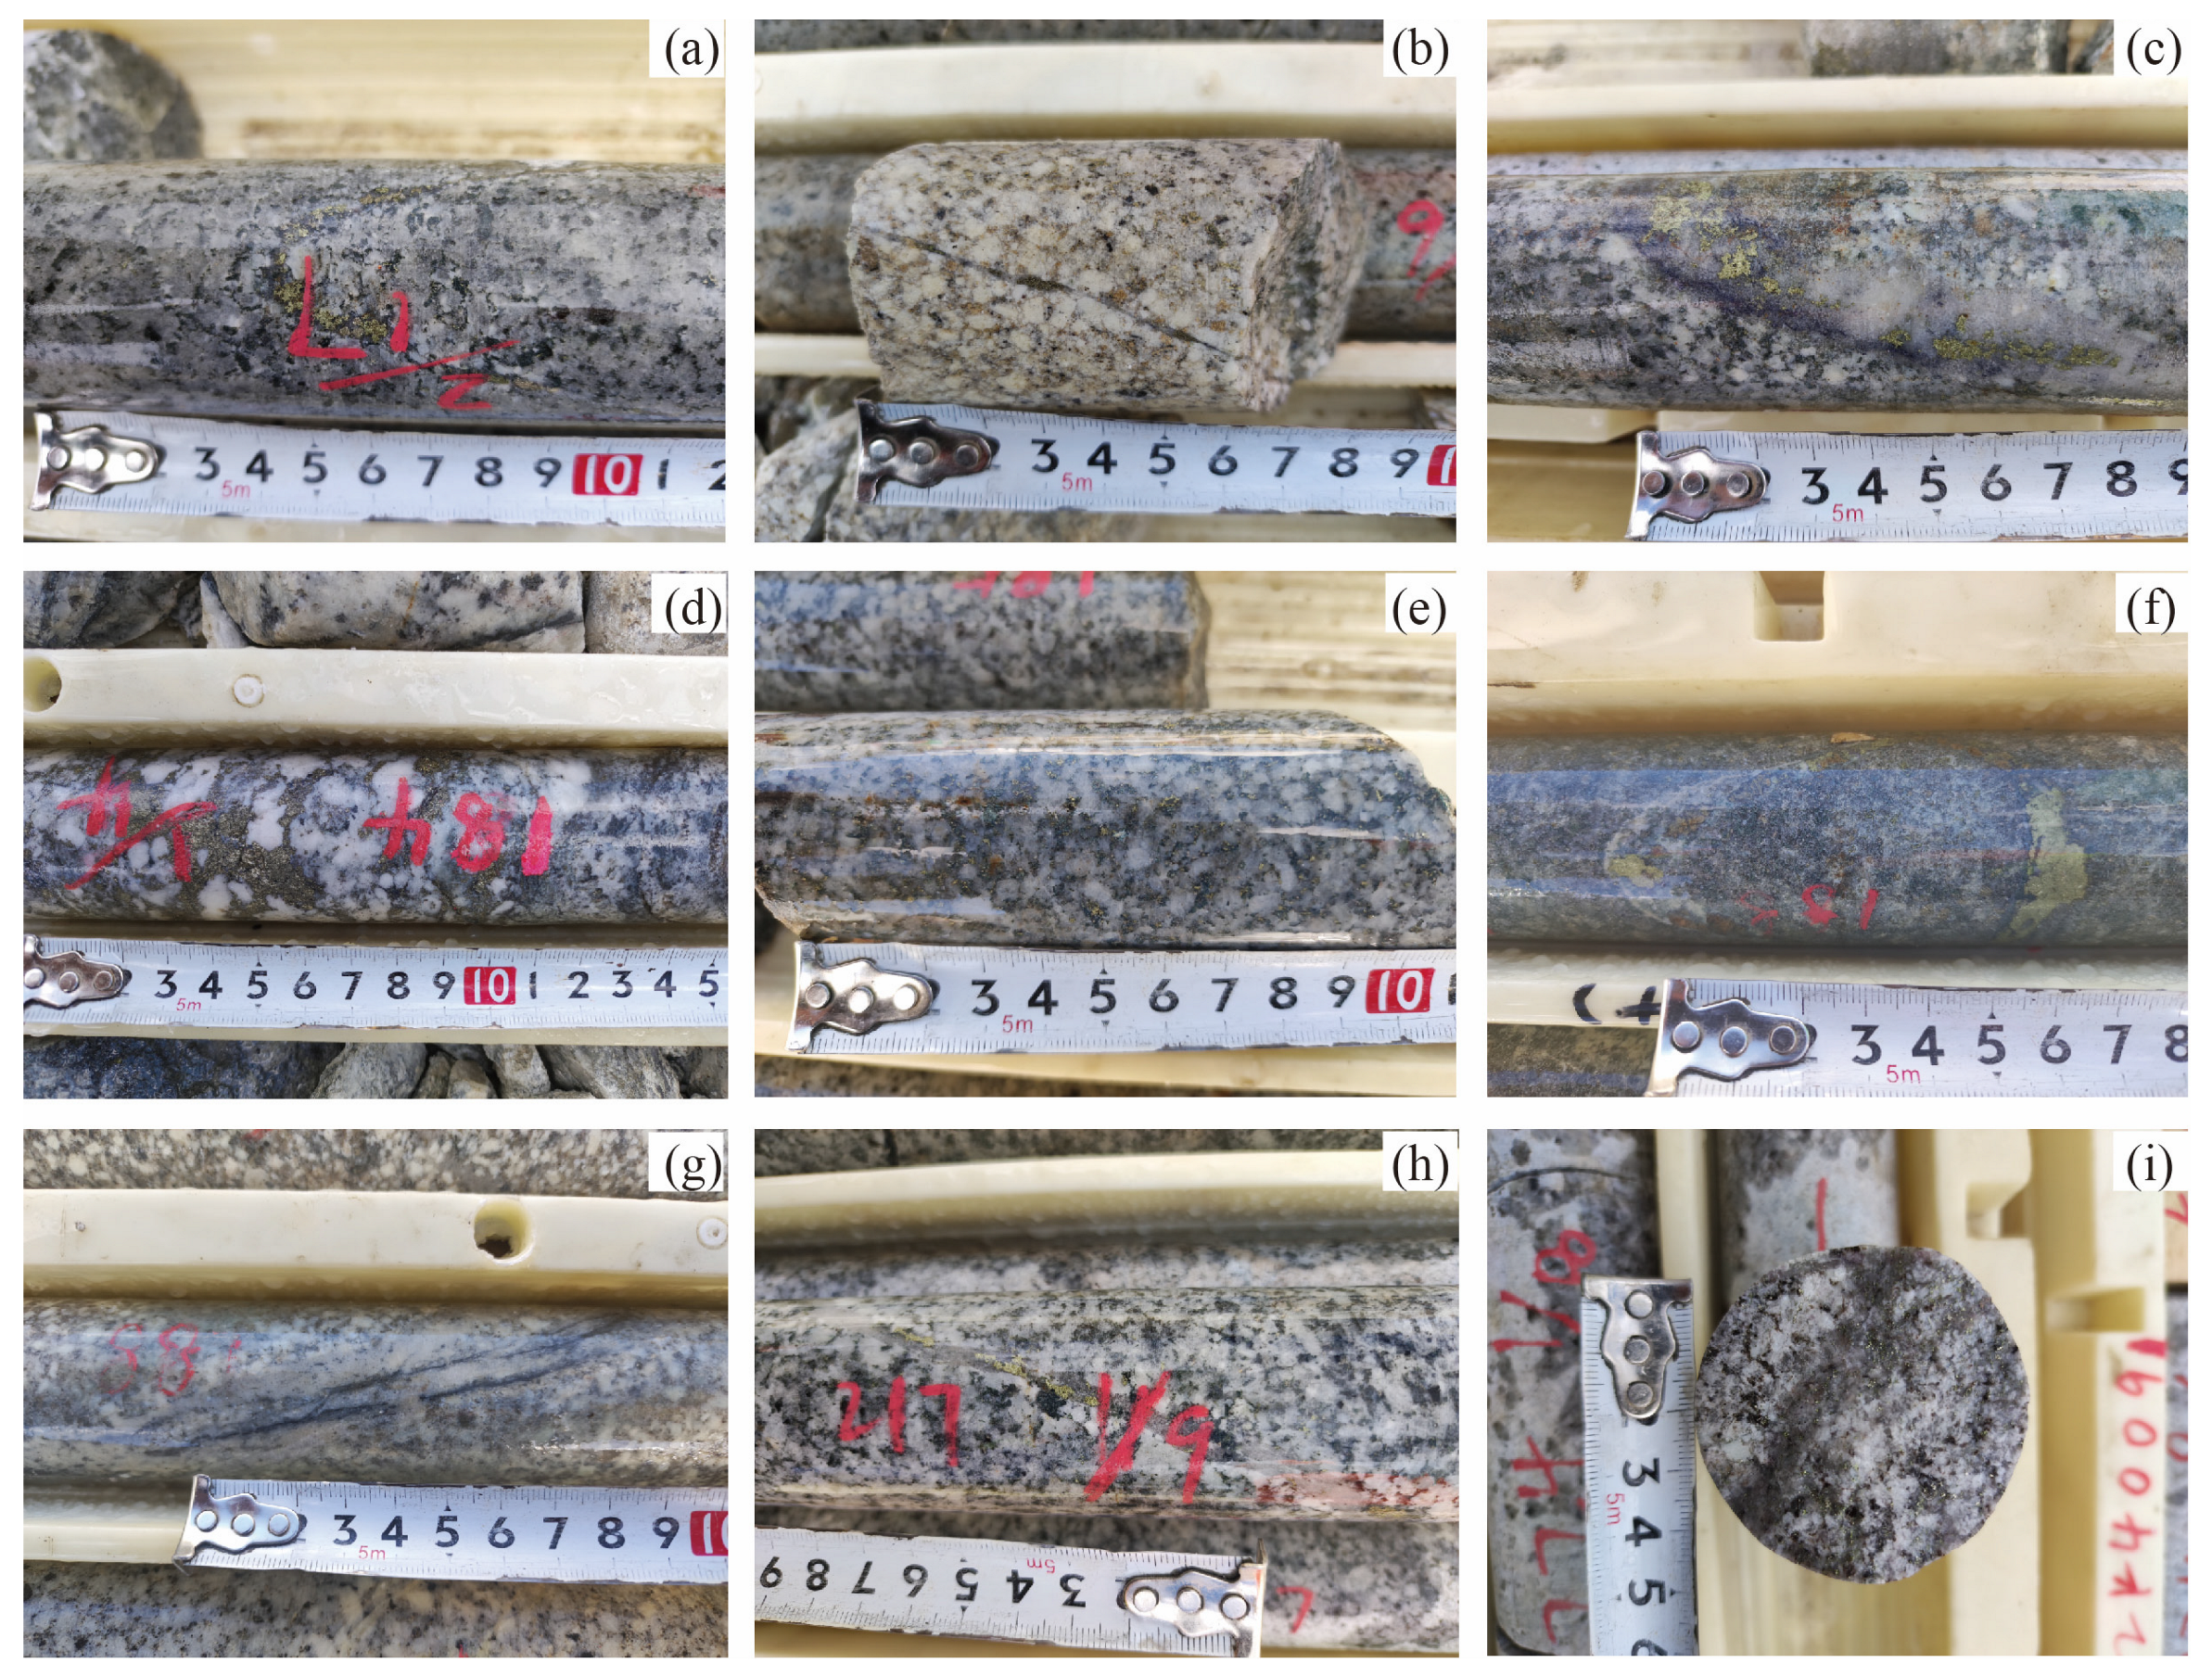
Field investigations further provide independent evidence supporting the remote sensing-derived alteration mapping. Typical mineralization styles observed in the study area include vein-type, stockwork-type, and disseminated sulfide mineralization, which are spatially associated with alteration zones interpreted from remote sensing data. Vein-type chalcopyrite mineralization is commonly developed within granodiorite and monzogranite porphyry (Figure 11a,h), whereas stockwork and disseminated chalcopyrite mineralization occur within granodiorite, fine-grained granodiorite, and sericitized rocks (Figure 11d–f,i).
Figure 11.
Representative photographs of typical mineralization styles in drill cores from the study area: (a) vein-type chalcopyrite mineralization in granodiorite; (b) monzogranite porphyry; (c) silicification associated with molybdenite and chalcopyrite mineralization in granodiorite; (d) stockwork-type chalcopyrite mineralization in monzogranite porphyry; (e) disseminated chalcopyrite mineralization in granodiorite; (f) clustered and disseminated chalcopyrite mineralization in sericitite; (g) vein-type molybdenite mineralization in monzogranite; (h) vein-type chalcopyrite mineralization in granodiorite; (i) disseminated chalcopyrite mineralization in fine-grained granodiorite.
In addition, silicification accompanied by molybdenite and chalcopyrite mineralization is observed in granodiorite (Figure 11c), while vein-type molybdenite mineralization is locally developed in monzogranite (Figure 11g). These mineralization styles are closely associated with quartz–sericite alteration and intense silicification, corresponding well with the alteration assemblages extracted from remote sensing imagery.
Overall, the consistency between remote sensing-identified alteration types, petrographic mineral assemblages, and observed mineralization styles confirms the reliability of the alteration mapping results and demonstrates that the detected alteration anomalies have clear geological significance.
5. Discussion
5.1. Comparison of Alteration Information Extraction Accuracy and Applicability Between Hyperspectral and Multispectral Remote Sensing
Hyperspectral and multispectral remote sensing each possess distinct characteristics and advantages for extracting alteration information in porphyry copper deposits, with notable differences in their accuracy and applicability. Hyperspectral data, featuring tens to hundreds of contiguous narrow bands, can capture subtle spectral absorption features of minerals. This capability allows hyperspectral sensing to identify diagnostic absorption peaks of specific minerals (e.g., the Al-OH absorption near 2200 nm for muscovite, the Fe-OH absorption near 2250 nm for chlorite), thereby effectively distinguishing between different alteration minerals [14,32]. In contrast, multispectral remote sensing has only a limited number of broad bands, each covering a wide wavelength range, which prevents the resolution of detailed, unique mineral absorption peaks. Consequently, multispectral data typically only indicate composite information for mineral groups, such as revealing “clay mineral anomalies” or “ferric iron staining anomalies,” without being able to pinpoint the specific type of clay mineral or iron oxide.
Therefore, hyperspectral remote sensing far surpasses multispectral in the accuracy of alteration mineral identification. This is particularly critical for porphyry copper deposits, which exhibit distinct alteration zoning, where different alteration mineral assemblages correspond to temperature and chemical gradients from the outer to inner zones. The results from the Qulong–Jiama ore concentration area in this study fully demonstrate this point. Utilizing GF-5 hyperspectral data, up to 33 alteration minerals were identified, encompassing supergene iron-stained minerals (e.g., limonite and goethite, weathering products of pyrite), mesothermal hydrothermal alteration minerals (e.g., sericite, chlorite, epidote, illite), and endogenic hydrothermal minerals and alteration products (e.g., K-feldspar, quartz, muscovite, kaolinite, alunite, and pyrophyllite). In comparison, using Sentinel-2 and Landsat 8 multispectral data, only generalized alteration anomalies could be extracted through PCA, such as high-value areas indicative of iron oxide enrichment or hydroxyl-bearing mineral enrichment [30]. These multispectral anomalies can rapidly delineate areas of higher alteration intensity within the ore district, but cannot further distinguish the specific mineral types and assemblages present.
The findings of this study indicate that in large porphyry copper ore concentration areas like Qulong–Jiama, multispectral remote sensing is suitable for the rapid location of alteration anomalies, whereas hyperspectral remote sensing enables the detailed characterization of alteration zoning. The anomaly zones delineated by multispectral data often correspond to specific alteration assemblages identified by hyperspectral data. This difference signifies that hyperspectral data provides higher information content and precision for mineral exploration. By identifying the specific alteration types, one can interpret their correspondence with the typical zoning of a porphyry system, thereby allowing for more accurate inference of the mineralized center’s location.
In summary, multispectral remote sensing is suitable for regional-scale reconnaissance, with advantages in broad coverage and high efficiency. Hyperspectral remote sensing is suited for detailed investigation and verification, with strengths in strong mineral diagnostic capability and high information content. Their integration can form a progressive exploration strategy of “reconnaissance first, detailed investigation later”: multispectral data is first used to rapidly screen prospective target areas, followed by hyperspectral data for detailed investigation of these targets to obtain alteration mineral assemblages and zoning characteristics, achieving a seamless transition from anomaly delineation to metallogenic prediction.
5.2. Advantages of Hyperspectral Remote Sensing
To evaluate the uniqueness and technical advancements of this study, the hyperspectral alteration mapping results from the Qulong–Jiama ore concentration area are compared with other relevant research, primarily analyzing the aspects of identified alteration mineral types, spatial zoning accuracy, and model construction depth.
Firstly, regarding the variety and range of identified alteration minerals, the use of GF-5 hyperspectral data enabled the identification of 33 alteration minerals, nearly encompassing the major minerals from supergene to hydrothermal origins within the porphyry–epithermal metallogenic system. Such broad-spectrum identification is relatively rare in existing studies. Most earlier works focused only on a subset of alteration minerals. For instance, Guo et al. [9], through field spectral measurements of the muscovite Al–OH absorption peak position, revealed its systematic shift with distance from the ore center, effectively tracing hydrothermal alteration intensity. However, being confined to a single mineral, it could not comprehensively reflect the overall alteration assemblage in the Jiama mining district. Similarly, Yuan et al. [10] proposed a “muscovite spectral fingerprint” method, integrating field-acquired muscovite spectral characteristics with GF-5 satellite hyperspectral imagery to locate muscovite anomaly areas with specific spectral signatures on a macroscopic scale, thereby extending prospecting information from points to areas. While these achievements provide in-depth insights into the key indicator mineral muscovite, the coverage of mineral species is limited and does not include other associated alteration minerals. In contrast, this study simultaneously captured information on various minerals such as muscovite, chlorite, illite, alunite, silicates, and oxides using hyperspectral data, enabling the construction of a more complete alteration zoning image. Compared to their work, the mineral types identified in this study in the Qulong–Jiama area are more diverse, particularly adding information on weathered supergene minerals (e.g., limonite, goethite, jarosite) and some deep hydrothermal minerals. This enhances the alteration mapping to include not only horizontal zoning but also clues to vertical evolution.
Secondly, concerning spatial zoning accuracy, both this study and existing results demonstrate that hyperspectral remote sensing can delineate the spatial distribution of alteration halos in detail, but accuracy varies due to differences in methodology and data sources. The hyperspectral mapping results of this study clearly show a concentric zoning structure of alteration minerals from the margin to the center in the Qulong–Jiama ore concentration area, and these alteration anomalies highly correspond spatially with known deposits (e.g., Qulong, Jiama ore bodies). For example, the strong alteration zone of sericite + iron oxides coincides with the surface oxidation cap of the Jiama deposit, chlorite-epidote anomalies surround the periphery of known ore bodies, and the silicification-potassic alteration zone covers the Qulong outcrop mineralization area. This correspondence between alteration zoning and prospecting targets indicates high spatial positioning accuracy in this study, and the extracted alteration information can reliably indicate the location of mineralization centers. In contrast, although the study by Chen et al. [7] in the Qinshui Basin based on ZY-1 02D data achieved a classification accuracy of approximately 81.7%, the identified minerals were mainly kaolinite, illite, and calcite, manifesting as scattered anomalies in space rather than the zoning structure of a metallogenic system. Other studies, such as Tan et al. [13], using spectral absorption peak shifts to discuss metallogenic potential directions in the Liba gold deposit, West Qinling, made breakthroughs in fine identification or quantitative characterization, but overall still emphasized localized depiction. The results of this study are more complete in terms of systematicity and correspondence with metallogenic regularity.
Finally, regarding model construction depth and prospecting prediction capability, this study shows significant systematic progress compared to previous work. Most existing studies focus on using remote sensing to extract alteration information itself, with relatively simple construction of alteration zoning or prospecting models, often superimposing alteration anomalies on geological backgrounds for target prioritization. This study attempts to construct a “hyperspectral remote sensing prospecting model for porphyry copper deposits.” Based on obtaining alteration zoning, it systematically refines ore-controlling factors and prospecting indicators by integrating metallogenic geological conditions. Specifically, we comprehensively analyzed the correspondence between remote sensing alteration information and the characteristic alteration zoning of typical porphyry deposits. Combined with metallogenic geological conditions, we summarized a three-zone zoning model (“inner–intermediate–outer”) and incorporated ore-controlling factors such as linear and circular structures and contact zones into the model, proposing that structural–alteration overlap areas are key loci for mineralization. Compared to the frameworks of Qin et al. [33], Liu et al. [34], and Fu et al. [35], which relied on single spectral parameters, this model offers advantages in comprehensiveness and predictability. While some studies integrating multi-source data [8,36] have explored the combined application of ASTER, Sentinel-2, and GF-5, most still rely on empirical models, lacking a more universal systematic framework. The practice in this study provides a valuable supplement for enriching remote sensing prospecting models for porphyry copper deposits.
6. Conclusions
This study utilized Sentinel-2 and Landsat-8 multispectral data, as well as GF-5 hyperspectral data, to extract alteration information and linear-circular structures in the Qulong–Jiama ore concentration area through principal component analysis and the SAM method. The main conclusions are as follows:
- Utilizing hyperspectral data, 33 types of alteration minerals were successfully identified. The results demonstrate that, compared to multispectral remote sensing, the contiguous narrow bands of hyperspectral remote sensing comprehensively capture the diagnostic spectral features of alteration minerals, enabling more reliable and precise identification of specific alteration minerals.
- The GF-5 hyperspectral satellite data effectively extracted hydrothermal alteration mineral information from the Qulong and Jiama deposits. This revealed the spatial distribution patterns of alteration minerals in the study area, summarized the characteristic hydrothermal alteration zoning, and effectively indicated the mineralization center.
- By integrating prospecting indicators such as stratigraphic lithology, structures, wall-rock alteration, and multispectral/hyperspectral remote sensing alteration information, a comprehensive analysis of typical porphyry copper deposits was conducted. A hyperspectral remote sensing prospecting model for typical porphyry copper deposits in the Qulong–Jiama ore concentration area was established, providing a valuable reference for exploring similar porphyry copper deposits.
Author Contributions
Conceptualization, C.Z., L.H., J.G. and Z.H.; methodology, C.Z., L.H., J.G. and Z.H.; software, C.Z. and X.C.; validation, C.Z., L.H. and Z.H.; formal analysis, C.Z.; investigation, C.Z., J.Z. and X.C.; resources, Z.H.; data curation, C.Z., J.Z. and X.C.; writing—original draft preparation, C.Z. and L.H.; writing—review and editing, Z.H., J.Z. and X.C.; visualization, C.Z., L.H. and Z.H.; supervision, L.H. and Z.H.; project administration, L.H. and Z.H.; funding acquisition, L.H. and Z.H. All authors have read and agreed to the published version of the manuscript.
Funding
This research was supported by the National Natural Science Foundation of China (Grant No. 42301456) and the Natural Science Foundation of Sichuan Province (Grant No. 2025ZNSFSC0321).
Data Availability Statement
The original contributions presented in this study are included in the article. Further inquiries can be directed to the corresponding authors.
Acknowledgments
We are grateful to the chief editor and anonymous reviewers for illuminating comments.
Conflicts of Interest
Authors Jiansheng Gong and Junkang Zhao were employed by the company Zijin Mining Group Southwest Geological Exploration Co., Ltd. Also, the authors declare the following financial interests/personal relationships, which may be considered as potential competing interests: Li He reports that financial support and administrative support were provided by the National Natural Science Foundation of China. Li He reports that financial support, article publishing charges, and travel were provided by the Chengdu University of Technology State Key Laboratory of Geohazard Prevention and Geoenvironment Protection. If there are other authors, they declare that they have no known competing financial interests or personal relationships that could have appeared to influence the work reported in this paper.
References
- Sillitoe, R.H. Porphyry Copper Systems. Econ. Geol. 2010, 105, 3–41. [Google Scholar] [CrossRef] [Scilit]
- Shi, S.; Chen, S.; Luo, S.; Ren, H.; Jiang, X. Petrogenesis and Metallogenic Significance of the Demingding Mo-Cu Porphyry Deposit in the Gangdese Belt, Xizang: Insights from U-Pb and Re-Os Geochronology and Geochemistry. Minerals 2024, 14, 1232. [Google Scholar] [CrossRef] [Scilit]
- Habashi, J.; Oskouei, M.M.; Moghadam, H.J.; Pour, A.B. Optimizing alteration mineral detection: A fusion of multispectral and hyperspectral remote sensing techniques in the Sar-e-Chah-e Shur, Iran. Remote Sens. Appl. Soc. Environ. 2024, 35, 101249. [Google Scholar] [CrossRef] [Scilit]
- Abdelkareem, M.; Abdalla, F.; Yousef, S. The use of ASTER and landsat remote sensing data for exploring hydrothermal mineral in Arabian-Nubian Shield. Kuwait J. Sci. 2024, 51, 100240. [Google Scholar] [CrossRef] [Scilit]
- Jain, R.; Sharma, R.U. Airborne hyperspectral data for mineral mapping in Southeastern Rajasthan, India. Int. J. Appl. Earth Obs. Geoinf. 2019, 81, 137–145. [Google Scholar] [CrossRef] [Scilit]
- Awad, M.E.; Amer, R.; López-Galindo, A.; El-Rahmany, M.M.; del Moral, L.F.G.; Viseras, C. Hyperspectral remote sensing for mapping and detection of Egyptian kaolin quality. Appl. Clay Sci. 2018, 160, 249–262. [Google Scholar] [CrossRef] [Scilit]
- Chen, L.; Sui, X.; Liu, R.; Chen, H.; Li, Y.; Zhang, X.; Chen, H. Mapping Alteration Minerals Using ZY-1 02D Hyperspectral Remote Sensing Data in Coalbed Methane Enrichment Areas. Remote Sens. 2023, 15, 3590. [Google Scholar] [CrossRef] [Scilit]
- Zhang, G.; Zhao, Z.; Zhang, X.; Wu, X.; Zheng, Y.; Feng, L.; Huang, Z. Comprehensive Multi-Source remote sensing data integration for enhanced mineralization alteration extraction and geological structure interpretation in the Lala region of Sichuan Province. Ore Geol. Rev. 2024, 168, 106032. [Google Scholar] [CrossRef] [Scilit]
- Guo, N.; Thomas, C.; Tang, J.; Tong, Q. Mapping white mica alteration associated with the Jiama porphyry-skarn Cu deposit, central Tibet using field SWIR spectrometry. Ore Geol. Rev. 2019, 108, 147–157. [Google Scholar] [CrossRef] [Scilit]
- Yuan, C.; Zhao, J.; Liu, Z.; Liu, X.; Tang, J. Detecting mineralization via white mica spectral footprints: From field-based sampling to satellite hyperspectral remote sensing. Ore Geol. Rev. 2025, 181, 106588. [Google Scholar] [CrossRef] [Scilit]
- Orynbassarova, E.; Ahmadi, H.; Pour, A.B.; Yerzhankyzy, A.; Zakariya, M.; Omirzhanova, Z. PRISMA hyperspectral satellite imagery for mapping alteration minerals and zones in Aktogay porphyry copper deposit, Kazakhstan: Implications for new discoveries. Geocarto Int. 2025, 40, 1–25. [Google Scholar] [CrossRef] [Scilit]
- Portela, B.; van der Werff, H.; Hecker, C.; van der Meijde, M. Characterising mineral chemistry variation as a proxy for fluid composition using EMIT spaceborne hyperspectral data. Ore Geol. Rev. 2025, 182, 106673. [Google Scholar] [CrossRef] [Scilit]
- Tan, H.; Qiu, K.; Liu, H.; Zhang, P.; Fu, J.; Wang, R.; Luo, J.; Shi, Y. Alteration characteristics of wall rocks in the Liba orogenic gold deposit, West Qinling: Based on information extraction from GF-5B spaceborne hyperspectral data. Acta Petrol. Sin. 2024, 40, 1784–1800. [Google Scholar] [CrossRef] [Scilit]
- Yao, F.; Liu, S.; Wang, D.; Geng, X.; Wang, C.; Jiang, N.; Wang, Y. Review on the development of multi- and hyperspectral remote sensing technology for exploration of copper-gold deposits. Ore Geol. Rev. 2023, 162, 105732. [Google Scholar] [CrossRef] [Scilit]
- Wang, Q.; Meng, Y.; Wei, Y.; Jiang, L.; Wang, Z.; Mao, G. Identification of the early cretaceous granitic pluton and tectonic implications in the middle gangdese belt, southern tibet. Front. Earth Sci. 2022, 10, 979313. [Google Scholar] [CrossRef] [Scilit]
- Zheng, W.; Tang, J.; Zhong, K.; Ying, L.; Leng, Q.; Ding, S.; Lin, B. Geology of the Jiama porphyry copper-polymetallic system, Lhasa Region, China. Ore Geol. Rev. 2016, 74, 151–169. [Google Scholar] [CrossRef] [Scilit]
- Bian, S.; Gong, J.; Zuza, A.V.; Yang, R.; Chen, L.; Ji, J.; Yu, X.; Tian, Y.; Yu, Z.; Cheng, X.; et al. Along-Strike Variation in the Initiation Timing of the North-Trending Rifts in Southern Tibet as Revealed from the Yadong-Gulu Rift. Tectonics 2022, 41, e2021TC007091. [Google Scholar] [CrossRef] [Scilit]
- Yang, Z.; Hou, Z.; White, N.C.; Chang, Z.; Li, Z.; Song, Y. Geology of the post-collisional porphyry copper-molybdenum deposit at Qulong, Tibet. Ore Geol. Rev. 2009, 36, 133–159. [Google Scholar] [CrossRef] [Scilit]
- Sun, W.; Zheng, Y.; Wang, W.; Feng, X.; Zhu, X.; Zhang, Z.; Hou, H.; Ge, L.; Lv, H. Geochemical Characteristics of Primary Halos and Prospecting Significance of the Qulong Porphyry Copper-Molybdenum Deposit in Tibet. Minerals 2023, 13, 333. [Google Scholar] [CrossRef] [Scilit]
- Sun, M.; Tang, J.-X.; Klemd, R.; Lin, B.; Tang, P.; Zhang, Z.-B.; Chen, W.; Li, F.-Q.; Qi, J.; Chen, H.; et al. The formation of a giant post-collision porphyry copper system: A case study of the Jiama deposit, Tibet. Geol. Soc. Am. Bull. 2024, 136, 1675–1688. [Google Scholar] [CrossRef] [Scilit]
- Tang, P.; Tang, J.; Lin, B.; Zhou, A.; Li, F.; Fang, X.; Qi, J.; Wang, M.; Xiong, Y.; Xie, Y.; et al. Genesis of the South Pit Deposit in Jiama District, Tibet: Constraints from Geology, Geochronology and Amphibole Geochemistry. J. Earth Sci. 2025, 36, 1479–1492. [Google Scholar] [CrossRef] [Scilit]
- Lin, B.; Tang, J.-X.; Tang, P.; Zheng, W.-B.; Song, Y.; Li, F.Q.; Leng, Q.-F.; Wang, Z.-C.; Qi, J.; Sun, M.; et al. Geology, geochronology, and exploration of the Jiama giant porphyry copper deposit(11 Mt), Tibet, China: A review. China Geol. 2023, 6, 338–357. [Google Scholar] [CrossRef] [Scilit]
- Cooley, T.; Anderson, G.; Felde, G.; Hoke, M.; Ratkowski, A.; Chetwynd, J.; Gardner, J.; Adler-Golden, S.; Matthew, M.; Berk, A.; et al. FLAASH, a MODTRAN4-based atmospheric correction algorithm, its application and validation. IEEE Int. Geosci. Remote Sens. Symp. 2002, 3, 1414–1418. [Google Scholar]
- Marujo, R.F.B.; Fronza, J.G.; Soares, A.R.; Queiroz, G.R.; Ferreira, K.R. Evaluating the Impact of Lasrc and Sen2cor Atmospheric Correction Algorithms on Landsat-8/Oli and Sentinel-2/Msi Data over Aeronet Stations in Brazilian Territory. ISPRS Ann. Photogramm. Remote Sens. Spat. Inf. Sci. 2021, V-3-2021, 271–277. [Google Scholar] [CrossRef] [Scilit]
- Yang, M.; Hu, Y.; Tian, H.; Khan, F.A.; Liu, Q.; Goes, J.I.; Gomes, H.D.R.; Kim, W. Atmospheric Correction of Airborne Hyperspectral CASI Data Using Polymer, 6S and FLAASH. Remote Sens. 2021, 13, 5062. [Google Scholar] [CrossRef] [Scilit]
- Crósta, A.P.; Sabine, C.; Taranik, J.V. Hydrothermal alteration mapping at Bodie, California, using AVIRIS hyperspectral data. Remote Sens. Environ. 1998, 65, 309–319. [Google Scholar] [CrossRef] [Scilit]
- Liu, L.; Zhou, J.; Han, L.; Xu, X. Mineral mapping and ore prospecting using Landsat TM and Hyperion. data, Wushitala, Xinjiang, northwestern China. Ore Geol. Rev. 2017, 81, 280–295. [Google Scholar] [CrossRef] [Scilit]
- Kruse, F.A.; Perry, S.L.; Caballero, A. District-level mineral survey using airborne hyperspectral data, Los Menucos, Argentina. Ann. Geophys. 2006, 49, 83–92. [Google Scholar] [CrossRef] [Scilit]
- Zheng, S.; An, Y.; Shi, P.; Zhao, T. Mapping the Lithological Features and Ore-Controlling Structures Related to Ni-Cu Mineralization in the Eastern Tian Shan, NW China from ASTER Data. Remote Sens. 2021, 13, 206. [Google Scholar] [CrossRef] [Scilit]
- Lyu, C.; Cheng, Q.; Zuo, R.; Wang, X. Mapping Spatial Distribution Characteristics of Lineaments Extracted from Remote Sensing Image Using Fractal and Multifractal Models. J. Earth Sci. 2017, 28, 507–515. [Google Scholar] [CrossRef] [Scilit]
- Sun, T.; Xu, Y.; Yu, X.; Liu, W.; Li, R.; Hu, Z.; Wang, Y. Structural Controls on Copper Mineralization in the Tongling Ore District, Eastern China: Evidence from Spatial Analysis. Minerals 2018, 8, 254. [Google Scholar] [CrossRef] [Scilit]
- Wu, C.; Dai, J.; Zhou, A.; He, L.; Tian, B.; Lin, W.; Zhao, T.; Bai, L. Mapping alteration zones in the Southern section of Yulong copper belt, Tibet using multi-source remote sensing data. Front. Earth Sci. 2023, 11, 1164131. [Google Scholar] [CrossRef] [Scilit]
- Qin, Y.; Zhang, X.; Zhao, Z.; Li, Z.; Yang, C.; Huang, Q. Coupling Relationship Analysis of Gold Content Using Gaofen-5 (GF-5) Satellite Hyperspectral Remote Sensing Data: A Potential Method in Chahuazhai Gold Mining Area, Qiubei County, SW China. Remote Sens. 2022, 14, 109. [Google Scholar] [CrossRef] [Scilit]
- Liu, C.; Qiu, C.; Wang, L.; Feng, J.; Wu, S.; Wang, Y. Application of ASTER Remote Sensing Data to Porphyry Copper Exploration in the Gondwana Region. Minerals 2023, 13, 501. [Google Scholar] [CrossRef] [Scilit]
- Fu, Y.; Cheng, Q.; Jing, L.; Ye, B.; Fu, H. Mineral Prospectivity Mapping of Porphyry Copper Deposits Based on Remote Sensing Imagery and Geochemical Data in the Duolong Ore District, Tibet. Remote Sens. 2023, 15, 439. [Google Scholar] [CrossRef] [Scilit]
- Zhang, X.; Zhao, Z.; Chen, Q.; Chai, W.; Li, Z.; Zhang, G.; Yang, H.; Niu, L. Mapping hydrothermal alteration of the Pulang porphyry copper deposit, SW China, using ASTER and ZY1-02D satellite data. Ore Geol. Rev. 2023, 161, 105605. [Google Scholar] [CrossRef] [Scilit]

Disclaimer/Publisher’s Note: The statements, opinions and data contained in all publications are solely those of the individual author(s) and contributor(s) and not of MDPI and/or the editor(s). MDPI and/or the editor(s) disclaim responsibility for any injury to people or property resulting from any ideas, methods, instructions or products referred to in the content. |
© 2026 by the authors. Licensee MDPI, Basel, Switzerland. This article is an open access article distributed under the terms and conditions of the Creative Commons Attribution (CC BY) license.