


Abstract
The variation features of metallic element grades can reflect the enrichment level of mineral deposits. Thus, quantitative characterization of the spatial patterns of metallogenic elements is fundamental to studying ore-forming processes and implementing mineral exploration. This study applies fractal theory and self-developed MATLAB computational scripts to process Cu grade datasets from 28 drillholes within the Pulang porphyry copper deposit, Yunnan Province. Both rescaled range (R/S) analysis and correlation integral methods were applied to clarify the spatial patterns of Cu grades in drill-cores. The calculated Hurst exponents ranged from 0.510 to 0.636, which demonstrated the persistent variation of Cu grades along the vertical direction of drillholes. This work further explored the correlation between Cu mineralization and fluctuations in correlation dimension (DC), with DC values spanning 0.011–2.873. Results indicate steep fractal gradient zones host high-grade copper ore bodies, and fractal dimension is a robust indicator to trace the migration of hydrothermal fluids. The Hurst exponents of Cu grade sequences correlate strongly with mineralization intensity, and ore-bearing veins extend continuously throughout all sampled drillholes. Accordingly, fractal gradients can be utilized to depict prospective zones for favorable mineralization in uncharted regions. This methodology may be applicable to other structurally controlled mineral deposits where similar fracture-controlled mineralization occurs, though further testing on different deposit types is needed.
1. Introduction
The natural geological processes generally follow nonlinear evolutionary rules and show irregular spatial and temporal distribution features. Porphyry deposits are formed through highly complicated geological processes, accompanied by drastic variations. Controlled by regional tectonics, deterministic geological controls and random events, metallogenic elements display obvious spatial heterogeneity [1,2,3,4]. Therefore, geochemical data analysis is essential for exploring the distribution of metallogenic elements. Nevertheless, the conventional mathematical models and deterministic dynamic theories cannot quantitatively characterize and simulate complex geological behaviors [5,6,7,8]. As the fundamental components of metallogenic systems, metallogenic elements carry key geological information. Analysis of their spatial distributions clarifies orebody emplacement mechanisms and material differentiation caused by geological activities. Meanwhile, such research results can be applied to locate mineral enrichment zones and define ore boundaries, so as to guide field exploration [9,10]. Systematic characterization of metallogenic element spatial patterns advances deposit genesis research and mineral enrichment modeling while delivering actionable guidance for geological prospecting.
Nonlinear analytical methods offer innovative tools to explore the distribution rules of metallogenic elements. As a vital subdiscipline of nonlinear science, fractal geometry focuses on the scaling characteristics of complex natural processes [11,12]. This theory extracts inherent scaling features generated by deterministic geological processes [13,14,15]. Scale-invariance theory now sees widespread adoption in geological research, with representative applications including characterization of rock fractures and pore structures [16,17,18,19,20], faults [4,21], seismic activity [22,23], structural fractures [24,25], metallogenic element distributions [26,27], ore grade [28,29], element migration [30,31], and fluid flow [32,33]. Mathematically, scale-invariance in spatial data sequences indicates consistent system integral properties across observation scales [11]. Thus, fractal dimension, Hurst exponent and other fractal indicators can quantify the evolution of mineralization. The system of metallogenic elements is defined as a typical nonlinear dissipative system, whose complex features are jointly controlled by multiple nonlinear driving factors [34,35]. In practical research, discrete spatial series are the most accessible data reflecting system characteristics. When the interaction between internal factors becomes more complicated, the data sequences will become more chaotic, complicating forecasting the system’s evolutionary trend. Thus, fractal methodologies accordingly quantify elemental data series variability across variable measurement scales.
The Pulang copper deposit hosts intricate fracture networks generated by multistage tectonic activity; orebodies scatter heterogeneously across the deposit, accompanied by highly variable Cu grades in 3D space. This study applies fractal theory to resolve depth-dependent Cu grade variability within drillholes and map copper grade spatial patterns across the mining district. In view of the distribution and scaling properties of metallogenic elements, this work establish a fractal model to interpret the correlation between fractal features and mineralization, and constrain the probable migration pathways of hydrothermal fluids. The research outcomes can enhance the cognition of metallogenic mechanisms and improve the accuracy of mineral prospecting. This approach can verify current exploration targets and facilitate the discovery of new prospective areas.
We only adopt Cu grade data to conduct fractal modeling in this study due to commercial data confidentiality restrictions of the mining enterprise. Nevertheless, microscopic petrographic observations of drill samples prove that steep fractal gradient zones correspond to intensive multi-sulfide vein filling and widespread hydrothermal alteration, which jointly record the migration and precipitation of ore-forming fluids. Such co-occurrence characteristics demonstrate that the fractal variations are intrinsic signals of the complete mineralization system, instead of simple response to single high copper values. Additionally, this method is also applicable to analyze the distribution rules of various other structurally controlled mineral deposits, and multi-element geochemical or infrared reflectometry tests can be integrated in follow-up work to further strengthen the reliability of fractal evidence.
2. Regional Geological Setting
Eastern Tibet’s tectonic framework comprises four micro-continental terranes, the Songpan-Garze, Yidun, Qiangtang and Lhasa blocks, in east-to-west order [36,37] (Figure 1). The Yidun terrane strikes NNW, bounded east by the Garze-Litang suture and west by the Jinshajiang suture zone. These two major sutures were formed as two separate Paleo-Tethys oceans ceased expansion and closed, with the former event occurring in the Late Paleozoic and the latter in the Middle-Late Triassic [38,39,40]. The nearly north-trending Xiangcheng-Geza fault cuts the Yidun terrane into two tectonic units: Yidun arc and Zhongza massif [41]. Paleozoic metasedimentary sequences represent the oldest rock units in the Zhongza massif. Fossil groups preserved in these rocks show similarities to those in strata of the Longmenshan thrust nappe belt located west of the Yangtze block. The breakup event was linked to the spreading of Garze-Litang Ocean, whose generation stemmed from the activity of the Emeishan mantle plume in the Late Permian Epoch [42,43,44].
The westward subduction of the Garze-Litang oceanic plate beneath the Zhongza massif during the Middle-Late Triassic led to the development of the Yidun arc [37,39]. Located in the southern part of the Yidun arc, the Zhongdian arc hosts abundant late Triassic porphyries [45,46,47]. Regional structural lineaments trend dominantly NNW, corresponding to compressive belts produced by the Garze-Litang oceanic crust subduction and collision; these structures represent primary ore-controlling frameworks. Several large porphyry deposits with economic value, including Pulang, Chundu and Lannitang, are hosted in these porphyries [48]. These deposits are formed in identical regional tectonic environments. The emplacement of ore-bearing porphyries is obviously controlled by the structure. Prolonged movement of NNW-striking deep faults within the Zhongdian arc governs the intrusion of rock belts. The secondary fracture and fracture system are a good channel for accumulation and migration of ore-bearing fluids. The development intensity of such fracture systems directly governs porphyry deposit scale, mineralization continuity, and grade persistence features quantified later via fractal parameters.
As a super-large porphyry copper deposit, the Pulang deposit occurs in the Zhongdian arc, which lies within Sanjiang Tethyan orogen [49,50]. The intersection zone of NNW Heishuitang fault and NE Quanganlida fault dominates the intrusive location and morphological characteristics of the Pulang compound porphyry bodies, thus controlling the occurrence of the ore body. The NNW trending faults control the overall distribution of ore-bearing porphyry belts across North and East Pulang. Interconnected, dense fracture networks along these major faults create sustained fluid transport channels, producing vertically continuous Cu mineralization with strong long-range memory effects in vertical grade series. Geometrically, drillholes penetrating major NNW fault zones consistently yield higher Hurst exponent values (HRS) and elevated correlation dimension (DC) gradients. The persistent upward/downward grade correlation captured by Hurst exponents directly reflects unobstructed hydrothermal fluid migration along these through-going NNW faults, corresponding to continuous high-grade vein clusters in drill logs. Therefore, the shallow ore-bearing fracture (large vein ore body) extends to the deep, which is related to the trend of mineralization extending and enriching to the deep, so there may also be porphyry ore bodies in the deep. The district is composed of three deposits: the largest South Pulang deposit, East Pulang and North Pulang [51,52] (Figure 2). The occurrence and shape of ore bodies are strictly controlled by intersection zone of NNW and NE faults. The main orebody in the South Pulang area is in a large lenticular shape and extends northwestward. The NE trending fault structures in the mining area also form a series of secondary fractures in the same direction, and the ore bodies in East Pulang are controlled by them and are in the shape of large veins. The NE trending faults form relatively segmented, compartmentalized fracture networks with limited lateral connectivity. Correspondingly, most East Pulang drillholes exhibit lower Hurst exponents (HRS) and gentler correlation dimension (DC) vertical gradients compared to North Pulang boreholes cutting major NNW fault zones.
The East Pulang and North Pulang deposits are mainly investigated in this study. Under the influence of the complex tectonic evolution background of the Zhongdian arc, East Pulang has developed dense fractures in the rock mass and both sides of the faults because of multiple emplacement of the rock mass and prolonged evolution of deep and large faults. The fracture zones consisting of dense fractures provide good ore guiding and ore storage space for migration of hydrothermal fluid and precipitation of ore-forming materials. The development degree of fractures directly affects the scale of porphyry deposits.
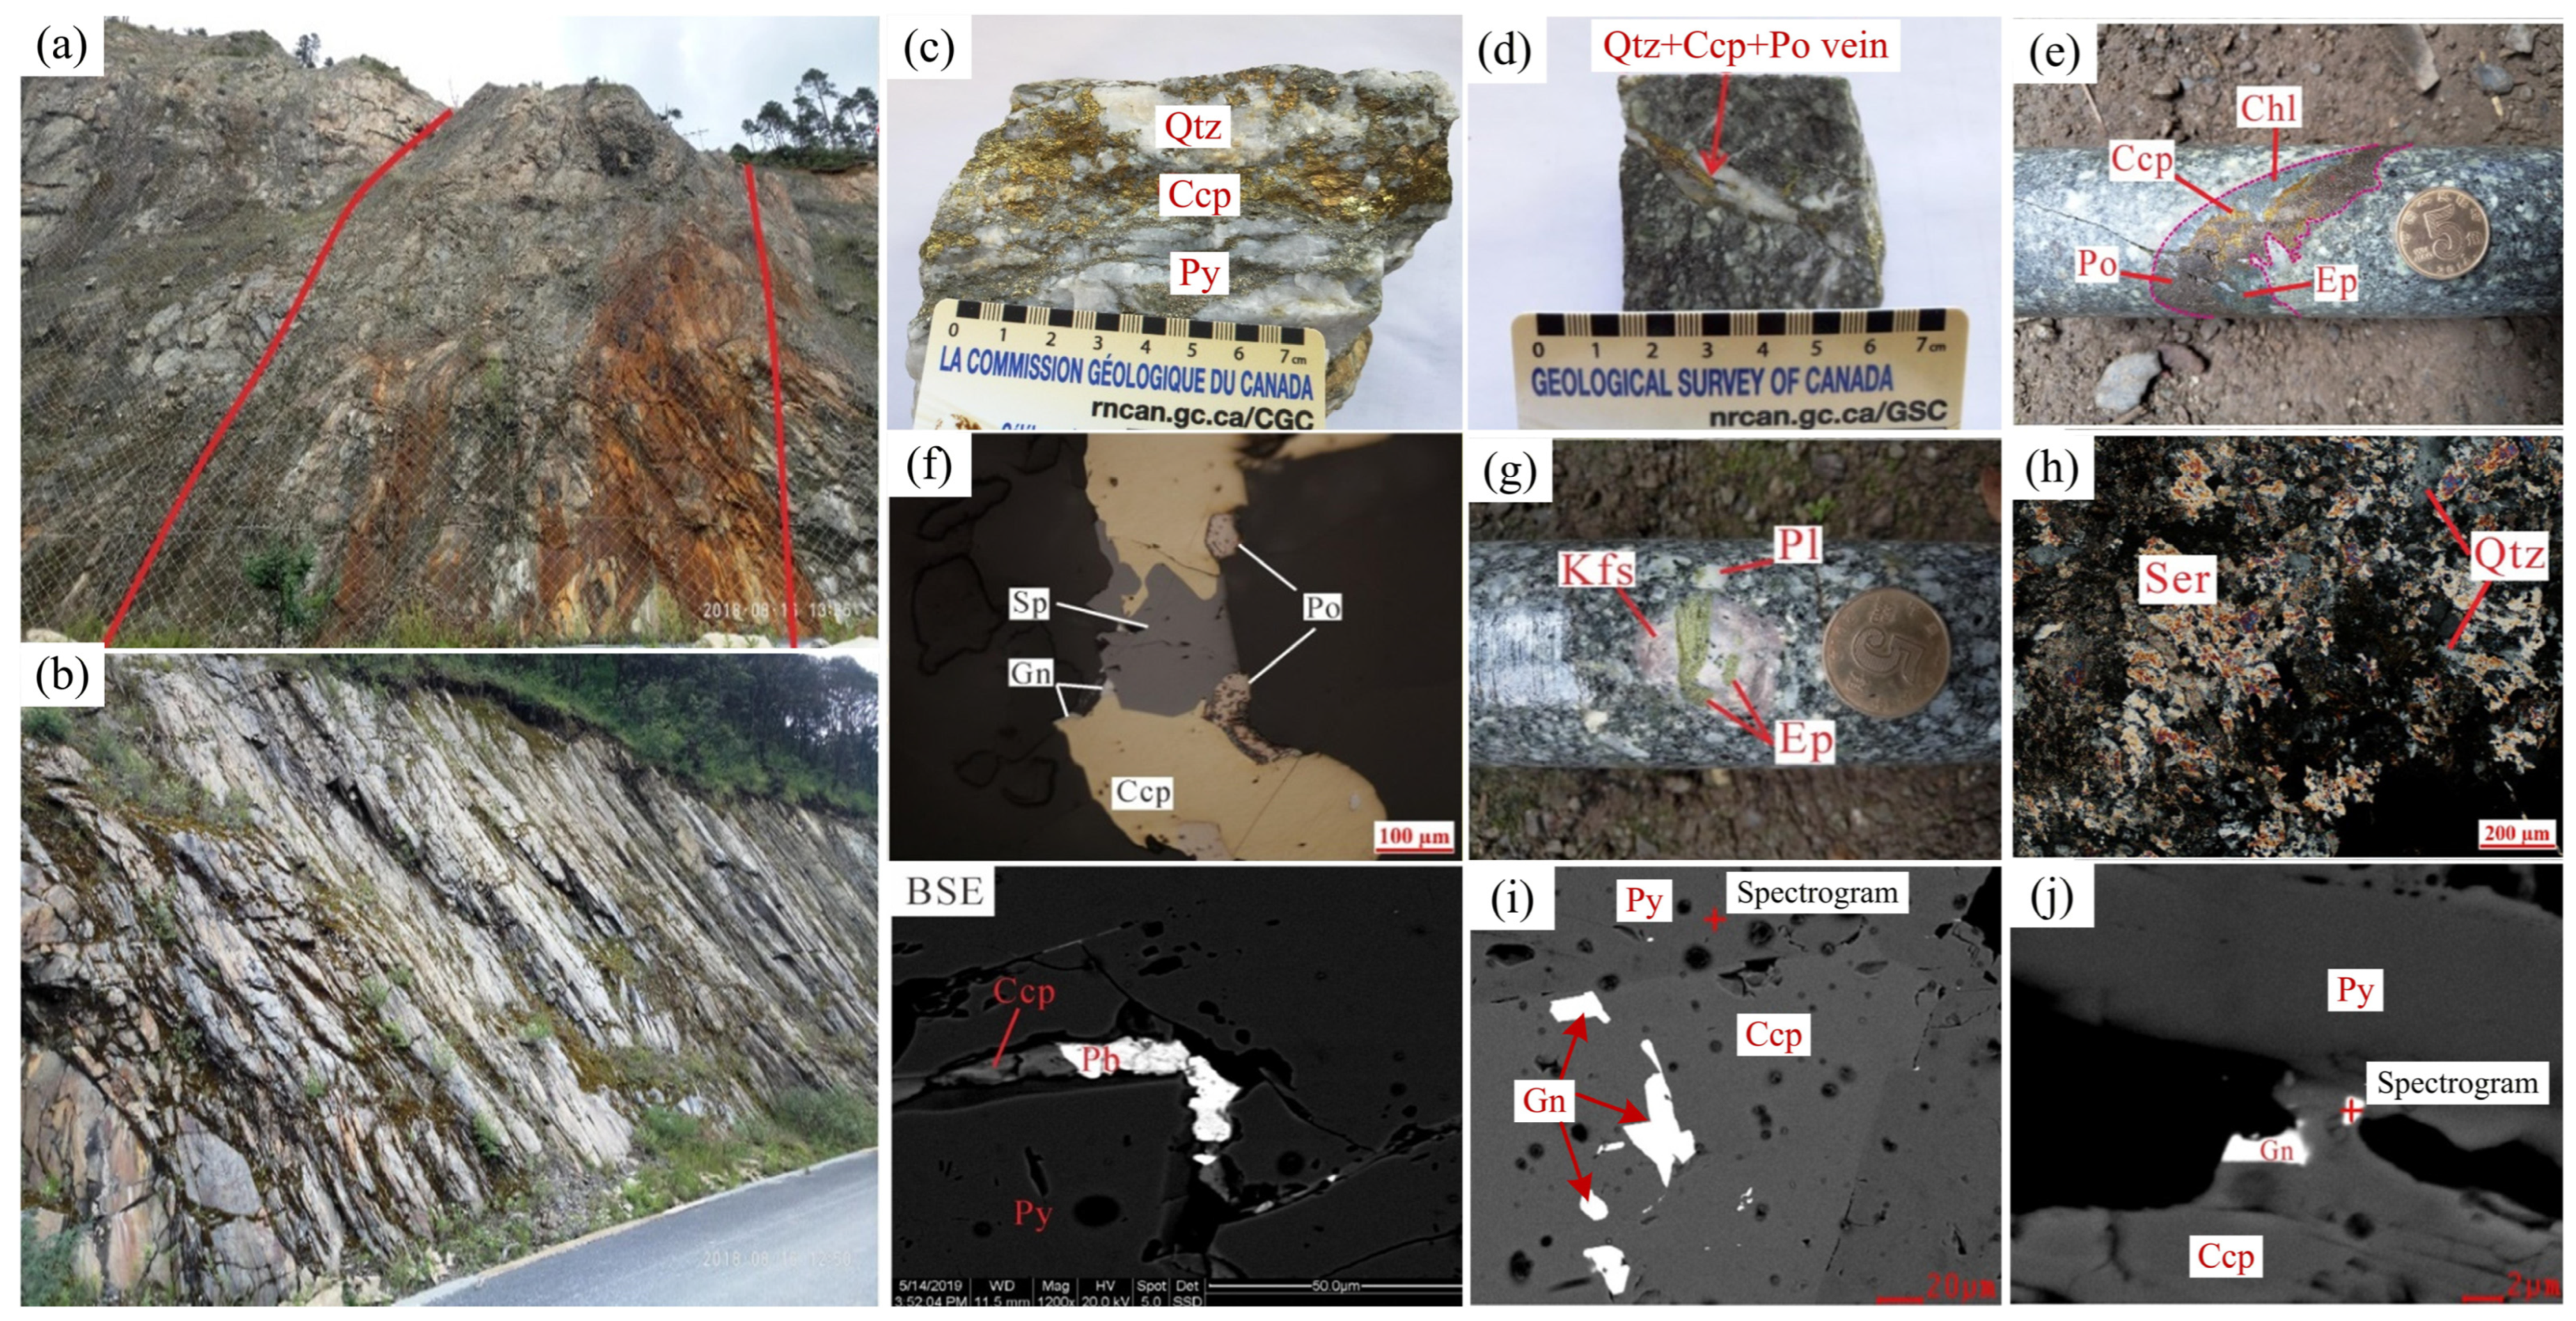
The fractures in East Pulang are mainly concentrated in the ore-bearing porphyry, and the number of fractures is reduced from the center of the rock mass to the outside in terms of distribution of the fractures. From the perspective of the output morphology, the fractures in various directions of East Pulang are relatively developed, but there are differences in different sections. Generally, most of the fractures are in the form of crisscross and interspersed network veins, and the width is mostly between 0.1 and 5 cm. The fracture is mainly filled with quartz, metal sulfide, potash feldspar, chlorite, pyrite, pyrrhotite, sphalerite, galena, sericite and epidote [53] (Figure 3).
Figure 1.
Regional tectonic map of Yidun arc (a) and schematic geological sketch showing Zhongdian arc (b) (revised from Leng et al. [54]). (TTD: Tibetan Tectonic Domain, YB: Yangtze block) Reproduced with permission from [Leng et al.], [Journal of Earth Science]; published by [Springer Nature], (2025).
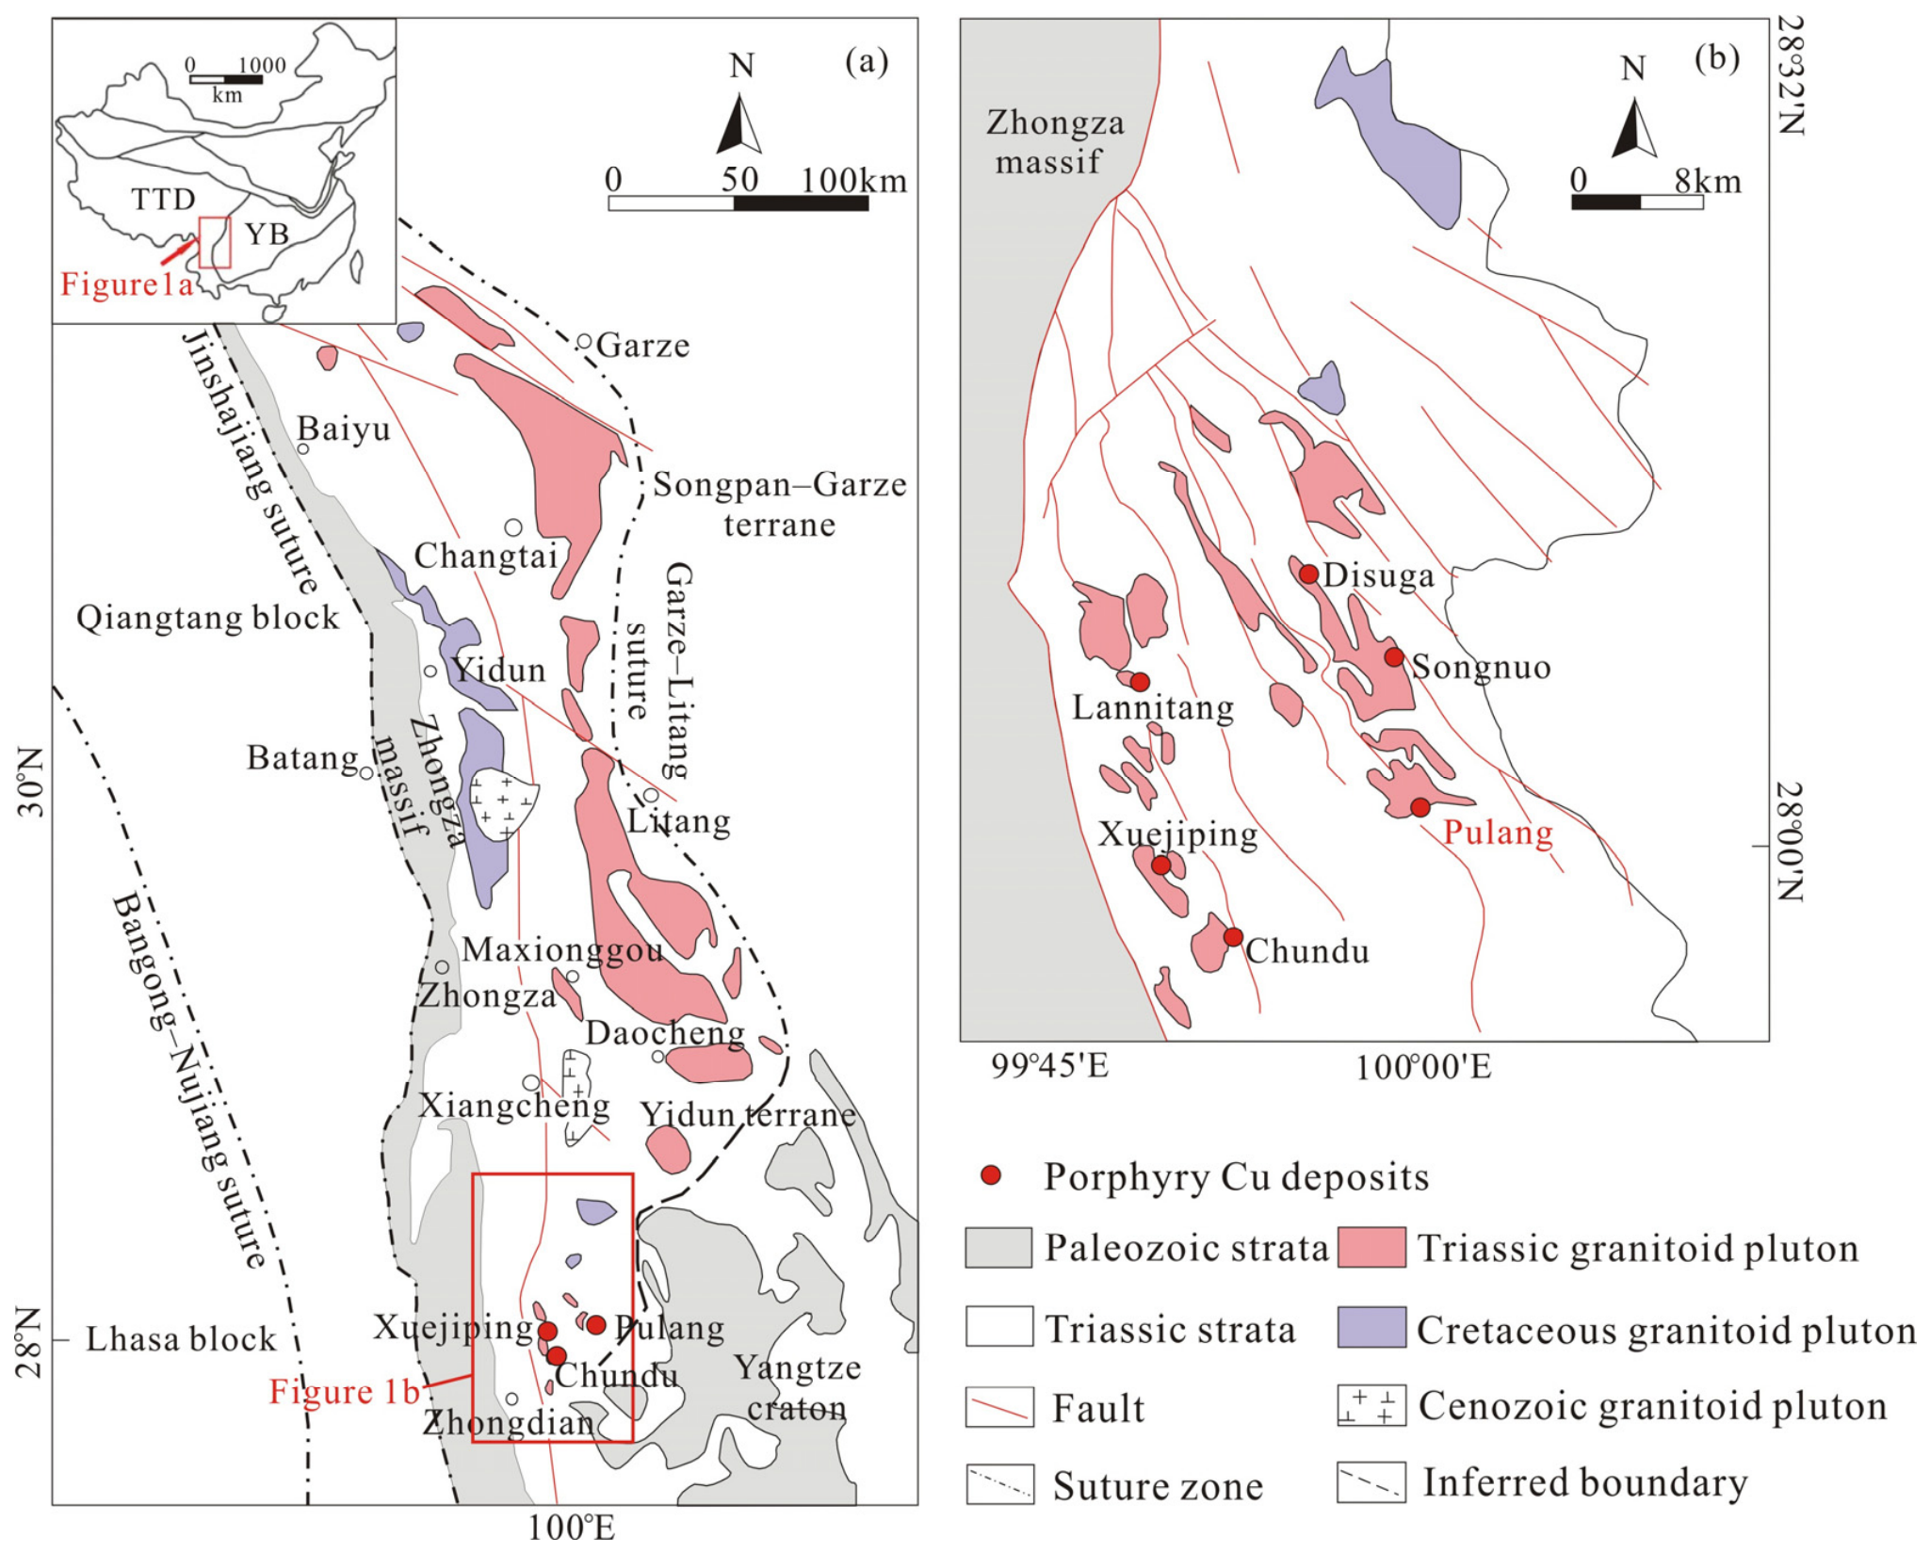
Figure 2.
Simplified geologic sketches of Pulang copper deposit (a), North Pulang (b) and East Pulang (c) (revised from Xia et al. [51]). Reproduced with permission from [Xia et al.], [Journal of Earth Science]; published by [Springer Nature], (2021).
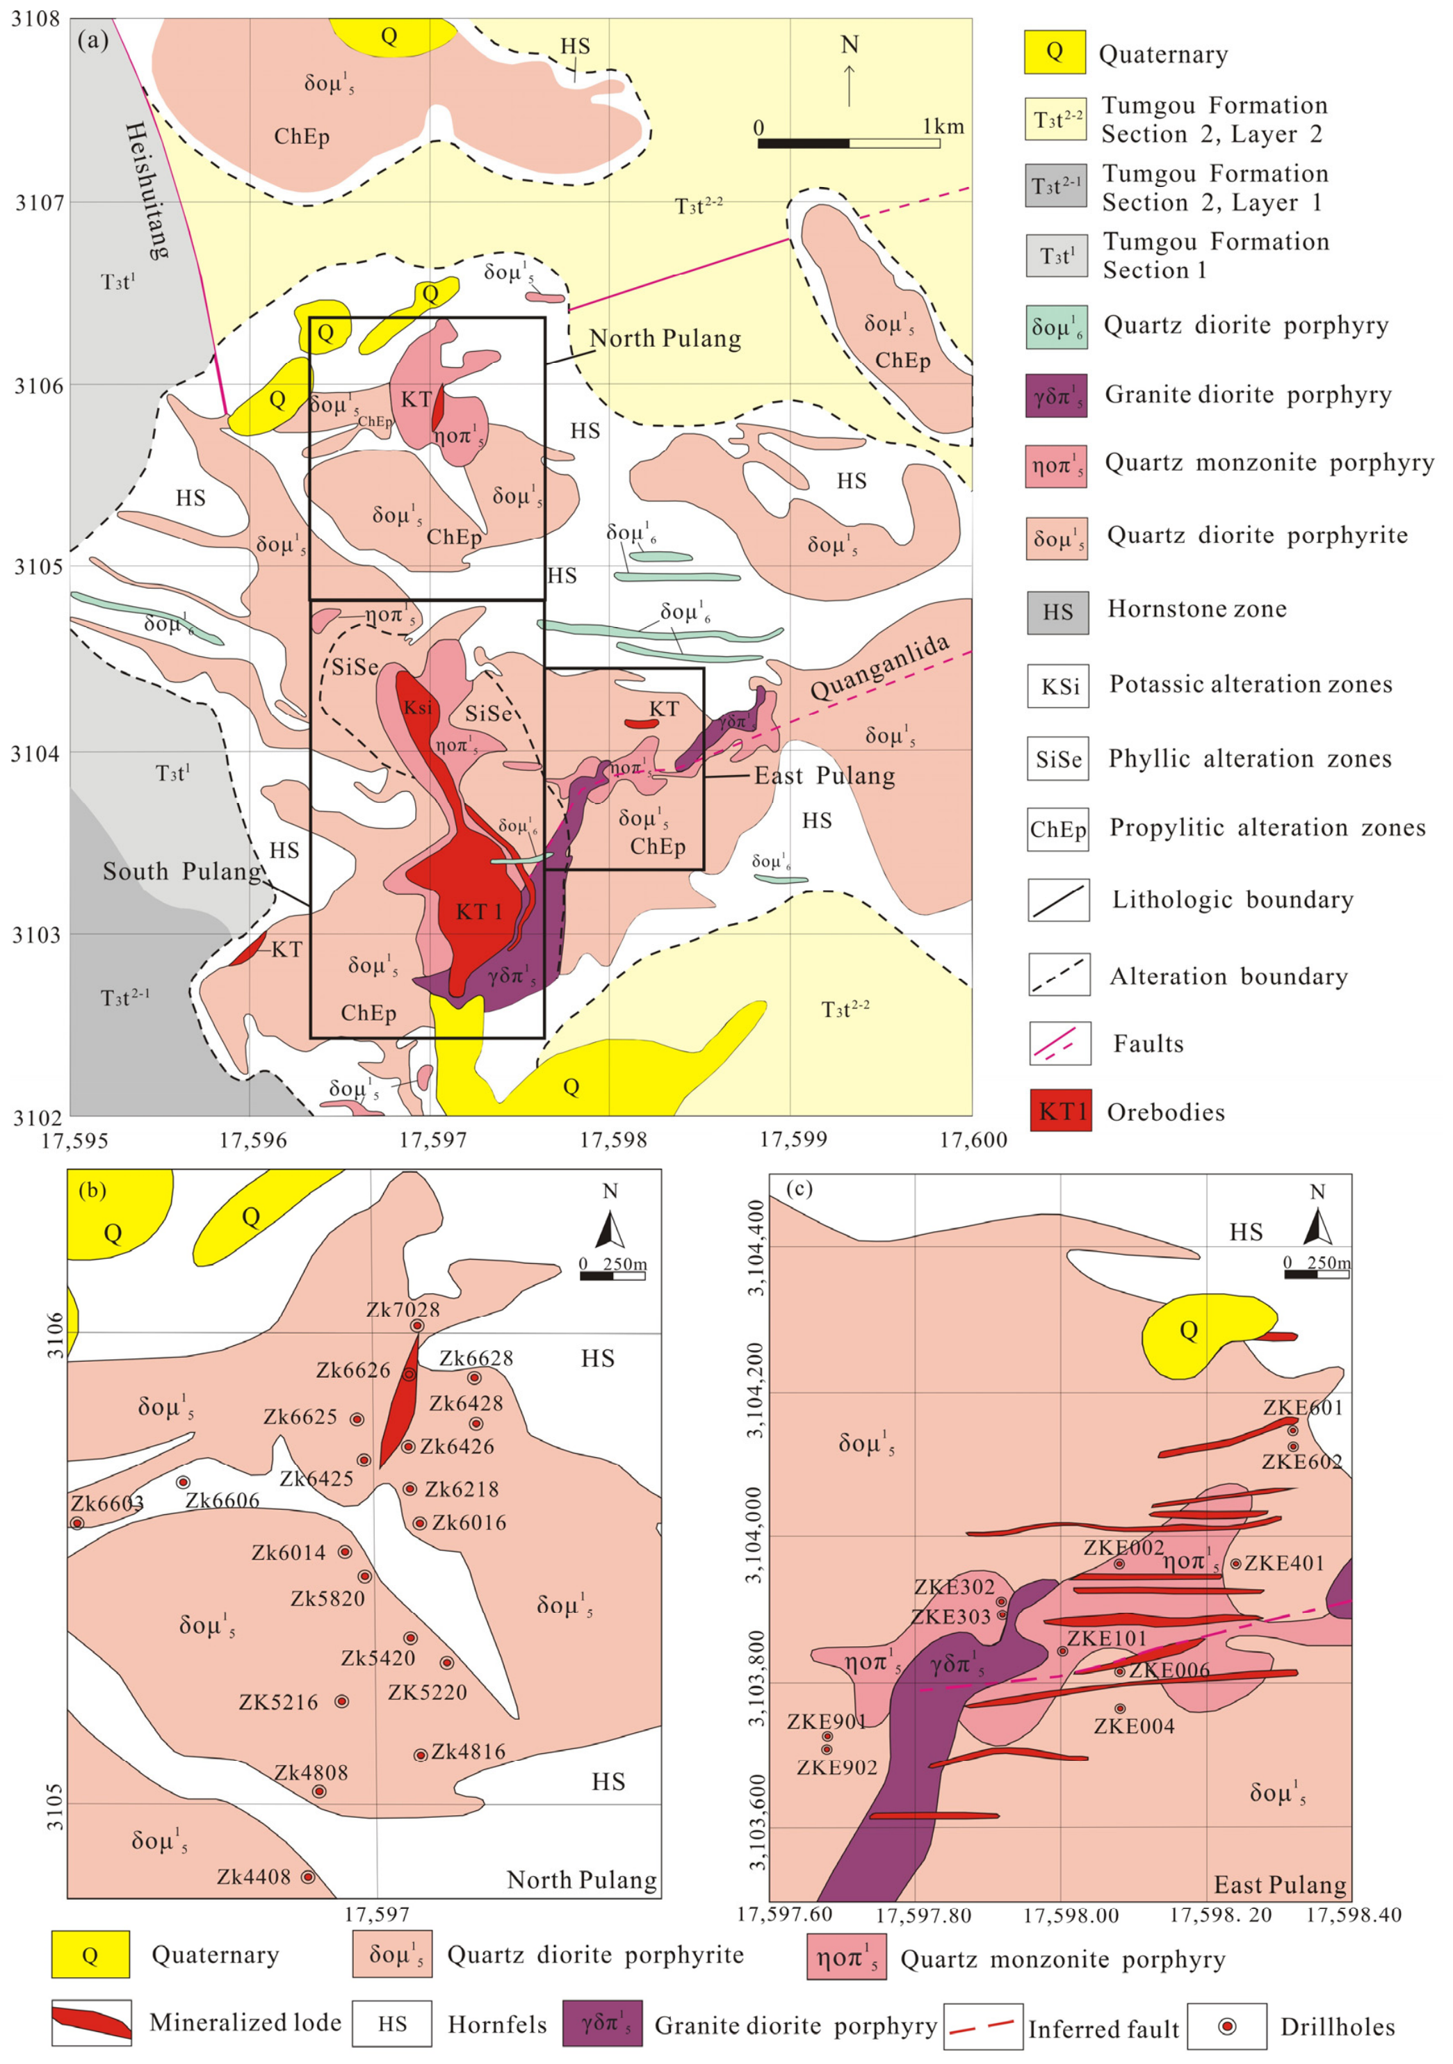
Figure 3.
(a) Fault fracture zone; (b) fracture development and rock fragmentation in tumugou formation; (c) quartz + chalcopyrite + pyrite vein; (d) quartz + pyrrhotite + chalcopyrite vein; (e) chalcopyrite + pyrrhotite + chlorite + epidote veins in quartz diorite porphyry; (f) pyrrhotite is isolated; galena embays chalcopyrite, and chalcopyrite predates galena; (g) plagioclase phenocrysts exhibit epidotization and K-feldspathization in quartz diorite porphyry; (h) sericitization with progressively increasing alteration intensity in hornfels; (i) scanning electron microscope (SEM) image of pyrite; (j) scanning electron microscope (SEM) image of molybdenite. BSE: backscattered electrons; Qtz: quartz; Ccp: chalcopyrite; Py: pyrite; Po: pyrrhotite; Chl: chlorite; Ep: epidote; Sp: sphalerite; Gn: galena; Kfs: K-feldspar; Pl: plagioclase; Ser: sericitization; Pb: lead.
3. Methodology
3.1. Data Collection
Core sampling covered 28 drillholes spanning East and North Pulang, yielding a total of 4064 rock core samples (drillhole distribution mapped in Figure 2b,c). The Cu concentrations were derived based on these core samples. The iodine–fluorine combined oscillopolarography was adopted by the laboratory belonging to the Third Geological Team of Yunnan Bureau of Mineral Resources to test copper and its coexisting elements, and the relative testing error was controlled within 7%. Two fractal approaches, correlation integral and rescaled range method, were utilized to derive correlation dimensions for each drillhole’s grade sequence and analyze their spatial variation. All numerical computations and subsequent analytical procedures were implemented via self-programmed MATLAB V6.7 scripts.
3.2. The Analysis of Fractal Correlation Dimension
The Grassberger–Procaccia correlation integral algorithm was originally proposed to quantify the dimensionality of strange attractors in reconstructed phase spaces, and the reliability of calculated correlation dimension DC highly depends on three critical preprocessing parameters, which are fully documented as follows.
- (1)
- Determination of embedding dimension (m): The Cao algorithm was adopted to calculate the minimum embedding dimension for each Cu grade depth sequence [55]. We gradually increased the embedding value from m = 1 upwards until the indicator E1(m) reached stable convergence and E2(m) ≈ 1. The converged stable embedding dimension was selected as the optimal reconstruction dimension for each borehole dataset.
- (2)
- Selection of similarity radius R range and step size: The similarity radius R was sampled evenly on a logarithmic scale to avoid uneven point distribution in the log–log plot. The minimum radius rmin was set to the minimum Euclidean distance between any two reconstructed phase points, and the maximum radius rmax was defined as one-third of the maximum inter-point distance within each reconstructed dataset. A total of 50 equal logarithmic step points were generated between rmin and rmax to guarantee dense sampling of correlation integral values C(N,R).
- (3)
- Identification of linear scaling region: After plotting logC(N,R) versus logR, we excluded the front small-R noisy segment (the first 10% of radius points) and the rear saturation flat segment (the last 10% of radius points). The intermediate continuous linear segment with R2 > 0.98 was recognized as the effective scaling interval, and the slope of linear least-squares fitting within this interval was taken as the final correlation dimension DC.
Grassberger and Procaccia [56] established the core formula of correlation integrals. For a Cu grade depth sequence containing N discrete sampling points embedded in the m-dimensional reconstructed Euclidean phase space, we first compute the Euclidean distance between every pair of phase vectors. The Heaviside step function H counts the number of point pairs whose distance is less than the preset similarity radius R, as expressed in Equation (1):
where , represents the Euclidean distance between two reconstructed phase points yi and yj. The correlation integral C(N,R) is calculated by Equation (2):
The correlation dimension DC is acquired via linear regression fitting on the identified effective linear scaling region of the logC(N,R)–logR curve. This study calculates DC values for all drillhole Cu geochemical sequences based on the above standardized parameter rules, and the depth-dependent fluctuation of DC is used to accurately locate high-grade Cu-enriched segments in each borehole.
3.3. Rescaled Range Method
Hurst initially introduced the rescaled range technique back in 1951 [57]. The Hurst exponent quantifies long-range correlation and nonlinear persistent features existing in time-series datasets. Numerous geologists have utilized this algorithm to conduct research in various geological branches [58,59,60,61,62]. For Cu grade data of one drillhole, we separate the full sequence to calculate the range and standard deviation of each subsequence and work out their quotient. Such segmentation circulates until every split subsequence merely includes two concentration points. The average ratio (Rτ/Sτ)average of all subsequences is then derived using Equation (3).
As Turcotte [28] described, linear regression between log(τ) and log(R/S) yields the slope equal to the Hurst exponent H.
Equation (4) defines the formula for calculating subsequence range R(τ):
Equation (5) corresponds to the standard deviation calculation:
Equation (6) expresses the cumulative residual series of the grade sequence:
ξ(t) stands for the average Cu grade of core samples within the subsequence τ at sampling point t, and this mean value is calculated via Equation (7):
According to Turcotte [28], a mathematical relationship exists between Euclidean dimension E, Hurst index HR/S and fractal dimension DR/S, which is formulated as Equation (8):
D = (E + 1) − H
Hurst exponent values are normally confined to the interval of 0–1. A value of H = 0.5 implies random walk and uncorrelated white noise features. Sequences with H < 0.5 fall into fractional Gaussian noise and display anti-persistent variation; sequences with H > 0.5 are fractional Brownian motion with progressively enhanced persistence [63]. The present study utilizes rescaled range analysis to characterize spatial pattern features of copper concentrations across the Pulang mining area.
It should be noted that rescaled range (R/S) analysis is sensitive to the length of grade sequences, and short sampling sequences tend to generate biased Hurst exponent estimates [58]. In this paper, individual boreholes possess relatively limited sample quantities. To eliminate the adverse impact of insufficient data volume on calculation reliability, we implemented two standardized preprocessing measures for all short sequences before regression: (1) We retained only continuous intact depth segments without missing samples for R/S fitting and discarded discontinuous broken sampling intervals to avoid artificial sequence distortion caused by blank depth points. (2) We adopted a multi-segment averaging strategy: the full grade sequence was split into multiple subintervals with equal length, the Hurst exponent of each subsegment was calculated separately, and the final HRS value of the borehole was taken as the average of valid subsegment results to reduce single-sequence bias.
3.4. Preprocessing and Precondition Tests for Fractal Modeling
Fractal analysis methods generally require the input data sequence to satisfy certain statistical stationarity conditions, particularly for the application of fractional Brownian motion (fBm) models. Unprocessed raw drillhole Cu grade data usually contains obvious depth-dependent long-term trends, abnormal high-grade outliers and skewed distribution, which will severely bias the calculated Hurst exponent and correlation dimension values. To eliminate such systematic errors, we implemented standardized preprocessing and stationarity diagnosis for all raw Cu sequences before fractal calculation: (1) Logarithmic transformation: All Cu grade values were transformed by natural logarithm. Log-transformation converts log-normal grade data into approximate Gaussian sequences, satisfying the core marginal distribution premise of fBm-based fractal analysis. (2) Detrending: Linear least-squares detrending follows the standard geochemical time-series procedure outlined in Chamoli et al. [58]. (3) Standardization: Each detrended grade series was standardized to zero mean and unit variance to eliminate the interference of different magnitude ranges between distinct boreholes. All the above preprocessing and inspection steps are uniformly applied to all the borehole grade datasets in this paper, ensuring the reliability of all subsequent fractal parameter results.
4. Results and Discussions
4.1. The Analysis of Correlation Integrals
The Cu grades of drill-core samples fluctuated between 0.001% and 2.210% in North Pulang, whereas, they were from 0.001% to 2.453% for East Pulang. The correlation dimension (DC) values calculated from North Pulang drillhole data are 0.011–2.873 (Table 1), and those of East Pulang ranged from 0.011 to 2.513 (Table 2). As documented by Turcotte [28], correlation dimension theoretically varies within 0 to 3.0, meaning the dataset from this study complies with the standard theoretical scope. Graphic profiles of multiple representative drillholes were drawn to visualize how correlation dimension changes synchronously with vertical copper grade.
Table 1.
Fractal dimensions and Hurst coefficients acquired from Cu grades of 16 drillholes in North Pulang.
Table 2.
Fractal dimensions and Hurst coefficients acquired from Cu grades of 12 drillholes in East Pulang.
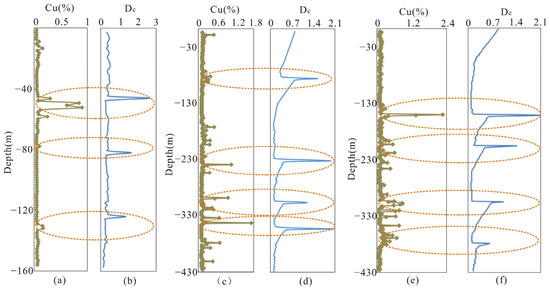
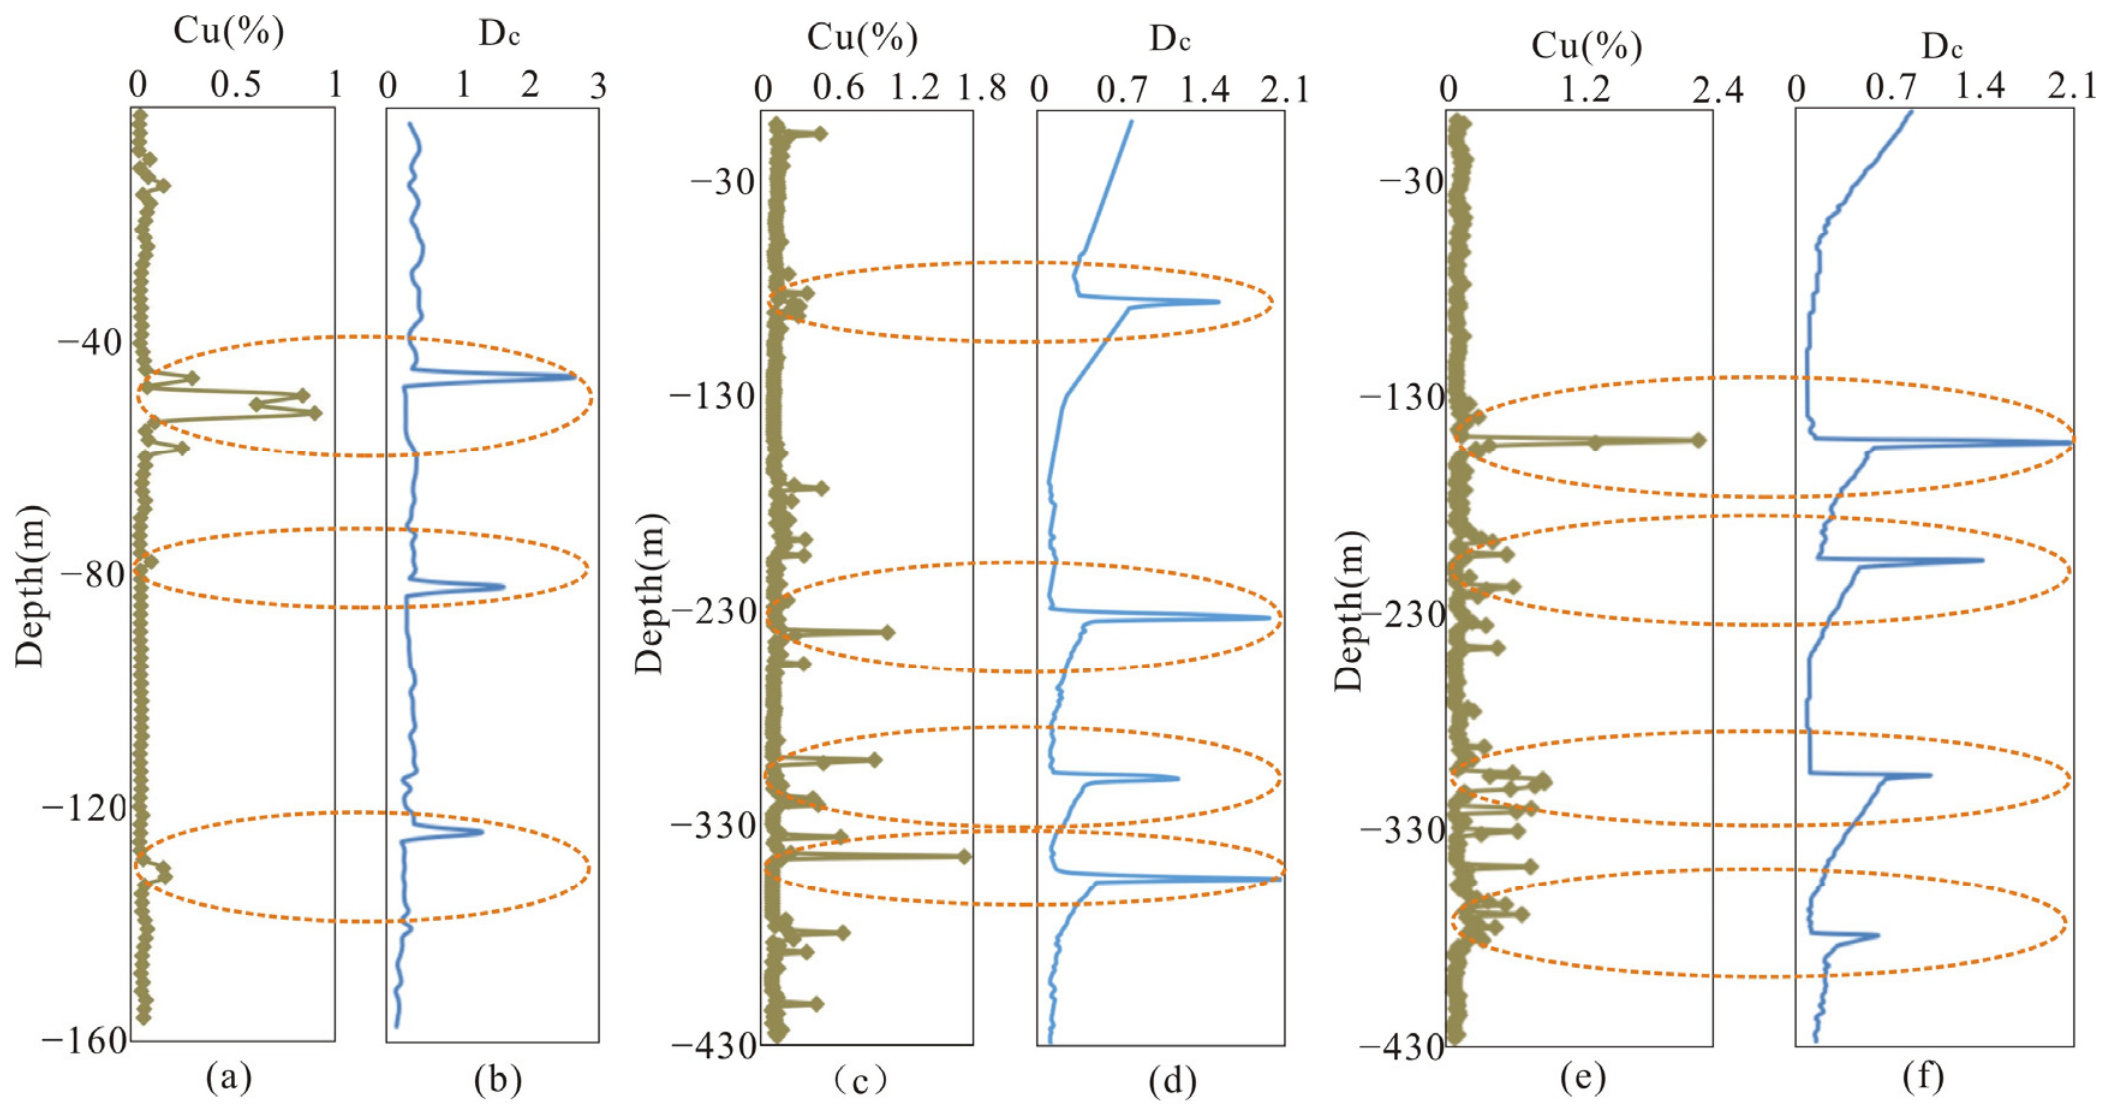
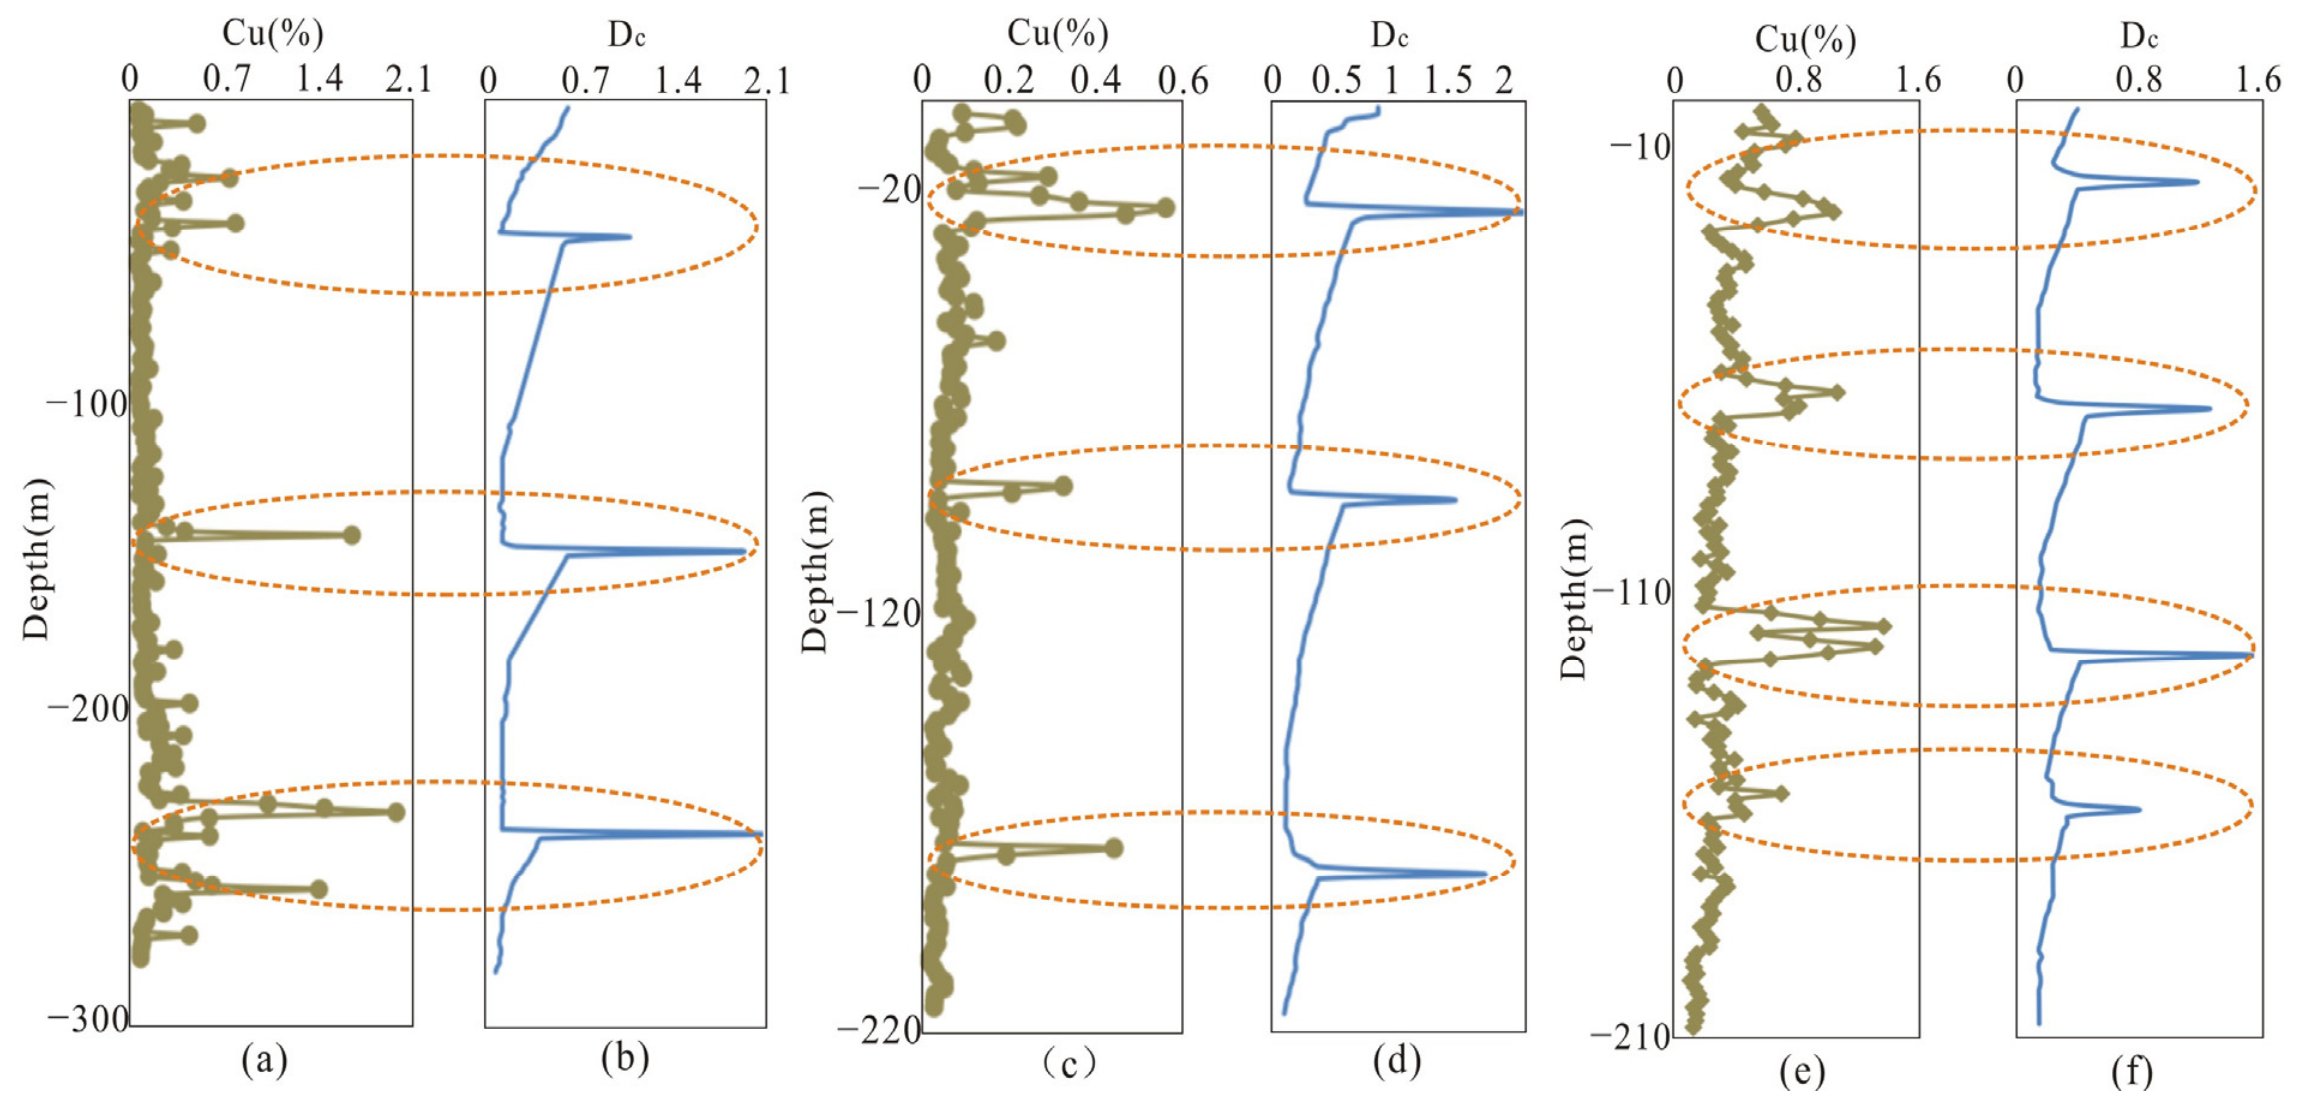
For drillhole ZKE601, the vertical variation curves of Cu grades and DC are plotted in Figure 4a,b. Three obvious copper-rich sections can be observed at −45 to −60 m, −76.5 to −79.5 m, and −129 to −133.5 m. For each mineralized interval, we calculate the vertical fractal gradient (ΔDC/Δz, where ΔDC is the total variation of correlation dimension over a depth interval Δz); steep absolute fractal gradient values indicate rapid spatial shifts in the self-similar clustering of Cu grade anomalies. Field core logging and thin-section petrography from these high-gradient zones confirm some consistent geological traits: (1) fracture density rises from barren intervals to steep gradient zones, forming crisscross network vein systems filled with chalcopyrite, pyrite and quartz (Figure 3a–e), with steep gradient zones hosting densely interlaced vein networks; (2) hydrothermal alteration intensity amplifies markedly, with pervasive K-feldspathization, sericitization and chlorite–epidote alteration overprinting the host porphyry in steep gradient intervals (Figure 3g,h). For drillhole ZKE902, the variations of Cu content and DC are illustrated in Figure 4c,d, with high-grade intervals identified at −72 to −91.5 m, −225 to −255 m, −300 to −321 m, and −334.5 to −346.5 m. Figure 4e,f correspond to drillhole ZKE002, where copper mineralization develops within −139.5 to −156 m, −196.5 to −223.5 m, −300 to −324 m, and −364.5 to −384 m. Figure 5a,b record the grade and DC fluctuation of ZKE401, whose copper enrichment zones are −24 to −48 m, −139.5 to −148.5 m, and −231 to −259.5 m. Figure 5c,d show the grades and DC profiles of ZK6428, with copper enrichment zones distributed at −15 to −27 m, −85.5 to −96 m, and −172.5 to −184.5 m. The Cu concentration variations and associated DC of drillhole ZK6625 are shown in Figure 5e,f. Zones of Cu concentrations are situated at the depth interval of −9 to −27 m, −60 to −72 m, −114 to −124.5 m, and −150 to −159 m.
Figure 4.
Correlation dimensions shift with vertical Cu grade variations. For drillhole ZKE601, Figures (a,b) depict depth profiles of copper grades and the corresponding evolution of correlation dimensions; drillhole ZKE902’s vertical Cu distribution and its coupled correlation dimension alterations are presented in (c,d); (e,f) record vertical copper concentration variations alongside concurrent correlation dimension changes in drillhole ZKE002.
Figure 5.
Correlation dimensions shift with vertical Cu grade variations. For drillhole ZKE401, Figures (a,b) depict depth profiles of copper grades and the corresponding evolution of correlation dimensions; drillhole ZK6428’s vertical Cu distribution and its coupled correlation dimension alterations are presented in (c,d); (e,f) record vertical copper concentration variations alongside concurrent correlation dimension changes in drillhole ZK6625.
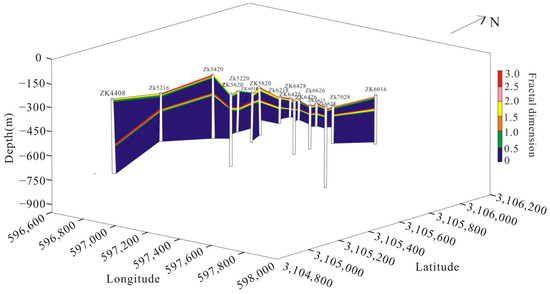
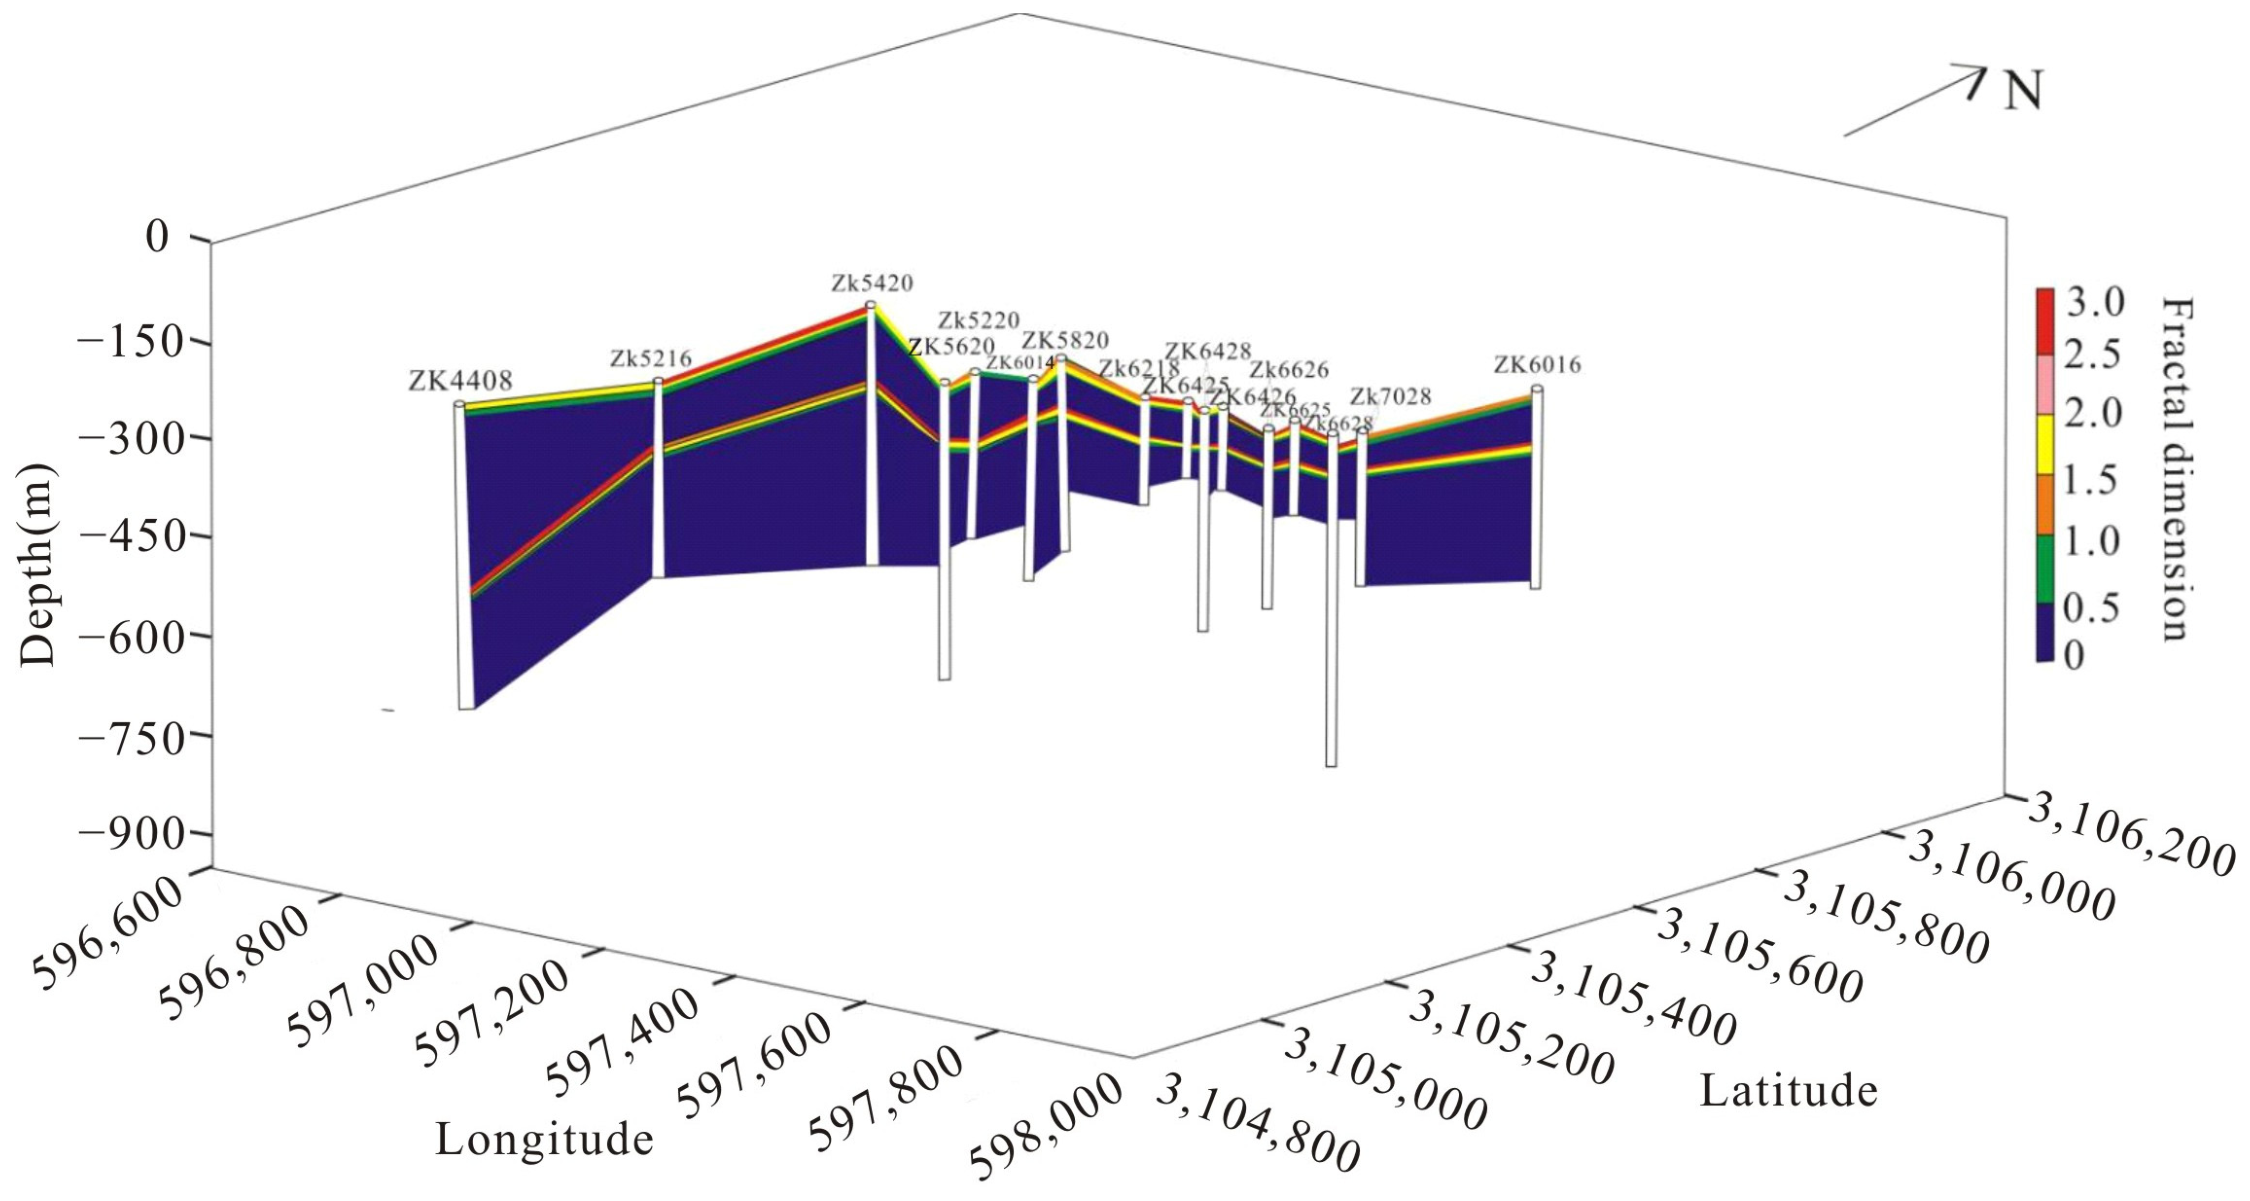
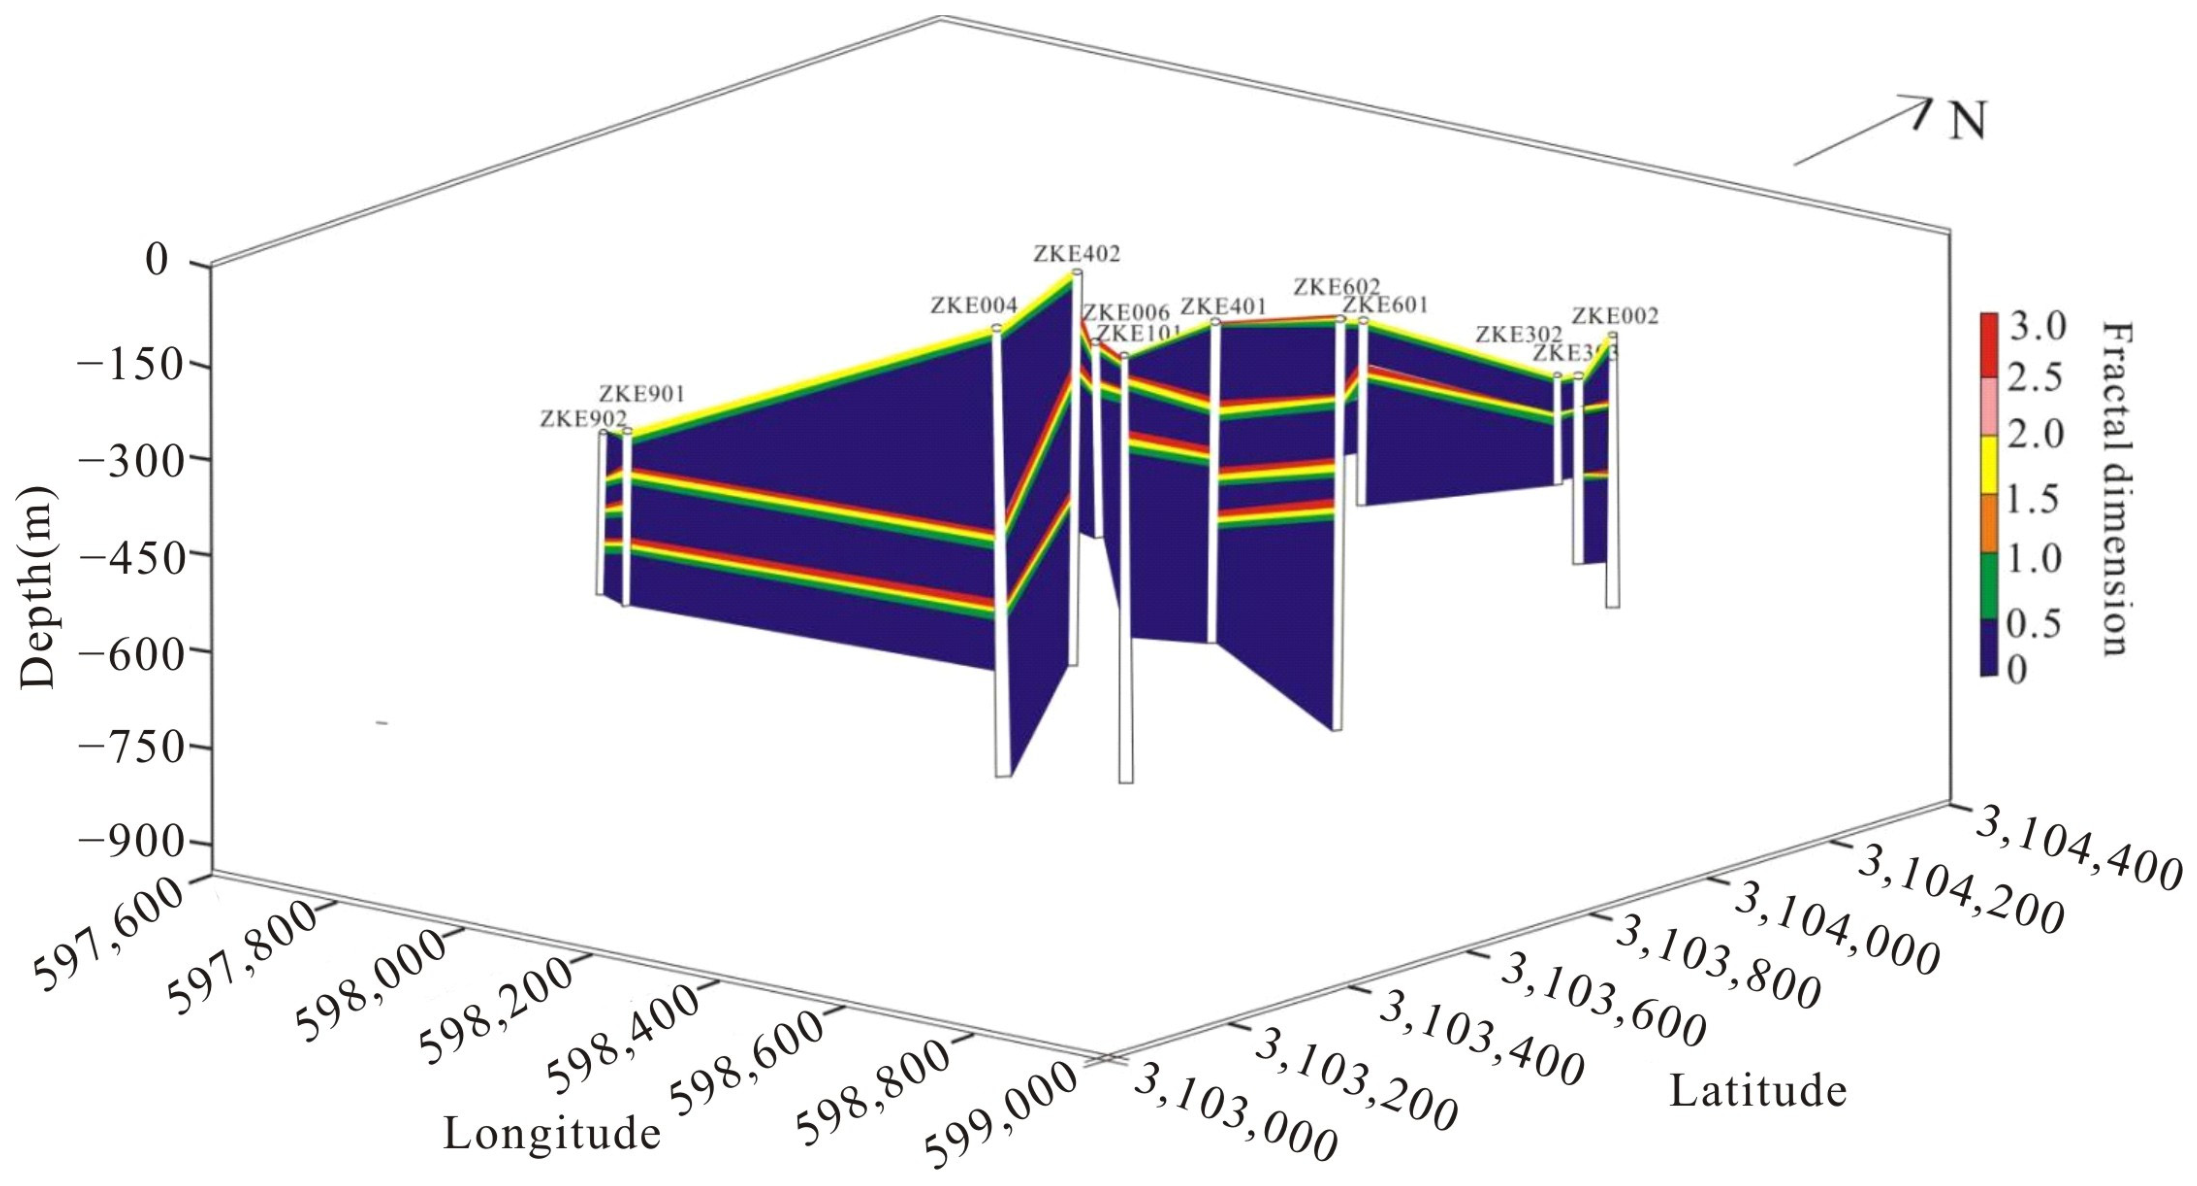
Figure 6 and Figure 7 are vertical equal fractal dimension contour maps of the North Pulang and East Pulang mining areas, respectively, which realize lateral interpolation of fractal dimension values between discrete boreholes at consistent depth layers. To generate geologically reasonable, non-turbulent contour lines and avoid unreasonable spatial jumps of fractal parameters caused by simple point-to-point linking, the natural neighbor interpolation algorithm [64] was adopted for horizontal interpolation at each fixed depth slice. This interpolation method is widely applied in geological contour mapping; it only uses the natural adjacent borehole sample points within the local Voronoi domain for weighted fitting, without extrapolating values beyond the actual borehole distribution range, which eliminates fictitious fractal gradients in blank areas lacking drillhole constraints. The interpolation weighting fully follows the vertical fractal dimension variation trend of adjacent boreholes at identical depth, strictly matching the spatial control of fault structures and vein distribution in the study area, and guarantees that the contour trends comply with regional metallogenic geological regularities. The contour visualization intuitively reveals the continuous spatial variation of fractal parameters across the whole mining area, establishes an integrated 3D spatial framework of Cu mineralization, and reduces the uncertainty risk of blind prospecting target delineation.
Figure 6.
Contour map of interpolated correlation dimension values along vertical depth for all drillholes in North Pulang.
Figure 7.
Contour map of interpolated correlation dimension values along vertical depth for all drillholes in East Pulang.
Figure 2c shows inferred fault structures near drillholes ZKE006 and ZKE101, which implies continuous copper vein bodies may develop within the fault zones of East Pulang. Fractal dimensions in this faulted zone vary between 0.018 and 2.421, which is indicative of extensive high-grade orebodies. All mineralized segments here have Hurst exponent values exceeding 0.5, signifying strong metallogenic activity. Four boreholes in North Pulang (ZK6425, ZK6426, ZK6428, ZK6625) produce higher Hurst coefficients, marking areas with high potential mineralization for copper prospecting. Integrating regional geological evidence and spatial fractal distribution features, exploration boreholes should be deployed preferentially at locations with high Hurst exponents.
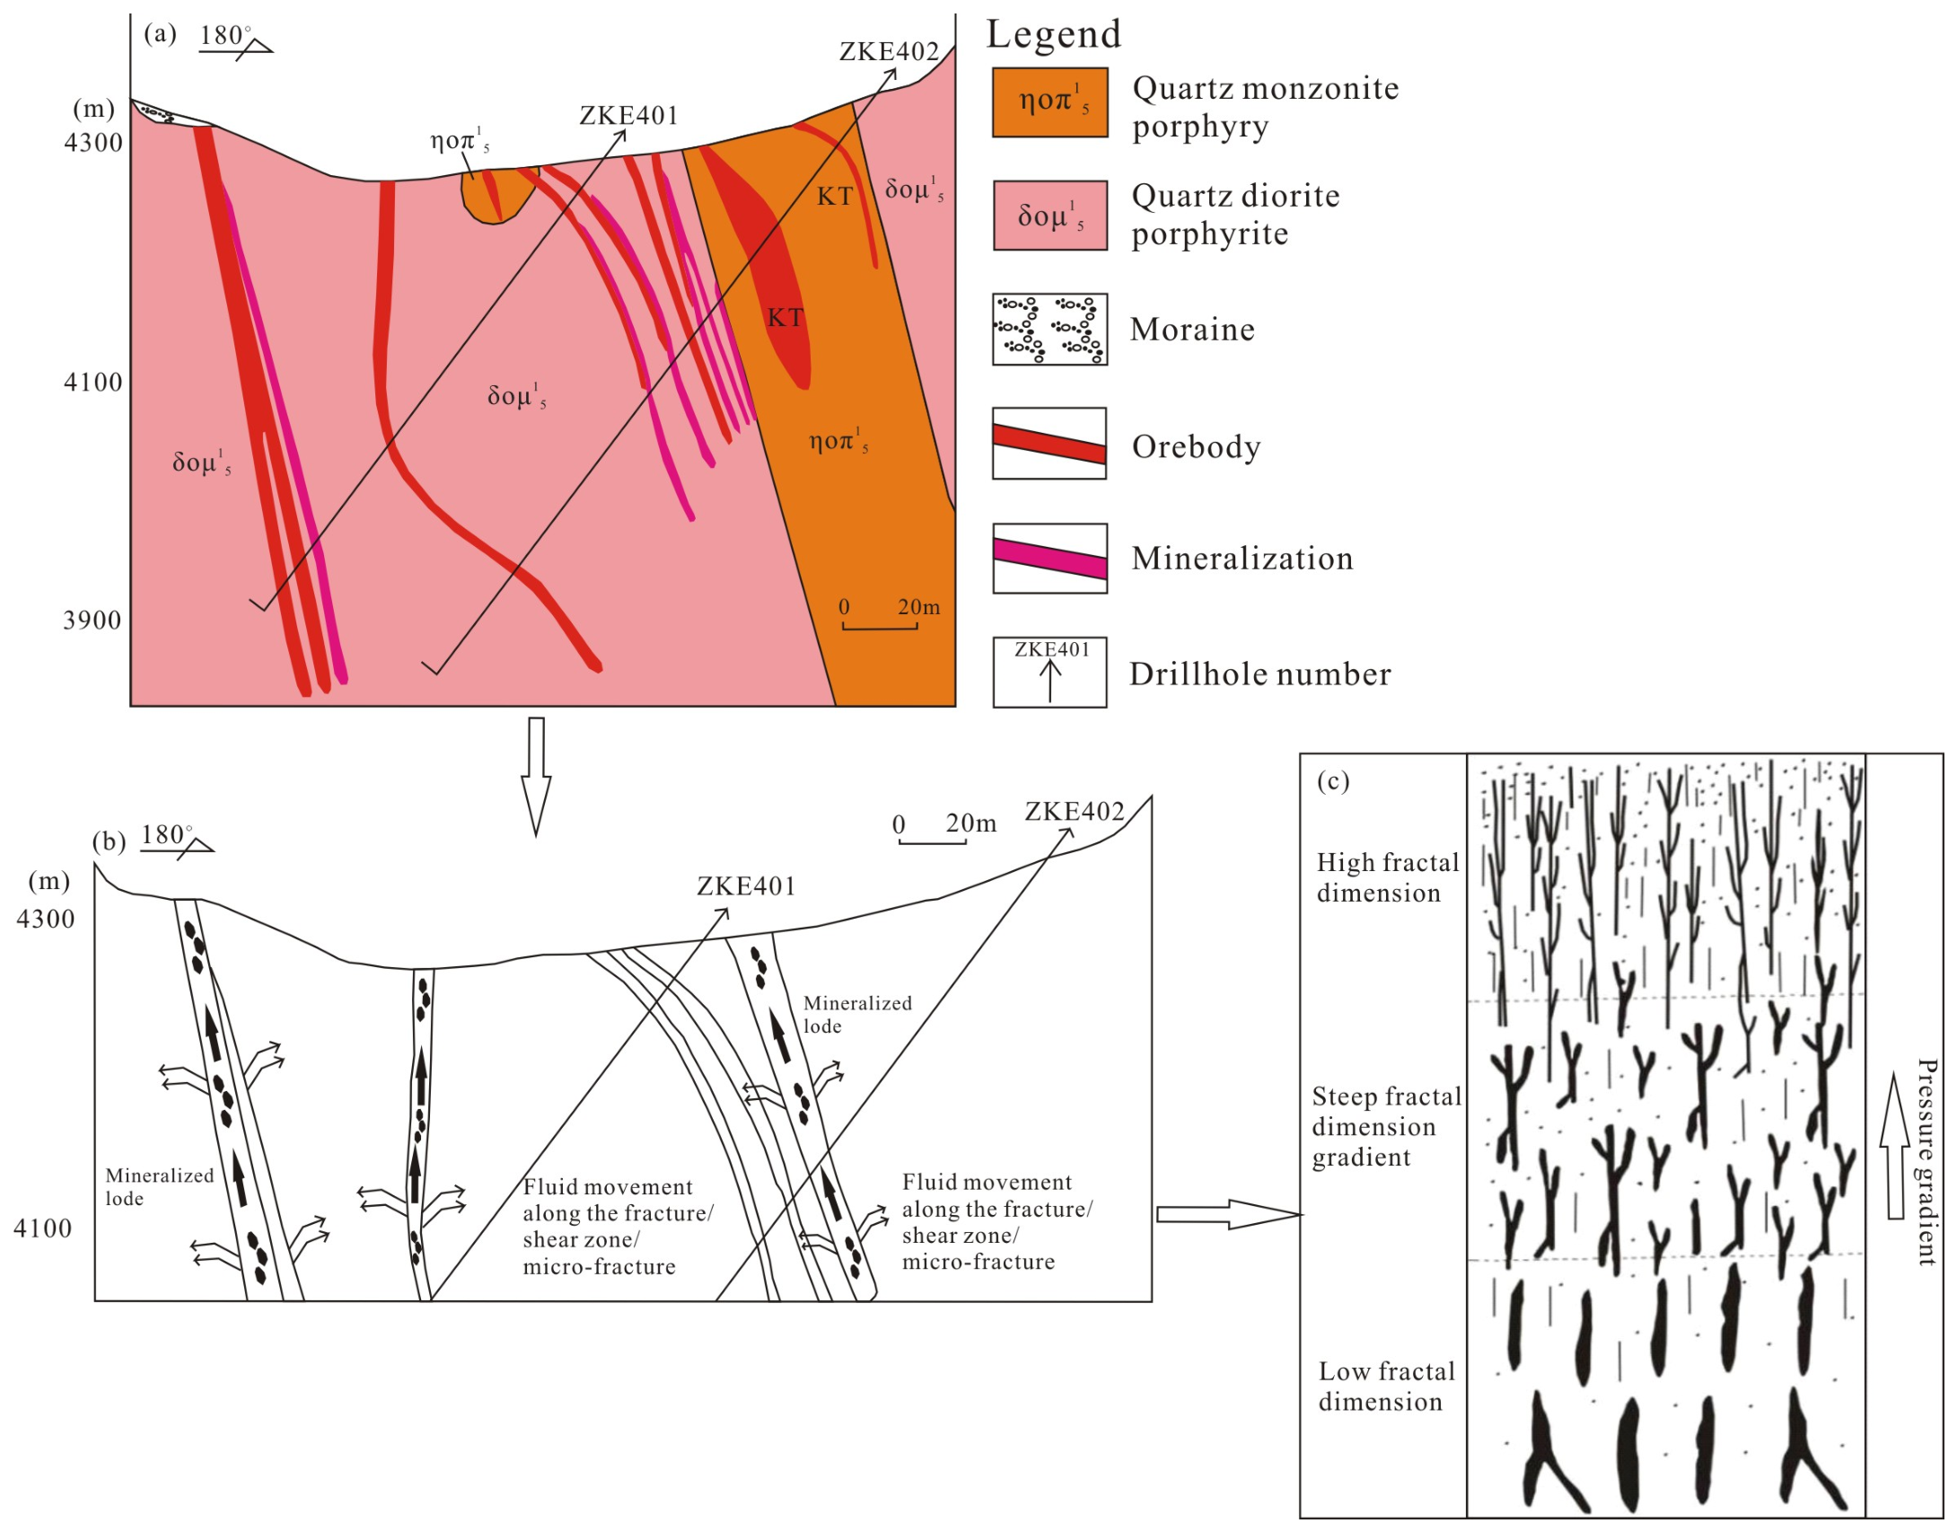
The core objective of this research is to deepen the comprehension of metallogenic evolution and validate the practicability of fractal analysis for discovering hidden copper deposits dominated by tectonic frameworks. The distinct fractal dimension fluctuations shown in Figure 4 and Figure 5 demonstrate that fractures and shear belts govern the migration pathways of metallogenic fluids. High fractal dimensions correspond to interconnected fracture systems that serve as ideal fluid migration channels, while low fractal values represent isolated structural spaces hindering mineral deposition. Under the driving force of pressure gradients, hydrothermal fluids flow from poorly connected structural zones toward well-developed fracture networks. When fluids pass through areas with steep fractal gradients, large-scale high-grade copper mineralization is prone to form. Consistent geological correlations between sharp fractal gradients and large-scale gold mineralization have been documented in numerous studies on Australia’s Yilgarn Craton, where vertical fractal dimension variations can well constrain the locations of super-large gold ore deposits [65]. This study extends this framework to porphyry Cu systems and anchors the fractal gradient–fluid migration model with local drill-core petrological and geochemical datasets rather than relying solely on statistical fractal covariation with grade.
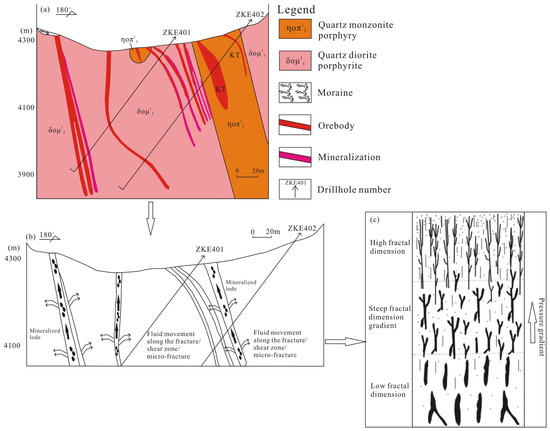
Figure 8 presents a conceptual sketch showing the vertical evolution of geological features and fractal parameters down drillholes. Figure 8a exhibits the vertical distribution of various lithologies, fracture density profiles and high-grade copper mineralization within drill-cores. The two-dimensional conceptual model in Figure 8b visualizes the migration paths governing the vertical and horizontal propagation of ore-bearing fluids under differential pressure; fluids are concentrated within steep fractal gradient zones where fracture connectivity and alteration intensity peak. Combined with the above geological features, the fractal conceptual model illustrated in Figure 8c demonstrates that high-grade mineralization concentrates in structural zones with sharp fractal gradient values, where elevated fracture density, intense alteration and interconnected fluid conduits co-occur. This fractal model can act as an effective spatial indicator to delineate prospective zones for other structurally controlled mineral deposits. In contrast to conventional techniques adopted in prior studies, the fractal gradient enables quantitative extrapolation for identifying copper prospecting targets within uninvestigated areas, with its geological meaning explicitly tied to measurable fracture, alteration and fluid connectivity metrics from drill-core observations.
Figure 8.
Conceptual model illustrating: (a) vertical profiles of drillholes in East Pulang, revealing varied rock units and ore-bearing veins; (b) migration paths governing the vertical and horizontal propagation of ore-bearing fluids under differential pressure; (c) high-grade copper mineralization accumulation within structural zones characterized by steep fractal gradient values.
4.2. Implementation of the Rescaled Range Method
The Hurst exponent (HR/S) can reflect the statistical characteristics of grade sequences and judge the relationship between data points, while the corresponding fractal dimension (DR/S) is adopted to evaluate the continuous variation of sequence variation [66]. Generally, the Hurst exponent fluctuates within the range 0–1, which reflects the dimensional characteristics of geochemical data. By judging the value of HR/S, we can distinguish whether the sequence presents random fluctuation or directional trend, and the trends are classified into anti-persistent and persistent types. The numerical magnitude of HR/S directly reflects the strength of sequence persistence. In this study, rescaled range analysis was adopted to reveal the vertical distribution rule of Cu grades in the Pulang mining area.
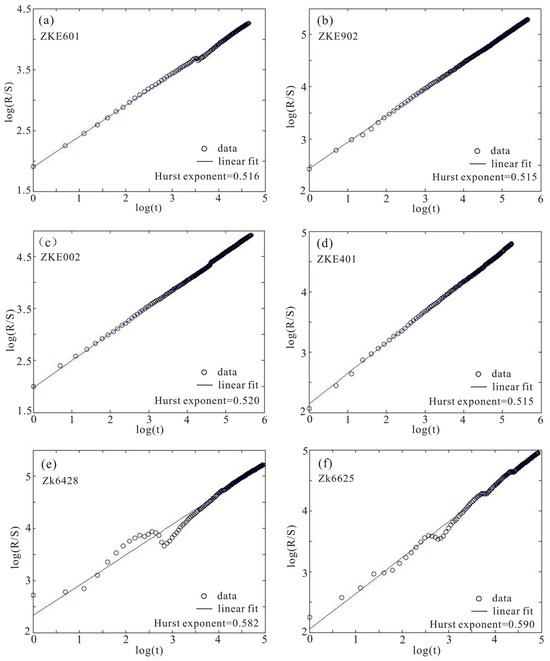
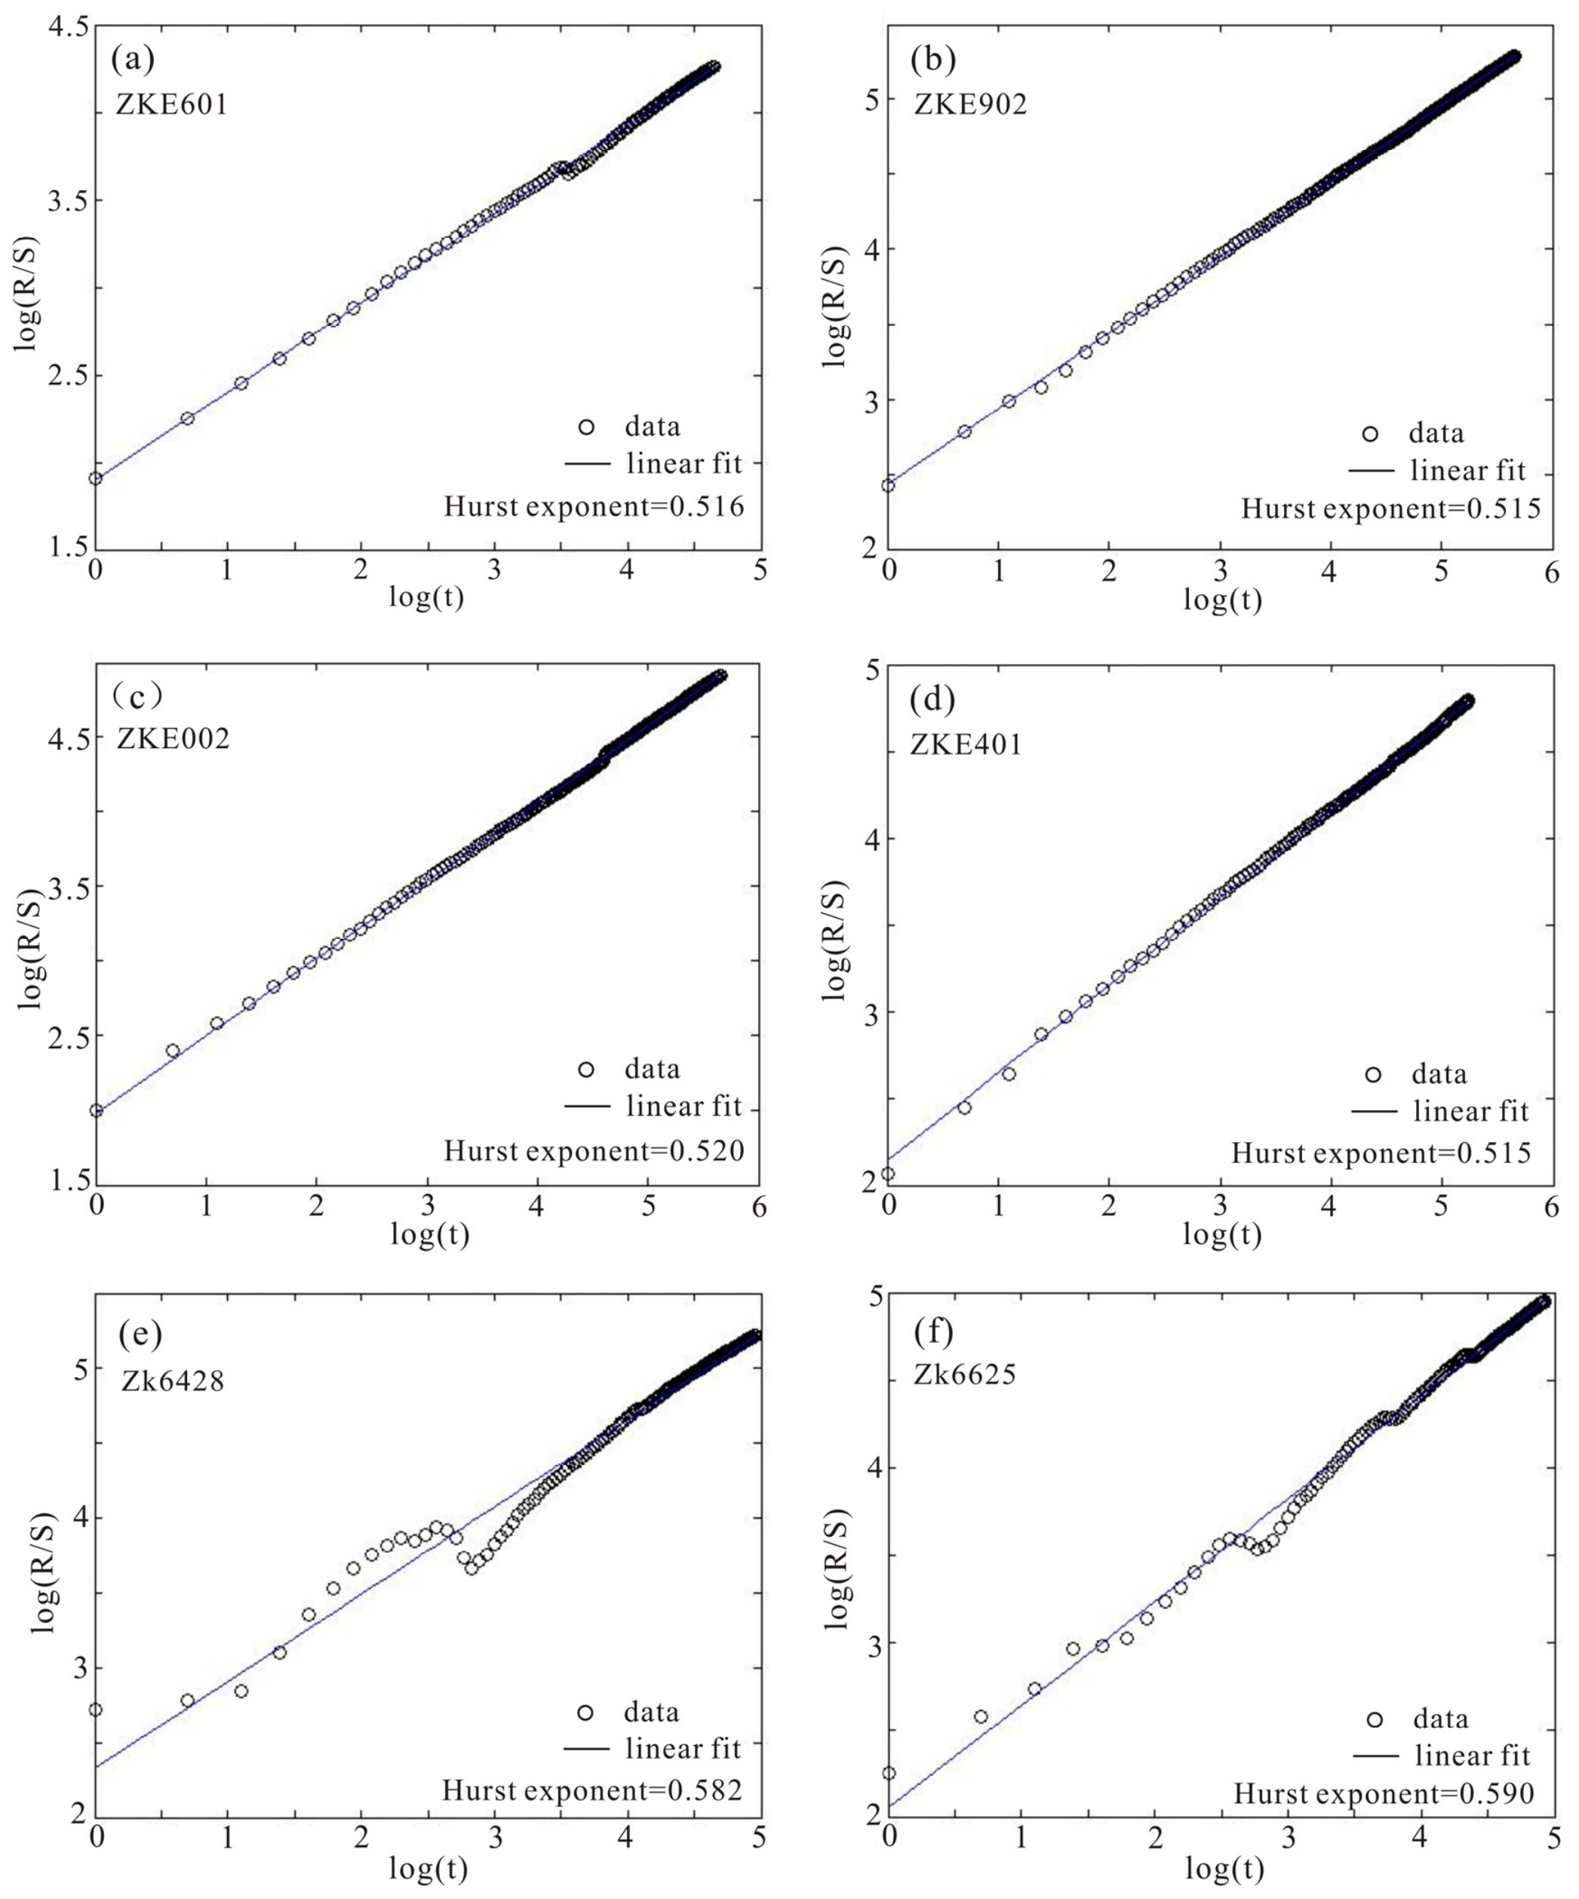
Table 1 and Table 2 separately summarize the rescaled range calculation outcomes of copper grade data collected from drillholes in North Pulang and East Pulang. Figure 9 displays the R/S fitting curves of Cu grade sequences from multiple drillholes. The measured Hurst indices fall within 0.510–0.636, meeting the criterion of 0.5 < H < 1, which proves copper grade evolution follows biased random walk patterns. Derived from Hurst exponents, the DR/S values of North Pulang are between 1.364 and 1.490, while those of East Pulang range from 1.420 to 1.498.
Figure 9.
Schematic plots of rescaled range analysis for Cu concentration datasets obtained from boreholes, together with corresponding Hurst exponent values. East Pulang (a–d) and North Pulang (e,f).
Such numerical features demonstrate that copper grade changes with sampling depth represent continuous, non-stochastic self-similar evolution. The Cu datasets match the characteristics of fractional Brownian motion (fBm) and carry long-range correlative features. Comparative analysis between persistence grades and mineralization degree reveals a statistically positive correlation between HR/S and average drillhole Cu grade. Linear regression of all the drillhole datasets yields a determination coefficient (R2 = 0.751) in the study area. Stronger mineralization corresponds to higher sequence persistence. The distribution of Cu grades along the drillholes in the study area was positively correlated, indicating that an increase in Cu grades in the previous section may imply an increase in the next section. High-grade intervals possess obvious memory and periodic signals. Controlled by local tectonic conditions, ore bodies occur either continuously or intermittently with stable extension, matching geological characteristics of the Pulang deposit. The fractal parameters acquired in this study present uniform copper enrichment rules across all sampled boreholes. The Hurst exponents of Cu sequences have an intimate linkage with mineralization strength, and its numerical size can quantitatively characterize both the mineralization intensity and continuity.
4.3. Geological Implications of Fractal Patterns in Copper Grades
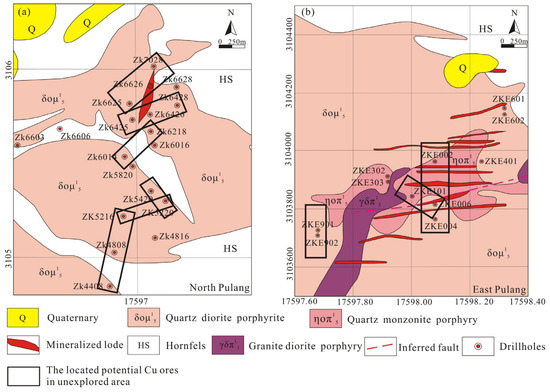
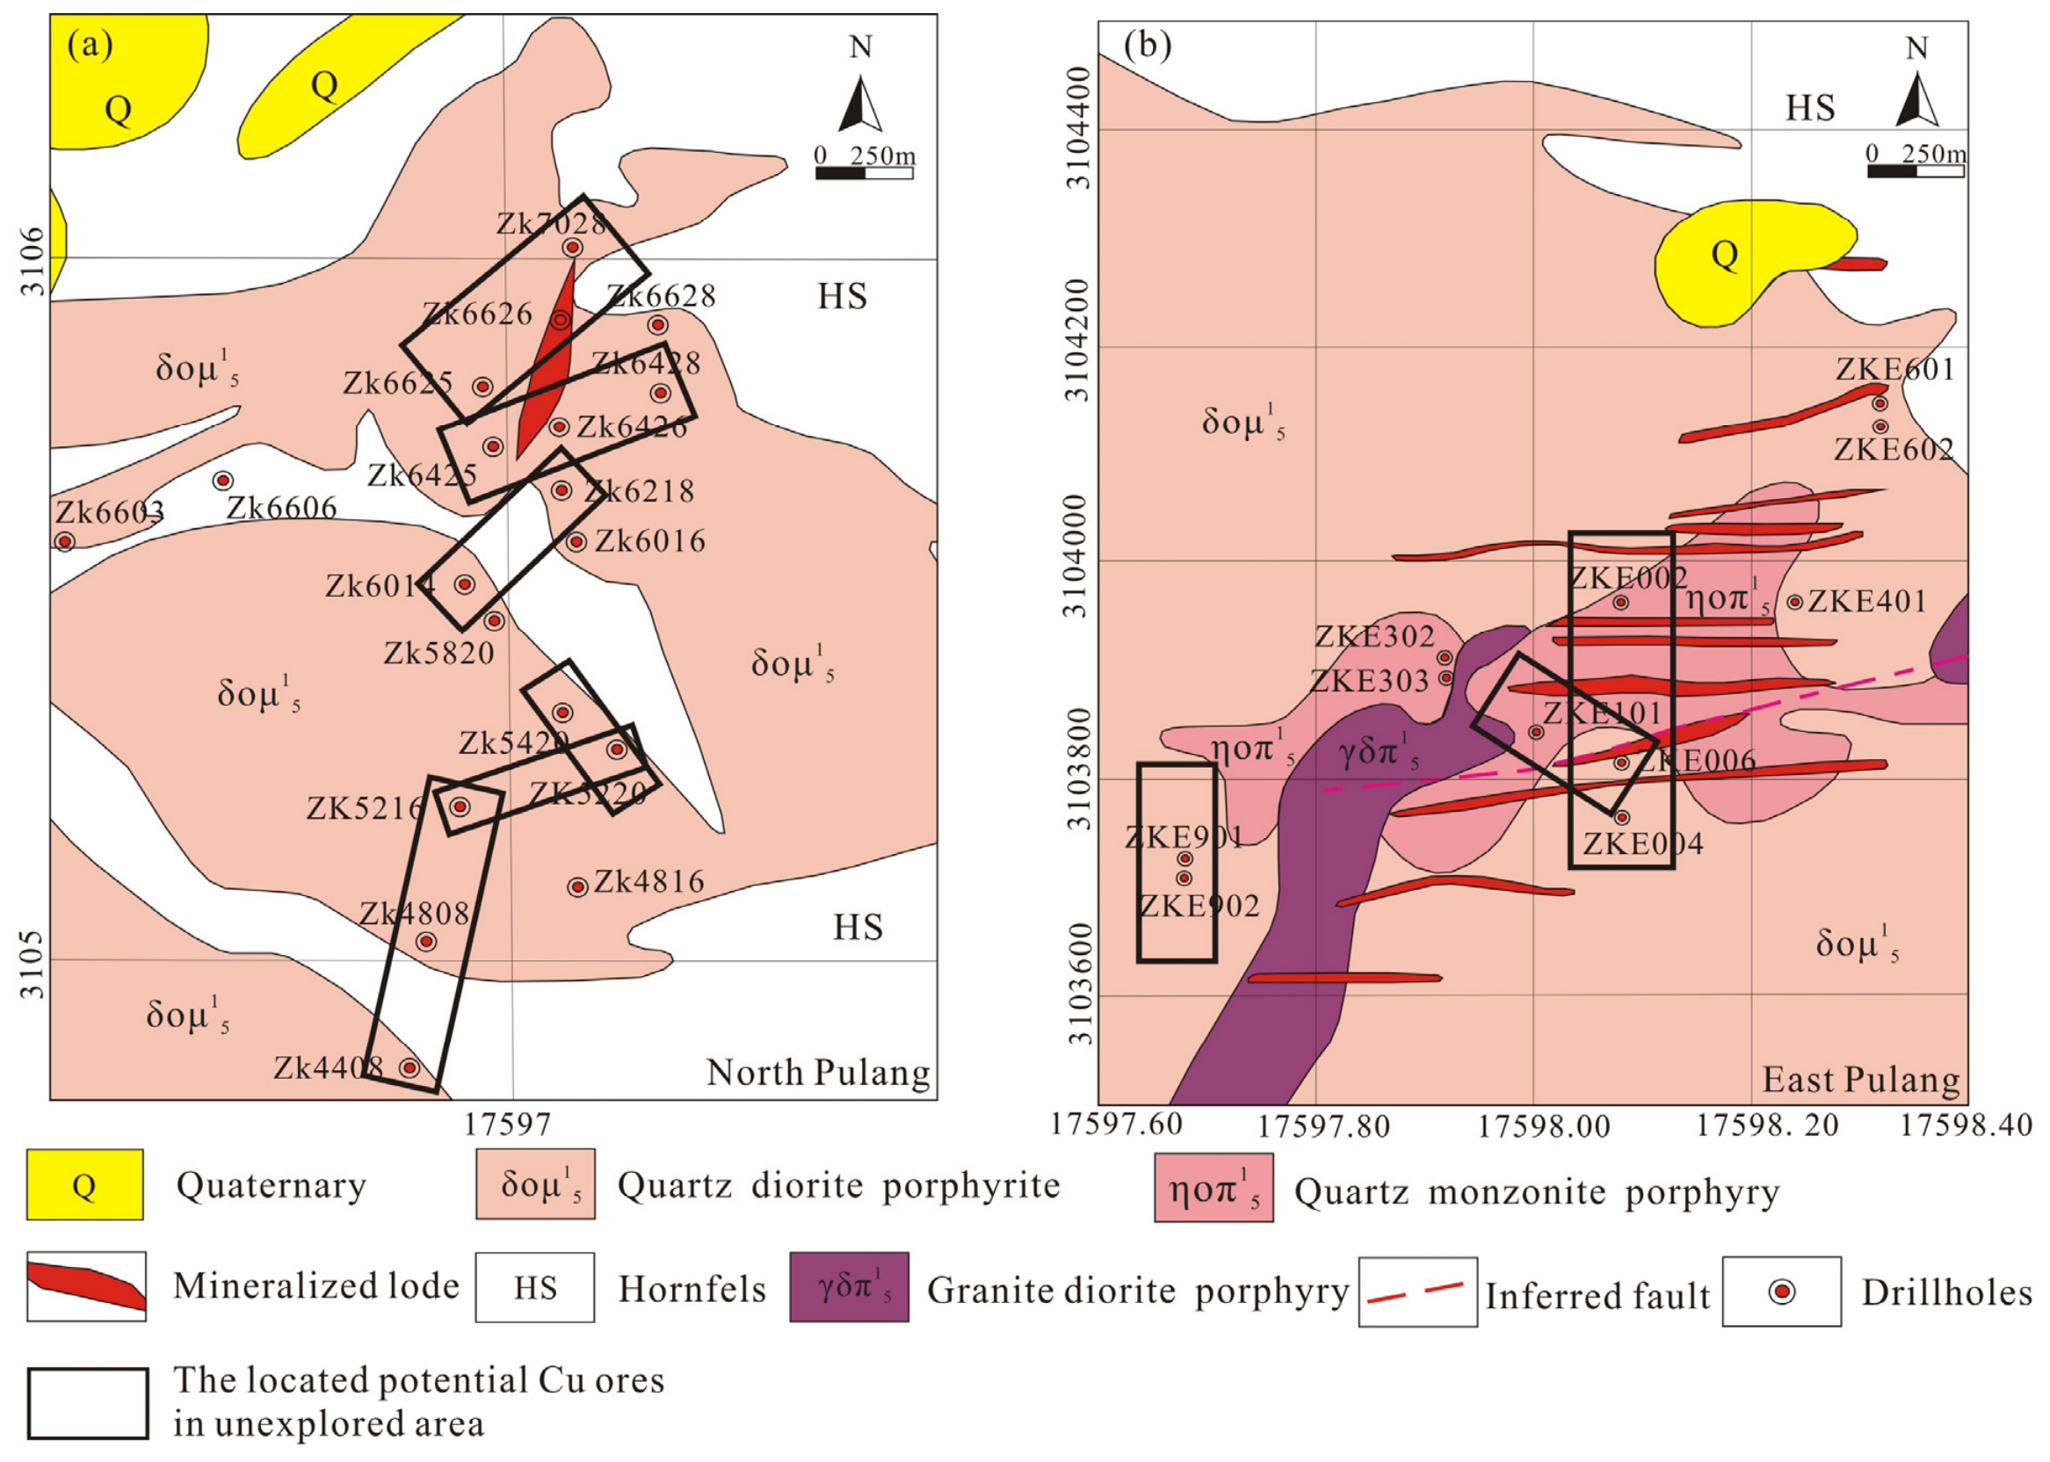
Integration of fractal theory and R/S analysis resolves coupled linkages between fractal dimensions and spatial occurrence of copper mineralization. Observations show that high-grade copper orebodies mostly concentrate within steep fractal gradient domains; computed fractal dimension metrics therefore constrain the migration paths of hydrothermal fluids. R/S calculations reveal that vertical copper grade sequences from all drillholes display evident self-similar attributes (Figure 9). Persistent trends in vertical Cu variability confirm mineralization retains scale-invariant properties within a specific spatial extent, establishing fractal dimension as a reliable metric for forecasting deep concealed orebodies. The derived Hurst exponent values confirm continuous copper mineralization along the full depth of drill holes, marking these mineralized intervals as core priority targets for copper prospecting. The R/S outcomes also characterize the geochemical variation of boreholes intersecting ore-hosting veins. This research further proves that fractal dimension gradients act as a critical spatial indicator to pinpoint prospective commercial copper deposits in unprospected regions (Figure 10). The fractal workflow established in this study has the potential to be applied to other fracture-controlled metallogenic systems; systematic tests on different deposit styles are necessary to confirm its universal adaptability. Meanwhile, this approach can enable the identification of hydrothermal migration channels, laying a solid foundation for revealing metallogenic mechanisms and conducting quantitative mineralization assessment.
Figure 10.
Distribution of potential Cu ores in unexplored area of North Pulang (a) and East Pulang (b).
The Hurst exponent calculated from R/S analysis serves as a novel analytical indicator capable of identifying the scaling characteristics of sequential data and distinguishing their inherent statistical variation laws [63]. In this research, full vertical grade sequences of each borehole were analyzed to clarify the overall scaling rules of copper grade variation along drilling depth. Meanwhile, the fractal correlation integral method was adopted to capture subtle small-scale fluctuations of Cu concentrations. In this method, correlation dimension (Dc) acts as a targeted parameter to match grade data with similar variation features across all drillholes, so it was adopted to characterize and visualize the spatial distribution of copper mineralization. In general, exploring the overall vertical variation trends of drillhole Cu grades first, and then analyzing their fine small-scale fluctuation characteristics, is a reasonable and standardized analytical workflow for geochemical sequence research.
Prior geochemical time-series anomaly detection deploys multiple statistical frameworks, including wavelet analysis [67], power spectrum analysis [68], cluster analysis [69], and discriminant analysis [70]. Among these conventional approaches, fractal correlation dimension uniquely extracts scale-invariant clustering characteristics of orebody distribution. Notably, unlike conventional analytical methods identifying mineralization anomalies relying on extreme grade values, this fractal parameter can accurately pinpoint high-grade copper mineralization zones based on gradient variations of correlation dimension. Apart from identifying scale-invariant Cu grade anomalies in both vertical and horizontal dimensions, this research also targets two additional core objectives: quantifying relative geochemical anomalies of drill-core Cu concentrations, and comparing such anomalous characteristics across different boreholes. In this study, we built a quantitative linkage between correlation dimension (Dc) and vertical Cu grade variations via fractal analysis. Furthermore, matching equivalent Dc values among adjacent boreholes facilitates the comparison of vertical grade variation trends and the spatial distribution of copper ore enrichment zones. As a prevalent spatial analytical technique, fractal analysis quantifies the self-similarity inherent in complex natural spatial patterns, and possesses prominent strengths relative to conventional spatial analysis tools. It performs excellently in characterizing complicated geological phenomena with multi-scale self-similar features. Typical natural fractal objects include coastlines, mountain landforms and river systems, whose spatial complexity can be quantitatively depicted by fractal dimension parameters [71]. Compared with Fourier transform and wavelet analysis, fractal analysis shows stronger anti-interference capacity against data noise and testing errors. The core reason lies in that this method focuses on the overall structural features of datasets rather than partial frequency characteristics or individual abnormal data points [72]. Furthermore, its analytical results are independent of spatial resolution, enabling multi-scale analysis covering both microscopic local variations and macroscopic overall distribution rules. By contrast, many conventional spatial analysis methods constrained by fixed resolution are prone to omit key geological information at unmatched scales. In addition, fractal analysis is a universal interdisciplinary analytical tool widely applied in ecology, geology, physics, economics and other disciplines, which enables comprehensive investigation of diverse complex nonlinear systems [73]. In summary, fractal analysis serves as a reliable and adaptable spatial analytical approach. It outperforms numerous traditional statistical approaches for characterizing and quantifying complex geological mineralization processes, rendering it highly suitable for geochemical sequence analysis and metallogenic spatial pattern identification.
5. Conclusions
This study applies rescaled range and fractal correlation integral methods to compute correlation dimensions quantifying vertical Cu grade variability across Pulang deposit drillhole samples. Meanwhile, cross-drillhole comparison of equivalent correlation dimension values was conducted to clarify the spatial mineralization distribution and migration paths of ore-forming hydrothermal fluids. The primary findings of this paper are outlined below.
- (1)
- Vertical Cu grade sequences of all boreholes in the research area present prominent self-similar features, proving that the vertical variation of copper concentrations conforms to typical fractal distribution laws. It also demonstrates that regional mineralization has obvious scale invariance within a specific spatial scope. The Hurst exponents calculated for both northern and eastern Pulang range from 0.510 to 0.636, suggesting persistent trends for vertical copper grade distribution. In addition, the Hurst exponent of geochemical sequences shows a positive correlation with mineralization intensity. Continuous copper mineralization veins develop along the whole drilling depth, which verifies that the Hurst exponent can quantitatively characterize the continuity of regional mineralization.
- (2)
- Restricted by local geological conditions, orebodies in the study area occur in either continuous or intermittent forms. The overall mineralization features keep stable vertically, which is highly consistent with the actual metallogenic geological background of Pulang porphyry Cu deposit.
- (3)
- This research confirms the inherent correlation between fractal dimension parameters and spatial patterns of copper mineralization. The correlation integral results indicate that high-grade copper orebodies are mostly concentrated in zones with sharp fractal dimension gradients, and such gradient variations can effectively constrain migration channels of ore-forming fluids. For blank prospecting areas, fractal dimension gradients can be applied as reliable spatial indicators to delineate prospective zones for hidden economic copper deposits.
- (4)
- This paper systematically explores the coupling relationship between multifractal features of ore-forming elements and mineralization strength, and further discusses the control effect of tectonic conditions on element distribution of structurally controlled deposits. Furthermore, this study reveals the laws governing element scattering and enrichment, alongside spatial-temporal variation patterns of metallogenic components throughout the generation and evolutionary processes of metallogenic systems. The research findings can provide effective references for interpreting complex geological phenomena and clarifying metallogenic mechanisms of structurally controlled ore deposits.
Author Contributions
Conceptualization, X.W.; methodology, X.W. and Y.L.; software, X.W.; validation, X.W. and Q.J.; formal analysis, X.W. and S.L.; investigation, X.W. and Y.L.; resources, Y.L.; data curation, X.W. and S.L.; writing—original draft preparation, X.W. and Y.L.; writing—review and editing, X.W.; visualization, X.W. and Y.L.; supervision, Y.L.; project administration, Q.J. and S.L.; funding acquisition, Y.L. All authors have read and agreed to the published version of the manuscript.
Funding
This study was funded by the Shanxi Province Basic Research Program (202503021212278) from Shanxi Provincial Department of Science and Technology, the Doctoral Start-up Foundation of Shanxi Institute of Technology (2024QD-16) from Shanxi Institute of Technology, the Natural Science Foundation of Hubei Province of China (2023AFD225) from Department of Science and Technology of Hubei Province, and the Key Joint Fund Project Supported by the Shanxi Province Basic Research Program (Geological Exploration) (202503011251011) from Shanxi Provincial Department of Science and Technology.
Data Availability Statement
The raw drill-core logging data cannot be publicly released due to the commercial confidentiality agreement of the Pulang mining company. All processed fractal calculation results, table statistics and fitted curve data displayed in figures are completely included in this manuscript for reproducible analysis.
Acknowledgments
The authors sincerely appreciate geologists from the Pulang copper deposit for their precious support during field surveys and the supply of raw data.
Conflicts of Interest
Author Yuqi Liang was employed by the company Shanxi Geological Exploration Bureau 217th Team Co., Ltd. The remaining authors declare that the research was conducted in the absence of any commercial or financial relationships that could be construed as a potential conflict of interest.
References
- Deng, J.; Wang, Q.; Wan, L.; Yang, L.; Gong, Q.; Zhao, J.; Liu, H. Self-similar fractal analysis of gold mineralization of dayingezhuang disseminated-veinlet deposit in jiaodong gold province, china. J. Geochem. Expl. 2009, 102, 95–102. [Google Scholar] [CrossRef] [Scilit]
- Deng, J.; Wang, Q.F.; Wan, L.; Liu, H.; Yang, L.Q.; Zhang, J. A multifractal analysis of mineralization characteristics of the Dayingezhuang disseminated-veinlet gold deposit in the Jiaodong gold province of China. Ore Geol. Rev. 2011, 40, 54–64. [Google Scholar] [CrossRef] [Scilit]
- Wang, X.C.; Xia, Q.L.; Li, T.F.; Leng, S.; Li, Y.L.; Kang, L.; Chen, Z.J.; Wu, L.R. Application of fractal models to delineate mineralized zones in the Pulang porphyry copper deposit, Yunnan, southwestern China. Nonlinear Processes Geophys. 2019, 26, 267–282. [Google Scholar] [CrossRef] [Scilit]
- Liu, H.; Mukherjee, B.; Zuo, Y.J.; Roy, P.N.S.; Wu, Z.H.; Sun, W.J.B.; Zheng, L.L.; Pan, C.; Lin, J.Y. Fractal dimension used as a proxy to understand the spatial distribution for carlin-type gold deposits. Ore Geol. Rev. 2023, 158, 16. [Google Scholar] [CrossRef] [Scilit]
- Cheng, Q.; Agterberg, F.P. Multifractal modeling and spatial point processes. Math. Geol. 1995, 27, 831–845. [Google Scholar] [CrossRef] [Scilit]
- Wang, Q.F.; Deng, J.; Wan, L.; Zhao, J.; Gong, Q.J.; Yang, L.Q.; Zhou, L.; Zhang, Z.J. Multifractal analysis of the element distribution in skarn-type deposits in Shizishan Orefield in Tongling area, Anhui province. China. Acta Geol. Sin. 2008, 82, 896–905. [Google Scholar] [CrossRef] [Scilit]
- Wan, L.; Zhu, Y.Q.; Deng, X.C. Multifractal characteristics of gold grades series in the Dayingezhuang Deposit, Jiaodong Gold Province, China. Earth Sci. Inform. 2015, 8, 843–851. [Google Scholar] [CrossRef] [Scilit]
- Ghasemzadeh, S.; Maghsoudi, A.; Youseff, M.; Mihalasky, M.J. Stream sediment geochemical data analysis for district-scale mineral exploration targeting: Measuring the performance of the spatial U-statistic and CA fractal modeling. Ore Geol. Rev. 2019, 113, 103115. [Google Scholar] [CrossRef] [Scilit]
- Richards, J.P.; Spell, T.; Rameh, E.; Razique, A.; Fletcher, T. High Sr/Y magmas reflect arc maturity, high magmatic water content, and porphyry Cu±Mo±Au potential: Examples from the Tethyan arcs of central and eastern Iran and western Pakistan. Econ. Geol. 2012, 107, 295–332. [Google Scholar] [CrossRef] [Scilit]
- Swain, S.K.; Roy, P.N.S.; Mukherjee, B.; Sawkar, R.H. Fractal dimension and its translation into a model of gold spatial proxy. Ore Geol. Rev. 2019, 110, 102935. [Google Scholar] [CrossRef] [Scilit]
- Mandelbrot, B.B. The Fractal Geometry of Nature. Am. J. Phys. 1983, 51, 286–287. [Google Scholar] [CrossRef] [Scilit]
- Zhao, Z.; Chen, J.; Cheng, B.; Liu, Y.; Qiao, K.; Cui, X.; Yin, Y.; Li, C. Spatial Analysis of Structure and Metal Mineralization Based on Fractal Theory and Fry Analysis: A Case Study in Nenjiang−Heihe Metallogenic Belt. Minerals 2023, 13, 313. [Google Scholar] [CrossRef] [Scilit]
- Turcotte, D.L.; Brown, S.R. Fractals and chaos in geology and geophysics. Phys. Today 1993, 46, 68. [Google Scholar] [CrossRef] [Scilit]
- Cheng, Q.; Agterberg, F.P.; Ballantyne, S.B. The separation of geochemical anomalies from background by fractal methods. J. Geochem. Explor. 1994, 51, 109–130. [Google Scholar] [CrossRef] [Scilit]
- Wang, X.C.; Xia, Q.L. Depiction of Different Alteration Zones Using Fractal and Simulation Algorithm in Pulang Porphyry Copper Deposit, Southwest China. Nat. Resour. Res. 2022, 31, 1943–1961. [Google Scholar]
- Pan, C.; Xia, B.W.; Zuo, Y.J.; Yu, B. Mechanism and control technology of strong ground pressure behaviour induced by high-position hard roofs in extra-thick coal seam mining. Int. J. Min. Sci. Technol. 2022, 32, 499–511. [Google Scholar] [CrossRef] [Scilit]
- Cui, Z.; Zhou, J.; Luo, K.; Lu, M. Fractal Structure Characteristics and Prospecting Direction of Dispersed Metals in the Eastern Guizhou Pb–Zn Metallogenic Belt, SW China. Minerals 2022, 12, 1567. [Google Scholar] [CrossRef] [Scilit]
- Khouya, T.; El Ouardi, H.; Al-Hashim, M.H. Multiscale fractures network analysis in the Liassic carbonates of the Tabular Middle Atlas, Morocco: Hydrogeological reservoir involvement. Geosci. J. 2025, 29, 468–490. [Google Scholar] [CrossRef] [Scilit]
- Fu, W.; Hu, W.; Yi, T.; Kane, O.I.; Zhang, M.; Huang, X. Fractal Dimension Analysis of Pores in Coal Reservoir and Their Impact on Petrophysical Properties: A Case Study in the Province of Guizhou, SW China. Minerals 2022, 12, 1425. [Google Scholar] [CrossRef] [Scilit]
- Jibrin, A.; Liu, X.; He, X. Geometrical characterization of multiscale pore structures in reservoir rocks using machine learning on images. Nat. Resour. Res. 2025, 34, 3103–3125. [Google Scholar] [CrossRef] [Scilit]
- Sun, T.; Wu, K.; Chen, L.; Liu, W.; Wang, Y.; Zhang, C. Joint Application of Fractal Analysis and Weights-of-Evidence Method for Revealing the Geological Controls on Regional-Scale Tungsten Mineralization in Southern Jiangxi Province, China. Minerals 2017, 7, 243. [Google Scholar] [CrossRef] [Scilit]
- Roy, P.N.S.; Mondal, S.K. Fractal nature of earthquake occurrence in northwest Himalayan region. J. Indian Geophys. Union 2009, 13, 63–68. [Google Scholar]
- Gupta, S.K.; Roy, P.N.S.; Pal, S.K. Scale invariance behavior for pre and post-2015 Nepal Gorkha earthquake GPS time series based on fractal analysis. Chaos Solitons Fractals 2021, 152, 111341. [Google Scholar] [CrossRef] [Scilit]
- Gillespie, P.A.; Howard, C.B.; Walsh, J.J.; Watterson, J. Measurement and characterisation of spatial distributions of fractures. Tectonophysics 1993, 226, 113–141. [Google Scholar] [CrossRef] [Scilit]
- Yang, B.; Liu, Y. Application of fractals to evaluate fractures of rock due to mining. Fractal Fract. 2022, 6, 96. [Google Scholar] [CrossRef] [Scilit]
- Carlon, C.A. Spatial distribution of ore deposits. Geology 1991, 19, 111–114. [Google Scholar] [CrossRef] [Scilit]
- Gong, Q.; Liu, Y. Identification of the Nonlinear Distributions of Elements with Multifractal: A Case Study of the Er’renshan Ore Field, NW China. Acta Geol. Sin. 2025, 99, 1509–1526. [Google Scholar] [CrossRef] [Scilit]
- Turcotte, D.L. Fractals and Chaos in Geology and Geophysics, 2nd ed.; Cornell University: New York, NY, USA, 2012. [Google Scholar]
- Groves, D.I.; Santosh, M.; Zhang, L. A scale-integrated exploration model for orogenic gold deposits based on a mineral system approach. Geosci. Front. 2020, 11, 719–738. [Google Scholar] [CrossRef] [Scilit]
- Zhou, Y.; Chown, E.H.; Tu, G.; Guha, J.; Lu, H. Geochemical migration of impurity trace elements and resultant fractal distribution patterns in source rocks. Math. Geol. 1994, 26, 419–435. [Google Scholar] [CrossRef] [Scilit]
- Lin, X.; Zhang, B.; Wang, X. Application of factor analysis and concentration-volume fractal modeling to delineation of 3D geochemical patterns: A case study of the Jinwozi gold field, NW China. Geochem. Explor. Environ. Anal. 2014, 14, 359–367. [Google Scholar] [CrossRef] [Scilit]
- Roberts, S.; Sanderson, D.J.; Gumiel, P. Fractal analysis and percolation properties of veins. Geol. Soc. Lond. Spec. Publ. 1999, 155, 7–16. [Google Scholar] [CrossRef] [Scilit]
- Li, Q.; Liu, D.; Cai, Y. Effects of natural micro-fracture morphology, temperature and pressure on fluid flow in coals through fractal theory combined with lattice Boltzmann method. Fuel 2021, 286, 119468. [Google Scholar] [CrossRef] [Scilit]
- Yu, C.W. Fractal growth of ore-forming dynamic systems at the edge of chaos-A new metallogeny and methodology. Bull. Mineral. Petrol. Geochem. 2002, 21, 103–113. [Google Scholar]
- Wang, Q.F.; Deng, J.; Wan, L.; Yang, L.Q.; Gong, Q.J. Discussion on the kinetic controlling parameter of the stability of orebody distribution in altered rocks in the Dayingezhuang gold deposit, Shandong. Acta Petrol. Sin. 2007, 23, 861–864. [Google Scholar]
- Roger, F.; Jolivet, M.; Malavieille, J. The tectonic evolution of the Songpan-Garzê (North Tibet) and adjacent areas from Proterozoic to Present: A synthesis. J. Asian Earth Sci. 2010, 39, 254–269. [Google Scholar] [CrossRef] [Scilit]
- Yang, T.N.; Hou, Z.Q.; Wang, Y.; Zhang, H.R.; Wang, Z.L. Late Paleozoic to Early Mesozoic tectonic evolution of northeast Tibet: Evidence from the Triassic composite western Jinsha-Garzê-Litang suture. Tectonics 2012, 31, TC4004. [Google Scholar] [CrossRef] [Scilit]
- Pullen, A.; Kapp, P.; Gehrels, G.E.; Vervoort, J.D.; Ding, L. Triassic continental subduction in central Tibet and Mediterranean-style closure of the Paleo-Tethys Ocean. Geology 2008, 36, 351–354. [Google Scholar] [CrossRef] [Scilit]
- Reid, A.J.; Wilson, C.J.; Liu, S. Structural evidence for the Permo-Triassic tectonic evolution of the Yidun Arc, eastern Tibetan Plateau. J. Struct. Geol. 2005, 27, 119–137. [Google Scholar] [CrossRef] [Scilit]
- Yang, T.N.; Ding, Y.; Zhang, H.R.; Fan, J.W.; Liang, M.J.; Wang, X.H. Two-phase subduction and subsequent collision defines the Paleotethyan tectonics of the southeastern Tibetan Plateau: Evidence from zircon U–Pb dating, geochemistry, and structural geology of the Sanjiang orogenic belt, southwest China. Geol. Soc. Am. Bull. 2014, 126, 1654–1682. [Google Scholar] [CrossRef] [Scilit]
- Reid, A.; Wilson, C.J.; Shun, L.; Pearson, N.; Belousova, E. Mesozoic plutons of the Yidun Arc, SW China: U/Pb geochronology and Hf isotopic signature. Ore Geol. Rev. 2007, 31, 88–106. [Google Scholar] [CrossRef] [Scilit]
- Leng, C.B.; Zhang, X.C.; Hu, R.Z.; Wang, S.X.; Zhong, H.; Wang, W.Q.; Bi, X.W. Zircon U–Pb and molybdenite Re–Os geochronology and Sr–Nd–Pb–Hf isotopic constraints on the genesis of the Xuejiping porphyry copper deposit in Zhongdian, Northwest Yunnan, China. J. Asian Earth Sci. 2012, 60, 31–48. [Google Scholar] [CrossRef] [Scilit]
- Song, X.Y.; Zhou, M.F.; Cao, Z.M.; Robinson, P.T. Late Permian rifting of the South China Craton caused by the Emeishan mantle plume? J. Geol. Soc. 2004, 161, 773–781. [Google Scholar] [CrossRef] [Scilit]
- Wang, B.Q.; Zhou, M.F.; Chen, W.T.; Gao, J.F.; Yan, D.P. Petrogenesis and tectonic implications of the Triassic volcanic rocks in the northern Yidun Terrane, Eastern Tibet. Lithos 2013, 175, 285–301. [Google Scholar] [CrossRef] [Scilit]
- Cao, K.; Xu, J.F.; Chen, J.L.; Huang, X.X.; Ren, J.B.; Zhao, X.D.; Liu, Z.X. Double-layer structure of the crust beneath the Zhongdian arc, SW China: U–Pb geochronology and Hf isotope evidence. J. Asian Earth Sci. 2016, 115, 455–467. [Google Scholar] [CrossRef] [Scilit]
- Chen, J.L.; Xu, J.F.; Ren, J.B.; Huang, X.X. Late Triassic E-MORB-like basalts associated with porphyry Cu-deposits in the southern Yidun continental arc, eastern Tibet: Evidence of slab-tear during subduction? Ore Geol. Rev. 2017, 90, 1054–1062. [Google Scholar] [CrossRef] [Scilit]
- Leng, C.B.; Huang, Q.Y.; Zhang, X.C.; Wang, S.X.; Zhong, H.; Hu, R.Z.; Bi, X.W.; Zhu, J.J.; Wang, X.S. Petrogenesis of the Late Triassic volcanic rocks in the Southern Yidun arc, SW China: Constraints from the geochronology, geochemistry, and Sr–Nd–Pb–Hf isotopes. Lithos 2014, 190–191, 363–382. [Google Scholar] [CrossRef] [Scilit]
- Li, W.C.; Zeng, P.S.; Hou, Z.Q.; White, N.C. The Pulang porphyry copper deposit and associated felsic intrusions in Yunnan Province, Southwest China. Econ. Geol. 2011, 106, 79–92. [Google Scholar] [CrossRef] [Scilit]
- Zhang, S.; He, W.; Wang, H.; Xiao, Y. Thermodynamic Modeling Constrains the Alteration and Mineralization Patterns of the Pulang Porphyry Cu-Au Deposits in Eastern Tibet. Minerals 2025, 15, 780. [Google Scholar] [CrossRef] [Scilit]
- Li, M.; Gao, X.; Gu, G.; Guan, S. Magmatic–Hydrothermal Processes of the Pulang Giant Porphyry Cu (–Mo–Au) Deposit, Western Yunnan: A Perspective from Different Generations of Titanite. Minerals 2025, 15, 263. [Google Scholar] [CrossRef] [Scilit]
- Xia, Q.; Li, T.; Kang, L.; Leng, S.; Wang, X. Study on the PTX Parameters and Fractal Characteristics of Ore-Forming Fluids in the East Ore Section of the Pulang Copper Deposit, Southwest China. J. Earth Sci. 2021, 32, 390–407. [Google Scholar] [CrossRef] [Scilit]
- Hu, D.; Guan, S.; Su, Y.; Li, S.; Li, Z.; Yang, F.; Wang, L.; Ren, T. Characteristics of Ore-Forming Fluids and Genesis of the First Mining Area and Eastern Ore Section of the Pulang Porphyry Copper Deposit, Southeastern China: A Comparative Study. Minerals 2024, 14, 98. [Google Scholar] [CrossRef] [Scilit]
- Li, W.C.; Zhang, X.; Yu, H.; Tao, D.; Liu, X. Geology and mineralization of the Pulang supergiant porphyry copper deposit (5.11 Mt) in Shangri-la, Yunnan Province, China: A review. China Geol. 2022, 5, 662–695. [Google Scholar] [CrossRef] [Scilit]
- Leng, S.; Xia, Q.; Li, T.; Wang, X.; Zhao, M.; Zhang, F. Geodynamic Simulation of the Pulang Porphyry Deposit in Southwest China: Implications for Ore Genesis and Exploration. J. Earth Sci. 2025, 36, 2513–2525. [Google Scholar] [CrossRef] [Scilit]
- Cao, L. Practical method for determining the minimum embedding dimension of a scalar time series. Phys. D Nonlinear Phenom. 1997, 110, 43–50. [Google Scholar] [CrossRef] [Scilit]
- Grassberger, P.; Procaccia, I. Characterizations of stranger attractors. Phys. Rev. Lett. 1983, 50, 346–349. [Google Scholar] [CrossRef] [Scilit]
- Hurst, H.E. Long-term storage capacity of reservoirs. Trans. Am. Soc. Civ. Eng. 1951, 116, 770–808. [Google Scholar] [CrossRef] [Scilit]
- Chamoli, A.; Bansal, A.R.; Dimri, V.P. Wavelet and rescaled range approach for the Hurst coefficient for short and long time series. Comput. Geosci. 2007, 33, 83–93. [Google Scholar] [CrossRef] [Scilit]
- Zuo, R.; Agterberg, F.P.; Cheng, Q.; Yao, L. Fractal characterization of the spatial distribution of geological point processes. Int. J. Appl. Earth Obs. Geoinf. 2009, 11, 394–402. [Google Scholar] [CrossRef] [Scilit]
- Zuo, R.; Cheng, Q.; Xia, Q. Application of fractal models to characterization of vertical distribution of geochemical concentration. J. Geochem. Explor. 2009, 102, 37–43. [Google Scholar] [CrossRef] [Scilit]
- Zuo, R.; Cheng, Q.; Xia, Q. Evaluation of the uncertainty in estimation of metal resources of skarn tin in Southern China. Ore Geol. Rev. 2009, 35, 415–422. [Google Scholar] [CrossRef] [Scilit]
- Zuo, R.; Wang, J. Fractal/multifractal modeling of geochemical data: A review. J. Geochem. Explor. 2016, 164, 33–41. [Google Scholar] [CrossRef] [Scilit]
- Mukherjee, B.; Roy, P.N.S.; Sain, K. Delineation of hydrocarbon and non-hydrocarbon zones using fractal analysis of well-log data from Bhogpara oil field, NE India. Carbonates Evaporites 2020, 35, 22. [Google Scholar] [CrossRef] [Scilit]
- Sibson, R.; Barnett, V. A brief description of natural neighbor interpolation. In Interpreting Multivariate Data; Barnett, V., Ed.; Wiley: Hoboken, NJ, USA, 1981; pp. 21–36. [Google Scholar]
- Hodkiewicz, P.F.; Weinberg, R.F.; Gardoll, S.J.; Groves, D.I. Complexity gradients in the Yilgarn Craton: Fundamental controls on crustal-scale fluid flow and the formation of world-class orogenic-gold deposits. Aust. J. Earth Sci. 2005, 52, 831–841. [Google Scholar] [CrossRef] [Scilit]
- Bassingthwaighte, J.B.; Raymond, G.M. Evaluating rescaled range analysis for time series. Ann. Biomed. Eng. 1994, 22, 432–444. [Google Scholar] [CrossRef] [Scilit] [PubMed]
- Mukherjee, B.; Srivardhan, V.; Roy, P.N.S. Identification of formation interfaces by using wavelet and Fourier transforms. J. Appl. Geophys. 2016, 128, 140–149. [Google Scholar] [CrossRef] [Scilit]
- Mukherjee, B.; Roy, P.N.S. Fractal analysis of logs to characterize the hydrocarbon and non-hydrocarbon zones of Bhogpara oil field, Northeast India. Arab. J. Geosci. 2017, 10, 497. [Google Scholar] [CrossRef] [Scilit]
- Mukherjee, B.; Sain, K. Vertical lithological proxy using statistical and artiffcial intelligence approach: A case study from Krishna-Godavari Basin, offshore India. Mar. Geophys. Res. 2021, 42, 3. [Google Scholar] [CrossRef] [Scilit]
- Pospiech, S.; van den Tolosana-Delgado, R.; Boogaart, K.G. Discriminant Analysis for Compositional Data Incorporating Cell-Wise Uncertainties. Math. Geosci. 2021, 53, 1–20. [Google Scholar] [CrossRef] [Scilit]
- Wang, X.; Liu, W.; Zhang, L.; Wu, W.; Ma, Q.; Song, J. Pore Structure and Fractal Dimension Analysis of Nephrite Deposits in Luanchuan, Western Henan, Central China. Minerals 2026, 16, 170. [Google Scholar] [CrossRef] [Scilit]
- Fattahi, M.H.; Talebbeydokhti, N.; Rakhshandehroo, G.R.; Shamsai, A.; Nikooee, E. The robust fractal analysis of time series: Concerning signal class and data length. Fractals 2011, 19, 29–49. [Google Scholar] [CrossRef] [Scilit]
- Souza, P.V.S.; Alves, R.L.; Balthazar, W.F. A Tool to Study Fractals in an Interdisciplinary Perspective. Phys. Teach. 2019, 57, 467–469. [Google Scholar] [CrossRef] [Scilit]

Disclaimer/Publisher’s Note: The statements, opinions and data contained in all publications are solely those of the individual author(s) and contributor(s) and not of MDPI and/or the editor(s). MDPI and/or the editor(s) disclaim responsibility for any injury to people or property resulting from any ideas, methods, instructions or products referred to in the content. |
© 2026 by the authors. Licensee MDPI, Basel, Switzerland. This article is an open access article distributed under the terms and conditions of the Creative Commons Attribution (CC BY) license.