


Abstract
This study integrates conventional sediment geochemistry with explainable machine learning to investigate the provenance of surface sediments from Wular Lake, Kashmir Valley, NW Himalaya. Twenty-two samples were analysed for 49 geochemical variables (10 major oxides, 25 trace elements and 14 rare earth elements), complemented by XRD mineralogy, which reveals an assemblage dominated by quartz, muscovite/illite, chlorite and feldspar. The Chemical Index of Alteration (CIA = 68.5–75.1, mean 72.1), corroborated by CIW, PIA and the A–CN–K trend, indicates moderate weathering under a cold temperate climate, and the Index of Compositional Variability (ICV > 1), together with uniformly low Zr/Sc ratios (3.4–6.0), which preclude significant zircon addition through recycling, records compositionally immature, first-cycle detrital input. Conventional discrimination ratios and the Herron system classify the sediments as geochemically equivalent to shale, and elevated Fe2O3/K2O (2.6–4.0), Al2O3/TiO2 (12.6–16.0), Cr/Th and Co/Th ratios record a substantial mafic imprint. Chondrite-normalised REE patterns show pronounced LREE enrichment ((La/Yb)N = 8.0–19.4), moderate negative Eu anomalies (Eu/Eu* = 0.56–0.73) and negligible Ce anomalies (Ce/Ce* = 0.98–1.03), with Eu/Eu* discriminating felsic crystalline from mafic volcanic contributions. A three-stage pipeline (principal component analysis (PCA) → random forest → SHapley Additive exPlanations (SHAP)) achieved a median leave-one-out cross-validation (LOO-CV) accuracy of 95.5% (n = 22; Wilson 95% CI 78%–99%), and unsupervised k-means clustering reproduced the same three geochemically distinct provenance end-members: siliceous-mature, detrital-mafic and carbonate-bearing, without reference to the assigned labels (Adjusted Rand Index = 1.0). Because the training labels derive from the same geochemical dataset, the classification quantifies the internal consistency of the provenance model, but does not provide independent validation. SHAP analysis reveals that trace elements (Cr, Co, Sc, Ni, Zn) carry greater discriminating power than do conventional major-oxide ratios, demonstrating that explainable machine learning robustly supplements and extends traditional provenance approaches.
Keywords:
Wular Lake; sediment geochemistry; provenance; REE; machine learning; SHAP; random forest; Kashmir Himalaya 1. Introduction
Lacustrine sediments serve as valuable archives of catchment geology, weathering processes, and sediment transport dynamics [1]. The geochemical composition of lake-bottom sediments reflects the integrated contributions of source lithologies, chemical weathering intensity, hydrodynamic sorting, and diagenetic modifications [2,3]. In tectonically active settings such as the Himalayan orogen, where multiple source terranes with contrasting geochemical signatures contribute detritus to a single basin, disentangling these contributions is both scientifically important and analytically challenging, and remains an active focus of provenance research in the region [4].
Wular Lake, situated in the Kashmir Valley of the northwestern Himalayas, receives sediment from a complex catchment underlain by the Higher Himalayan Crystalline Series (gneisses, schists and granites), the Permo-Carboniferous Panjal Trap basalts (basaltic–andesitic lava flows), and the Plio-Pleistocene Karewa Group sedimentary sequence (fluvio-lacustrine silts, sands and calcareous muds) [5]. Previous geochemical studies of Kashmir Valley lake sediments have relied predominantly on conventional analytical frameworks, which include bivariate discrimination diagrams [6,7], elemental ratio proxies [8,9], and weathering indices [3,10], which are well-established and have long been complemented by multivariate statistical methods such as discriminant function analysis [6] and factor and cluster analysis. The conventional diagram-based workflow nevertheless evaluates only a few variables at a time, so that part of the analytical information available in modern multi-element datasets often remains unused; the two families of methods are complementary rather than competing, and PCA in particular has an established record in statistical provenance analysis [11].
Recent advances in machine learning (ML) have begun to address this limitation in the Earth sciences, with applications ranging from automated SEM-based quantitative mineralogy [12] to multivariate provenance analysis [11]. Supervised and unsupervised ML methods have been applied to sediment provenance determination [13], geochemical classification of igneous rocks [14], and environmental geochemical mapping [15]. However, the application of explainable artificial intelligence (XAI) methods, particularly SHapley Additive exPlanations (SHAP) [16], to lacustrine sediment geochemistry has received only limited attention [17,18]. The critical gap is not the lack of ML applications per se, but the absence of interpretability. Most existing studies treat ML as a black box, reporting classification accuracy without providing element-level mechanistic insight.
This study addresses this gap by developing an integrated analytical framework that combines conventional geochemical methods with a three-stage interpretable ML pipeline. The conventional analyses comprise weathering indices, provenance ratios, sediment classification, enrichment factors and ternary diagrams to establish the baseline geochemical characterization. The ML pipeline consists of PCA, RF classification, and SHAP analysis, exploiting the full 49-element signature to validate provenance assignments and rank the discriminating elements. The specific objectives are: (1) to characterize the weathering intensity and provenance of Wular Lake sediments using established geochemical methods; (2) to apply RF classification with SHAP analysis to rank the discriminating elements and validate the provenance model; and (3) to evaluate whether SHAP analysis provides element-specific, quantitative provenance interpretations beyond those obtained from conventional geochemical approaches.
2. Geological Setting
The Kashmir Valley is an oval-shaped intermontane basin of the northwestern Himalayas, developed between the Pir Panjal Range to the southwest and the Zanskar Range of the Higher Himalaya to the northeast [19,20], and lineament fabric indicates strong structural control of the formation of Wular Lake [5,21,22,23]. The surrounding mountains rise to 5458 m above sea level, and the valley lies within a regionally subtropical climate belt dominated by westerly disturbances, but its high elevation (valley floor ≈ 1580 m; surrounding peaks > 5400 m) creates a cool montane environment with seasonally cold conditions [24], with temperatures of −2 °C to 32 °C and about 693 mm of annual rainfall. This high-relief, seasonally cold terrain favours physical over chemical weathering, sustaining high erosion and a large detrital flux into the lake [21,25].
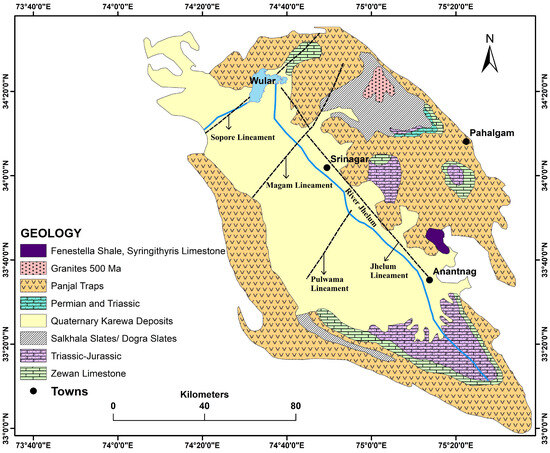
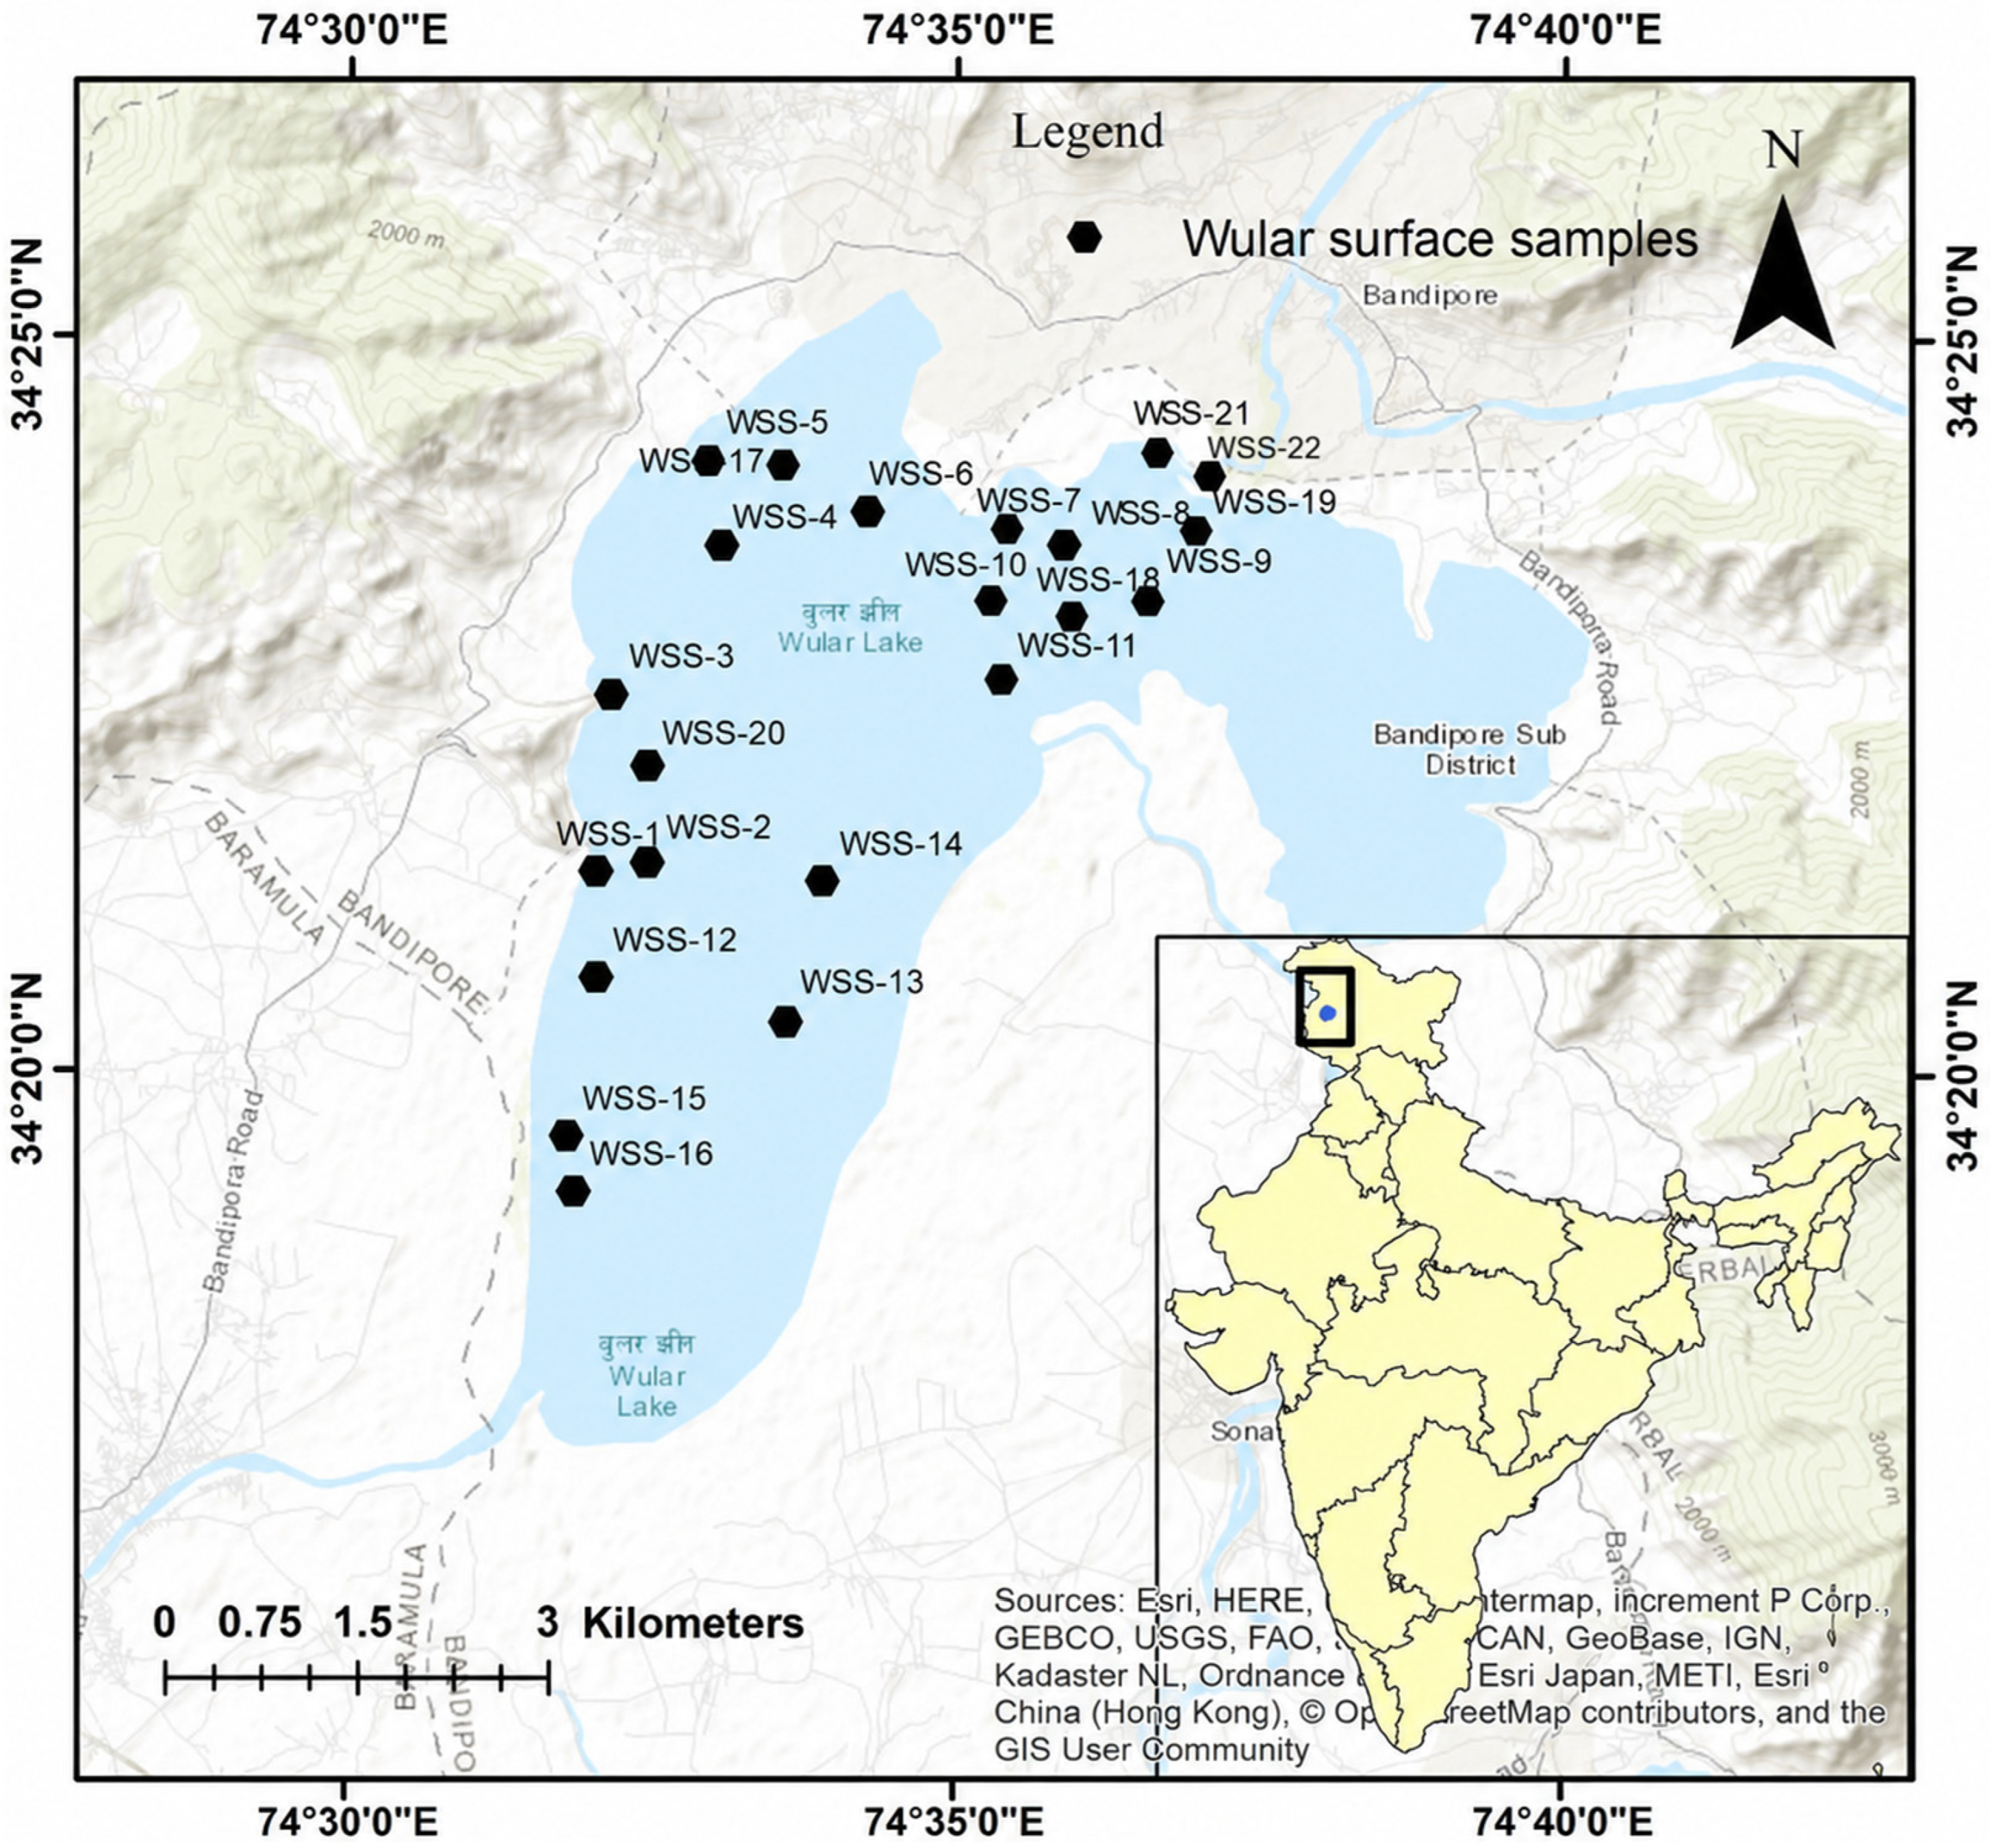
Wular Lake, the largest freshwater lake in India, lies about 34 km northwest of Srinagar at an altitude of 1580 m, between 34°16′–34°25′ N and 74°29′–74°40′ E [26] (Figure 1). The lake is elliptical, covering 112.77 km2 (16 km × 9.6 km) with a maximum depth of about 5 m, and was designated a Ramsar Wetland of International Importance in 1990 [25]. It is fed chiefly by the Jhelum River, which drains a catchment of ~10,196 km2, together with the Madhumati and Erin streams; this erosion-prone, anthropogenically disturbed catchment delivers a heavy silt load (1.25 mm/year) [27] that is progressively reducing the width and depth of the lake [5,22].
Figure 1.
Geological map of the study area modified after the work of Shah et al., 2020 [5].
The lithostratigraphy of the catchment spans the Precambrian to the Quaternary periods. The Precambrian Salkhala Group (phyllites, carbonaceous slates, marbles, dolomites and mica schists) is conformably overlain by the early Cambrian Dogra Slates [23]. The Panjal Traps, the upper unit of the Panjal volcanic series [28], are a thick succession of Upper Carboniferous to Lower Permian basaltic–andesitic lava flows overlying the agglomeratic slates [29,30,31]. They are succeeded by the fossiliferous Permian Zewan beds and compact, light-grey Triassic limestones [29,32]. The youngest major unit, the Plio-Pleistocene Karewa Group, is a roughly 1300 m thick fluviolacustrine to aeolian sequence [33,34,35,36] deposited in the former Karewa Lake.
Panjal Traps and limestone formations dominate the eastern and northern margins of the lake, whereas recent alluvium and Karewa deposits fringe its southern shore. Because the Karewa sediments were themselves derived mainly from the Panjal Traps [20,37], these volcanic rocks constitute the essential primary source for both the Karewa deposits and the modern lake fill; the composition of the Wular Lake sediments is therefore compared with the Panjal Trap volcanics of the Kashmir region [21,25]. This emphasis follows earlier work [5,20,21,25,37] and serves as a comparison baseline only: contributions from the crystalline, carbonate and alluvial units of the catchment are equally expected, and the three-end-member provenance model examined below explicitly allows for such mixed sources rather than assuming a single dominant contributor a priori.
3. Materials and Methods
3.1. Sampling and Analytical Methods
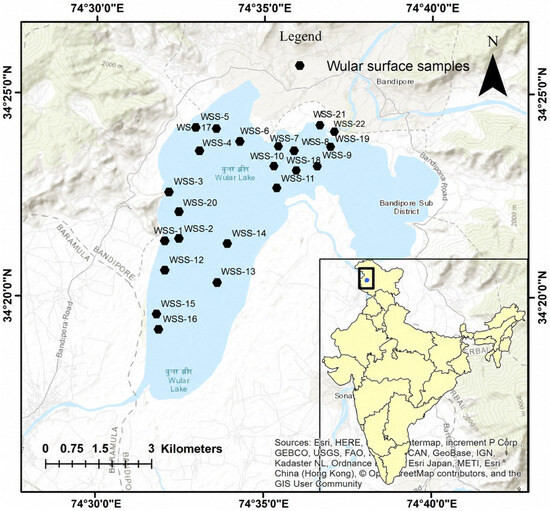
Twenty-two surface sediment samples (~500 g each) were collected by boat from sites spanning the major spatial extent of Wular Lake (Figure 2; Table S1). Sampling followed a spatial-coverage design of one site per ≈5.1 km2, constrained by boat accessibility and distributed across the lake’s principal depositional environments: the Jhelum inflow and outflow sectors, the deeper central basin, the northern and eastern margins fringed by Panjal Trap and Triassic limestone bedrock, and the southern shore fringed by Karewa deposits and recent alluvium. Because the lake is shallow (≤5 m), seasonally well-mixed and dominated by the Jhelum silt flux, this design resolves the lake-scale provenance gradients targeted here. At each site, the uppermost 5–10 cm of sediment was retrieved with a long-handled stainless-steel scoop in 2–5 m of water; given the high sedimentation rate sustained by the heavy silt load of the catchment [22], this interval integrates roughly the last few years to decades of deposition, smoothing seasonal variability while remaining representative of the modern sediment flux. Samples were sealed in polyethene bags and oven-dried at 40 °C to minimise mineralogical or chemical alteration. All analyses used bulk sediment; the −250 mesh grinding served to achieve analytical homogenisation only.
Figure 2.
Sampling locations of Wular Lake surface sediments (WSS), Kashmir Valley, NW Himalaya.
For geochemical determination of major oxides, a homogenised powder-pellet specimen (40 mm) is prepared by pressing the fine-powdered sample. The procedure commenced by adding boric acid, in a 1:10 ratio, as a binder to 9–10 g of the dried powdered sample; then, the specimen was placed into a moulded die. Then, the sample was placed under hydraulic pressure at 18–20 ton using a semi-automatic hydraulic machine. The major oxides estimation was carried out using WDXRF (Rigaku ZSX PrimusIII+, Rigaku Corporation, Tokyo, Japan) at the Department of Geology, A.M.U., Aligarh, India. The precision and accuracy of the analysis were determined using Geological Survey of Japan SA Bureau of Standards, Republic of South Africa (i.e., JSO-1 and SARM 41) [38,39] and were better than 5% and 8%, respectively. Total iron is expressed as Fe2O3 (Fe2O3T). The measured LOI (5.2–12.0 wt%) correlates only weakly with CaO (r = 0.11), indicating that it is dominated by organic matter and clay-bound structural water, with a subordinate carbonate contribution largely restricted to the carbonate-bearing group.
For trace element analysis of bulk samples, ~0.1 g of a sediment sample in a 15 mL Savillex vial was first treated with 1 mL H2O2 to remove organic matter and then reacted with 1 mL HCl to dissolve carbonates. It was then reacted with a mixture of 1 mL HF + 0.5 mL HNO3 and kept on a hotplate at 120 °C overnight for complete digestion of silicate phases and dried at 100 °C. About 2 mL of HNO3 and ~2 mL of Milli-Q water were added to the dried sample, which formed a clear solution indicating complete digestion. Then, the samples were transferred into a 15 mL centrifuge tube, the sample was increased to 10 mL using Milli-Q water, and was further diluted to a final dilution of 8000× for analysis in an Inductively Coupled Plasma Mass Spectrometer (Thermo Scientific, Bremen, Germany, iCAP-Q) at the Department of Earth Sciences, IITK, Kanpur, India. Along with two sample blanks, three USGS rock standards (BIR-1a, AGV-2, and BHVO-2) were also subjected to the same procedure as were the unknown samples. In total, around 39 elements, including trace elements and REEs, were analysed (standard and Kinetic Energy Discrimination (KED) modes of measurement) with bracketing standards. The instrument was calibrated using different dilutions of AGV-2 and BHVO-2 (both standards diluted by 5000× and 15,000×), and a blank. Indium was used as an internal standard, and BIR-1a was used as a check standard. The reproducibility of BIR-1a was within 5%–15% of the analytical uncertainty (see Supplementary Tables S3 and S4) [40].
Mineralogical identification was performed on randomly oriented powder mounts using a Shimadzu LabX XRD-6100 diffractometer (Shimadzu Corporation, Kyoto, Japan) (Cu Kα radiation; 40 kV accelerating voltage, 30 mA tube current) at the Department of Physics, AMU, Aligarh, India. Scans were acquired in θ–2θ geometry over 5–60° 2θ in continuous-scan mode at a scan speed of 8° min−1 with a sampling step of 0.02° 2θ, using 1° divergence, scatter slits, and a 0.3 mm receiving slit. The minerals of the bulk rock samples were identified using both 2θ and d values after processing the XRD file via X’Pert HighScore® Plus 3.0 software (PANAlytical) integrated with the ICDD PDF2 database at the Department of Geology, AMU, Aligarh, India.
3.2. Geochemical Methods
3.2.1. Chemical Weathering Indices
Five weathering indices were calculated to assess the degree of chemical alteration: the Chemical Index of Alteration (CIA = [Al2O3/(Al2O3 + CaO* + Na2O + K2O)] × 100) [3], where CaO* is corrected for non-silicate calcium following the method of McLennan [2]; the Chemical Index of Weathering (CIW) [10]; the Plagioclase Index of Alteration (PIA) [41]; the Index of Compositional Variability (ICV = (Fe2O3 + K2O + Na2O + CaO + MgO + MnO + TiO2)/Al2O3) [9] and the Mineralogical Index of Alteration (MIA) [42]. The samples were plotted in A–CN–K and A–CNK–FM ternary diagrams (Nesbitt and Young [43,44] to visualise weathering trends. CaO* represents Ca in the silicate fraction only and was computed following the method of McLennan [2]: CaO was first corrected for apatite using P2O5 (molar CaO − 10/3 × P2O5); when the remaining molar CaO exceeded molar Na2O, indicating a likely carbonate contribution, CaO* was set equal to Na2O; otherwise, the corrected value was accepted. The five indices are retained because they answer complementary questions: CIA is the primary weathering measure; CIW and PIA exclude K2O and thus test the sensitivity of the weathering assessment to potassium enrichment; ICV measures compositional maturity rather than weathering intensity; and MIA extends the assessment to the mafic-relevant oxides.
3.2.2. Provenance Discrimination
Provenance was assessed using elemental ratios including SiO2/Al2O3 (maturity indicator), K2O/Na2O (source composition), Fe2O3/K2O (mafic vs. felsic), and Al2O3/TiO2 (source discrimination) [45]. Sediment classification was performed using the Herron [6] log(SiO2/Al2O3) vs. log(Fe2O3/K2O) diagram and the Pettijohn et al. [46] log(SiO2/Al2O3) vs. log(Na2O/K2O) diagram; the latter scheme was devised for terrigenous sands and is applied here only for comparison with earlier studies.
In addition, immobile-element ratios (Th/Sc, Zr/Sc, La/Sc, Cr/Th and Co/Th), which are insensitive to chemical weathering and hydraulic sorting, were used to discriminate felsic from mafic contributions by comparison with Upper Continental Crust (UCC) values [47] and with the compositional ranges of sediments derived from silicic and basic source rocks [48]. Differences in key discriminating variables among the three provenance groups were tested via the non-parametric Kruskal–Wallis test, using exact permutation p-values (20,000 label permutations) appropriate to the small group sizes. To assess whether the three provenance groups emerge from the data independent of the analyst-assigned labels, unsupervised k-means and Ward hierarchical clustering (k = 3) were applied to the standardised 22 × 49 matrix and compared with the assigned groups using the Adjusted Rand Index (ARI) [49].
3.2.3. Enrichment Factors
Enrichment factors (EF) relative to Upper Continental Crust (UCC) [47] were calculated as EF = (Xi/Al2O3)sample/(Xi/Al2O3)UCC, with Al2O3 as the normalising element. Enrichment factors serve two purposes here: characterising source-inherited enrichments and weathering-related depletions (e.g., Ti contributed by mafic detritus; Na lost through plagioclase weathering) and screening for anthropogenic overprints on pollution-sensitive elements (Section 5.4). Al2O3 was chosen as the normaliser because Al is hosted in the detrital aluminosilicate fraction, is immobile during weathering and early diagenesis, and behaves near-conservatively in this dataset (Al2O3 = 13.7–18.0 wt%, RSD ≈ 7%) [50].
3.2.4. Rare Earth Element Analysis
REE concentrations were normalised to CI chondrite values [51] to evaluate fractionation patterns. The Eu anomaly was calculated as Eu/Eu* = EuN/√(SmN × GdN), where the subscript N denotes chondrite-normalised values. The Ce anomaly was calculated analogously as Ce/Ce* = CeN/√(LaN × PrN). LREE/HREE fractionation was assessed using (La/Yb)N and (Gd/Yb)N ratios.
3.3. Machine Learning Framework
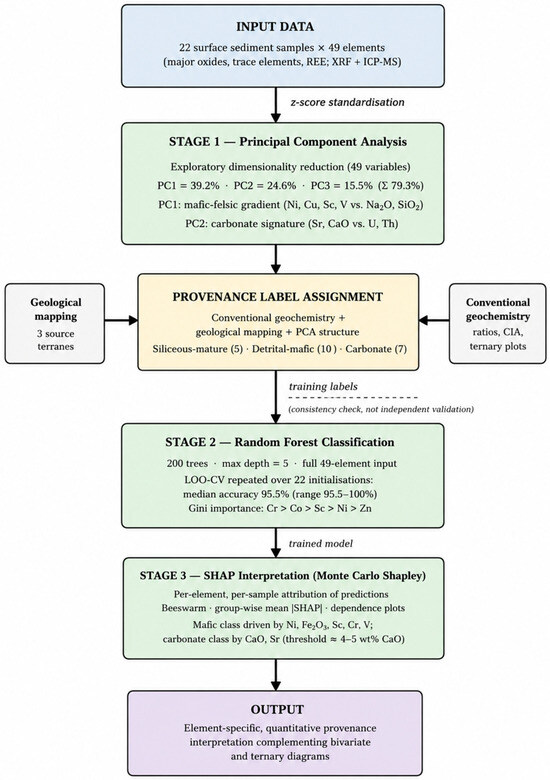
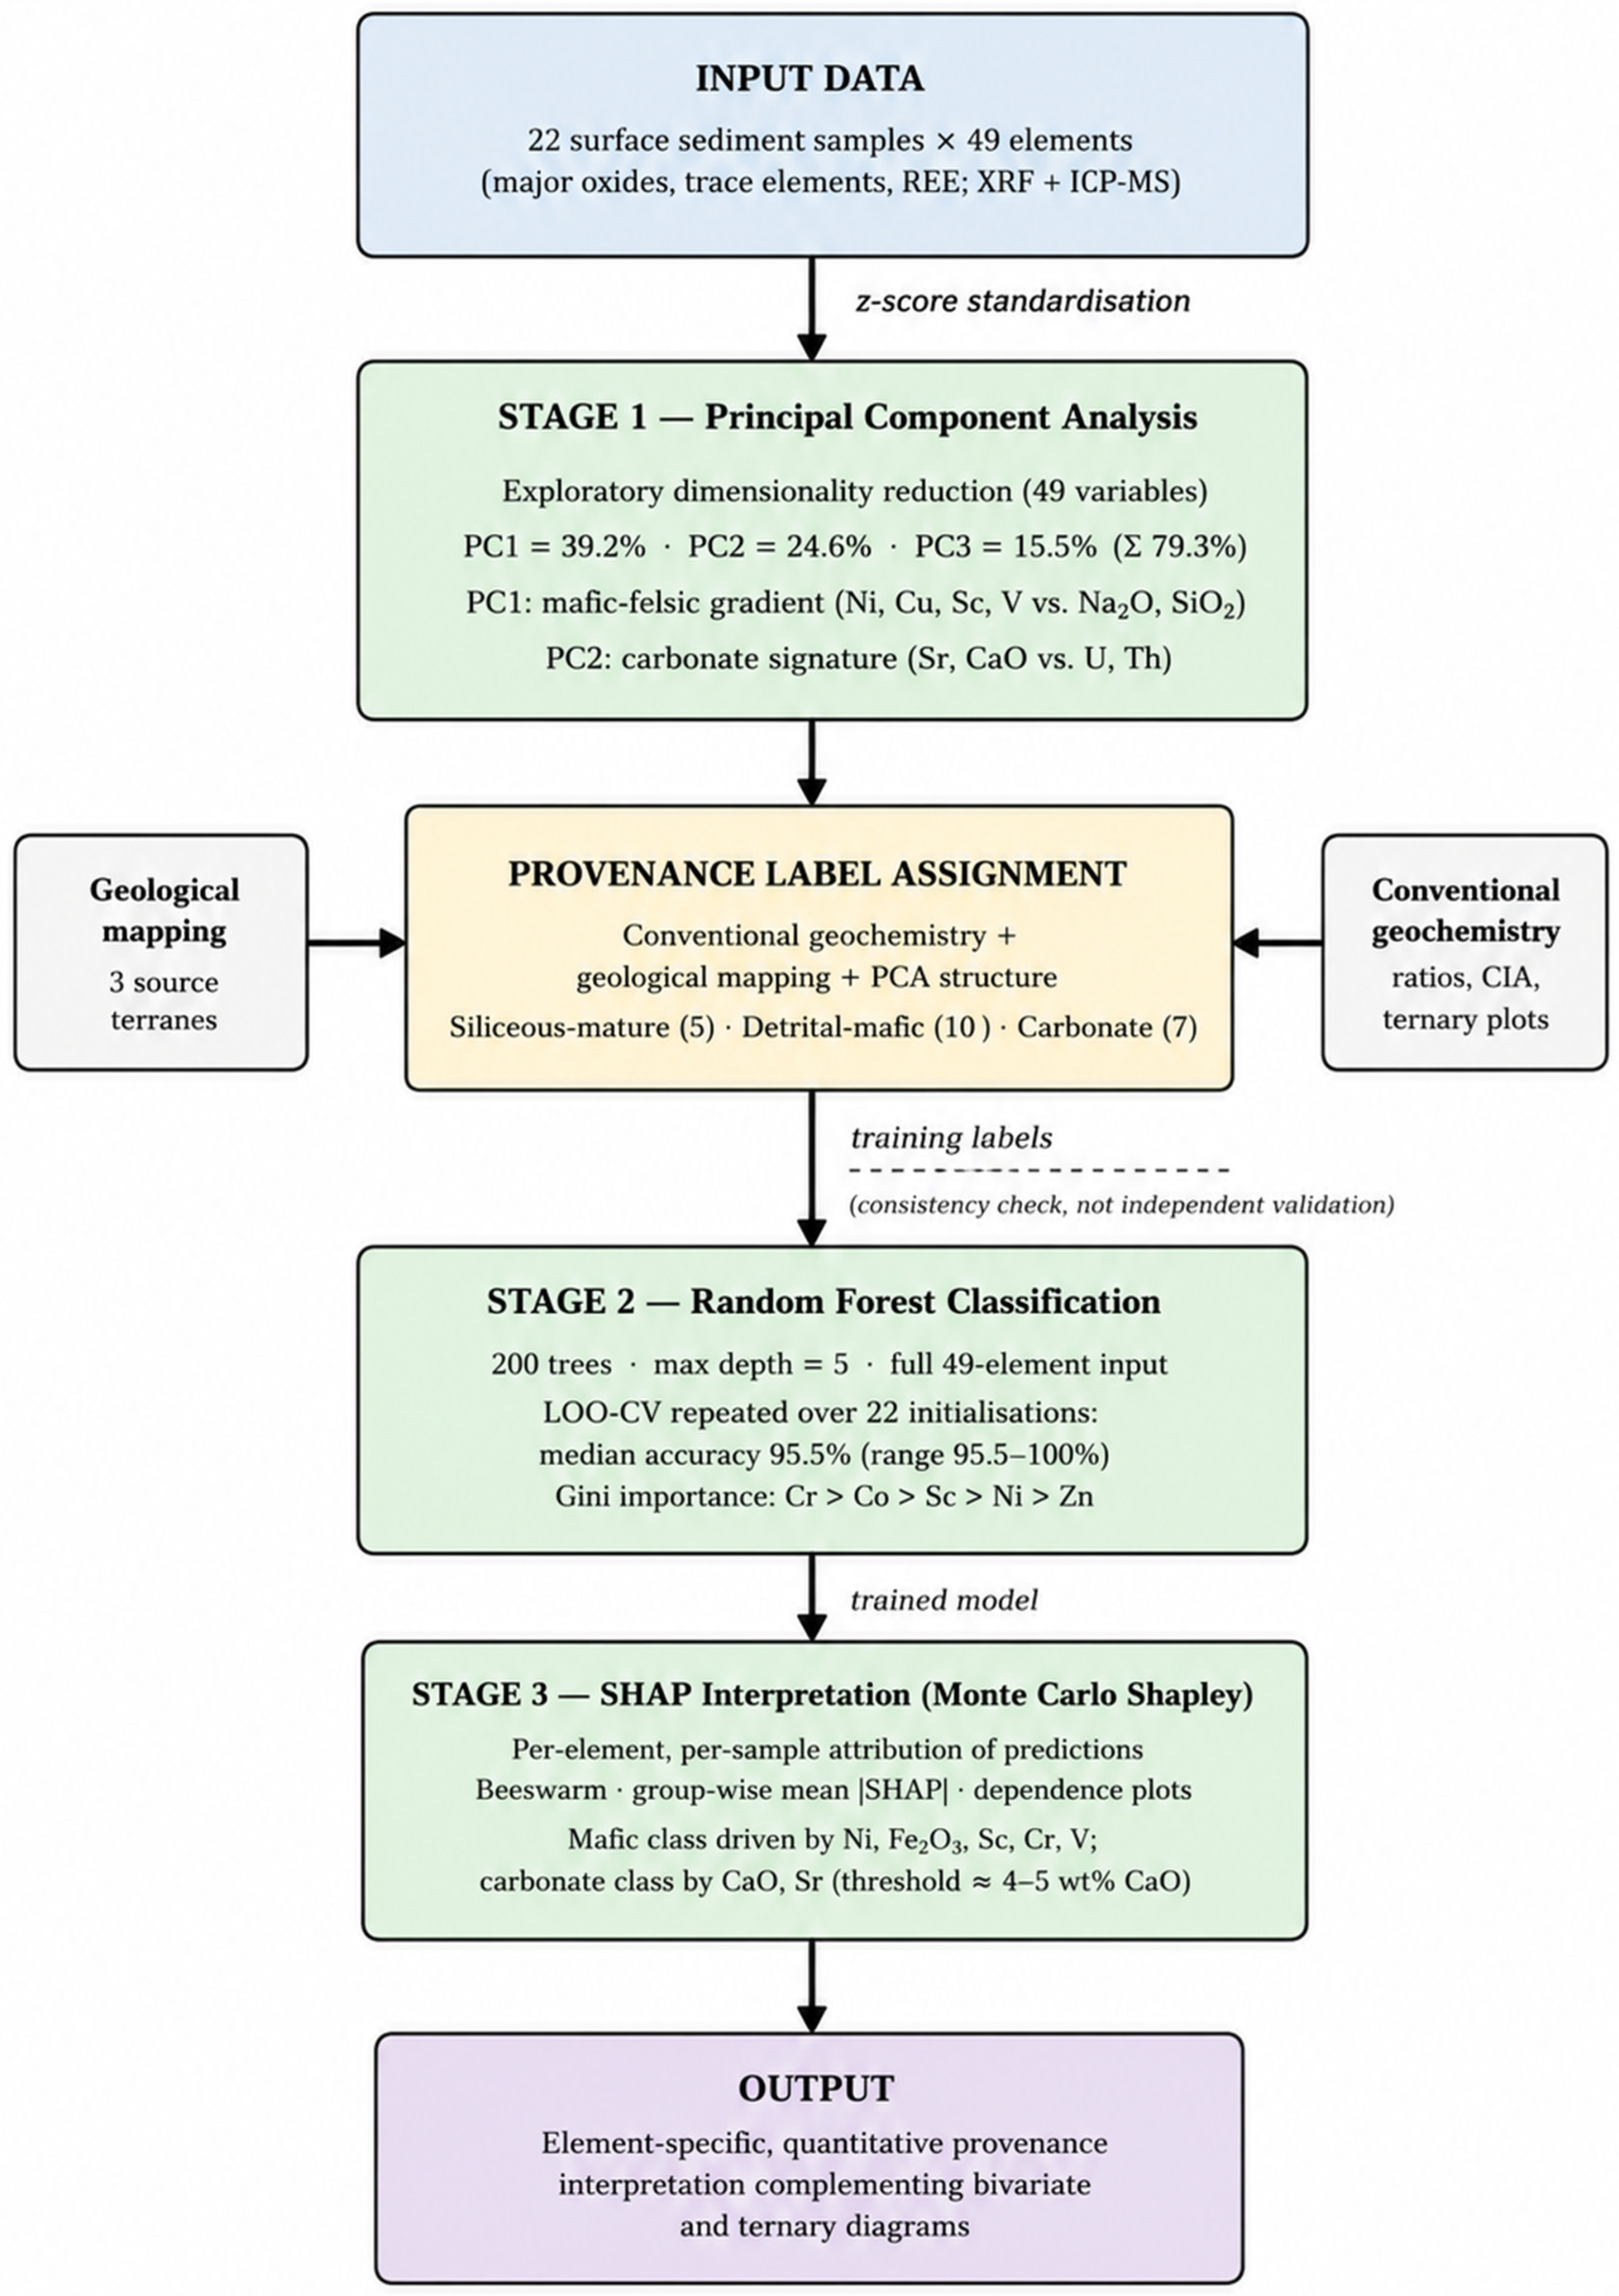
A three-stage interpretable ML pipeline was applied to the z-score-standardised 22 × 49 geochemical matrix (Figure 3): (1) exploratory dimensionality reduction by PCA, (2) supervised random forest classification, and (3) global model interpretation by SHAP. PCA serves an exploratory role only, visualising the dominant covariance structure and informing the geological interpretation; the random forest is trained on the original 49 standardised variables rather than on principal components, preserving element-level interpretability in the SHAP decomposition. z-score standardisation is required by PCA and places SHAP contributions on comparable scales; random forest is insensitive to monotonic rescaling, and the same matrix was used at all stages for consistency. All stages were implemented from first principles in Visual Studio Code using Python 3.11 and NumPy 2.0 with performed PCA via singular value decomposition (SVD); random forest was employed, with the Gini criterion, 200 trees, bootstrap aggregation, and seven candidate features per split; SHAP 0.47 by Monte Carlo permutation sampling was used [52]; no external machine-learning library was employed.
Figure 3.
The three-stage interpretable machine learning pipeline (PCA → random forest → SHAP) applied to the standardised 22 × 49 Wular Lake geochemical dataset.
3.3.1. Principal Component Analysis (PCA)
PCA [53] was applied to the standardised matrix to reduce the 49-dimensional geochemical space into uncorrelated principal components. Unlike a conventional PCA restricted to 10 major oxides, this analysis includes all trace elements and REE, capturing provenance signals that major oxides alone cannot resolve. The biplot displays both sample scores and variable loadings on PC1 vs. PC2.
3.3.2. Provenance Classification
Each sample was assigned to one of three provenance end-members: siliceous-mature (Higher Himalayan Crystallines), detrital-mafic (Panjal Traps) or carbonate-bearing (Karewa Group) using conventional geochemical criteria (Section 3.2), geological mapping and the PCA structure. These assignments served as training labels for the supervised classification. Because the labels are informed by the same geochemical data used to train the classifier, the cross-validation results measure the internal consistency and separability of the assigned groups. The random forest assesses the coherence of the geochemical classification, not provenance itself, and provides independent validation.
3.3.3. Random Forest Classification
A random forest classifier [54] was trained using provenance labels assigned from conventional geochemical criteria and geological mapping of the three principal source terranes identified in Section 2 (Higher Himalayan Crystalline Series, Panjal Trap basalts, Karewa Group). The hyperparameters (200 trees; maximum depth 5; seven candidate features per split, ≈√49) were fixed a priori as deliberately conservative choices rather than tuned: shallow trees act as regularisation for the small sample size, and hyperparameter optimisation was intentionally avoided because tuning against cross-validation performance at n = 22 would itself risk overfitting through selection. Performance was evaluated by leave-one-out cross-validation (LOO-CV), appropriate for small datasets, with the procedure repeated across 22 random seeds to quantify sensitivity to stochastic initialisation. Gini importance ranked features by discriminative power.
3.3.4. SHAP Analysis
SHAP values [16] were estimated by Monte Carlo permutation sampling of feature contributions [52], decomposing each prediction into per-element contributions. Monte Carlo permutation sampling [52] was preferred over TreeSHAP because the entire pipeline is implemented from first principles in NumPy 2.0, without external machine-learning libraries (Section 3.3): the model-agnostic permutation estimator applies directly to this custom ensemble, and its sampling error is negligible for a feature space of this size, whereas TreeSHAP would have required adopting the tree structures of the SHAPlibrary. Three visualisations were generated: beeswarm plots (per-sample attributions), summary bar plots (mean absolute SHAP per provenance group), and dependence plots (feature value vs. SHAP value, coloured by an interacting feature).
4. Results
4.1. Mineralogy
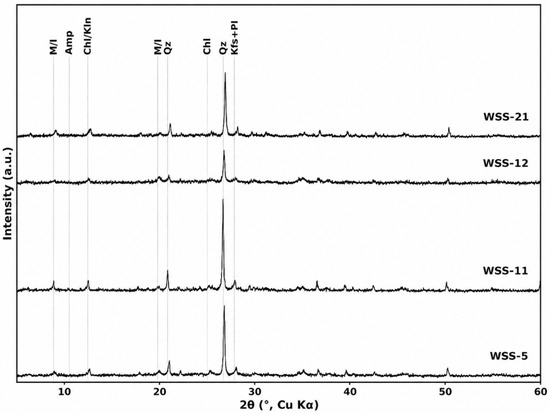
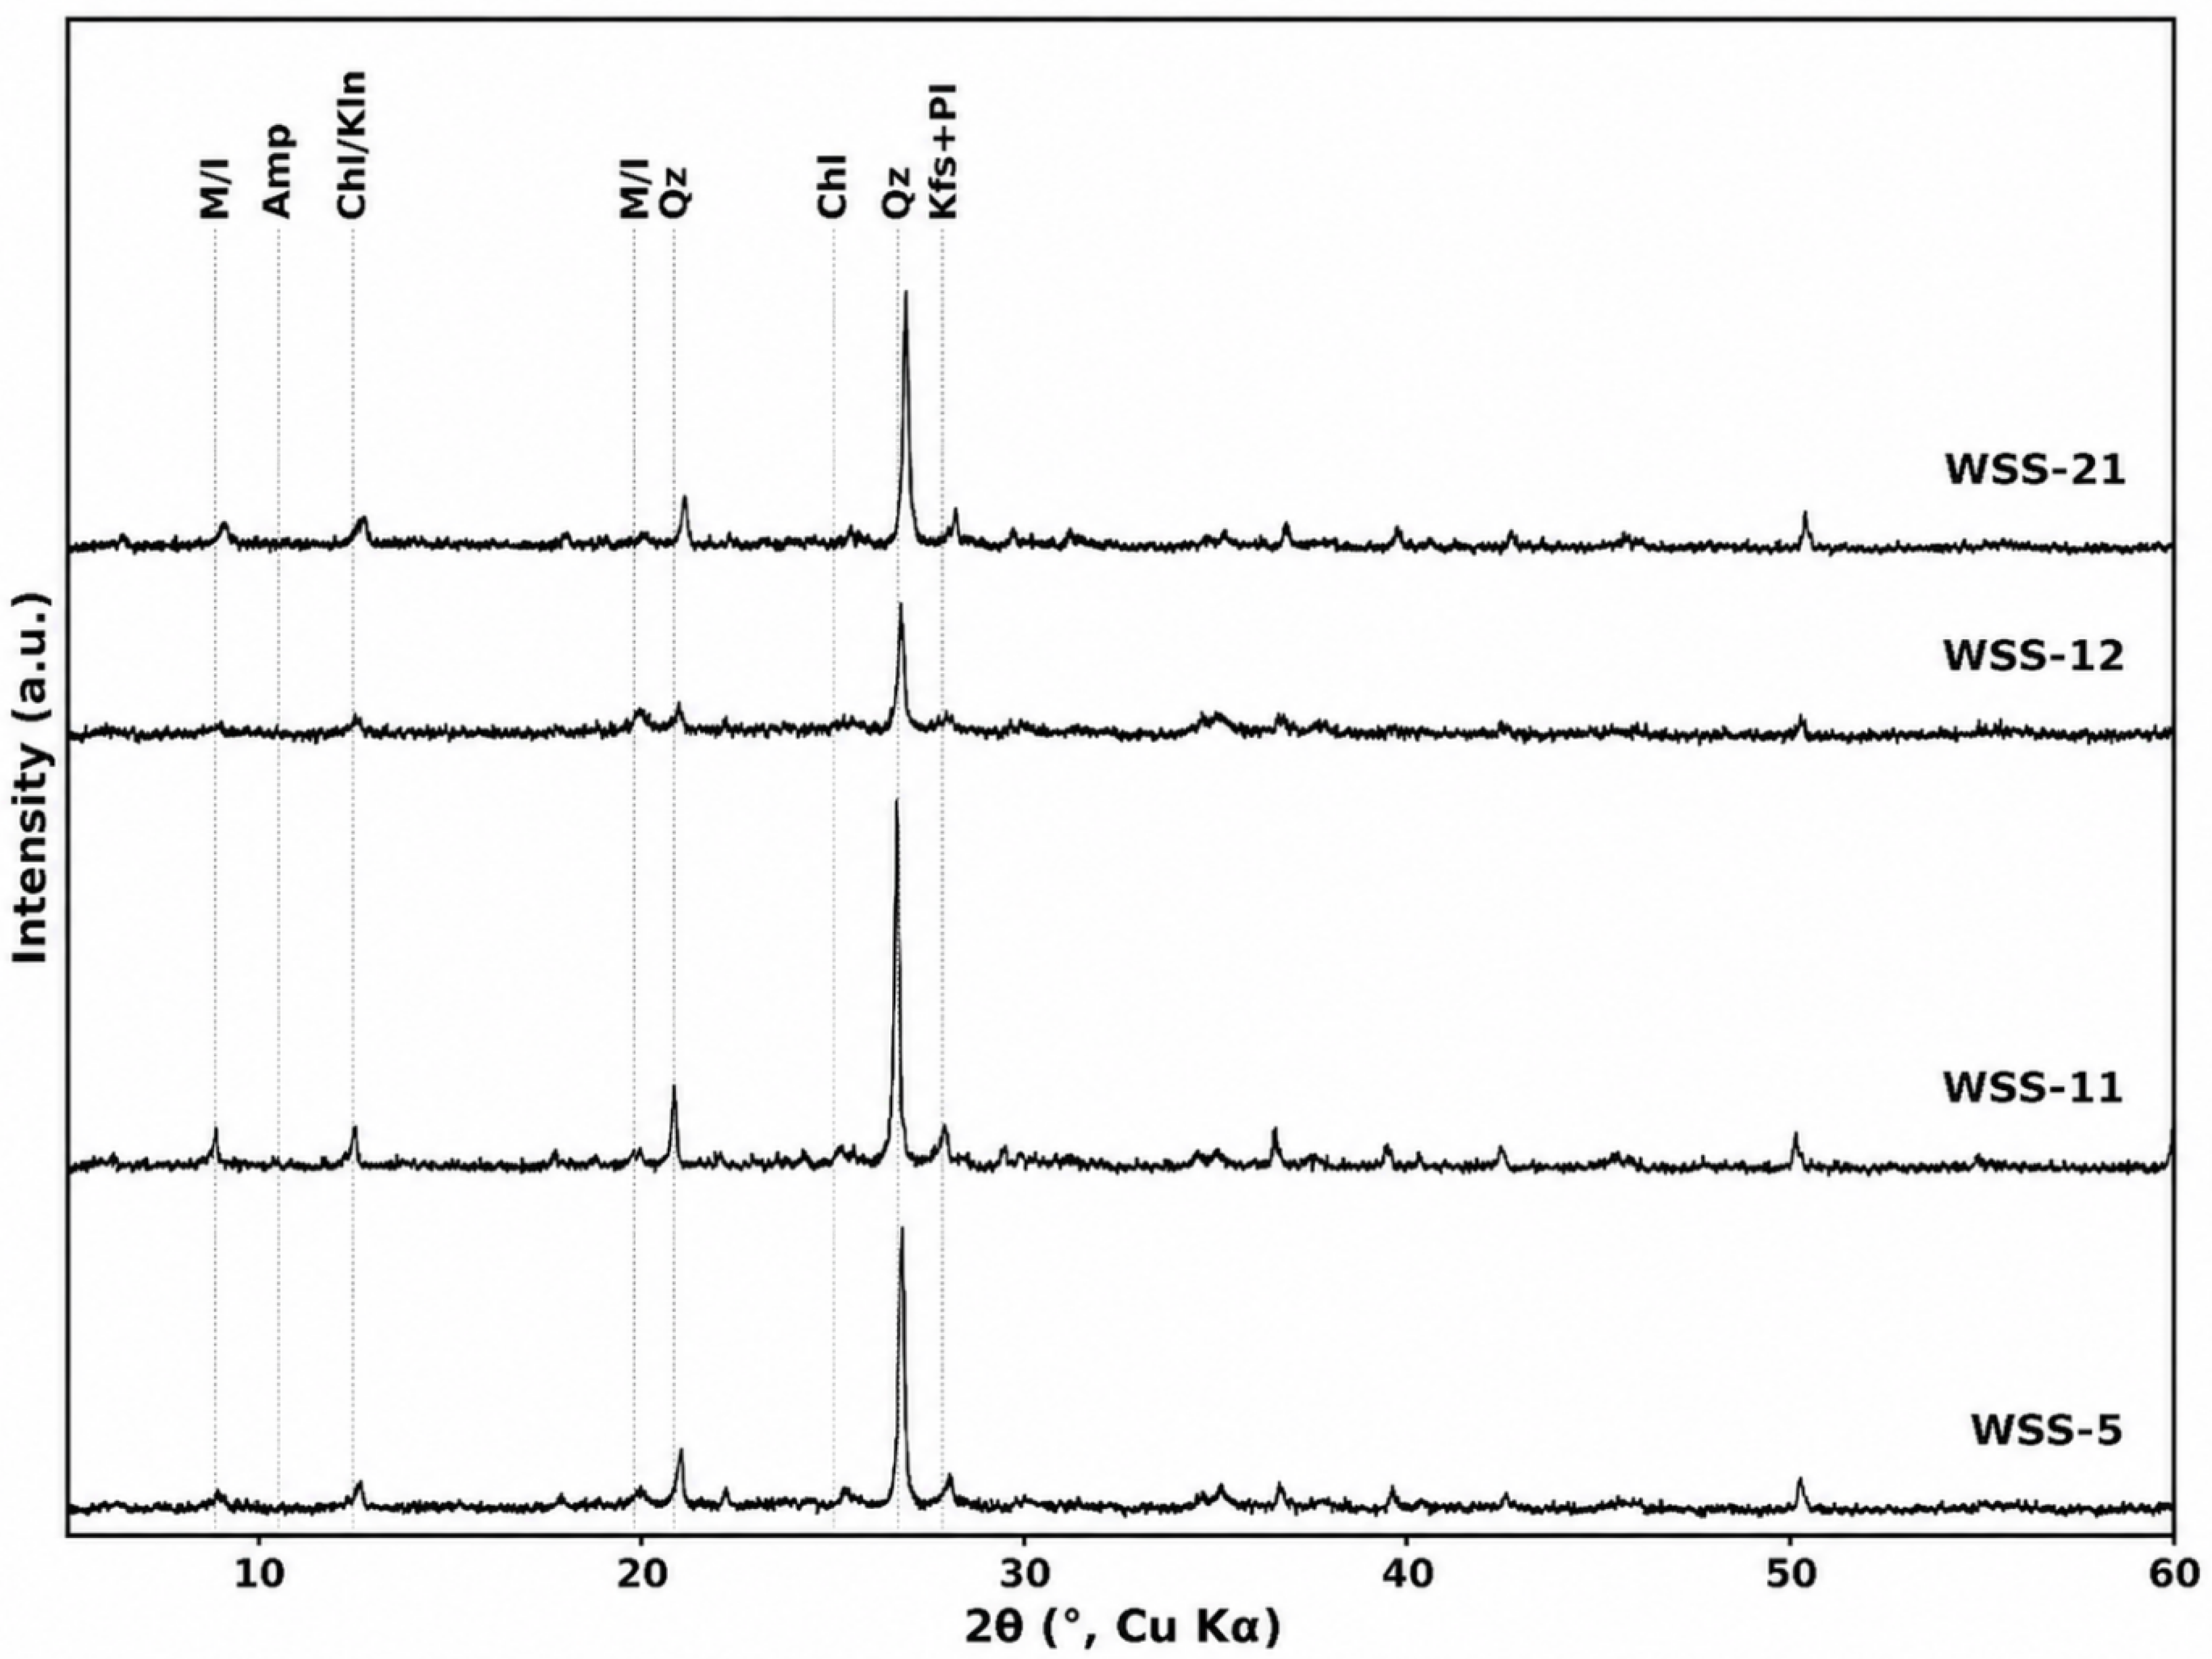
XRD analysis reveals a consistent mineral assemblage across all samples, dominated by quartz (primary peak at 2θ = 26.6°, d = 3.34 Å), muscovite/illite (d = 10.0, 4.48 Å), chlorite (d = 7.08, 3.55 Å), and feldspar, including both K-feldspar (d = 3.24 Å) and plagioclase (d = 3.18–3.20 Å). Subordinate amounts of amphibole (d = 8.40 Å) and kaolinite (d = 7.15, 3.58 Å) are present in some samples (Figure 4).
Figure 4.
XRD patterns of selected surface sediment samples from Wular Lake. Mineral abbreviations are as follows: Qz, quartz; M/I, muscovite/illite; Amp, amphibole; Chl, chlorite; Kln, kaolinite; Kfs, K-feldspar; and Pl, plagioclase.
This assemblage is consistent with derivation from metamorphic and volcanic source rocks: quartz and muscovite/illite from the Higher Himalayan Crystallines, chlorite and amphibole from the Panjal Trap mafic volcanics, and feldspar from both sources. These attributions are permissive rather than unique. Quartz, feldspar, chlorite and amphibole occur in more than one unit of the catchment and rest on the coherence of the assemblage with catchment geology and with the geochemical evidence presented below, rather than on mineralogy alone. The preservation of primary feldspar indicates that chemical weathering has not progressed to completion, consistent with the moderate CIA values discussed below.
No discrete carbonate peaks were resolved in the XRD patterns of the selected samples shown in Figure 4. This is not inconsistent with the carbonate-bearing provenance group identified below (Section 4.5.2): the group-mean CaO of 4.6 wt% corresponds to roughly 8 wt% calcite equivalents, close to the practical detection limit of conventional powder XRD for a minor phase dispersed in a clay-rich, multiphase matrix, and the samples selected for XRD were not the most CaO-rich. The carbonate designation rests instead on the coherent geochemical fingerprint of the group: CaO co-varies strongly with Sr (r = 0.91), the element that substitutes most readily for Ca in calcite, whereas the CaO–Na2O correlation expected if plagioclase controlled the Ca budget is much weaker (r = 0.43), and amphibole is only a subordinate phase. The eastern and northern catchment supplies detrital carbonate from the Triassic limestones and calcareous Karewa horizons, and a contribution from biogenic carbonate (mollusc shell debris and ostracod valves, common in the littoral zones of Kashmir Valley lakes) is also plausible; the term ‘carbonate-bearing’ is therefore used here in the sense of a carbonate-influenced, Ca–Sr-enriched geochemical signature rather than as a mineralogically confirmed carbonate assemblage.
4.2. Major and Trace Element Geochemistry
The Wular Lake sediments are characterised by SiO2 = 49.4–61.1 wt% (mean 53.9), Al2O3 = 13.7–18.0 wt% (mean 16.2), Fe2O3 = 6.7–12.2 wt% (mean 9.2), and CaO = 1.1–7.2 wt% (mean 2.6) (Table 1).
Table 1.
Major oxide concentrations (wt%) and chemical weathering indices of Wular Lake surface sediments, summarised by provenance group as the mean (range). CaO* is corrected following the method of McLennan [2] using molar proportions. Full per-sample data are given in Supplementary Table S2.
Enrichment factors relative to UCC show consistent TiO2 enrichment (EF = 1.63 mean), in harmony with a contribution from Ti-bearing phases. Na2O is systematically depleted (EF = 0.27), consistent with preferential loss of Na-bearing plagioclase during weathering. K2O is near UCC levels (EF ≈ 1.0), consistent with the retention of K in muscovite and illite. Fe2O3 enrichment (EF = 1.4–2.2) is highest in the southern and western sampling stations, suggesting a spatial gradient in mafic source contribution. Trace element concentrations are presented in Supplementary Table S3.
Rare Earth Element Pattern
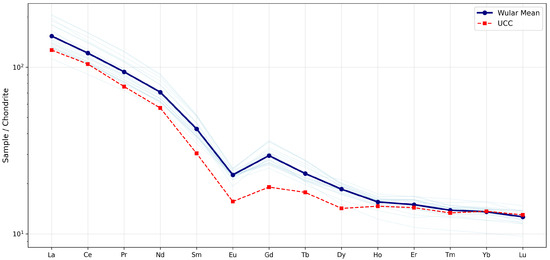
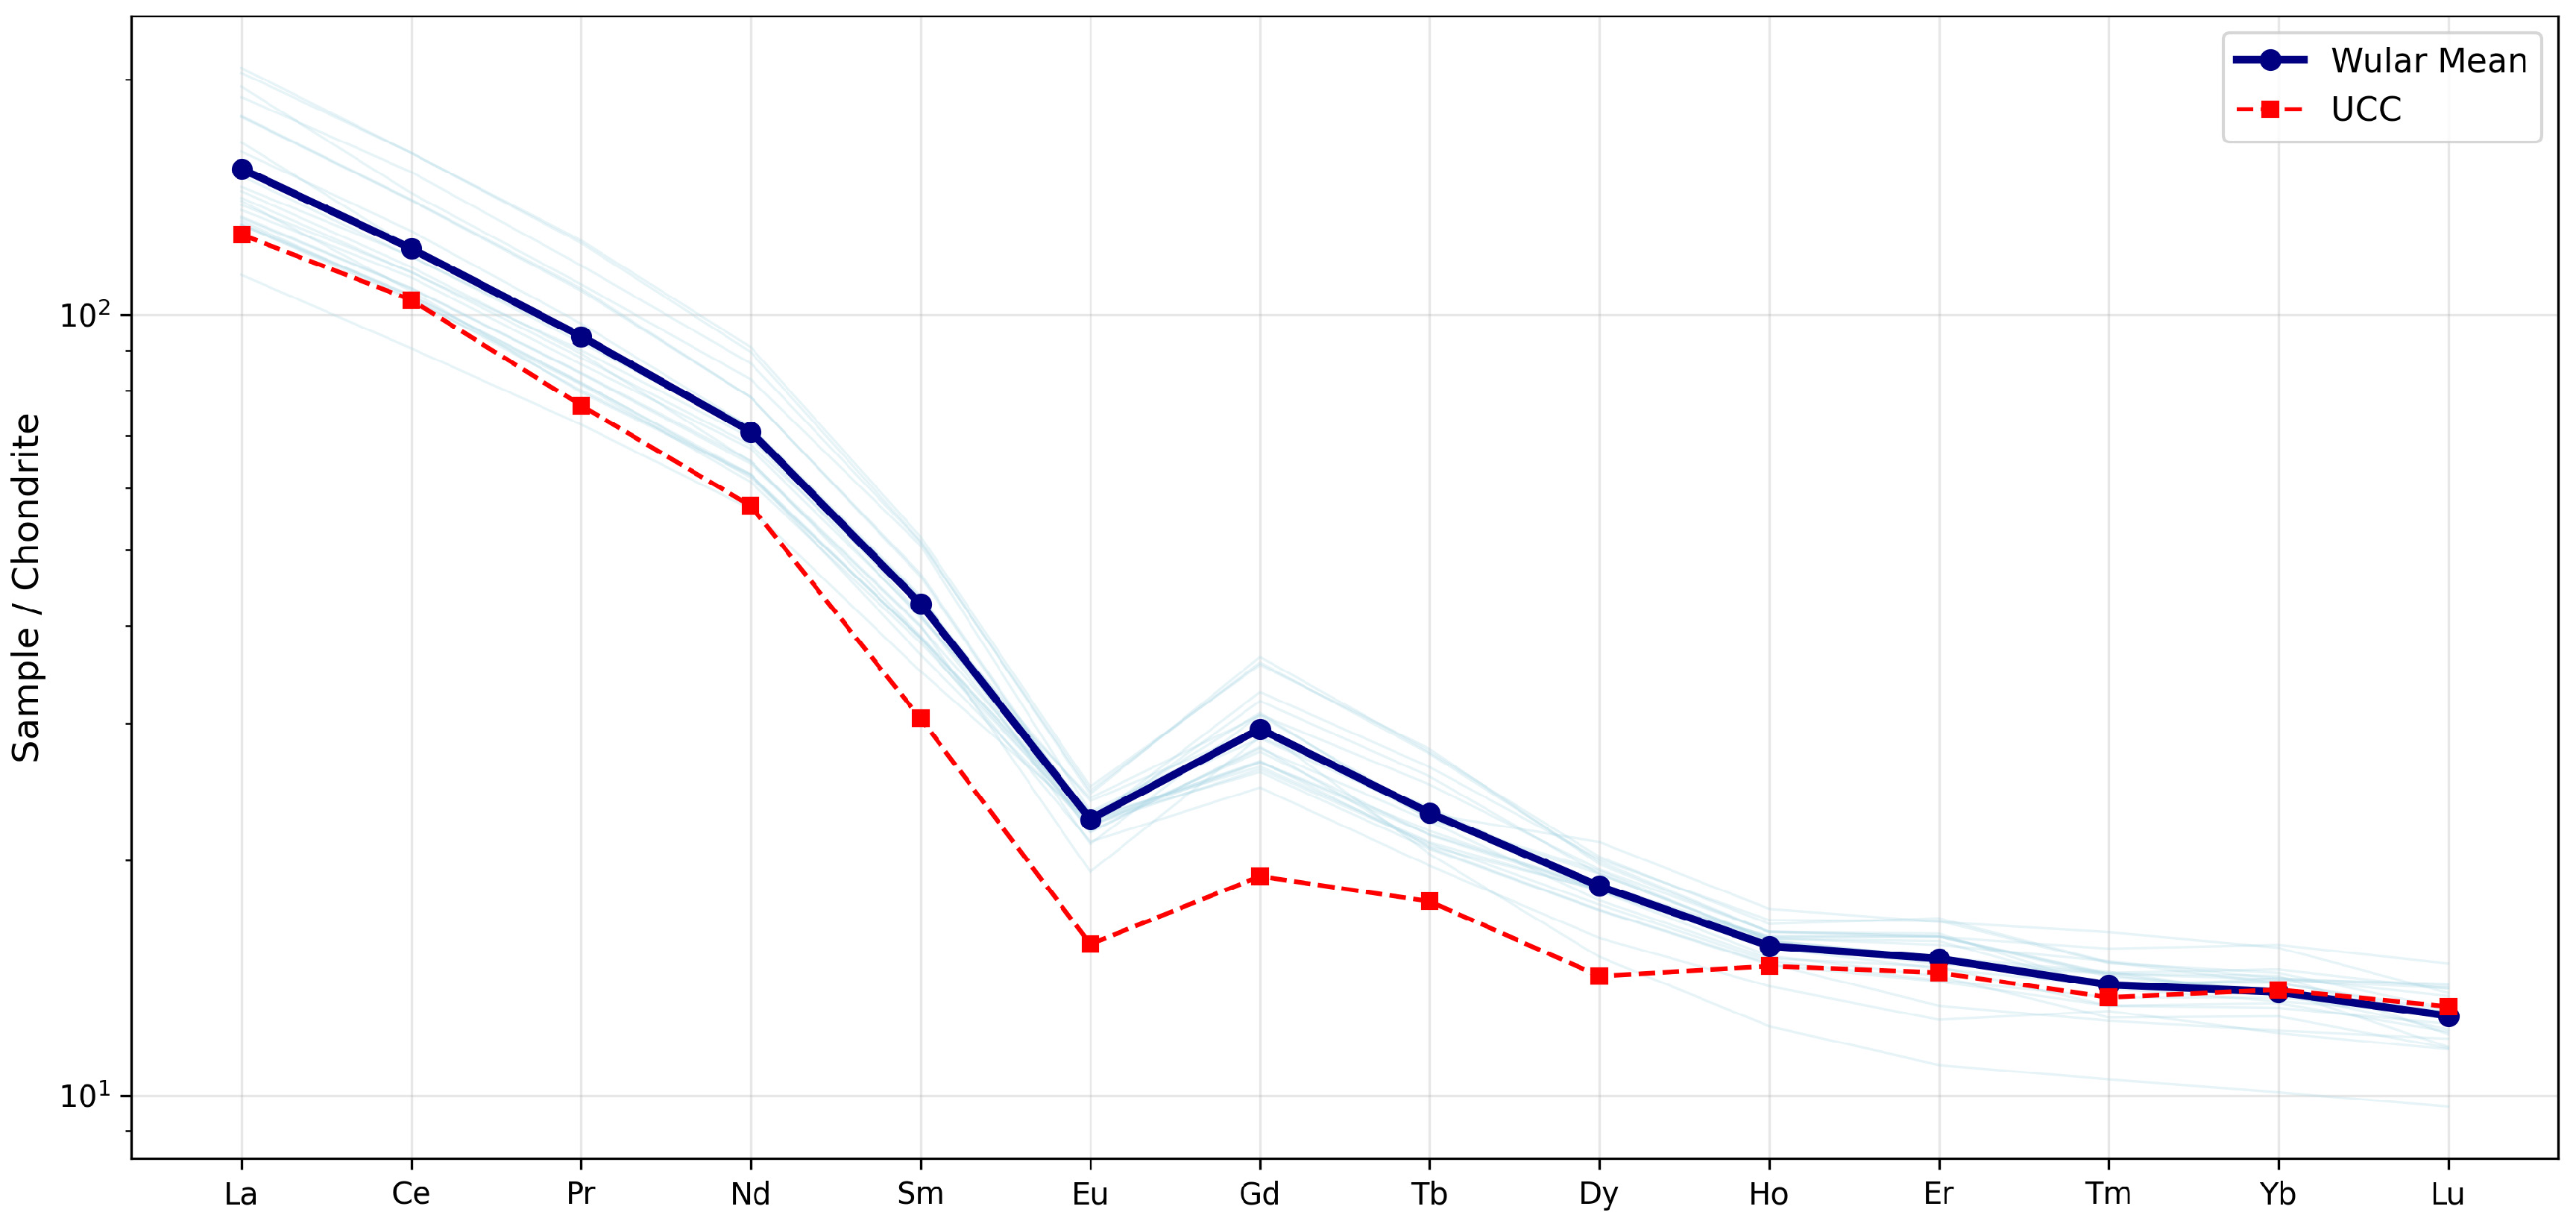
Chondrite-normalised REE patterns (Figure 5; Table 2) display consistent LREE enrichment and moderately fractionated HREE segments across all 22 samples. Total REE concentrations range from 138.0 to 229.2 ppm (mean 176.9 ppm), with LREE/HREE ratios of 7.1–12.8 (mean 9.2). The (La/Yb)N ratios of 8.0–19.4 (mean 11.5) indicate pronounced LREE fractionation, while (Gd/Yb)N ratios of 1.8–2.9 (mean 2.2) indicate moderate fractionation within the HREE. All samples exhibit moderate negative Eu anomalies (Eu/Eu* = 0.56–0.73, mean 0.64), inherited from source rocks in which plagioclase fractionation during intracrustal magmatic differentiation depleted Eu relative to that of its neighbouring REE. Ce anomalies are negligible (Ce/Ce* = 0.98–1.03, mean 1.01), confirming that the sediments have not been significantly affected by redox-sensitive Ce fractionation. PAAS-normalised patterns were also examined: they are nearly flat, with mean (La/Yb) relative to PAAS of 1.25, consistent with a typical post-Archaean upper-crustal REE budget [55]; chondrite normalisation is retained in the figures for direct comparability with the Panjal Trap and regional literature [51].
Figure 5.
Chondrite-normalised REE patterns [51] of Wular Lake surface sediments (light traces), the dataset mean (blue), and upper continental crust (UCC; red) [47].
Table 2.
Chondrite-normalised REE parameters [51] of Wular Lake surface sediments by provenance group, mean (range). Full per-sample REE concentrations are given in Supplementary Table S4.
The REE patterns show systematic variation among the three provenance groups identified from conventional geochemistry and geological mapping. Samples from the Higher Himalayan Crystalline-dominated sites (WSS-7, WSS-8, WSS-9, WSS-21, WSS-22) exhibit the highest ΣREE (mean 215.2 ppm), the strongest negative Eu anomalies (Eu/Eu* = 0.56–0.58, mean 0.57), and consistently high LREE/HREE fractionation ((La/Yb)N = 12.5–14.6), consistent with derivation from evolved felsic crystalline sources, where feldspar fractionation produces pronounced Eu depletion. The Panjal Trap-dominated samples (WSS-1, WSS-2, WSS-3, WSS-12–17, WSS-20) have the lowest ΣREE (mean 156.8 ppm) but the weakest Eu anomalies (Eu/Eu* = 0.67–0.73, mean 0.70), reflecting the mafic volcanic contribution, where less feldspar fractionation yields REE patterns closer to those of the source. The carbonate-influenced samples (WSS-4–6, WSS-10–11, WSS-18–19) show intermediate values (ΣREE = 178.2 ppm, Eu/Eu* = 0.57–0.65), suggesting mixed input from both crystalline and volcanic sources, with additional carbonate dilution from the Karewa Group. Notably, this group is the most heterogeneous in regards to LREE fractionation ((La/Yb)N = 10.5–19.4): sample WSS-18, the boundary sample misclassified in the random forest cross-validation, records the highest (La/Yb)N ratio in the dataset; this felsic-like REE signature explains its recurrent assignment to the siliceous-mature class in the cross-validation.
4.3. Chemical Weathering Assessment
The Chemical Index of Alteration ranges from 68.5 to 75.1 (mean 72.1), indicating moderate silicate weathering (Table 1). The CIW (79.0–88.3, mean 84.1) and PIA (75.3–85.8, mean 80.9) values corroborate this assessment, with both indices recording slightly higher apparent weathering than CIA because their formulations exclude K2O. The ICV ranges from 1.05 to 1.59 (mean 1.26), with all samples exceeding unity, confirming that the sediments are compositionally immature and dominated by first-cycle detrital input with minimal recycling [8]. The MIA values (45.7–69.0, mean 62.8) further support moderate weathering, consistent with the cold-temperate climate of the Kashmir Valley, where seasonal snowmelt and cool temperatures limit the intensity of chemical alteration.
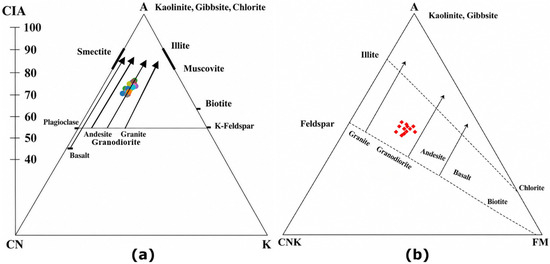
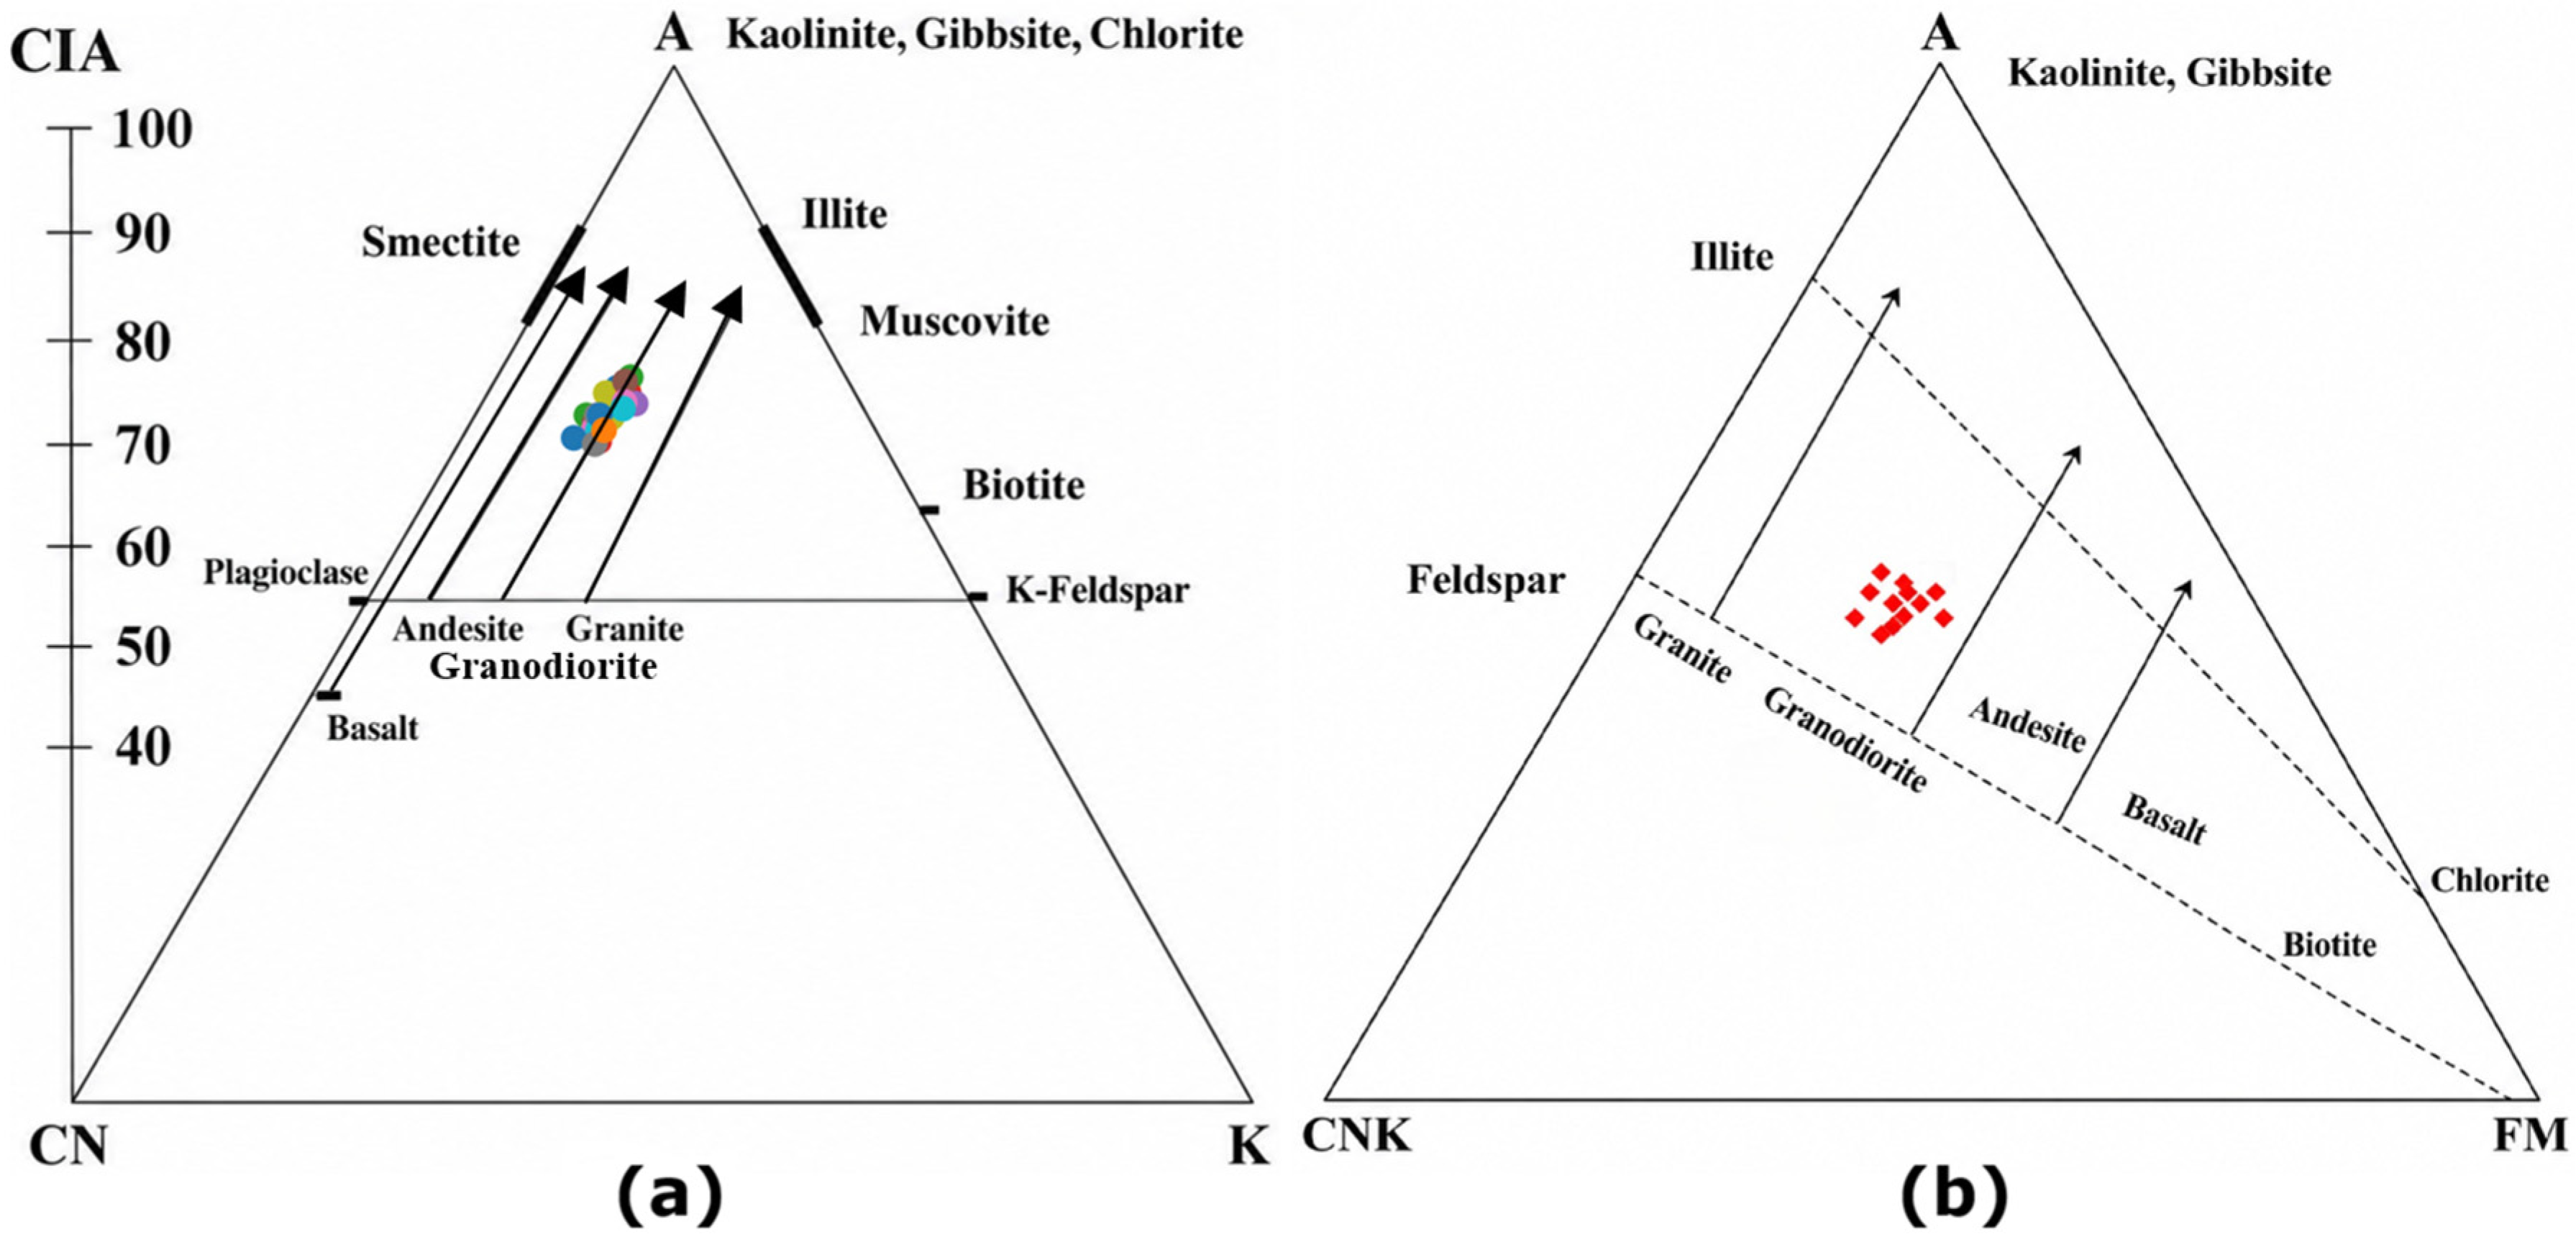
On the A–CN–K ternary diagram (Figure 6a), the samples plot along a trend sub-parallel to the A–CN join between the plagioclase–K-feldspar join and the muscovite–illite composition, consistent with progressive removal of Na and Ca during feldspar hydrolysis, while K is retained in mica phases [43]. The A–CNK–FM ternary (Figure 6b) shows samples displaced toward the FM apex relative to the average UCC, reflecting the significant contribution of ferromagnesian material from the Panjal Trap volcanics.
Figure 6.
(a) A–CN–K and (b) A–CNK–FM ternary diagrams [43,44] for Wular Lake surface sediments.
4.4. Sediment Classification and Provenance
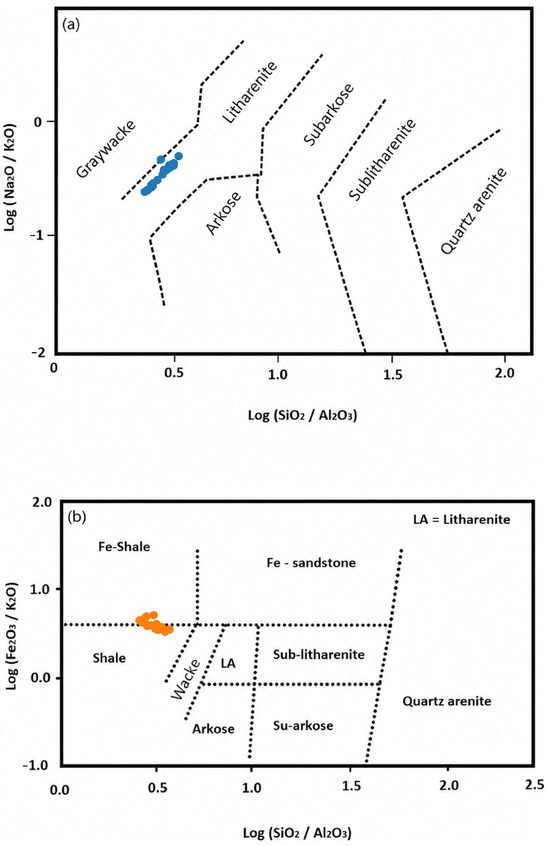
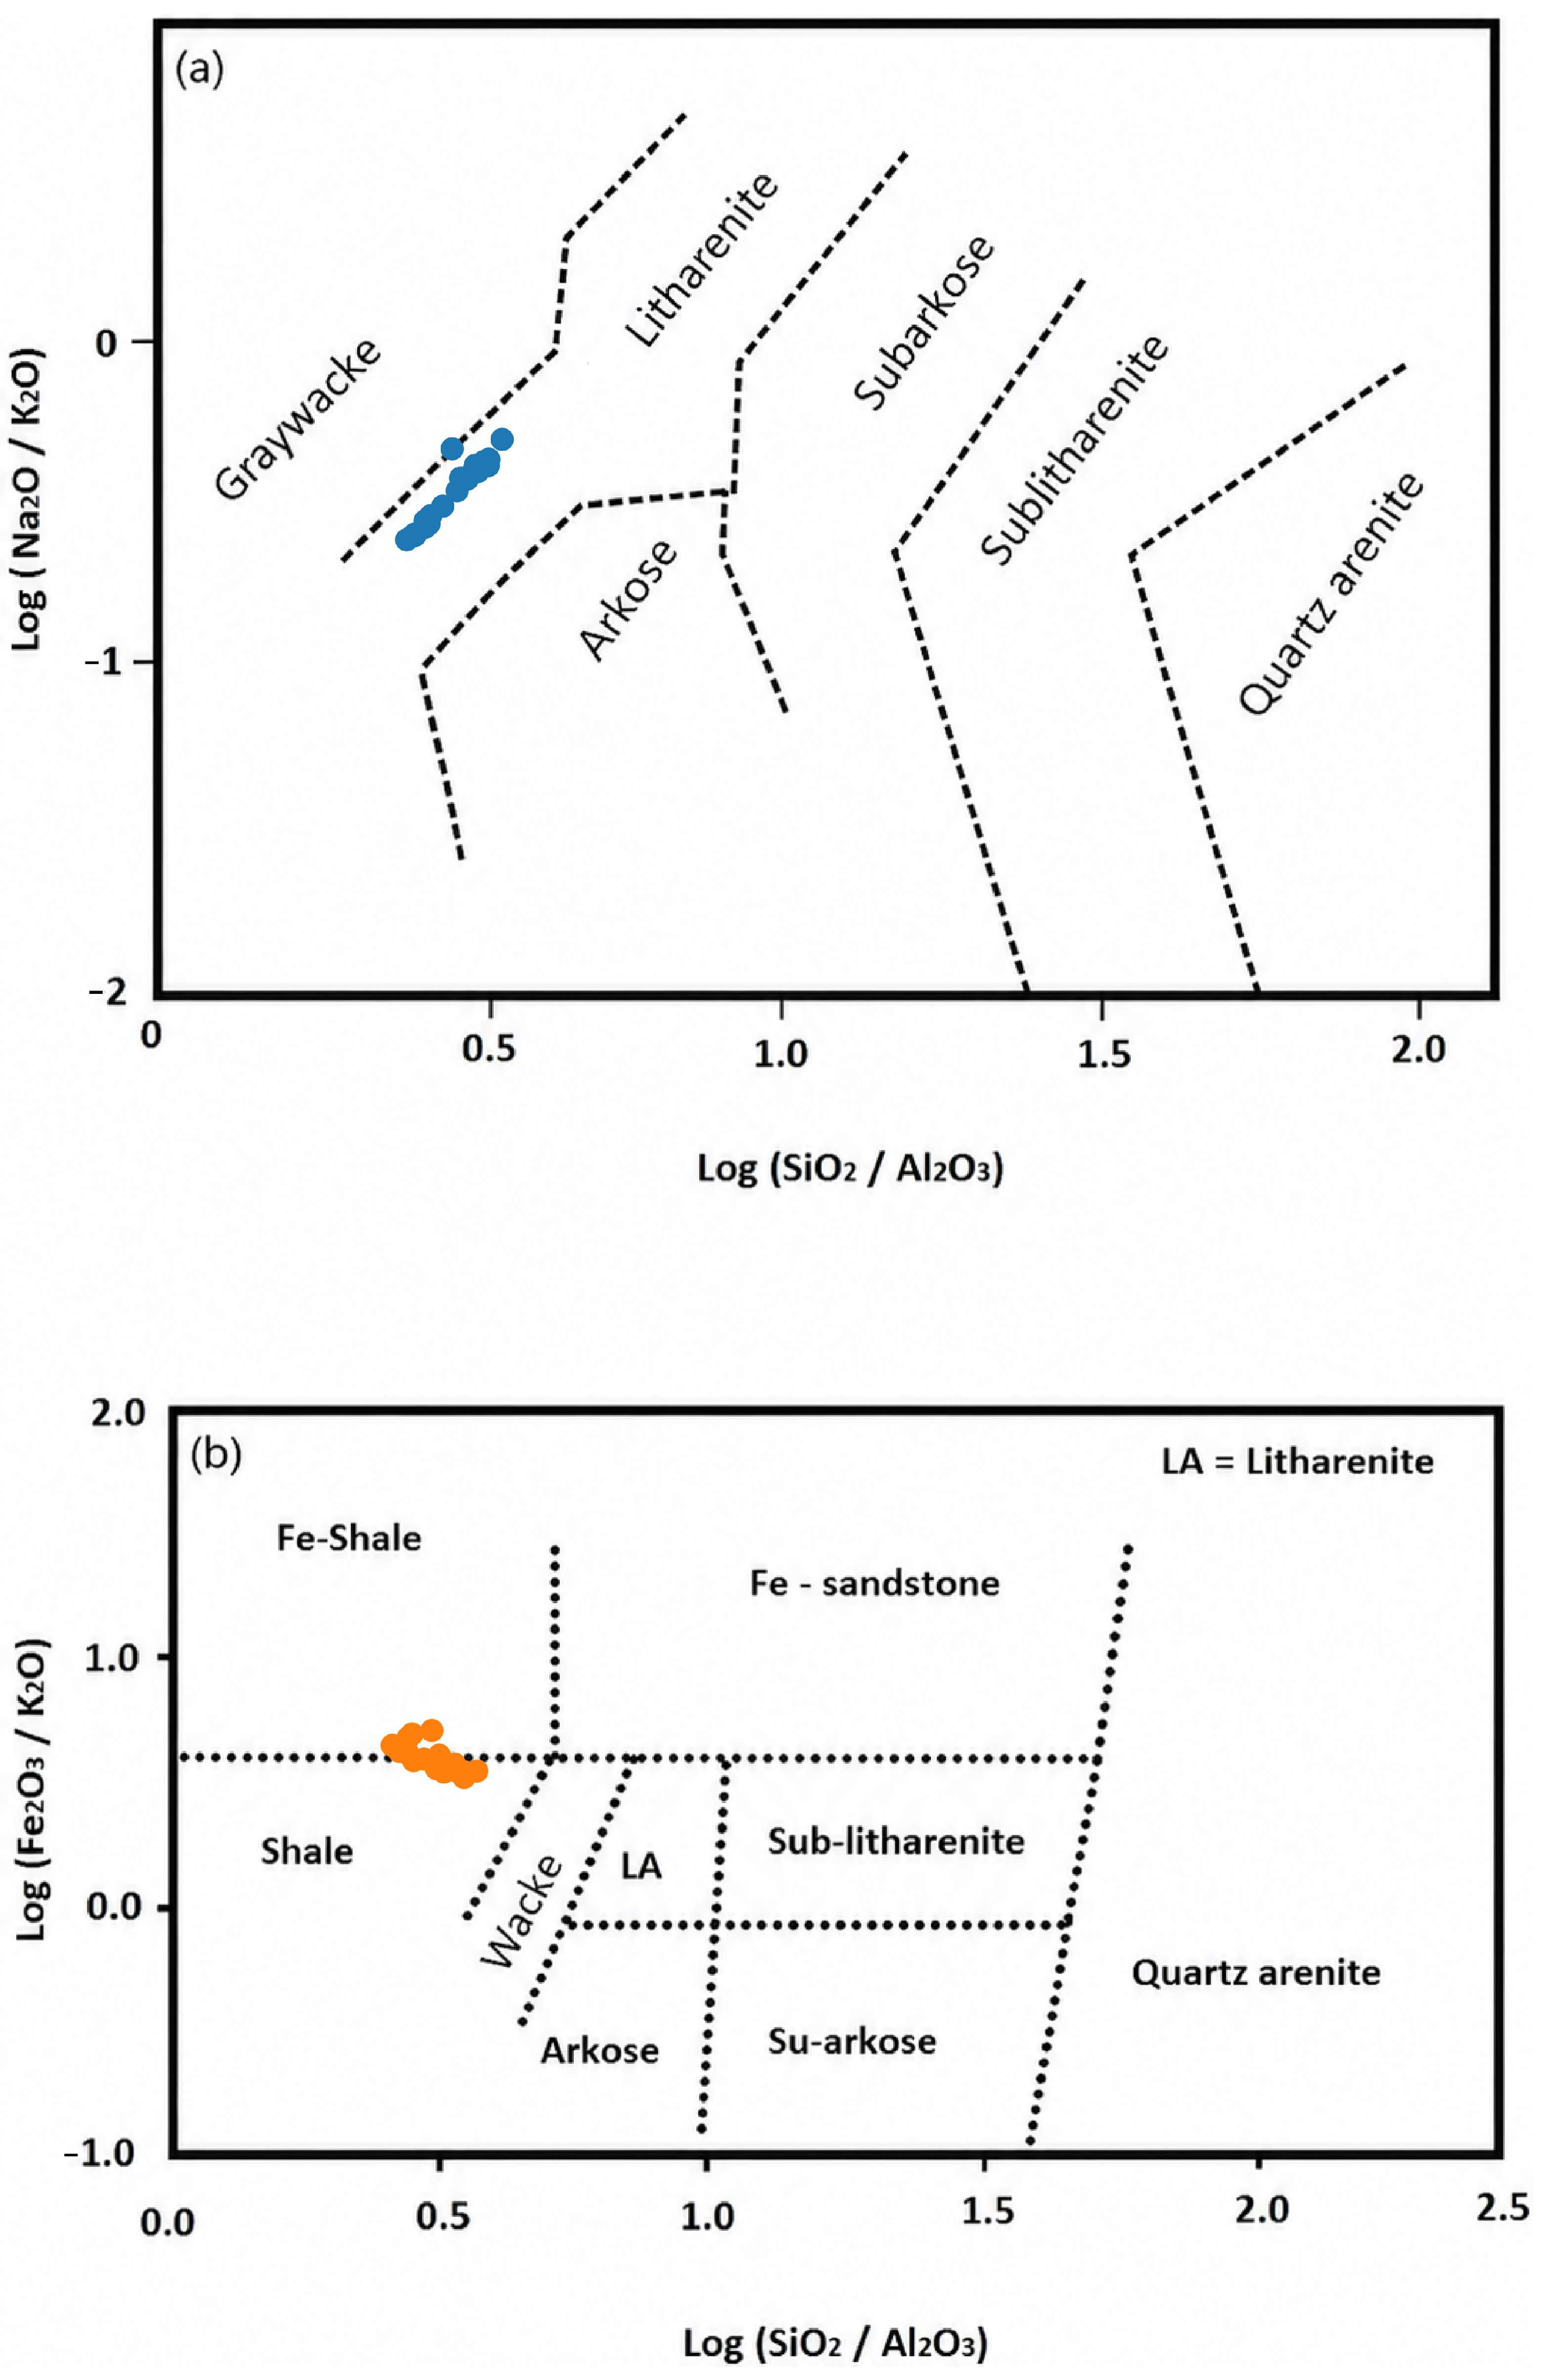
On the Pettijohn et al. [46] diagram (Figure 7a), all the samples plot in the litharenite field, consistent with their immature, lithic-rich character; because this scheme was devised for terrigenous sands, the designation is reported only for comparison with earlier studies. On the Herron [6] classification diagram (Figure 7b), the samples again form a coherent cluster at low log(SiO2/Al2O3), placing them in the shale field; the term is used here in a purely compositional (geochemical) sense, as the material is modern, unconsolidated mud rather than lithified rock. Their elevated Fe2O3/K2O ratios (2.6–4.0) place the cluster toward the upper part of the shale field, recording the substantial contribution of ferromagnesian detritus from the Panjal Trap basalts, although the iron enrichment does not reach the values characteristic of true Fe-shales. The apparent contrast between the litharenite designation in (a) and the shale field in (b) arises because the two schemes discriminate on different second axes: both share log(SiO2/Al2O3), on which the samples plot uniformly low (fine-grained, clay-rich compositions), but the sand-oriented Pettijohn scheme separates on Na2O/K2O, where the low ratios of these K-rich, Na-depleted muds fall in the litharenite field, whereas the Herron scheme separates on Fe2O3/K2O. The two diagrams are therefore mutually consistent: both identify the sediments as fine-grained, texturally and compositionally immature, first-cycle deposits in which a felsic crystalline framework signature is overprinted by a significant mafic input.
Figure 7.
Sediment classification of Wular Lake surface sediments: (a) log(Na2O/K2O) vs. log(SiO2/Al2O3) diagram [46]; (b) log(Fe2O3/K2O) vs. log(SiO2/Al2O3) diagram [6].
Provenance discrimination ratios indicate a predominantly intermediate to mafic source character. The SiO2/Al2O3 ratios (2.8–4.0, mean 3.3) fall below the average for mature quartzose sands (>5) but above typical values for immature first-cycle sediments (<3), suggesting mixed provenance. The invariably high K2O/Na2O ratios (2.2–4.5, mean 3.3) reflect both the K-rich nature of the metamorphic source rocks and the preferential depletion of Na during weathering. Fe2O3/K2O ratios (2.6–4.0, mean 3.1) exceed the threshold of 2, which distinguishes mafic-influenced from felsic-dominated sediments. Al2O3/TiO2 ratios (12.6–16.0) are consistent with derivation from intermediate to mafic igneous rocks [45].
Immobile-element ratios provide weathering- and sorting-insensitive provenance constraints (Table 3). Th/Sc (0.52–1.24, mean 0.91), La/Sc (1.34–3.38, mean 2.19), Cr/Th (5.6–22.3, mean 8.4) and Co/Th (0.96–4.56, mean 1.66) all lie between the compositional ranges of purely silicic and purely basic source rocks [48], bracketing the UCC values (Th/Sc = 0.75, La/Sc = 2.21, Cr/Th = 8.8, Co/Th = 1.65) [47] and confirming a mixed felsic–mafic provenance. The three groups are systematically displaced: the siliceous-mature samples have the highest Th/Sc (1.00–1.24) and La/Sc (2.68–3.38) and the lowest Cr/Th (5.6–7.7) values, whereas the detrital-mafic samples show the reverse (Th/Sc = 0.52–0.84; Cr/Th up to 22.3 in WSS-3), a shift toward the basic-source field consistent with the Panjal Trap contribution. Zr/Sc ratios are uniformly low (3.4–6.0) relative to the UCC (≈13.8), and the samples follow the primary compositional trend rather than the zircon-addition trend in Th/Sc–Zr/Sc space [56], independently corroborating the first-cycle character inferred from ICV. Kruskal–Wallis tests with exact permutation p-values confirm that the group contrasts are statistically significant for all key discriminating variables: SiO2, Fe2O3, CaO, Sc, Cr, Co, Ni, Zn, V, Sr, ΣREE, Eu/Eu*, (La/Yb)N, Th/Sc, Cr/Th and Co/Th (H = 10.3–16.9; p ≤ 0.002 in all cases; Supplementary Table S6).
Table 3.
Immobile-element provenance ratios of Wular Lake surface sediments by provenance group, mean (range), compared with upper continental crust (UCC) [47] values and with the compositional ranges of sediments derived from silicic and basic source rocks [48]. Per-sample values and Kruskal–Wallis statistics are given in Supplementary Table S6.
4.5. Machine Learning Framework Result
4.5.1. Principal Component Analysis
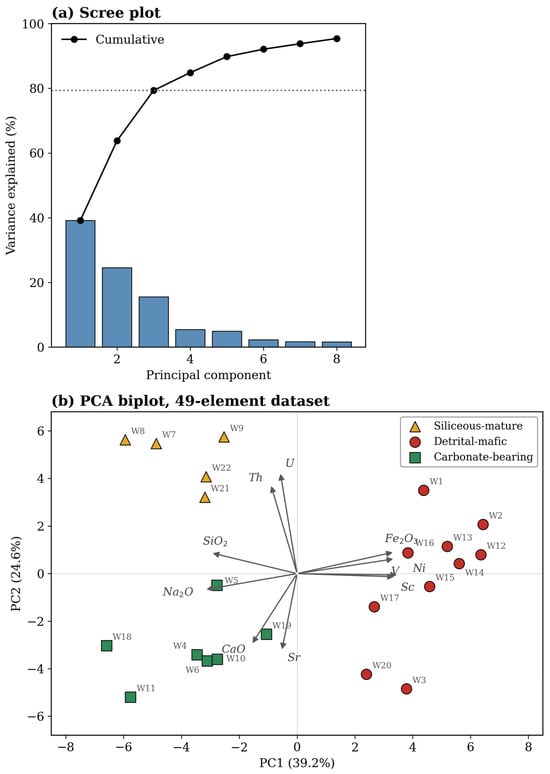
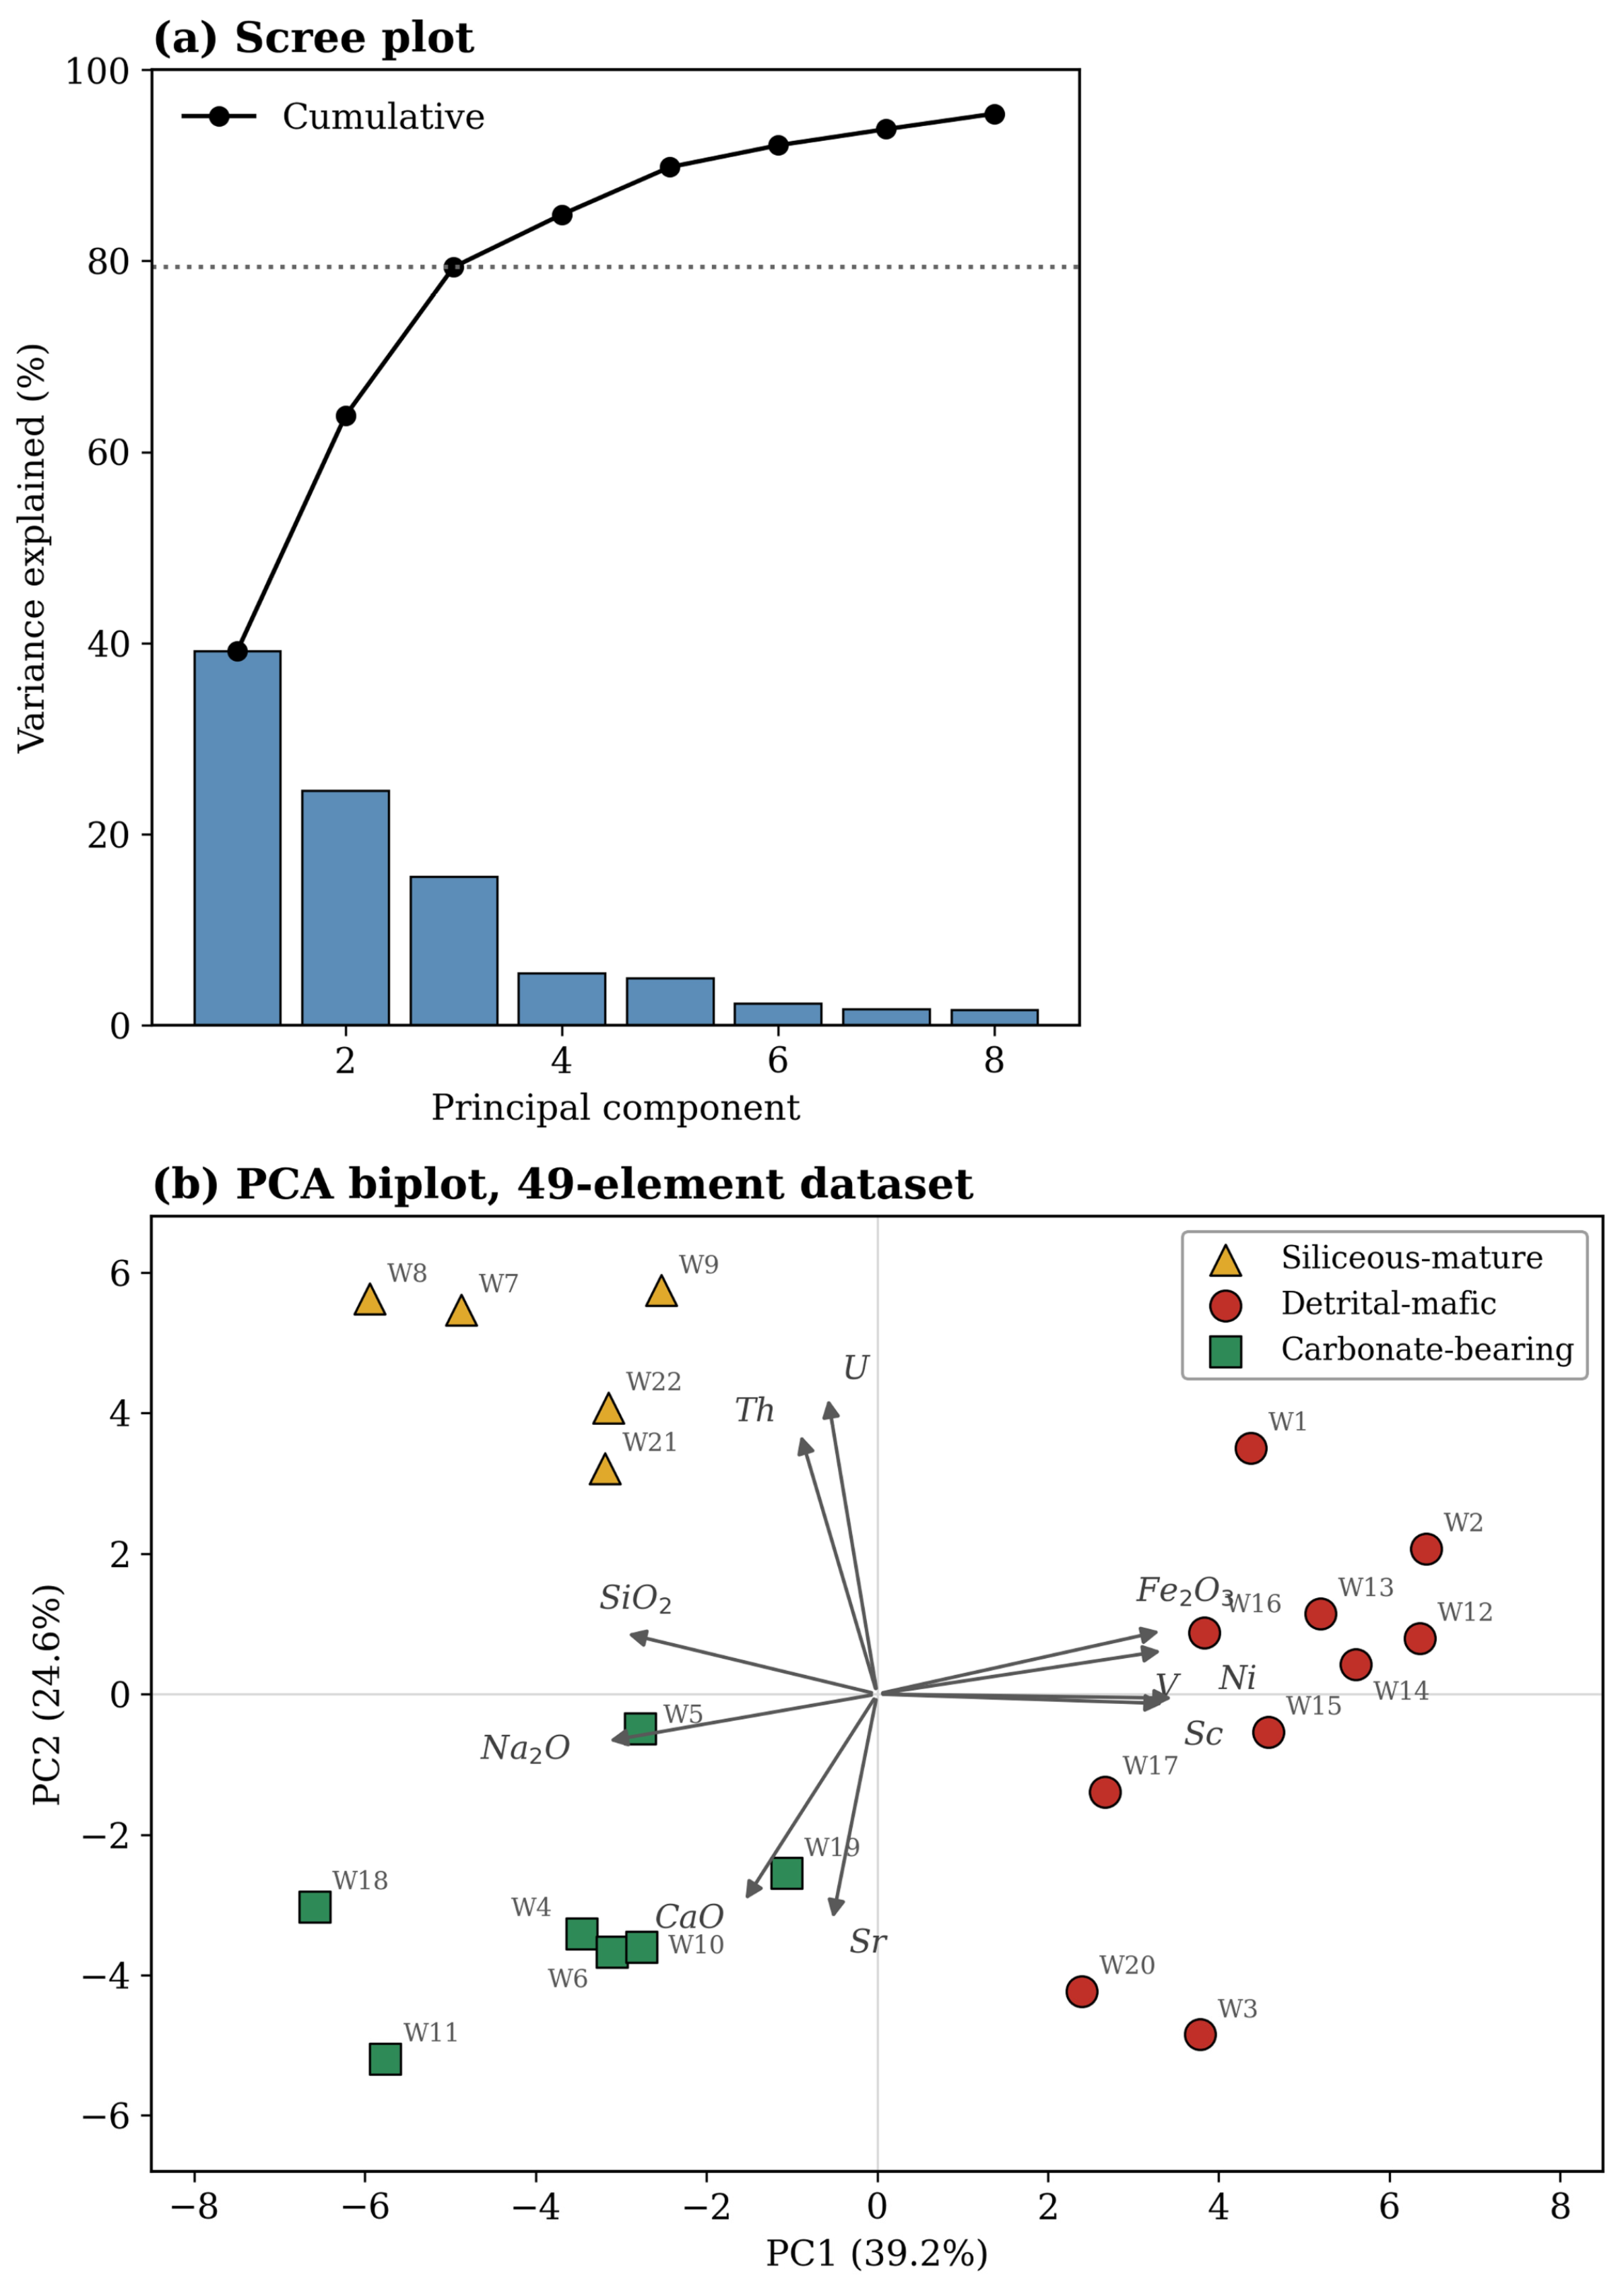
PCA on the full 49-element dataset extracts three principal components explaining 79.3% of total variance (PC1 = 39.2%, PC2 = 24.6%, PC3 = 15.5%; Figure 8a). Notably, while a conventional PCA restricted to the 10 major oxides captures 78.1% of variance in just two components, the full 49-element PCA requires three components to reach a similar threshold. This partly reflects the increased dimensionality of the larger dataset; that the additional dimensions carry provenance-relevant rather than merely additional information is indicated independently by the dominance of trace elements in the random forest importance ranking and by the significant inter-group contrasts of the immobile trace-element ratios (Table 3). PC1 separates samples along a mafic–felsic gradient, with strong positive loadings on Ni (+0.220), Cu (+0.215), Sc (+0.214), V (+0.211), and Fe2O3 (+0.209) opposing those on Na2O (−0.201) and SiO2 (−0.189). PC2 captures the carbonate signature, with negative loadings on Sr (−0.207) and CaO (−0.191) opposing U (+0.267) and Th (+0.234) (Figure 8b). The complete PC1–PC3 loadings for all 49 variables are listed in Supplementary Table S5.
Figure 8.
(a) Scree plot of explained variance for the 49-element PCA; (b) PCA biplot (PC1 vs. PC2) with samples coloured by provenance group and selected variable loadings.
4.5.2. Provenance Classification
On the basis of conventional geochemical criteria, geological mapping of source terranes, and the PCA structure described above, the 22 samples can be assigned to three provenance end-members (Table 4). The siliceous-mature group (n = 5: WSS-7, WSS-8, WSS-9, WSS-21, WSS-22) is characterised by the highest SiO2 (57.3 wt%) and relatively low Fe2O3 (8.1 wt%), Sc (15.5 ppm), and Sr (106.3 ppm) values, consistent with recycled Higher Himalayan crystalline sources. The detrital-mafic group (n = 10: WSS-1, WSS-2, WSS-3, WSS-12–17, WSS-20) exhibits high Fe2O3 (10.8 wt%), Sc (19.1 ppm), V, Cr, Co, and Ni values, reflecting significant Panjal Trap volcanic input. The carbonate-bearing group (n = 7: WSS-4–6, WSS-10–11, WSS-18–19) is distinguished by elevated CaO (4.6 wt%) and Sr (158.3 ppm) values. These assignments served as the training labels for the random forest classifier described below.
Table 4.
Characteristics of the three provenance end-members used as random forest training labels (group means; concentrations in wt% for oxides and ppm for trace elements).
To test whether this three-group structure is an artefact of the analyst-assigned labels, unsupervised clustering was applied to the standardised 22 × 49 matrix without any label information. k-means clustering (k = 3, 50 random restarts) reproduced the assigned partition exactly (Adjusted Rand Index (ARI) = 1.0), and Ward’s hierarchical clustering preserved the siliceous-mature and carbonate-bearing groups while splitting the detrital-mafic group into two sub-clusters and attaching its three transitional members to the carbonate-bearing cluster (ARI = 0.59), consistent with a mixing continuum between the mafic and carbonate-influenced end-members. The three provenance groups therefore represent intrinsic structure in the geochemical data rather than an imposed classification, although the supervised cross-validation results remain, strictly, a measure of internal consistency.
4.5.3. Random Forest Classification
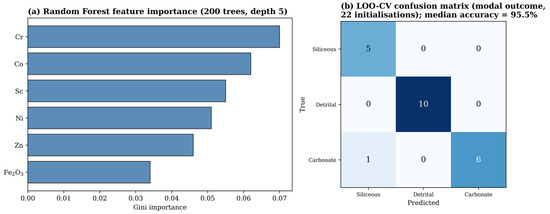
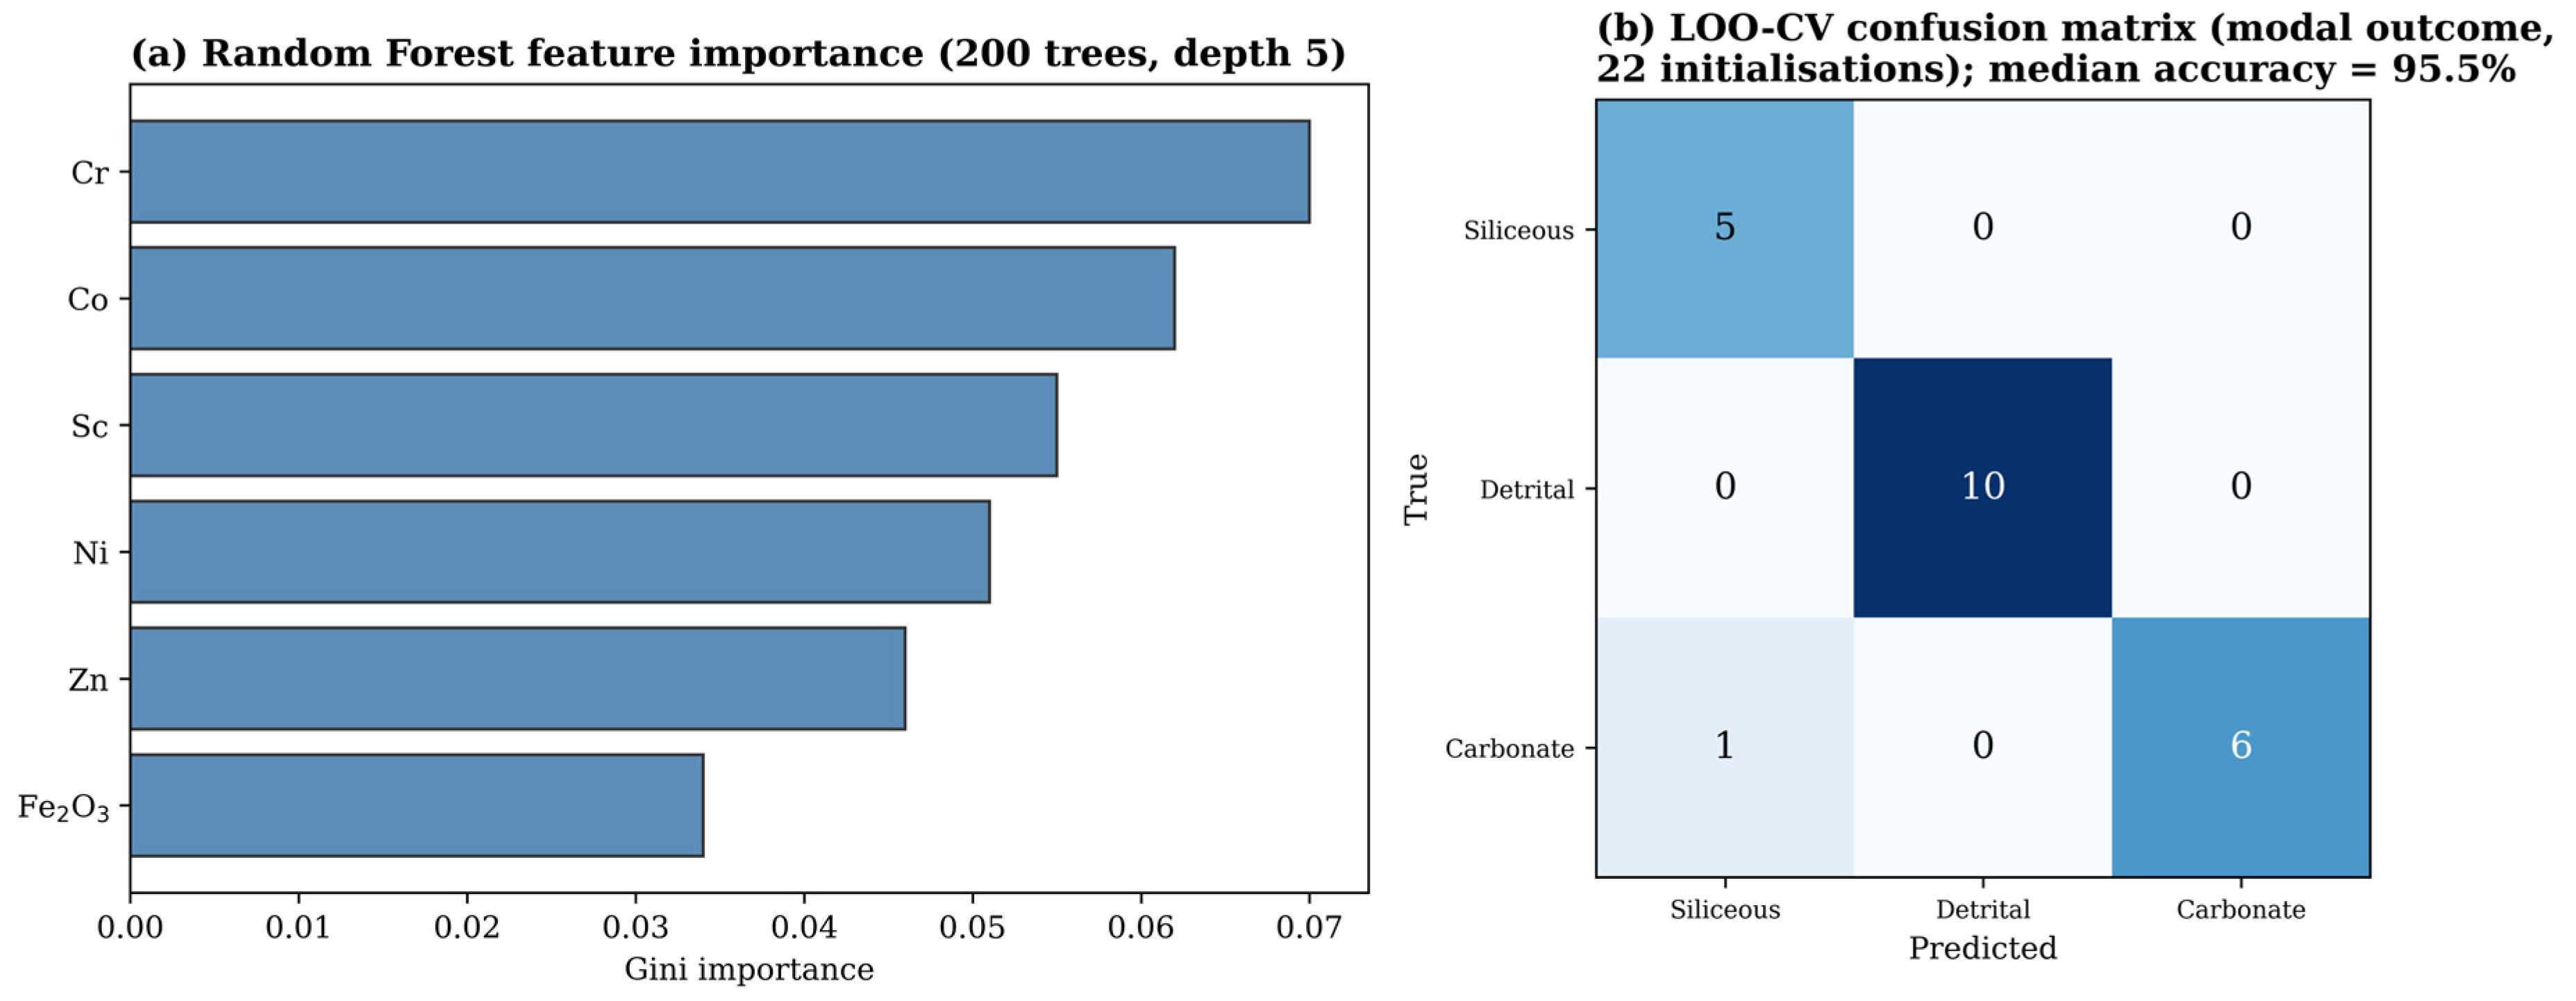
Repeated across 22 random initialisations, the random forest LOO-CV accuracy has a median of 95.5% (range 95.5%–100%), the more conservative and reliable performance estimate given the high-dimensional setting (p = 49, n = 22; the perfect training accuracy of 1.000 is expected when p >> n and should not be over-interpreted). The sole recurrent misclassification is WSS-18 (18 of 22 initialisations), a boundary sample with the lowest CaO (1.75 wt%) in the carbonate-bearing group, consistently predicted as siliceous-mature when misclassified in line with its strongly fractionated, felsic-like REE pattern. Gini importance (Figure 9a) identifies Cr (0.070), Co (0.062), Sc (0.055), Ni (0.051), and Zn (0.046) as the top discriminators. All compatible trace elements associated with mafic lithologies confirm that the primary provenance contrast is between Panjal Trap-derived material and other sources. The major oxides Fe2O3 (0.034) and CaO rank lower, suggesting that trace elements carry more provenance information than do traditional major oxide ratios.
Figure 9.
(a) Random forest Gini feature importance (200 trees, maximum depth 5); (b) modal leave-one-out cross-validation confusion matrix across 22 random initialisations (median accuracy 95.5%). Dark blue indicates a higher number of samples in each cell, whereas lighter blue indicates fewer samples.
Per-class performance in the modal LOO-CV confusion matrix corresponds to precision/recall/F1 of 0.83/1.00/0.91 for the siliceous-mature, 1.00/1.00/1.00 for the detrital-mafic and 1.00/0.86/0.92, respectively, for the carbonate-bearing class, with a balanced accuracy of 0.95. The Wilson 95% confidence interval for the median LOO-CV accuracy (21 of 22 correct) is 78.2%–99.2%; the width of this interval reflects the small sample size, and the perfect training accuracy equally indicates that model complexity approaches the sample size. Both observations underscore that the headline accuracy should be read as an internal-consistency measure for the assigned provenance groups rather than as an estimate of generalisation performance [57,58].
4.5.4. SHAP Analysis
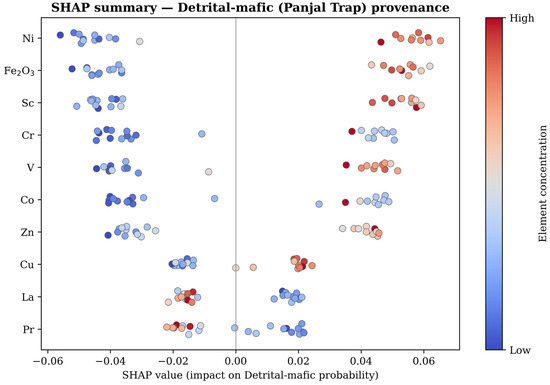
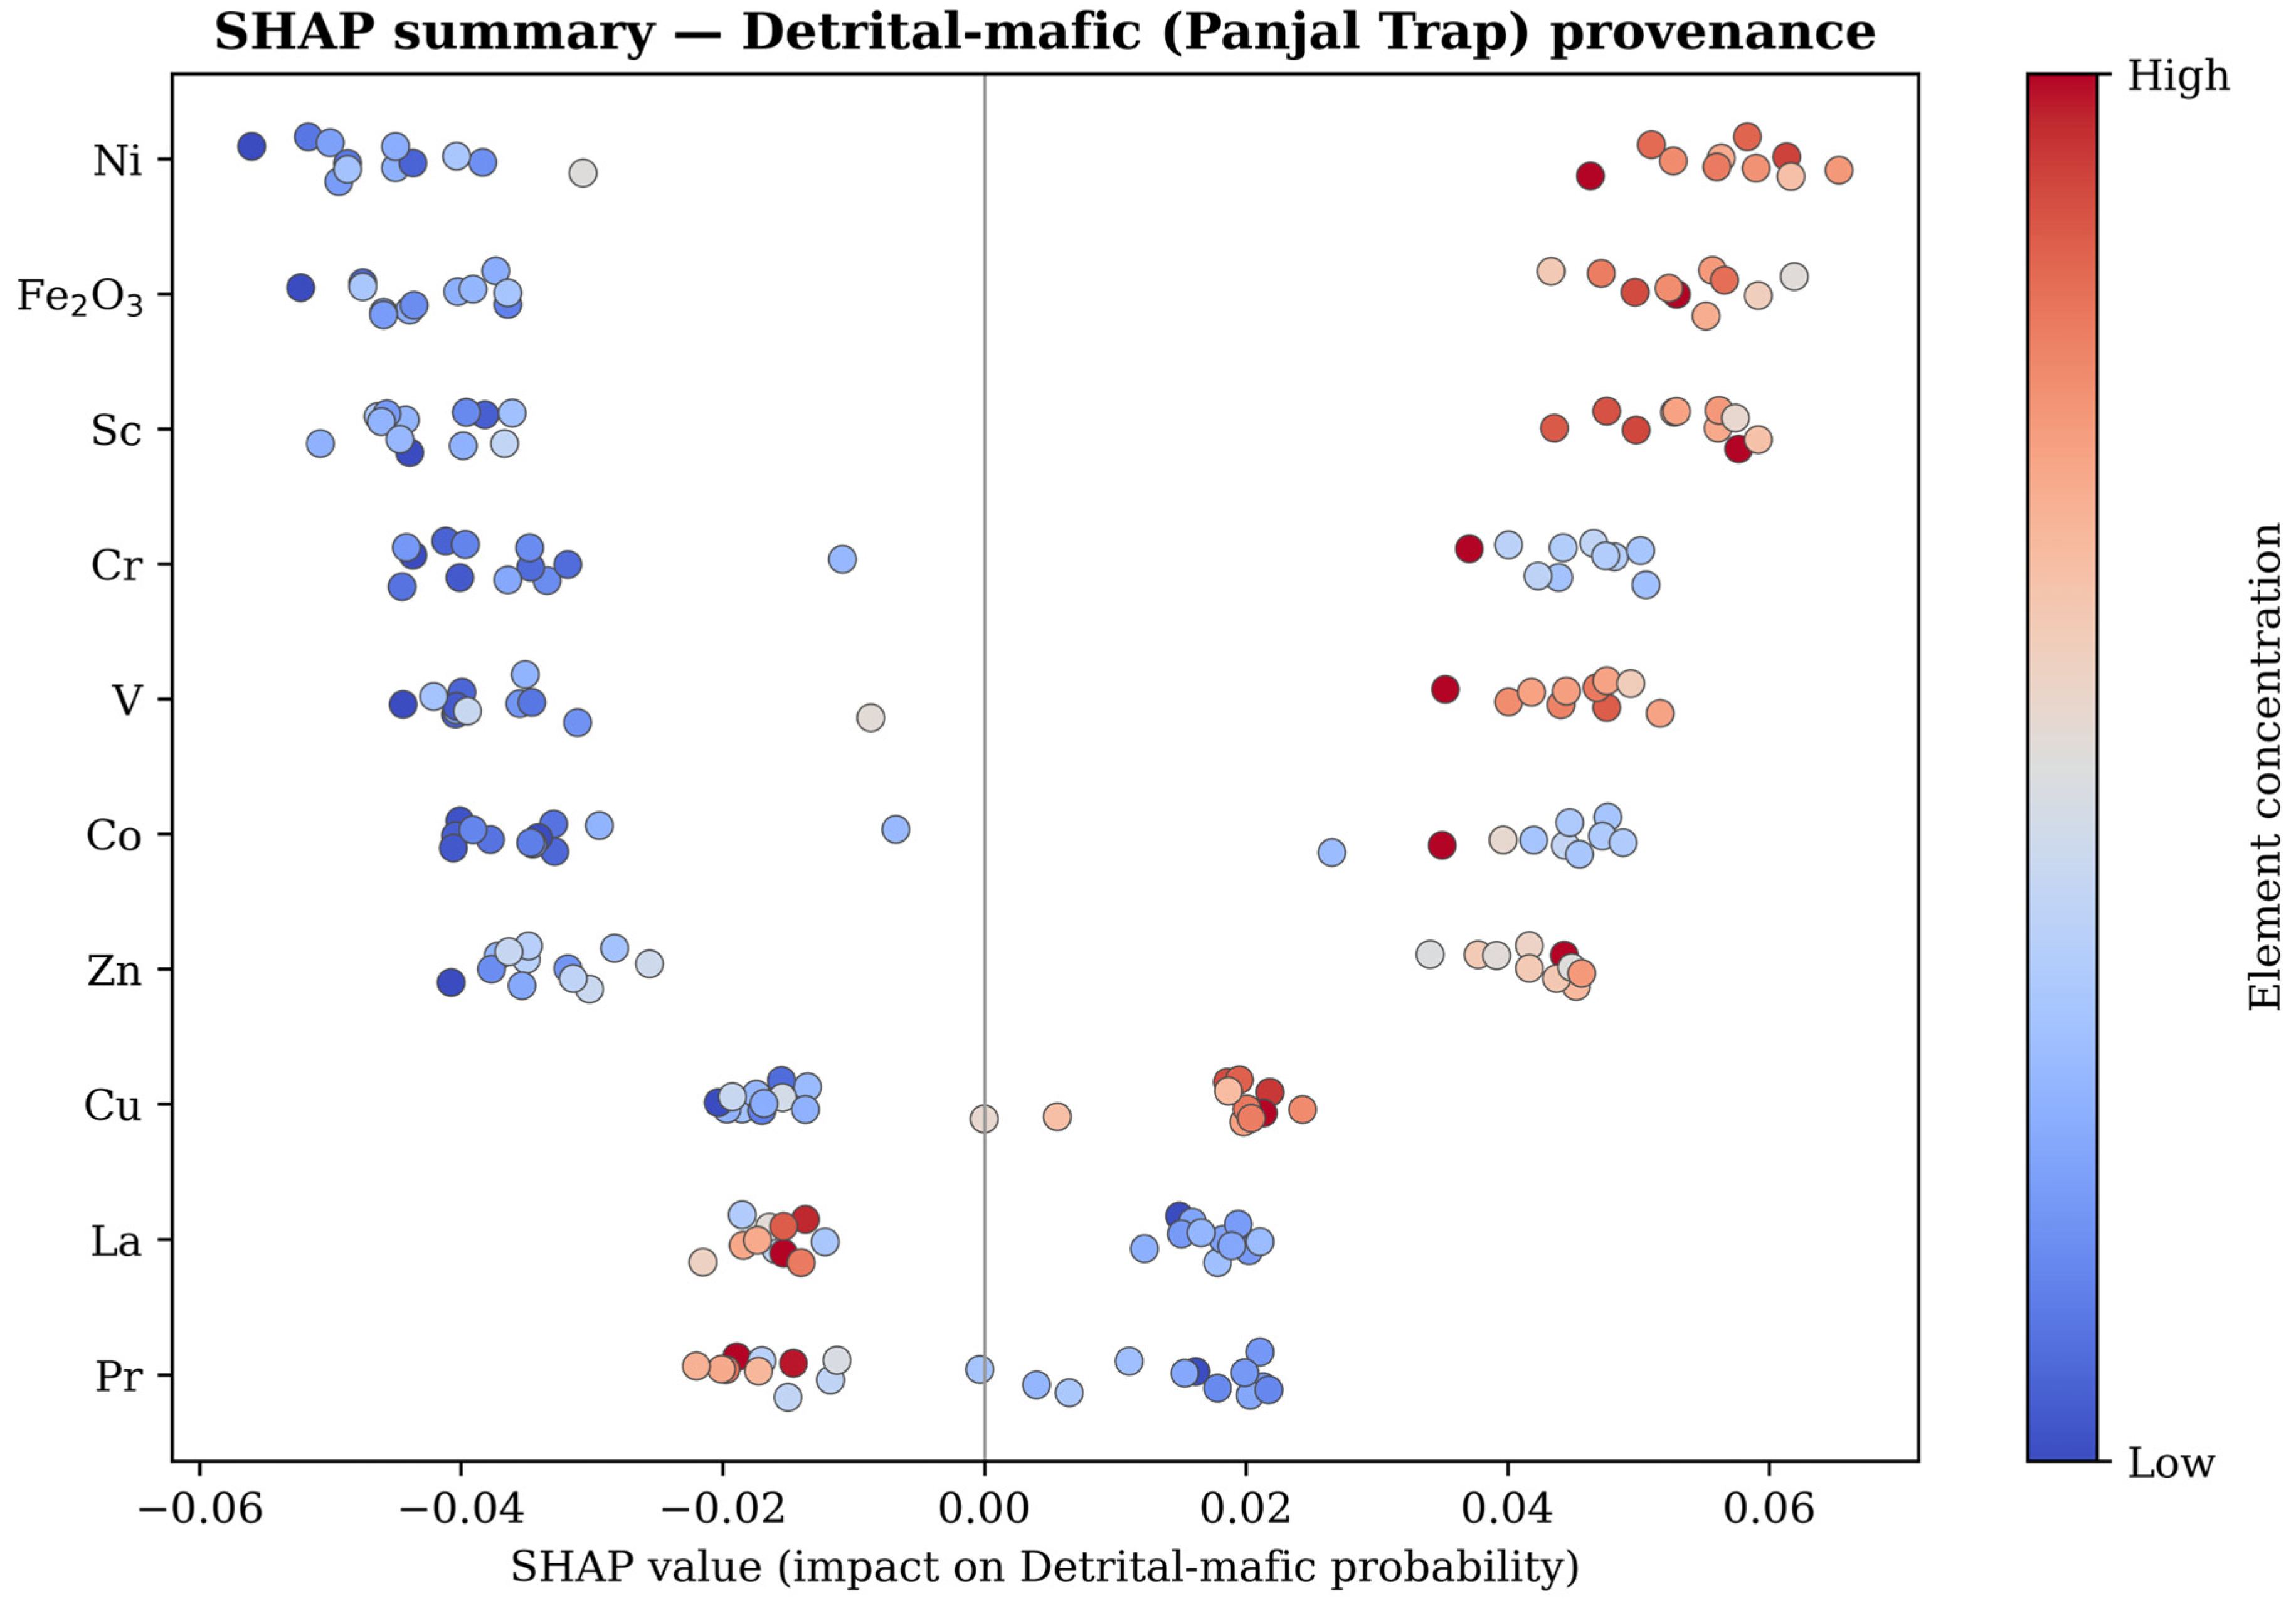
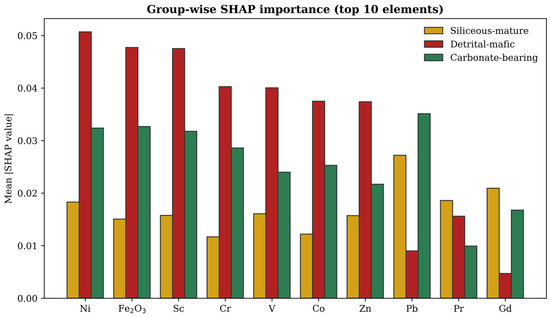
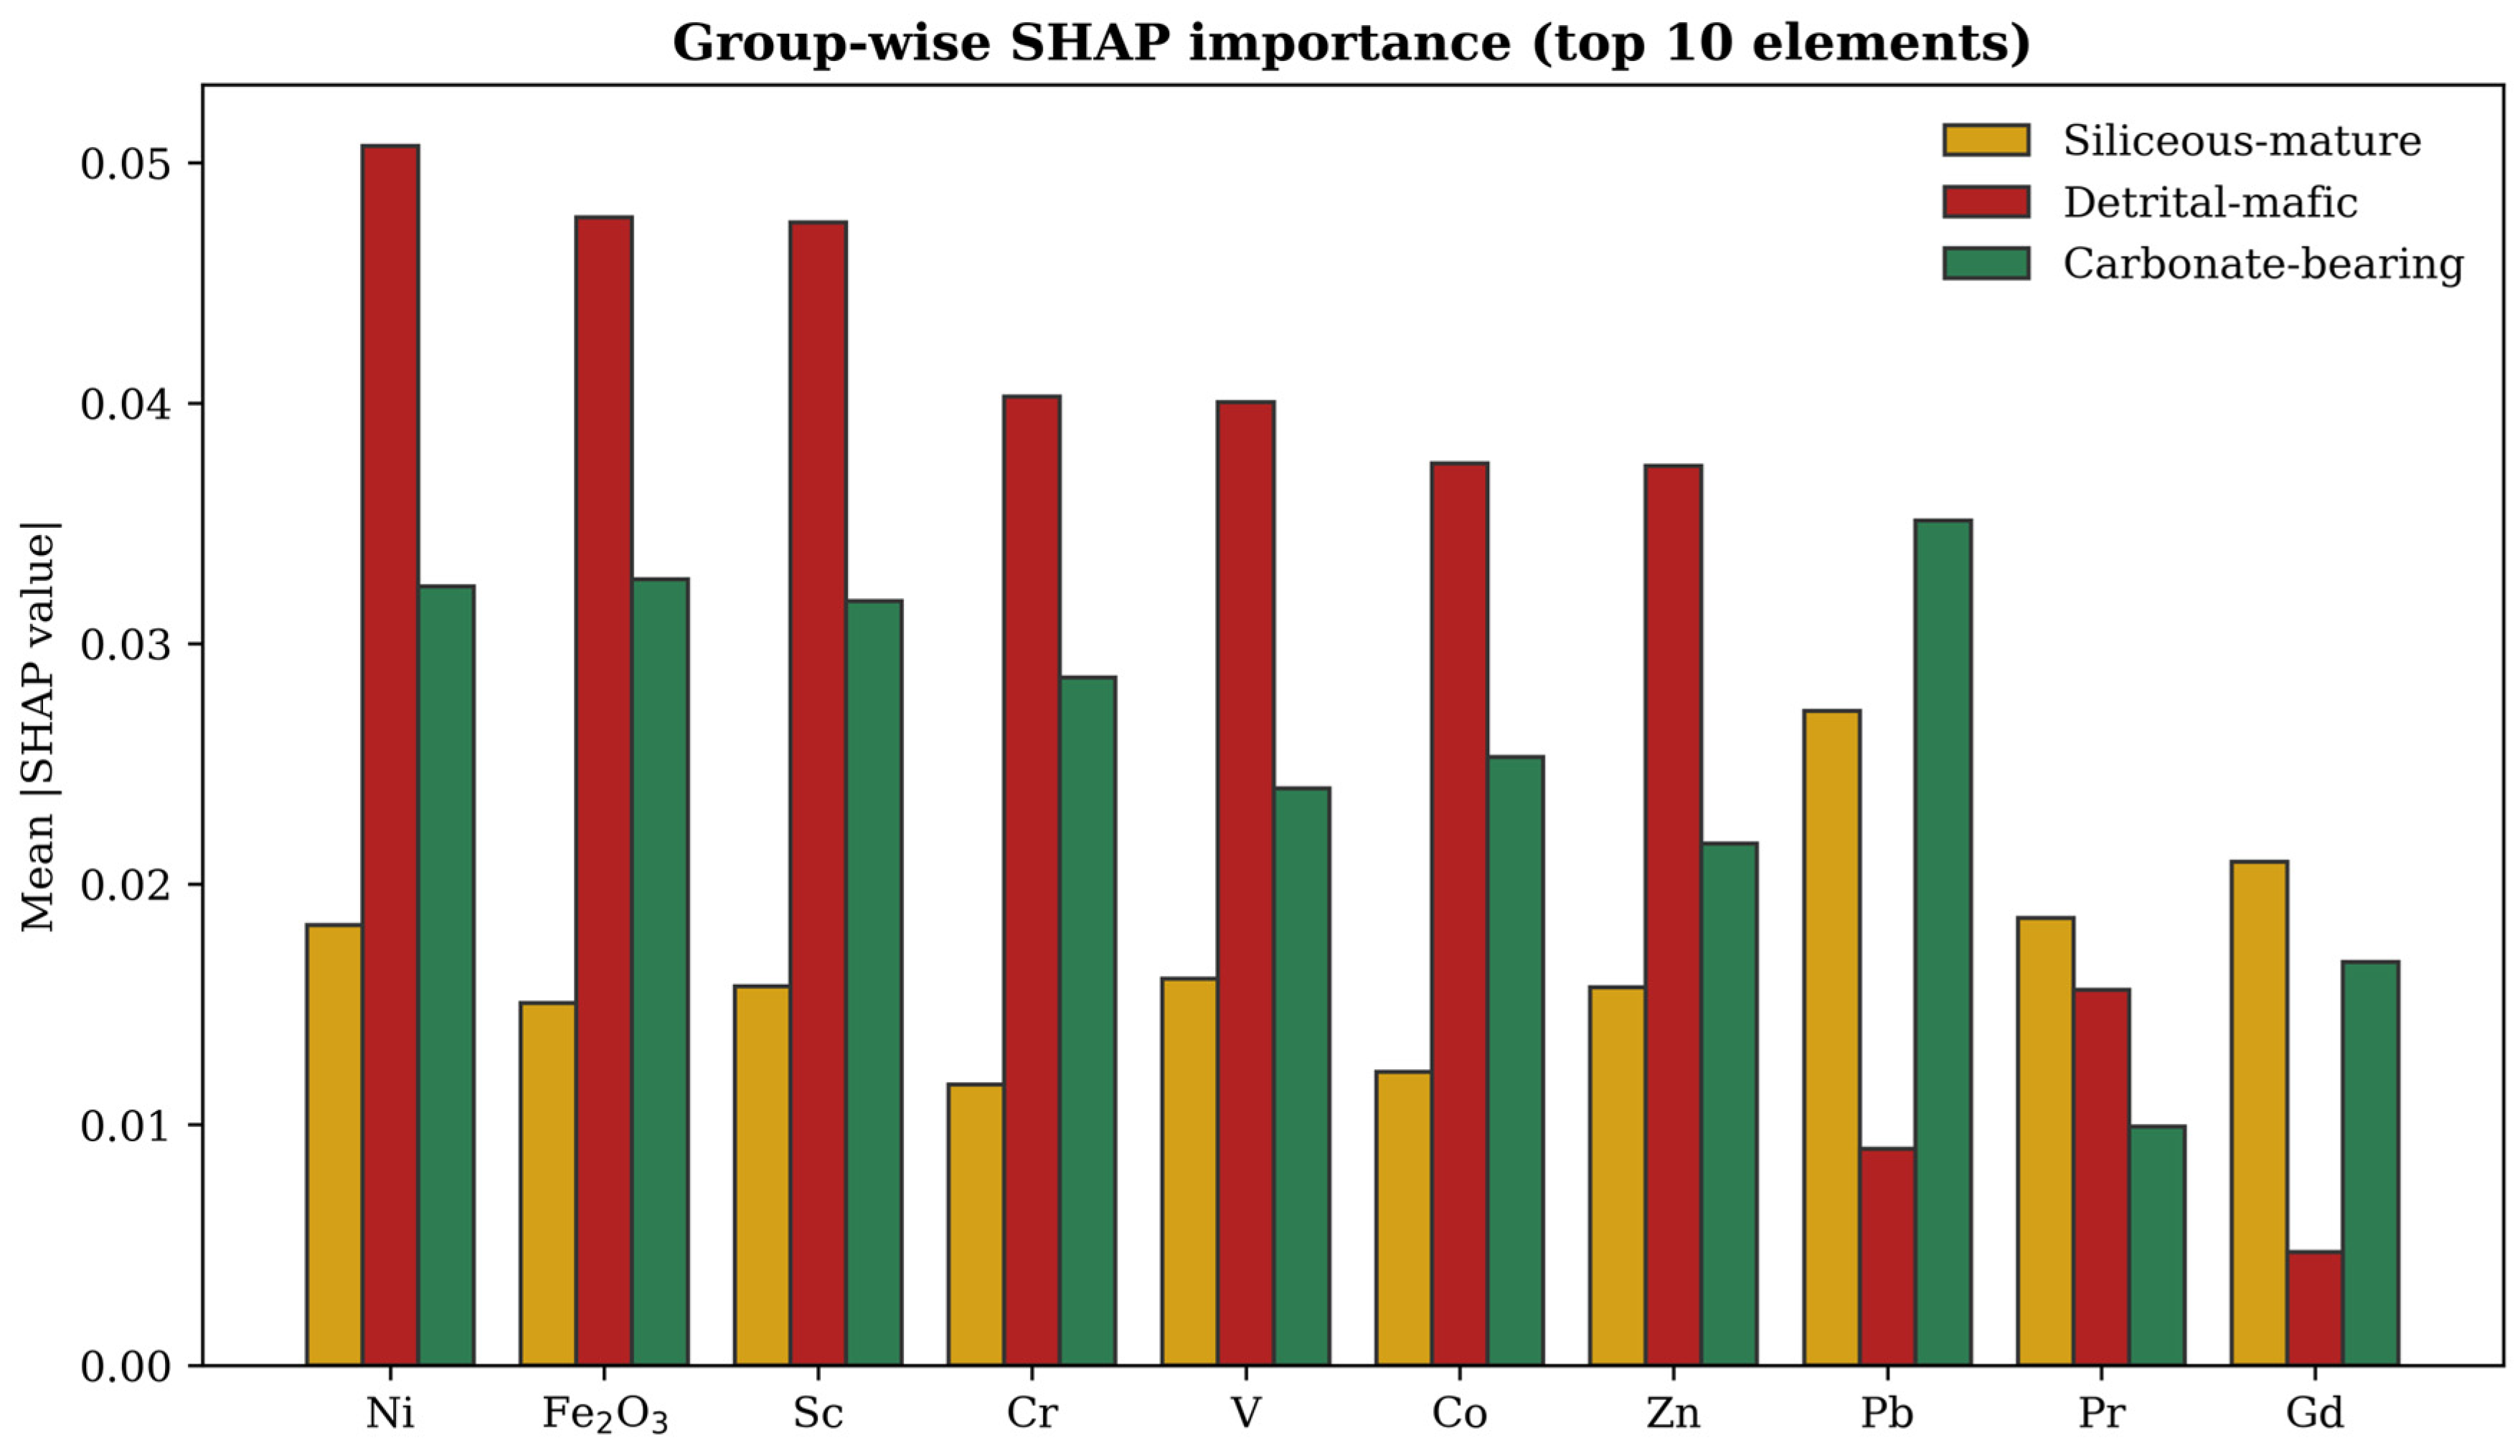
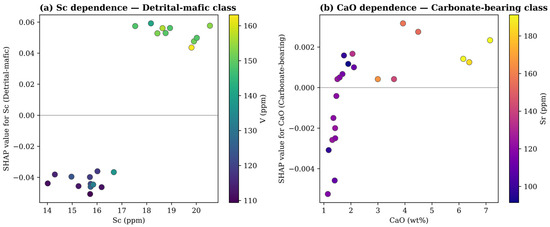
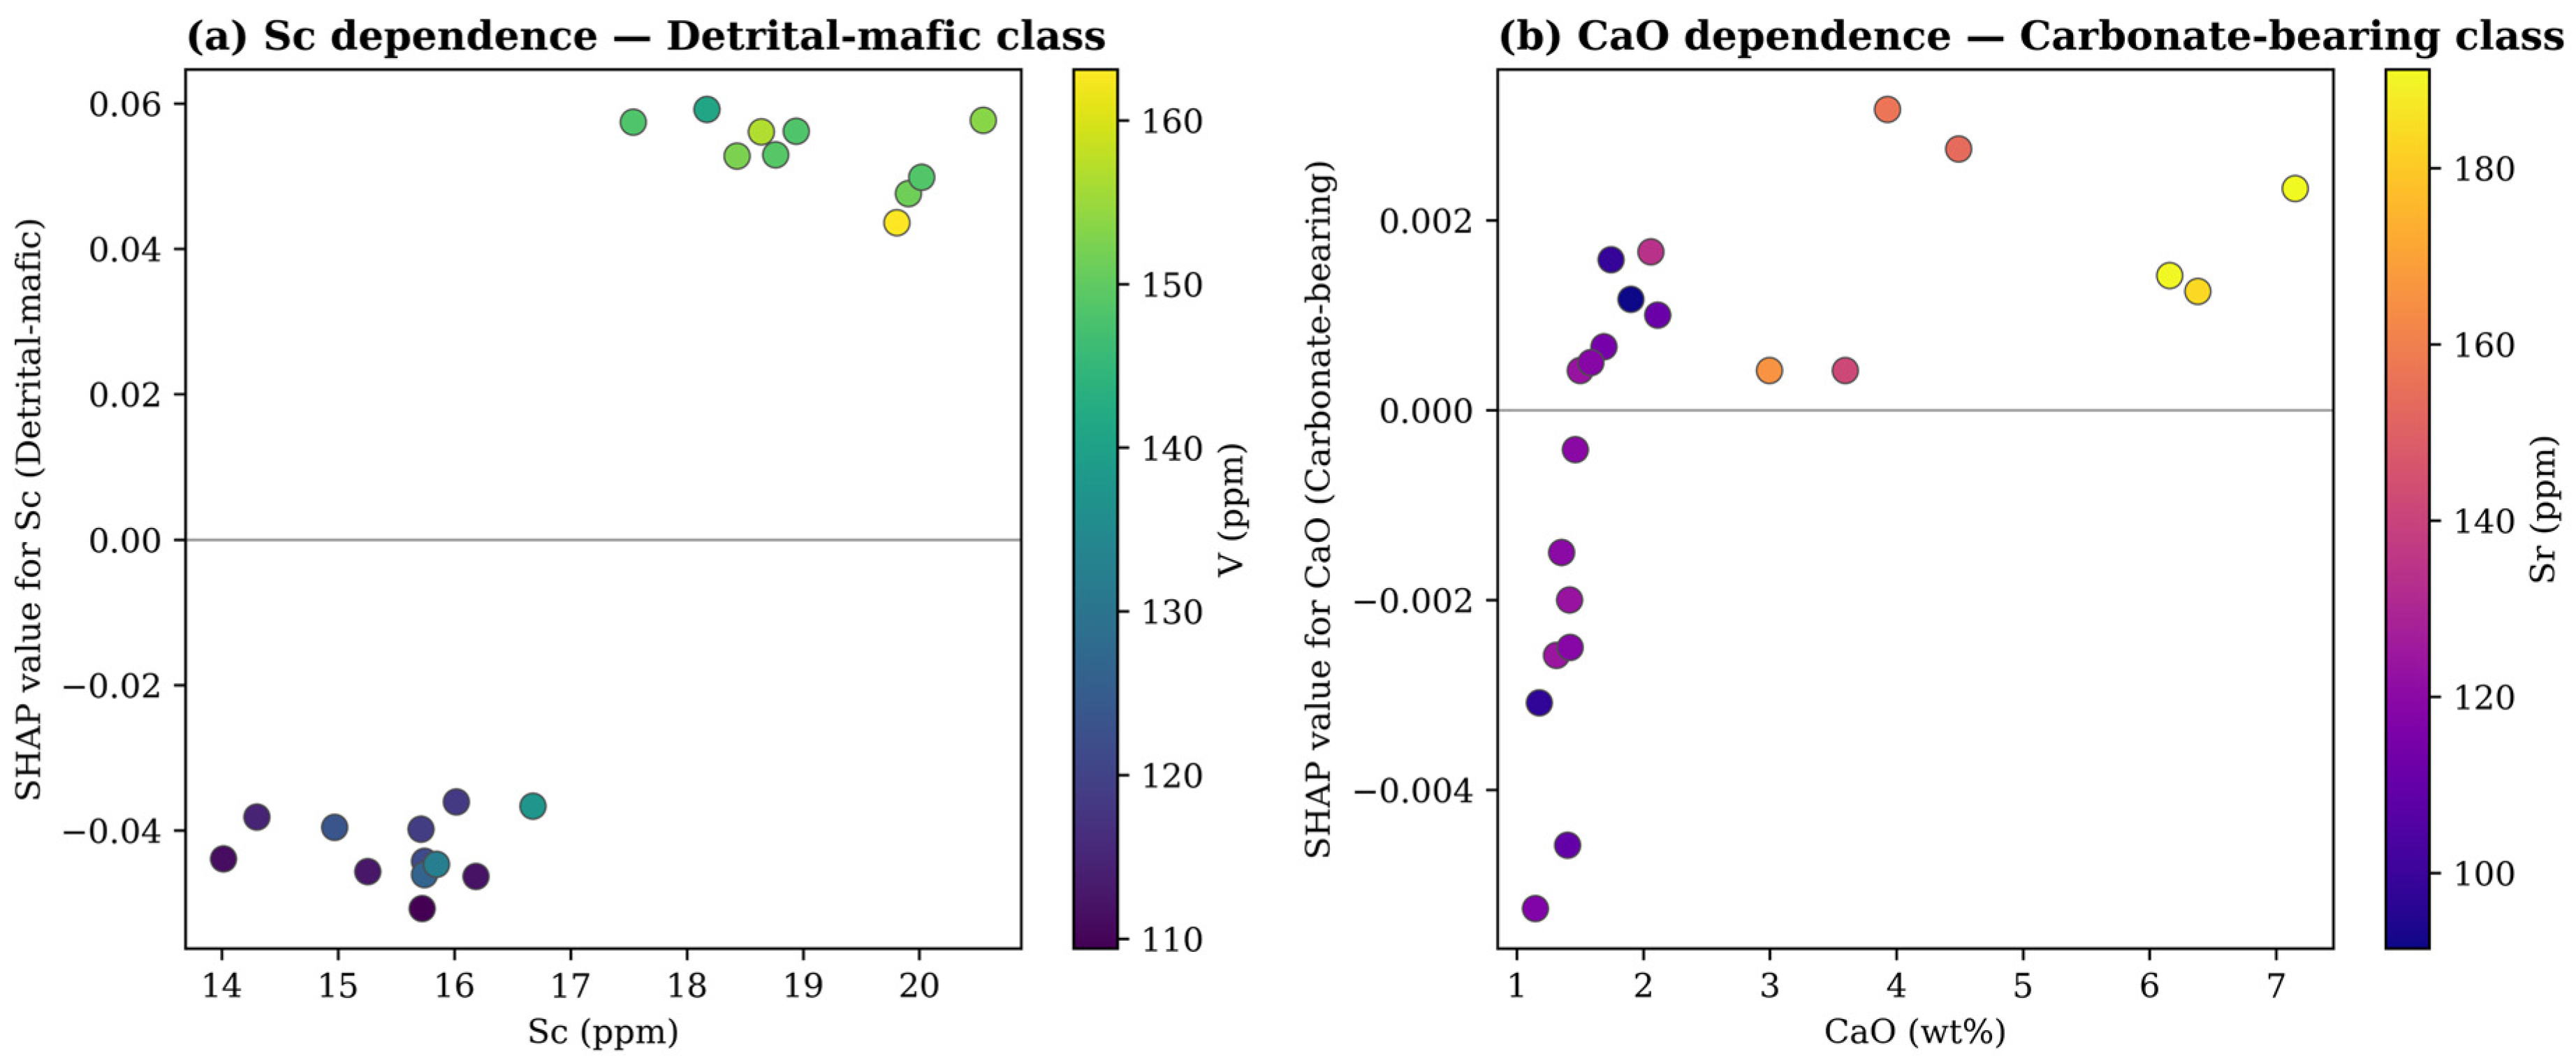
SHAP decomposition (Figure 10, Figure 11 and Figure 12) reveals group-specific element contributions. For the detrital-mafic provenance, the dominant SHAP drivers are Ni (mean |SHAP| = 0.051), Fe2O3 (0.048), Sc (0.048), Cr (0.040), and V (0.040), with high values consistently pushing SHAP values toward positive. For the carbonate-bearing provenance, the same elements operate with reversed polarity, while CaO and Sr act as secondary positive drivers. The siliceous-mature provenance shows a more distributed SHAP signature, with Sc, Pb, U, Cr, and Gd all contributing modestly, consistent with a mixed, recycled source. SHAP dependence plots (Figure 12) reveal monotonically increasing effects for Sc and V in the detrital-mafic class and a nonlinear threshold for CaO in the carbonate-bearing class, with classification probability rising sharply above 4–5 wt%. Throughout, SHAP values quantify how the classifier uses the geochemical variables to separate the predefined provenance groups from their statistical importance within the model, and their geological significance is asserted only where they converge with independent evidence such as the immobile-element ratios (Table 3) and the REE systematics.
Figure 10.
SHAP summary (beeswarm) plot for the detrital-mafic (Panjal Trap) provenance class; points are individual samples coloured by element concentration. The vertical line (SHAP = 0) separates positive and negative feature contributions to the class prediction.
Figure 11.
Group-wise mean absolute SHAP values for the ten most influential elements across the three provenance classes.
Figure 12.
SHAP dependence plots: (a) Sc for the detrital-mafic class (coloured by V); (b) CaO for the Carbonate-bearing class (coloured by Sr). The horizontal line at SHAP = 0 indicates no contribution to the model prediction; points above and below the line represent positive and negative contributions, respectively.
4.6. Regional Comparison
Compared with those from other Kashmir Valley lakes, Wular Lake sediments display moderate weathering intensity (CIA ~72) intermediate between the low–moderate values reported by Shah et al. [5] for Wular Lake (CIA ~64) and the intense weathering (CIA 87–95) documented in Dal Lake sediments [59]. The mineralogical assemblage (quartz + muscovite/illite + chlorite + feldspar) is consistent across all Kashmir Valley lakes, including Manasbal Lake [60] and Dal Lake [59], confirming a shared regional source terrane. All studies identify the Panjal Traps as the dominant mafic contributor, although the relative carbonate input varies spatially across the valley. Table 5 summarises the key geochemical parameters across the Kashmir Valley lakes.
Table 5.
Regional comparison of geochemical parameters across Kashmir Valley lakes.
5. Discussion
5.1. Weathering Regime and Climate Control
Comparable to sediments from other cold-climate Himalayan settings, moderate CIA values (68.5–75.1) place Wular Lake sediments in the incipient to moderate weathering zone developed by Nesbitt and Young [3]. Das and Haake [61] reported CIA values of 75.2–78.1 for Rewalsar Lake sediments in the Lesser Himalaya, indicating moderate to high weathering in a comparable montane catchment with mixed metamorphic and sedimentary source rocks. Shao et al. [62] documented CIA values of 65–75 for Yangtze River sediments that integrate contributions from both intensely weathered subtropical lowlands and relatively unweathered high-elevation Tibetan Plateau sources. The Wular Lake CIA range (68.5–75.1) is slightly lower than that of Rewalsar Lake, consistent with the cold temperate climate of the Kashmir Valley, where physical weathering driven by frost action and seasonal snowmelt dominates over chemical alteration and is substantially lower than the intense weathering (CIA 87–95) recorded in Dal Lake sediments [59], where longer sediment residence times and anthropogenic inputs enhance apparent weathering signatures.
Potassium metasomatism, which can deflect A–CN–K trends toward the K-apex and lower apparent CIA values [41], does not appear to have affected these sediments: the samples define a trend sub-parallel to the A–CN join, with no deflection toward K, and K2O/Al2O3 ratios (0.16–0.19) remain well below values characteristic of K-feldspar-enriched or metasomatised compositions, consistent with K residing chiefly in detrital muscovite/illite.
The moderate weathering intensity should not be read as a purely climatic signal. In the Himalayan orogen, rapid tectonic uplift, steep relief and short sediment residence times limit the duration of regolith exposure, so that erosion outpaces chemical alteration regardless of temperature; the Kashmir Valley combines this tectonic forcing with a cold temperate climate in which frost shattering and seasonal snowmelt further favour physical denudation. The CIA values of 68.5–75.1 therefore record the combined effect of a kinetically limited, supply-dominated weathering regime and a cool climate, and the two controls cannot be fully separated considering the present data.
The ICV values consistently exceeding unity (1.05–1.59) provide complementary evidence of compositional immaturity, a characteristic that Cox et al. [9] associated with first-cycle sediments. This is consistent with the broader pattern observed across Himalayan lake sediments, where rapid physical denudation outpaces chemical weathering and preserves primary source signatures in the sediment geochemistry. Importantly, the ML results are consistent with this assessment: the random forest’s top discriminating features are compatible trace elements (Cr, Co, Sc, Ni) rather than weathering-mobile major oxides (Na2O, CaO). Feature importance measures usefulness for separating the assigned classes rather than process control, so this observation is consistent with provenance signals dominating over weathering overprints. If chemical weathering had substantially modified the original source signatures, the weathering-sensitive elements would be expected to rank higher in the feature importance hierarchy, and the ML classifications would have reflected weathering intensity rather than lithological provenance. The uniformly low Zr/Sc ratios (3.4–6.0) and the position of the samples along the primary compositional trend in Th/Sc–Zr/Sc space [56] independently corroborate this first-cycle character provenance discrimination.
5.2. Provenance Identification: Conventional vs. Machine Learning Approaches
The conventional provenance indicators unanimously point to a mixed source dominated by mafic volcanic (Panjal Trap) input: Fe2O3/K2O ratios exceed 2, Al2O3/TiO2 ratios of 12.6–16.0 fall within the intermediate-to-mafic source field of Hayashi et al. [45], and the Herron classification places all samples in the shale field, their elevated iron contents reflecting the significant mafic detrital contribution. These findings are consistent with the work of Shah et al. [5], who identified the Panjal Traps as the primary source of Wular Lake sediments based on magnetic susceptibility and major oxide geochemistry.
An alternative explanation for the elevated Fe2O3/K2O ratios post-depositional iron enrichment through redox cycling or diagenetic Fe-oxyhydroxide precipitation [63] can be evaluated against the trace-element systematics. Fe2O3 correlates strongly with the immobile mafic tracers Ni (r = 0.90), V (r = 0.89) and Sc (r = 0.87), but only weakly with LOI (r = 0.24), and Ce anomalies are absent (Ce/Ce* = 0.98–1.03), indicating that redox-driven fractionation has not measurably modified the sediment chemistry. In a shallow (≤5 m), seasonally mixed lake with high detrital throughput, prolonged anoxia at the sediment–water interface is unlikely to be sustained. A minor diagenetic contribution to the Fe budget cannot be excluded, but the coherence of Fe with the mafic provenance suite indicates that detrital input from the Panjal Traps is the dominant control. Hydraulic concentration of heavy minerals offers a further alternative explanation for the TiO2 and Fe2O3 enrichments; however, the uniformly low Zr/Sc ratios (3.4–6.0; Table 3) argue against significant heavy-mineral concentration, since hydrodynamic enrichment of rutile or ilmenite would be expected to co-concentrate zircon.
The critical question is whether the ML framework adds genuine value beyond what conventional methods already establish. We argue that it does, on three grounds. First, the random forest trained on all 49 elements simultaneously achieves a median LOO-CV accuracy of 95.5% in discriminating the three provenance end-members, a quantitative internal-consistency test showing that the groups are separable in the full multivariate space, conditional on the assigned labels, which hand-selected bivariate diagrams cannot provide. In practice, conventional provenance analysis integrates multiple diagrams with mineralogical, petrographic and geological evidence; the multivariate test offered here complements rather than replaces that integration. Ueki et al. [14] demonstrated a comparable advantage in their ML-based tectonic discrimination of igneous rocks, achieving classification accuracy exceeding 83% across eight tectonic settings using 20 elements simultaneously, an outcome that conventional binary diagrams could not replicate for intermediate compositions.
Second, the random forest feature importance and SHAP analyses reveal that trace elements (Cr, Co, Sc, Ni, Zn) carry substantially more provenance-discriminating power than do the major oxides traditionally used in geochemical diagrams. This finding has direct practical implications: it suggests that, within this dataset, trace elements carry the greater share of provenance-discriminating information, a cross-comparative ranking that the conventional bivariate approach cannot supply. Whether this justifies prioritising trace element analysis in future Kashmir Valley provenance studies requires confirmation with additional datasets and independent study areas. Hasterok et al. [13] reached a parallel conclusion in their ML-based identification of metamorphic protoliths, where ensemble tree methods (RUSBoosted) correctly identified 95% of igneous and 85% of sedimentary protoliths from major element chemistry alone, demonstrating that ML can extract lithological information from geochemical data more efficiently than can conventional classification schemes. We note, however, that these comparative studies drew on datasets one to two orders of magnitude larger than ours and on different geological materials, so the comparisons are indicative rather than direct.
Third, SHAP dependence plots reveal the functional form of the relationships the classifier has learned between element concentrations and the assigned provenance classes. The approximately monotonic and additive effects of Sc, V, and Cr on the detrital-mafic classification are consistent with a simple mixing interpretation, where increasing concentrations of these mafic tracers linearly increase the probability of Panjal Trap provenance. This finding supports the conventional assumption underlying bivariate discrimination diagrams that individual elemental ratios can be interpreted in isolation. Had the SHAP analysis revealed strong interaction effects (high H-statistics), it would have challenged this assumption, suggesting that element ratios should be interpreted jointly rather than independently. The fact that the ML results are consistent with the conventional framework, while simultaneously extending it beyond what bivariate diagrams can achieve, represents a genuine methodological advance.
5.3. REE Constraints on Provenance
The chondrite-normalized REE patterns provide complementary provenance constraints that support the conventional elemental ratios and the ML-derived provenance assignments. The overall pattern shows strong LREE enrichment, moderate negative Eu anomalies, and flat HREE, which is characteristic of sediments derived from upper continental crustal sources where intracrustal differentiation has produced LREE-enriched, Eu-depleted compositions [55]. The provenance-specific Eu/Eu* values are particularly diagnostic. The siliceous-mature group exhibits the most pronounced negative Eu anomalies (Eu/Eu* = 0.56–0.58), consistent with derivation from felsic crystalline sources (gneisses, granites), where extensive feldspar fractionation during magmatic evolution depletes Eu values relative to that of its neighbours. In contrast, the detrital-mafic group shows significantly weaker Eu anomalies (Eu/Eu* = 0.67–0.73), approaching values typical of mafic volcanic rocks where less feldspar fractionation preserves a more primitive REE distribution.
This Eu/Eu* contrast between provenance groups provides strong complementary support for the three-source model. The fact that a largely independent geochemical proxy, the Eu anomaly which discriminates the same provenance groups inferred from conventional ratios and recovered by the random forest method, strengthens confidence in both approaches. Furthermore, the elevated ΣREE in the siliceous-mature group (mean 215 ppm vs. 157 ppm in the detrital-mafic group) is consistent with the higher incompatible element concentrations expected from evolved felsic lithologies. The REE data also illuminate the transitional character of the carbonate-bearing group (Eu/Eu* = 0.57–0.65), whose intermediate values suggest mixed input from both felsic and mafic sources, with additional dilution by REE-poor carbonate material from the Karewa Group.
The negligible Ce anomalies (Ce/Ce* = 0.98–1.03) across all samples indicate that the sediments have not been significantly affected by oxidative Ce fractionation, which can occur in highly oxidising lacustrine or marine environments. This confirms that the REE patterns primarily reflect source lithology rather than post-depositional modification, reinforcing their reliability as provenance indicators.
5.4. Regional Context
The regional comparison shows that while all Kashmir Valley lakes share a common mineralogical assemblage and Panjal Trap-dominated provenance, the degree of chemical weathering varies systematically. Dal Lake, situated in the more urbanised and lower-elevation portion of the valley, records CIA values of 87–95 [59], significantly higher than those of Wular Lake (68.5–75.1), likely reflecting both the longer residence time of Dal Lake sediments and the additional contribution of anthropogenically modified material. Manasbal Lake records low to moderate weathering [60], comparable to our results, consistent with its similar catchment characteristics.
Anthropogenic influence on the catchment (agriculture, settlements and catchment disturbance) could, in principle, modify the concentrations of pollution-sensitive elements. Al-normalised enrichment factors for these elements are, however, only minor to moderate (Pb = 1.4, Cu = 1.6, Cd = 1.7, Zn = 1.9 and Sb = 2.9 on average; ≤1.7 when normalised to TiO2), indicating a modest anthropogenic overprint, although the Sb enrichment merits monitoring. More importantly, the elements that carry the provenance discrimination (Cr, Co, Sc, Ni, V and the REE) are not typical urban or agricultural contaminants and co-vary coherently with the mafic detrital suite, so the provenance interpretation is robust to this overprint, in line with observations from Dal Lake, where anthropogenic effects are far stronger [59].
The ML framework developed here is transferable, in principle, to these other Kashmir Valley lakes and to other multi-source lacustrine settings where conventional provenance approaches are limited by their bivariate nature. The pipeline requires only a standard multi-element geochemical dataset and can be implemented entirely with freely available open source tools (this study used Python 3.11 using NumPy 2.0 implementation using Visual Studio Code version 1.96), making it accessible to the broader geochemical community. Future applications could extend the SHAP-based interpretive framework to quantify temporal changes in provenance mixing, for example, by applying the pipeline to sediment core data to track how the relative contributions of the three source terranes have varied in response to Holocene climate changes or anthropogenic land-use modifications. Formal end-member mixing models that quantify the proportional contribution of each source terrane would require representative multi-element compositions of the Panjal Trap basalts, Higher Himalayan Crystallines and the Karewa Group, and correspondingly denser source-rock and tributary sampling; in the interim, the PC1 mafic–felsic gradient and the SHAP dependence structure provide a semi-quantitative view of the mixing relationships. All indices and multivariate analyses operate on weight-percent and ppm concentrations, which are compositional data subject to constant-sum closure; log-ratio (clr) transformations provide a formally consistent alternative and will be explored in future work.
6. Conclusions
An integrated geochemical and machine learning investigation of 22 surface sediment samples from Wular Lake, Kashmir Valley, yields the following principal conclusions:
- (1)
- The Wular Lake sediments are compositionally immature (ICV > 1), classified as shales on the Herron [6] diagram and have undergone moderate chemical weathering (CIA = 68.5–75.1, mean 72.1), consistent with the cold temperate climate of the Kashmir Valley. The mineralogical assemblage of quartz + muscovite/illite + chlorite + feldspar confirms the mixed metamorphic–volcanic provenance inferred from the geochemistry.
- (2)
- Conventional provenance discrimination identifies three principal source contributions: the Higher Himalayan Crystalline Series (siliceous-mature component), the Panjal Trap basalts (mafic-detrital component), and the Karewa Group (carbonate-bearing component). Random forest classification on the full 49-element dataset achieves a LOO-CV accuracy of 95.5%, demonstrating that the provenance assignments are internally consistent with the multivariate geochemical signatures; because the training labels were informed by the same data, this result constitutes a consistency check rather than a fully independent validation of the provenance model. Unsupervised k-means clustering, however, reproduces the same three-group structure without any label information (Adjusted Rand Index = 1.0), indicating that the partition is intrinsic to the data.
- (3)
- Chondrite-normalised REE patterns provide complementary provenance support through provenance-specific Eu anomalies: Eu/Eu* = 0.57 (siliceous-mature, felsic crystalline source), 0.70 (detrital-mafic, Panjal Trap volcanic source), and 0.61 (carbonate-bearing, mixed input). The negligible Ce anomalies confirm that REE signatures are source-controlled rather than diagenetically modified.
- (4)
- SHAP analysis demonstrates that compatible trace elements (Cr, Co, Sc, Ni, Zn) carry greater provenance-discriminating power than do the major oxides traditionally emphasised in bivariate diagrams, suggesting, subject to confirmation in additional datasets and independent study areas, that trace elements deserve greater analytical priority in future Himalayan sediment provenance studies.
- (5)
- The three-stage ML pipeline (PCA → random forest → SHAP) is, in principle, transferable to other multi-source sedimentary settings where standard multi-element geochemical data are available, although its performance in locations beyond Wular Lake remains to be tested. By combining the geological interpretability of conventional methods with the full-dimensional exploitation of ML, this integrated framework offers a complementary, more fully multivariate approach to sediment provenance analysis than does either method alone.
Supplementary Materials
The following supporting information can be downloaded at: https://www.mdpi.com/article/10.3390/min16080805/s1, Table S1: Sampling locations and provenance group assignments. Table S2: Major oxide concentrations (wt%), LOI, and chemical weathering indices. Table S3: Trace element concentrations (ppm); Table S4: REE concentrations (ppm) and chondrite-normalised parameters. Table S5: PCA loadings (PC1–PC3) and Random Forest configuration. Table S6: (a) Immobile-element provenance ratios per sample; (b) Kruskal–Wallis test results (exact permutation p-values, 20,000 label permutations) for differences among the three provenance groups.
Author Contributions
Conceptualisation, M.H.A. and S.A.R.; methodology, M.H.A., S.A.R. and J.A.G.; investigation, M.H.A. and J.A.G.; formal analysis, M.H.A., S.A.R. and J.A.G.; writing—original draft, M.H.A.; writing—review and editing, S.A.R., M.K., S.A., A., and A.K.; funding acquisition, M.K. All authors have read and agreed to the published version of the manuscript.
Funding
The authors extend their appreciation to the Deanship of Research and Graduate Studies at King Khalid University for funding this work through the Large Research Groups Program under grant number RGP2/37/47.
Data Availability Statement
The original contributions presented in this study are included in the Supplementary Material. Further inquiries can be directed to the corresponding author.
Acknowledgments
The authors are also grateful to the Department of Geology, AMU, Aligarh, and the Department of Earth Science, IIT-Kanpur, for offering their facilities and support.
Conflicts of Interest
The authors declare no conflicts of interest.
References
- Weltje, G.J.; von Eynatten, H. Quantitative Provenance Analysis of Sediments: Review and Outlook. Sediment. Geol. 2004, 171, 1–11. [Google Scholar] [CrossRef] [Scilit]
- McLennan, S.M. Weathering and Global Denudation. J. Geol. 1993, 101, 295–303. [Google Scholar] [CrossRef] [Scilit]
- Nesbitt, H.W.; Young, G.M. Early Proterozoic Climates and Plate Motions Inferred from Major Element Chemistry of Lutites. Nature 1982, 299, 715–717. [Google Scholar] [CrossRef] [Scilit]
- Verma, S.; Phartiyal, B.; Morthekai, P.; Venkateshwarlu, M.; Chandra, R.; Das, P.K. Provenance and Depositional Processes of Plio-Pleistocene Karewa Group Sediments of Kashmir Valley: Insights from Mineral Magnetism Study. Quat. Int. 2026, 760, 110167. [Google Scholar] [CrossRef] [Scilit]
- Shah, R.A.; Achyuthan, H.; Sangode, S.J.; Lone, A.M.; Rafiq, M. Mineral Magnetic and Geochemical Mapping of the Wular Lake Sediments, Kashmir Valley, NW Himalaya. Aquat. Geochem. 2020, 26, 31–52. [Google Scholar]
- Herron, M.M. Geochemical Classification of Terrigenous Sands and Shales from Core or Log Data. J. Sediment. Res. 1988, 58, 820–829. [Google Scholar] [CrossRef] [Scilit]
- Roser, B.P.; Korsch, R.J. Provenance Signatures of Sandstone-Mudstone Suites Determined Using Discriminant Function Analysis of Major-Element Data. Chem. Geol. 1988, 67, 119–139. [Google Scholar] [CrossRef] [Scilit]
- Bhatia, M.R. Plate Tectonics and Geochemical Composition of Sandstones. J. Geol. 1983, 91, 611–627. [Google Scholar] [CrossRef] [Scilit]
- Cox, R.; Lowe, D.R.; Cullers, R.L. The Influence of Sediment Recycling and Basement Composition on Evolution of Mudrock Chemistry in the Southwestern United States. Geochim. Cosmochim. Acta 1995, 59, 2919–2940. [Google Scholar] [CrossRef] [Scilit]
- Harnois, L. The CIW Index: A New Chemical Index of Weathering. Sediment. Geol. 1988, 55, 319–322. [Google Scholar] [CrossRef] [Scilit]
- Vermeesch, P.; Resentini, A.; Garzanti, E. An R Package for Statistical Provenance Analysis. Sediment. Geol. 2016, 336, 14–25. [Google Scholar] [CrossRef] [Scilit]
- Pszonka, J.; Godlewski, P.; Fheed, A.; Dwornik, M.; Schulz, B.; Wendorff, M. Identification and Quantification of Intergranular Volume Using SEM Automated Mineralogy. Mar. Pet. Geol. 2024, 162, 106708. [Google Scholar] [CrossRef] [Scilit]
- Hasterok, D.; Gard, M.; Bishop, C.M.B.; Kelsey, D. Chemical Identification of Metamorphic Protoliths Using Machine Learning Methods. Comput. Geosci. 2019, 132, 56–68. [Google Scholar] [CrossRef] [Scilit]
- Ueki, K.; Hino, H.; Kuwatani, T. Geochemical Discrimination and Characteristics of Magmatic Tectonic Settings: A Machine-learning-based Approach. Geochem. Geophys. Geosystems 2018, 19, 1327–1347. [Google Scholar] [CrossRef] [Scilit]
- Dramsch, J.S. 70 Years of Machine Learning in Geoscience in Review. Adv. Geophys. 2020, 61, 1–55. [Google Scholar] [CrossRef] [Scilit]
- Lundberg, S.M.; Lee, S.-I. A Unified Approach to Interpreting Model Predictions. Adv. Neural Inf. Process. Syst. 2017, 30. [Google Scholar] [CrossRef] [Scilit]
- Sahoo, A.; Verma, A.K.; Sabri, M.S.; Singh, T.N. Interpretable Machine Learning for Quantifying the Weathering Index of Mafic and Ultramafic Rocks Using SHAP and PDPE. Earth Sci. Inform. 2026, 19, 25. [Google Scholar] [CrossRef] [Scilit]
- Li, G.; Meng, Y.; Zhou, J.; Ming, D.; Dai, L.; Wang, L. Geochemical Characteristics and Source Analysis of Rare Earth Elements in Qinghai Lake Sediments. Acta Geochim. 2025, 44, 231–246. [Google Scholar] [CrossRef] [Scilit]
- Ori, G.G.; Friend, P.F. Sedimentary Basins Formed and Carried Piggyback on Active Thrust Sheets. Geology 1984, 12, 475–478. [Google Scholar]
- Burbank, D.W.; Johnson, G.D. The Late Cenozoic Chronologic and Stratigraphic Development of the Kashmir Intermontane Basin, Northwestern Himalaya. Palaeogeogr. Palaeoclimatol. Palaeoecol. 1983, 43, 205–235. [Google Scholar] [CrossRef] [Scilit]
- Rashid, S.A.; Ganai, J.A.; Masoodi, A.; Khan, F.A. Major and Trace Element Geochemistry of Lake Sediments, India: Implications for Weathering and Climate Control. Arab. J. Geosci. 2015, 8, 5677–5684. [Google Scholar] [CrossRef] [Scilit]
- Kulkarni, U.D.; Khan, A.N.; Gavali, R.S. Rate of Siltation in Wular Lake, (Jammu and Kashmir, India) with Special Emphasis on Its Climate & Tectonics. Int. J. Clim. Change Impacts Responses 2009, 1, 233. [Google Scholar] [CrossRef] [Scilit]
- Wadia, D.N. The Geology of Poonch State (Kashmir) and Adjacent Portions of the Punjab. Mem. Geol. Surv. India 1928, 51, 185–370. [Google Scholar] [CrossRef] [Scilit]
- Dixit, Y.; Tandon, S.K. Hydroclimatic Variability on the Indian Subcontinent in the Past Millennium: Review and Assessment. Earth-Sci. Rev. 2016, 161, 1–15. [Google Scholar] [CrossRef] [Scilit]
- Rashid, S.A.; Masoodi, A.; Khan, F.A. Sediment-Water Interaction at Higher Altitudes: Example from the Geochemistry of Wular Lake Sediments, Kashmir Valley, Northern India. Procedia Earth Planet. Sci. 2013, 7, 786–789. [Google Scholar] [CrossRef] [Scilit]
- Murthy, T.V.R.; Patel, J.G.; Panigrahy, S.; Parihar, J.S. National Wetland Atlas: Wetlands of International Importance Under Ramsar Convention; Space Applications Centre, ISRO: Ahmedabad, India, 2010. [Google Scholar]
- Shah, R.A.; Paul, O.J.; Dar, R.A.; Romshoo, S.A. Impact of Climate Change and Anthropogenic Activities on Lacustrine Ecosystems of the Kashmir Valley, NW Himalaya, India. Environ. Qual. Manag. 2024, 34, e22200. [Google Scholar] [CrossRef] [Scilit]
- Middlemiss, C.S. A Revision of the Silurian-Trias Sequence in Kashmir; Geological Survey of India: West Bengal, India, 1910. [Google Scholar]
- Fuchs, G.; Gupta, V.J. Palaeozoic Stratigraphy of Kashmir, Kishtwar and Chamba (Panjab Himalayas). Verhandlungen Geol. Bundesanst. 1971, 1, 68–97. [Google Scholar]
- Bhat, M.I.; Zainuddin, S.M. Origin and Evolution of the Panjal Volcanics. Himal. Geol. 1979, 9, 421–461. [Google Scholar]
- Shellnutt, J.G.; Bhat, G.M.; Wang, K.-L.; Yeh, M.-W.; Brookfield, M.E.; Jahn, B.-M. Multiple Mantle Sources of the Early Permian Panjal Traps, Kashmir, India. Am. J. Sci. 2015, 315, 589–619. [Google Scholar] [CrossRef] [Scilit]
- Wadia, D.N. The Cambrian-Trias Sequence of North-West Kashmir (Parts of Muzafarabad and Baramula Districts). Rec. Geol. Surv. India 1934, 68, 121. [Google Scholar]
- De Terra, H. Studies on the Ice-Age in India and Associated Human Cultures. Publ. Carnegie Inst. 1939, 493, 354. [Google Scholar]
- Bhatt, D.K. Lithostratigraphic Sub-Division of the Hirpur Formation (Lower Karewa)―A Critical Review and Modification. Himal. Geol. 1979, 9, 283–291. [Google Scholar]
- Bhatt, D.K. Lithostratigraphy of Karewa Group, Kashmir Valley, India and a Critical Review of Its Fossil Record. J. Geol. Soc. India 1989, 36, 548–549. [Google Scholar]
- Singh, I.B. Sedimentation Pattern in the Karewa Basin, Kashmir Valley, India, and Its Geological Significance. J. Palaeontol. Soc. India 1982, 27, 71–110. [Google Scholar] [CrossRef] [Scilit]
- Ahmad, I.; Chandra, R. Geochemistry of Loess-Paleosol Sediments of Kashmir Valley, India: Provenance and Weathering. J. Asian Earth Sci. 2013, 66, 73–89. [Google Scholar] [CrossRef] [Scilit]
- Terashima, S.; Imai, N.; Taniguchi, M.; Okai, T.; Nishimura, A. The preparation and preliminary characterisation of four new Geological Survey of Japan geochemical reference materials: Soils, JSO-1 and JSO-2; and marine sediments, JMS-1 and JMS-2. Geostand. Newsl. 2002, 26, 85–94. [Google Scholar] [CrossRef] [Scilit]
- Ring, E.J. The preparation and certification of fourteen South African silicate rocks for use as reference materials. Geostand. Newsl. 1993, 17, 137–158. [Google Scholar] [CrossRef] [Scilit]
- Paul, D.; Das, S.; Dash, J.K. Partitioning of Potentially Toxic Elements (PTEs) in the Surface Sediments of Muttukadu Estuary, Tamil Nadu, India: Implication for Environmental Risk Assessment. Soil Sediment Contam. Int. J. 2025, 34, 1743–1764. [Google Scholar] [CrossRef] [Scilit]
- Fedo, C.M.; Wayne Nesbitt, H.; Young, G.M. Unraveling the Effects of Potassium Metasomatism in Sedimentary Rocks and Paleosols, with Implications for Paleoweathering Conditions and Provenance. Geology 1995, 23, 921–924. [Google Scholar]
- Babechuk, M.G.; Widdowson, M.; Kamber, B.S. Quantifying Chemical Weathering Intensity and Trace Element Release from Two Contrasting Basalt Profiles, Deccan Traps, India. Chem. Geol. 2014, 363, 56–75. [Google Scholar] [CrossRef] [Scilit]
- Nesbitt, H.W.; Young, G.M. Prediction of Some Weathering Trends of Plutonic and Volcanic Rocks Based on Thermodynamic and Kinetic Considerations. Geochim. Cosmochim. Acta 1984, 48, 1523–1534. [Google Scholar] [CrossRef] [Scilit]
- Nesbitt, H.W.; Young, G.M. Formation and Diagenesis of Weathering Profiles. J. Geol. 1989, 97, 129–147. [Google Scholar] [CrossRef] [Scilit]
- Hayashi, K.-I.; Fujisawa, H.; Holland, H.D.; Ohmoto, H. Geochemistry Of ∼1.9 Ga Sedimentary Rocks from Northeastern Labrador, Canada. Geochim. Cosmochim. Acta 1997, 61, 4115–4137. [Google Scholar] [CrossRef] [Scilit] [PubMed]
- Pettijohn, F.J.; Potter, P.E.; Siever, R. Sand and Sandstone; Springer Science & Business Media: Berlin/Heidelberg, Germany, 2012; ISBN 1461210666. [Google Scholar]
- Rudnick, R.L.; Gao, S. The Crust, 3.01–The Composition of the Continental Crust. Treatise Geochem. 2003, 3, 635. [Google Scholar] [CrossRef] [Scilit]
- Cullers, R.L. The Geochemistry of Shales, Siltstones and Sandstones of Pennsylvanian–Permian Age, Colorado, USA: Implications for Provenance and Metamorphic Studies. Lithos 2000, 51, 181–203. [Google Scholar] [CrossRef] [Scilit]
- Hubert, L.; Arabie, P. Comparing Partitions. J. Classif. 1985, 2, 193–218. [Google Scholar] [CrossRef] [Scilit]
- Loring, D.H. Normalization of Heavy-Metal Data from Estuarine and Coastal Sediments. ICES J. Mar. Sci. 1991, 48, 101–115. [Google Scholar] [CrossRef] [Scilit]
- Sun, S.-S.; McDonough, W.F. Chemical and Isotopic Systematics of Oceanic Basalts: Implications for Mantle Composition and Processes. Geol. Soc. Lond. Spec. Publ. 1989, 42, 313–345. [Google Scholar] [CrossRef] [Scilit]
- Štrumbelj, E.; Kononenko, I. Explaining Prediction Models and Individual Predictions with Feature Contributions. Knowl. Inf. Syst. 2014, 41, 647–665. [Google Scholar] [CrossRef] [Scilit]
- Joliffe, I.T. Principal Component Analysis, 2nd ed.; Springer: New York, NY, USA, 2002. [Google Scholar]
- Breiman, L. Random Forests. Mach. Learn. 2001, 45, 5–32. [Google Scholar] [CrossRef] [Scilit]
- Taylor, S.R.; McLennan, S.M. The Continental Crust: Its Composition and Evolution; Blackwell Scientific Publications: Oxford, UK, 1985. [Google Scholar]
- McLennan, S.M.; Hemming, S.; McDaniel, D.K.; Hanson, G.N. Geochemical Approaches to Sedimentation, Provenance, and Tectonics; Geological Society of America: Boulder, CO, USA, 1993. [Google Scholar]
- Ojala, M.; Garriga, G.C. Permutation Tests for Studying Classifier Performance. J. Mach. Learn. Res. 2010, 11, 1833–1863. [Google Scholar]
- Varma, S.; Simon, R. Bias in Error Estimation When Using Cross-Validation for Model Selection. BMC Bioinform. 2006, 7, 91. [Google Scholar] [CrossRef] [Scilit] [PubMed]
- Jeelani, G.H.; Shah, A.Q. Geochemical Characteristics of Water and Sediment from the Dal Lake, Kashmir Himalaya: Constraints on Weathering and Anthropogenic Activity. Environ. Geol. 2006, 50, 12–23. [Google Scholar] [CrossRef] [Scilit]
- Babeesh, C.; Lone, A.; Achyuthan, H. Geochemistry of Manasbal Lake Sediments, Kashmir: Weathering, Provenance and Tectonic Setting. J. Geol. Soc. India 2017, 89, 563–572. [Google Scholar] [CrossRef] [Scilit]
- Das, B.K.; Haake, B.-G. Geochemistry of Rewalsar Lake Sediment, Lesser Himalaya, India: Implications for Source-Area Weathering, Provenance and Tectonic Setting. Geosci. J. 2003, 7, 299–312. [Google Scholar] [CrossRef] [Scilit]
- Shao, J.; Yang, S.; Li, C. Chemical Indices (CIA and WIP) as Proxies for Integrated Chemical Weathering in China: Inferences from Analysis of Fluvial Sediments. Sediment. Geol. 2012, 265, 110–120. [Google Scholar] [CrossRef] [Scilit]
- Davison, W. Iron and Manganese in Lakes. Earth-Sci. Rev. 1993, 34, 119–163. [Google Scholar] [CrossRef] [Scilit]

Disclaimer/Publisher’s Note: The statements, opinions and data contained in all publications are solely those of the individual author(s) and contributor(s) and not of MDPI and/or the editor(s). MDPI and/or the editor(s) disclaim responsibility for any injury to people or property resulting from any ideas, methods, instructions or products referred to in the content. |
© 2026 by the authors. Licensee MDPI, Basel, Switzerland. This article is an open access article distributed under the terms and conditions of the Creative Commons Attribution (CC BY) license.