Article

Imaging Detailed Structures and Estimating Permeability of the Weathered Crust in Ion-Adsorption Rare Earth Deposits via Electrical Resistivity Tomography

1
Ministry of Natural Resources Key Laboratory of Ionic Rare Earth Resources and Environment, Jiangxi College of Applied Technology, Ganzhou 341000, China
2
Ganzhou Key Laboratory of Tungsten and Rare Earth Resources Exploration and Environment Evaluation, Jiangxi College of Applied Technology, Ganzhou 341000, China
3
Gannan Geological and Mineral Group Co., Ltd., Ganzhou 341000, China
4
China Rare Earth Jiangxi Co., Ltd., Ganzhou 341000, China
5
Jiangxi Earthquake Agency, Nanchang 330026, China
*
Authors to whom correspondence should be addressed.
Minerals 2026, 16(8), 773; https://doi.org/10.3390/min16080773
Submission received: 8 June 2026 / Revised: 5 July 2026 / Accepted: 21 July 2026 / Published: 25 July 2026
(This article belongs to the Special Issue Ion-Adsorption-Type REE Deposits)

Abstract

Ion-adsorption rare earth deposits (IADs) constitute the primary global source of medium-to-heavy rare earth elements. The sustainable exploitation of these resources hinges on the precise characterization of the weathered crust architecture and its hydrogeological properties. Conventional drilling often fails to resolve the complex vertical heterogeneity of regolith profiles, thereby limiting orebody delineation and the optimization of in situ leaching (ISL). To address this, this study integrates Electrical Resistivity Tomography (ERT) with Archie’s Law and the Kozeny–Carman equation. Focusing on the YZK1 and YZK2 survey lines in the Dabu mining area, southern Jiangxi, we derived 2D distributions of porosity and permeability from resistivity inversions. Our results delineate the weathered crust into four distinct vertical strata: a surface accumulation layer, a completely-to-highly weathered granite layer, a moderately-to-slightly weathered layer, and fresh bedrock. Quantitatively, the completely-to-highly weathered layer exhibits a “low resistivity (10–700 Ω·m)–high porosity (8.7%–17%)–high permeability (0.04–1.2 mD)” mode, serving as the primary leachable reservoir. In contrast, the surface and moderately weathered layers display “high resistivity (>800 Ω·m)–low porosity (3.4%–6.4%)–low permeability (0.01–0.04 mD)” characteristics. Crucially, although the fractured bedrock zones on both YZK1 and YZK2 profiles exhibit similar absolute permeability values (~0.016 mD), they represent two distinct hydraulic architectures. On the YZK1 profile, the fractured zone acts as a relatively homogeneous potential leakage pathway. Conversely, the YZK2 profile displays significant vertical segmentation: the upper and lower margins function as permeable pathways, while the central core, likely infilled with fault gouge, acts as a sealing zone that impedes fluid flow. Consequently, resistivity data alone are insufficient to accurately assess hydraulic conductivity; joint interpretation incorporating both permeability and porosity is essential to definitively determine whether a fault zone acts as a “conduit” or a “barrier.” By transitioning from qualitative imaging to quantitative parameter evaluation, this study provides a robust technical paradigm for fine-scale exploration and ISL optimization in IADs.

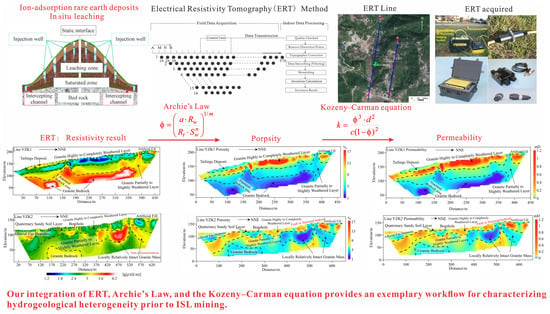
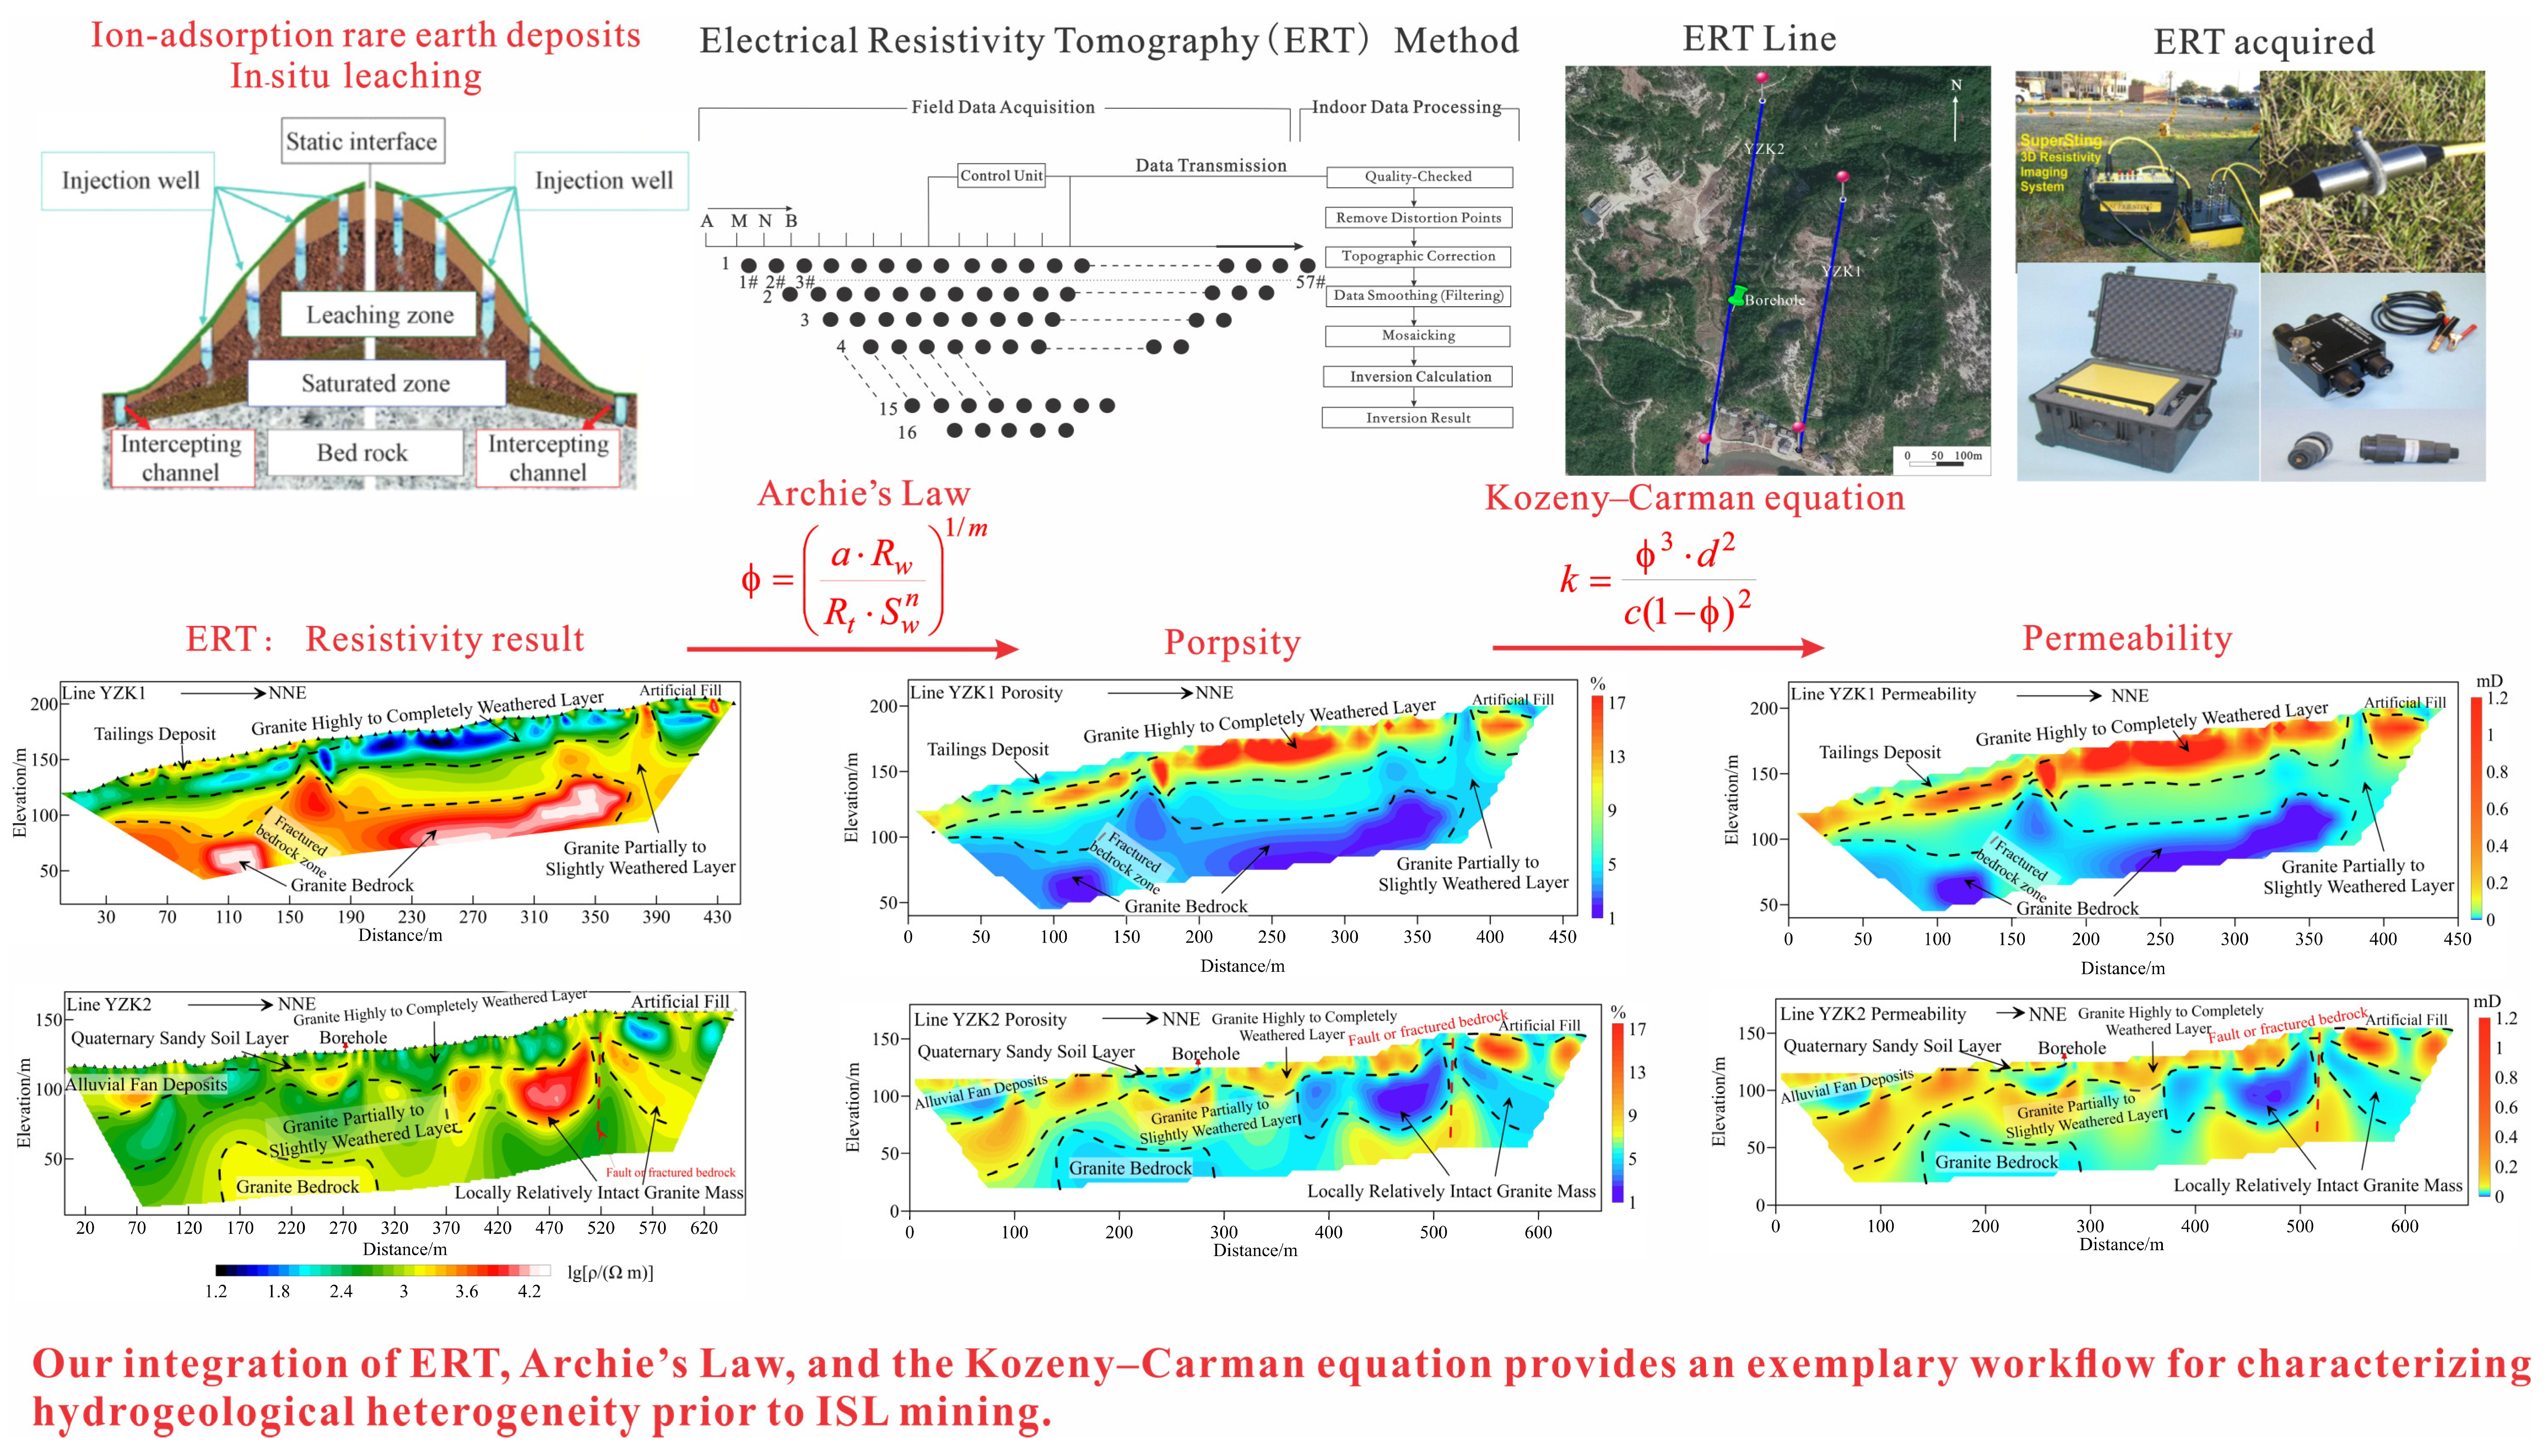
Graphical Abstract

1. Introduction

Rare earth elements (REEs) constitute a group of seventeen metallic elements, including scandium, yttrium, and the fifteen lanthanides. Owing to their unique optical, electronic, and magnetic properties, REEs are indispensable strategic resources for high-tech sectors, including national defense, aerospace, and renewable energy [1]. Conventionally, REEs are classified into light (LREEs, La–Eu) and heavy (HREEs, Gd–Lu) based on an ionic radius threshold of 106 pm [2]. Given that HREEs serve as irreplaceable ‘industrial vitamins’ in high-tech supply chains—possessing a strategic value far exceeding that of LREEs—the explosive growth of global emerging industries has triggered an exponential surge in HREE demand [3,4].
Economically viable HREE resources are predominantly hosted within ion-adsorption rare earth deposits (IADs) [5]. Southern China hosts the first-discovered and most economically significant IADs, and recent studies have confirmed comparable deposits in Madagascar, Southeast Asia (e.g., Indonesia), South America, Australia, and Japan [6,7,8]. The formation of IADs involves two discrete and independent evolutionary stages: endogenetic and exogenous [8,9,10]. The endogenetic stage, governed by complex magmatic and tectonic processes, forms the favorable granitic source rocks, determining the initial REE abundance and distribution patterns. During the exogenous stage, primary REE-bearing minerals (e.g., bastnaesite and monazite) decompose, releasing REE3+ ions into pore fluids, followed by selective adsorption onto the surfaces of secondary clay minerals via cation exchange mechanisms, concentrating the highest grades in the weathered shallow layer [10,11,12]. The weathered layer represents the primary ore-bearing horizon of ion-adsorption type rare earth deposits. Current exploration practices rely heavily on manual percussion drilling to characterize the weathered layer and determine REE grade and thickness distributions [13]. These sparse point data are typically supplemented by spatial interpolation algorithms—such as Inverse Distance Weighting, Radial Basis Functions, Local Polynomial, and Ordinary Kriging—for reserve estimation [14,15,16,17]. However, these conventional methods are constrained by low efficiency, high costs, and significant sampling discreteness. Consequently, they struggle to achieve fine-scale, non-destructive, and efficient characterization of the weathered layer, thereby severely impeding the accurate evaluation and green development of these critical deposits.
The weathered crust of IADs constitutes the principal ore-hosting horizon, typically exhibiting complex morphology, heterogeneous grades, and variable burial depths [18,19]. Currently, the primary extraction method for ion-adsorption rare earth deposits is in situ leaching (ISL). This technology involves injecting electrolyte solutions—such as ammonium sulfate—into the orebody. Through ion exchange, rare earth ions adsorbed onto clay mineral surfaces are desorbed into the liquid phase, allowing for subsequent collection and separation [20,21]. Within this process, porosity and permeability serve as core parameters governing leachate migration pathways and mass transfer efficiency: porosity controls solution storage space, while permeability dominates seepage velocity and the formation of preferential flow channels [22,23]. Conventional measurements relying on borehole coring and laboratory tests are costly, time-consuming, and lack spatial representativeness [24]. Therefore, there is an urgent need for rapid, cost-effective technologies to characterize both the structural and hydrogeological properties of the weathered layer.
Geophysical exploration offers a quasi-transparent means of detecting subsurface structures by leveraging physical property contrasts. Ion-adsorption rare earth ores exhibit significant contrasts in density, conductivity, and permittivity relative to surrounding lithologies [8], providing a solid foundation for geophysical applications. Among available methods, Electrical Resistivity Tomography (ERT) stands out for its high resolution, efficiency, and intuitive profiling in shallow environments. Recent studies have successfully employed ERT to delineate weathered layers stratigraphy [6,7,8,25], identify corestones and fracture zones [26], and map deep fault structures [27]. Integrative approaches combining ERT with other methods (e.g., AMT) have further enabled the construction of 3D models for “orebody-fracture-seepage” systems [28].
The quantitative transformation from resistivity to hydrogeological parameters is grounded in the physical coupling between electrical conduction and fluid flow in porous media. In saturated weathered layers, electrical current migrates primarily through interconnected pore water, establishing an inverse relationship between bulk resistivity and porosity (ϕ), as described by Archie’s Law [29,30]. Porosity can then be linked to permeability (k) via the Kozeny–Carman equation, which relates fluid flow to pore throat geometry [31]. This framework has been validated in various hydrogeophysical contexts, including granular reservoirs [32] and coastal aquifers [33], confirming that resistivity data encapsulate critical information regarding both fluid storage (porosity) and transmission (permeability) capacities [34].
Despite the widespread application of ERT in IADs exploration, existing research remains largely confined to qualitative or semi-quantitative interpretations, primarily focusing on defining layer thickness or bedrock topography [35]. A notable gap persists in the deep coupling required to quantitatively transform resistivity into key hydrogeological parameters (porosity and permeability). This limitation hinders the direct application of geophysical results to leachate migration simulation and orebody recoverability assessment. To bridge this gap, this study pioneers the quantitative transformation of ERT-derived resistivity into permeability distributions for IADs weathered layer. By integrating Archie’s Law and the Kozeny–Carman equation, we establish a refined “resistivity–porosity–permeability” interpretation workflow. This research aims to transcend traditional qualitative constraints, providing a scientific basis for efficient exploration and optimized ISL schemes.

2. Geological Setting and Physical Property Characteristics

2.1. Geological Setting

The study area is located in the Dabu region of southern Jiangxi (Gannan), situated within the southeastern portion of the South China Fold System in the South China Block. It occupies the eastern segment of the Nanling EW-trending tectono-magmatic-metallogenic belt, specifically at the junction and superposition of the NE-trending Wuyishan structural belt and the Nanling EW-trending structural belt [36,37,38]. This location constitutes the core of the Gannan ion-adsorption rare earth ore concentration zone within the eastern Nanling REE metallogenic belt (Figure 1a) [39,40].
The regional stratigraphy exhibits a typical basement-cover structure. The lower unit consists of a rigid basement comprising Sinian–Cambrian low-grade metamorphic rocks (e.g., metasandstone and slate) [41]. The upper unit is a cover sequence dominated by Devonian–Permian littoral to neritic clastic rocks and carbonate rocks, whereas the Mesozoic–Cenozoic strata are primarily composed of continental red beds, volcaniclastic rocks, and Quaternary loose accumulations (Figure 1b) [41]. The tectonic evolution of the area involved multiple superimposed stages. The Caledonian period established the near EW-trending structural framework; the Hercynian–Indosinian periods were characterized by regional uplift and subsidence; and the Yanshanian period represented the main stage of tectonic-magmatic-metallogenic activity. This formed a complex fault network dominated by NNE-trending structures, supplemented by EW-trending and NW-trending faults. The intense block faulting and intraplate extension during this period not only controlled the emplacement space of Yanshanian granites but also profoundly governed the development of the later weathered crust and the spatial distribution of the deposits [41].
Magmatic activity in the area was frequent and intense, dominated by Yanshanian acid intrusions. This formed large granite batholiths represented by the Dabu composite pluton and the Xiawentan pluton, which constitute the most prominent geological bodies in the region [42]. The lithology is primarily biotite monzogranite and alkali feldspar granite. Geochemical analyses reveal that these granites are generally characterized by high silica (SiO2), high alkalis (K2O + Na2O), enrichment in light rare earth elements (LREEs), and strong negative Eu anomalies (δEu = 0.17–0.20), forming the geochemical baseline for the subsequent supergene enrichment of IADs [43]. The total REE content is relatively high (generally >150 × 10−6) and exhibits a relative enrichment in heavy REEs (HREEs) [44]. Consequently, these granites serve as high-quality parent rocks for the formation of ion-adsorption medium-to-heavy REE deposits in the region [12].
The formation and preservation of ion-adsorption rare earth ores are strictly controlled by supergene weathering processes and geomorphological conditions [12]. Since the Quaternary, the study area has been situated in a subtropical warm and humid climatic environment. The widespread development of ‘steamed-bun-shaped’ gentle hilly terrain (150–350 m a.s.l.) further enhances this effect. By favoring the infiltration and leaching of surface runoff while mitigating intense physical denudation, this topography provides favorable conditions for the preservation of thick weathered layers [44]. The ore-bearing weathered layer is continuously distributed in a planar fashion over the parent rock, exhibiting a complete profile structure from top to bottom: a humus layer, an eluvial–colluvial layer, a completely weathered layer, a semi-weathered layer, and bedrock [41]. Among these, the completely weathered layer serves as the primary host for REE mineralization. This layer is weakly acidic (pH 5.5–6.5), with the original rock texture completely destroyed [44]. It is mainly composed of clay minerals (e.g., kaolinite, halloysite) and quartz grains. Characterized by a loose structure and high porosity, its thickness varies significantly (2–20 m, averaging approximately 12 m), providing an ideal site for the enrichment of REE ions, which exist as hydrated cations adsorbed onto the surface of clay minerals [21,28].
In summary, the Dabu rare earth mining area exhibits a well-developed weathered crust and distinct REE enrichment characteristics, making it an ideal field laboratory for investigating the “electrical property–structure–seepage” coupling mechanism of ion-adsorption rare earth deposits. Conducting detailed detection and permeability assessment of the weathered crust in this area will not only deepen the scientific understanding of internal crustal heterogeneity but also provide critical technical support for optimizing in situ leaching processes.

2.2. Physical Property Characteristics

Petrophysical property contrasts serve as the fundamental bridge connecting geology and geophysics. Based on the regional geological setting, the parent rocks of the ion-adsorption rare earth ores in the study area are granites, with the ore-hosting horizon situated within the granite weathered crust [38,45]. Consequently, the primary objective of employing Electrical Resistivity Tomography (ERT) is to characterize the architectural framework and permeability distribution of the weathered layer.
Analysis of the petrophysical properties in the Dabu mining area (Table 1) reveals distinct resistivity signatures across different geological units. Surface water and groundwater exhibit the lowest resistivity values (<100 Ω·m) [28], displaying pronounced low-resistivity characteristics. Quaternary sandy clay and fault fracture zones are typified by medium-to-low resistivity (<300 Ω·m) [28]. The granite weathered layer presents moderate resistivity (300–800 Ω·m) [26], while the granite bedrock demonstrates distinctly high resistivity (>1000 Ω·m) [27]. Moreover, the fresh granite bedrock is characterized by excellent integrity and negligible matrix porosity. However, its bulk resistivity remains sensitive to water content, as electrical conduction is governed by interconnected microfractures. Even trace amounts of fracture water can significantly lower the bulk resistivity, distinguishing it from the extremely high resistivity of the completely dry, intact rock mass. Therefore, from the perspective of resistivity parameters, ERT is highly effective in delineating key structural interfaces within the weathered layer, including the groundwater table, weathering horizons, bedrock contacts, and fracture zones.

3. Methodology

3.1. Electrical Resistivity Tomography Method

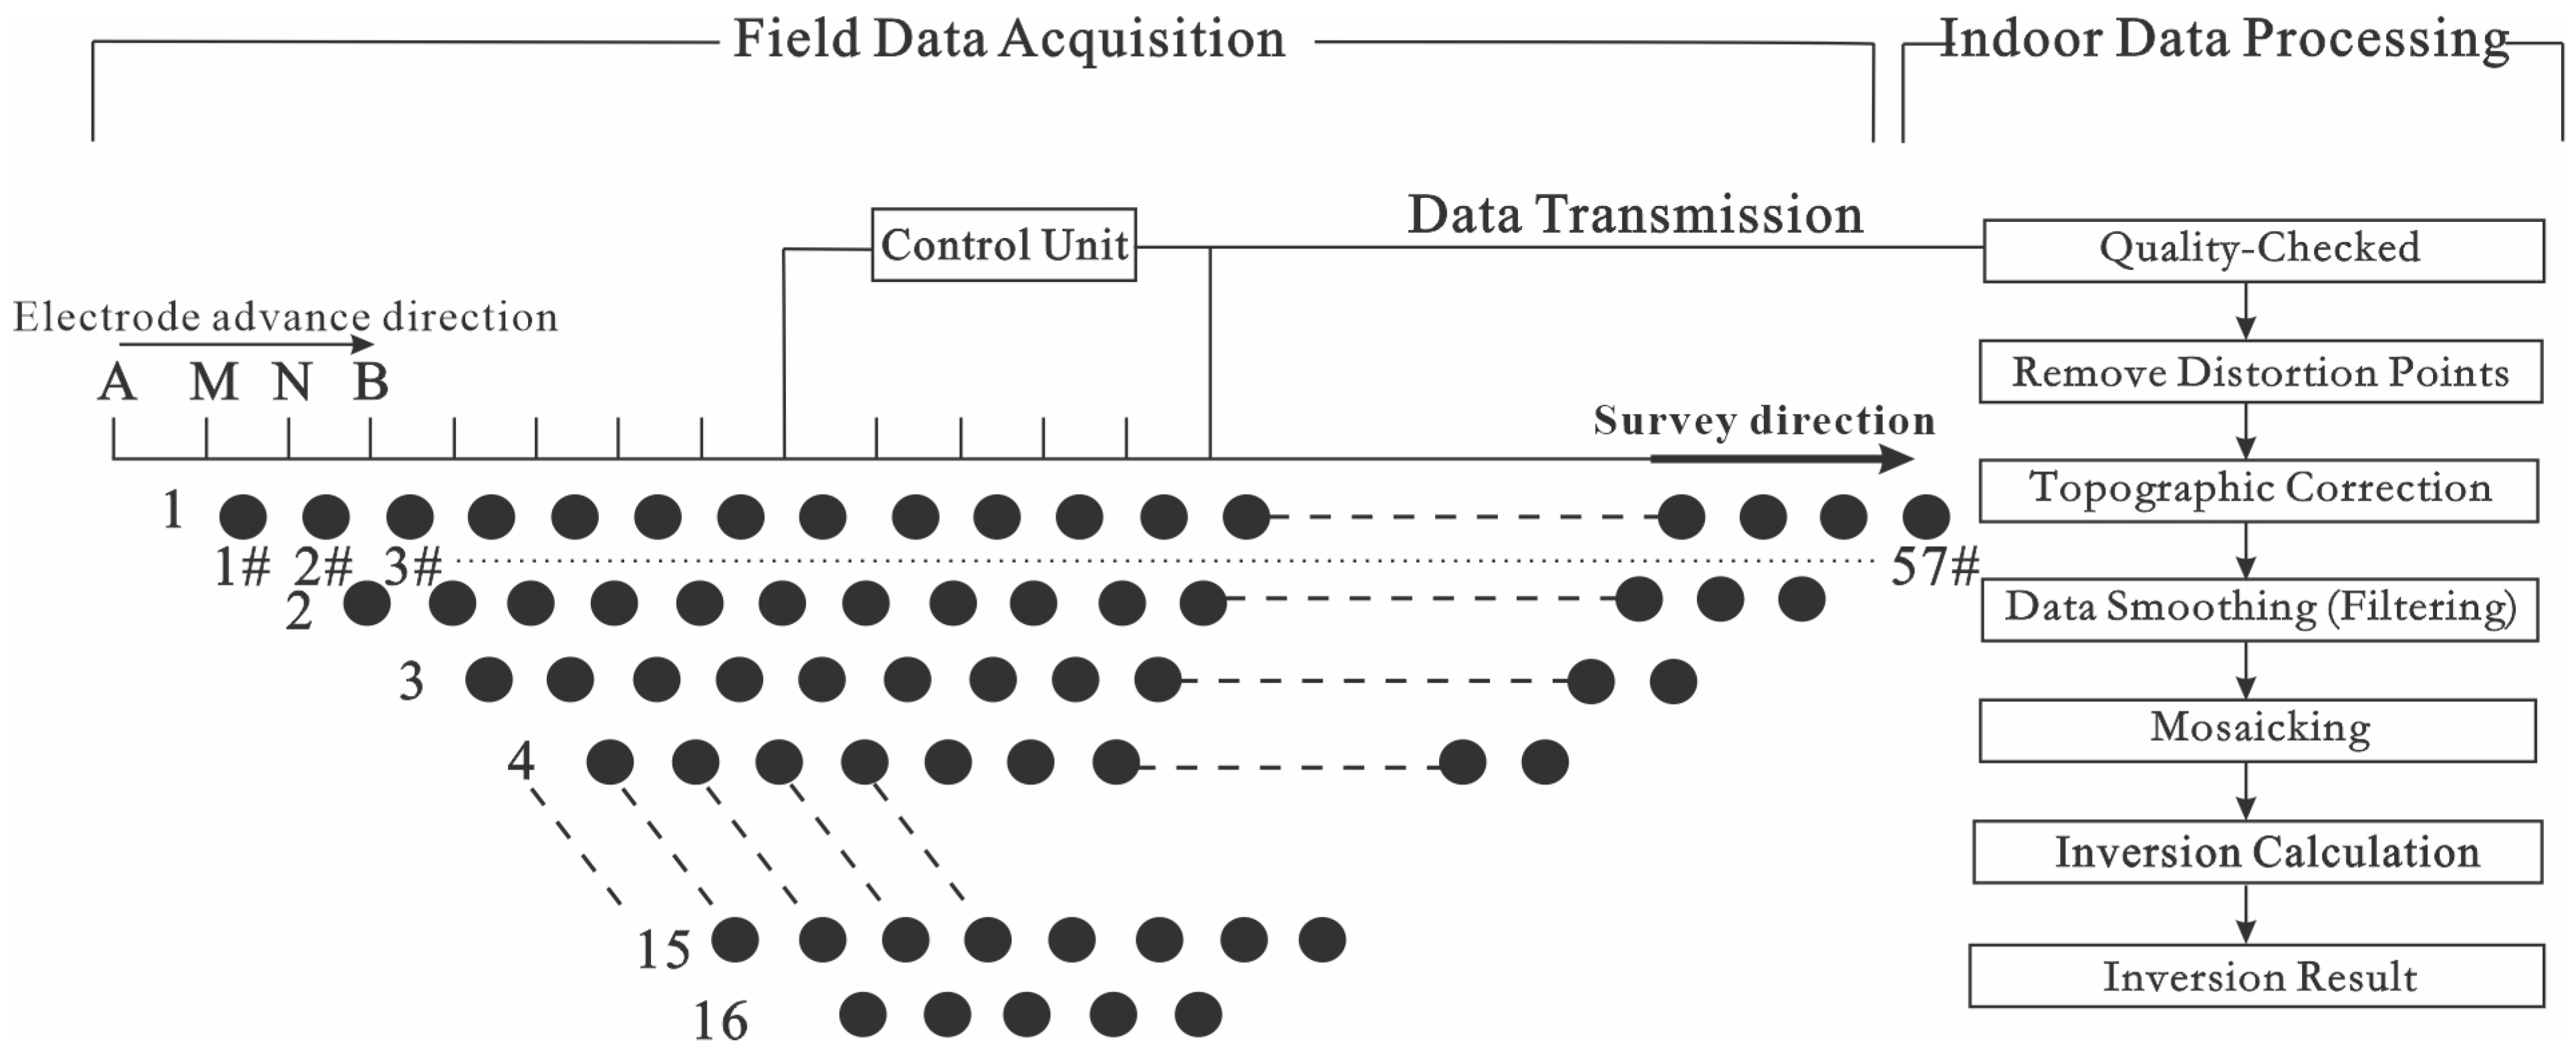
Electrical Resistivity Tomography (ERT) is a sophisticated geophysical imaging technique that exploits contrasts in the electrical conductivity of subsurface materials to delineate the distribution of conduction currents within artificially generated direct current (DC) fields [17]. Fundamentally, ERT shares the same physical principles as conventional resistivity profiling and sounding methods. The technique involves injecting a DC into the ground using specific electrode configurations and recording the resultant potential differences as the current flows through various subsurface geological units. Subsequently, the acquired data undergo rigorous processing and inversion to reconstruct the subsurface resistivity distribution, thereby addressing specific geological or engineering objectives. The distinguishing feature of ERT is its high density of measurement points. During fieldwork, a dense array of electrodes is deployed at fixed intervals along the survey line. A central controller automatically manages the sequential switching of current injection and potential measurement electrodes, enabling the rapid and simultaneous acquisition of both 2D profiling and vertical sounding data across the survey area (Figure 2) [45].

3.2. ERT Data Acquisition, Processing, and Inversion

Field data acquisition for the Electrical Resistivity Tomography (ERT) survey was conducted using a SUPER STING R8/IP system (Advanced Geosciences, Inc., Austin, TX, USA). The Wenner-Schlumberger array was selected for the sounding measurements due to its optimal compromise between vertical resolution and signal-to-noise ratio. Two survey lines, designated YZK1 and YZK2, were deployed in a NNE direction, extending from the slope foot to the slope crest, with a constant electrode spacing of 10 m. The layout of the survey lines is illustrated in Figure 1c, and the detailed acquisition parameters are summarized in Table 2.
During data acquisition, real-time noise suppression was implemented based on the raw pseudosections displayed by the acquisition software, ensuring the removal of anomalous data points to secure high-quality datasets for subsequent processing and inversion. The collected ERT data then underwent rigorous preprocessing, including format conversion, data editing, filtering of noisy outliers, and topographic correction. Subsequently, forward modeling and inversion were performed using the Generalized Nonlinear Conjugate Gradient (GNCG) method [46] (Figure 2). This iterative process yielded the final 2D resistivity models, which serve as the foundational dataset for characterizing the structure of the weathered crust and inferring its permeability distribution.

3.3. Relationships Between Resistivity, Porosity, and Permeability

The bulk resistivity of subsurface rocks is primarily controlled by three factors: rock porosity, water saturation, and the resistivity of the pore fluid [29,30]. In the context of ERT surveys, variations in bulk resistivity are governed by the combined effects of porosity, water saturation, and pore-fluid salinity. To quantify this relationship, Archie’s law establishes the empirical relationship linking bulk resistivity (Rt), formation factor (F), and water saturation (Sw) (Archie, 1942 [47]; Equation (1)). This relationship allows for the derivation of a functional relationship between resistivity and porosity (Equation (2)), enabling the estimation of porosity from resistivity data.
F = R t R w = a ϕ m S w n
ϕ = a R w R t S w n 1 / m
In Equations (1) and (2), Rt = Bulk resistivity of the rock (Ω·m), Rw = Resistivity of the pore water (Ω·m), F = Formation factor (dimensionless), ϕ = Porosity (fraction), Sw = Water saturation (fraction), a= Tortuosity factor (Usually 1), m = Cementation exponent, n = Saturation exponent.
Porosity (ϕ) is a key parameter governing the hydraulic conductivity (K). For saturated porous media, the intrinsic permeability (k)—which describes the ease of fluid flow through the pore structure—can be related to porosity via the Kozeny–Carman equation [48,49].
k = ϕ 3 d 2 c ( 1 ϕ ) 2
In Equation (3), k represents the permeability, and ϕ denotes the porosity. The parameter refers to the average grain diameter of the constituent rock particles, which governs the pore-throat size. A larger value corresponds to wider pore throats, resulting in weaker capillary forces, reduced bound water, and enhanced mobility of free water, thereby increasing the effective permeability, and vice versa [48]. The coefficient c is the Kozeny constant, which is primarily dependent on the geometry of the pore spaces and the flow resistance [49].
Substituting the porosity function defined in Equation (2) into the Kozeny–Carman relationship [48,49] (Equation (3)) yields a direct functional relationship between resistivity and permeability (Equation (4)). This unified model facilitates the quantitative transformation from bulk resistivity to permeability:
k = 1.013 × 10 9 ( d × 10 3 ) 2 a R w R t S w n 3 / m c 1 a R w R t S w n 1 / m 2
Due to the lack of systematic petrophysical calibration data for ion-adsorption rare earth weathered crusts, this study integrated regional geological constraints with empirical parameters derived from unconsolidated kaolinitic sand–clay mixtures and igneous rocks. Based on these references, the parameters listed in Table 3 are selected to perform the porosity-to-permeability transformations.

4. Evaluation of Inversion Results and Borehole Validation

4.1. Data Inversion and Quality Assessment

Following data acquisition, the raw datasets from the YZK1 and YZK2 survey lines were processed and inverted using CarrotREM v1.5 software (Wuhan Center of Geological Survey, China Geological Survey). Initially, low-quality data points with errors exceeding 5% were filtered out. Subsequently, topographic data were imported to implement inversion with terrain correction.
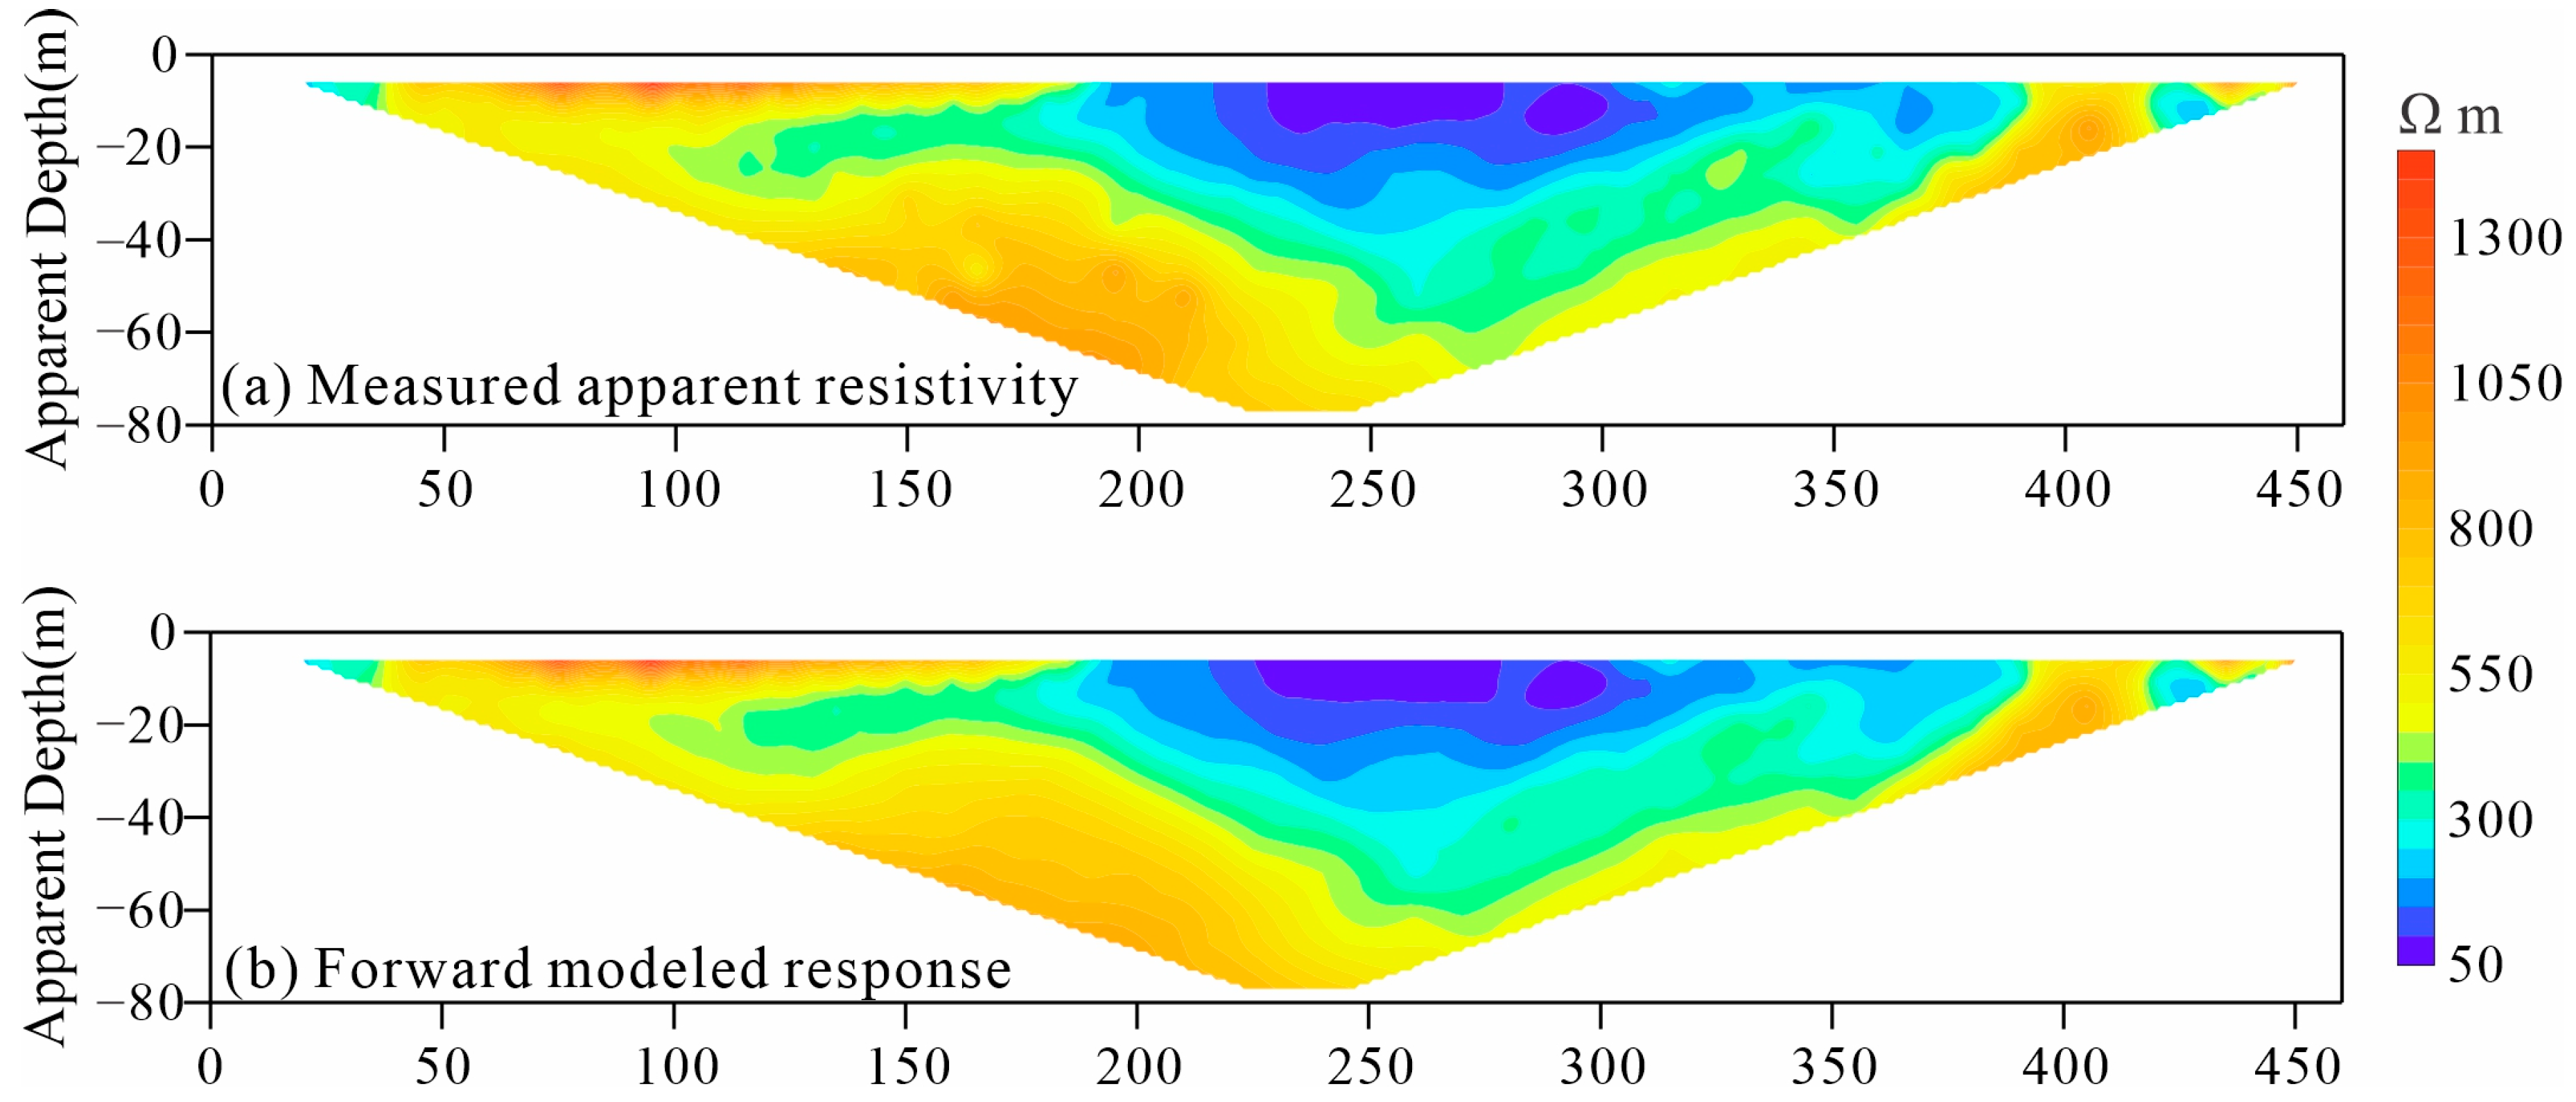
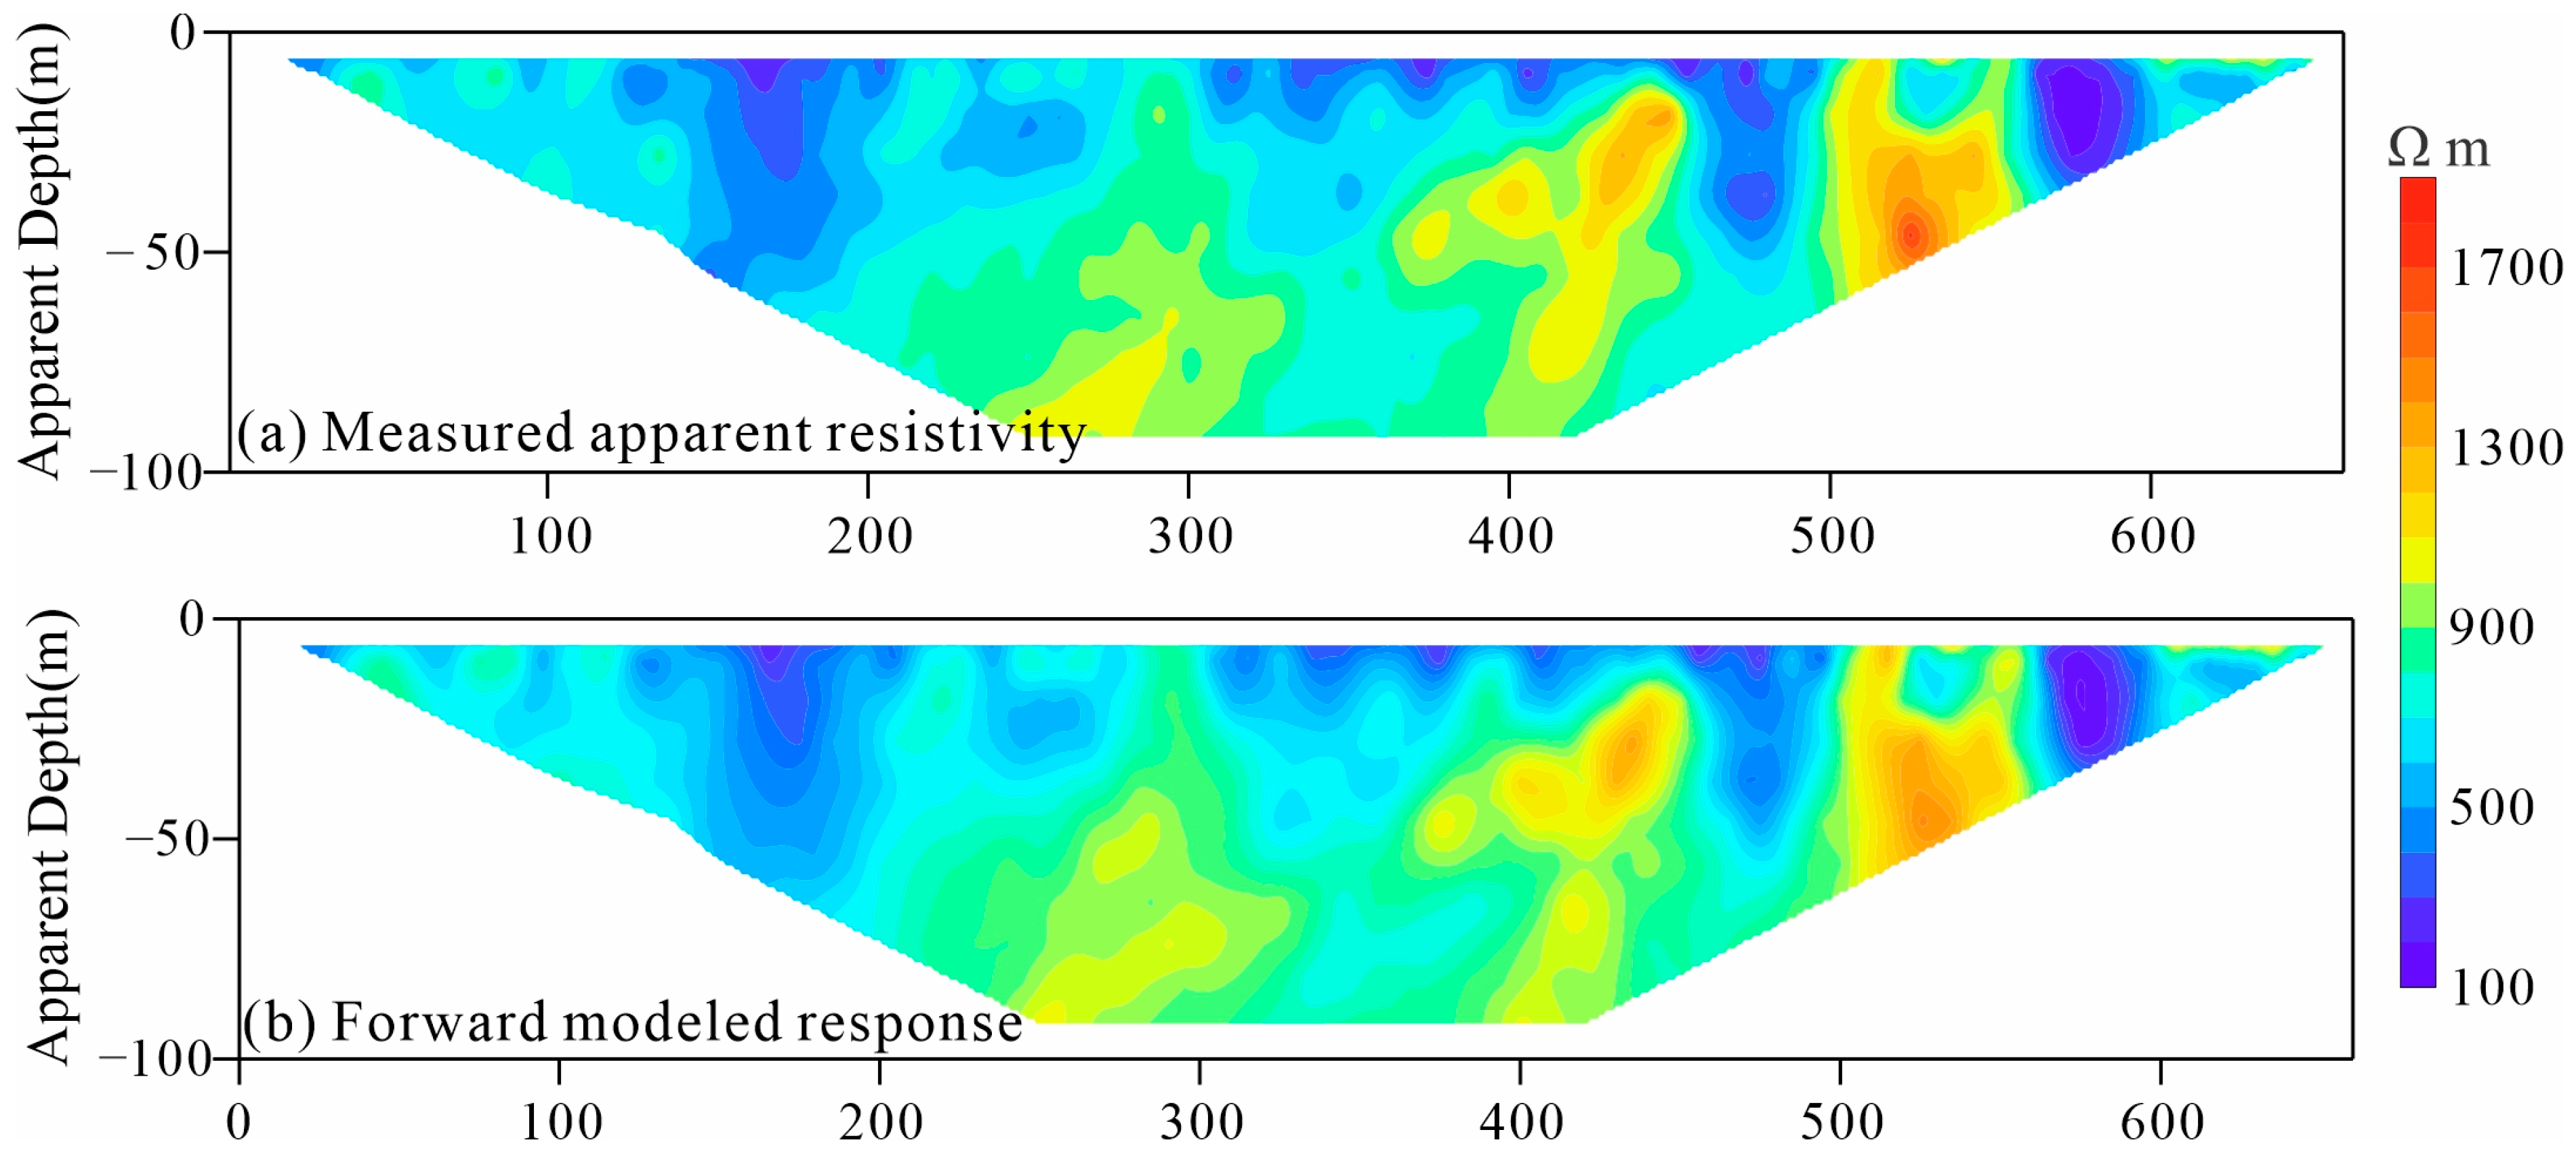
During the inversion, the measured average apparent resistivities of YZK1 (466.97 Ω·m) and YZK2 (756.4 Ω·m) were set as the background reference models. The inversion process was constrained by predefined minimum and maximum resistivity boundaries. The inversion process converged after 10 iterations for YZK1 and 8 iterations for YZK2. Ultimately, the Root Mean Square (RMS) errors for the YZK1 and YZK2 inversions were reduced to 6.11% (Figure 3) and 6.20% (Figure 4), respectively, indicating a good fit between the observed and calculated data.
The measured apparent resistivity and the forward-modeled apparent resistivity (derived from the inversion results) for the YZK1 and YZK2 lines are presented in Figure 3 and Figure 4, respectively. A comparison between the measured and forward-modeled responses reveals a high degree of consistency in their spatial variation characteristics. This indicates that the inversion results are robust and reliable, further supported by the fitting errors being less than 7%. Consequently, the 2D inversion results from both survey lines can be utilized for subsequent comprehensive geological and geophysical interpretation.

4.2. Verification of Inversion Results by Boreholes

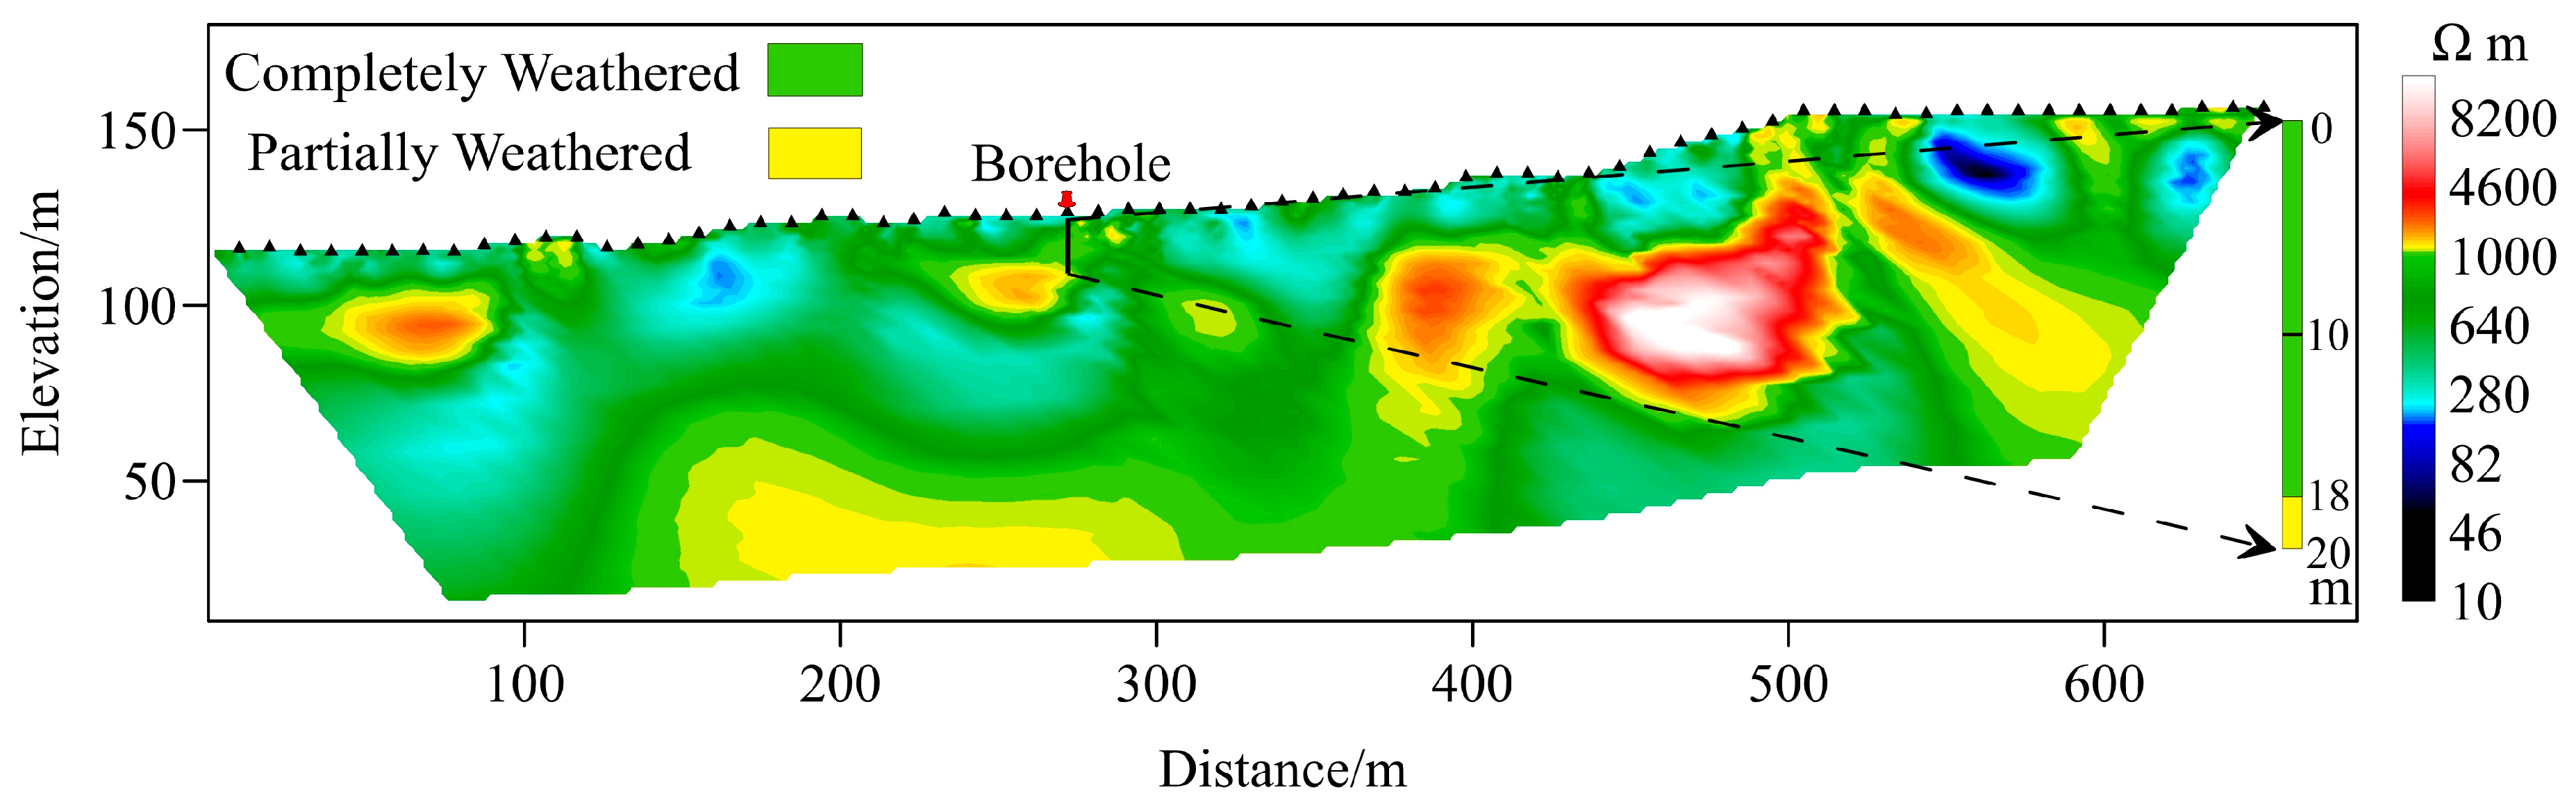
To quantitatively corroborate the reliability of the 2D Electrical Resistivity Tomography (ERT) inversion results, borehole data (Figure 1c) were introduced for validation. As shown in Figure 5, the manual drill hole (total depth: 20 m) located at the 270 m mark of the YZK2 survey line revealed that the basal boundary of the completely weathered granite layer lies at a depth of 18 m. The shallow subsurface at the borehole location is composed of Quaternary sandy soil with high moisture content, exhibiting characteristic low-resistivity anomalies. With increasing depth, the water content gradually decreases due to gravity drainage and the transition to denser weathered rock. Consequently, the resistivity of the completely weathered layer increases correspondingly, manifesting as a relatively high-resistivity anomaly zone (>300 Ω·m). This inverse correlation between resistivity and saturation—where low resistivity indicates high water content and vice versa—demonstrates that the ERT inversion accurately images the hydrogeological structure of the weathered crust.
Comparative analysis indicates a high degree of consistency between the borehole data and the ERT model. The depth of the high-resistivity bedrock interface interpreted from the 2D inversion section (16.55 m) closely matches the drilled depth of 18 m. Furthermore, the resistivity range of this layer on the inversion section (463–1367 Ω·m) is largely consistent with the typical resistivity range of granite weathered layers (300–800 Ω·m). This dual consistency in “depth and resistivity” fully demonstrates that the ERT inversion results for Line YZK2 accurately reflect the distribution of subsurface geological structures, thereby possessing high credibility for subsequent geological interpretation.

5. Discussion

5.1. Detailed Interpretation of the Resistivity Structure of the Weathered Layer

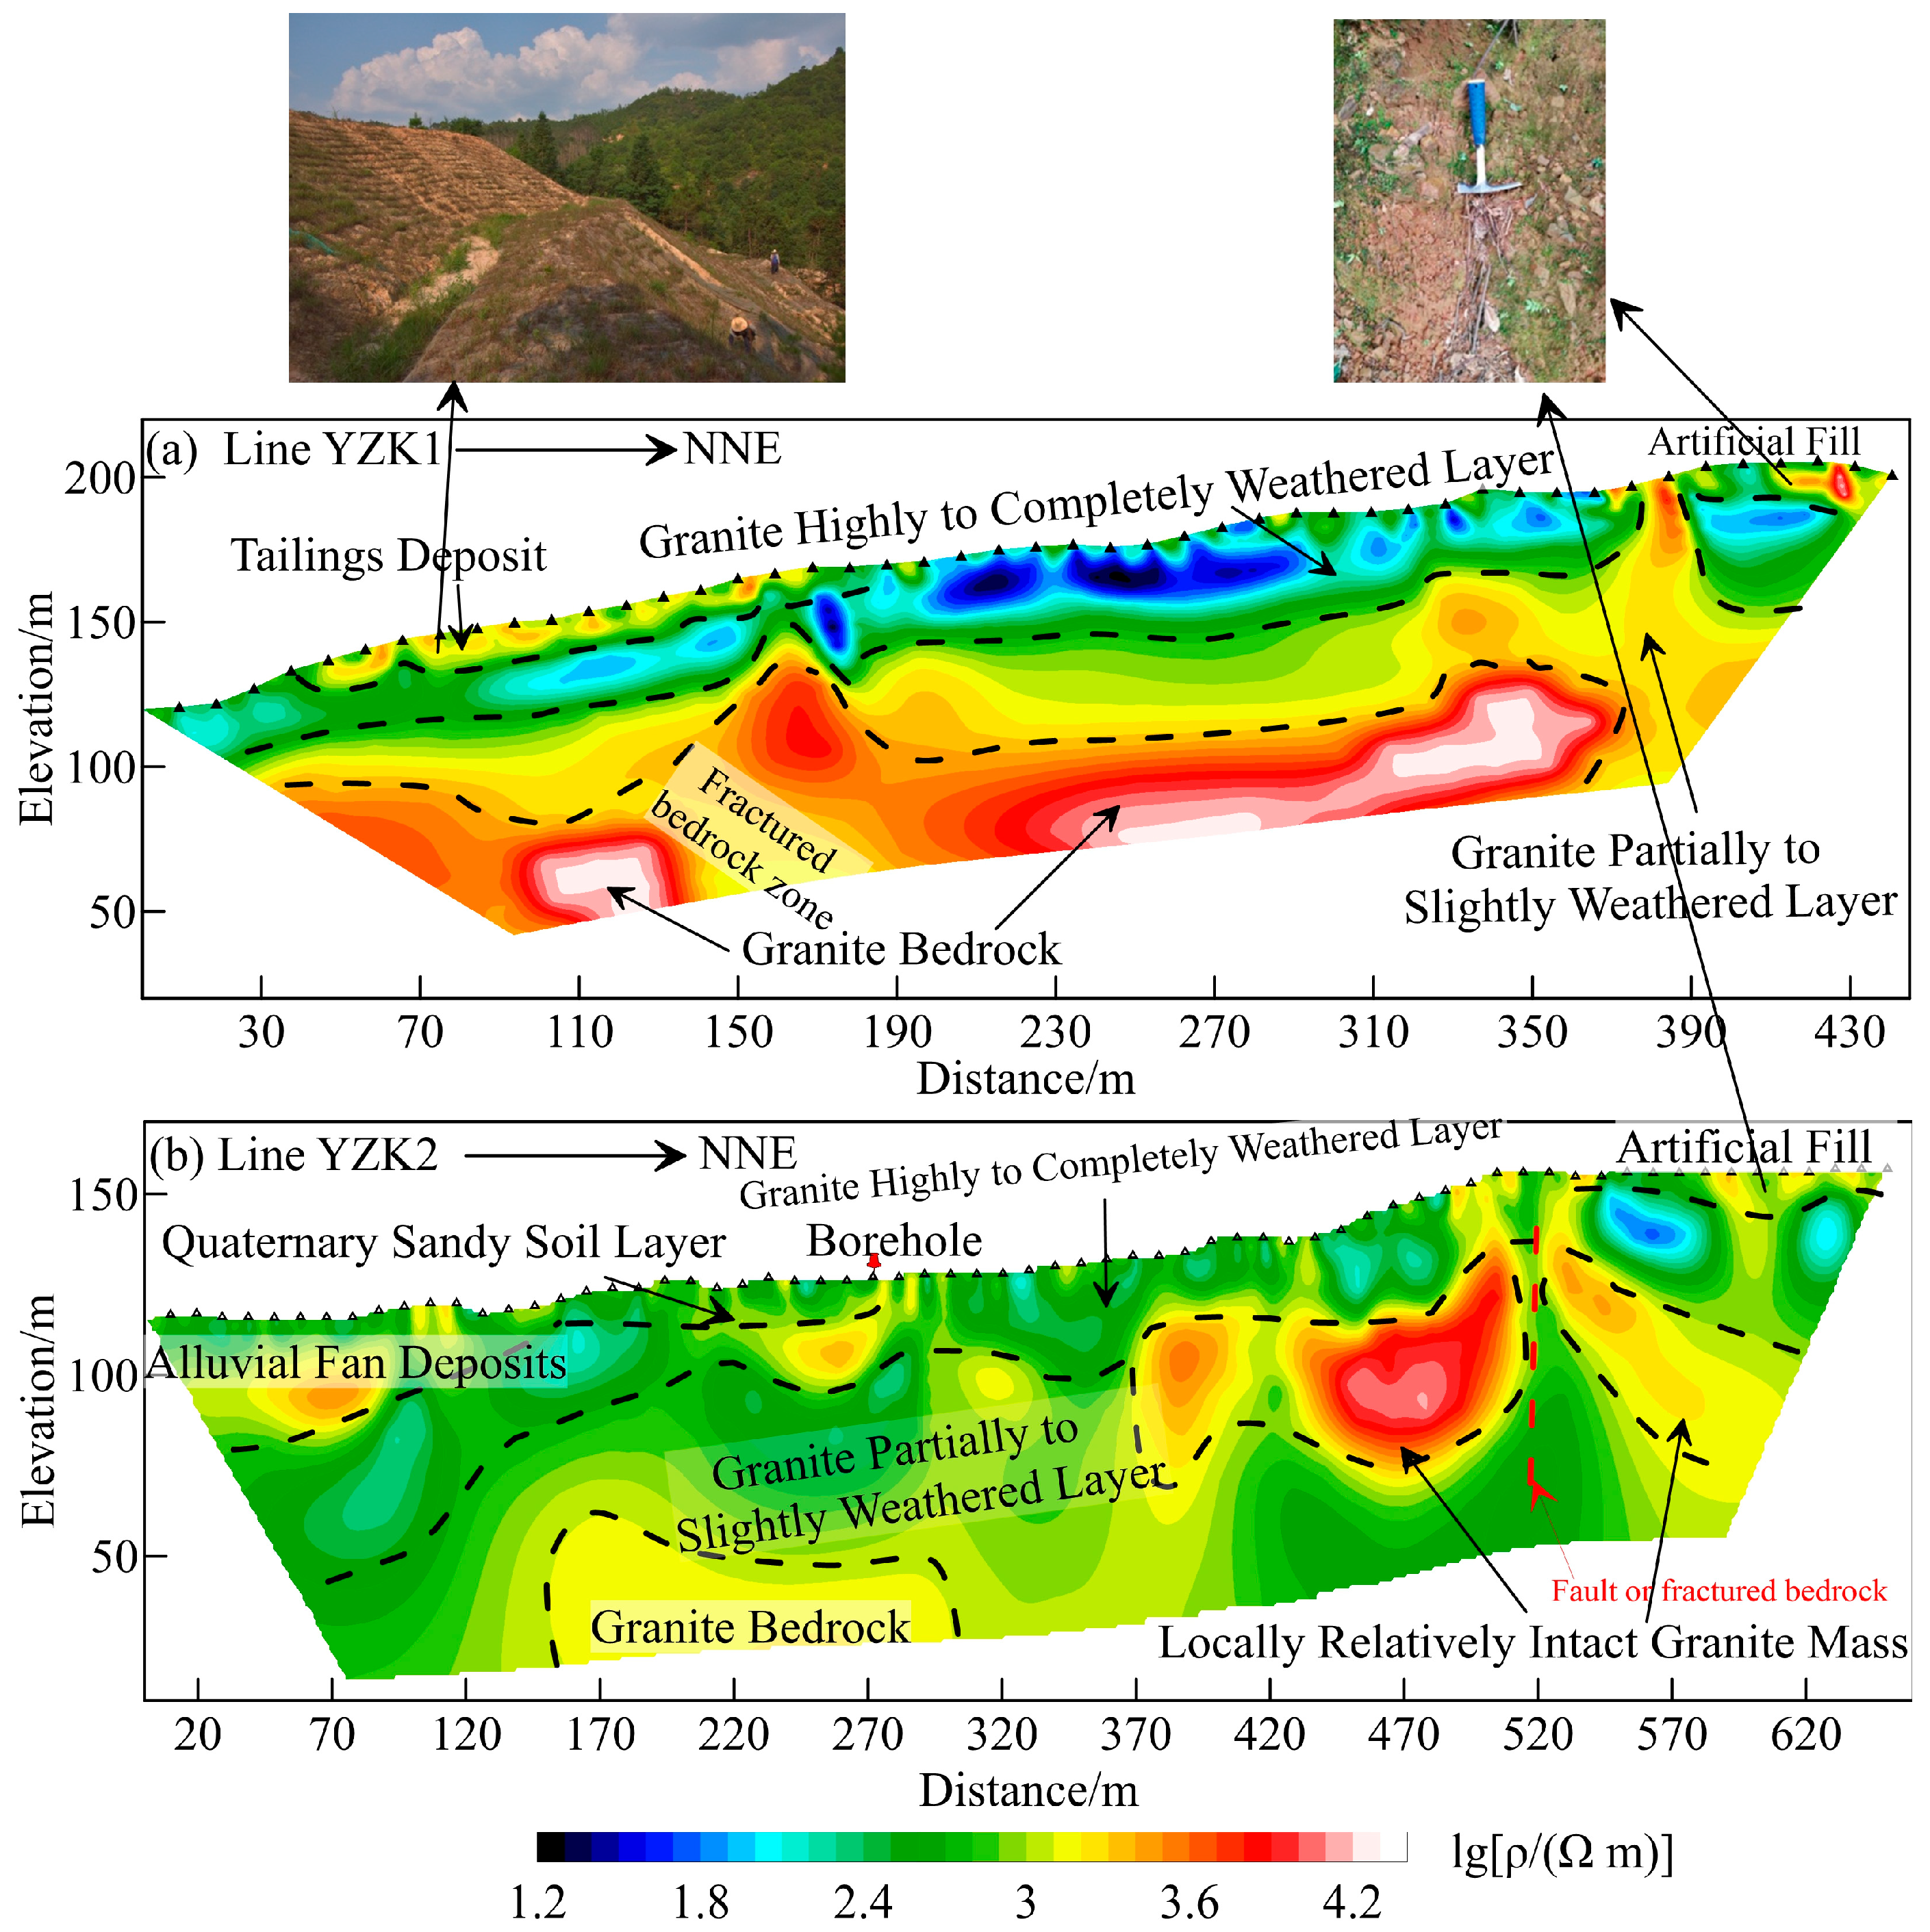
Based on the ERT inversion profiles from survey lines YZK1 and YZK2, and referenced by the resistivity signatures of typical weathered strata (Table 1), a detailed geological interpretation of the subsurface structures was conducted (Figure 6). This interpretation synthesizes regional geomorphic features with the geological structural characteristics observed during the field investigation. In presenting the ERT inversion results, a logarithmic (log10) color scale was employed for the resistivity distribution. This choice is necessitated by the inherently wide dynamic range of subsurface resistivity values, which typically span three to four orders of magnitude (from tens to thousands of Ohm-meters). A linear scale would compress the low-resistivity variations (e.g., saturated clays) into an indistinguishable dark band, while overemphasizing minor differences in the high-resistivity bedrock. The logarithmic scale ensures that both low-resistivity anomalies (indicating saturated zones) and high-resistivity anomalies (indicating bedrock) are visualized with equal clarity, facilitating a more balanced geological interpretation.

5.1.1. Resistivity Profile of the YZK1 Survey Line

The electrical response along the YZK1 profile (from the valley bottom to the hillslope) exhibits significant lateral heterogeneity (Figure 6a), which correlates well with the vertical zoning of weathering intensity and the integrity of the bedrock.
(1)
Tailings Accumulation
A high-resistivity anomaly (800–1500 Ω·m) is observed at depths of 0–10 m between stations 50 and 190 m (Figure 6a). This is confirmed by field photographs (Figure 6a—insert) showing tailings deposits. The accumulation is approximately 10 m thick and is characterized by well-developed intergranular pores but low saturation, resulting in weak conductivity and a sharp electrical contrast with the surrounding low-resistivity weathered layers.
(2)
Completely to Highly Weathered Layer
Within the 0–370 m segment and at depths of 0–20 m, resistivity ranges from 10 to 200 Ω·m, manifesting as low-to-moderate resistivity characteristics corresponding to the completely to highly weathered granite (Table 1). The layer thickness is approximately 20 m, except at station 160 m where tectonic activity or erosion has thinned it to approximately 10 m. The low resistivity is attributed to intense mineral alteration, clay mineral enrichment, developed weathering fissures, and the presence of shallow pore-fissure water.
(3)
Colluvial/Eluvial Deposits
A high-resistivity anomaly (>2000 Ω·m) thickening towards the NNE is identified at depths of 0–15 m between stations 390 and 440 m. Surface investigations identify this as coarse-grained colluvial deposits dominated by cobbles and boulders (Figure 6). The coarse-grained nature (sandy, gravelly) and low saturation of these loose deposits create a distinct high-resistivity signature, forming a clear electrical interface with the underlying weathered layer.
(4)
Slightly to Moderately Weathered Layer
At depths greater than 20 m across most of the profile, resistivity increases sharply from 10–200 Ω·m to 1000–5000 Ω·m. Compared to the resistivity properties (Table 1), this transition corresponds to the slightly to moderately weathered granite. The increase in rock compactness, decrease in weathering fissures, reduction in clay alteration, and significantly lower fissure water content collectively contribute to this high-resistivity signature.
(5)
Granite Bedrock
Below 50 m resistivity exceeds 8000 Ω·m, in comparison with the resistivity petrophysics Table 1, indicating an extremely high-resistivity zone. However, the localized low-resistivity zone within the 145–186 m segment is interpreted as a fractured bedrock zone, potentially due to tectonic crushing that increased fracture density and water saturation.

5.1.2. Resistivity Profile of the YZK2 Survey Line

The coupling relationship between the electrical response and the geological structure along the YZK2 profile is delineated in Figure 6b.
(1)
Alluvial Fan Deposits
At depths of 10–20 m between stations 0 and 150 m, resistivity ranges from 1000 to 2000 Ω·m, manifesting as a relatively high-resistivity anomaly. Surface imagery (Figure 1c) confirms this is an alluvial fan deposit at the river mouth. Shallower than 10 m, the resistivity drops below 500 Ω·m, likely attributable to the presence of shallow groundwater.
(2)
Artificial Fill
A discontinuous high-resistivity anomaly (>1000 Ω·m) is present at depths of 0–10 m between stations 550 and 650 m. Surface surveys suggest this consists of loose accumulations, such as tailings and slope colluvium (Figure 6).
(3)
Quaternary Sediments
A low-resistivity zone (100–800 Ω·m) is detected at shallow depths (0–5 m) between stations 160 and 260 m. Integrated with field observations and surface imagery (Figure 1c), this is interpreted as Quaternary sandy soil with high moisture content.
(4)
Weathered Layer Distribution
The resistivity ranges from 100 to 700 Ω·m between stations 70 and 220 m, with the thickness decreasing from 50 m to 20 m. Compared to the resistivity properties (Table 1), between stations 320–490 m and 540–620 m, the thickness is approximately 20 m, reflecting localized structural uplift and depression. This interval is inferred to correspond to the completely to highly weathered granite.
(5)
Slightly to Moderately Weathered Layer
Compared to the resistivity properties (Table 1), at depths of 20–50 m, resistivity increases to approximately 1000 Ω·m, marking the transition to less weathered rock.
(6)
Localized Intact Granite Bodies
Two discontinuous high-resistivity bodies are observed between stations 320–520 m at depths of 20–55 m. Additionally, a high-resistivity body dipping westwards is noted between stations 520–620 m (20–60 m depth). These are interpreted as reflections of locally intact granite bedrock, potentially segmented by the fractured bedrock zone or fault structure near station 520 m.
(7)
Granite Bedrock
In the 150–310 m segment, a relatively high-resistivity zone (>1500 Ω·m) at depths greater than 60 m is interpreted as fresh granite bedrock.

5.2. Quantitative Interpretation of Porosity and Permeability from ERT Data

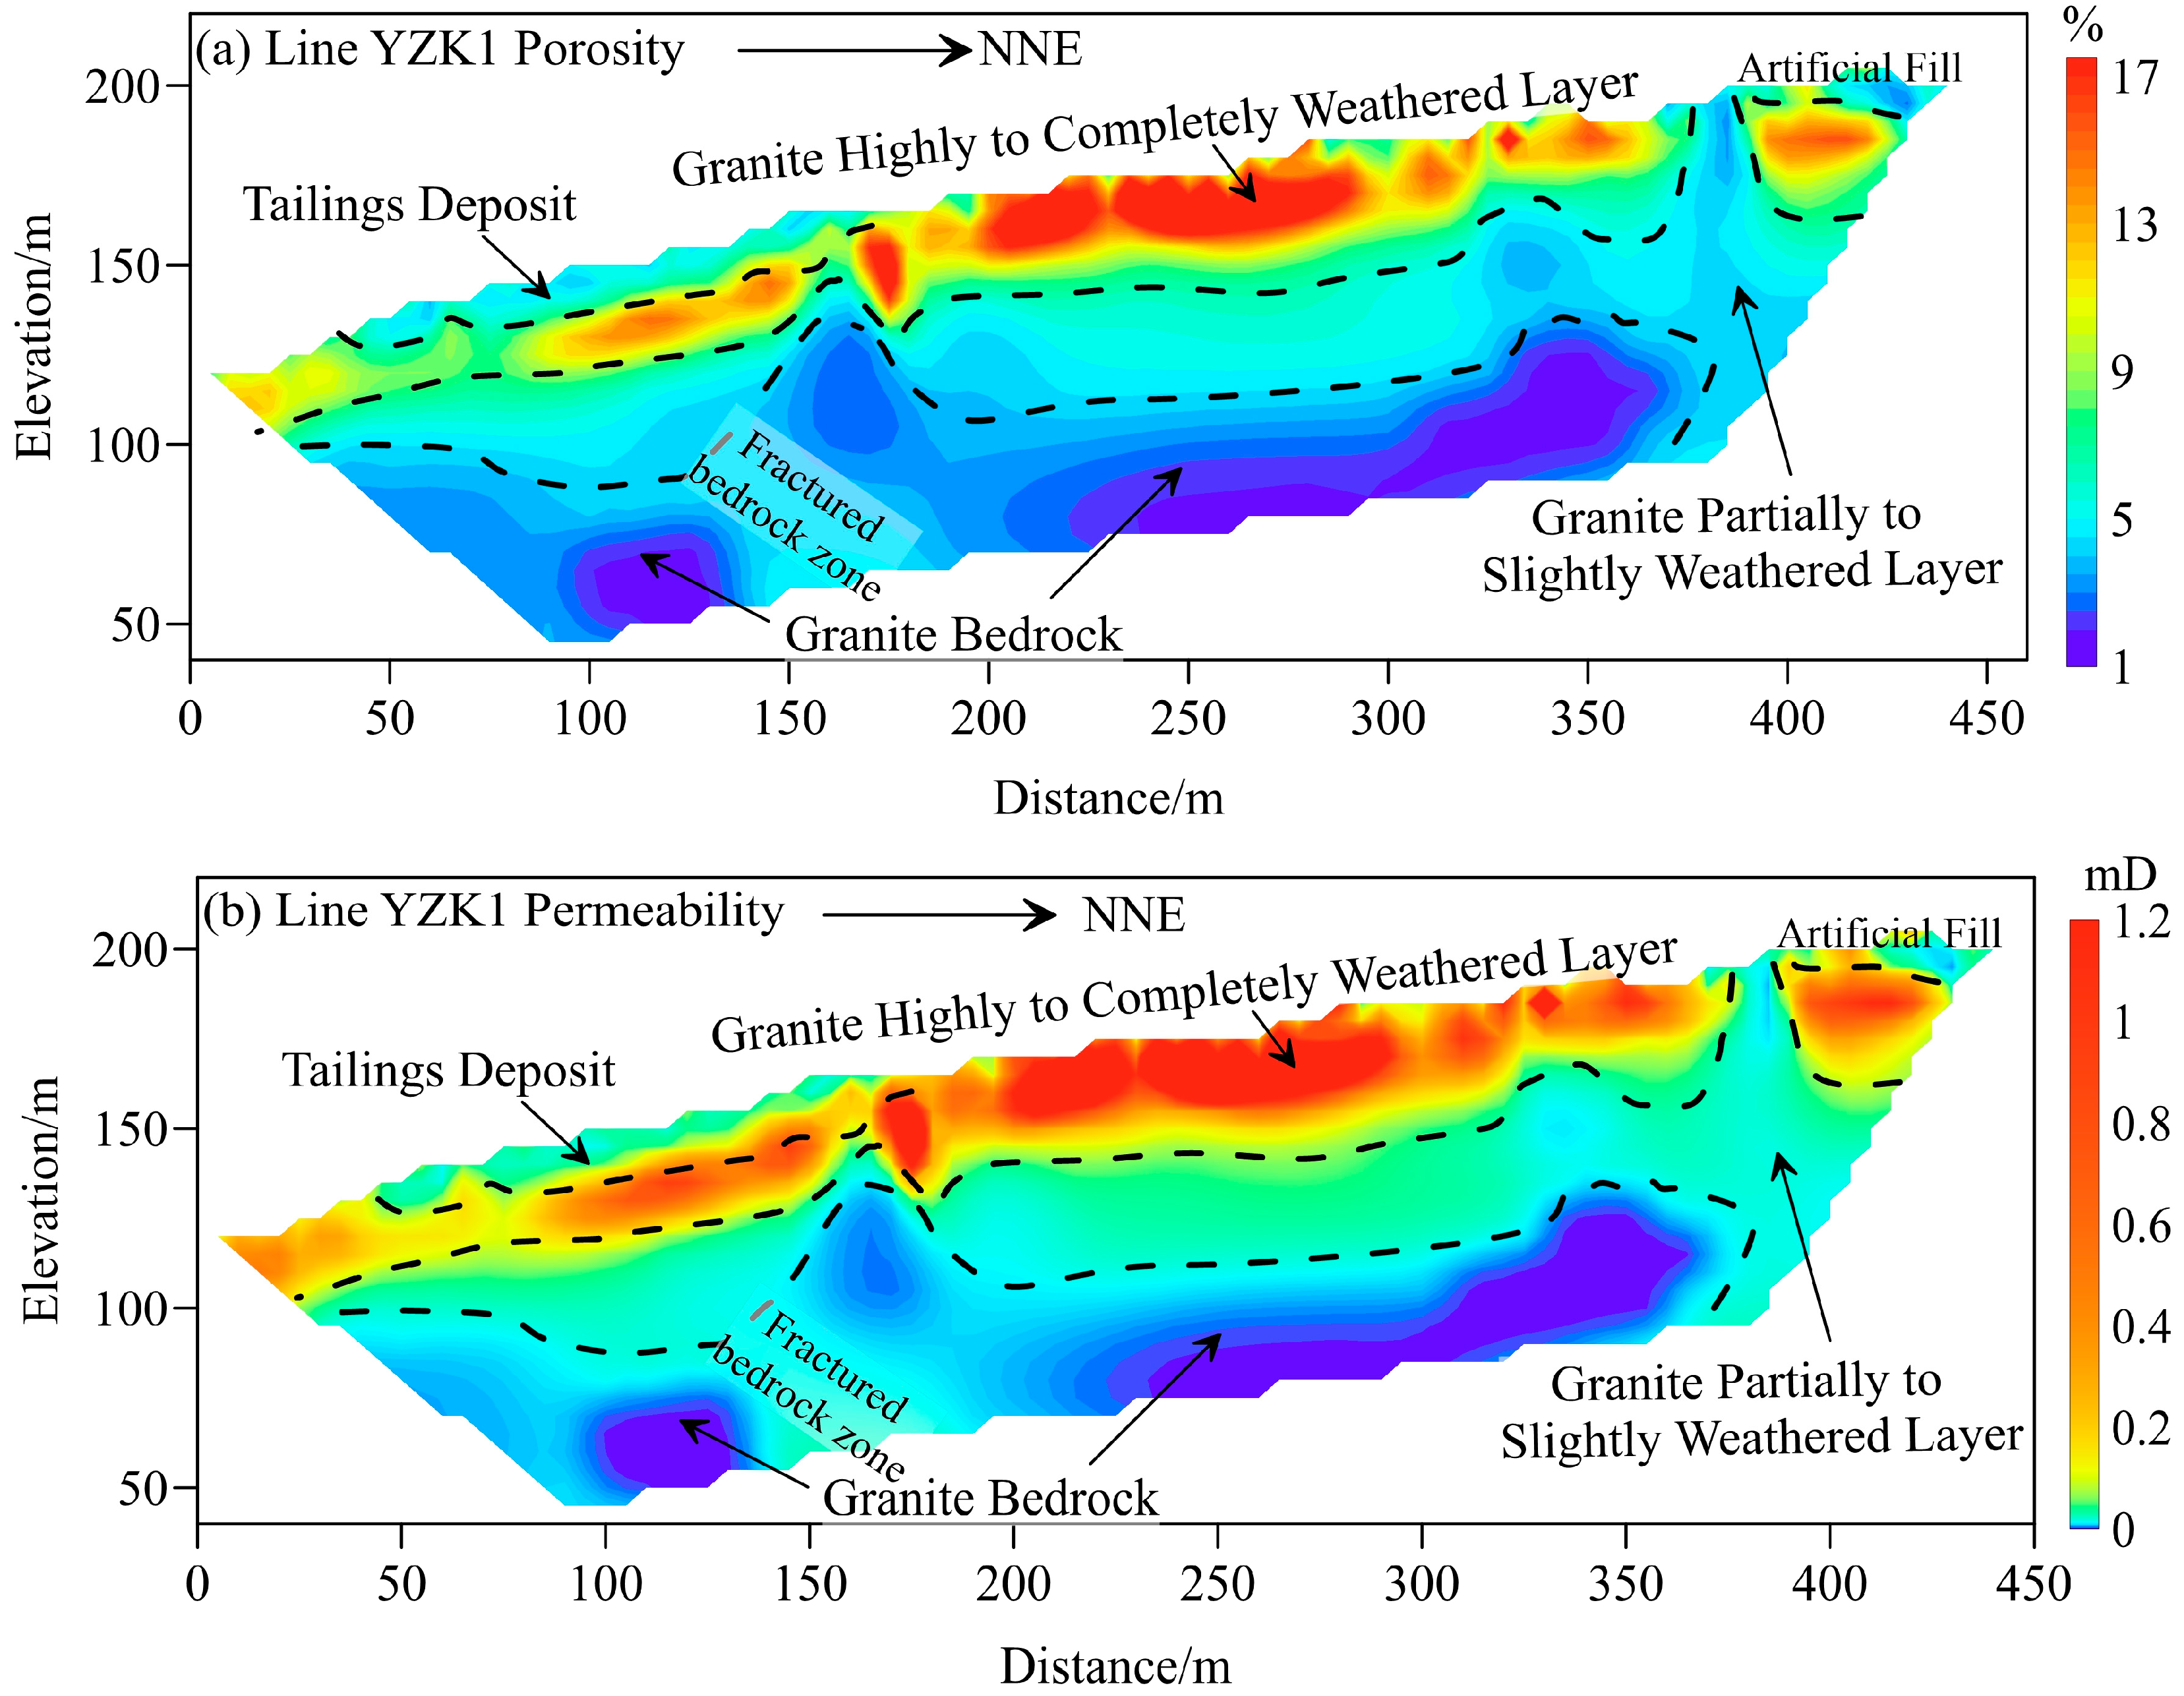
The quantitative transformation from resistivity to hydrogeophysical parameters via Archie’s Law and the Kozeny–Carman equation [47,48,49] has been widely validated in saturated porous media, including granular coastal aquifers and heterogeneous regolith systems (e.g., Ram et al., 2019 [11]). While these frameworks originate from sedimentary petrophysics, research by Moldoveanu and Papangelakis (2012, 2013, 2016) [19,52,53] on clay–fluid interactions in hydrometallurgical systems underscores their utility in interpreting fine-grained, weathering-derived media similar to IAD host layers. Building on this international body of work, and utilizing petrophysical parameters representative of the weathered layer (Table 4), the ERT inversion results (Figure 6) were transformed to derive the 2D distributions of porosity and permeability (Figure 7 and Figure 8) for survey lines YZK1 and YZK2. As illustrated in Figure 7 and Figure 8, the porosity and permeability profiles exhibit a high degree of consistency with the ERT inversion sections regarding their vertical zonation.

5.2.1. Porosity and Permeability of the YZK1 Survey Line

Based on the electrical resistivity characteristics (Figure 6a), the YZK1 profile can be subdivided vertically into five distinct hydrogeological units: surface tailings accumulation, colluvial–eluvial loose deposits, the completely to highly weathered granite layer, the slightly to moderately weathered granite layer, and fresh bedrock (Figure 7).
(1)
Surface Tailings Accumulation
This unit exhibits porosity values of 4.5%–5.6% and permeability of 0.02–0.03 mD (Figure 7). The low permeability is attributed to the tight packing of fine-grained tailings and the dominance of primary intergranular pores with minimal fracture development, classifying it as a tight and low-permeability unit.
(2)
Colluvial–Eluvial Loose Deposits
This layer displays moderate porosity (3.4%–7.0%) and low permeability (0.012–0.04 mD). It acts as a transitional zone where poor particle sorting limits pore connectivity despite moderate porosity values.
(3)
Completely to Highly Weathered Granite
This is the most hydrogeologically active unit, showing porosity ranging from 8.7% to 17% and permeability from 0.04 to 1.2 mD. The peak permeability (~1.2 mD) in the central segment (150–250 m) coincides with the zone of intense chemical weathering. Here, the transformation of feldspar to clay minerals creates abundant micro-fractures and secondary pores, significantly enhancing pore connectivity. This results in the coexistence of high conductivity (low resistivity) and high permeability, forming the primary reservoir for rare earth leaching [54,55,56].
(4)
Slightly to Moderately Weathered Granite
Porosity ranges from 4.0% to 6.0%, with permeability between 0.02 and 0.04 mD. Compared to the overlying completely weathered layer, the reduction in fracture development and the closure of primary fractures lead to a significant decline in hydraulic conductivity [57].
(5)
Granite Bedrock
Porosity rapidly dropping to low values (<3.5%) and permeability falling below 0.0036 mD. With increasing depth, rock densification and the disappearance of weathering fractures result in extremely weak conductivity and minimal pore water content, acting as an impermeable barrier [58]. In contrast, the YZK1 fractured bedrock zone (or fault-affected zone) displays a distinct petrophysical disturbance. Increased fracture density leads to synchronous increases in porosity (to 4.2%) and permeability (to 0.016 mD) compared to the adjacent intact granite. Consequently, this zone represents a potential leakage pathway for subsequent in situ leaching operations.

5.2.2. Porosity and Permeability of the YZK2 Survey Line

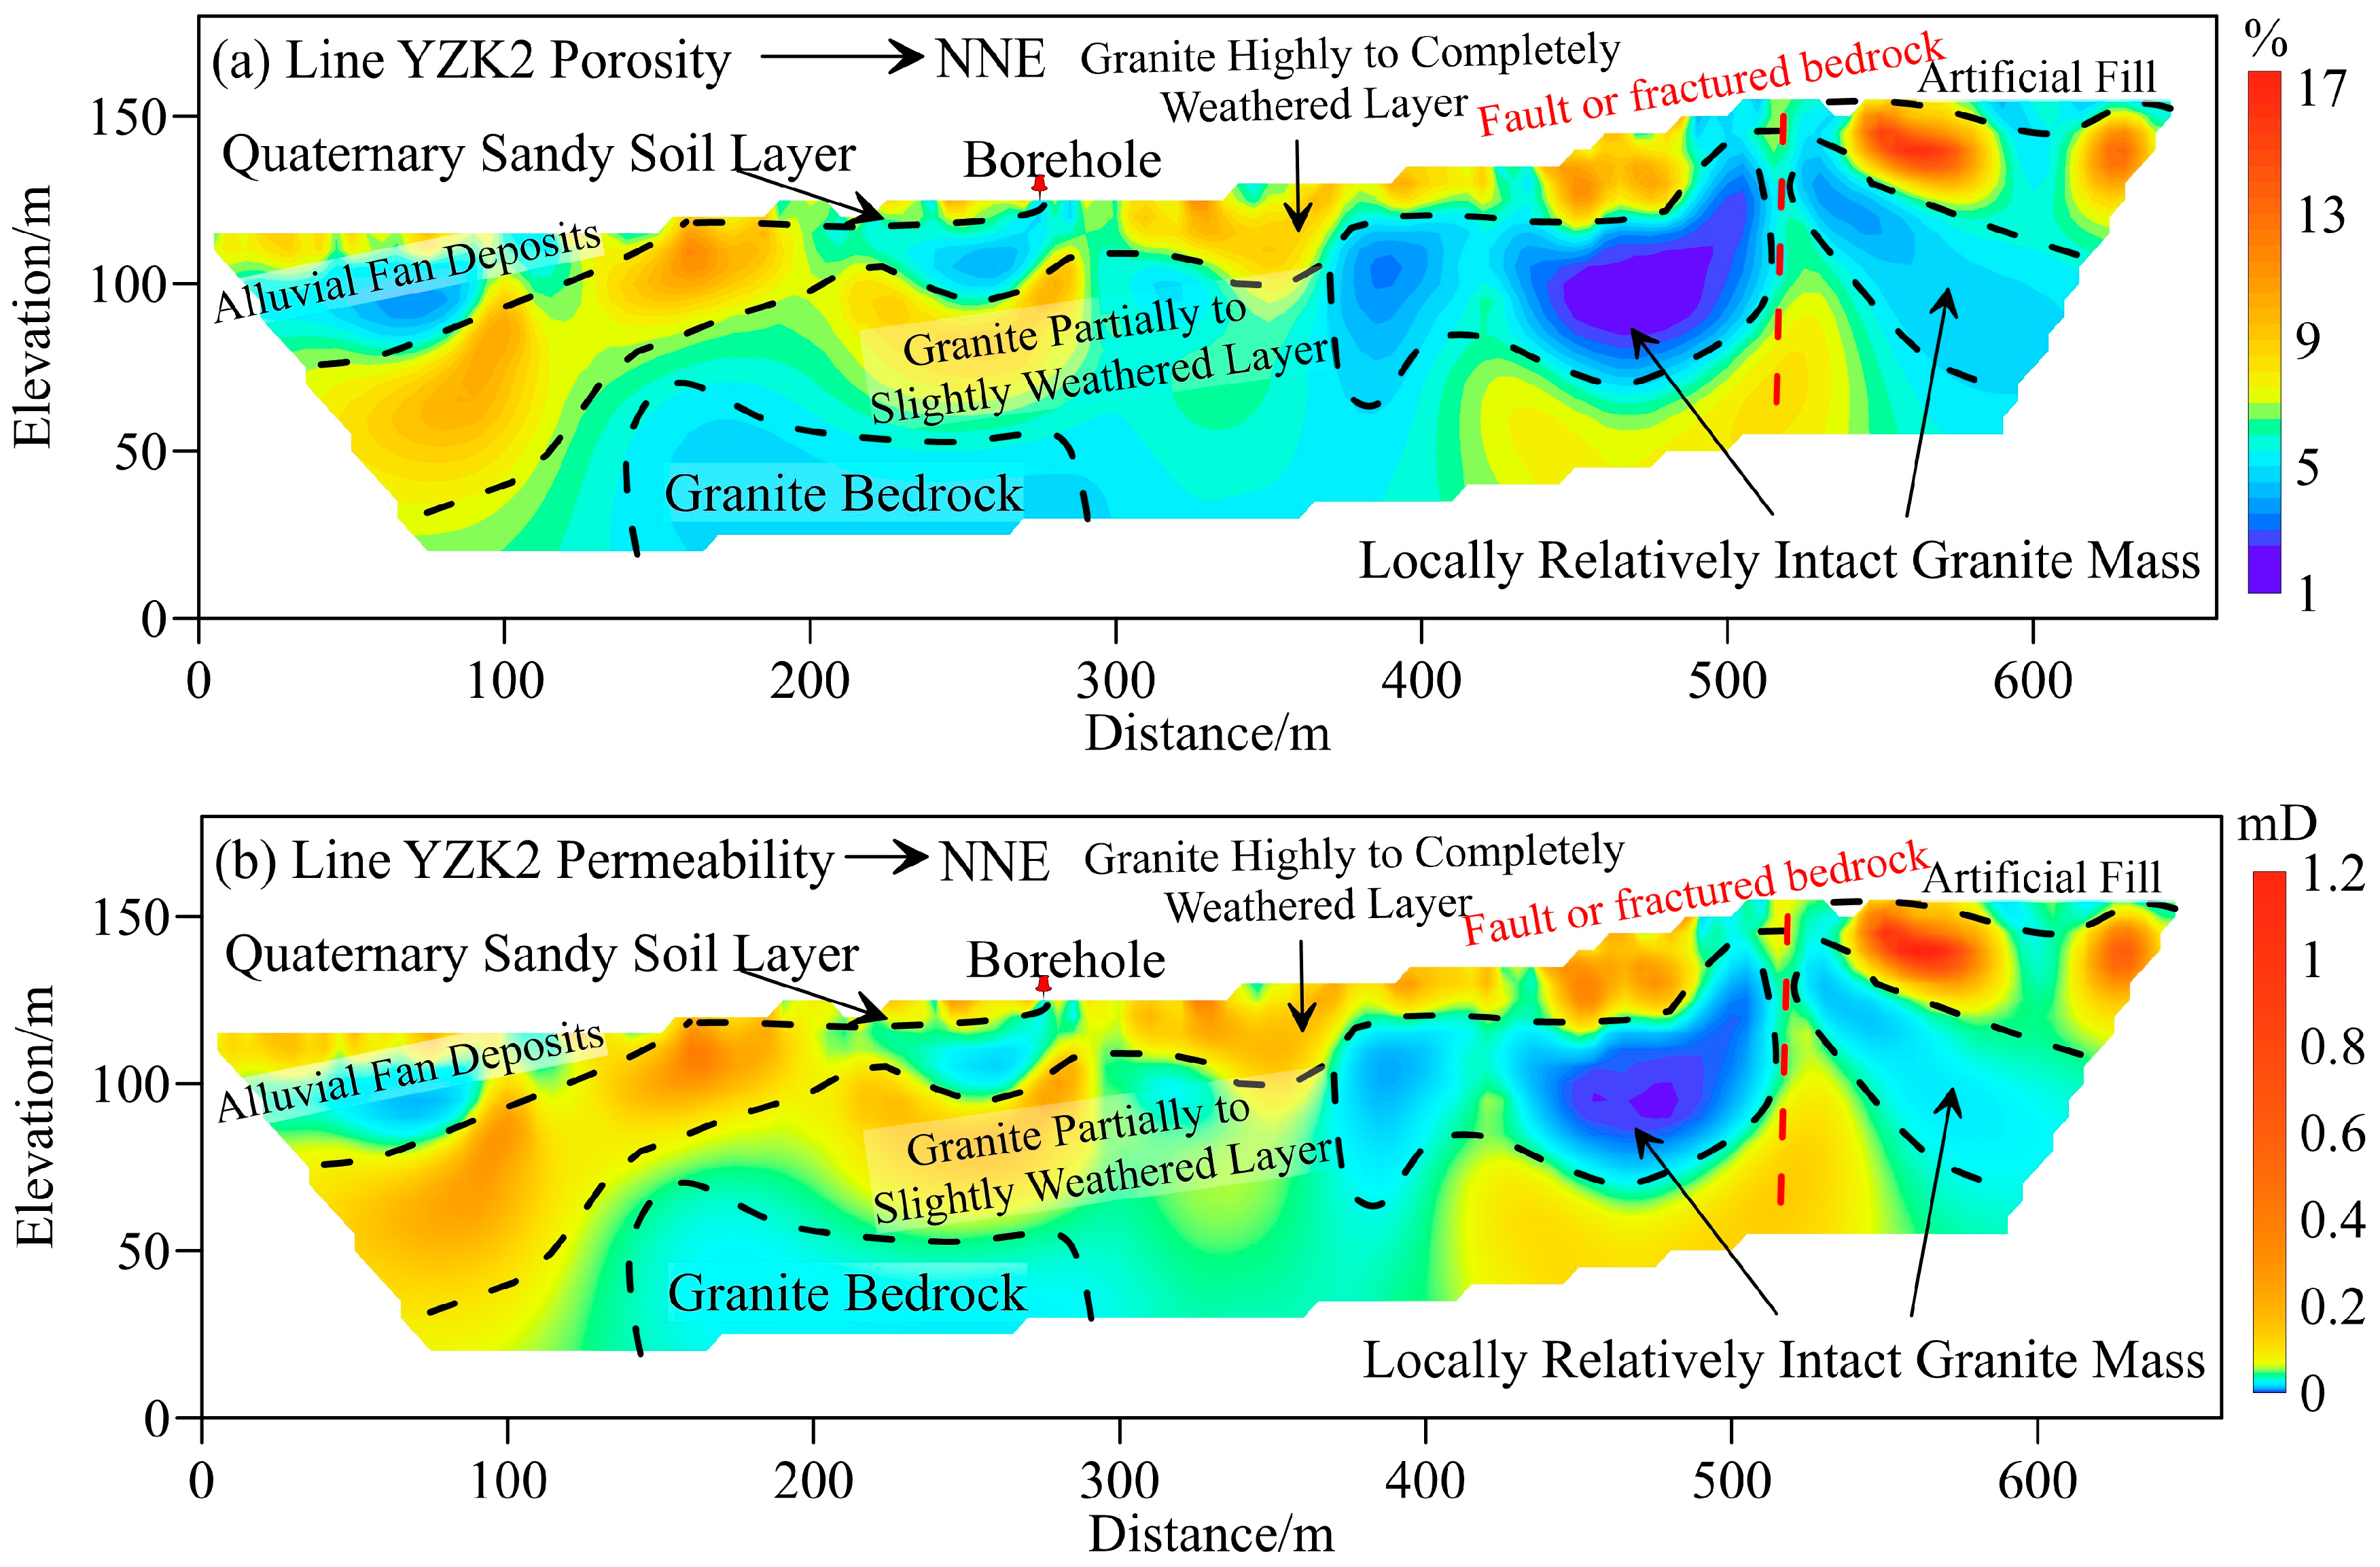
Based on the electrical resistivity characteristics (Figure 6b), the YZK2 profile can be subdivided vertically into six distinct geological units: the alluvial fan deposits, Quaternary overburden, colluvial–eluvial loose deposits, the completely to highly weathered granite layer, the slightly to moderately weathered granite layer, and the bedrock (Figure 8).
(1)
Alluvial Fan Deposits
Quantitatively, this unit exhibits moderate porosity (4.1%–7.5%) and permeability (0.011–0.06 mD). The moderate permeability is attributed to relatively coarse but poorly sorted grains, which provide moderate pore connectivity. Its seepage capacity is superior to that of the tailings accumulation but inferior to that of the highly weathered layer.
(2)
Quaternary Overburden
This layer is characterized by moderately low porosity (approx. 5.4%) and low permeability (0.03–0.04 mD). The fine-grained texture and restricted pore structure result in “low-resistivity, moderate-porosity, low-permeability” behavior. The seepage capacity is primarily constrained by the limited pore architecture [59].
(3)
Completely to Highly Weathered Granite
This is the most hydrogeologically active unit, exhibiting peak values for both porosity (4.75%–12%) and permeability (0.02–0.36 mD). Intense weathering generates abundant micro-fractures and secondary pores, significantly enhancing pore connectivity. While clay surfaces adsorb water (high conductivity), the well-connected pore spaces facilitate fluid flow, forming the primary reservoir for leaching.
(4)
Fractured bedrock zone or Fault
Stations 320–620 m, Elevation 50–90 m zone corresponds to multiple discontinuous high-resistivity bodies at depths of 20–60 m in Figure 6b. It likely represents locally intact granite blocks dissected by faults or a fractured bedrock zone. The primary mineral composition of granite (feldspar, quartz, etc.) exhibits inherently poor conductivity. When not sufficiently weathered or filled with highly conductive media (such as water or clay), granite manifests as high resistivity [60]. Although faulting disrupts the continuity of the rock mass, the displaced blocks remain relatively intact, dry, or with low clay content, maintaining a high overall resistivity. On the porosity and permeability profiles (Figure 8), this zone exhibits a distinct pattern: relatively higher porosity (5%–7%) and permeability (0.02–0.05 mD) in the upper and lower parts, contrasting with relatively lower values in the center (porosity 4.6%; permeability ~0.02 mD). This suggests that the upper and lower sections retain some developed fractures or a locally looser, fractured structure, providing moderate-to-low permeability. The very low permeability in the central portion is likely due to the infilling of fractures and pores by fault gouge, clay, or secondary precipitates, which severely degrades pore connectivity and impedes fluid flow [61].
(5)
Slightly to Moderately Weathered Granite
Porosity rapidly drops to low values (approx. 5.1%–6.0%), and permeability decreases significantly (0.03–0.05 mD). The reduction in fracture development and rock compaction leads to a decline in hydraulic conductivity.
(6)
Granite Bedrock
Porosity quickly declines to very low values (approx. 2.2%–4.8%), and permeability is drastically reduced (<0.02 mD). The rock matrix exhibits extremely low porosity and permeability, acting as an impermeable barrier that confines the leachable orebody [62].

5.3. Coupling Characteristics of Resistivity, Porosity, and Permeability in the Weathered Layer and Their Geological Implications

The vertical zonation of the weathered layer constitutes a heterogeneous system where resistivity, porosity, and permeability are mutually constrained. Based on the integrated interpretation of ERT inversions and derived petrophysical parameters from both YZK1 and YZK2 survey lines, a generalized coupled structural model is established (Table 4).
(1)
“Low Resistivity–High Porosity–High Permeability” Mode in the Completely to Highly Weathered Layer
The completely to highly weathered layer represents the most favorable hydrogeological unit within the weathering crust and contributes most significantly to rare earth leaching [36]. This layer represents the most favorable hydrogeological unit for rare earth leaching. This mode is consistently observed across both YZK1 and YZK2 profiles. On YZK1, it corresponds to the low-resistivity anomaly (10–700 Ω·m) in the central segment (Sta. 0–370 m). On YZK2, it corresponds to the low-resistivity zone (100–700 Ω·m) at Sta. 70–220 m. Through Archie’s Law, these low resistivity values translate to high porosity (8.7%–17%). The Kozeny–Carman equation further transforms this into high permeability (0.04–1.2 mD). Crucially, the ERT datasets visually confirm this: the continuous low-resistivity zone acts as a primary reservoir, providing efficient hydraulic pathways for leaching fluid migration.
(2)
“High Resistivity–Low Porosity–Low Permeability” Transitional Mode in Shallow Accumulations and Slightly to Moderately Weathered Layers
Shallow accumulations (tailings, colluvium) exhibit high resistivity (>800 Ω·m) due to coarse grains and low saturation. This characteristic is evident on both YZK1 (Sta. 50–190 m) and YZK2 (Sta. 550–650 m). However, the pores are mostly isolated intergranular pores, resulting in low porosity (3.6%–6.4%) and permeability (0.01–0.04 mD). With increasing depth, the slightly to moderately weathered layer shows high resistivity (1000–2000 Ω·m) on both YZK1 (>20 m depth) and YZK2 (20–50 m depth). This indicates rock densification and fracture closure. The ERT profiles confirm this sealing tendency: the high-resistivity bodies form a distinct electrical interface that restricts vertical fluid migration, acting as a relatively impermeable “basal plate” for the overlying highly weathered layer. Consequently, the implementation of the ISL technology necessitates artificial borehole drilling for solution infusion.
(3)
“High Resistivity–Low Porosity–Extremely Low Permeability” Sealing Mode of the Bedrock
The fresh granite bedrock is characterized by excellent integrity and an absence of free water. This sealing mode is definitively confirmed by ERT data from both lines. On YZK1, it manifests as an extremely high-resistivity zone (>8000 Ω·m) below 50 m. On YZK2, it appears as a high-resistivity zone (>1500 Ω·m) below 60 m (Sta. 150–310 m). Porosity drops to <4.0%, and permeability approaches zero (<0.02 mD). The ERT datasets provide direct visual confirmation: the high-resistivity bedrock truncates the underlying conductive pathways (Figure 6), physically confining the leachable orebody and preventing deep fluid loss.
(4)
Disturbance of the “Resistivity–Porosity–Permeability” Coupling by Fractured bedrock zone
The fractured bedrock zone (or fault-affected zone) illustrates the complex modification of petrophysical coupling by tectonic activity. This phenomenon, observed on both YZK1 and YZK2 profiles, highlights a critical limitation of relying solely on resistivity data.
On the YZK1 profile, the fresh granite bedrock functions as an impermeable barrier. In contrast, the fractured bedrock zone exhibits synchronous increases in porosity (to 4.2%) and permeability (to 0.016 mD) compared to the adjacent intact granite, rendering it a potential leakage pathway for subsequent in situ leaching operations. On the YZK2 profile, the fresh bedrock also serves as a barrier. However, the fractured bedrock zone displays significant segmentation in its porosity and permeability distribution. The upper and lower margins retain developed fractures, exhibiting higher porosity (5%–7%) and permeability (0.02–0.05 mD), which may act as moderate-to-low permeability pathways. Conversely, the central compressional core is likely infilled with fault gouge or clay, resulting in lower porosity and permeability values. This forms a “high-resistivity, low-permeability” sealing zone that impedes fluid flow.
In summary, while intact bedrock acts as a barrier, the fractured bedrock zone exhibits synchronous increases in porosity and permeability, functioning as a potential leakage pathway. Crucially, resistivity data alone are insufficient to accurately assess the hydraulic conductivity of the fault zone. Joint inversion incorporating both permeability and porosity is necessary to definitively determine whether the fractured bedrock zone acts as a “conduit” or a “barrier.

6. Conclusions

This study discusses the resistivity–porosity–permeability coupling within IAD weathered layers within the broader international context of ion-adsorption rare earth deposit research. While southern China hosts the first-discovered and most economically significant IADs, recent advances have documented comparable deposits worldwide, including in Madagascar, Indonesia, Japan, Australia, and South America [6,7,8]. These global cases reveal common geophysical challenges: characterizing heterogeneous weathering profiles, quantifying hydrogeological properties non-invasively, and predicting leachate migration in fractured bedrock settings. Taking the Dabu mining area in Gannan, Jiangxi Province as a case study, this research integrated field ERT inversion with Archie’s Law and the Kozeny–Carman equation to quantitatively characterize the petrophysical properties of the granite weathered crust. By moving beyond qualitative ERT interpretation to quantitative permeability assessment, this study establishes a direct link between geophysical imaging and hydrogeological engineering. The main conclusions are as follows:
(1)
ERT Enables Quantitative Characterization of Hydrogeological Heterogeneity
While traditional ERT interpretation identifies four vertical zones (Shallow Accumulations, Highly Weathered Layer, Moderately Weathered Layer, and Bedrock), this study demonstrates that ERT data, when coupled with petrophysical laws, can quantify their hydraulic significance. The inversion successfully captured the vertical transition from low-resistivity, water-rich weathered layers to high-resistivity, intact bedrock, providing the foundational dataset for subsequent parameter computation.
(2)
A “Low Resistivity–High Porosity–High Permeability” Mode Identifies the Leachable Reservoir
The most significant finding is the quantitative confirmation of the completely to highly weathered layer as the primary reservoir. Through the integrated explanation, this layer exhibits a distinct “low resistivity–high porosity–high permeability” coupling mode (porosity: 8.7%–17%; permeability: 0.04–1.2 mD). this study demonstrates that low resistivity is a direct geophysical proxy for high permeability, allowing for the delineation of leachable ore zones.
(3)
Fractured Bedrock Zones Exhibit Segmented Hydraulic Behavior
The research reveals that not all high-resistivity zones behave alike. The fresh bedrock exhibits an “extremely low permeability” mode (<0.02 mD), serving as an impermeable base that confines the orebody. Conversely, the fractured bedrock zone (or fault-affected zone) displays a complex segmentation. The ERT dataset visually confirms this: the central fault core acts as a hydraulic barrier (permeability ~0.02 mD) due to infilling by fault gouge, while the surrounding fractured blocks may act as moderate-flow pathways. This highlights that resistivity alone is insufficient to predict hydraulic conductivity; permeability computation is essential to distinguish between barriers and conduits.
(4)
The “Resistivity–Porosity–Permeability” Model Optimizes ISL Operations
By establishing a coupled structural model, this study provides a refined characterization method for IADs. The quantitative distribution of permeability derived from ERT data offers a critical tool for simulating leachate migration paths and optimizing injection-production well patterns.

Author Contributions

Conceptualization, S.L. and F.L.; formal analysis, S.L., F.L., S.Z. and G.F.; methodology, S.L., F.L. and Y.W.; visualization, S.L., F.L., S.Z., Y.W., D.Z., J.L., G.L., X.C. and G.F.; writing—original draft, S.L., F.L. and S.Z.; project administration, S.L., F.L. and J.L. All authors have read and agreed to the published version of the manuscript.

Funding

This research was funded by the Deep Earth Probe and Mineral Resources Exploration—National Science and Technology Major Project (2025ZD1007900), the Key Project of the Jiangxi Provincial Natural Science Foundation—Gannan Soviet Area Innovation and Development Joint Fund (20244BAB28052), Science and Technology Research Project of Jiangxi Provincial Department of Education (GJJ2405109, GJJ2505011), Jiangxi Province Vocational & Adult Education Teaching Reform Project (JXJG-25-52-15), the Key Laboratory of Ionic Rare Earth Resources and Environment, Ministry of Natural Resources of the People’s Republic of China (2023IRERE104), the Startup Project of Doctor Scientific Research of Jiangxi College of Applied Technology (JXYY-G2023005), the Resource Environment and Engineering Exploration Technology application Science and Technology innovation center of Jiangxi College of Applied Technology (010-2302700003).

Data Availability Statement

The raw ERT data and borehole data supporting the findings of this study are available from the corresponding author upon reasonable request.

Acknowledgments

The authors are grateful for the constructive comments by the anonymous reviewers.

Conflicts of Interest

Author Guocheng Liu was employed by the company Jiangxi Gannan Geological and Mineral Group Co., Ltd. Author Xiaofei Chen was employed by the company China Rare Earth Jiangxi Co. Ltd. Author Guangming Fu was employed by the company Jiangxi Earthquake Agency. The remaining authors declare that the research was conducted in the absence of any commercial or financial relationships that could be construed as a potential conflict of interest.

References

  1. He, H.P.; Yang, W.B. REE Mineral Resources in China: Review and perspective. Geotecton. Metallog. 2022, 46, 829–841, (In Chinese with English abstract). [Google Scholar]
  2. Williams-Jones, A.E.; Migdisov, A.A.; Samson, I.M. Hydrothermal Mobilization of the Rare Earth Elements—A Tale of “Ceria” and “Yttria”. Elements 2012, 8, 355–360. [Google Scholar] [CrossRef]
  3. Zhou, B.; Li, Z.; Chen, C. Global Potential of Rare Earth Resources and Rare Earth Demand from Clean Technologies. Minerals 2017, 7, 203. [Google Scholar] [CrossRef]
  4. Habib, K.; Wenzel, H. Exploring Rare Earths supply constraints for the emerging clean energy technologies and the role of recycling. J. Clean. Prod. 2014, 84, 348–359. [Google Scholar] [CrossRef]
  5. Sanematsu, K.; Watanabe, Y. Characteristics and genesis of ion adsorption-type rare earth element deposits. In Rare Earth and Critical Elements in Ore Deposits; Verplanck, P.L., Hitzman, M.W., Eds.; Society of Economic Geologists: Littleton, CO, USA, 2016; Volume 18, pp. 55–79. [Google Scholar]
  6. Borst, A.M.; Smith, M.P.; Finch, A.A.; Estrade, G.; Villanova-de-Benavent, C.; Nason, P.; Marquis, E.; Horsburgh, N.J.; Goodenough, K.M.; Xu, C.; et al. Adsorption of rare earth elements onto clays: A review. Nat. Commun. 2020, 11, 5549. [Google Scholar] [CrossRef]
  7. Estrade, G.; Marquis, E.; Boulvais, P.; Le Carlier de Veslud, C.; Tartèse, R.; Poujol, M.; Smith, M. Rare earth element mobility during deep weathering of granite in a tropical environment: The Ambohimirahavavy complex, Madagascar. Ore Geol. Rev. 2019, 107, 103027. [Google Scholar] [CrossRef]
  8. Yamaguchi, A.; Minami, M.; Hoshino, M.; Takahashi, Y. Geochemical characteristics of ion-adsorption type REE deposits in the Higashi-Akaishi granitic body, western Japan. Geochem. J. 2018, 52, 415–425. [Google Scholar] [CrossRef]
  9. Li, Y.H.M.; Zhao, W.W.; Zhou, M.F. Nature of parent rocks, mineralization styles and ore genesis of regolith-hosted REE deposits in South China: An integrated genetic model. J. Asian Earth Sci. 2017, 148, 65–95. [Google Scholar] [CrossRef]
  10. Wu, C.; Bai, G.; Huang, D.; Zhu, Z. Characteristics and significance of heavy rare earth element (HREE)-rich granitoids of the Nanling Mountain area. Bull. Chin. Acad. Geol. Sci. 1992, 25, 46–61, (In Chinese with English abstract). [Google Scholar]
  11. Ram, R.; Choubey, P.K.; Gupta, S.K.; Pandey, B.D. Characterization and leaching of ion-adsorption type rare earth deposits: A review. Chem. Geol. 2019, 511, 221–237. [Google Scholar]
  12. Wang, D.; Zhao, Z.; Yu, Y.; Wang, C.; Dai, J.; Sun, Y.; Zhao, T.; Li, J.; Huang, F.; Chen, Z.; et al. A Review of the Achievements in the Survey and Study of Ion-Absorption-Type REE Deposits in China. Acta Geosci. Sin. 2017, 38, 317–325, (In Chinese with English abstract). [Google Scholar]
  13. Luo, F.; Yan, J.Y.; Liang, J.; Zhang, S.; Wu, D.H.; Rao, G.W.; Hu, W.Q.; Fu, G.M. Application Status and Prospect of Geophysical Technology in the Rare-Earth Resources Field. J. Rare Earths 2024, 42, 1088–1101, (In Chinese with English abstract). [Google Scholar]
  14. Chen, C.; Bei, Y.; Li, Y.; Zhou, W. Effect of Interpolation Methods on Quantifying Terrain Surface Roughness under Different Data Densities. Geomorphology 2022, 417, 108448. [Google Scholar] [CrossRef]
  15. Oliver, M.A.; Webster, R. A tutorial guide to geostatistics: Computing and modelling variograms and kriging. Catena 2014, 113, 56–69. [Google Scholar] [CrossRef]
  16. Xie, W.Q.; Long, P.; Hu, S.L. Determination of the Bottom Plate of Ion-Adsorption Rare Earth Ore Body Based on Spatial Interpolation Algorithm. Nonferrous Met. Sci. Eng. 2023, 14, 700–705, (In Chinese with English abstract). [Google Scholar] [CrossRef]
  17. Loke, M.H.; Barker, R.D. Rapid least-squares inversion of apparent resistivity pseudosections by a quasi-Newton method. Geophys. Prospect. 1996, 44, 131–152. [Google Scholar] [CrossRef]
  18. Russo, C.J.; Fayek, M.; Migdisov, A.A.; Silva, A.G.; Janasi, V.A. Formation of ion-adsorption rare earth element deposits in a paleo-weathering profile, Brazil. J. Geochem. Explor. 2025, 268, 107621. [Google Scholar]
  19. Moldoveanu, G.A.; Papangelakis, V.G. Recovery of rare earth minerals from clay minerals: I. Leaching studies. Hydrometallurgy 2012, 117, 71–78. [Google Scholar] [CrossRef]
  20. Yang, X.J.; Lin, A.; Li, X.; Wu, Y.; Zhou, Q.; Chen, S.; Wang, H. China’s ion-adsorption rare earth resources, mining consequences and preservation. Environ. Dev. 2013, 8, 131–136. [Google Scholar] [CrossRef]
  21. Xiao, Y.; Guo, G.; Li, H.; Chi, R.; Xu, H.; Zhou, X. A discussion on the leaching process of the ion-adsorption type rare earth ore with the electrical double layer model. Miner. Eng. 2018, 120, 35–43. [Google Scholar] [CrossRef]
  22. Yin, S.; Chen, X.; Yan, R.; Wang, L. Pore Structure Characterization of Undisturbed Weathered Crust Elution-Deposited Rare Earth Ore Based on X-ray Micro-CT Scanning. Minerals 2021, 11, 236. [Google Scholar] [CrossRef]
  23. Wang, X.; Zhuo, Y.; Zhao, K.; Zhong, W. Experimental measurements of the permeability characteristics of rare earth ore under the hydro-chemical coupling effect. RSC Adv. 2018, 8, 11652–11660. [Google Scholar] [CrossRef] [PubMed]
  24. Stockdale, A.; Banwart, S.A. Impact of particle size on the leaching kinetics of ion-adsorption rare earth ores. Miner. Eng. 2021, 160, 106652. [Google Scholar]
  25. Zhong, J.; Ye, D.; Wu, Y.; Chen, B.; Deng, Y.; Qi, F. Comprehensive Application of High-Density Resistivity Method and Drilling Data in Ion-Adsorption Rare Earth Mines. Chin. Rare Earths 2023, 44, 82–91, (In Chinese with English abstract). [Google Scholar]
  26. Chen, S.; Shu, R.; Min, G.; Liu, K.; Yuan, H.; Cheng, R. High-Density Electrical Exploration Test of Hidden Fault Zone in Southern Rare Earth Mining Area. Multipurp. Util. Miner. Resour. 2022, 1, 79–85, (In Chinese with English abstract). [Google Scholar] [CrossRef]
  27. Min, G.; Shu, R.; Liu, K.; Cheng, R.; Chen, S.; Yuan, H. Exploration Test of 3D Deep Structure and Floor Fracture Zone in Ion-Type Rare Earth Ore District. Chin. J. Nonferrous Met. 2022, 32, 1833–1843, (In Chinese with English abstract). [Google Scholar] [CrossRef]
  28. Liu, Y.; Cheng, R.; Gong, D.; Dai, L.; Zhu, Z. Application of Integrated Geophysical Methods in In-Situ Leaching of Ion-Adsorption REE Deposits. Sediment. Geol. Tethyan Geol. 2025, 45, 776–787, (In Chinese with English abstract). [Google Scholar]
  29. Niu, Q.; Zhang, C. Physical Explanation of Archie’s Porosity Exponent in Granular Materials: A Process-Based, Pore-Scale Numerical Study. Geophys. Res. Lett. 2018, 45, 1870–1877. [Google Scholar] [CrossRef]
  30. Griffiths, D.H. Application of Electrical Resistivity Mseasurements for the Determination of Porosity and Permeability in Sandstones. Geoexploration 1976, 14, 207–213. [Google Scholar] [CrossRef]
  31. Civan, F. Porosity and Permeability Relationships of Geological Formations. In Reservoir Formation Damage, 2nd ed.; Chapter 5; Gulf Professional Publishing: Burlington, MA, USA, 2007; pp. 125–153. [Google Scholar]
  32. Tong, M.; Tao, H. Permeability estimating from complex resistivity measurement of shaly sand reservoir. Geophys. J. Int. 2008, 173, 733–739. [Google Scholar] [CrossRef][Green Version]
  33. Najib, A.; Bertin, H. Revolutionary approach for mapping hydraulic conductivity in coastal aquifers using 2D electrical resistivity tomography calibrated by borehole data. Near Surf. Geophys. 2011, 9, 345–357. [Google Scholar]
  34. Sudo, H.; Ehara, K.; Takakura, S.; Murakami, Y.; Ushijima, K. Permeability Imaging in Granitic Rocks Based on Surface Resistivity Profiling. Explor. Geophys. 2004, 35, 56–61. [Google Scholar] [CrossRef]
  35. Knorsch, L.; Küster, T.; Möller, P.; Schwinn, G.; Zimányi, L.; Gaupp, R. Geochemical and mineralogical controls on REE mobilization in tropical weathering profiles. Geosci. Front. 2025, 16, 101892. [Google Scholar] [CrossRef]
  36. Shu, L.; Yao, J.; Wang, B.; Faure, M.; Charvet, J.; Chen, Y. Neoproterozoic plate tectonic process and Phanerozoic geodynamic evolution of the South China Block. Earth-Sci. Rev. 2021, 216, 103596. [Google Scholar] [CrossRef]
  37. Luo, F.; Yan, J.; Zhang, S.; Liang, J.; Fu, G.; Wu, D.; Reng, G. Discussion of the W-Sn-REE Metallogenic Background in the Nanling Region of South China: Evidence from Satellite Gravity and Magnetic Data. Minerals 2024, 14, 215. [Google Scholar] [CrossRef]
  38. Xie, M.; Zhou, J.; Du, X.; Wang, X.; Zhang, B.; Wu, H.; Hu, Q.; Wang, W.; Tian, M.; Chen, B.; et al. The Characteristics and Enrichment Process of Dabu Ion-Adsorption Heavy Rare-Earth Element (HREE) Deposits in Jiangxi Province, South China. Minerals 2024, 14, 857. [Google Scholar] [CrossRef]
  39. Xiao, X.; Guo, M.; Tan, J.; Shao, X.; Wang, L.; Qiu, X. Comparison of Geochemical Characteristics and Occurrence Modes of Rare Earth Elements in Ion-Adsorption Rare Earth Ores from Weathering Crust Profiles of Different Granite Types in Southern China. Geochimicain 2026, in press (In Chinese with English abstract). [Google Scholar] [CrossRef]
  40. Huang, Y.; He, H.; Liang, X.; Bao, Z.; Tan, W.; Ma, L.; Zhu, J.; Huang, J.; Wang, H. Characteristics and Genesis of Ion-Adsorption-Type REE Deposits in the Weathering Crusts of Metamorphic Rocks in Ningdu, Ganzhou, China. Ore Geol. Rev. 2021, 135, 104173. [Google Scholar] [CrossRef]
  41. Guo, D.; Zhao, Z.; Hou, Z.; Tao, J.; Yin, J.; Duan, C. Spatio-temporal structure and prospecting of Dabu tungsten polymetallic ore field, Ganxian, Jiangxi Province. Miner. Depos. 2024, 43, 578–598, (In Chinese with English abstract). [Google Scholar]
  42. Li, J.F.; Fu, J.M.; Lu, Y.Y.; Cheng, S.B.; Ma, L.Y.; Chen, X.Q.; Quan, H.Y.; Ma, K.M. Early Yanshanian metallogenesis of the Banjing tungsten deposit in Ganxian, Jiangxi province, China: Constraints from geochemistry, Sr–Nd isotopes, zircon U–Pb, molybdenite Re–Os, and mica 40Ar–39Ar dating. Geol. J. 2023, 58, 1366–1383. [Google Scholar]
  43. Zhao, X.; Li, N.B.; Huizenga, J.M.; Zhang, Q.B.; Yang, Y.Y.; Yan, S.; Yang, W.B.; Niu, H.C. Granitic magma evolution to magmatic-hydrothermal processes vital to the generation of HREEs ion-adsorption deposits: Constraints from zircon texture, U–Pb geochronology, and geochemistry. Ore Geol. Rev. 2022, 146, 104931. [Google Scholar] [CrossRef]
  44. Zhang, Q. Investigation and Evaluation Report on the Rare Earth Resources in Ganxian District, Ganzhou City, Jiangxi Province; Jiangxi Provincial Geological and Mineral Exploration and Development Bureau, Gannan Geological Survey Brigade: Ganzhou, China, 2017; pp. 1–112. (In Chinese) [Google Scholar]
  45. Dahlin, T.; Zhou, B. Multiple-gradient array measurements for multichannel 2D resistivity imaging. Near Surf. Geophys. 2006, 4, 113–123. [Google Scholar]
  46. Pidlisecky, A.; Haber, E.; Knight, R. RESINVM3D: A 3D Resistivity Inversion Package. Geophysics 2007, 72, H1–H10. [Google Scholar] [CrossRef]
  47. Archie, G.E. The Electrical Resistivity Log as an Aid in Determining Some Reservoir Characteristics. Trans. AIME 1942, 146, 54–62. [Google Scholar] [CrossRef]
  48. Kozeny, J. Über Kapillare Leitung des Wassers im Boden (On Capillary Conduction of Water in Soil). Sitzungsber. Akad. Wiss. Wien Math.-Naturwiss. Kl. Abt. IIa 1927, 136, 271–306. [Google Scholar]
  49. Mavko, G.; Nur, A. The Effect of a Percolation Threshold in the Kozeny–Carman Relation. Geophysics 1997, 62, 1480–1482. [Google Scholar] [CrossRef]
  50. Mavko, G.; Mukerji, T.; Dvorkin, J. The Rock Physics Handbook: Tools for Seismic Analysis of Porous Media; Cambridge University Press: Cambridge, UK, 1997. [Google Scholar]
  51. Worthington, P.H. The Uses of the Archie Formation Factor in the Petrophysical Characterization of Reservoirs. Log Anal. 1993, 34, 22–38. [Google Scholar]
  52. Moldoveanu, G.A.; Papangelakis, V.G. Recovery of rare earth minerals from clay minerals: II. Precipitation stripping of rare earths from acid leach liquors. Hydrometallurgy 2013, 131–132, 158–166. [Google Scholar] [CrossRef]
  53. Moldoveanu, G.A.; Papangelakis, V.G. Mineralogical analysis of rare earth bearing clay minerals by SEM-EDS and EPMA. Mineral. Mag. 2016, 80, 329–343. [Google Scholar] [CrossRef]
  54. Liu, D.; Zhang, Z.; Chi, R. Seepage mechanism during in-situ leaching process of weathered crust elution-deposited rare earth ores with magnesium salt. Physicochem. Probl. Miner. Process. 2020, 56, 117925. [Google Scholar]
  55. Wang, X.; Wang, Y.; Hu, K. Wetting front migration model of ion-adsorption rare earth during the multi-hole unsaturated liquid injection. J. Rock Mech. Geotech. Eng. 2024, 16, 483–496. [Google Scholar] [CrossRef]
  56. Zhang, L.; Wen, B.; Chen, L.; Wang, L. Variations in Pore Structures and Permeabilities of Ion-Adsorption Rare Earth Ores in Zones with Different Weathering Degrees before and after Leaching. Hydrogeol. Eng. Geol. 2024, 51, 117–124, (In Chinese with English abstract). [Google Scholar]
  57. Costabel, S.; Weidner, C.; Müller-Petke, M.; Houben, G. Hydraulic characterisation of iron-oxide-coated sand and gravel based on nuclear magnetic resonance relaxation mode analyses. Hydrol. Earth Syst. Sci. 2018, 22, 1713–1729. [Google Scholar] [CrossRef]
  58. Xu, T.; Wang, X.; Zhang, Y.; Zhao, X.; Bao, Y. Clay Minerals in Petroliferous Basins of China; Science Press: Beijing, China, 2003. (In Chinese) [Google Scholar]
  59. Jiang, F.; Huang, Y.; Lin, J.; Chen, L.; Liao, H.; Wang, Z. Analysis of Soil Infiltration Characteristics of Benggang Colluvium. J. Soil Water Conserv. 2013, 27, 49–54, (In Chinese with English abstract). [Google Scholar]
  60. Jiang, H.; Zhao, X.; Zhao, Y. Cross-Hole Resistivity CT Method Based on Borehole Radar and Its Application. Prog. Geophys. 2024, 39, 1285–1292, (In Chinese with English abstract). [Google Scholar]
  61. Wu, Y.; Huang, Z.; Gu, Q.; Lin, Y.; Moyo, D.; Wu, Y.; Zou, C.; Zhao, K. Experimental investigation on the pore structure and water inrush evolution law of weakly cemented fault fracture zone with different filling gradations. Geomech. Geophys. Geo-Energy Geo-Resour. 2023, 9, 162. [Google Scholar] [CrossRef]
  62. Li, Y.; Lan, J.; Li, R.; Wang, J.; Mo, Q. Permeability Coefficient of Weathered Zones of the Huashan Granite Body, Guangxi. J. Guilin Univ. Technol. 2016, 36, 681–687, (In Chinese with English abstract). [Google Scholar]
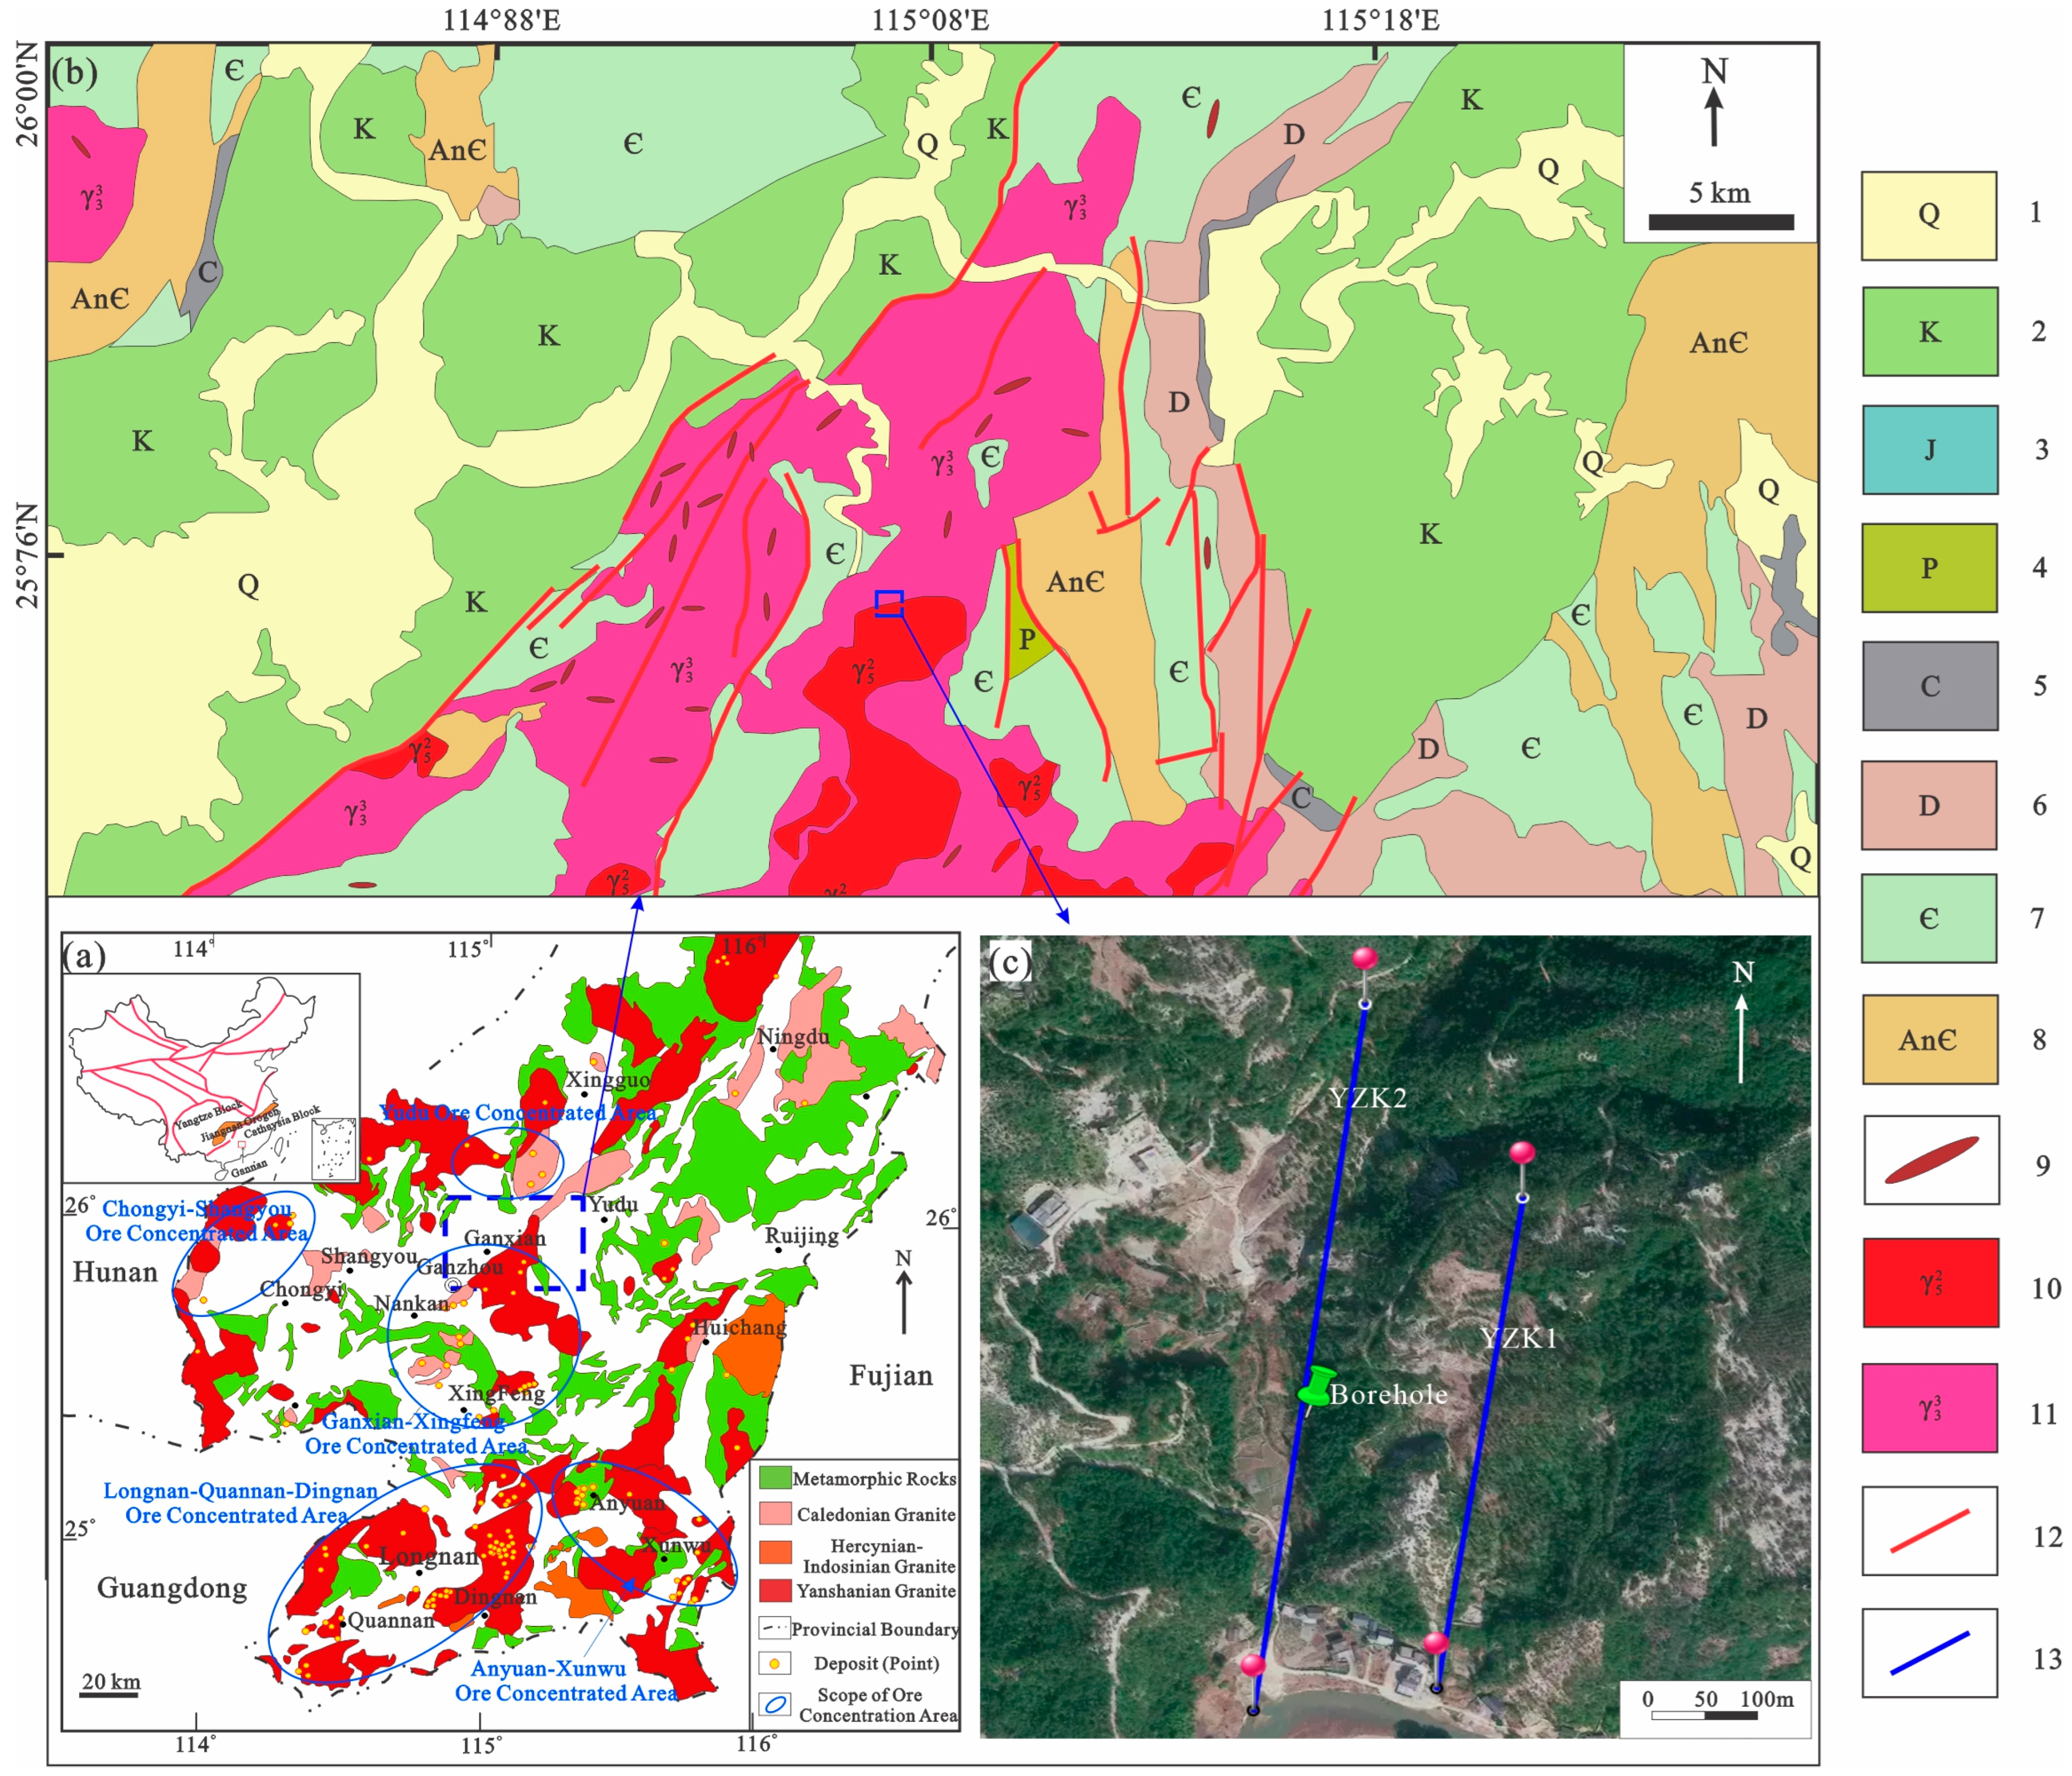
Figure 1. Geological Sketch Map of the Study Area and Survey Line Distribution (Modified by [40,41]). (a) Distribution of ion-adsorption type REE deposits in Southern Jiangxi (Gannan region); (b) Simplified geological map of the Dabu area; (c) Layout of electrical resistivity tomography (ERT) survey lines. 1—Quaternary sediments; 2—Cretaceous conglomerate and sandstone; 3—Jurassic sandstone and mudstone; 4—Permian sandstone; 5—Carboniferous limestone; 6—Devonian limestone and sandstone; 7—Cambrian metasandstone; 8—Precambrian metasandstone and slate; 9—Late Yanshanian intrusive dike; 10—Early Yanshanian granite; 11—Caledonian granite; 12—Fracture; 13—ERT Line.
Minerals 16 00773 g001
Figure 2. Schematic diagram of the ERT workflow and data processing flowchart(“#” indicates the electrode number) [45].
Minerals 16 00773 g002
Figure 3. Measured Apparent Resistivity (a) and Forward-Modeled Response (b) for Line YZK1.
Minerals 16 00773 g003
Figure 4. Measured Apparent Resistivity and Forward-Modeled Response for Line YZK2.
Minerals 16 00773 g004
Figure 5. Borehole Validation of ERT Inversion Results for Line YZK2.
Minerals 16 00773 g005
Figure 6. ERT Inversion Profiles and Geological Interpretation of Lines YZK1 (a) and YZK2 (b).
Minerals 16 00773 g006
Figure 7. Distribution of (a) porosity and (b) permeability along survey Line YZK1.
Minerals 16 00773 g007
Figure 8. Distribution of (a) porosity and (b) permeability along survey Line YZK2.
Minerals 16 00773 g008
Table 1. Resistivity Characteristics of Major Rock Strata in the study Area.
Lithology/StratumResistivity (Ω·m)RemarksSource
Quaternary sandy clay50–300Highly influenced by moisture content[28]
Granite weathered layer300–800Highly influenced by water content[26]
Granite bedrock1000–10,000Highly influenced by water content[27]
Fault fracture zone20–400Highly influenced by water content[28]
Groundwater/Surface water~100/[28]
Table 2. Survey line parameters for the ERT investigation in the Dabu rare earth mining area.
Survey LineAzimuthLength (m)Electrode Spacing (m)Number of Electrodes
YZK1NNE4701047
YZK2NNE6701067
Table 3. Parameters used for the transformation from resistivity to porosity and permeability.
ParameterSymbolValueUnitSource/Description
Cementation Exponentm2.5/Empirical data for unconsolidated kaolinitic sandstone
Saturation Exponentn2.0/Standard Archie equation assumption
Average Grain Diameterd0.01mmGrain size analysis of typical weathered crust samples
Kozeny Constantc5000/Kozeny–Carman model fitting (Mavko et al., 1997) [49,50]
Pore Water ResistivityRw0.1Ω·mAssumed average saturation during in situ leaching
Water SaturationSw0.5/Assumed average saturation during in situ leaching
Archie constanta1.8/Empirical tortuosity factor for weathered crust (Worthington, 1993) [51]
Table 4. The “Resistivity-Porosity-Permeability” coupling structural model of granite weathering layer.
Vertical ZoneResistivity Range (Ω·m)Porosity (%)Permeability (mD)Support Evidence (Figure 6, Figure 7 and Figure 8)
Tailings/
Colluvium
>8003.6–6.40.01–0.04e.g., High-resistivity anomalies (800–1500 Ω·m) at shallow depths (0–10 m) on YZK1.
Completely Weathered10–7008.7–170.04–1.2e.g., Low-resistivity anomalies (10–200 Ω·m) at depths of 0–20 m on YZK1, thinning to 10 m at Sta. 160 m.
Moderately Weathered1000–20002.2–6.00.02–0.05e.g., High-resistivity transition (>1000 Ω·m) at depths > 20 m on YZK1.
Fresh Bedrock>1500<4.0<0.02e.g., Extremely high-resistivity zone (>8000 Ω·m) below 50 m on YZK1, truncating conductive pathways.
Disclaimer/Publisher’s Note: The statements, opinions and data contained in all publications are solely those of the individual author(s) and contributor(s) and not of MDPI and/or the editor(s). MDPI and/or the editor(s) disclaim responsibility for any injury to people or property resulting from any ideas, methods, instructions or products referred to in the content.