1. Introduction
Dixie Valley, Nevada, is one of the most geologically significant areas within the Basin and Range Province due to its exceptional geothermal potential and growing importance as a frontier for lithium exploration. The distinctive interaction among tectonic extension, normal faulting, hydrothermal circulation, basin development, and sedimentary-fluid processes has created an environment favorable for both high-temperature geothermal activity and possible concentration of critical minerals. Previous studies have emphasized the fundamental role of fault-controlled fluid flow, hydrothermal alteration, and basin evolution in governing the distribution of geothermal and mineral resources across this tectonically active domain [
1,
2].
The Dixie Valley geothermal field is among the most productive geothermal systems in the United States and serves as a natural laboratory for understanding extensional geothermal systems. Its location in the Basin and Range Province, a region characterized by large-scale normal faulting, enhances crustal permeability and facilitates the upward migration of heat from deep-crustal and upper-mantle sources. The same structural and hydrological conditions that promote geothermal circulation also provide favorable geochemical settings for lithium accumulation. Lithium may be concentrated in geothermal environments through hydrothermal leaching of volcanic and sedimentary rocks, transport in hot fluids, and subsequent accumulation in brines or clay-rich sediments. Such processes are broadly analogous to those recognized in lithium-bearing basins such as Clayton Valley, Nevada [
3].
Since 2021, geophysical investigations in Dixie Valley have expanded substantially through the Basin and Range Investigation for Developing Geothermal Energy (BRIDGE) project, a U.S. Department of Energy initiative designed to advance exploration methods for concealed, or blind, geothermal systems in the Basin and Range Province [
4,
5]. Led by Sandia National Laboratories in collaboration with academic and industrial partners, BRIDGE seeks to reduce geothermal exploration risk and cost by developing systematic workflows that integrate geological, geophysical, geochemical, thermal, and hydrological observations.
Within Dixie Valley, recognized as a benchmark geothermal field and a key BRIDGE test site, an extensive suite of modern geophysical surveys was conducted between 2021 and 2024. The data acquisition program included helicopter-borne time-domain electromagnetic surveys, magnetotelluric soundings, ground-gravity measurements, and integration of legacy aeromagnetic data. These datasets were complemented by shallow temperature-probe measurements, spring and well geochemistry, high-resolution LiDAR, and detailed structural mapping of Quaternary fault systems. Together, these data provide one of the most comprehensive modern geophysical datasets acquired over a Basin and Range geothermal system.
The multidisciplinary BRIDGE datasets were integrated into preliminary 3D conceptual models of the geothermal system [
5,
6,
7]. These models combine resistivity structure, fault geometry, shallow temperature data, and hydrothermal indicators to infer the geometry and permeability of active fault zones and to estimate the depth and extent of the geothermal reservoir. At Dixie Valley, this integrated approach revealed a previously unrecognized northeast-striking, northwest-dipping normal fault associated with hydrothermal alteration and elevated shallow temperatures, suggesting the presence of a geothermal system structurally linked to the broader Dixie Valley fault system.
The present study extends previous BRIDGE interpretations by performing a comprehensive re-analysis and integration of the available geophysical datasets in Dixie Valley, with emphasis on the Grover Point area. We apply a recently developed novel magnetic inversion method capable of simultaneously recovering induced and remanent magnetization from total magnetic intensity data. This approach helps separate magnetization aligned with the present-day geomagnetic field from remanent magnetization acquired during earlier thermal, chemical, or tectonic events. Such separation is important in geothermal settings, where hydrothermal alteration may destroy or modify magnetic minerals and where remanent magnetization may strongly influence the observed magnetic field.
In parallel, we perform Gramian joint inversion of gravity and magnetic data to produce self-consistent density and magnetization models that honor both datasets simultaneously. We also revisit the inversion of HeliTEM and MT data using rigorous 3D integral-equation methods. The resulting resistivity model extends from shallow basin fill to deeper crystalline basement and helps identify conductive alteration zones, fault-damage corridors, and possible hydrothermal flow paths.
Multiple preliminary inversion runs were conducted to assess the sensitivity of the results to the assumed data-error floors, select the focusing parameters, determine the size of the inversion grids, and optimize the Gramian coupling parameters. Across these tests, the principal model characteristics—including the overall basin geometry and the dominant density, magnetization, and electromagnetic anomalies—remained generally stable and consistent. The inversion-cell dimensions were progressively refined to ensure that the final models captured the full spatial resolution and fidelity of the available datasets. Geological features that persisted across successive inversion runs were gradually sharpened and more clearly resolved, whereas localized anomalies that appeared only under specific parameter choices were interpreted as likely numerical artifacts. The final selected models therefore preserve robust, repeatable structural and physical-property features while minimizing spurious effects associated with individual inversion realizations. This multiphysics inversion framework reduces interpretational ambiguity and improves confidence in delineating geothermal reservoirs and associated lithium-bearing systems.
In summary, the integrated methodology presented here advances quantitative, deterministic interpretation of multiphysics geophysical data for geothermal and critical-mineral exploration. By combining electromagnetic, magnetic, and gravity datasets within a unified interpretation framework, this approach improves subsurface characterization, reduces exploration uncertainty, and supports more efficient development of sustainable energy and mineral resources in Dixie Valley and comparable extensional terranes worldwide.
2. Geological Setting of Dixie Valley and the Grover Point Area
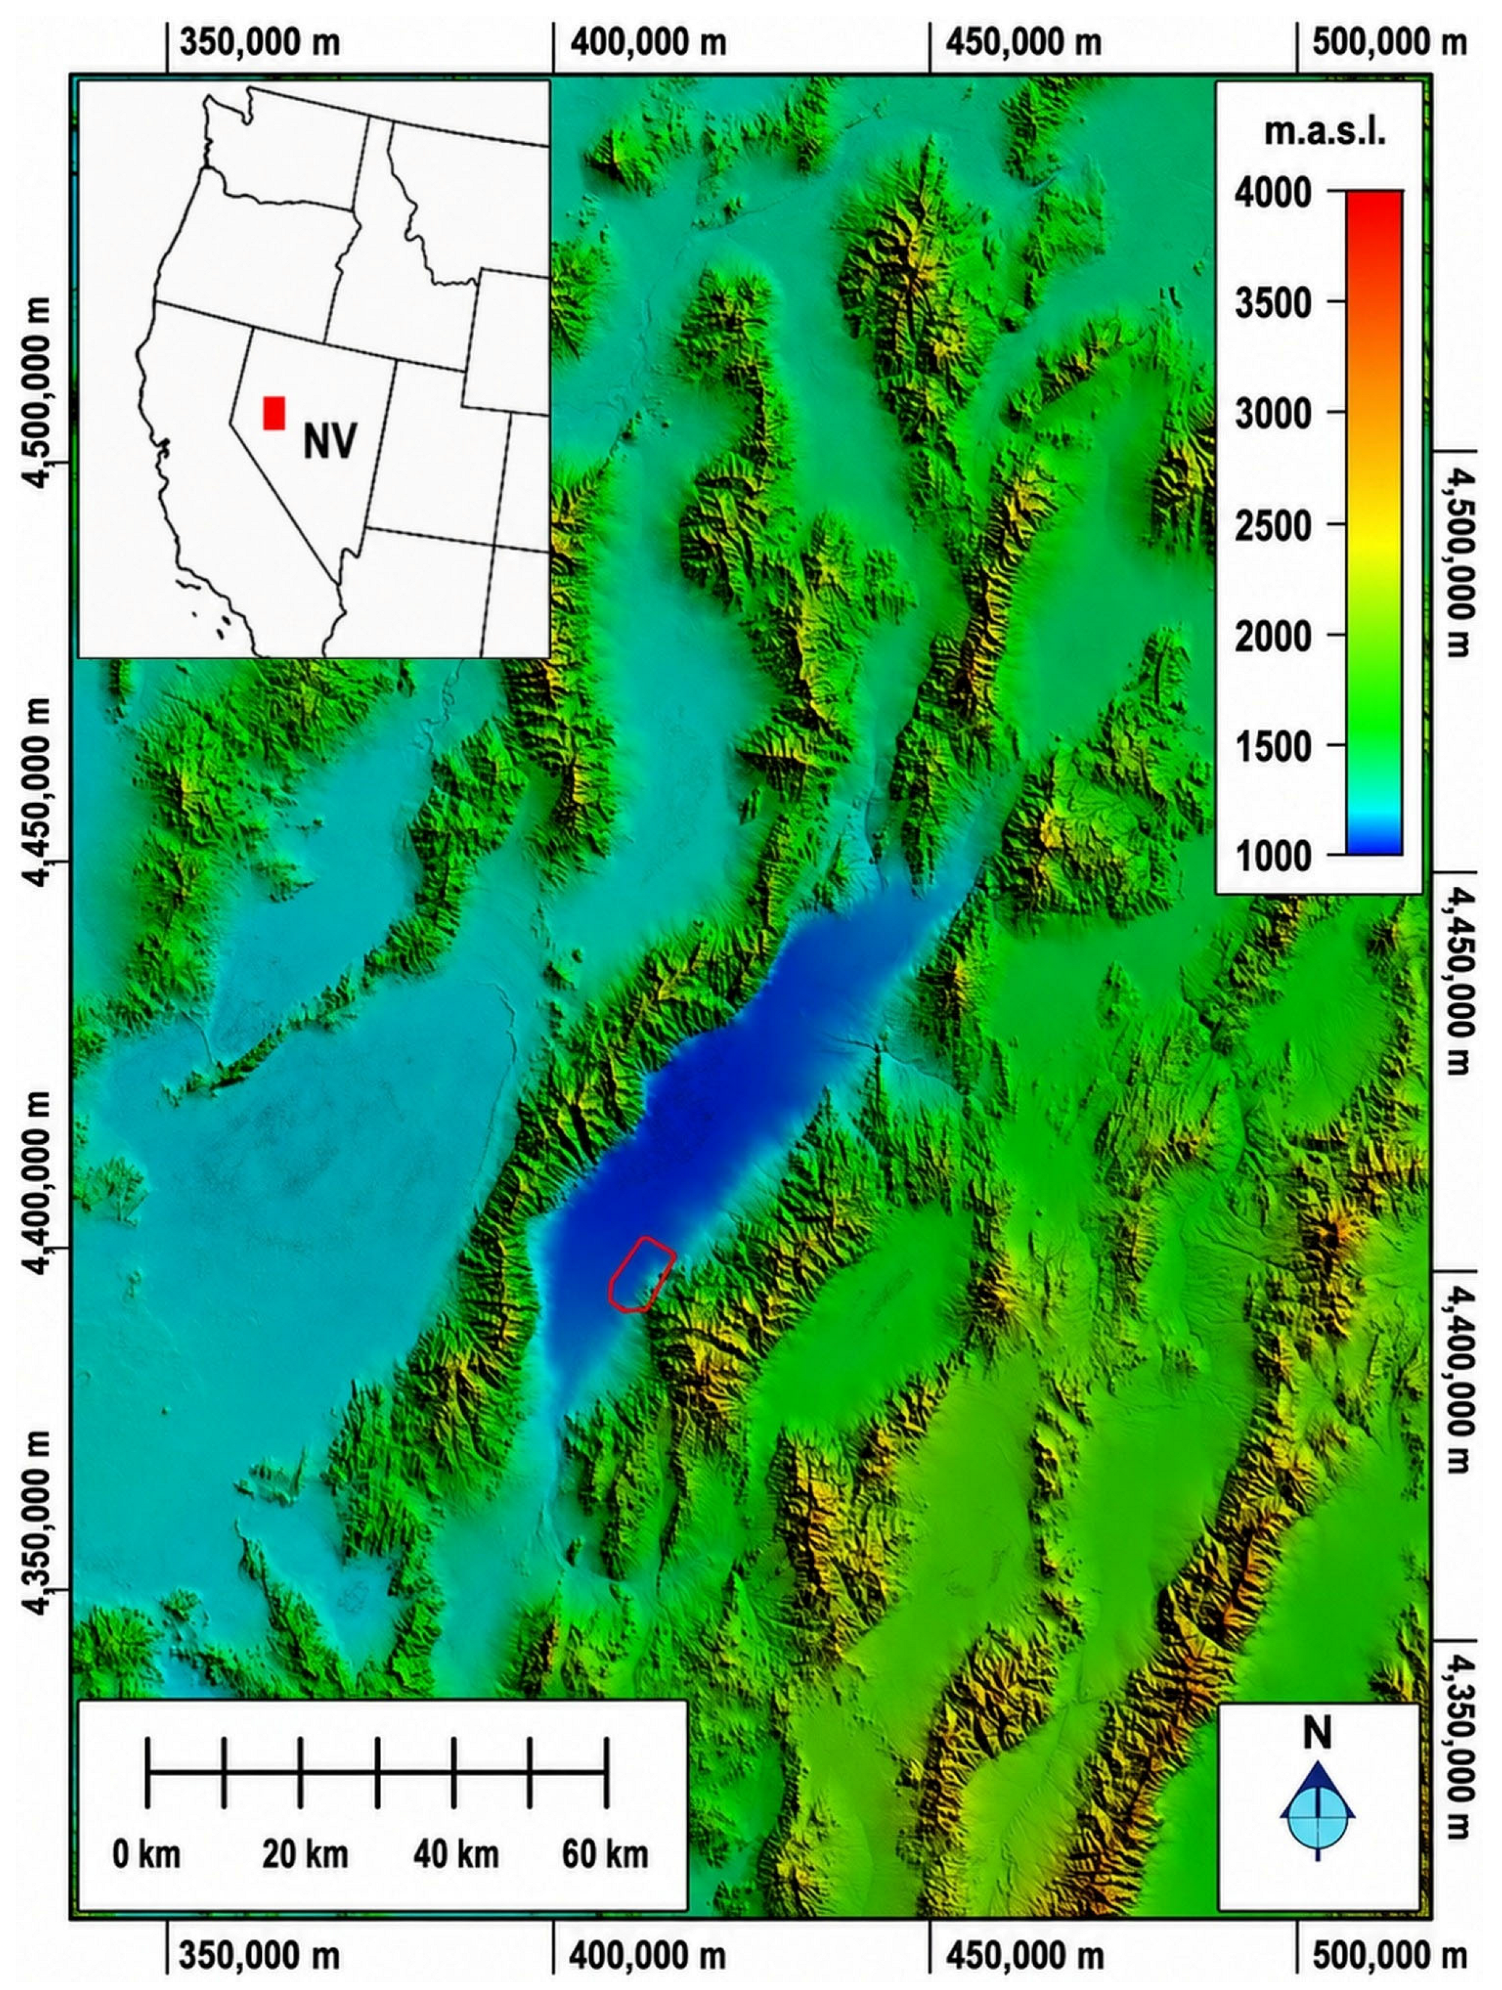
Dixie Valley is located in the central Basin and Range Province of western North America, a region distinguished by active crustal extension and the development of alternating uplifted ranges and down-dropped basins (
Figure 1). The valley forms a classic graben system bounded to the west by the Stillwater Range and controlled by the major Dixie Valley, or Stillwater, fault system. This fault zone defines the principal structural framework of the basin and accommodates significant extensional displacement. Geological and geophysical investigations indicate a nested graben architecture characterized by step-faulted blocks and complex 3D basin geometry.
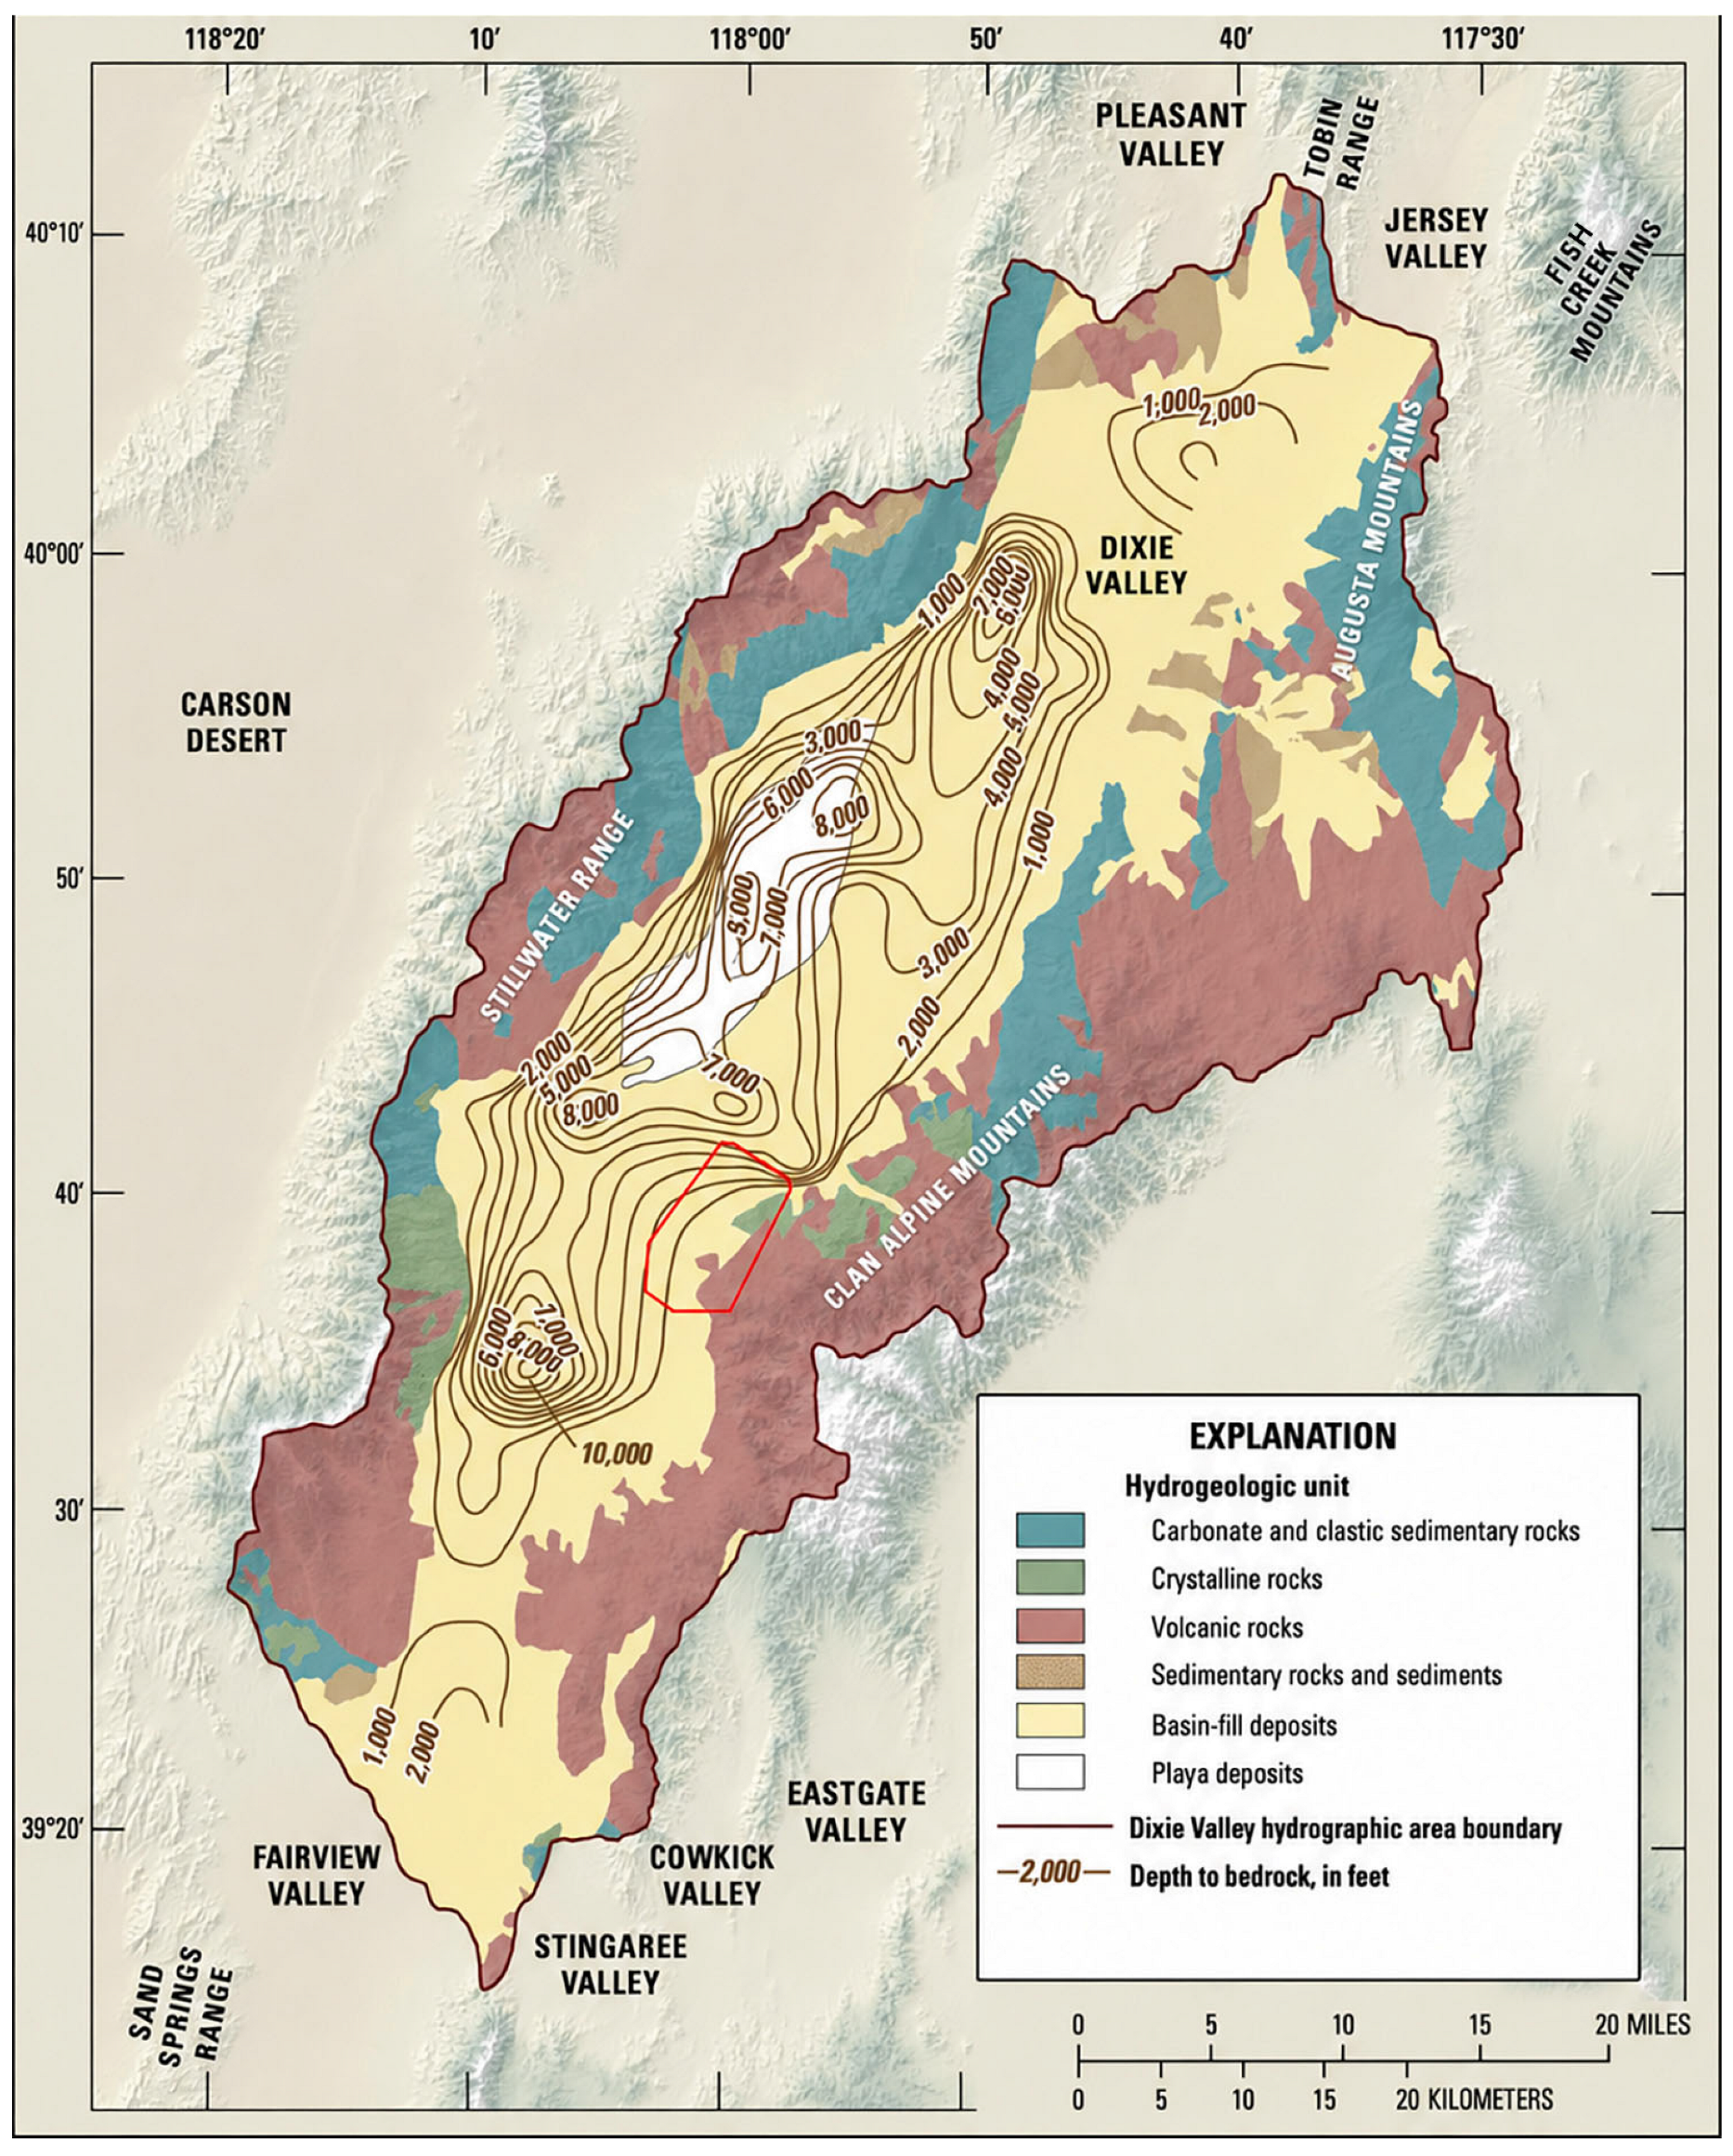
The bedrock geology of the surrounding ranges is dominated by Triassic strata that transition upward into Jurassic marine sedimentary and volcaniclastic successions (
Figure 2). These units are structurally juxtaposed by the low-angle Fencemaker Thrust. Basin fill within Dixie Valley includes Mesozoic conglomerates, sandstones, and carbonates collectively referred to as the Dixie Valley Formation, with cumulative thicknesses reaching several hundred meters. Lithological heterogeneity in these units exerts an important control on permeability structure, fluid migration, and hydrothermal alteration.
Dixie Valley hosts one of the most productive geothermal systems in Nevada. Geothermal fluids are largely confined to fracture zones developed within Jurassic rocks in the hanging wall of the Stillwater Fault, where reservoir temperatures are approximately 240–280 °C at depths of about 2–3 km. Surface manifestations include fumaroles, hot springs, and sinter deposits along the active fault trace, indicating sustained discharge of hydrothermal fluids from depth. Commercial development has confirmed high-enthalpy reservoir conditions in deep wells.
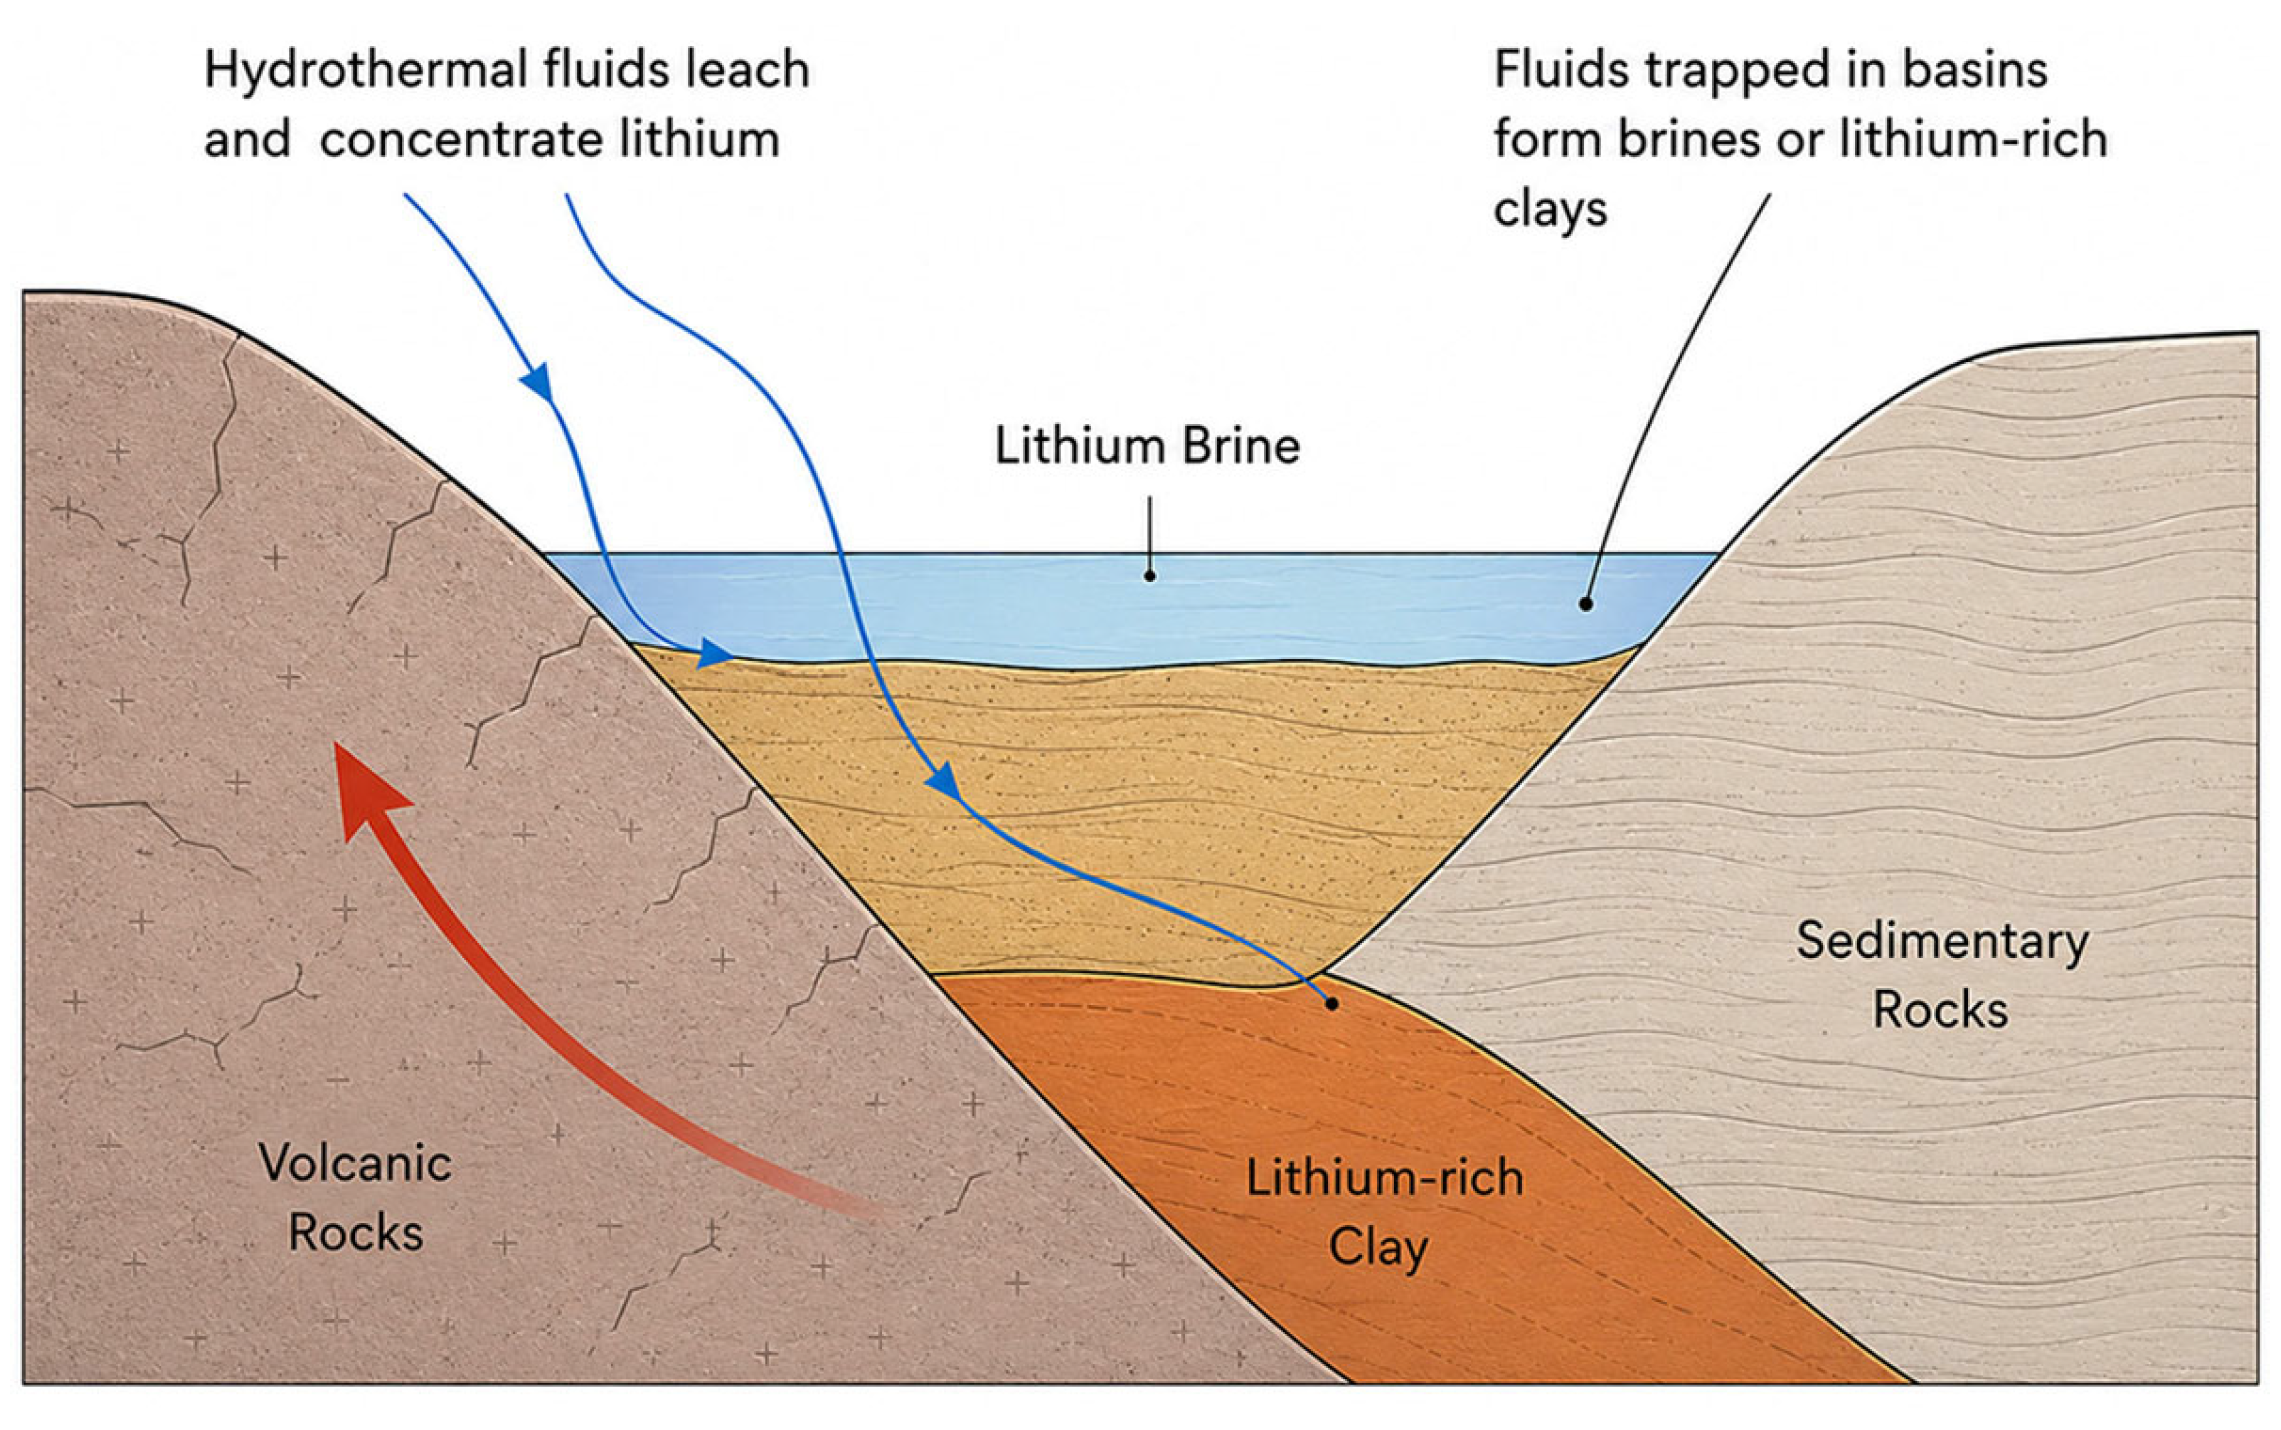
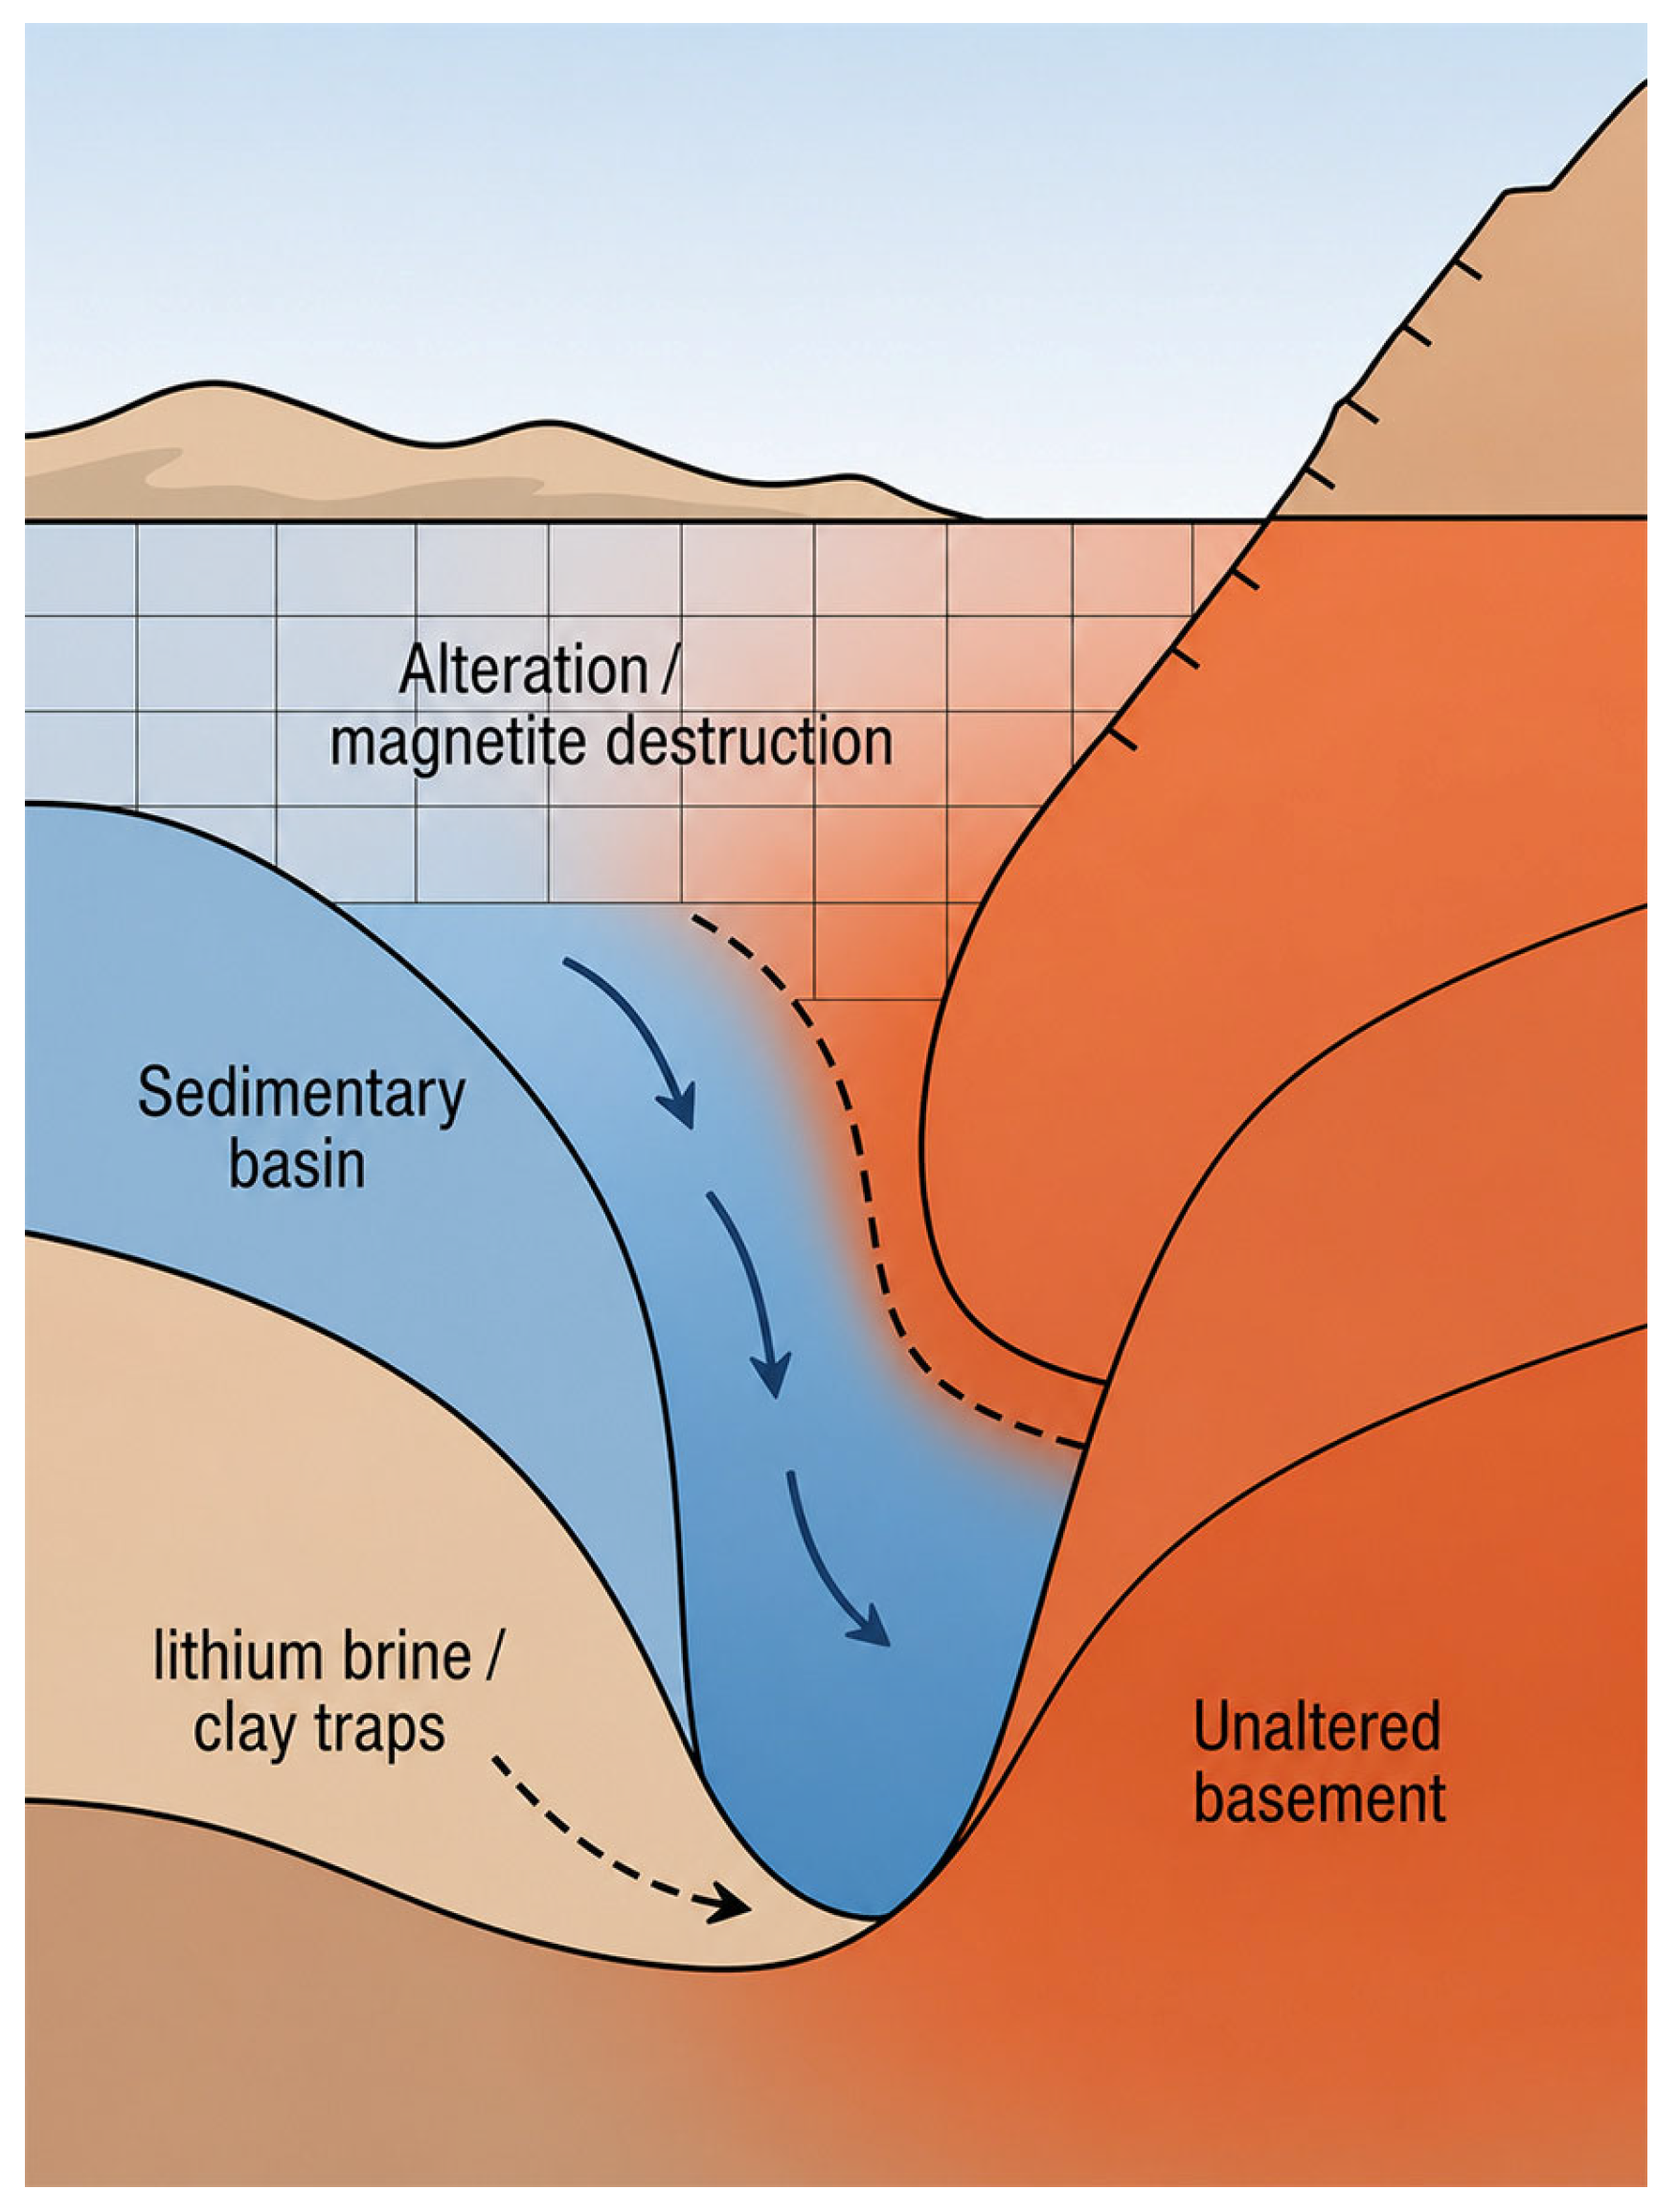
The same geological and hydrological framework that supports active geothermal circulation also suggests potential for lithium enrichment. As geothermal fluids circulate through volcanic and sedimentary sequences, they can leach lithium from primary minerals and transport it through fault and fracture networks. Where these fluids become trapped in permeable basin fill or undergo evaporation and water-rock interaction, lithium may be concentrated in brines or clay-rich sediments. This is illustrated in
Figure 3. Although the tectonic and hydrologic environment of Dixie Valley is favorable for such enrichment, no economically viable lithium deposit has yet been confirmed. Further geophysical surveys and deep fluid or sediment sampling are required to evaluate the distribution and grade of potential lithium resources.
The present study focuses on the Grover Point area along the eastern margin of Dixie Valley. This area was selected because it has been the focus of recent gravity, magnetic, airborne electromagnetic, and MT investigations conducted under BRIDGE. The site occupies a structurally complex region between the Clan Alpine and Stillwater ranges, where successive episodes of normal faulting have produced favorable conditions for hydrothermal circulation and mineral deposition [
7,
9].
Structurally, the Grover Point area is defined by north-striking, west-dipping normal faults associated with the Middlegate Fault Zone and by intersecting northeast-striking, west-dipping faults along the eastern margin of the basin. These fault intersections form relay zones and step-overs that may enhance vertical and lateral permeability. The subsurface stratigraphy consists of Quaternary to Tertiary basin-fill sediments overlying Tertiary volcanic and volcaniclastic rocks, which in turn rest on Mesozoic basement. The contrasts in density, magnetization, and electrical resistivity among these units make Grover Point particularly suitable for integrated geophysical interpretation.
Between 2021 and 2024, an integrated suite of airborne and ground geophysical investigations was carried out under the BRIDGE program. The Grover Point surveys included HeliTEM acquisition, ground gravity measurements, airborne magnetic surveys, and a detailed MT study [
5]. In this paper, we present joint and cooperative inversion of these datasets to delineate structural and lithologic controls on geothermal fluid flow and to evaluate the potential for co-located geothermal and lithium resources.
3. Joint Inversion of Gravity and Magnetic Data
3.1. Airborne Magnetic Data
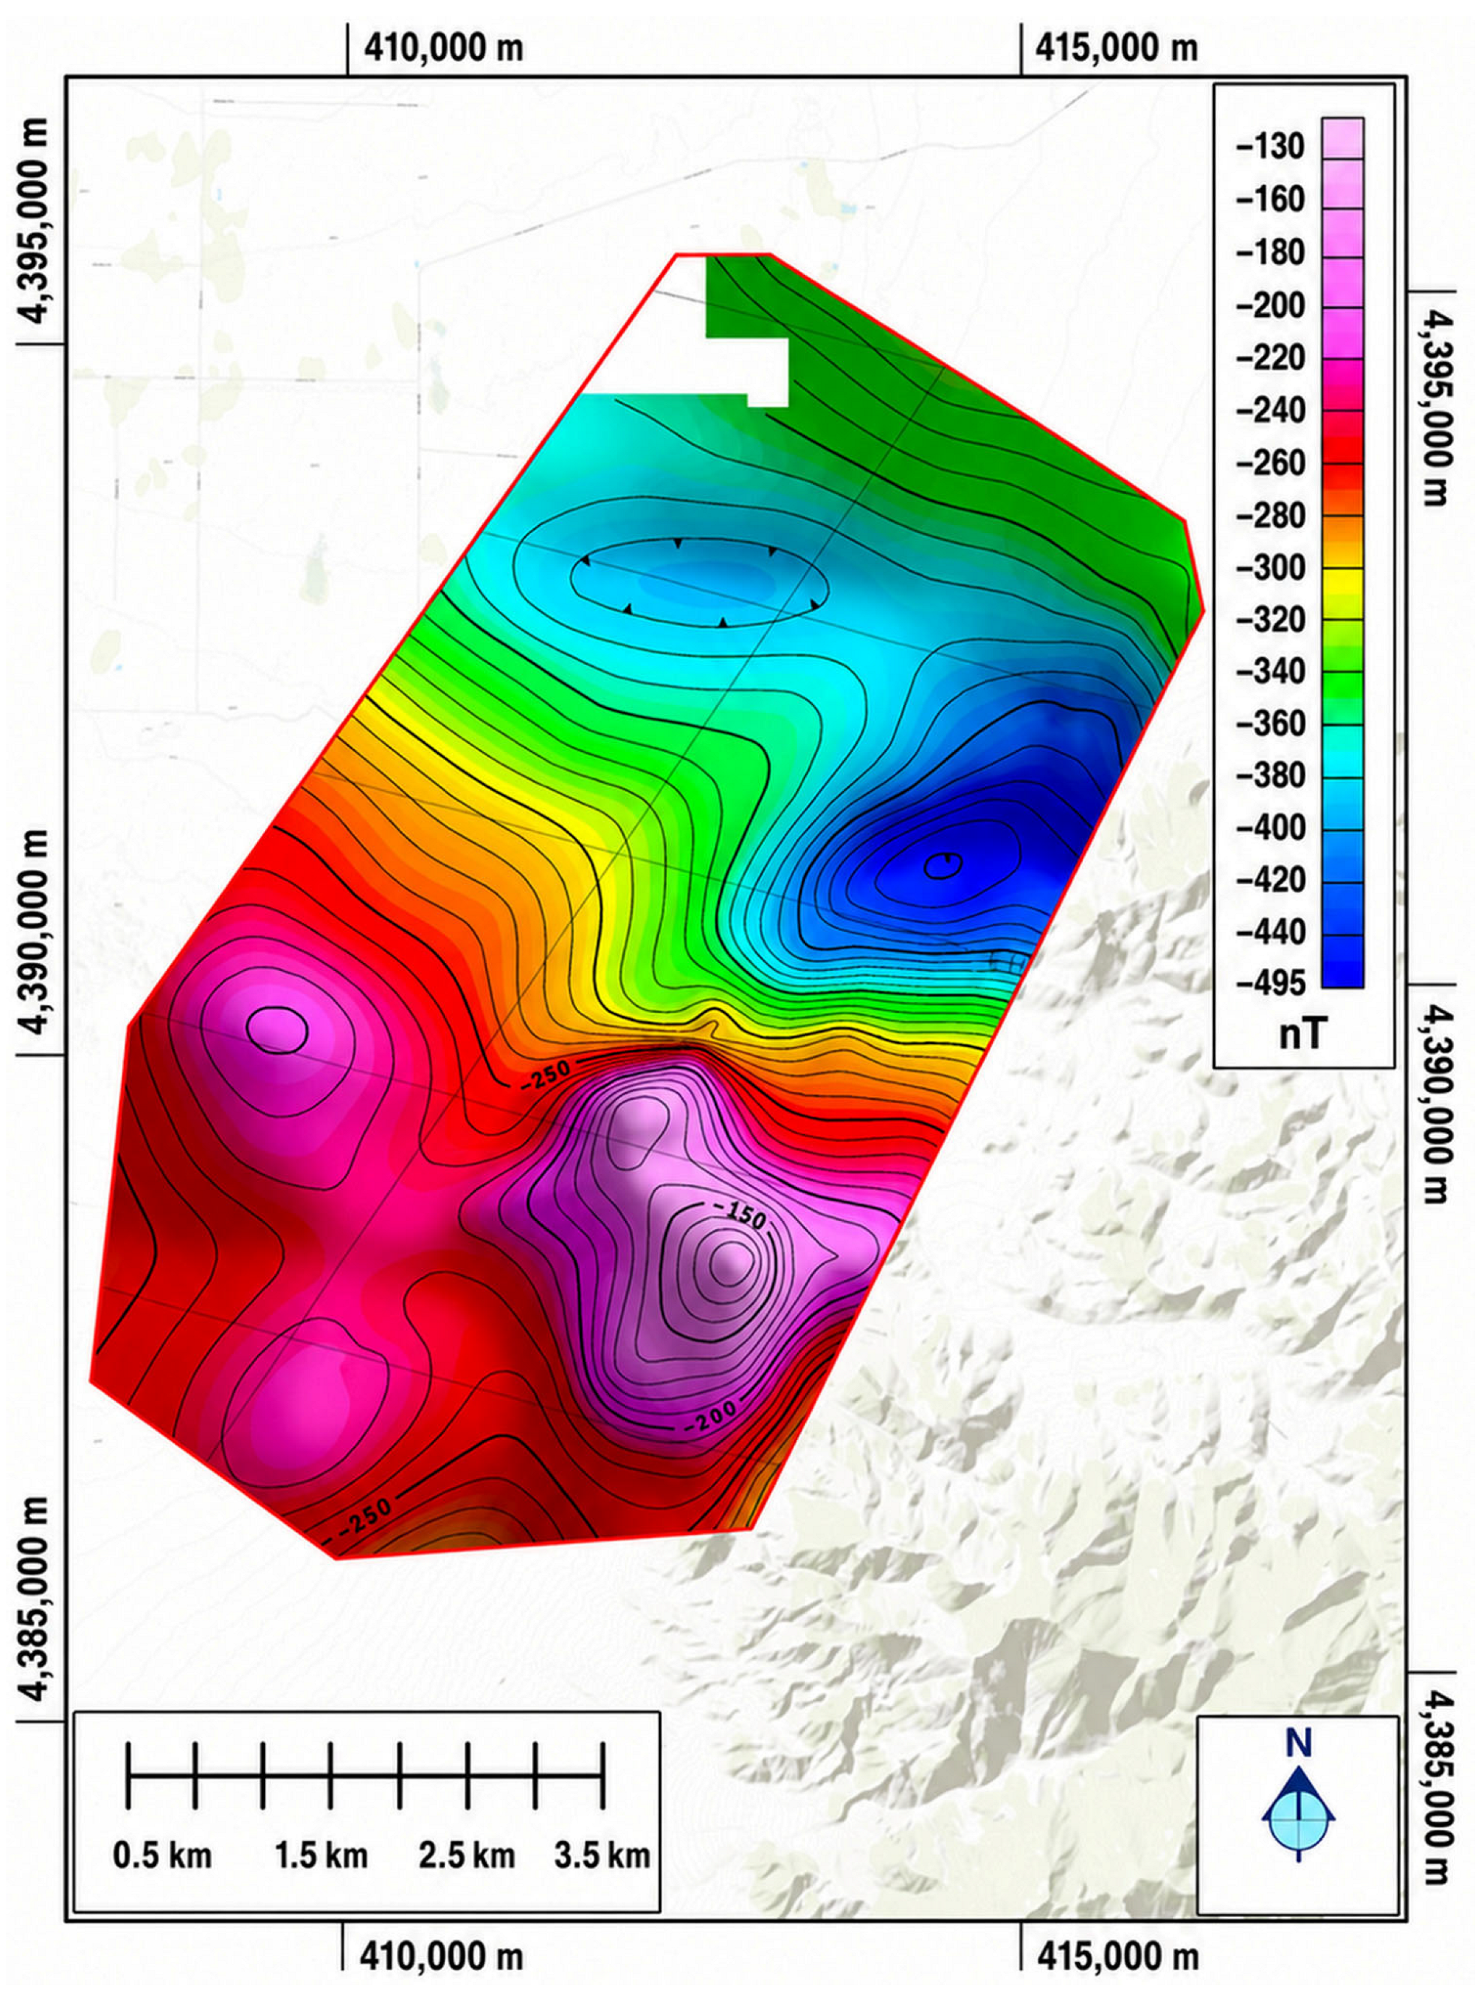
The magnetic dataset used in this study is shown in
Figure 4 and consists of leveled total magnetic intensity data compiled for Dixie Valley [
2]. Total magnetic intensity anomalies reflect variations in the Earth’s magnetic field caused by spatial changes in magnetic mineral content, magnetization direction, and geological structure. However, raw TMI data commonly contain both local responses associated with near-surface geological sources and broader regional components produced by deeper crustal sources.
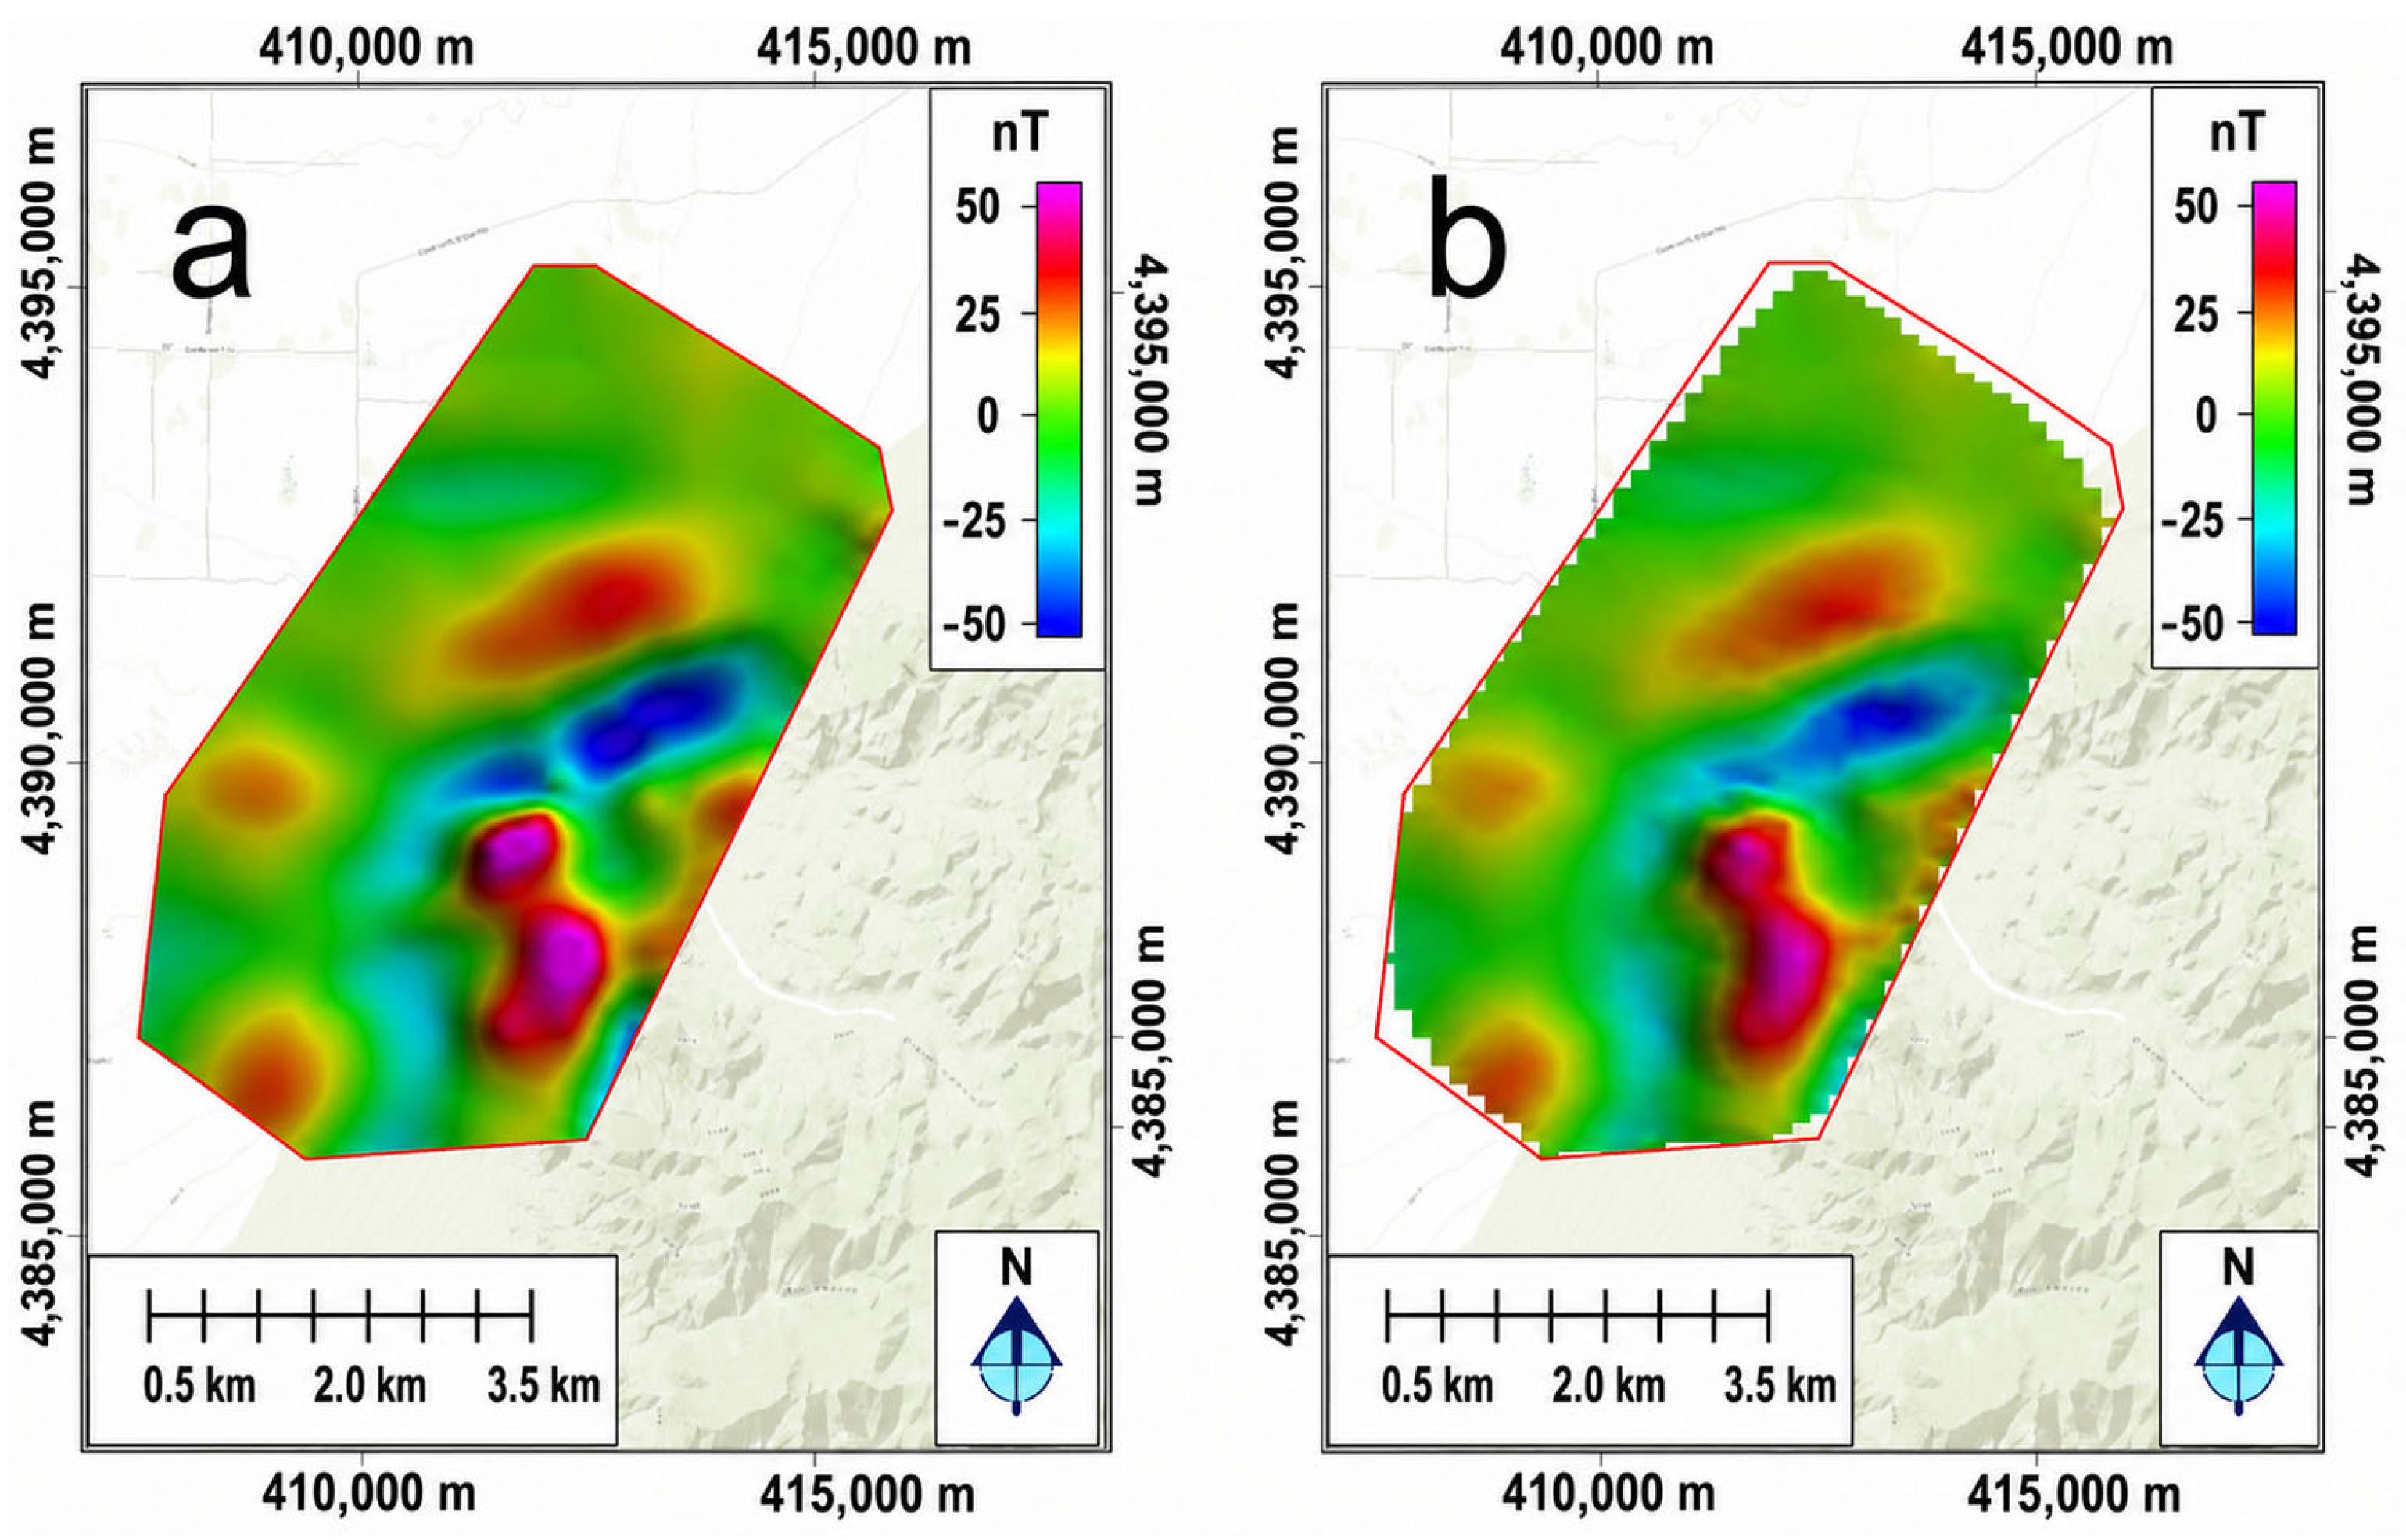
To enhance the resolution of near-surface magnetic features, a high-pass filtering procedure was applied to the TMI data. A high-pass filter with the angular wavenumber cutoff equal to six times the depth of investigation was applied to the dataset. For a maximum target source depth of 3 km, the cutoff wavelength was selected at about 18 km. Components with wavelengths greater than 18 km were removed, while those with shorter wavelengths were retained. The filtering suppresses long-wavelength regional trends while preserving shorter-wavelength anomalies associated with shallow structures, intrusive bodies, faults, and alteration zones. The resulting residual anomalous magnetic intensity (RAMI) field emphasizes local geological features and provides a more appropriate dataset for inversion focused on geothermal and mineral exploration targets. Removal of broad regional components also reduces the tendency of inversion to fit deep or regional sources that may otherwise obscure the geometry of shallower targets. Maps of the observed and predicted RAMI fields are shown in
Figure 5.
3.2. Gravity Data
Dixie Valley has been the subject of several gravity surveys conducted by the U.S. Geological Survey and other organizations since the early 1980s. An early comprehensive USGS survey consisted of nine east-west profiles extending from bedrock outcrop to outcrop across the valley and included approximately 300 stations. The average station spacing was about 600 m, sufficient to characterize first-order basin geometry and major fault structures.
Subsequent compilations expanded the gravity coverage to approximately 2400 stations by integrating regional industrial surveys and public USGS data. More recent studies have refined these datasets for geothermal and structural applications. Standard processing included corrections for latitude, free-air, Bouguer, and terrain effects. Bouguer anomalies were calculated using representative bedrock and alluvial-fill densities, producing an effective density contrast suitable for basin analysis.
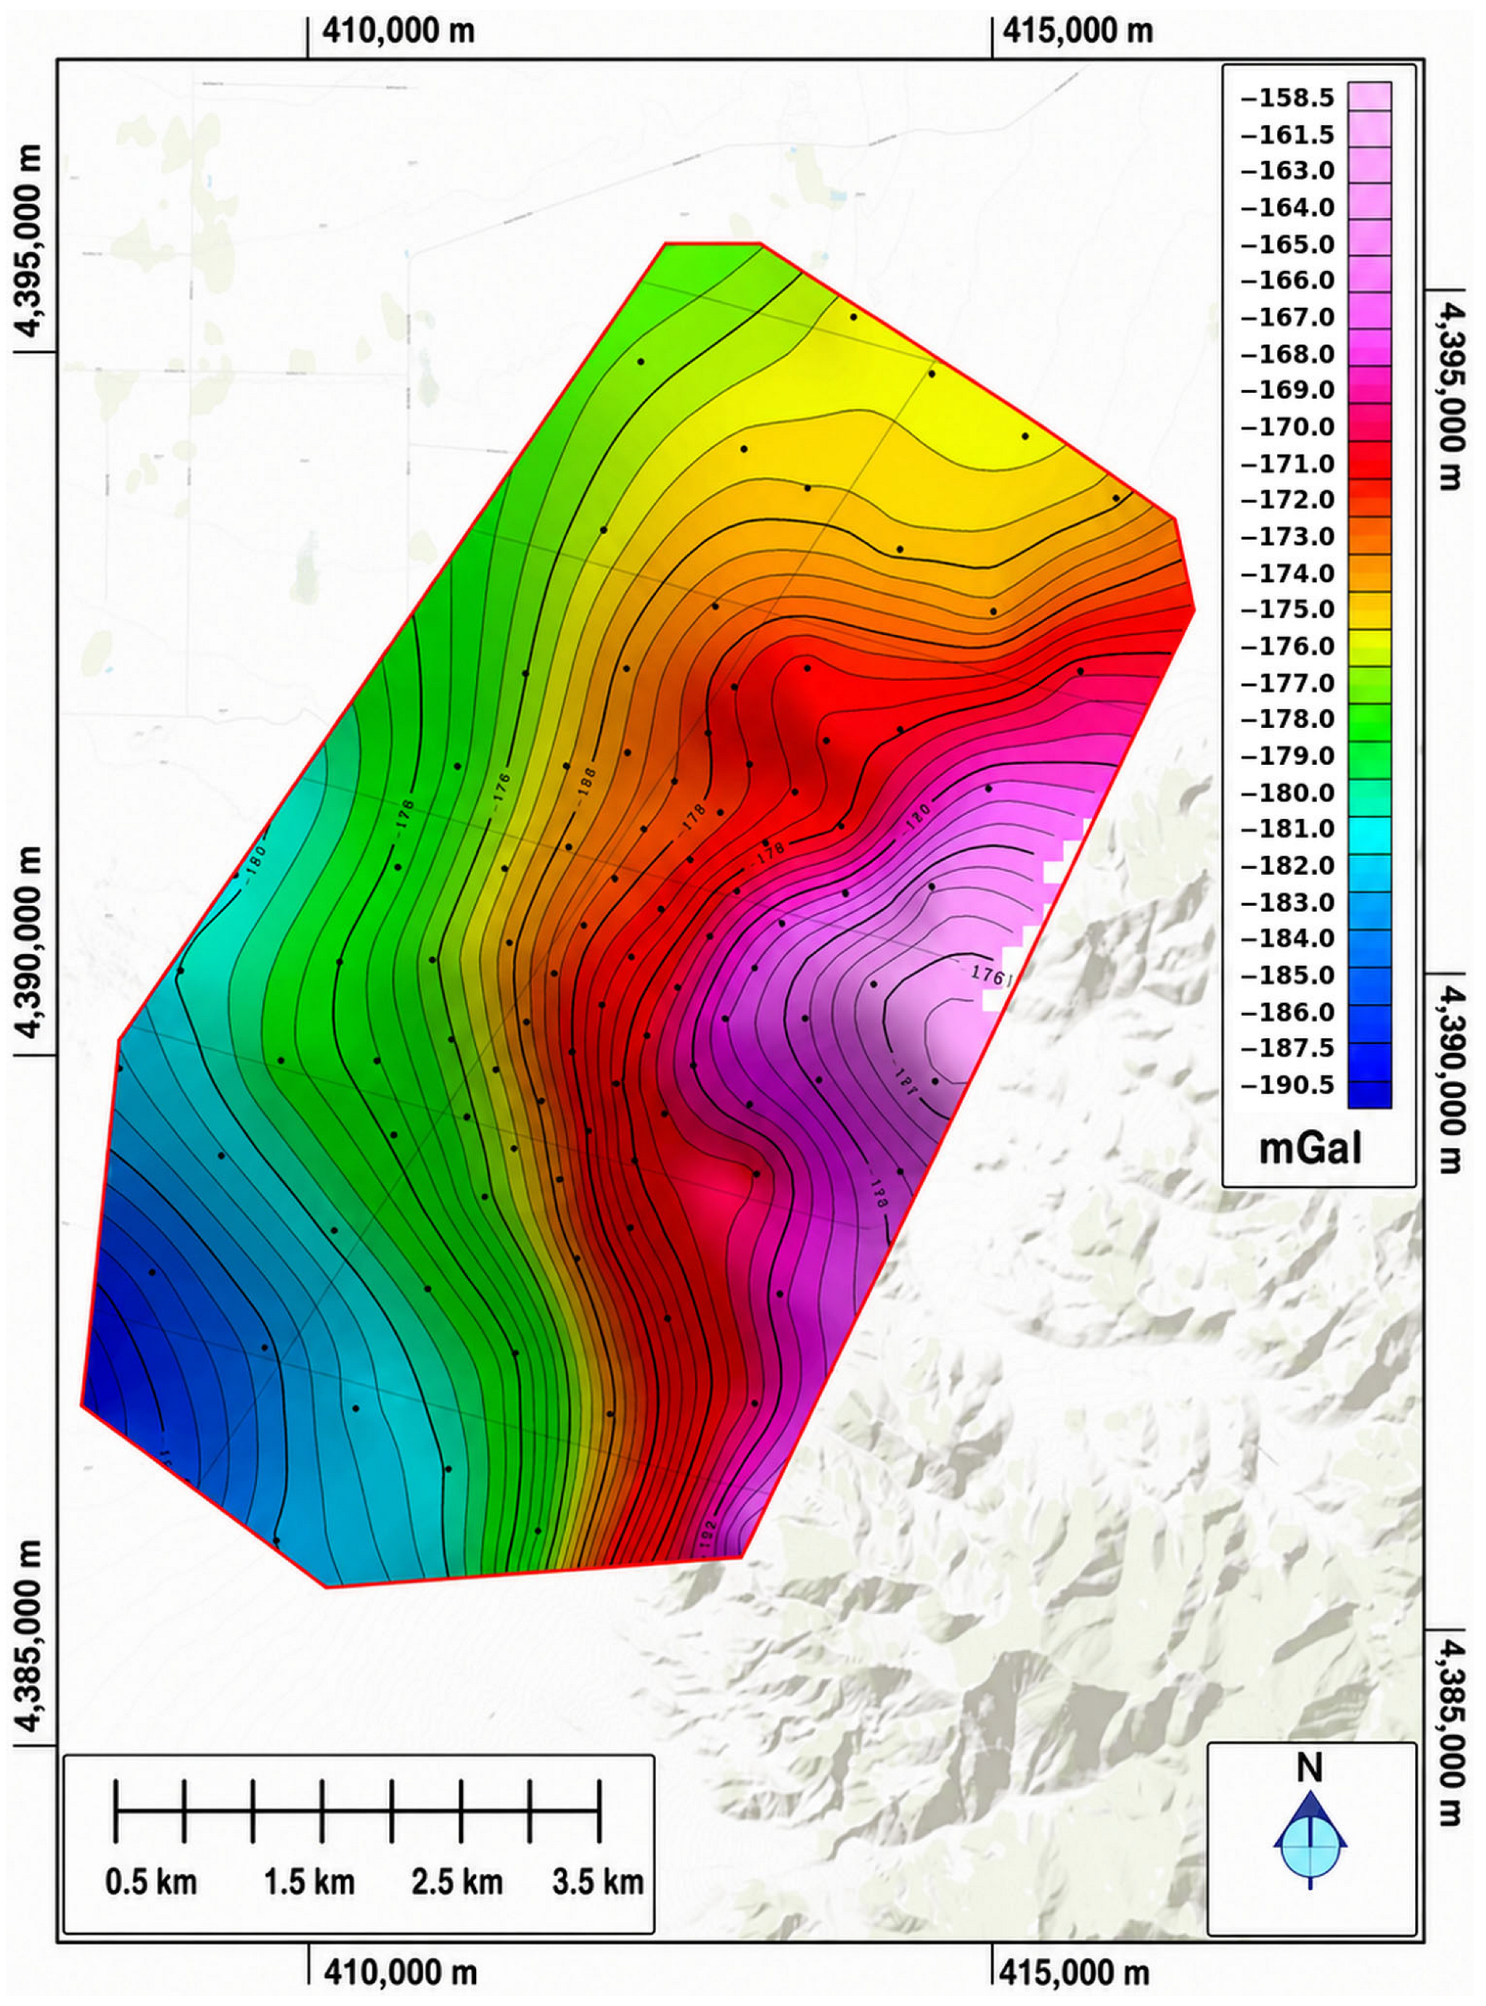
The processed Bouguer anomaly map (
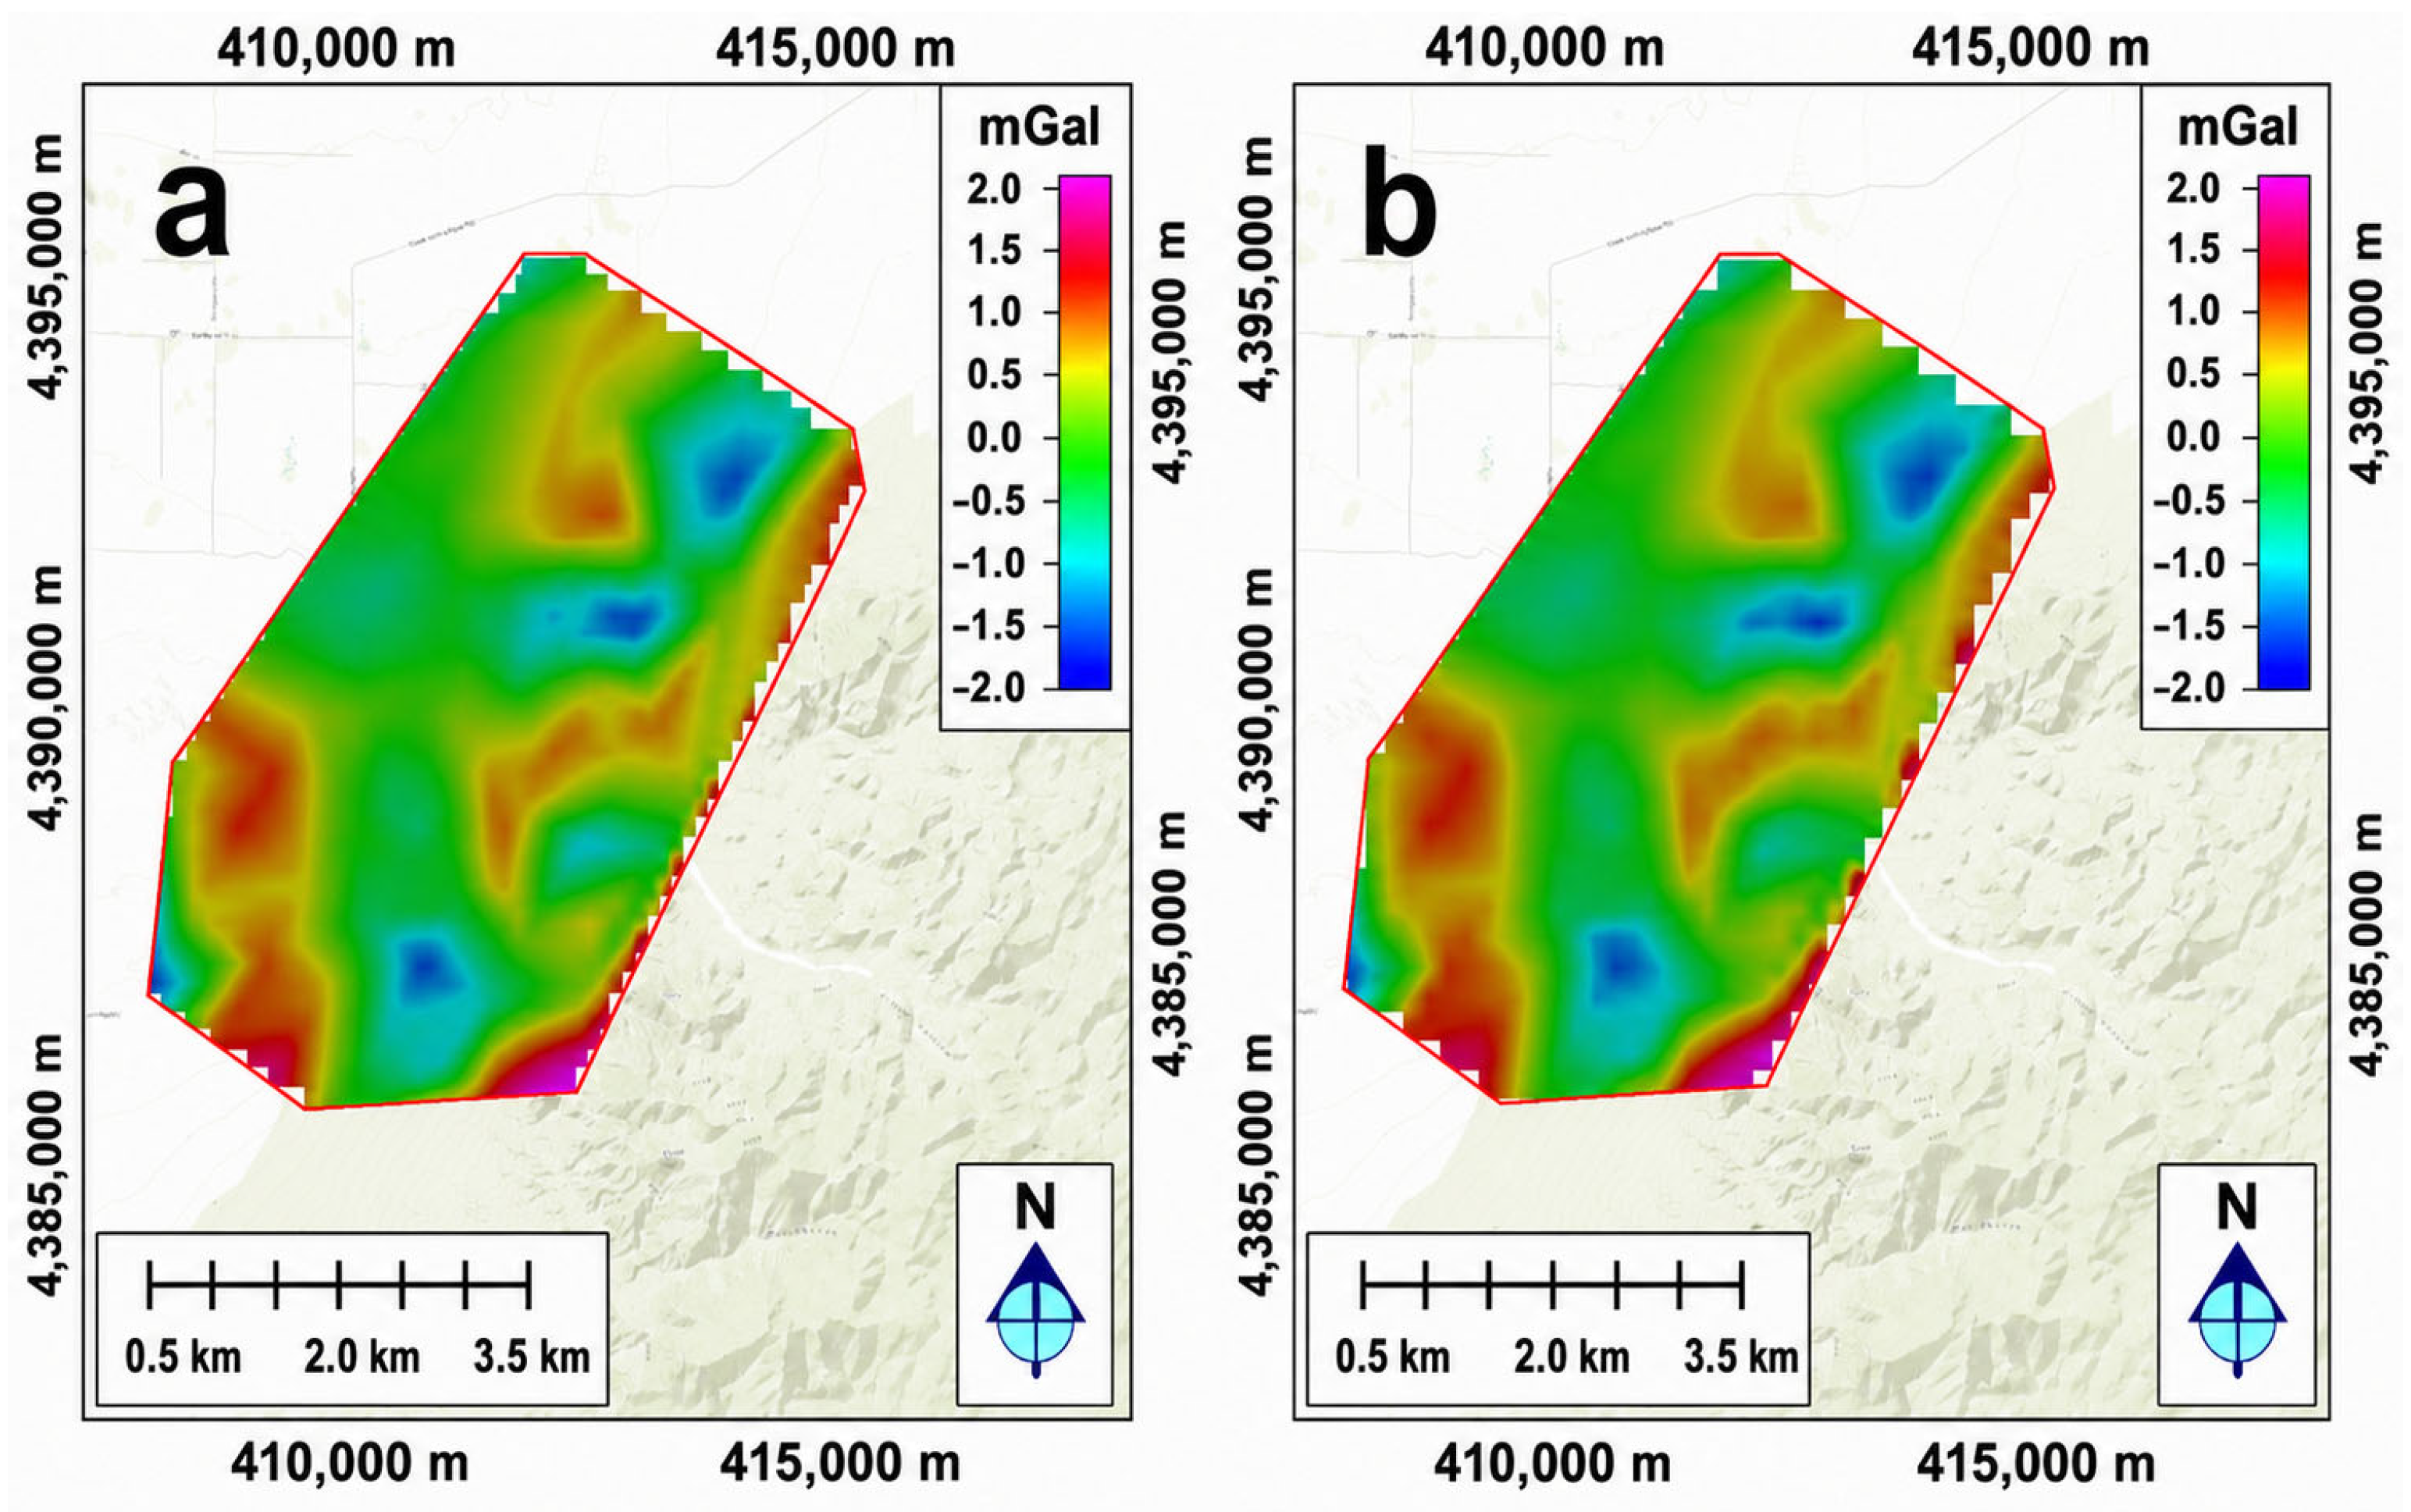
Figure 6) exhibits a range of approximately 30 mGal across the basin. Terrain corrections are especially important along the eastern and western basin margins, where steep topographic gradients occur adjacent to the surrounding ranges. For the present joint inversion, the Bouguer anomaly data were filtered using the same high-pass filter as for magnetic data, and the regional component was removed to obtain an anomalous gravity field that emphasizes density contrasts associated with basin structure, fault blocks, and potential resource-related geological features. Since the same filtering procedure and cutoff were applied to both datasets, the filtered gravity and magnetic data have comparable spatial scales, making them suitable for integrated interpretation. Maps of the observed and predicted anomalous gravity fields are shown in
Figure 7.
3.3. Methodology for Joint Gravity and Magnetic Inversion
We applied the Gramian method to joint inversion of gravity and magnetic data. In this formulation, gravity data are inverted for a 3D density distribution, while magnetic data are inverted for a 3D distribution of induced and remanent magnetization. This approach is particularly important in volcanic, hydrothermal, and structurally complex environments where remanent magnetization may be substantial and not aligned with the present-day geomagnetic field.
Conventional magnetic inversion often assumes that magnetization is purely induced and parallel to the present geomagnetic field. This assumption may be inadequate in geological settings where thermoremanent or chemical remanent magnetization plays an important role. The new methodology of magnetic data inversion introduced in [
10,
11] overcomes this limitation by jointly recovering induced susceptibility and the three Cartesian components of remanent magnetization. The total magnetization vector
M is written as
where χ is magnetic susceptibility,
H0 is the inducing geomagnetic field vector, and
R = (R
x, R
γ, R
z) is the remanent magnetization vector. The predicted magnetic data are written as
where
A is the magnetic forward-modeling operator.
Following the regularized inverse-theory framework [
12,
13], the coupled gravity and magnetic inverse problems can be expressed in operator form as
where
d(1) and
d(2) represent the observed gravity and magnetic data, respectively. The model
m(1) = ρ is the density distribution, and
m(2) = (χ, R
x, R
γ, R
z) contains magnetic susceptibility and remanent magnetization components. The corresponding forward operators are
A(1) for gravity and
A(2) for magnetics.
Because both inverse problems are ill-conditioned, regularization is required. We minimize a joint parametric functional that includes data misfit terms, stabilizing functionals, and Gramian constraints [
14]:
where
are misfit functionals,
are minimum norm stabilizing functionals,
L(1) and
L(2) are linear operators on the model parameters, which are described below,
is the regularization parameter, and coefficients
c1 and
control the relative contributions of the stabilizing and coupling terms. These coefficients are chosen empirically during the inversion-parameter testing phase by evaluating model stability, data misfit reduction, and the geological reasonableness of the recovered model, and are then kept fixed for the production inversion. The regularization parameter
is adaptively reduced during inversion. The purpose of this adaptive reduction is to impose stronger stabilization during the early iterations, when the model is far from convergence, and to progressively relax it as the inversion approaches the target misfit, allowing the recovered model to develop sharper, more geologically meaningful structure. Thus, the procedure is best described as an adaptive regularization scheme with empirically selected initial weights [
13,
14].
The data misfit functionals are
where
are data-weighting operators. The minimum-norm stabilizers are
where
are model-weighting operators and
are a priori models.
The Gramian stabilizer provides a measure of correlation between model parameters or between transformed model attributes. For example, the Gramian of two model attributes
a and
b can be written as follows:
where (·,·) denotes the L
2 inner product.
The operators
L(1) and
L(2) may represent mappings to a common grid, gradients, Laplacians, or other transforms of the model parameters. A structural Gramian constraint based on gradients is particularly useful where direct petrophysical correlation is uncertain but structural similarity is expected:
where
is the del (gradient) operator.
The Gramian term can also be interpreted probabilistically as the determinant of the covariance matrix of model parameters. For two parameters m(1) and m(2), the Gramian is proportional to σ12 σ22 [1 − η2], where η is the correlation coefficient. Thus, minimization of the Gramian promotes correlation between the corresponding model parameters or model attributes. In joint inversion, this coupling helps recover models that are not only consistent with their respective data but also mutually compatible in a geological sense.
The joint parametric functional is minimized iteratively using a reweighted, regularized conjugate gradient method. Depending on geological expectations, the inversion may include minimum-norm, smoothness, focusing, compactness, or structural stabilizers. In the present application, the Gramian coupling encourages structural and petrophysical consistency between density and magnetization models while allowing each dataset to retain its independent sensitivity to subsurface properties.
3.4. Joint Gravity and Magnetic Inversion Results
The joint Gramian inversion was applied to the filtered TMI data and anomalous gravity data to produce density and magnetic models for the Dixie Valley study area. The inversion used a horizontal grid with 100 m cell dimensions and a logarithmic vertical discretization. Vertical cell sizes ranged from approximately 20 to 200 m and extended to a depth of about 1.7 km, providing adequate resolution of shallow to intermediate-depth structures relevant to geothermal and lithium exploration.
The inversion achieved global misfits of less than 7% for the magnetic data and less than 5% for the gravity data.
Figure 5 and
Figure 7 compare observed and predicted magnetic and gravity fields, respectively, and demonstrate that the inversion reproduces the principal anomalies while maintaining geologically interpretable models.
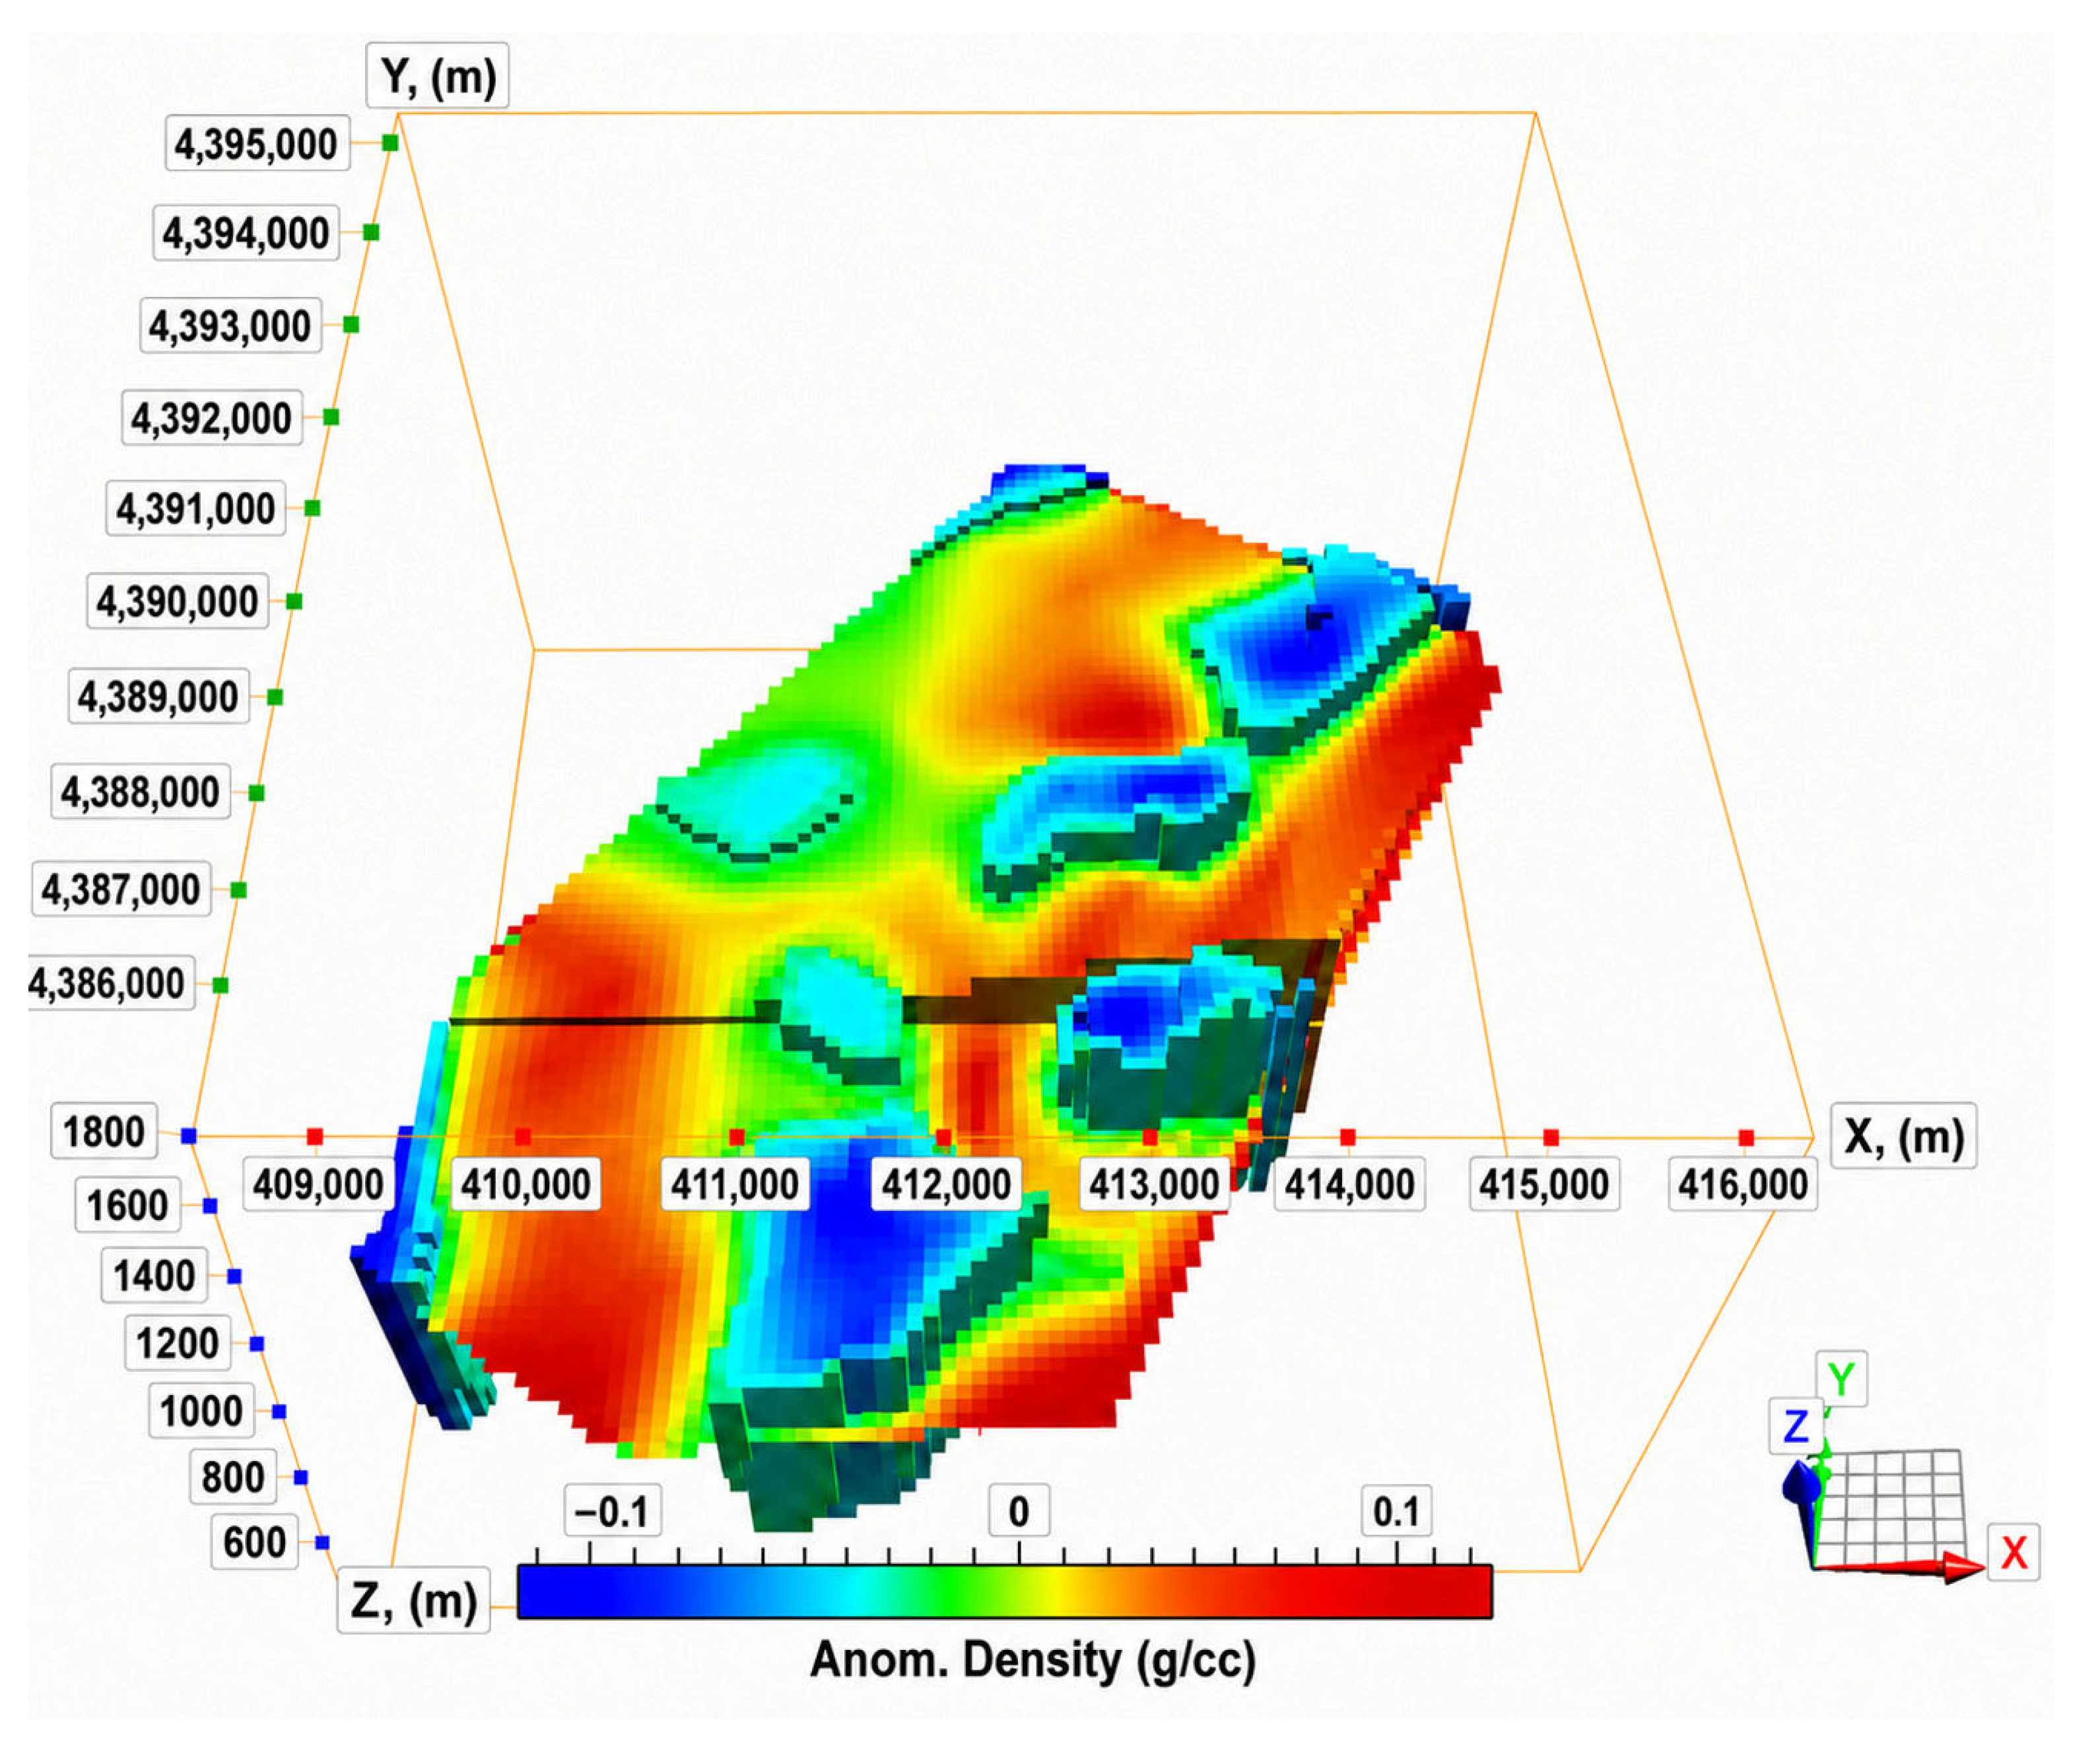
Figure 8 presents the 3D density model obtained from the joint inversion. Low-density zones, shown by cool colors, are interpreted as sedimentary basins or fault-controlled depocenters. These basins are important exploration targets because they may host permeable sediments capable of accumulating lithium-bearing brines or clay-rich alteration products. Higher-density zones are interpreted as basement highs, volcanic or intrusive rocks, and uplifted structural blocks.
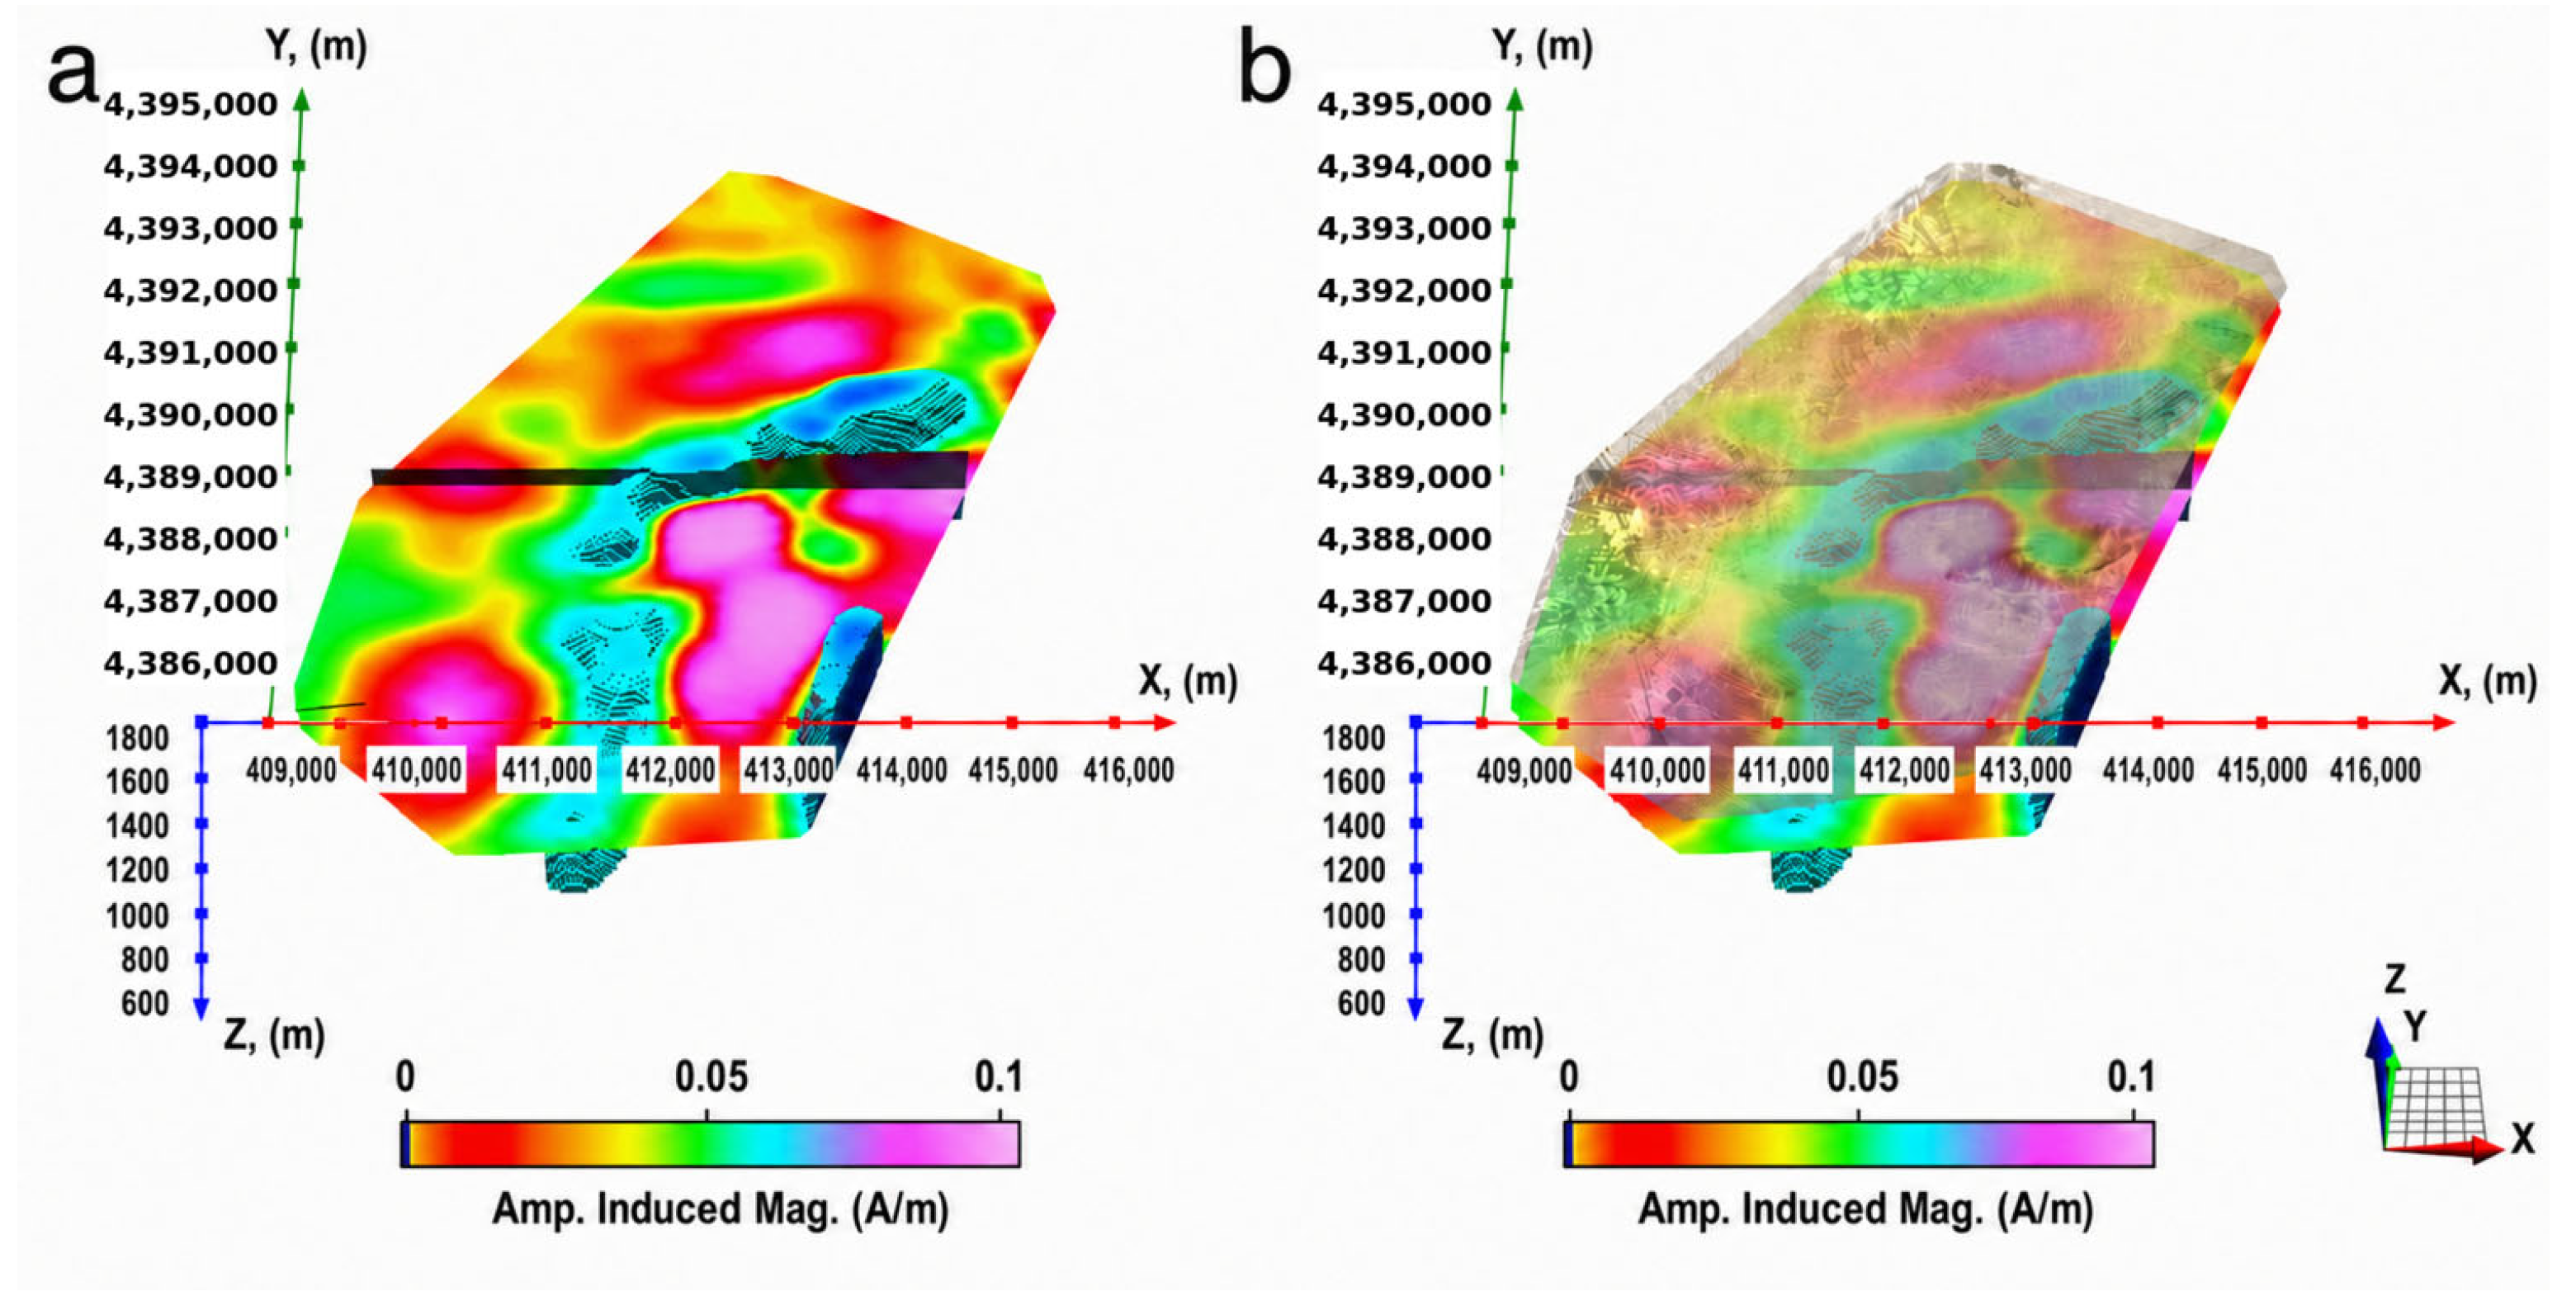
Figure 9a presents the 3D model of inverted induced magnetization. Hydrothermal alteration commonly destroys or modifies magnetite, producing demagnetized corridors along fluid pathways. Cool colors identify these demagnetized zones, which may be diagnostic of past or present hydrothermal circulation. These demagnetized zones, especially where they coincide with low-density basins and conductive resistivity anomalies, are important indicators of geothermal activity and possible lithium accumulation.
Figure 9b shows the same induced magnetization model overlain by topography.
The induced magnetization model detects magnetite destruction, which is indicative of past or present fluid pathways favorable to both geothermal systems and lithium deposition. However, this model represents only one component of the magnetic system.
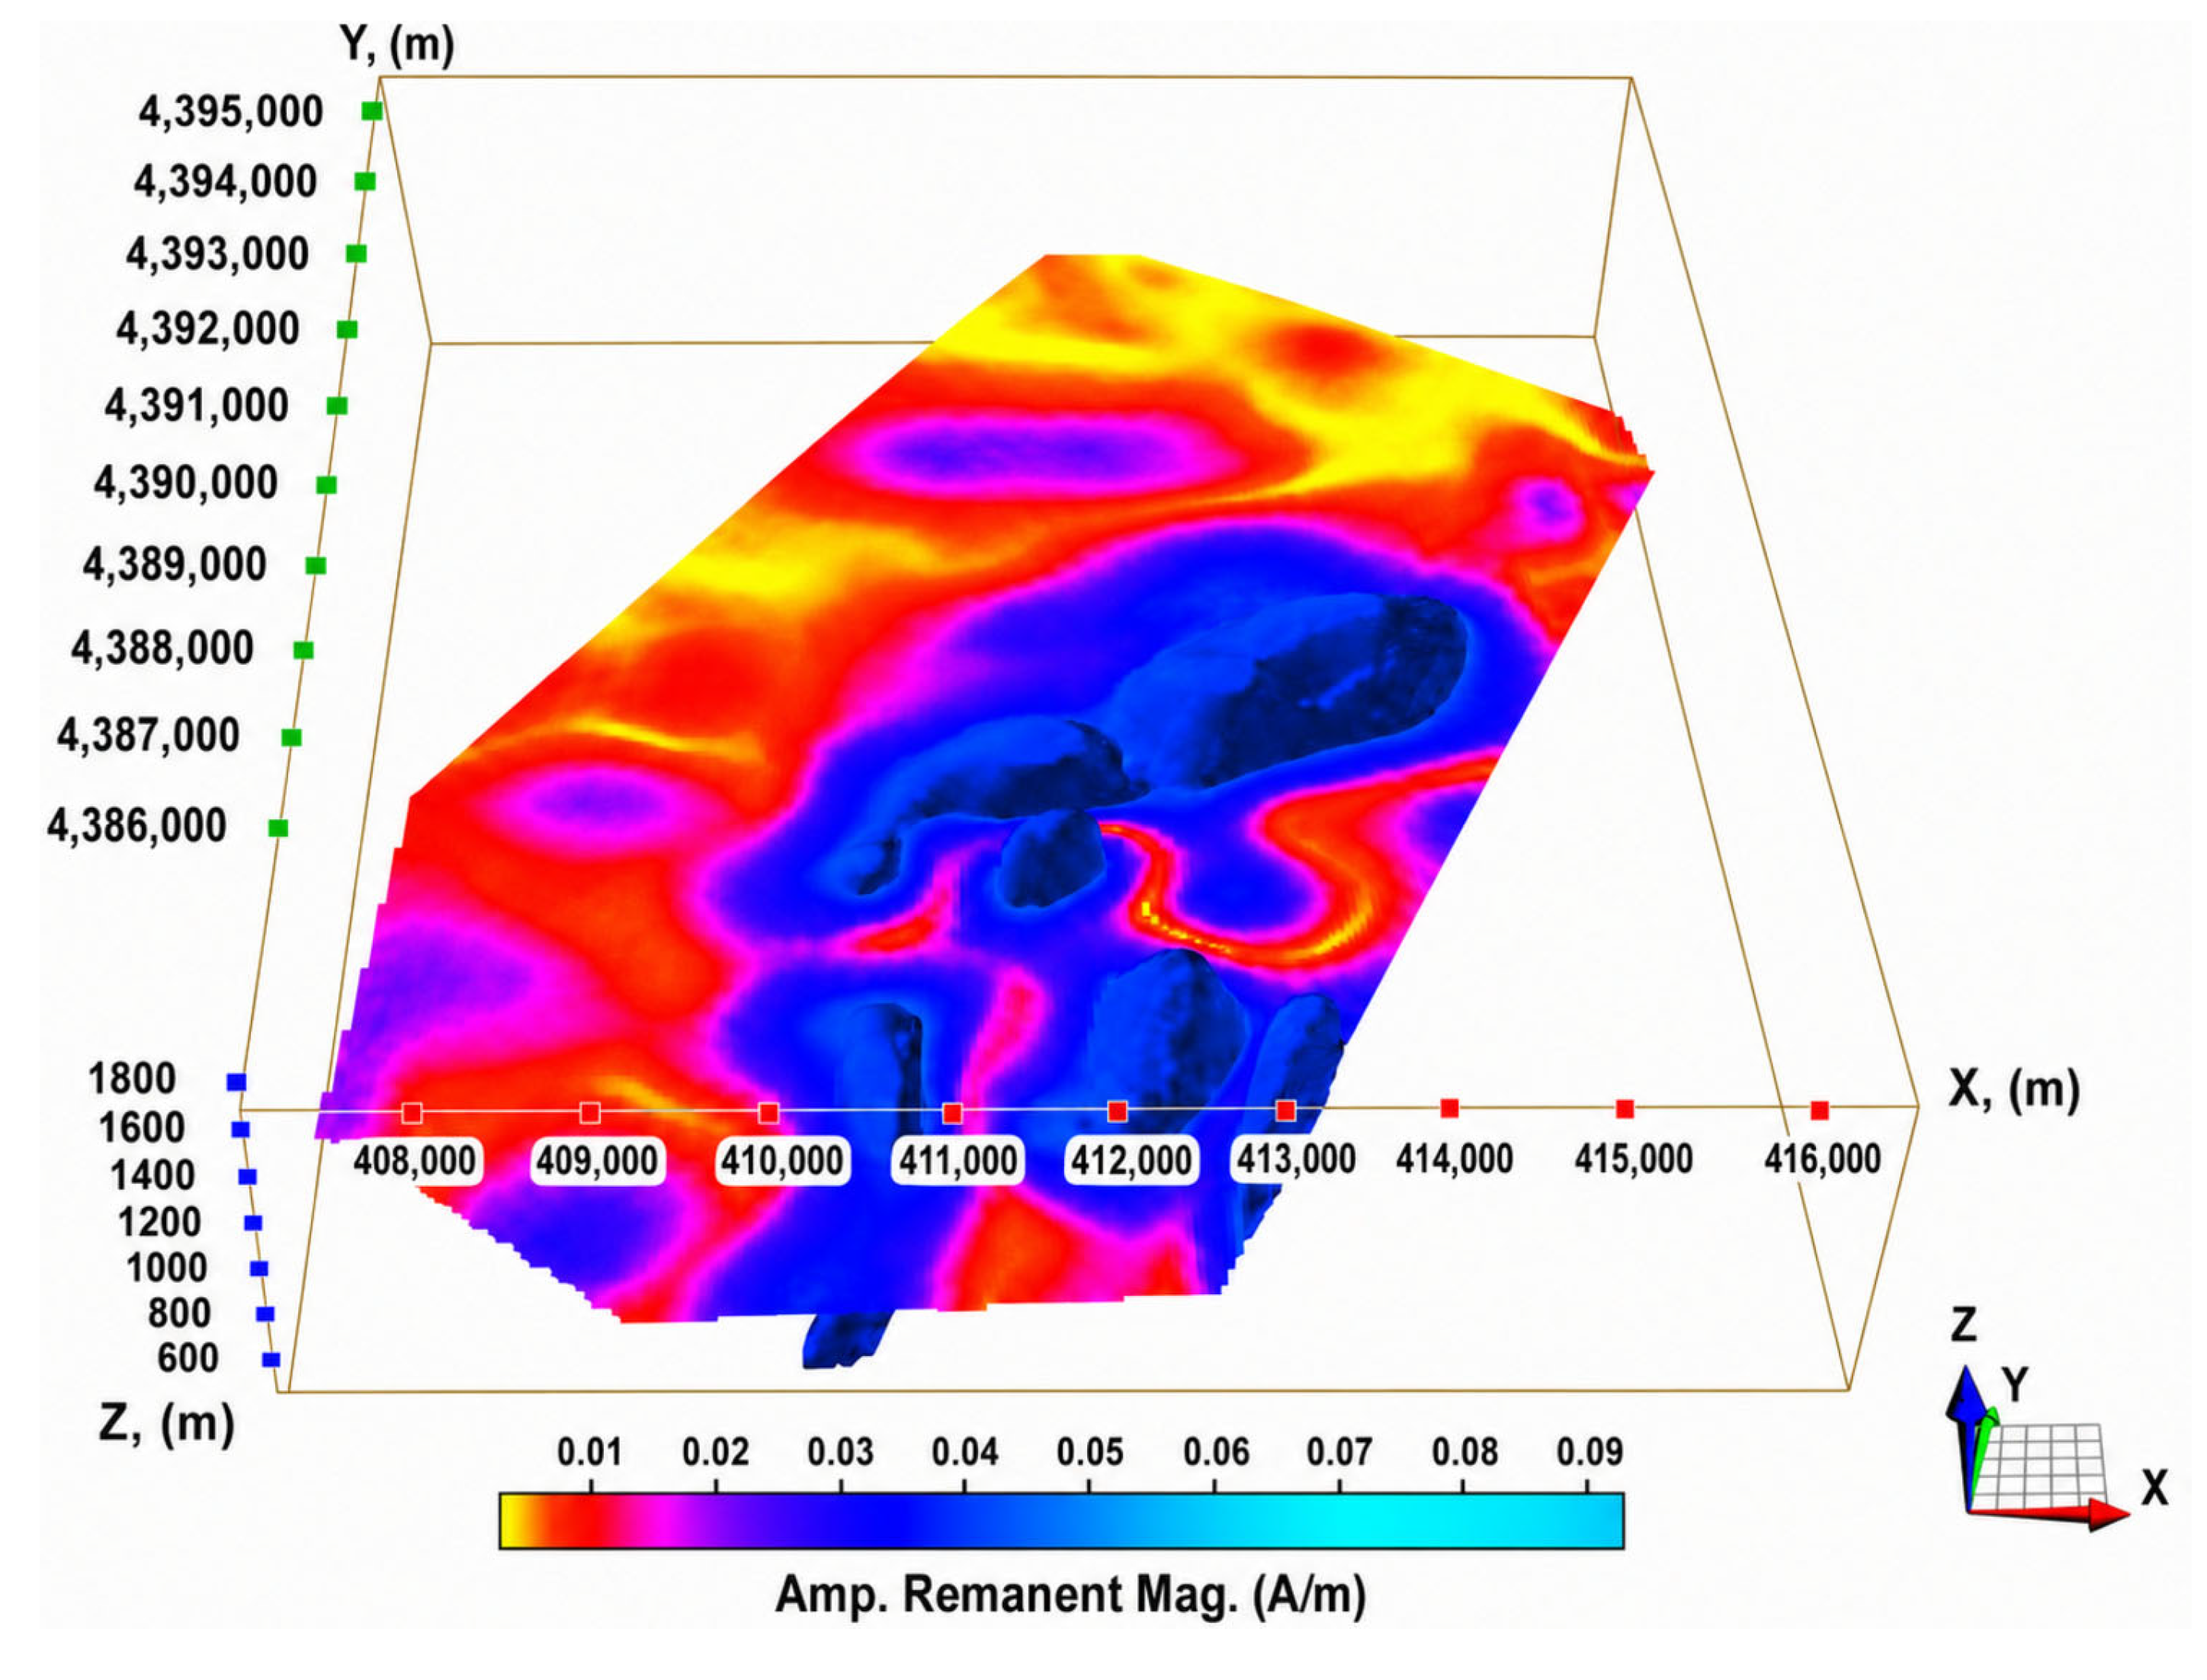
Figure 10 shows the inverted remanent magnetization model. In Dixie Valley, remanent magnetization highlights basement structures and volcanic or intrusive units that acquired magnetization during earlier cooling or alteration events. Remanent highs may correspond to magnetite-rich igneous or metamorphic basement, whereas remanent lows may indicate sedimentary basin fill, fault zones, or hydrothermally altered rocks.
The sedimentary basins identified in the density and magnetic models are significant for both geothermal and lithium exploration. Hydrothermal fluids enriched in lithium by leaching of volcanic and sedimentary rocks can migrate along fault and fracture networks and accumulate in permeable basin sediments. Along these pathways, fluid-rock interaction may alter or remove magnetic minerals, producing reduced induced or remanent magnetization. Consequently, the spatial association of low density, demagnetization, and conductive alteration can identify favorable zones for lithium-bearing brines or clays.
In Dixie Valley, sedimentary basins with adequate porosity and permeability may act as traps for lithium-bearing fluids. When these basins are connected to sustained hydrothermal flow, they provide favorable conditions for progressive lithium concentration. This relationship between basin geometry, fault-controlled fluid flow, hydrothermal alteration, and magnetic destruction provides a conceptual framework for identifying high-priority exploration targets, as illustrated in
Figure 11.
4. Cooperative Inversion of HeliTEM and Magnetotelluric Data
The HeliTEM survey conducted at the Grover Point prospect on the eastern flank of Dixie Valley provided shallow resistivity images to depths of several hundred meters. These data revealed zones of reduced resistivity attributed to clay alteration within fault-damage zones and basin sediments, consistent with hydrothermal upflow or outflow pathways. Follow-up MT soundings extended resistivity imaging to greater depths and delineated broader conductive corridors associated with the primary fault systems. Gravity and magnetic analyses constrained basin geometry and basement structure, while geochemical and temperature data provided independent evidence of elevated heat flow.
4.1. HeliTEM Survey
The HeliTEM survey acquired under BRIDGE is a key component of the reconnaissance-phase geophysical program in Dixie Valley. Its primary objective was to identify shallow resistivity anomalies associated with hydrothermal alteration, clay caps, saturated fault breccias, and fault-damage zones indicative of concealed geothermal systems. The survey also improved structural mapping by correlating resistivity variations with mapped and inferred fault zones [
4,
6,
9].
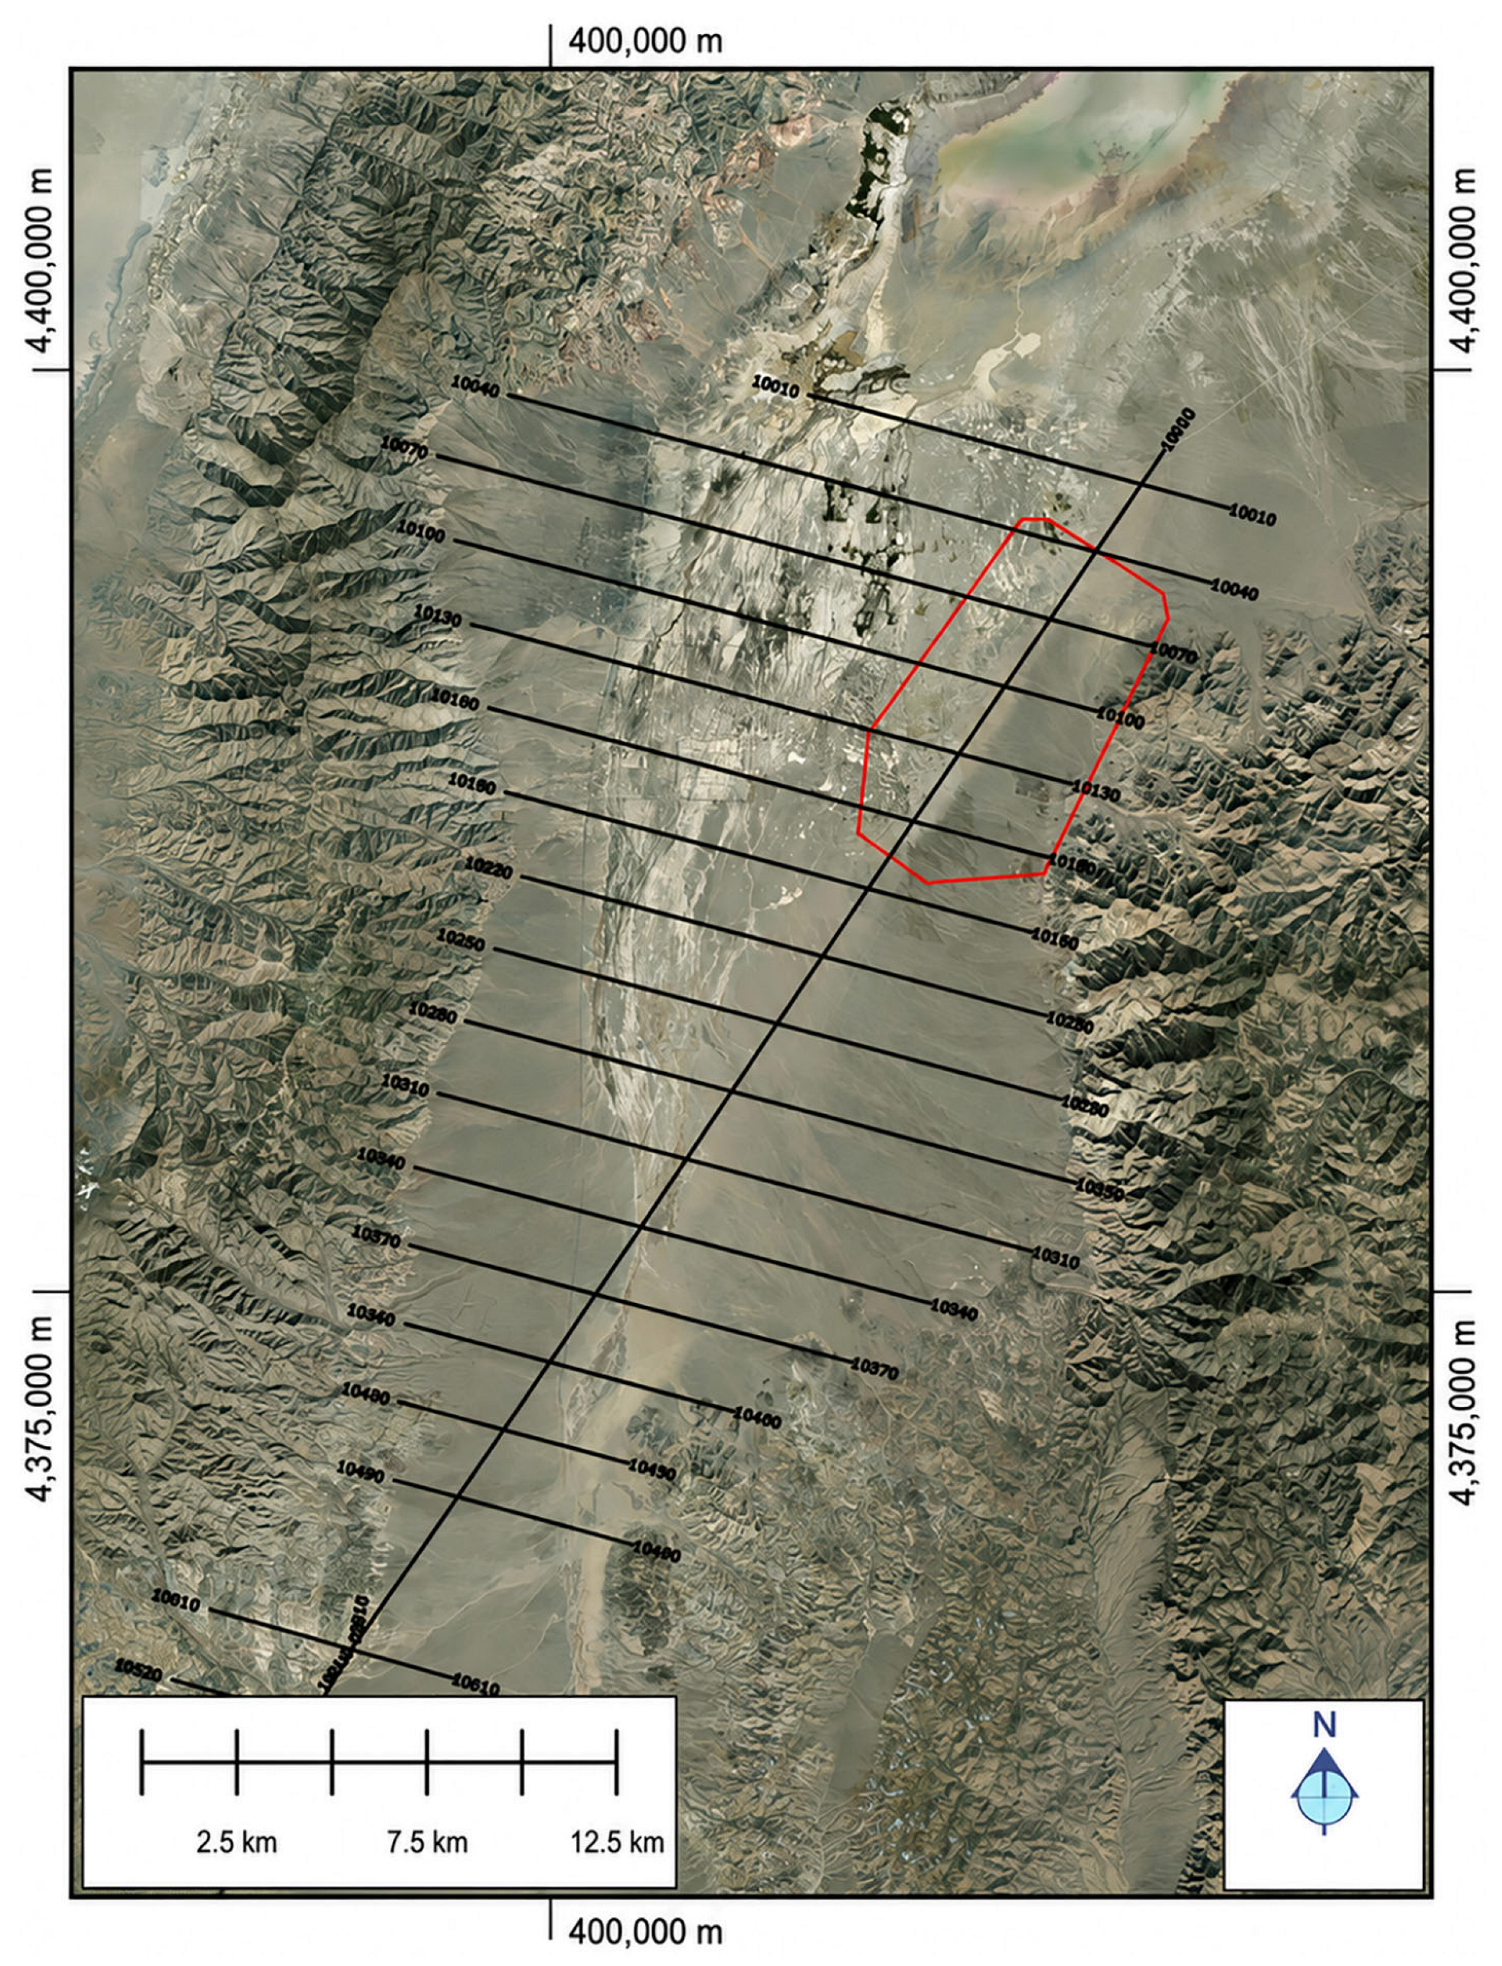
The campaign was conducted in 2022 over the Grover Point prospect. Survey lines were oriented approximately perpendicular to the principal structural trends to improve sensitivity to fault-controlled conductivity contrasts (
Figure 12). The dataset imaged the upper several hundred meters of the subsurface and delineated conductive zones associated with clay-rich alteration and saturated basin sediments.
Previous studies presented 1D inversion results [
7] for the HeliTEM data, in which each sounding was modeled as a vertically layered and laterally independent earth. These results revealed shallow low-resistivity anomalies aligned with a northeast-striking, northwest-dipping normal fault that had not been recognized in earlier structural maps. The conductive features were interpreted as alteration zones associated with hydrothermal upflow within a geothermal system.
Although 1D inversion is useful for rapid quality control and approximate background modeling, it may be inadequate in areas with strong lateral conductivity variations, such as Dixie Valley. A 1D approximation may distort structures associated with faults, basin margins, and localized alteration zones. Therefore, in the present study, we performed rigorous 3D inversion of the HeliTEM data using integral-equation methods developed for 3D airborne electromagnetic inversion [
15,
16] and implemented in TechnoImaging’s EMVision
® software.
4.2. A 3D Inversion of HeliTEM Data
Our HeliTEM workflow uses 1D inversion for quality control and construction of an initial background model, followed by 3D inversion for final interpretation. One-dimensional inversion is computationally efficient and may be accurate where the Earth is laterally uniform. However, it assumes horizontally infinite layers below each sounding and cannot properly account for 3D conductivity variations. For small-offset airborne EM systems, 1D inversion commonly relies primarily on the vertical component, thereby ignoring horizontal components that are highly sensitive to lateral conductivity contrasts.
In contrast, 3D inversion accounts for the true Earth geometry and can use both horizontal and vertical components of the measured data. This is essential in complex geological settings, such as Dixie Valley, where fault zones, basin margins, and alteration corridors produce strong 3D variations in conductivity. Although 3D inversion is computationally more demanding, it produces more accurate, geologically meaningful resistivity models.
The EMVision
® software uses robust and stable algorithms to recover the 3D conductivity distribution. The inversion incorporates data weighting to fit observations to their estimated noise levels and model weighting to normalize sensitivity and improve depth resolution. Data errors are represented by a two-part model: an absolute error that accounts for the instrument noise floor and a relative error that accounts for factors such as tilt and flight-height uncertainty. The inverse of these errors is used as the data weight. An optimal inversion is expected to approach a normalized chi-square value close to one:
where
is the predicted datum,
is the observed datum, ε
i is the estimated error of the ith datum, and N is the number of data. A value of χ
2 ≈ 1 indicates that the residuals are consistent with the estimated data uncertainties.
We performed 3D inversion of the HeliTEM data using all available off-time channels.
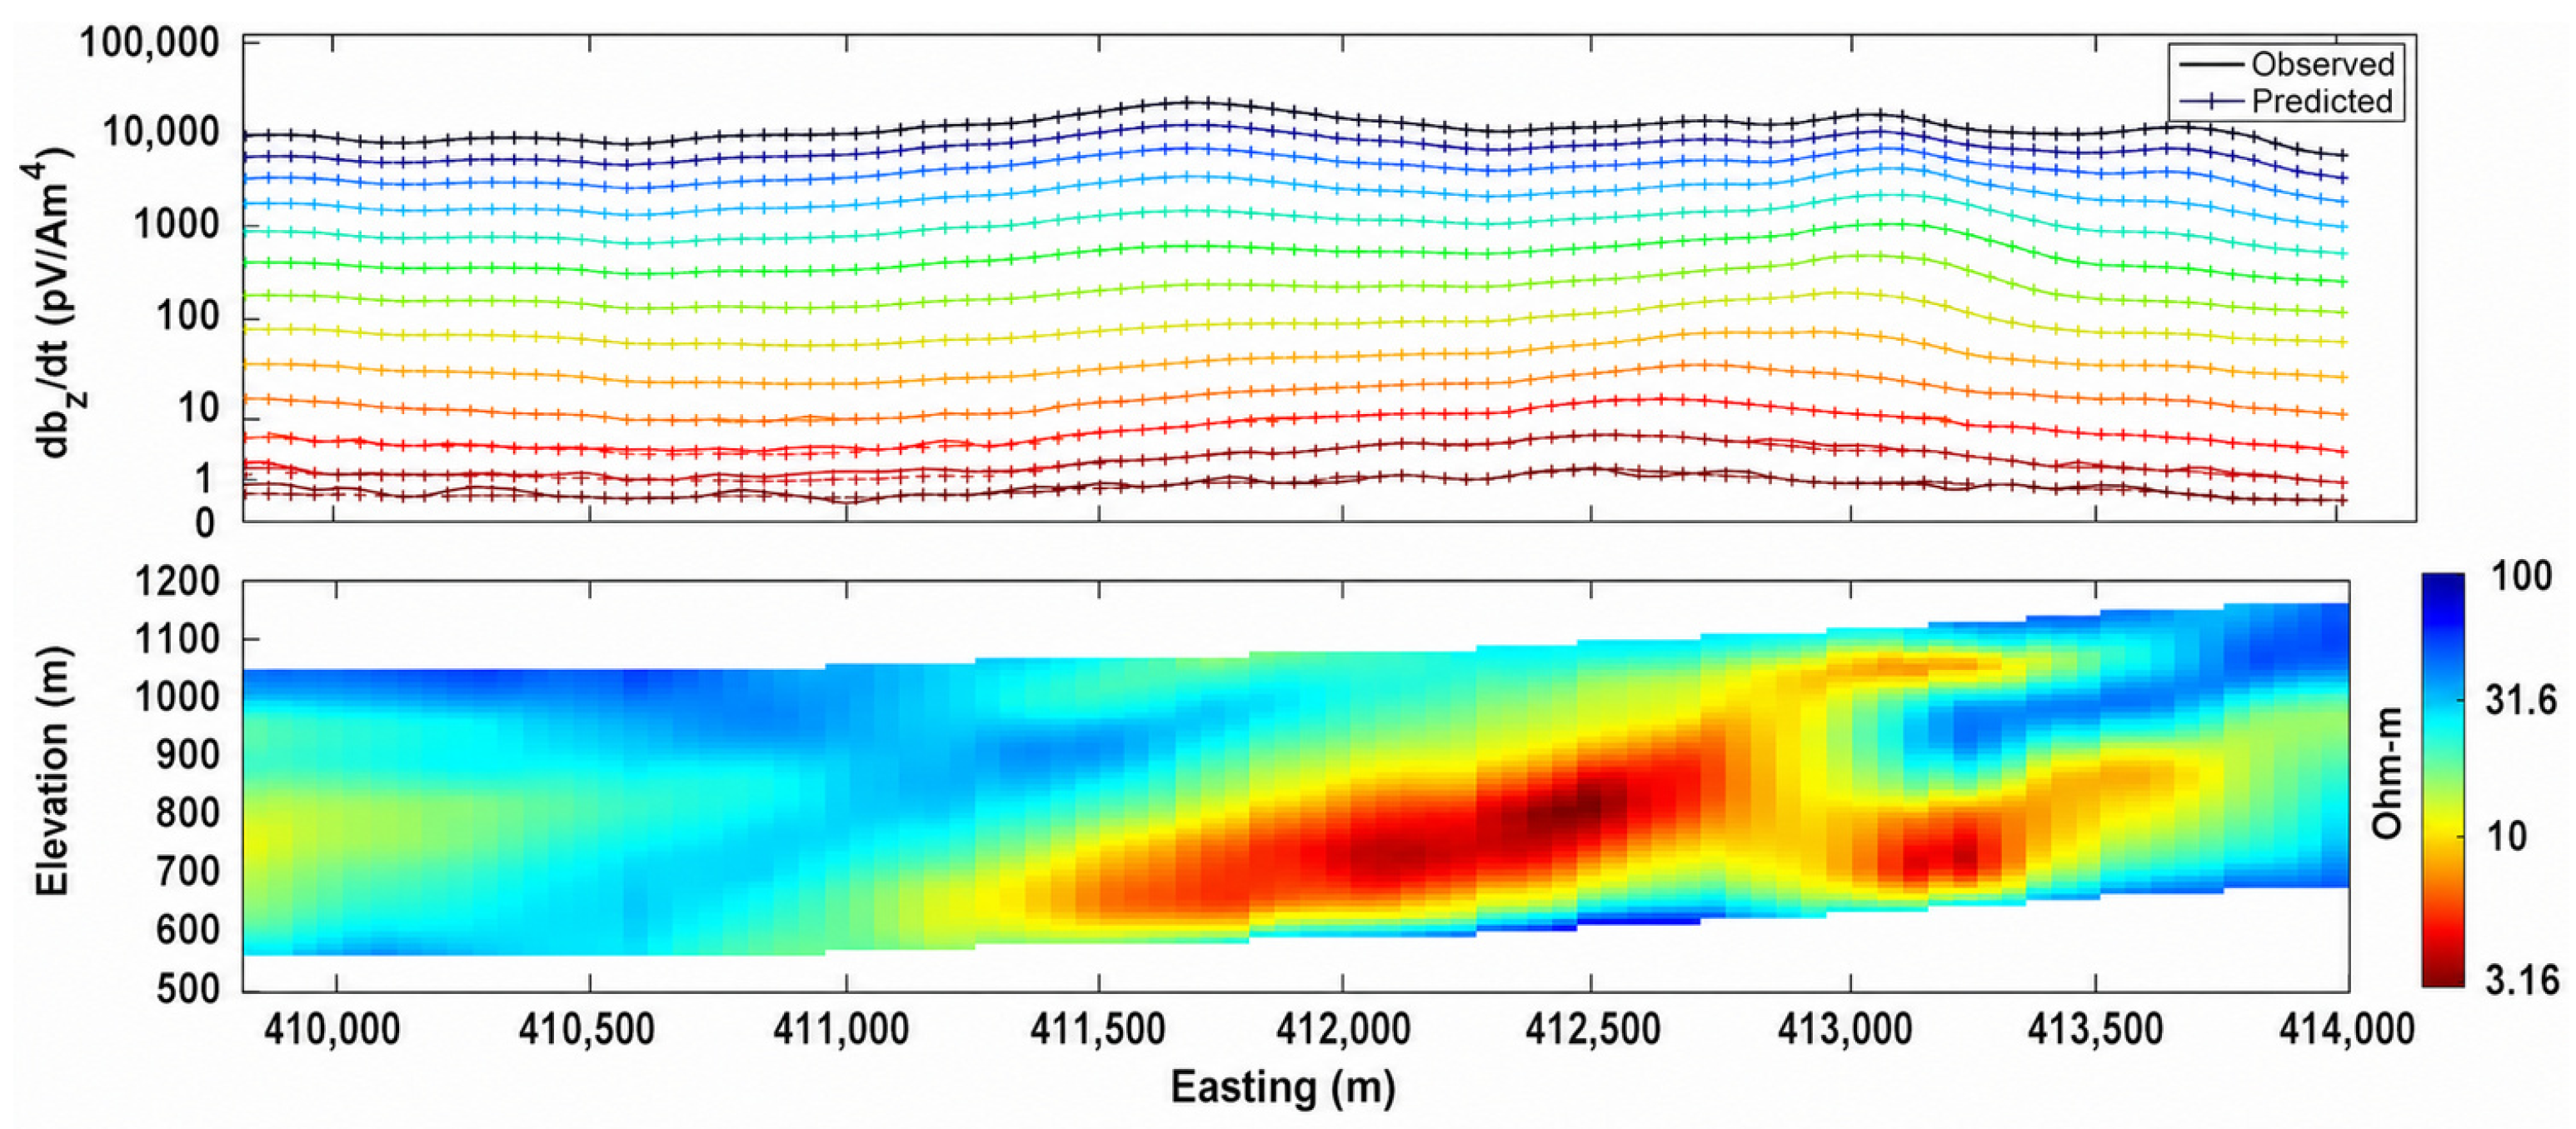
Figure 13 shows an example comparison between observed and predicted dBz/dt data along a representative survey line. The fit demonstrates that the 3D inversion reproduces the principal EM responses. The lower panel of
Figure 13 presents the corresponding vertical resistivity section, which images shallow conductive structures interpreted as clay alteration, saturated sediments, and fault-related damage zones.
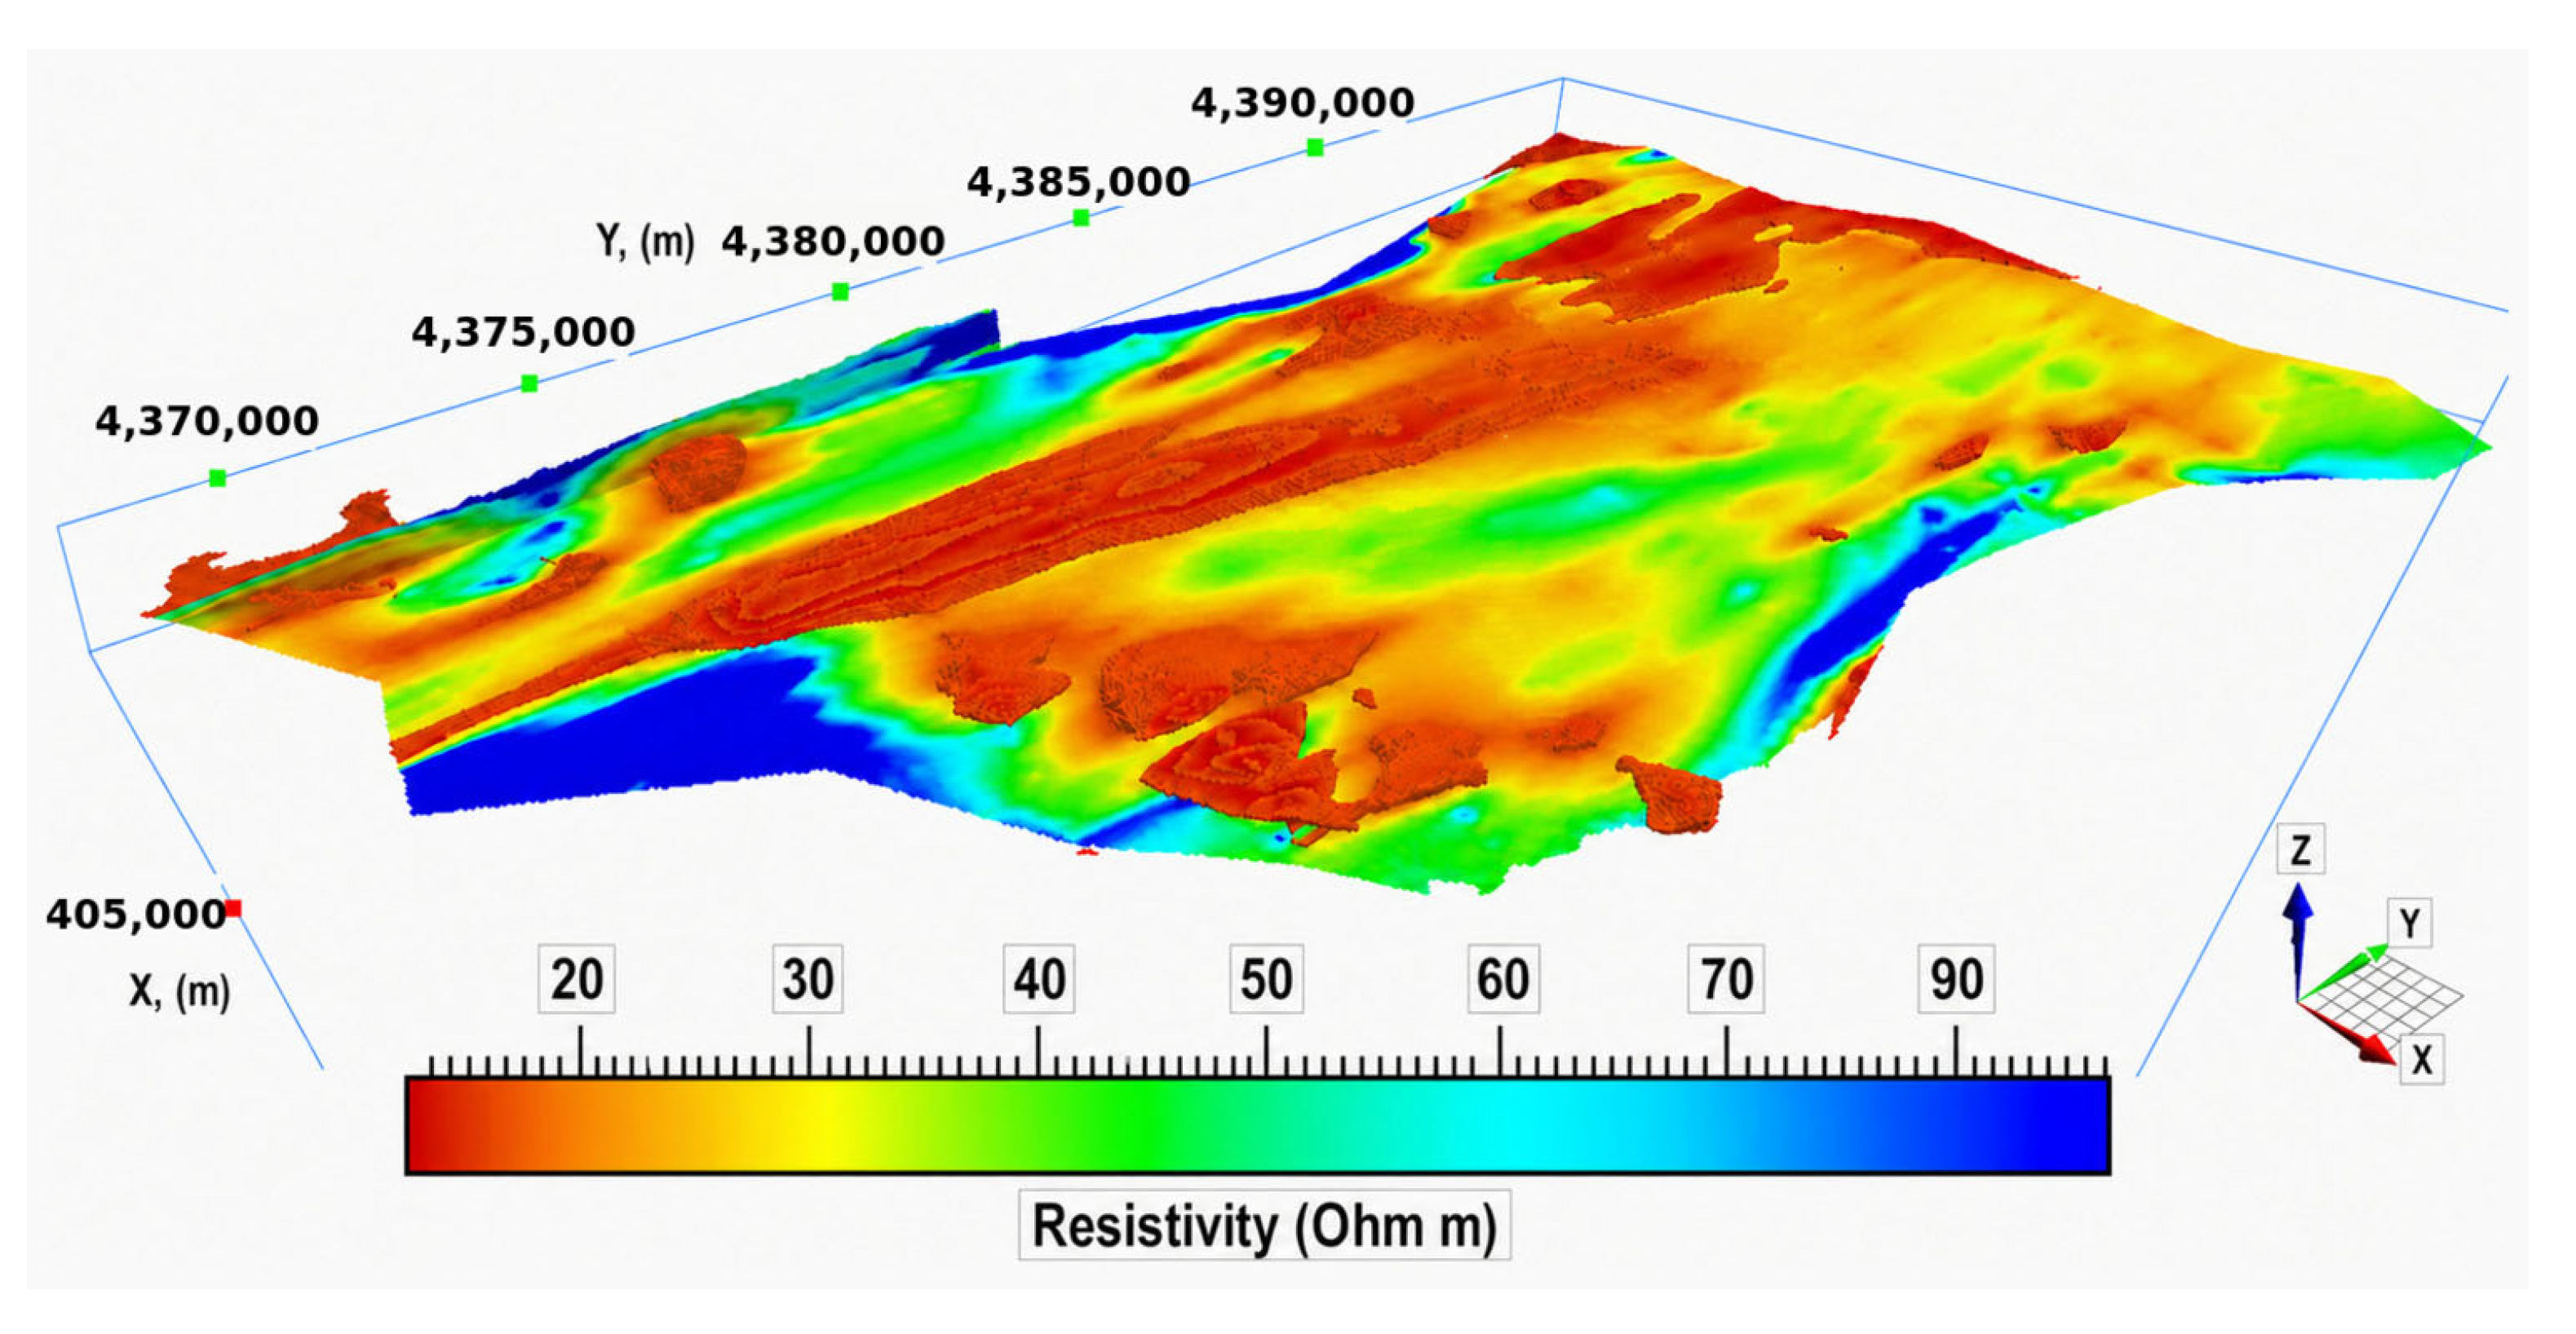
Figure 14 shows the 3D resistivity model produced by standalone 3D inversion of the HeliTEM data. The model reveals a continuous conductive structure extending along the northeast-trending fault zone. This structure is interpreted as a clay-rich hydrothermal alteration corridor and possible shallow expression of a deeper geothermal upflow pathway.
4.3. Magnetotelluric Survey and 3D MT Inversion
Following airborne reconnaissance, an MT survey was conducted in Dixie Valley as part of the second BRIDGE exploration phase. The MT survey was designed to extend resistivity imaging beyond the penetration depth of HeliTEM and to characterize the deeper structural framework controlling geothermal circulation. The MT data are particularly valuable for imaging conductive fault zones, clay alteration, reservoir boundaries, and deeper fluid pathways [
5].
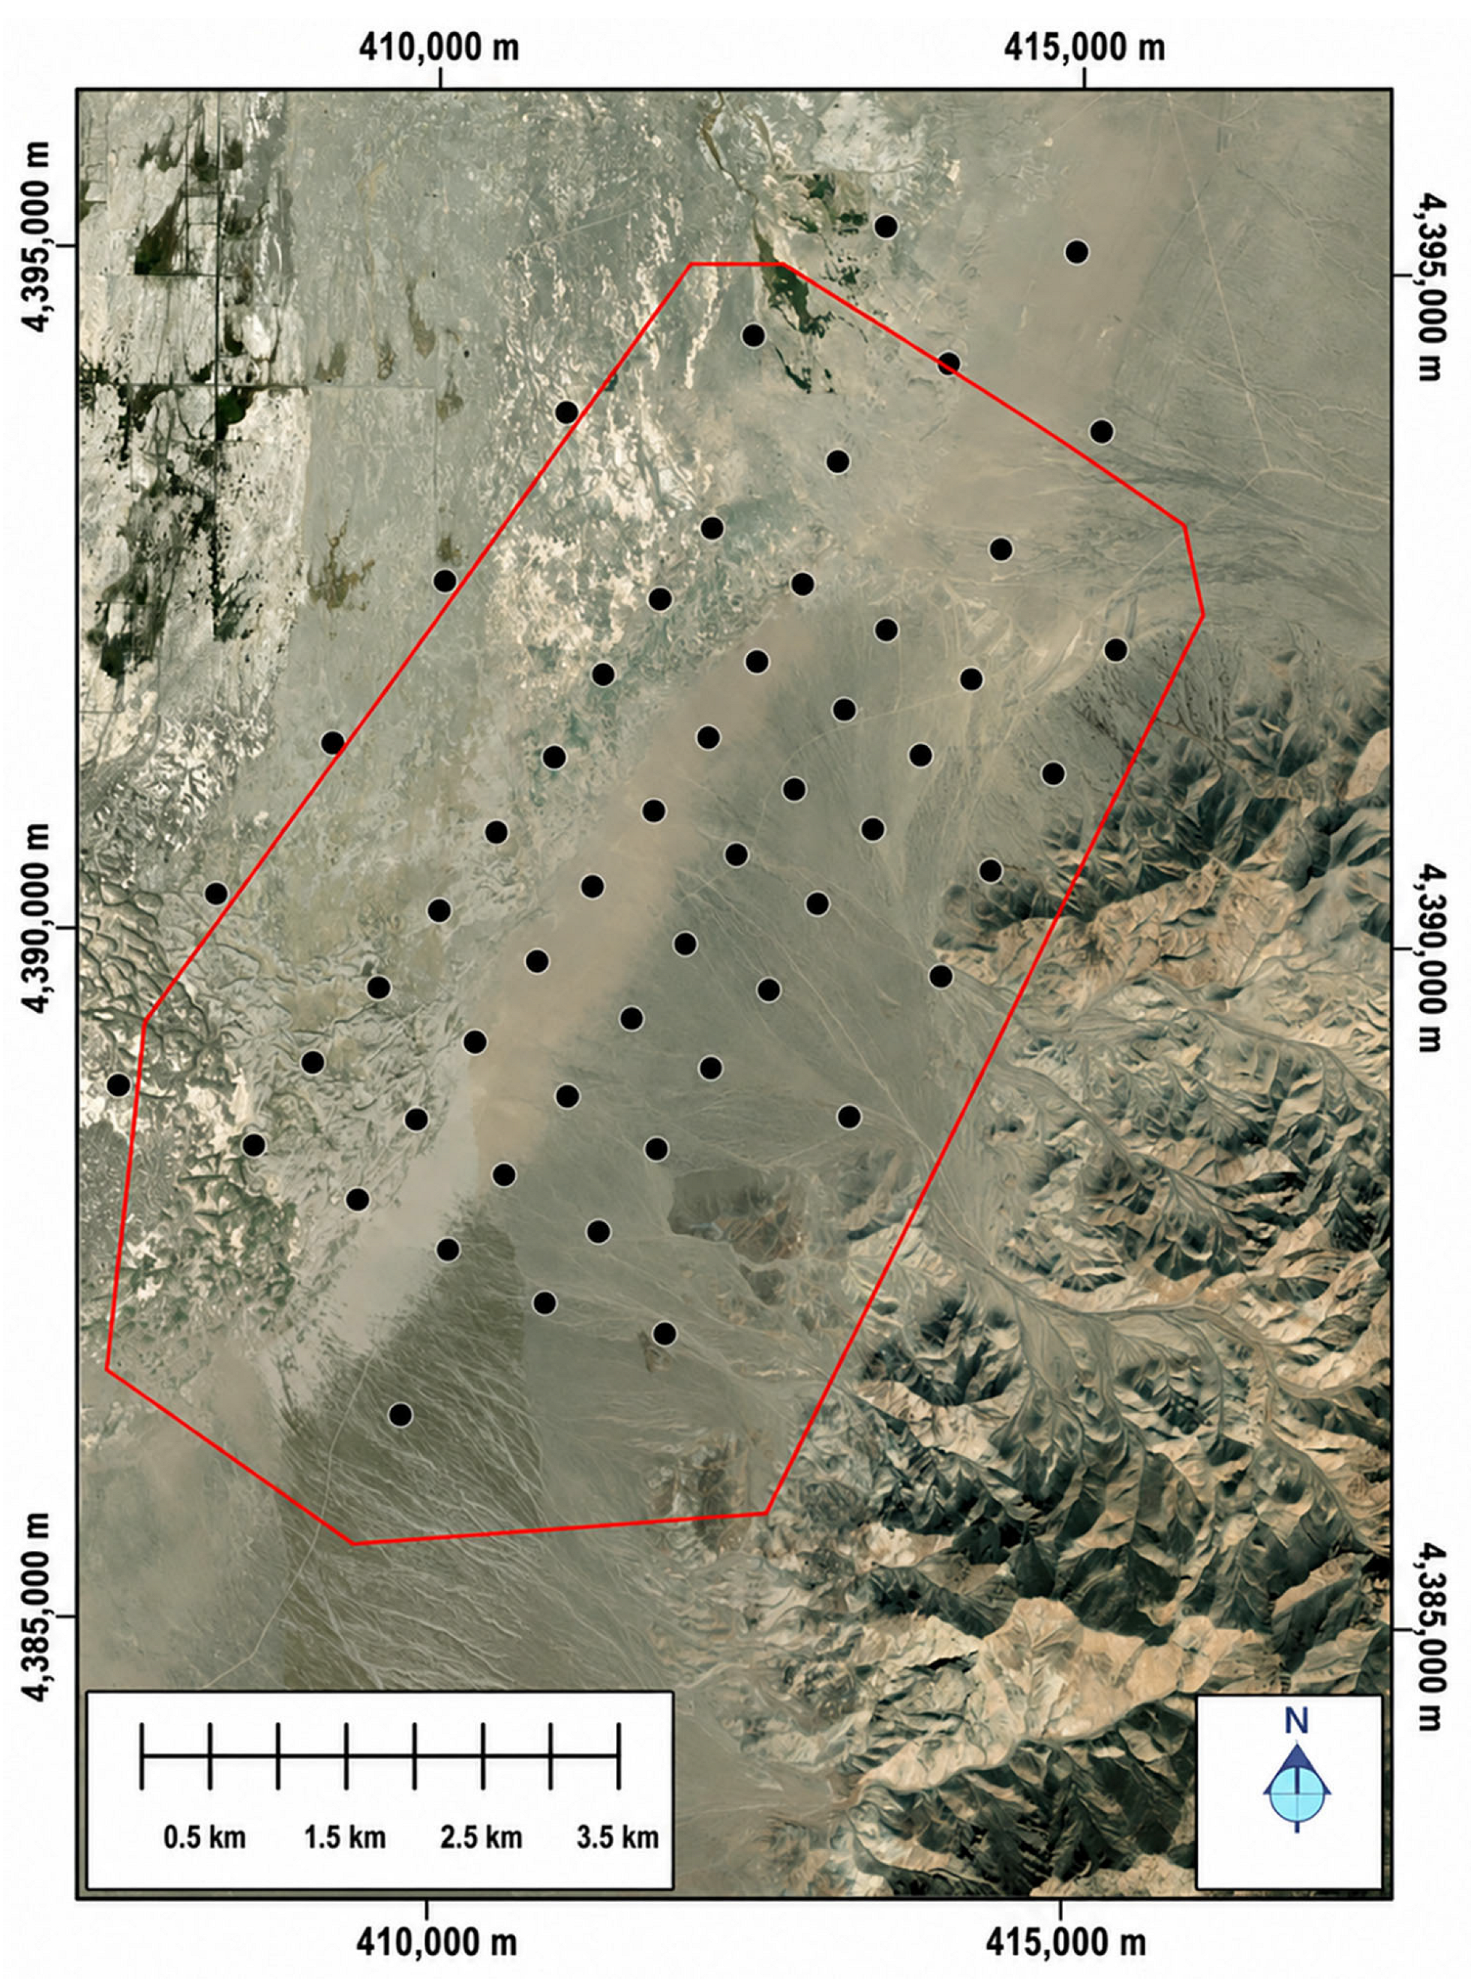
The MT survey consisted of broadband soundings acquired over the Grover Point area and the adjacent portions of the valley floor (
Figure 15), with an approximate station spacing of 800 m. The data were subsequently released through the DOE Geothermal Data Repository [
5]. Full impedance tensor data from 55 MT stations were used in the inversion. The observed data had a period range within 1 × 10
−4 and 3 × 10
2 s. For the inversion, we selected a period range from 1 × 10
−3 to 1 s based on data quality considerations and the targeted depth interval.
We applied regularized 3D MT inversion to this dataset using a Gauss-Newton optimization scheme formulated in data space [
17]. This formulation reduces the computational cost associated with Hessian-matrix calculations and enables efficient inversion of large datasets.
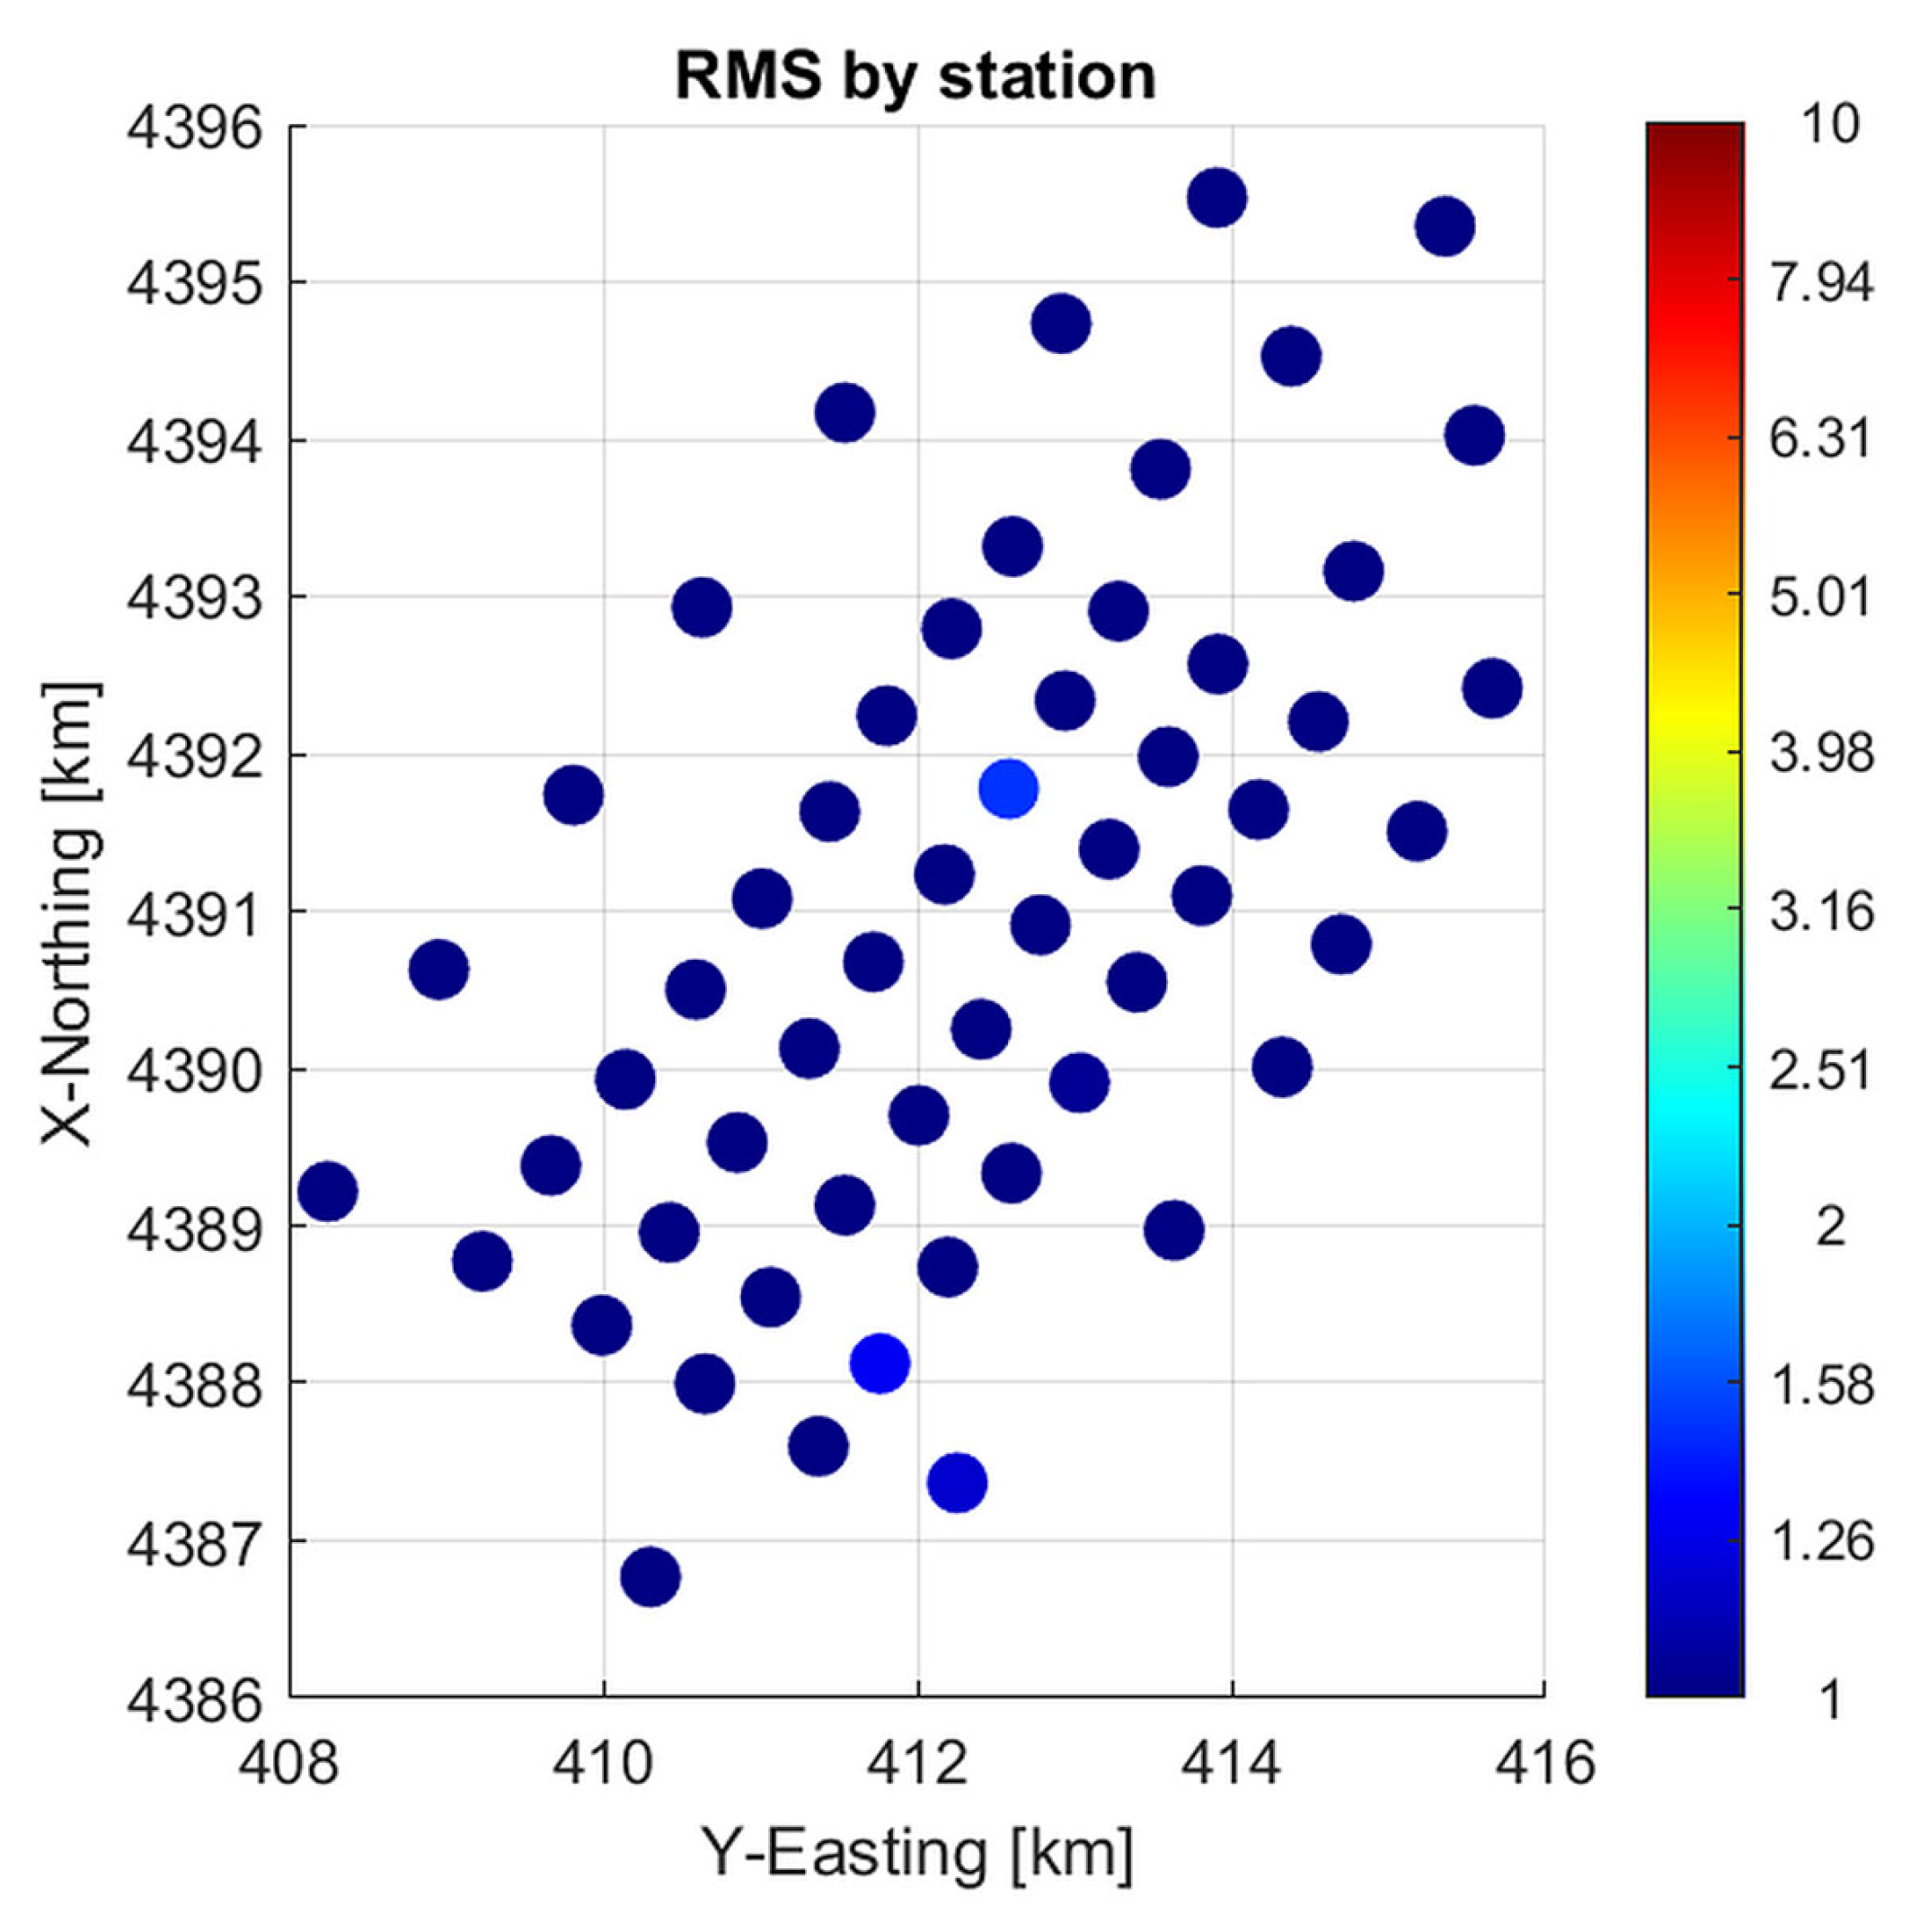
Figure 16 presents the RMS distribution by station for the standalone MT inversion computed with an error floor of 3.5%.
The inversion accounts for MT distortions caused by near-surface geoelectrical inhomogeneities by simultaneously inverting the full impedance tensor and tipper data while recovering both the 3D subsurface conductivity distribution and an associated distortion matrix. Forward modeling is performed using the contraction integral equation formulation, which provides a rigorous and stable electromagnetic solver for complex 3D conductivity structures. The moving sensitivity domain concept is used to support inversion of large MT surveys without subdividing the model into separate regions. Details of the underlying regularized inversion methodology and related multiphysics applications are given in [
12,
13,
17].
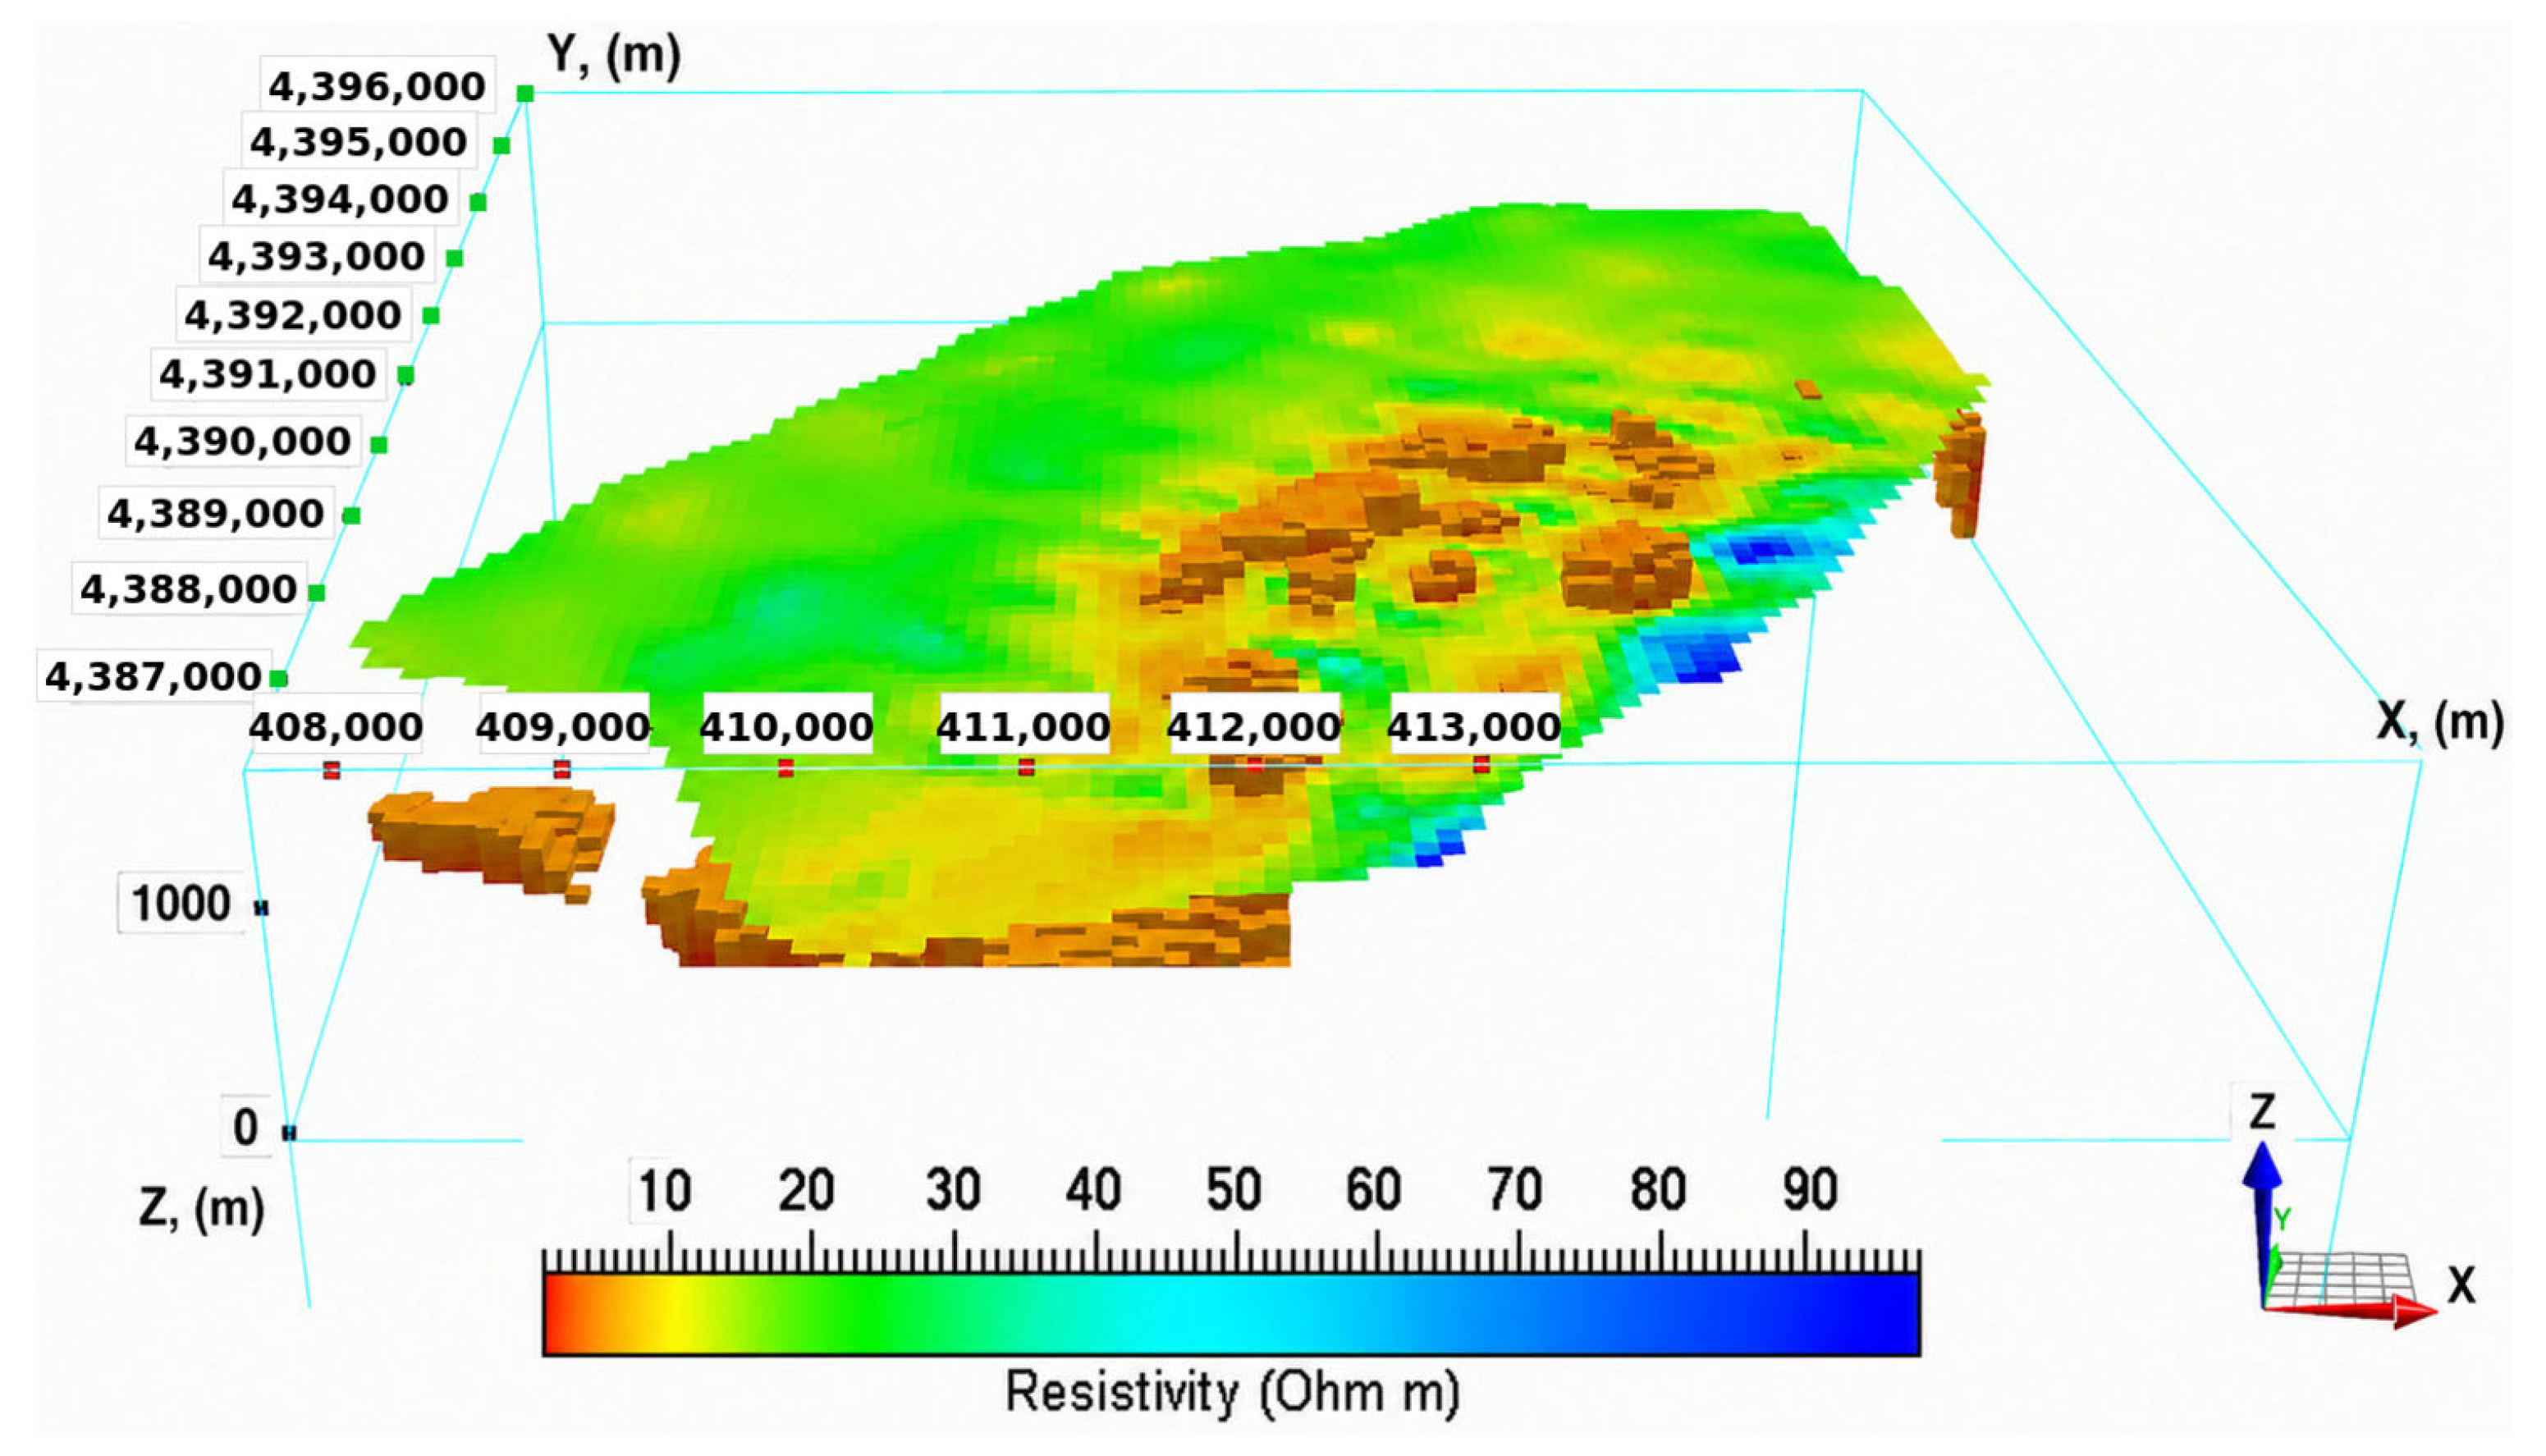
Figure 17 presents the 3D resistivity model obtained from standalone 3D inversion of the MT data. The model images deeper conductive features that are broadly consistent with the shallow HeliTEM anomalies and suggests that near-surface alteration zones may be connected to deeper fault-controlled hydrothermal pathways.
4.4. Cooperative Inversion of HeliTEM and MT Data
We also integrated the HeliTEM inversion results into a cooperative inversion of the MT data. This was achieved by constrained 3D inversion of MT data using the HeliTEM resistivity model as a shallow reference model. Because the HeliTEM model extends only to approximately 500 m depth, the results of 1D MT inversion were used as the reference model at greater depths and in areas where HeliTEM coverage was insufficient. We have achieved a similar level of data fit for joint inversion of HeliTEM and MT data as in the separate inversions described above.
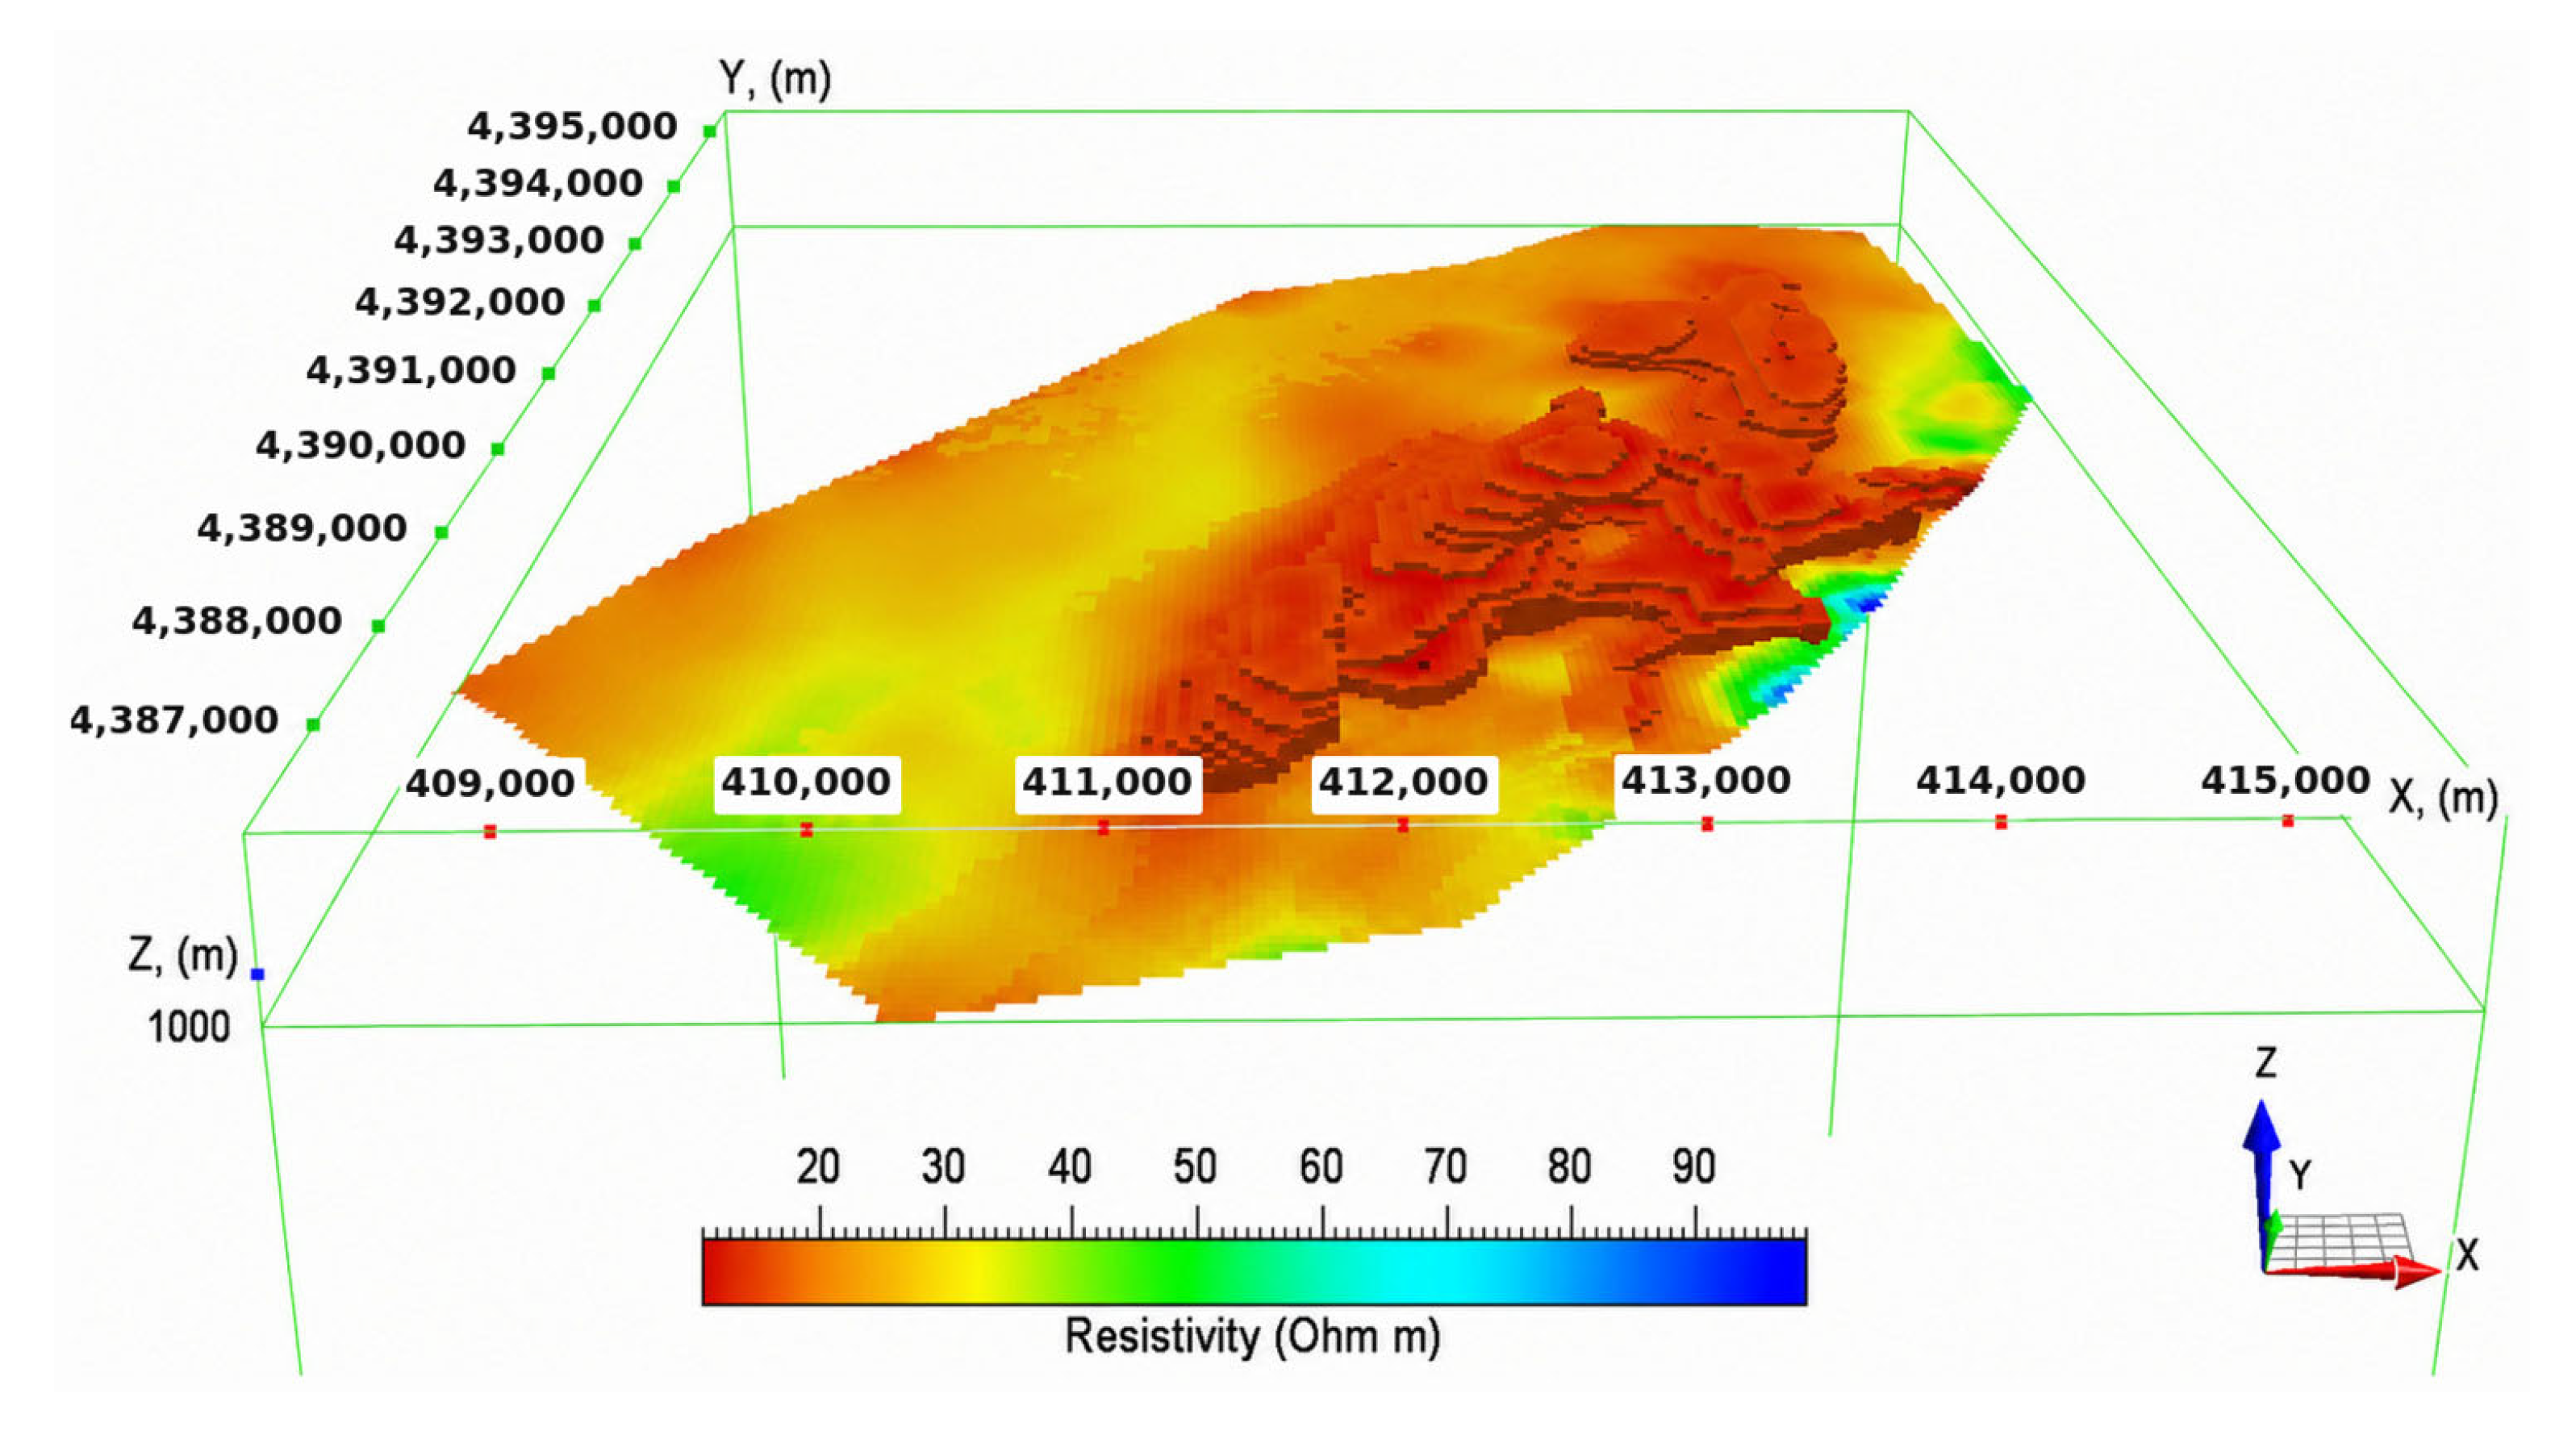
Figure 18 presents the 3D resistivity model produced by cooperative 3D inversion of HeliTEM and MT data. The integration of these datasets enables cross-validation of shallow and deep resistivity features and improves estimation of fault geometries and conductive alteration zones. The cooperative model provides a more continuous representation of the resistivity structure than either dataset alone, linking shallow alteration anomalies imaged by HeliTEM with deeper conductive features imaged by MT.
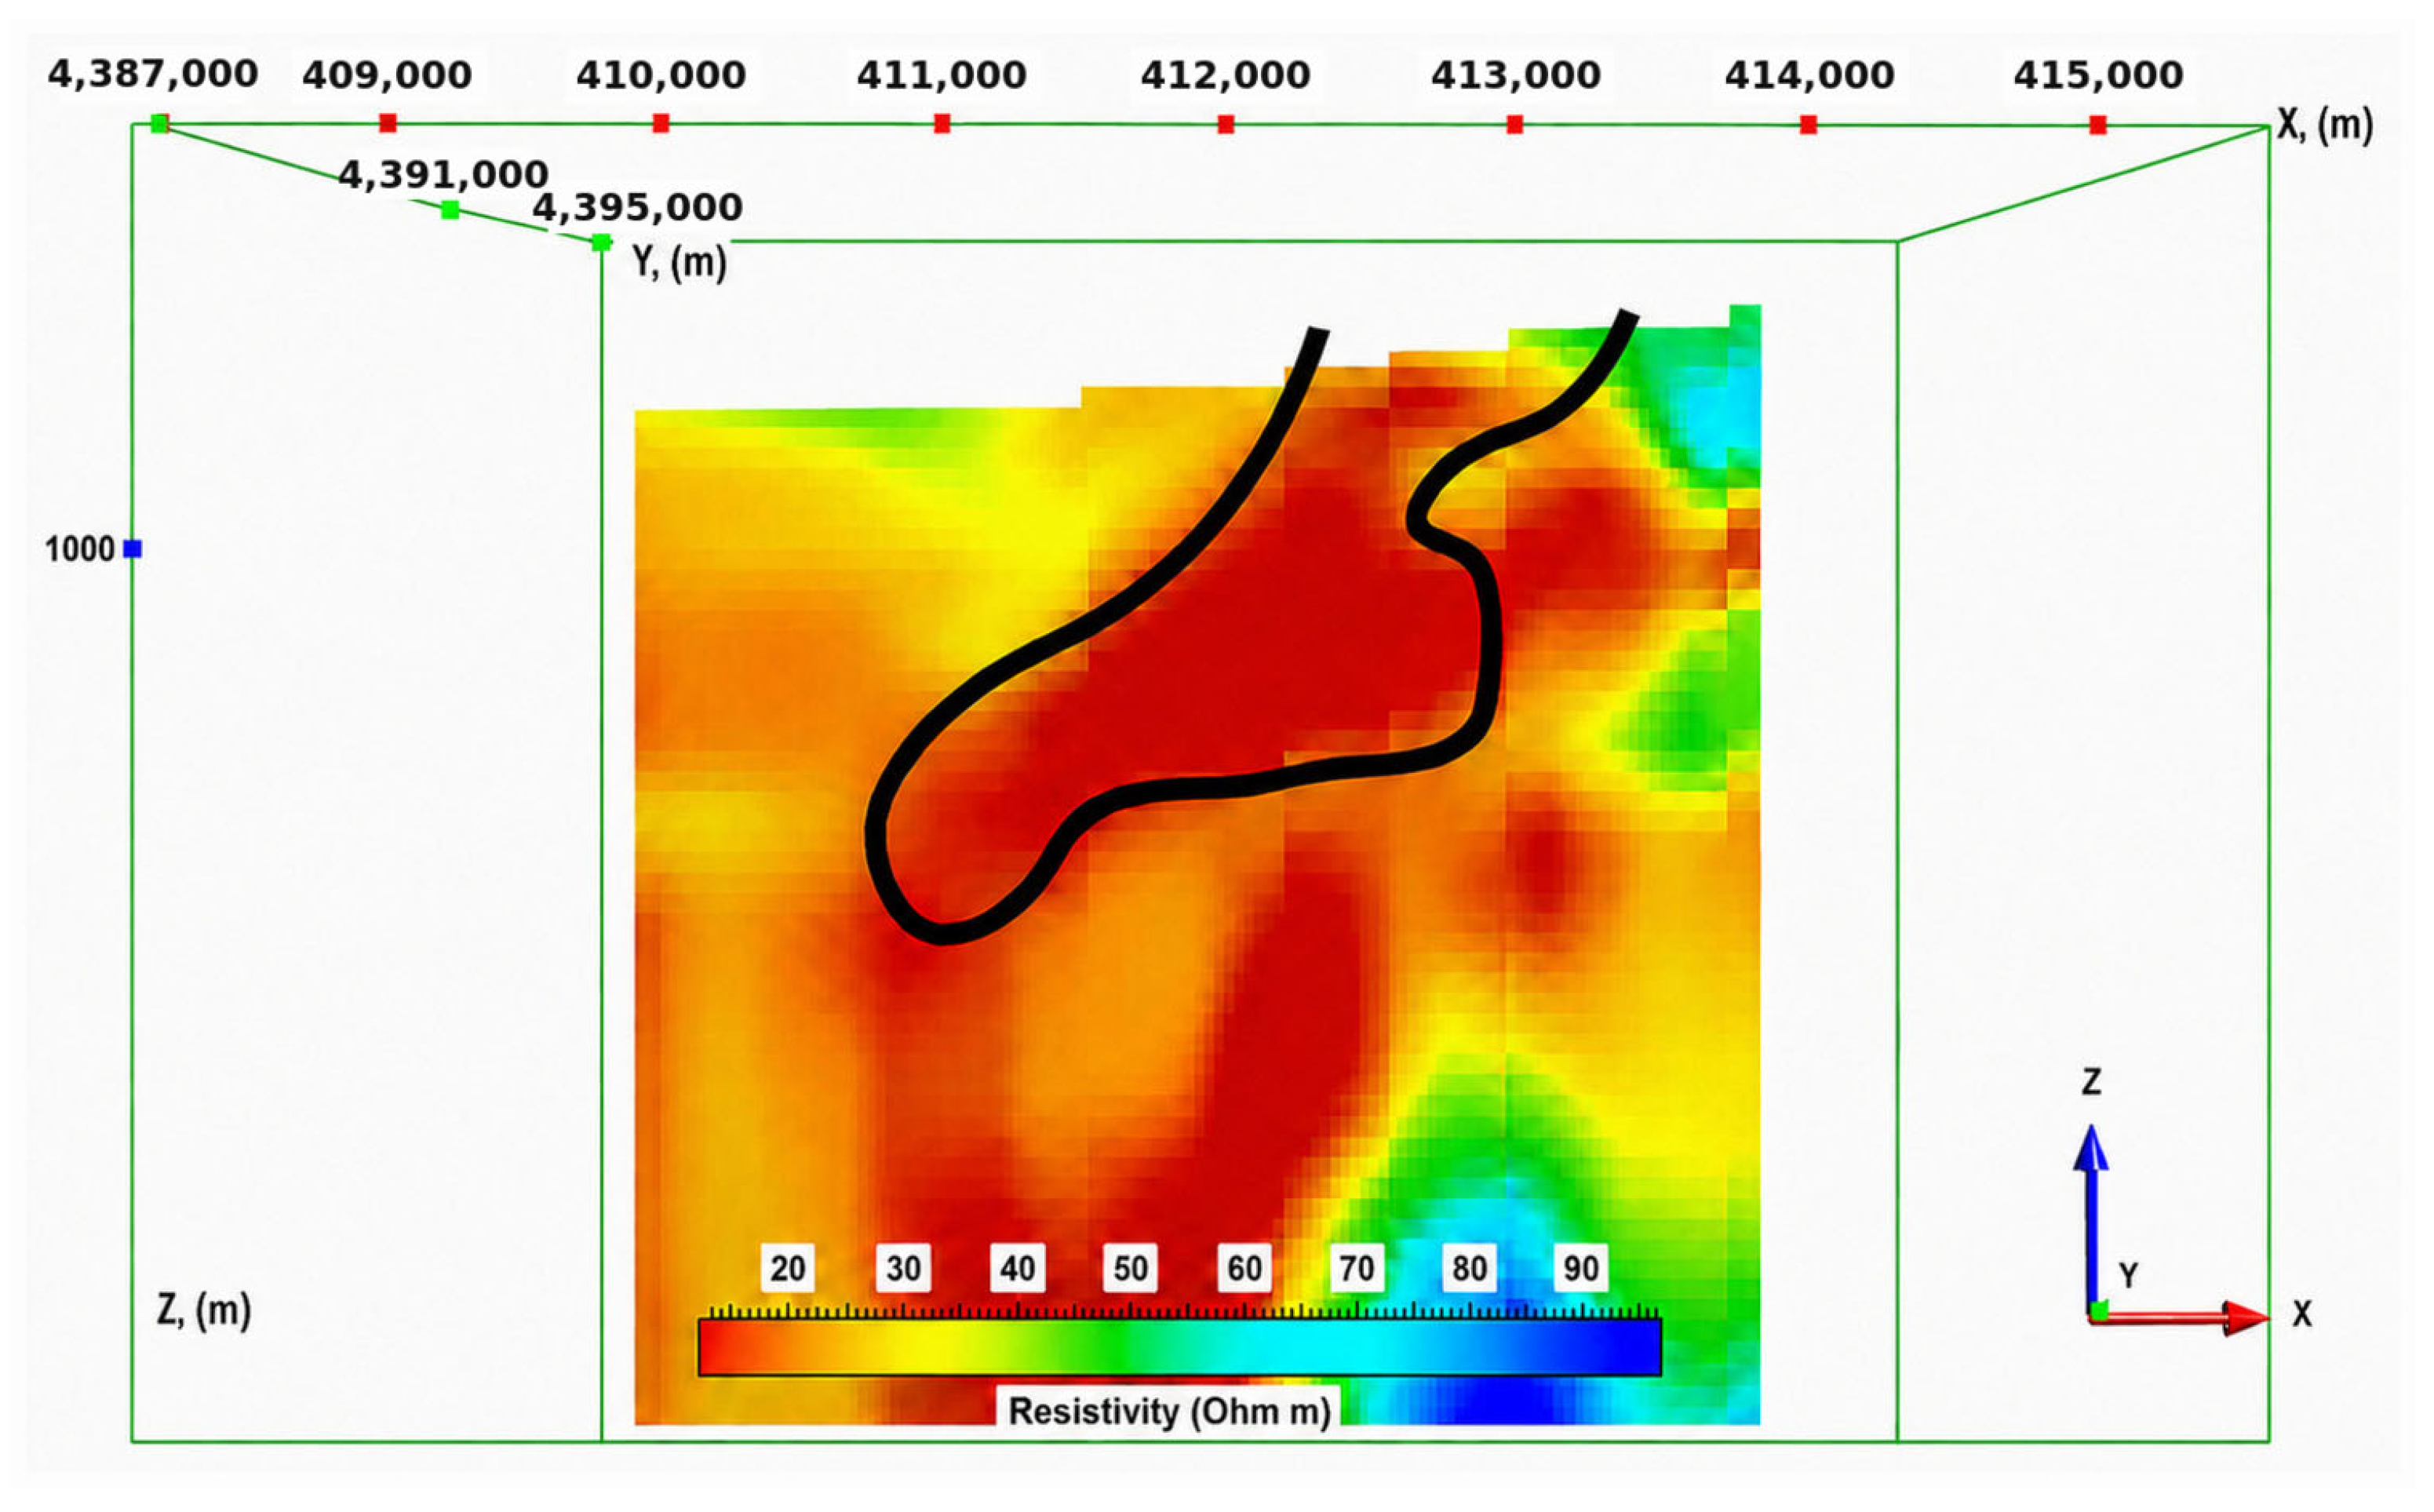
Figure 19 shows a vertical section through the cooperative resistivity model. The section demonstrates continuity between shallow and deep conductivity anomalies, supporting the interpretation of a structurally controlled geothermal system. The conductive corridor follows the northeast-trending fault identified in the HeliTEM data and extends to greater depth in the MT model. This geometry is consistent with fault-mediated hydrothermal circulation characteristic of the Basin and Range Province.
Previous studies compared 1D HeliTEM inversion with 1D TE-mode MT inversion in the same area [
7]. The present cooperative 3D approach extends that comparison by accounting for 3D conductivity structure, integrating both shallow and deep resistivity information, and improving geological continuity between datasets.
5. Discussion and Conclusions
Dixie Valley is an excellent natural laboratory for integrated geothermal and critical-mineral exploration. The active extensional tectonic regime of the Basin and Range Province enhances permeability along faults and fractures, allowing geothermal fluids to circulate efficiently and transfer heat from depth. These hydrothermal fluids can also leach lithium from volcanic and sedimentary rocks and concentrate it in sedimentary basins as lithium-bearing brines or clays.
The joint gravity and magnetic inversion results demonstrate that density, induced magnetization, and remanent magnetization provide complementary information about the subsurface. The density model delineates low-density sedimentary basins and higher-density basement blocks. The induced magnetization model highlights magnetic basement, volcanic units, or intrusive rocks that may be related to heat-source lithologies or structural blocks. The remanent magnetization model provides additional information about basement architecture, older magnetization events, and hydrothermal demagnetization.
The separation of induced and remanent magnetization is particularly important in geothermal environments. Hydrothermal alteration can reduce magnetite content, producing magnetic lows that may outline fluid pathways and alteration corridors. When such demagnetized zones coincide with low-density basins and conductive resistivity anomalies, they become high-priority targets for geothermal circulation and possible lithium accumulation.
The HeliTEM and MT results demonstrate the value of tiered electromagnetic exploration. HeliTEM provides rapid, high-resolution imaging of shallow alteration and fault-damage zones, whereas MT extends resistivity imaging to greater depth and constrains the deeper geothermal plumbing system. Cooperative 3D inversion of HeliTEM and MT data links shallow conductive alteration zones with deeper conductive corridors, supporting the interpretation of a structurally controlled geothermal system at Grover Point.
The integrated multiphysics workflow reduces exploration uncertainty by combining independent physical-property models: density from gravity, magnetization from magnetic data, and resistivity from HeliTEM and MT.
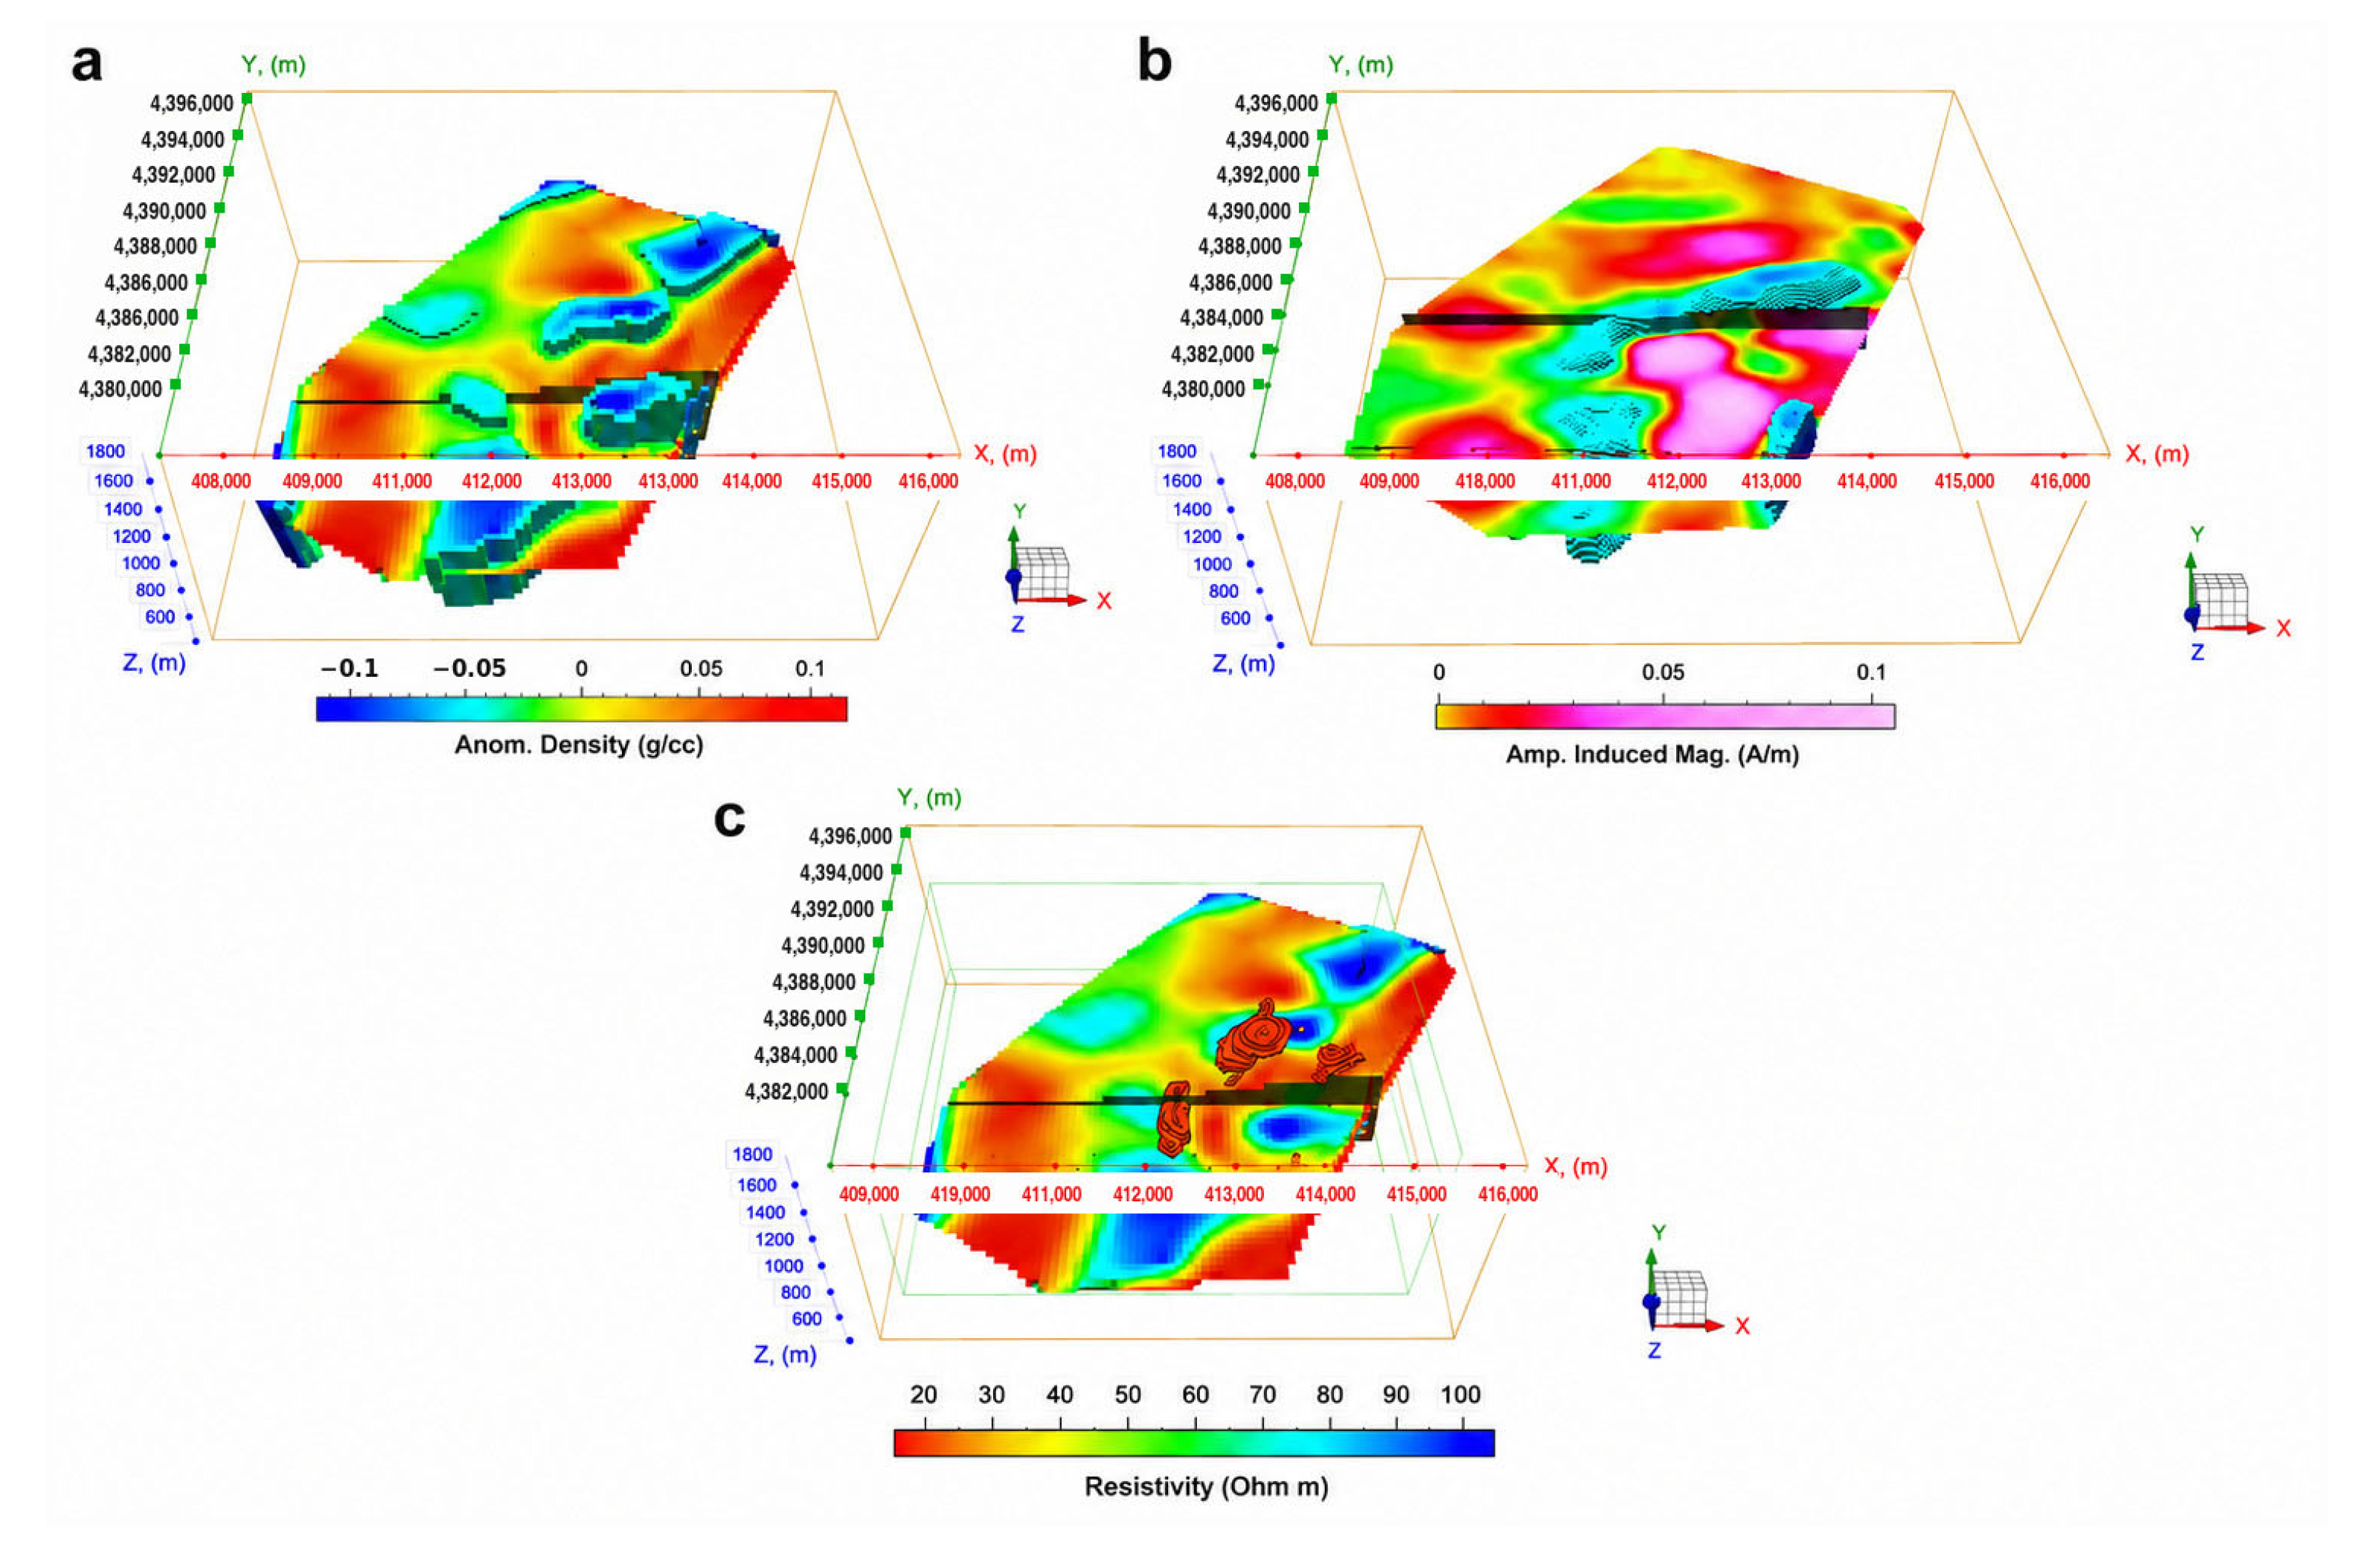
Figure 20 summarizes the principal petrophysical models generated for Dixie Valley. Joint interpretation of these models provides a more complete understanding of basin geometry, basement structure, hydrothermal alteration, fault permeability, and potential lithium-bearing sedimentary or brine reservoirs.
The results support several conclusions. First, gravity and magnetic data jointly constrain basin architecture and magnetic basement structure more effectively than either dataset alone. Second, simultaneous magnetic inversion into induced and remanent magnetizations provides important diagnostic information by separating the induced and remanent components of the magnetization vector. Third, 3D HeliTEM inversion improves the resolution of shallow conductive alteration zones relative to 1D inversion in laterally heterogeneous settings. Fourth, cooperative HeliTEM-MT inversion provides a continuous shallow-to-deep resistivity model that helps identify geothermal upflow pathways. Finally, the spatial association of low-density basin fill, demagnetized alteration corridors, and conductive resistivity anomalies provides a practical exploration criterion for geothermal and lithium targets. It should be emphasized, however, that even multiphysics methods cannot directly detect lithium. Rather, these methods are used to delineate structural controls, basin architecture, and potential traps where lithium-bearing fluids may accumulate. Therefore, geochemical sampling remains essential for validating the presence and economic significance of any lithium deposit.
The experience gained from Dixie Valley underscores the effectiveness of integrated multiphysics geophysical exploration for concealed geothermal systems and associated critical mineral resources. The methodology developed here is transferable to other Basin and Range systems and to analogous extensional terrains worldwide, where similar structural and hydrological processes may control geothermal circulation, basin development, and critical mineral enrichment.